


Abstract
The transport sector, and aviation in particular, is strongly involved in the decarbonization process. The Clean Aviation Programme provides strong support through its funded research projects, with H2-powered aircraft being one of the main alternatives. Storage of LH2, as a cryogenic fluid, implies inherent particularities and complexities, which combine with those derived from integration in an aircraft (weight, functionalities, safety). The support of simulation tools is crucial to facilitate the process of designing storage tanks and their behaviour in operation or during testing. The present paper presents the cooldown studies under development within the H2ELIOS project, extending previous work more focused on dormancy and boil-off phenomena. The attention is now shifted to investigating the transient effects during the initial gas cooldown process, where the thermal inertia of the foams used in the current design plays a crucial role. This document describes a modelling approach oriented towards fast and lightweight simulation. After that, some results are presented to highlight the role of tank foam thermal inertia and the flow resistances of the inlet and outlet piping.
1. Introduction
Hydrogen-powered aircraft are expected to be a key player in driving the decarbonization of the sector, either through fuel cells or direct combustion. The storage of H2 is prioritised in liquid cryogenic form to maximise the energy storage density and then minimise the space required. Due to the extremely low evaporation temperatures (on the order of ), it must be effectively isolated from the external environment. In this context, the H2ELIOS project is developing an innovative foam-based LH2 aircraft storage tank prototype, which, among other benefits, offers more robust insulation than traditional vacuum Dewar designs (in the event of a vacuum failure, the insulation level decreases dramatically). The relatively short storage times without consumption in an aircraft mean that insulation requirements are less restrictive than in other sectors, opening an opportunity for foam insulation, albeit with higher heat gains compared to vacuum designs. Previous experiences in the space field confirm the validity of this approach for cryogenic tanks under particular design constraints [1]. In contrast, others suggest insulation combinations to reduce the maintenance vacuum efforts [2].
Numerical simulations are unavoidable for the analysis and design of these tanks, especially when dealing with a dangerous and costly fluid that requires experimental testing be minimised as much as possible. In fact, virtualising the experiments in advance is also a positive feature that reduces risks and the duration of the campaign. Accordingly, the H2ELIOS project is developing a DTwin for tank design and analysis of operating scenarios. As an industrial design tool, it must efficiently manage computational resources to provide accurate results within a limited timeframe. The initial focus was on generating the DTwin core for dormancy and boil-off scenarios [3]. Later, the dual-foam-based design was parametrically studied to characterise the foam thickness combinations that maintain the requested dormancy times and ensure internal temperature limits for certain materials [4]. Nowadays, our attention is being shifted towards the simulation of transient scenarios of interest (gas and liquid cooldown, first filling). The scientific community is also addressing these processes to identify operating parameters or to optimise the overall storage efficiency [5,6].
This paper focuses on the description of the numerical setup to study the gas cooldown process (cooling from ambient conditions to a temperature level that preconditions the liquid cooldown process to reduce its evaporation intensity). The modelling approach and the discussion/interpretation of some illustrative results constitute the core of its contents.
2. Methodology
In the DTwin developed in the current work, an equilibrium 0D model is used to analyse the H2 gas domain, while a transient 1D model is selected for calculating insulation gains. To generate a more realistic scenario, the gas flow is determined by the difference between the inlet/supply line pressure (from which the storage tank receives the cold gas for the cooldown process) and ambient pressure as it passes through the inlet and outlet pipes and valves. These numerical bricks are explained in more detail in the following subsections.
2.1. 0D Fluid Thermodynamic Model
For the current scenario focused on the first tank cooldown phase involving cold gas supply across the system, the model for the tank internal gas is based on a first-principles 0D model (Equation (1)), considering the corresponding inlet/outlet piping and the surface contact with the insulation envelope. Kinetic and potential energy terms will be neglected, as well as the work terms, since the tank is rigid and lacks a mixer or electric supply. The thermal properties are integrated through NIST-REFPROP [7] for H2 (function of T and P).
As previously commented, the flow rates to and from the interface piping are determined by an overall convergence algorithm, along with the inlet temperature and pressure conditions from the piping models. The heat gains are determined from the interaction with the insulation model. For this paper, the geometry is simplified to be spherical; however, other shapes have been developed to better adapt to the project tank.
2.2. Insulation Analysis
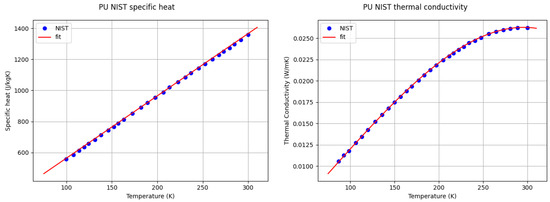
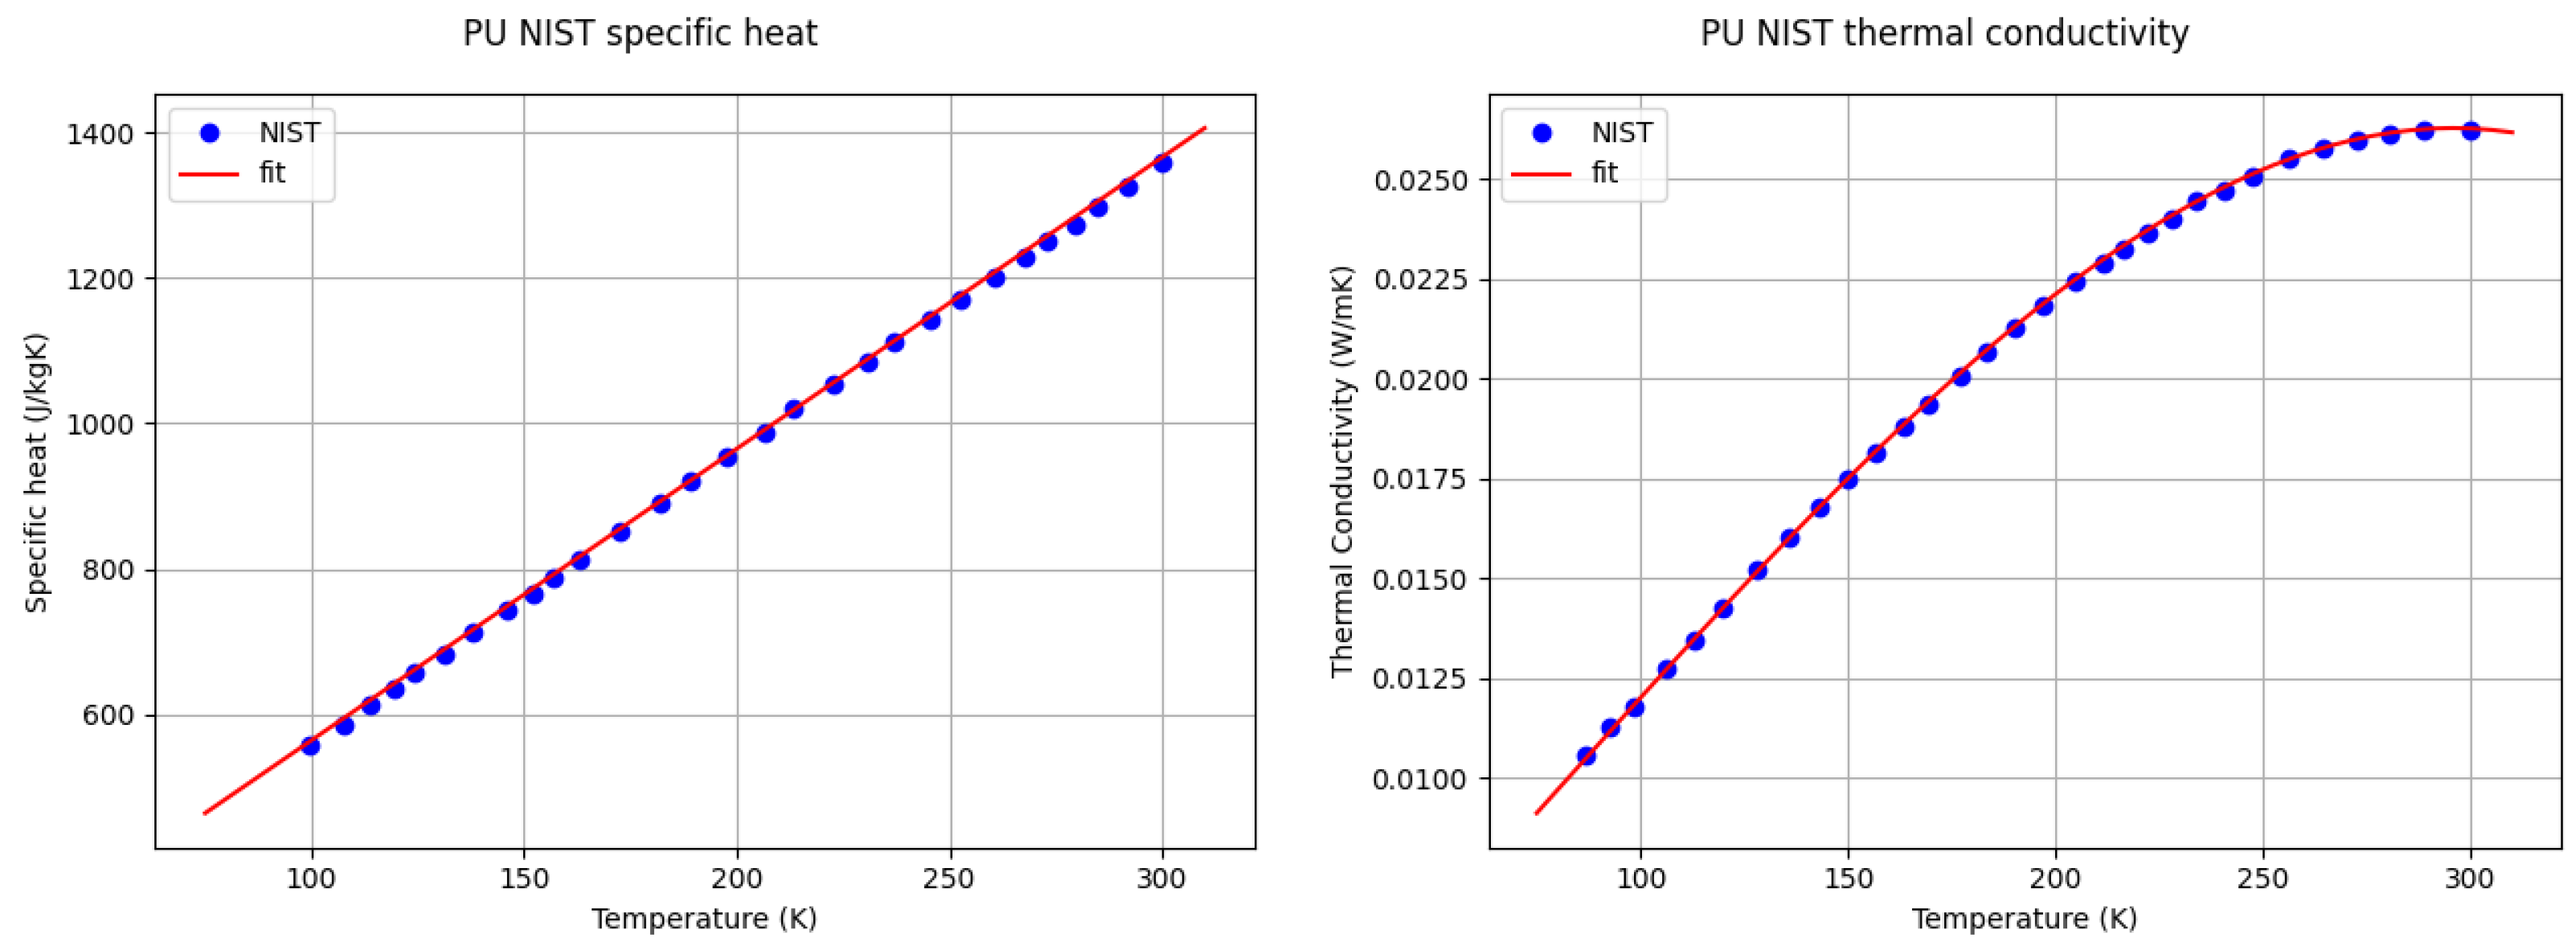
Ongoing research is examining the application of novel and multiple insulators to reduce tank gains, while protecting different materials from reaching temperatures below their operating limits (fragility, damage, etc.). For the purpose of this paper, which focuses on illustrating the overall cooldown behaviour of a foam-based cryogenic tank, a polyurethane foam has been selected to avoid using proprietary data. Thermophysical properties from the NIST cryogenic database [8] have been incorporated into and utilised in the simulations. For density, a reference value of has been considered. As described in Figure 1, there is a great change in the properties between room and cryogenic temperatures, which forces the analysis to take this variability into account.
Figure 1.
Specific heat and thermal conductivity considered in the analysis (NIST [8]).
Although the authors have already developed a CFD model to simulate the tank envelope in 3D [3], an alternative model for faster foam transient evolution is considered of strong interest to efficiently cope with parametric studies on long transient scenarios.
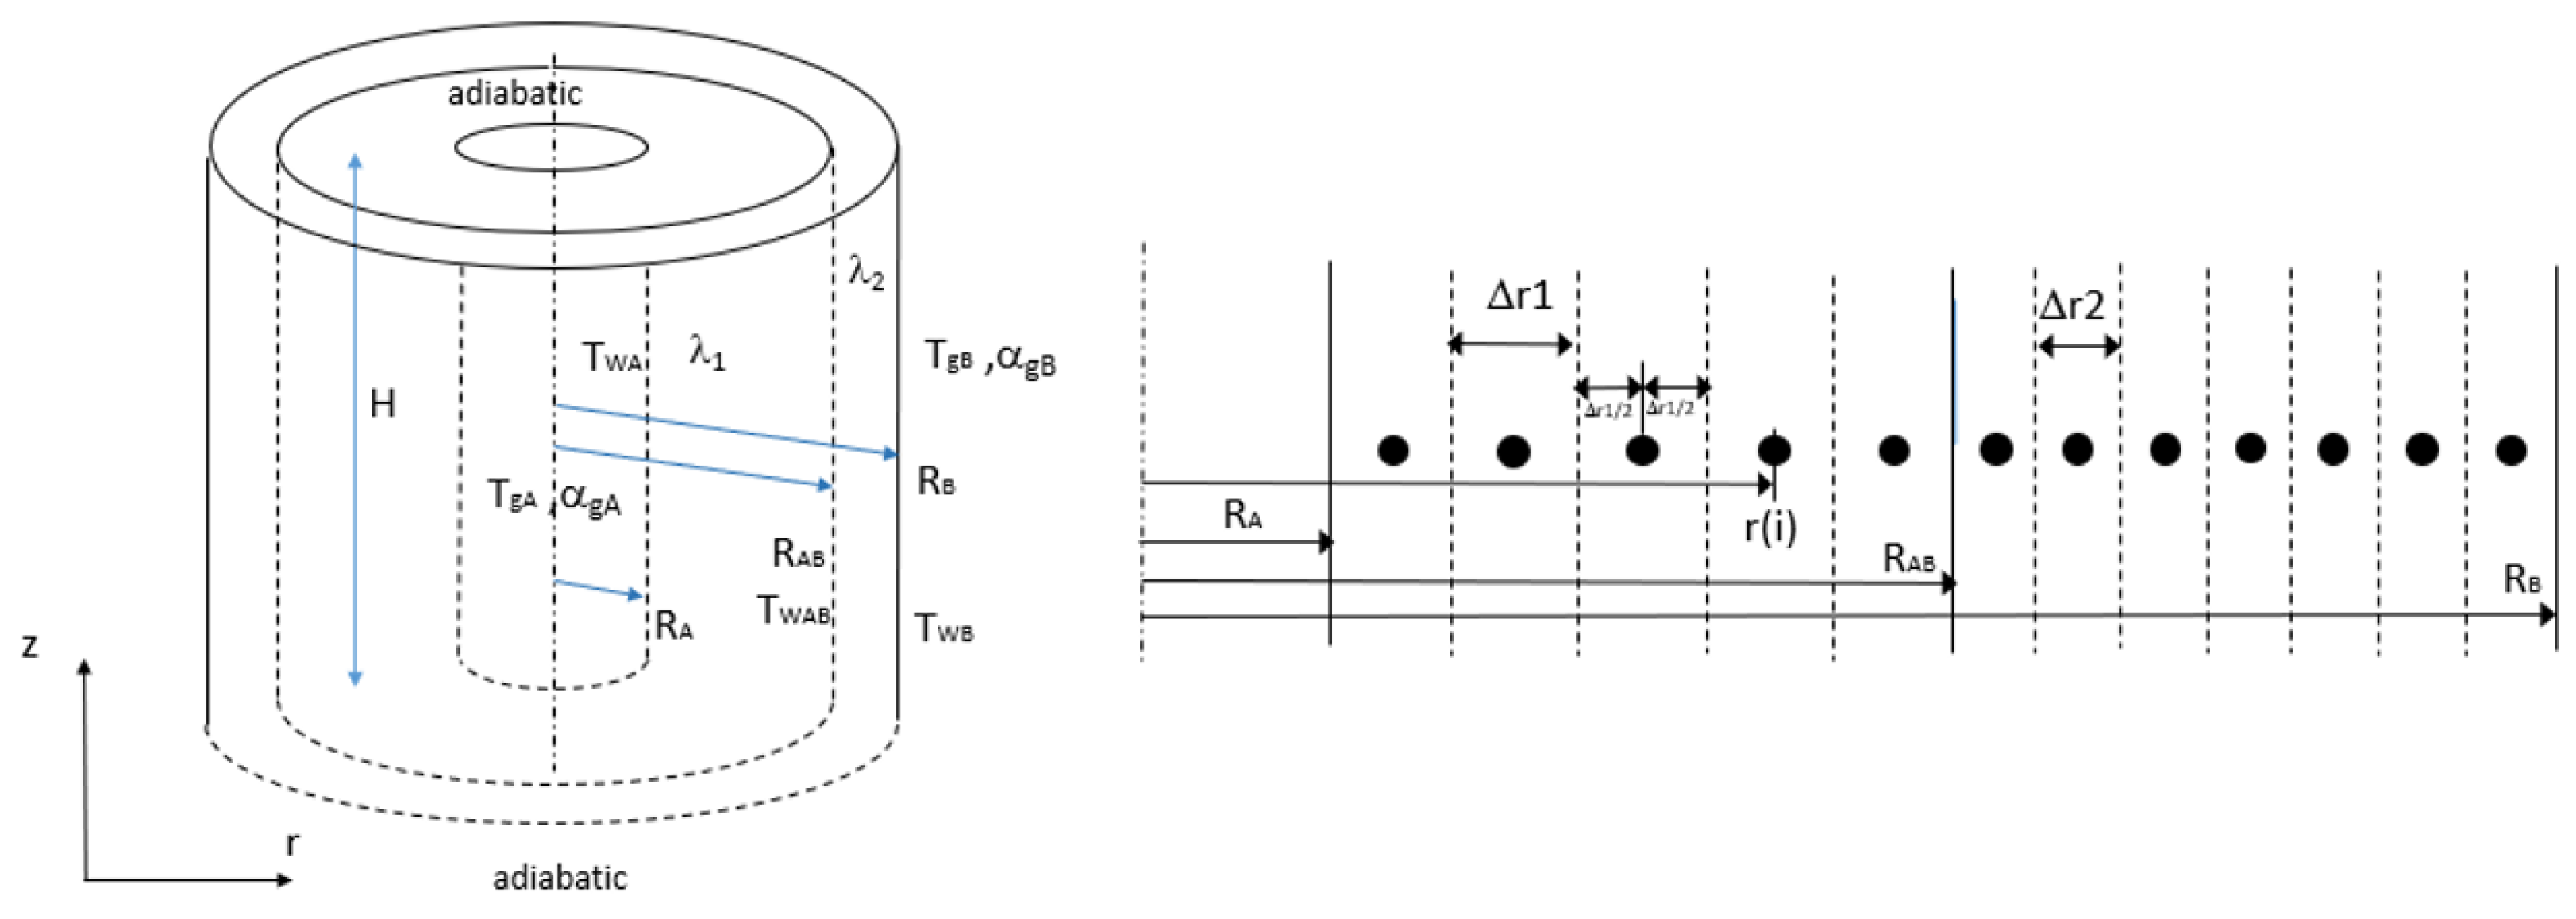
The proposed model is based on a 1D numerical solution (Figure 2) of the heat conduction equation (Equation (2)), considered representative of the dominant effects of cylindrical or spherical walls in the tanks. The discretisation allows for local variation in thermophysical properties, capturing the non-linear temperature profile across the foam, and including transient effects (thermal inertia) with a very low computational time.
Figure 2.
Insulation 1D numerical model and discretization.
The steady state of the model has been verified by comparing it with well-known plane, cylindrical and spherical heat conduction relations. To verify the transient part, an analytical solution for a plane slab submerged into a fluid [9] has been selected. To adapt the numerical model, half of the domain with an adiabatic boundary in the plane of symmetry has been imposed. The successful comparison confirmed the correct implementation, while already showing some interesting results on the impact of insulation thickness, thermal properties and heat transfer coefficients. In particular, it identified very long cooling times, in the order of 101 h, for thicknesses and properties similar to those used in the final tank.
2.3. Tank Interfaces and Overall Algorithm
The tank interfaces with the control bay and the inlet/supply line, the consumer, the venting stack, etc., are of paramount relevance when analysing any tank scenario, as are determining the flow rates from/to the tank and its working conditions (temperature, pressure, mass). For the cooldown, the inlet piping from the inlet/supply line and the outlet piping towards the atmosphere have been taken into consideration. These interfaces are primarily composed of several pipes and elbows/bends, along with a corrugated hose and a control valve. A dedicated effort has been devoted to characterising the flow resistance characteristics of these elements using proprietary/commercial data (hose, valves) or generalistic handbooks [10].
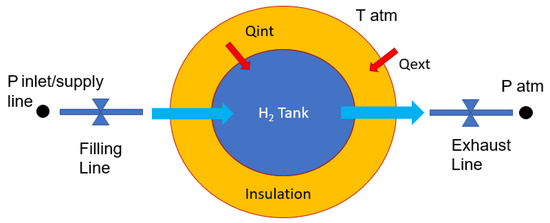
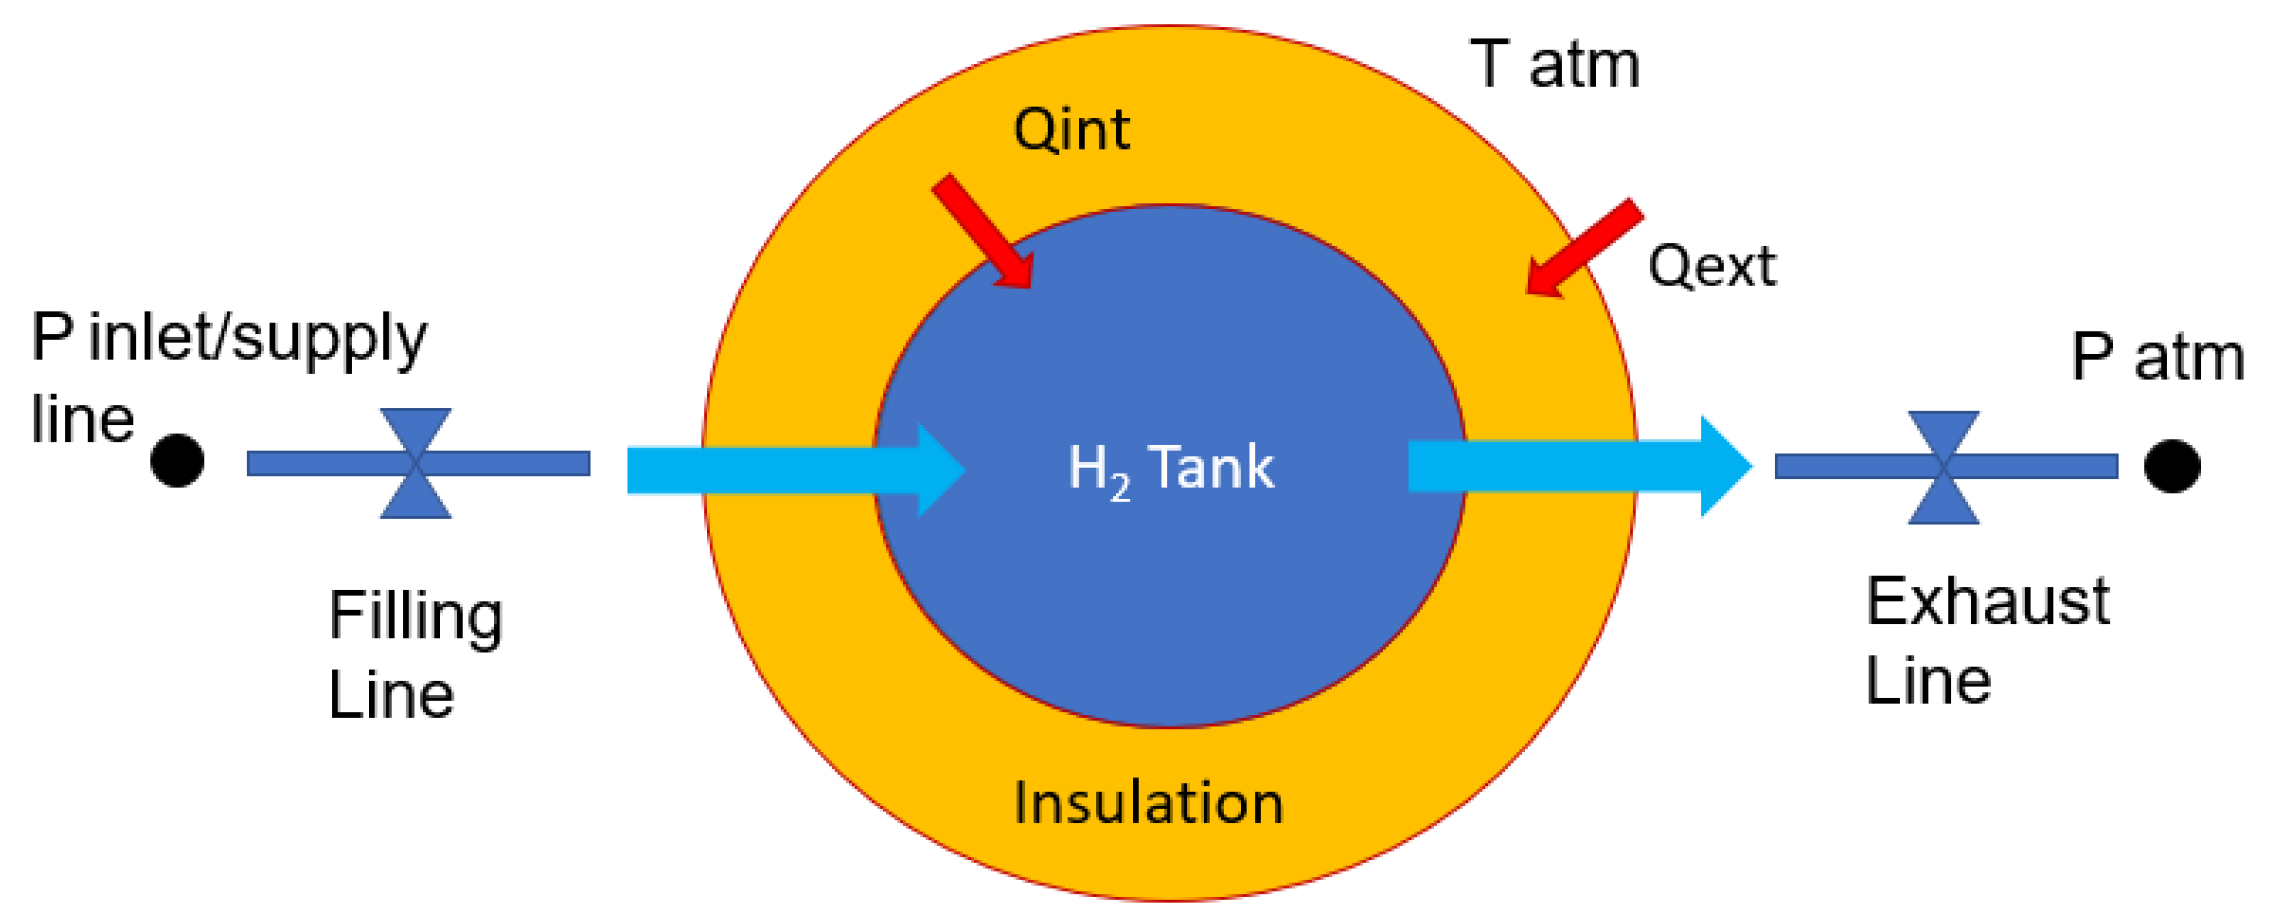
To make the overall control algorithm more manageable, the serial components are collected in a superior object called ComplexLine. Therefore, the simulation takes a ComplexLine (FillingLine) from the inlet/supply line to the tank, and a ComplexLine (ExhaustLine) from the tank to the atmosphere (Figure 3). Given fixed pressures at the inlet/supply line and the atmosphere, the tank pressure at a certain time is used to calculate the flow rates across the ComplexLines. These flow rates at the corresponding conditions are then used as interfaces of the tank model to predict the new tank pressure and temperature.
Figure 3.
Diagram showing the overall simulation setup (tank volume with inlet/outlet ComplexLines and insulation envelope). Blue arrows represent the H2 flow between numerical objects.
The convergence of this numerical algorithm after a few iterations enables us to determine the final operating point of the entire setup at each time step. As a reference for the computational time required by the DTwin, running on a Laptop computer (HP EliteBook 830 G8), a physical time scenario is resolved in (77 times faster), which is considered adequate for progressing in future intensive parametric studies.
3. Results
Now that the modelling approach has been presented, this section will focus on analysing a gas cooldown case, thereby examining the transient behaviour of the entire setup.
3.1. Case Description
The tank will be, for this illustrative work, simplified as a spherical shape (, ) with a polyurethane insulation cover of . As already described, the inlet and outlet pipings are composed of several components (13 and 4, respectively). We pay particular attention to the two control valves and the corrugated flexible hoses due to their significant pressure drop. The inlet valve has a flow capacity approximately four times that of the outlet valve, due to its respective alignment with the overall envelope of operational conditions (liquid filling, purging, etc.). The inlet/supply line is assumed to provide gH2 at and for this gas cooldown phase. The external and in-tank initial conditions are assumed to be and .
Regarding the convection interaction with the external atmosphere, a reference heat transfer coefficient of has been used, consistent with its natural convection nature. Regarding the convective heat transfer between the internal gH2 and the tank wall, a fixed value of is assumed (gas forced convective range), due to the flow field complexity and departure from classical empirical correlations (a probable topic of further research is using CFD to capture the multidimensional nature of the problem). By now, both heat transfer coefficients have become another parameter to be analysed by the DTwin.
3.2. Baseline Case
The baseline case is aligned with the previous description, with the addition that to set up the flow and pressure conditions of interest, the inlet valve is set to 50% opening and the outlet valve to 100% opening. The following section describes the results of the cooldown scenario, including the H2 tank conditions, insulation temperature and heat balance progress, and the interface pressure drop analysis.
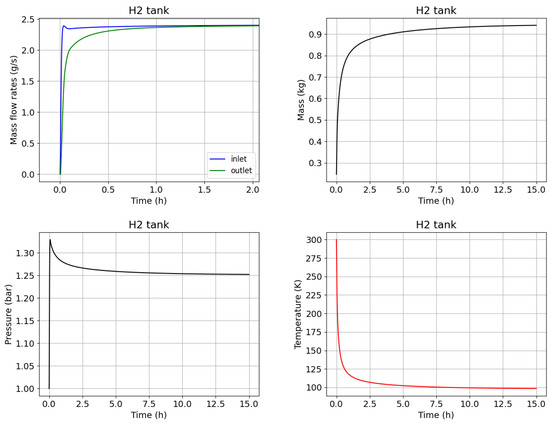
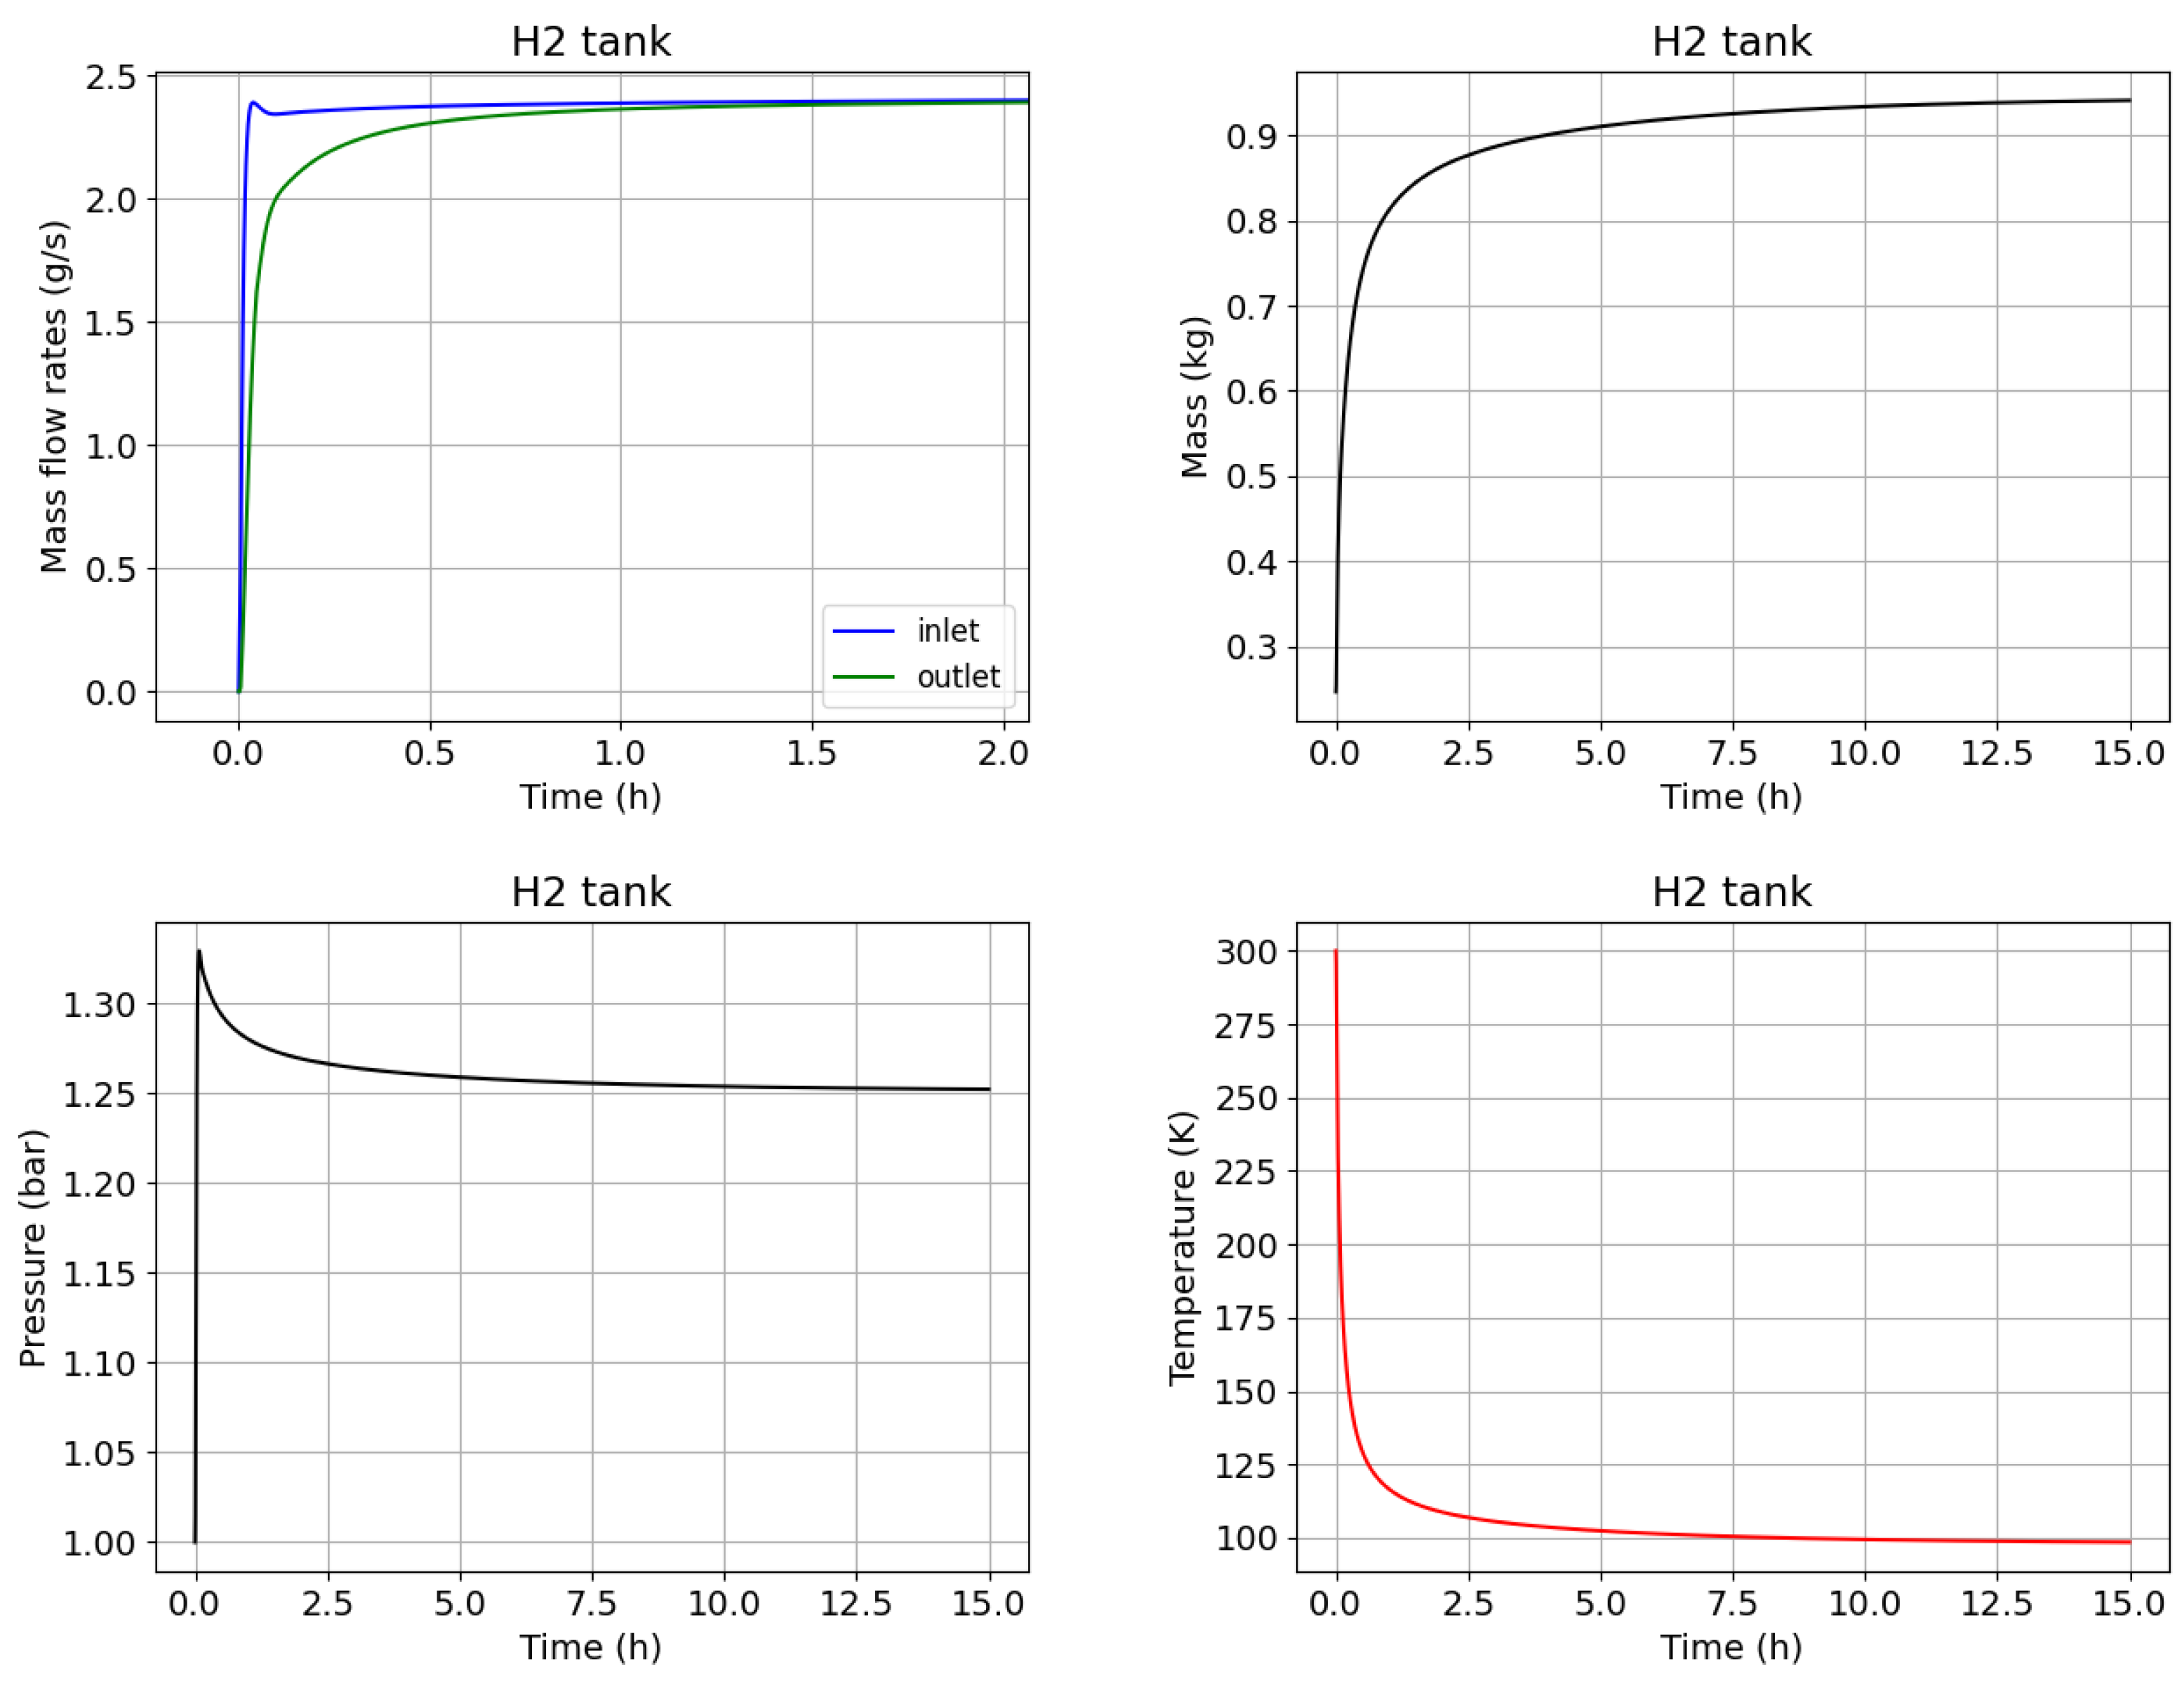
Regarding the tank conditions, Figure 4 describes the evolution of the inlet/outlet mass flows, the accumulated mass, the temperature and the pressure of the H2. At the scenario start, we observe a quick increase in the mass flow rate tank inlet, followed at a distance by the outlet flow rate (top-left subfigure), thus implying an important starting mass accumulation effect, confirmed by the result on the H2 mass evolution (top-right subfigure); the flow stabilises at . On the other hand, the pressure (bottom-left subfigure) sharply increases at the beginning due to the higher pressure of the inlet flow compared to the atmospheric in-tank starting conditions; after this initial period, the pressure stabilises in about to a final pressure of . Finally, the temperature exponentially decreases down to a value of in less than .
Figure 4.
Baseline case, in-tank H2: from top to bottom and left to right are time evolution of mass flows, accumulated mass, pressure and temperature.
The calculated mass flow rate in the final steady conditions is a result of the equilibrium between the inlet and outlet piping flow resistance vs. the available pressure difference between the inlet/supply line and the atmosphere. On the other hand, the tank pressure is related to the flow resistance proportion between the inlet and outlet piping under the equilibrium flow rate. For this baseline case, the tank equilibrium pressure at is a consequence of an inlet piping pressure drop of and an outlet piping pressure drop of , both with the valves as the dominant component (>99%).
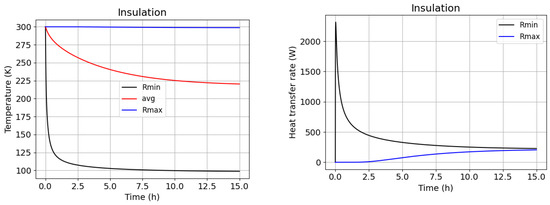
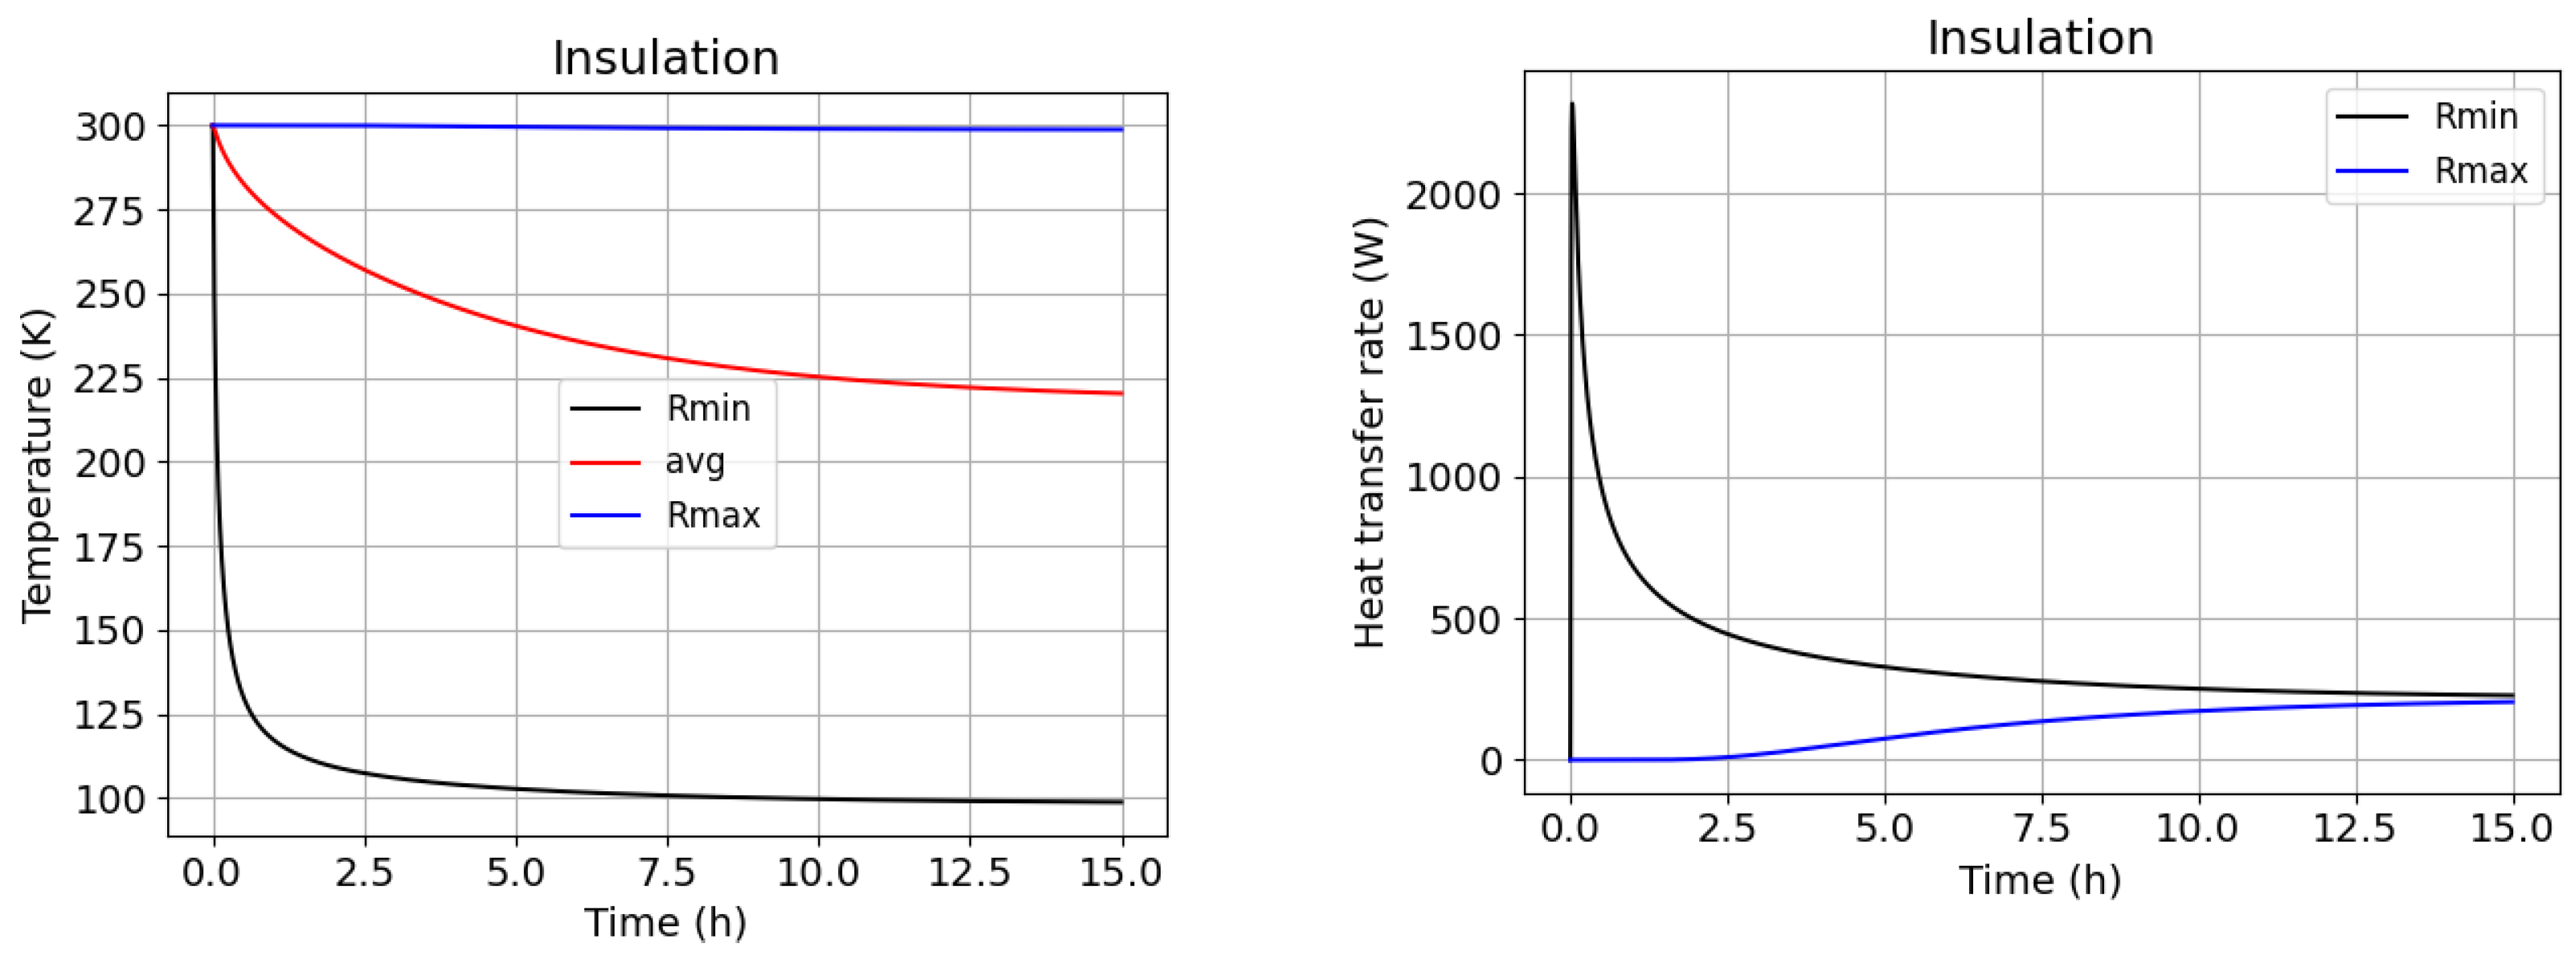
After the fluid evolution, the transient temperature and heat transfer on the insulation layer are of the utmost importance to visualise its thermal inertia and the corresponding impact on the time needed to cool down the tank envelope. As seen in Figure 5, the temperature and heat transfer evolution achieve stabilisation after approximately (for complete stabilization as seen in Table 1), which is a very important conclusion when planning this phase in such kinds of tanks (in operation or for research experiments). The temperature on the external skin (Rmax) changes slightly compared to the ambient temperature, and the internal temperature follows the same profile as the internal fluid. However, the average temperature of the insulation shows a temperature decay. For the heat transfer, it can be observed that the value at the H2 side (Rmin) experiences a sudden peak when the cold flow enters the tank, followed by an exponential decay. Meanwhile, the heat transfer on the external skin takes some time to notice the colder temperature and starts to increase progressively. The difference between the heat extracted at Rmin and the heat incoming at Rmax indicates the level of heat release of the insulation over time; it ultimately becomes null when both converge to a steady heat gain of .
Figure 5.
Baseline case, insulation: temperature (left) and heat transfer (right) time evolution.
Table 1.
Influence of inlet and outlet valve opening positions.
As can be observed, even though it is a relatively simple model as a whole, the amount of information provided is relevant and allows for a deeper understanding of the transient conditions’ progress and the physical reasons behind those changes.
3.3. Parametric Study
After analysing in detail a baseline operating condition in the previous section, it is considered of interest to use the described numerical setup to investigate the impact of some parameters on the tank cooldown.
The first study is intended to capture the overall flow resistance effect and the ratio of inlet to outlet flow resistances by varying the valve openings (25% to 100%) relative to the baseline condition (50% inlet and 100% outlet valve openings) (Table 1).
As observed, a higher inlet valve opening (first four rows) decreases the total flow resistance, therefore increasing the mass flow across the tank. Its progressive lower relative pressure drop shifts the tank pressure towards the inlet condition (2.5 bar). In a similar way, but with less impact due to its inherent lower flow resistance, a wider outlet valve opening (last four rows) increases the mass flow and shifts the tank pressure towards the outlet condition (1 bar). The impact of these changes on the time to reach steady conditions and on heat gains is only significant for the case with the lowest opening on both valves, as it has a very low mass flow rate (0.33 g/s).
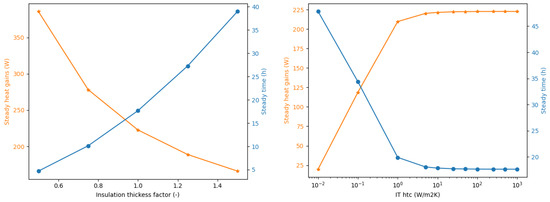
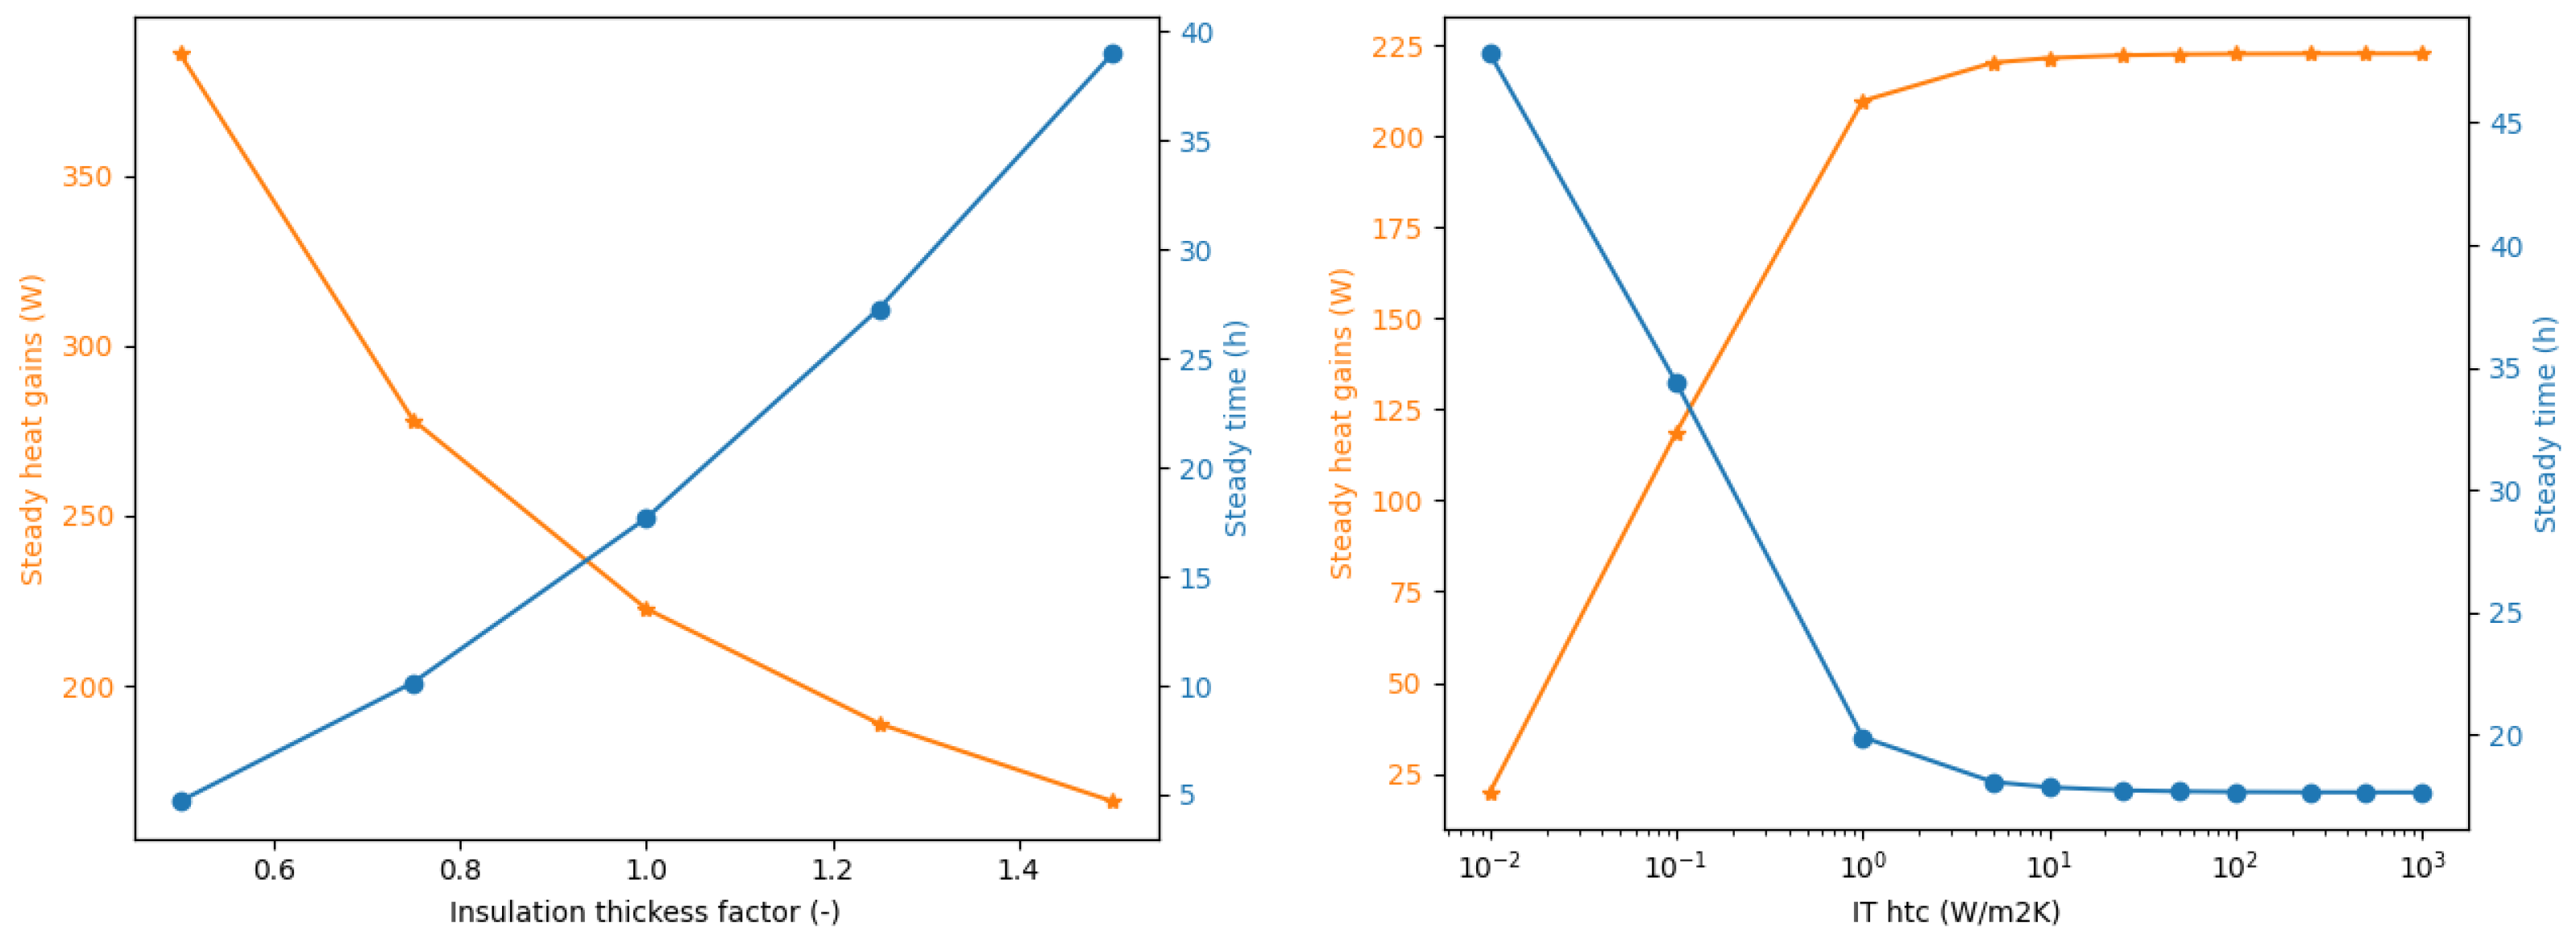
An additional study (Figure 6, left) examines the influence of foam thickness, applying a factor over the baseline thickness (250 mm). It can be seen that increasing the insulation thickness results in the expected reduction in heat gains, but the increased thermal inertia worsens the time to reach steady state. Therefore, in addition to the typical design trade-off between heat gains and dormancy vs. cost and weight, we need to consider thermal inertia.
Figure 6.
Parametric analysis: insulation (left) and inner tank surface heat transfer coefficient (right).
Determining the inner tank’s internal surface heat transfer coefficient is not straightforward in this case, as the gas flow in contact with the internal tank surface is far from canonical geometries such as pipes or plates. Future CFD studies are planned to provide the proposed 0D/1D model with better information on this aspect, including its spatial distribution. At this time, a parametric study has been conducted to assess the impact of the heat transfer coefficient on the results. As shown in Figure 6 (right), the heat transfer coefficient impact is almost negligible on heat gains and the steady state time for values down to 10 W/m2K. Regarding heat gains, this result confirms that in this application, the foam thermal resistance is the dominant one for heat transfer coefficients above this threshold. On the steady state time side, transient heat conduction theory for slab cooling indicates that, for Biot numbers above a threshold, the transient response is weakly affected by the heat transfer coefficient, as observed in our results.
4. Conclusions
This work presents a numerical analysis of the gas cooldown process for a foam-insulated cryogenic tank. The industrial context and the need to conduct parametric studies of long transient scenarios have prompted the use of relatively simple yet representative models for the DTwin setup in this case. Current cases, even accounting for local non-linear thermal conductivity and iterating from boundary pressures to obtain mass flow rates, run about 70 times faster than physical time on a common laptop.
The results identify long cooldown times of the order of due to the significant thermal inertia inherent in a relatively high foam thickness. Variation in inlet and outlet valve positions has a strong impact on flow rates and tank pressure, underscoring the importance of accounting for tank interfaces to capture their actual conditions. Further parametric study has shown that increasing the foam thickness reduces gains but penalises the time to reach steady state. The influence of the inner tank heat transfer coefficient has finally been discussed, confirming that, above a threshold, it has a limited effect on the cooldown process. All the results have been generated without any numerical convergence problem after the application of sub-relaxation between the tank and the interfaces’ pressure–flow coupling. Future work is foreseen to extend the study using CFD to analyse in more detail gas-to-wall interactions and local thermal bridges.
Author Contributions
Conceptualization and methodology, C.O., E.S. and M.M.-O.; writing—original draft preparation, C.O.; writing—review and editing, E.S., M.M.-O. and J.C.; project administration and funding acquisition, J.C. and C.O. All authors have read and agreed to the published version of the manuscript.
Funding
Developed in the mark of the HydrogEn Lightweight & Innovative tank for zerO-emisSion aircraft (H2ELIOS) research project Ref. 101102003, (https://h2elios.eu/home, accessed on 2 May 2026). The project H2ELIOS is funded by the European Union within the Clean Aviation Programme. Views
and opinions expressed are those of the author(s) only and do not necessarily reflect those of the European Union or Clean Aviation JU. Neither the European Union nor Clean Aviation JU can be held responsible for them. The authors and EU/Clean Aviation are not responsible for any use that may be made of the information the paper contains. 
Institutional Review Board Statement
Not applicable.
Informed Consent Statement
Not applicable.
Data Availability Statement
Data are contained within the article.
Acknowledgments
Carles Oliet acknowledges the Catalan Government for the support through the Serra Húnter Program. Marcial Mosqueda is supported by the Catalan Agency for Management of University and Research Grants (2024 FI-1 00684).
Conflicts of Interest
The authors declare no conflicts of interest.
Abbreviations
The following abbreviations are used in this manuscript:
| DTwin | Digital Twin | Subscripts | |
| LH2 | Liquid Hydrogen | i | inlet |
| gH2 | Gas Hydrogen | o | outlet |
References
- Fesmire, J.; Coffman, B.; Meneghelli, B.; Heckle, K. Spray-on foam insulations for launch vehicle cryogenic tanks. Cryogenics 2012, 52, 251–261. [Google Scholar] [CrossRef] [Scilit]
- Kang, D.H.; An, J.H.; Lee, C.J. Numerical modeling and optimization of thermal insulation for liquid hydrogen storage tanks. Energy 2024, 291, 130143. [Google Scholar] [CrossRef] [Scilit]
- Oliet, C.; Mosqueda-Otero, M.; Schillaci, E.; Amani, A.; Rigola, J.; Castro, J. Thermal Digital Twin of LH2 Aircraft Storage Tank. Eng. Proc. 2025, 90, 97. [Google Scholar] [CrossRef] [Scilit]
- Oliet, C.; Schillaci, E.; Mosqueda-Otero, M.; Amani, A.; Rigola, J.; Castro, J. Insulation Optimization of Dual-Foam Insulated H2 Cryogenic Tank. In Proceedings of the 11th European Conference for Aeronautics and Space Sciences (EUCASS), Rome, Italy, 30 June–4 July 2025. [Google Scholar] [CrossRef]
- Wang, J.; Webley, P.A.; Hughes, T.J. Cooldown strategies for ship-borne cryogenic storage tanks during the ballast voyage. Energy 2025, 334, 137568. [Google Scholar] [CrossRef] [Scilit]
- Petitpas, G. Boil-Off Losses Along LH2 Pathway; Technical Report LLNL-TR-750685; Lawrence Livermore National Laboratory: Livermore, CA, USA, 2018. [Google Scholar]
- Lemmon, E.W.; Bell, I.H.; Huber, M.; McLinden, M. NIST Standard Reference Database 23: Reference Fluid Thermodynamic and Transport Properties-REFPROP, Version 10.0; Standard Reference Data Program; National Institute of Standards and Technology: Gaithersburg, MD, USA, 2018.
- NIST Cryogenic Database. 2025. Available online: https://trc.nist.gov/cryogenics/ (accessed on 13 November 2025).
- Lienhard, J.H., V; Lienhard, J.H., IV. A Heat Transfer Textbook, 6th ed.; Phlogiston Press: Cambridge, MA, USA, 2024. [Google Scholar]
- Idelchik, I.E. Handbook of Hydraulic Resistance, 4th ed.; Begell House, Inc.: Danbury, CT, USA, 2007. [Google Scholar]

Disclaimer/Publisher’s Note: The statements, opinions and data contained in all publications are solely those of the individual author(s) and contributor(s) and not of MDPI and/or the editor(s). MDPI and/or the editor(s) disclaim responsibility for any injury to people or property resulting from any ideas, methods, instructions or products referred to in the content. |
© 2026 by the authors. Licensee MDPI, Basel, Switzerland. This article is an open access article distributed under the terms and conditions of the Creative Commons Attribution (CC BY) license.