


Abstract
The use of liquid hydrogen (LH2) as a civil aircraft fuel is gaining attention due to increasing environmental concerns associated with conventional fossil fuels. The EU-funded HASTA (Hydrogen Aircraft Sloshing Tank Advancement) project aims to investigate, both experimentally and numerically, the storage of LH2 in civil aircraft, ultimately providing design guidelines for cryogenic fuel tanks. A critical phenomenon affecting airborne cryogenic tanks is the ullage pressure drop, which can occur due to in-flight excitations that induce mixing between the liquid and gas phases. As an initial step toward understanding the sloshing dynamics in LH2 tanks, this study investigated isothermal sloshing in a small-scale, horizontal cylindrical tank. An experimental campaign was conducted using an 80 mm × 120 mm cylindrical horizontal tank, partially filled with deionised water and subjected to vertical sinusoidal excitation. The objective was to map the liquid response regimes to the excitation frequency–amplitude range of interest. A sloshing regime map was obtained, providing a key understanding of the liquid dynamics, indicating excitation amplitudes and frequencies that can lead to phase mixing. Ten distinct sloshing modes were observed within the 4–10 Hz excitation frequency range, with this study focusing on mode (1 0), the lowest-frequency response and particularly critical for such systems. The modal frequency and damping were obtained using a sloshing surface identification algorithm, and the relationship between the sloshing force and tank displacement/velocity was analysed to provide insight into the sloshing regime. Apart from providing important insights into the sloshing regimes inside horizontal cylindrical tanks, this research also establishes the experimental characteristics needed for future numerical model calibration.
1. Introduction
There is growing interest in the use of liquid hydrogen (LH2) as an alternative to fossil fuels for long-range aircraft. For the same energy content, LH2 is approximately 2.8 times lighter than kerosene, with the disadvantage that it requires about four times the volume [1]. While the difference in energy density make LH2 a promising alternative to conventional fuels for greener, longer flights, the need for cryogenic operating conditions leads to substantial differences in fuel system design. One major challenge associated with the use of LH2 fuel tanks in aircraft concerns their dynamic response to aircraft movement during flight and ground operations. Previous studies have shown that significant drops in ullage pressure can occur when LH2 fuel tanks are subjected to oscillatory motions [2]. If not properly understood and modelled, such pressure drops may compromise tank integrity or induce pump cavitation. Considering the range of in-flight and on-ground dynamic excitations typically experienced by large aircraft [3], pressure drops are expected to occur when LH2 is used for this category of aircraft. Currently, close attention is being paid to LH2 tank design for large aircraft under the EU-funded HASTA (Hydrogen Aircraft Sloshing Tank Advancement) project. HASTA aims to investigate, both experimentally and numerically, the storage of LH2 in civil aircraft and ultimately provide design guidelines for cryogenic fuel tanks. Previous research has shown that the liquid sloshing regime (i.e., the sloshing mode and nonlinearity or violence of the free-surface liquid motion) correlates with the rate of the pressure drop in LH2 tanks [4]. It is therefore of particular importance to understand the excitation conditions that may lead to critical sloshing regimes. Moreover, the sloshing mode and general liquid motion patterns are influenced by the tank geometry [5]. Considering the shape of the fuselage, it is likely that an LH2 fuel tank designed for an aircraft certified under CS-25 specifications will have a horizontally oriented cylindrical geometry. In this context, studying sloshing phenomena in horizontal cylindrical tanks becomes especially relevant. The sloshing modes and instability regions for such geometries, however, are not yet well understood or characterised [6,7,8]. To address the challenges associated with mapping sloshing regimes in horizontal cylindrical tanks, an experimental study is conducted to investigate the dynamic behaviour of the fluid in this type of geometry. Because experiments with LH2 require a complex setup, deionised water is selected as a surrogate for an initial assessment of the free-surface response. Although LH2 and water differ in density, surface tension, and thermophysical properties, such investigations can be structured in two stages [9]: an isothermal campaign, in which thermodynamic effects are neglected and the behaviour of the fluid under external excitation is dominated by inertial and gravitational forces, so that water can reproduce the free-surface dynamics once Froude similarity is enforced, and a non-isothermal campaign, in which thermal stratification representative of that in cryogenic tanks is reproduced using a biphasic water–water vapour system. The present study addresses the first stage, and the experimental campaign is conducted under isothermal conditions at 50% fill, where sloshing forces are typically maximised [10,11]. Liquid behaviour is examined under vertical excitation in the 4–10 Hz range, encompassing the first longitudinal mode and higher modes representative of scaled aircraft-relevant frequencies. The campaign pursues two objectives: mapping sloshing stability boundaries in a horizontal cylindrical tank under vertical forcing and quantifying vertical sloshing forces to characterise the resulting regimes, with particular emphasis on the first longitudinal mode (1 0), which mobilises the largest fraction of liquid mass [5,6]. For this mode, visually identified regimes are further assessed through their dissipated energy. In this study, an experimental setup is developed, described in Section 2. The results and discussion, including an energy-based analysis of the sloshing regimes, are presented in Section 3, and conclusions are drawn in Section 4.
2. Materials and Methods
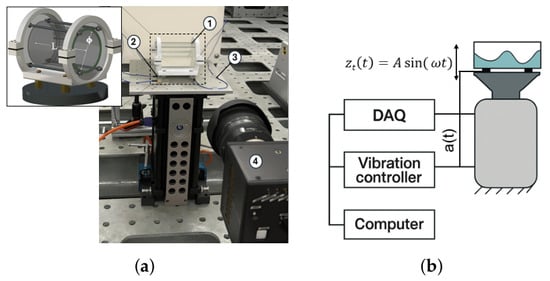
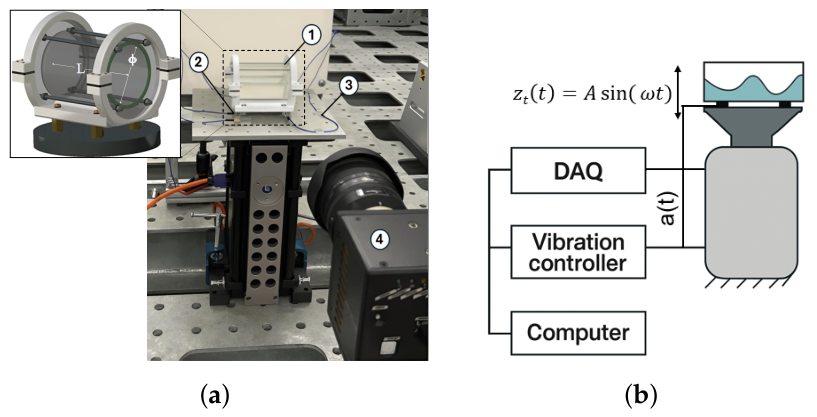
As a first step, the tank geometry was defined. Since no reference LH2 tank dimensions exist for aircraft, the reference configuration was selected to fit within the fuselage of a representative mid-range large aircraft, in accordance with the CS-25 regulations [3], and a scaled model was designed. Its geometric parameters were obtained by enforcing Froude similarity [12,13], with a length–scale ratio . The main dimensions are listed in Table 1, and the tank is shown in Figure 1a, where is the diameter, L the length, and V the volume. The tank is composed of cast acrylic (PMMA) for optical access, with flat end-plates replacing cylindrical end-caps to reduce the geometric complexity and facilitate liquid behaviour modelling. Given the 5 mm thick cylindrical walls, 10 mm thick end-caps fixed by four screwed rods, and the fully infilled 3D-printed PLA+ support, the assembly’s deformability is assumed to be negligible for the low excitation amplitudes considered.
Table 1.
Reference and scaled tank parameters.
Figure 1.
Vertical excitation isothermal experimental setup. (1) Transparent sloshing tank; (2) force sensors and accelerometer; (3) vertical shaking table; (4) high-speed camera. (a) Test rig and (b) schematic diagram of experimental setup.
Vertical excitation of the tank was achieved using an APS-400 long-stroke shaker (APS Dynamics, Inc./SPEKTRA GmbH Dresden, Germany), controlled in amplitude and frequency by a Spider-80X controller (Crystal Instruments Corporation, Santa Clara, CA, USA), as shown in Figure 1b. Tank acceleration was measured with a SDI 2240-005 MEMS accelerometer (Silicon Designs, Inc., Kirkland, WA, USA) (uncertainty: 0.3%), while total interface forces were recorded using four ICP® 208C04 force sensors (PCB Piezotronics, Inc., Depew, NY, USA) (uncertainty: ), with all signals acquired via a QuantumX MX840B module (Hottinger Brüel & Kjaer GmbH, Darmstadt, Germany). A Photron WX100 high-speed camera (Photron USA, Inc., San Diego, CA, USA) at 125 fps was used to correlate the measurements with the free-surface dynamics.
The experimental campaign to map the stability boundaries comprised two phases: (I) mode detection via a 4–10 Hz sine sweep at 0.3 mm, followed by targeted sinusoidal runs near the detected mode for confirmation, and (II) stability boundary identification, by varying the excitation frequency and amplitude in steps of 0.1 Hz and 0.05 mm, respectively, to determine the onset of free-surface oscillations. For the first longitudinal mode (1 0), all frequency–amplitude pairs within the stability boundary were tested to characterise the sloshing regimes, which were classified by dissipated energy from the hysteresis loop in the mean sloshing force–displacement representation. The sloshing force () was computed by subtracting the dry contribution (, support structure plus water mass, totalling ) from the total load () measured by the four sensors, as given in Equation (1):
Signals were processed in MATLAB® R2025a and band-pass-filtered (third-order zero-phase Butterworth, 0.1–30 Hz), and the tank displacement and velocity were derived by numerical integration of the sinusoidal acceleration signal using the trapezoidal rule.
3. Results and Discussion
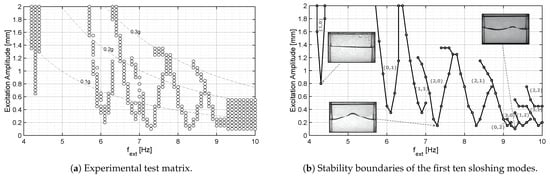
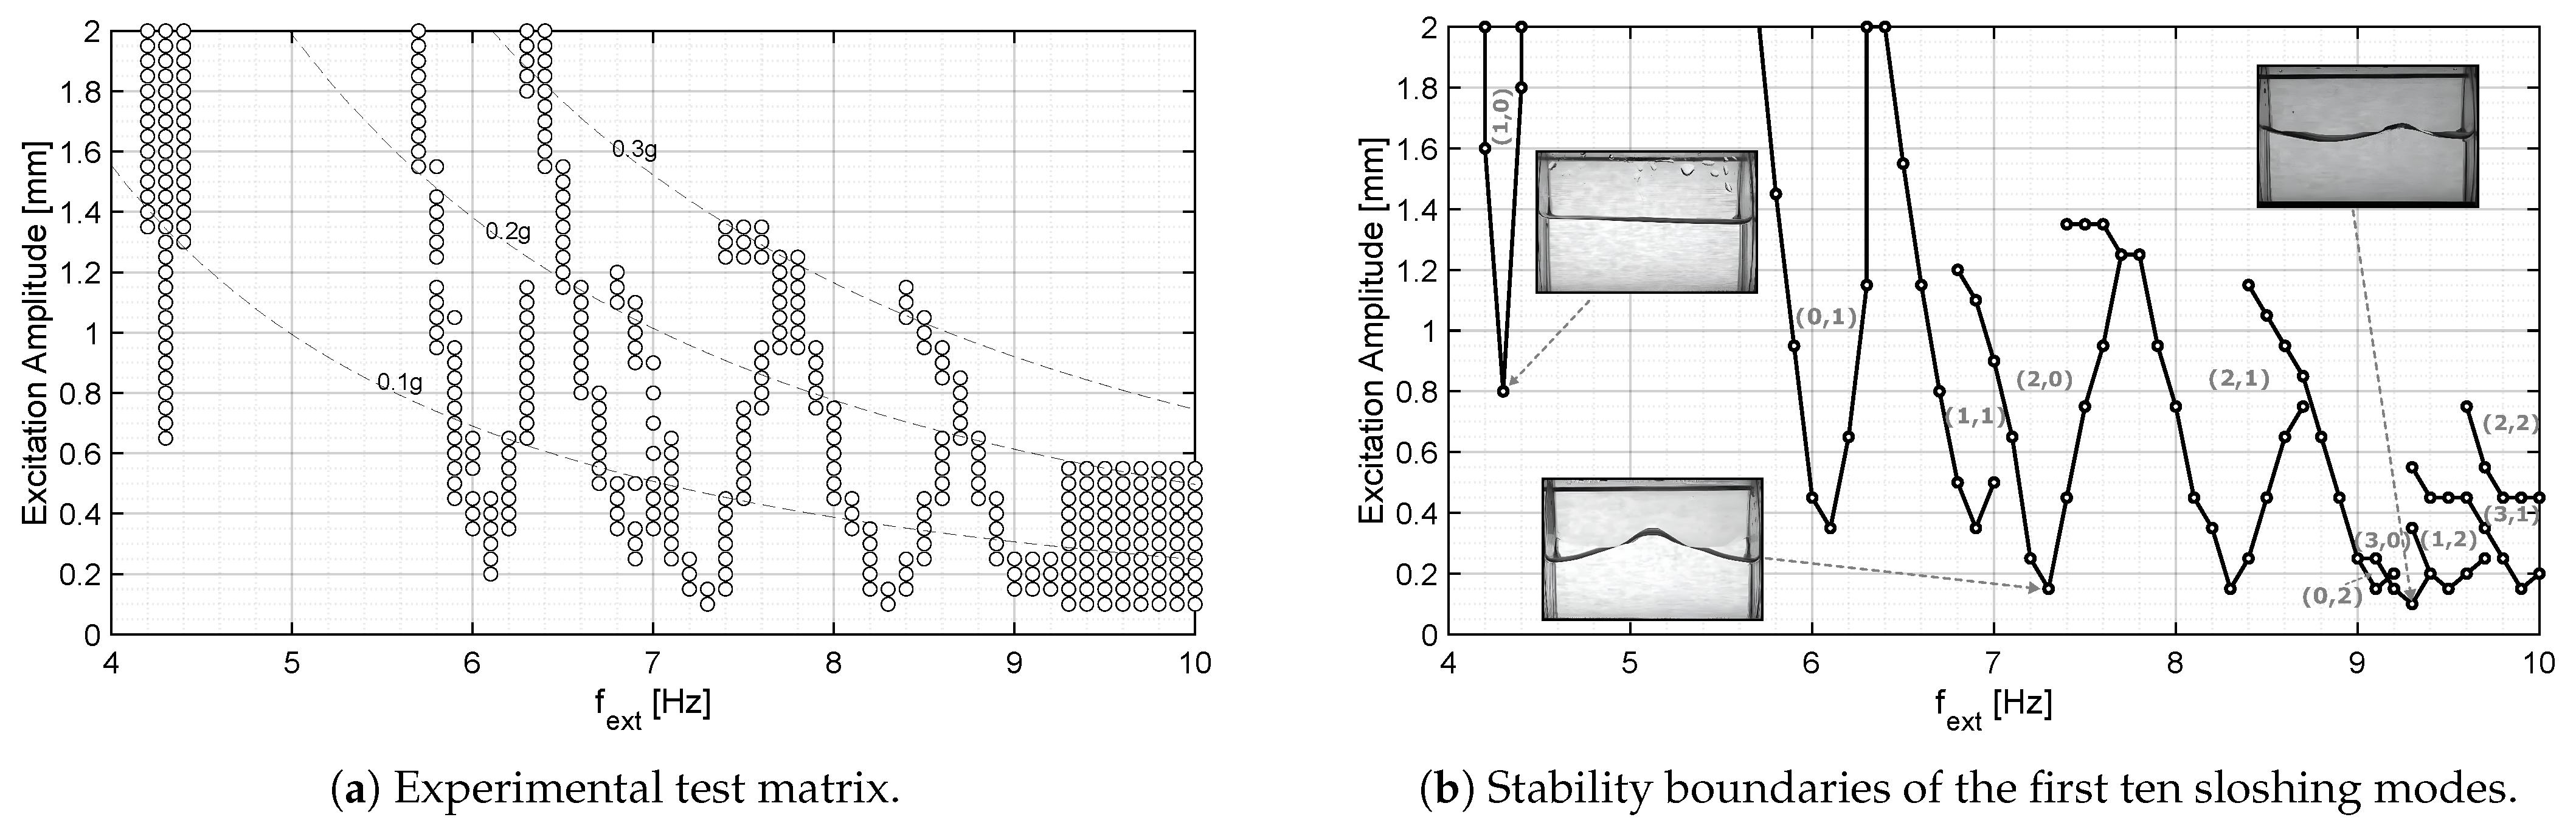
For a half-full, 1/25-scale horizontal cylindrical tank, the stability boundaries of the visually identified modes in the 4–10 Hz range are shown in Figure 2b. Based on these boundaries, the resulting mode stability diagram (Ince–Mathieu chart) delineates regions of critical sloshing response in the excitation frequency–amplitude domain [5,14]. Since the excitation is applied normal to the free surface (parametric excitation [5]), resonance occurs at approximately twice the natural sloshing frequency. Therefore, the abscissa is expressed as twice the natural sloshing frequency, while the ordinate represents the excitation amplitude. Consequently, the natural frequencies inferred from the chart correspond to a one-half subharmonic response.
Figure 2.
Experimental test matrix and stability boundaries for an excitation frequency ranging from 4 to 10 Hz.
After the natural frequency of each mode was identified in phase I, as described in the previous section (e.g., mode (1 1) being identified at 6.9 Hz and 0.35 mm, using frequency and amplitude increments of 0.1 Hz and 0.05 mm, respectively, for the targeted tests in this first phase), the stability boundaries in Figure 2b were mapped by varying the excitation frequency and amplitude according to phase II. All excited frequency–amplitude pairs are marked in Figure 2a. At a fixed frequency (e.g., 7 Hz), the amplitude was increased in 0.05 mm steps until the quiescent free surface lost stability and the corresponding modal oscillations were first observed (e.g., mode (1 1) at 0.5 mm). The resulting instability threshold is marked by a dot in Figure 2b. Connecting these points with a black line indicates the stability boundary, separating a stable region (below the line), where the free surface remains quiescent, from unstable regions above the line, where the free surface starts to oscillate according to a certain modal shape with varying degrees of nonlinearity [14]. Each unstable region is labeled by the corresponding mode.
With further increases in amplitude, additional stability boundaries may emerge that bound the unstable region of a given mode (e.g., the stability boundary of mode limits the unstable region of mode ), indicating the excitation of a different mode at higher amplitudes. Since the present study focuses on the modal response, excitation amplitudes above 1.2 mm for frequencies exceeding 7 Hz were not tested due to the nonlinear effects. Therefore, the imposed amplitude was progressively reduced above 7 Hz, as shown in Figure 2a.
Since experimental investigations of this geometry under vertical excitation are limited in the literature [8,10], the natural frequencies identified for the half-filled horizontal cylindrical tank (Figure 2b) are compared in Table 2 with predictions from three published models, providing additional validation of these models: an analytical solution [7], a semi-analytical method [8], and an approximate analytical model based on an equivalent rectangular tank [10]. The best agreement is obtained with the equivalent rectangle approach [10], with a maximum deviation of 5.4%. For the other two methods, the error increases with the mode number, mainly due to surface tension effects associated with the relatively small tank dimensions.
Table 2.
Comparison between experimental excitation frequencies and reference values from different prediction methods.
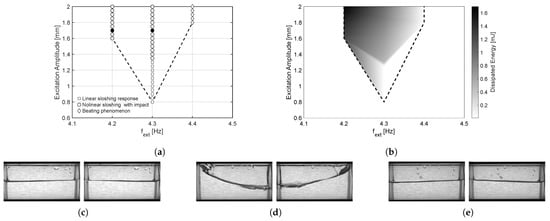
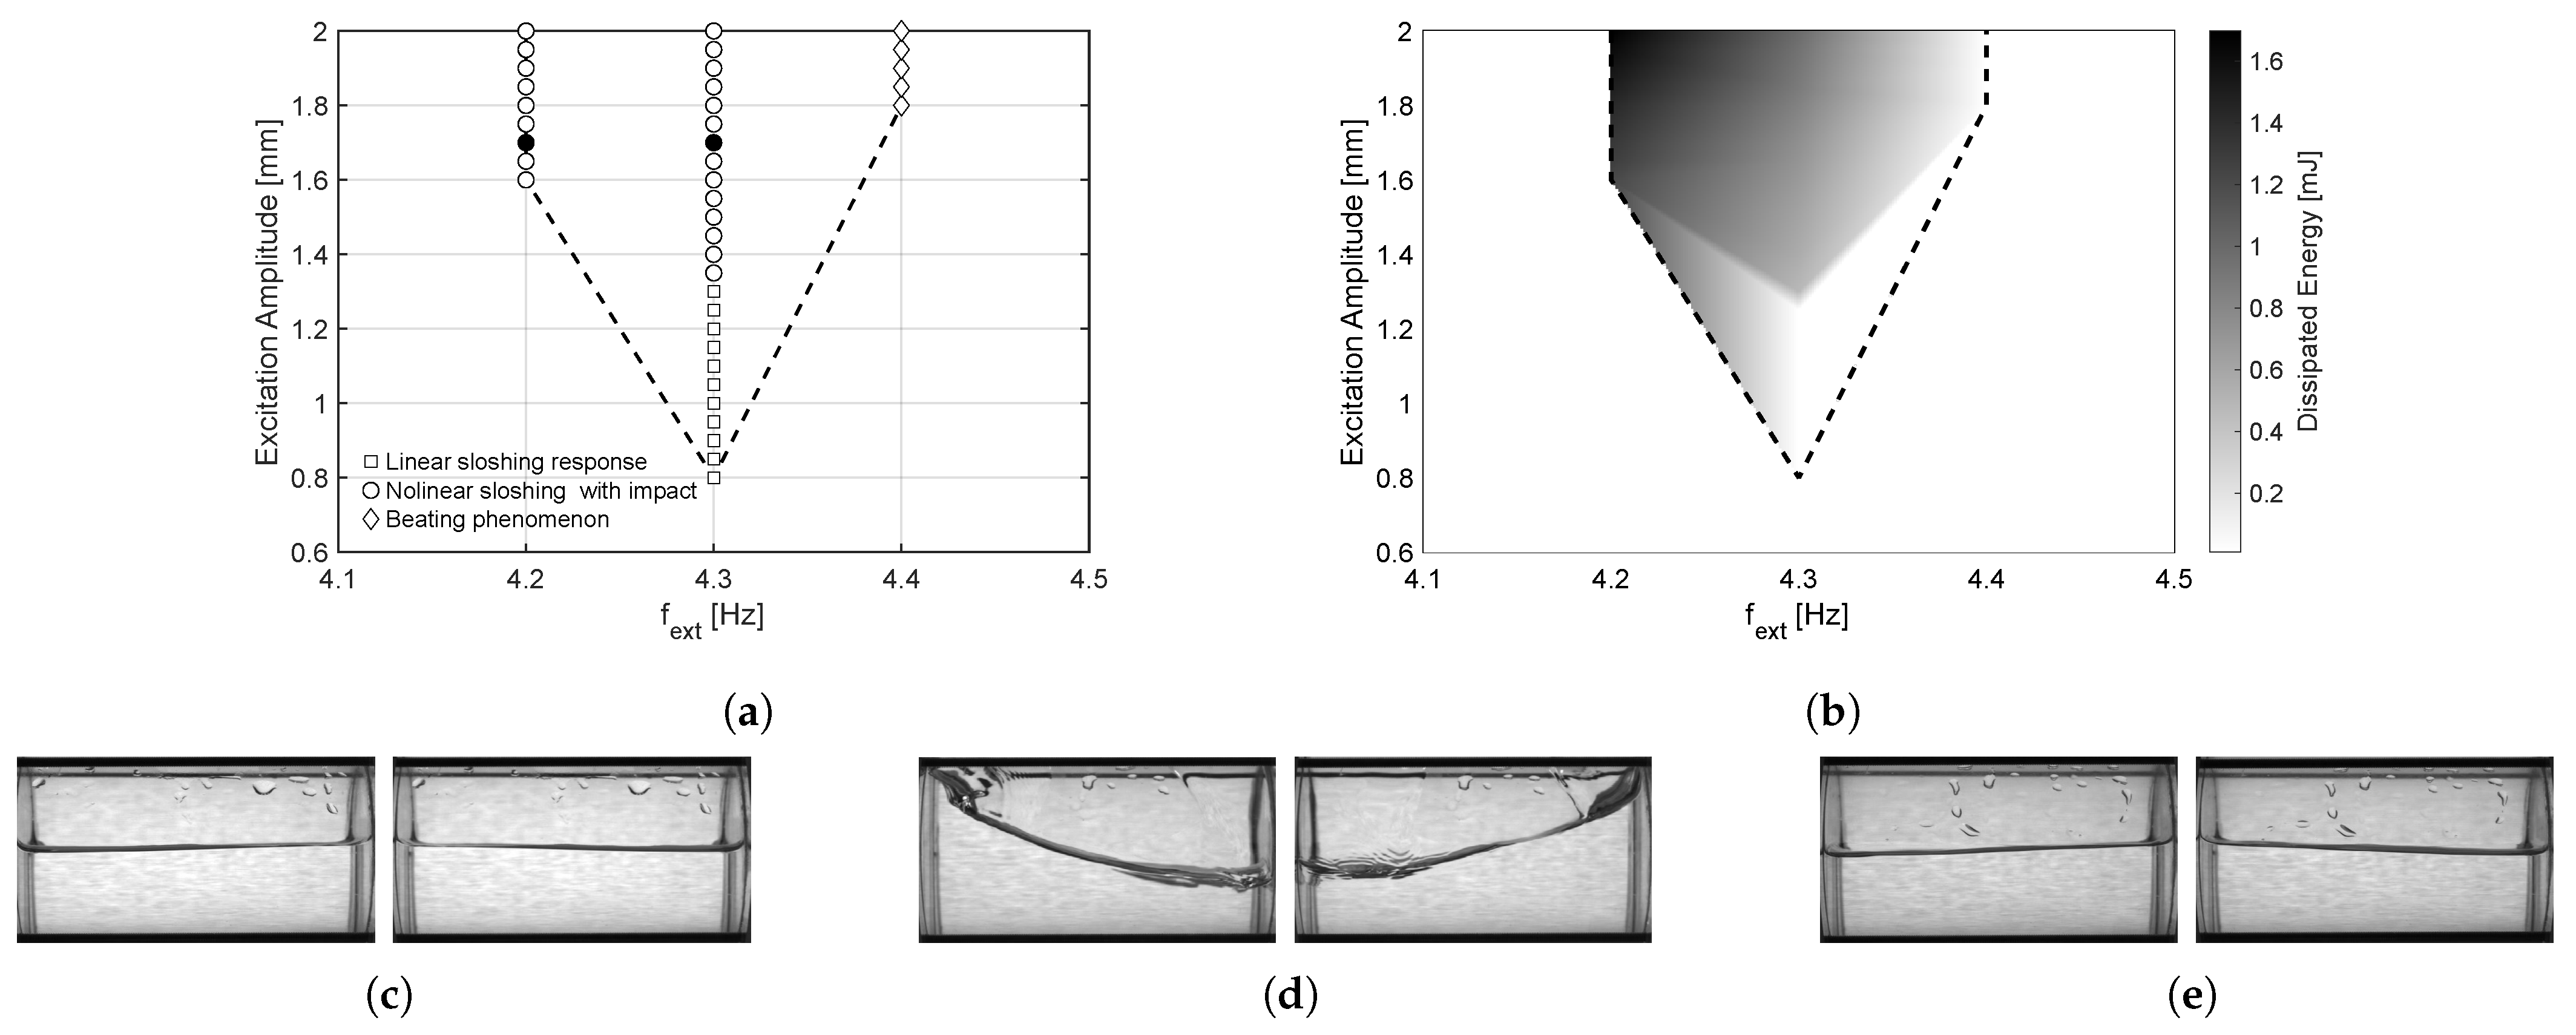
The visually identified sloshing regimes within the stability boundary of mode (1 0) are marked in Figure 3a, with representative snapshots shown as follows: (c) linear sloshing at 4.3 Hz for excitation amplitudes of 0.8–1.3 mm; (d) nonlinear sloshing, characterised by large-amplitude free-surface motion resulting in impacts on the tank upper part, for amplitudes above 1.35 mm at 4.3 Hz (also observed at 4.2 Hz); and (e) beating for a slightly detuned excitation at 4.4 Hz.
Figure 3.
Experimentally observed sloshing regimes for mode (1 0). (a) Stability map for mode (1 0). (b) Dissipated energy associated with mode (1 0). (c) Linear sloshing regime: Hz, mm, g. (d) Nonlinear sloshing with impacts: Hz, mm, g. (e) Beating phenomenon: Hz, mm, g.
For a detailed analysis of the sloshing regimes of mode (1 0), two nonlinear cases are considered, namely 4.2 Hz and 4.3 Hz, both at an excitation amplitude of 1.7 mm, as indicated in Figure 3. Their comparison reveals that even a small change in excitation frequency can lead to a significant difference in dissipated energy.
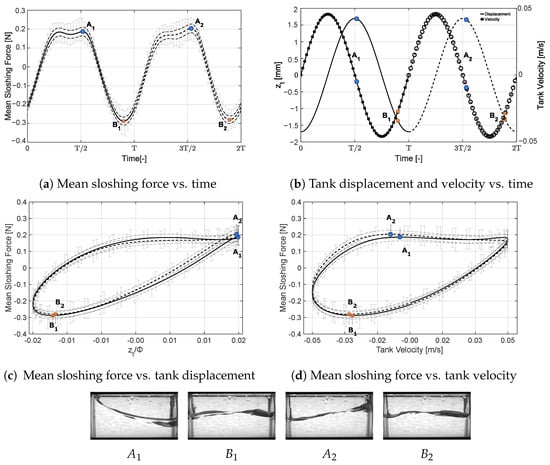
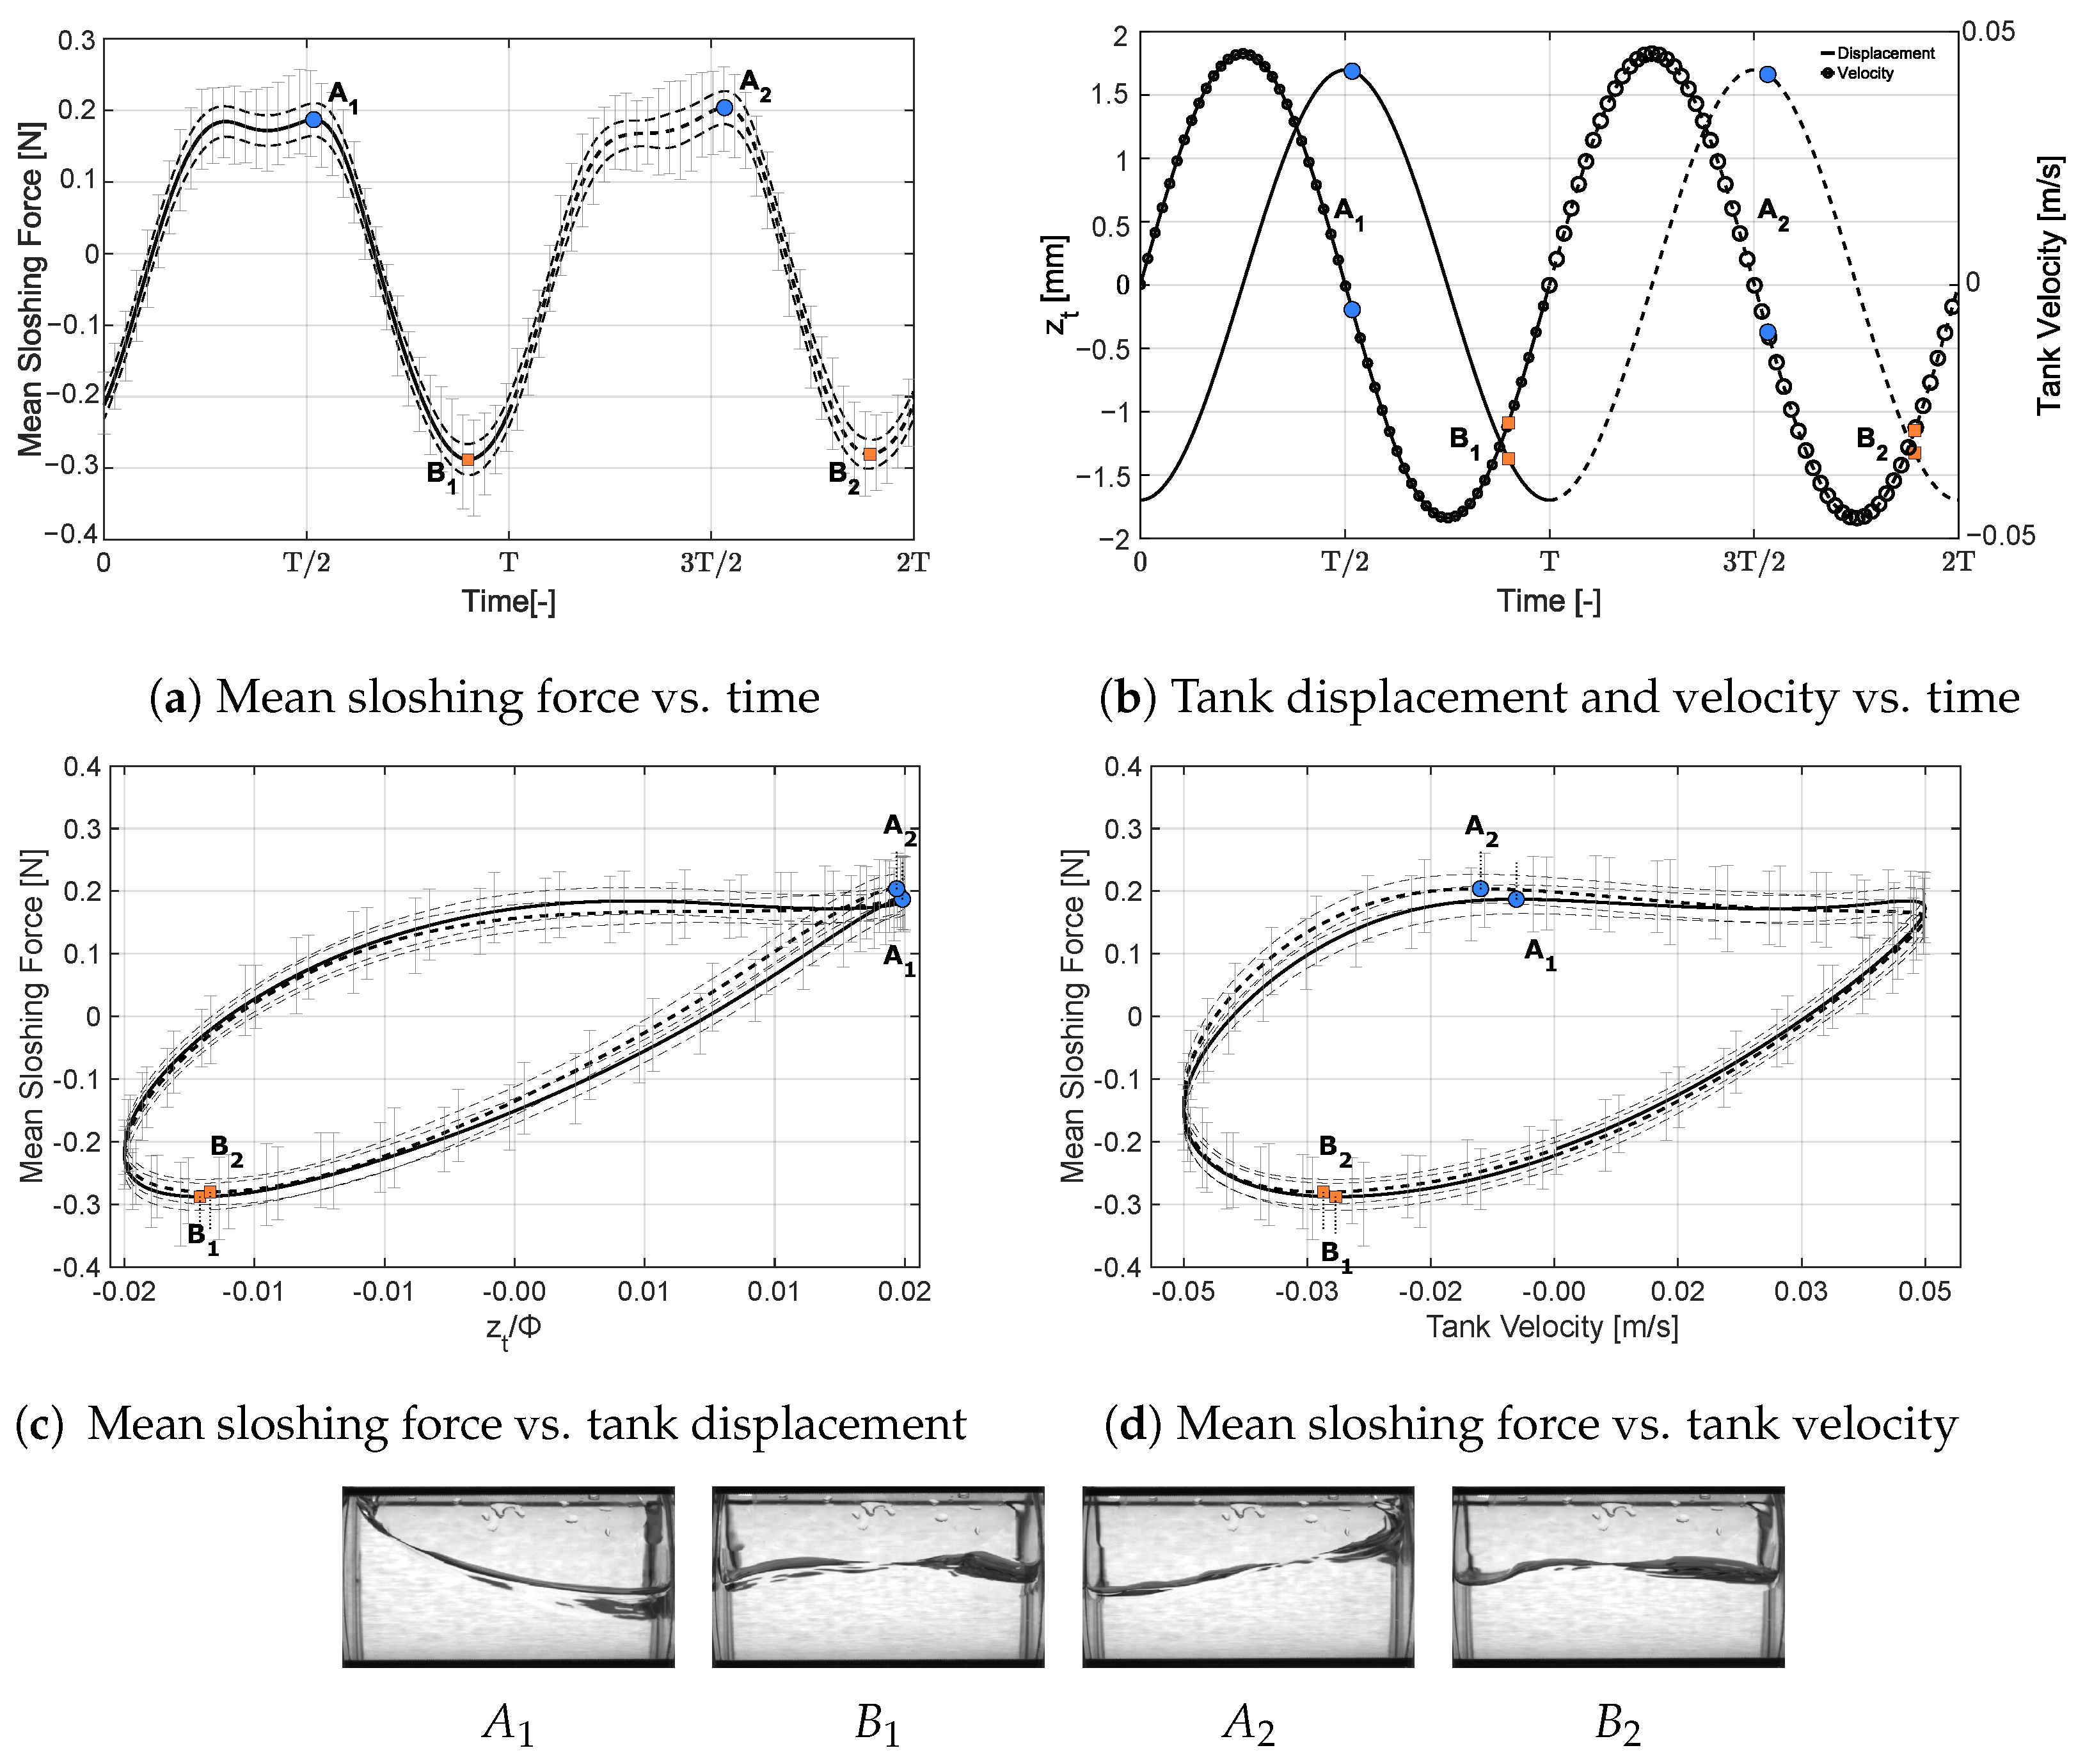
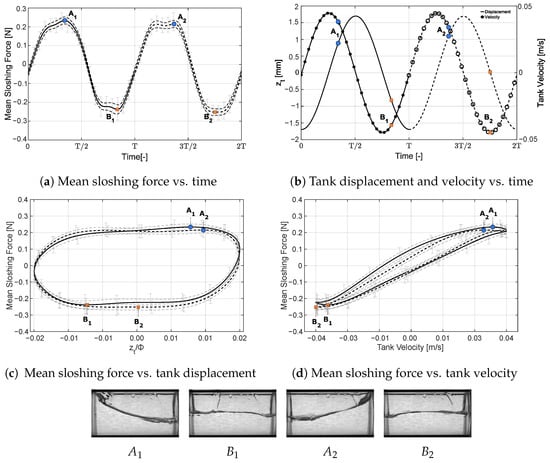
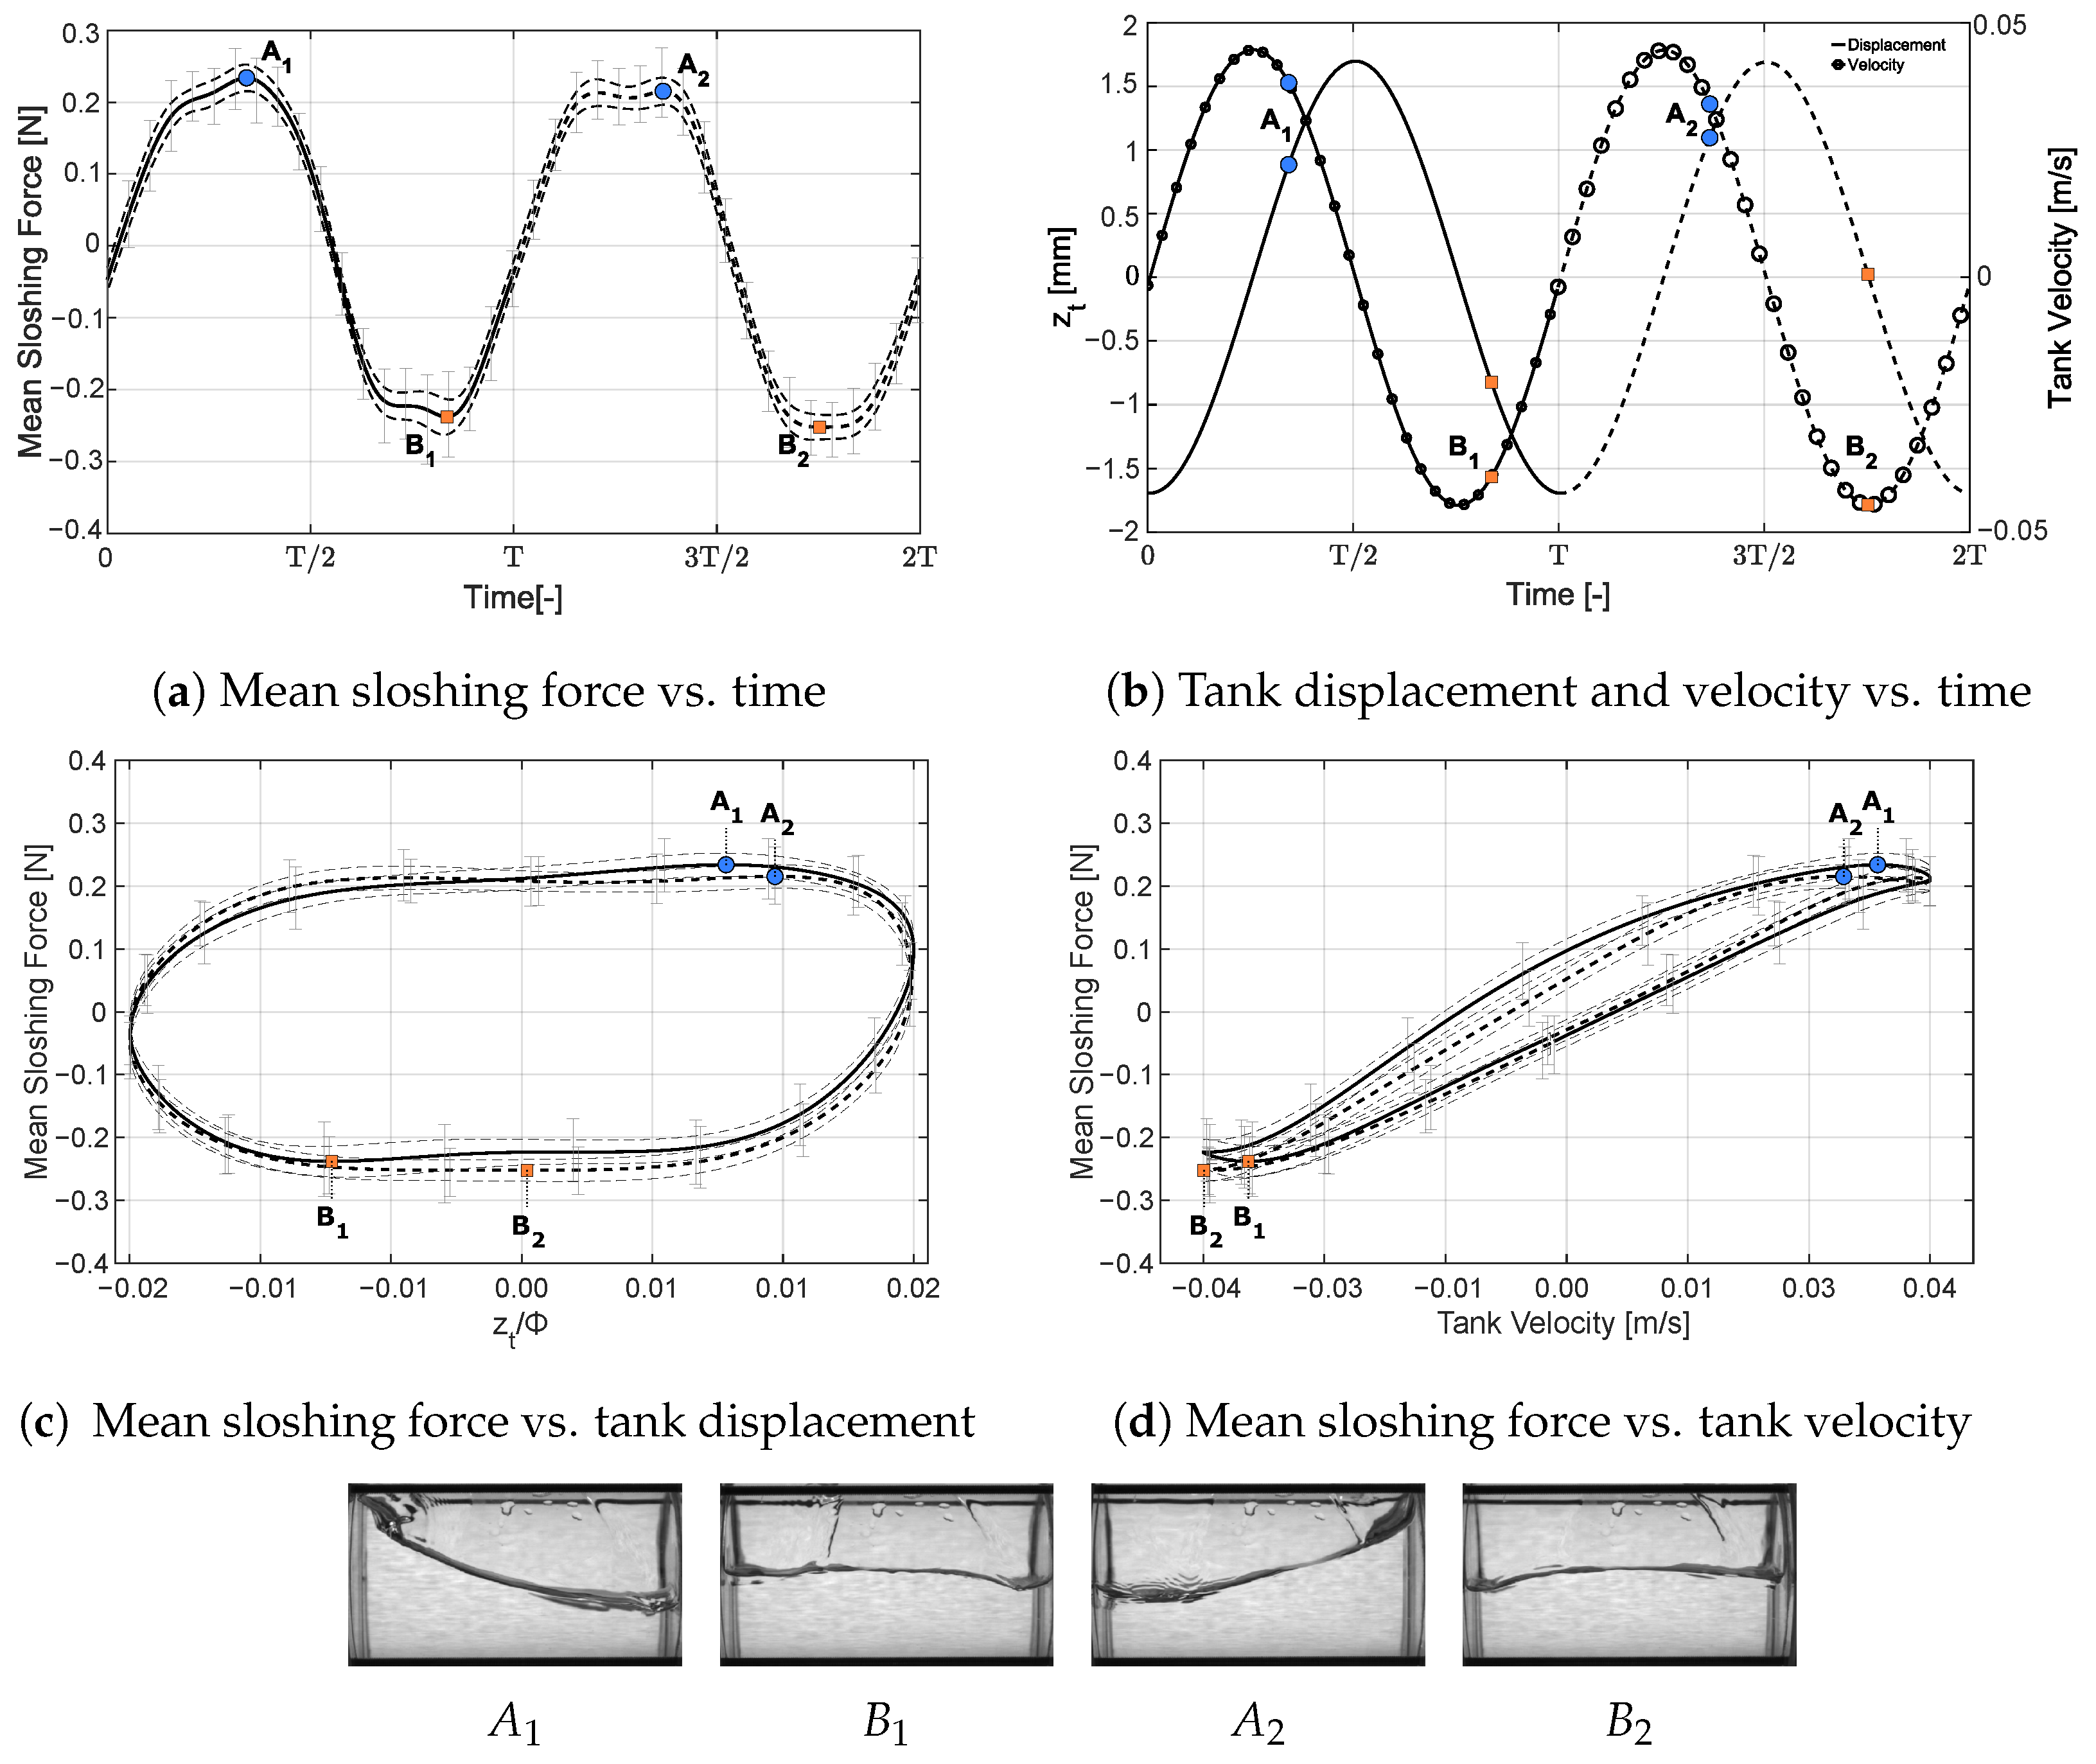
As described in the previous section, the sloshing force was first isolated to enable the analysis of energy dissipation. The mean sloshing force was then computed over all sloshing cycles in the steady-state regime. Its variation is presented in Figure 4 and Figure 5 for the 4.2 Hz and 4.3 Hz cases, respectively, where the mean values are plotted with error bars indicating the minimum and maximum across cycles, and thin dashed lines represent one standard deviation. In subfigure a, the force is plotted against the normalised time (with time scaled by the tank oscillation period); in subfigure c, it is shown against the excitation displacement, where the tank displacement () is normalised by the tank diameter (); and, in subfigure d, it is shown against the tank velocity. The identified peaks and troughs of the mean sloshing force are highlighted to correlate the free-surface dynamics with the tank displacement and velocity profiles shown in Figure 4b and Figure 5b. Points A1 and A2 denote the first and second mean sloshing maxima, while B1 and B2 indicate the minima, with representative snapshots shown for each point. The mean force rises during the first half-cycle to the initial impact (A1), remains elevated while the fluid contacts the upper wall, and then decreases to a minimum (B1) when the free surface is nearly horizontal, before increasing again to the second peak (A2) at the end of the subsequent impact. Similar behaviours were previously observed in rectangular tanks [13].
Figure 4.
Mean sloshing force, displacement, and velocity under an excitation frequency of 4.3 Hz and an amplitude of 1.7 mm.
Figure 5.
Mean sloshing force, displacement, and velocity under an excitation frequency of 4.2 Hz and an amplitude of 1.7 mm.
In order to obtain further insight into the dissipative behaviour in the chosen cases, the response is examined via the hysteresis loops in subfigures c and d. Subfigure c shows that the 4.2 Hz case encloses a markedly larger loop area than 4.3 Hz, indicating higher energy dissipation, consistent with the more intense impacts at 4.2 Hz. Moreover, Figure 5d exhibits a regime dominated by viscous damping, in contrast to Figure 4d, as the mean sloshing force is approximately proportional to the tank velocity. The energy dissipated by sloshing serves as an indicator for distinguishing and characterising different sloshing regimes. The dissipative behaviour of all frequency–amplitude combinations within the stability boundaries of mode (1 0) was quantified from the areas of the corresponding hysteresis loops and interpolated linearly, yielding the dissipation map in Figure 3b, where dashed lines denote visually identified stability limits. The map shows a marked increase in dissipated energy at an excitation amplitude of about 1.35 mm for 4.3 Hz (onset of free-surface impacts), relatively low dissipation at 4.4 Hz (milder motion), and even higher dissipation at 4.2 Hz for comparable amplitudes, indicative of a more nonlinear, strongly dissipative regime associated with more violent liquid–structure interactions [11,13,15].
4. Conclusions
This experimental study considered the design of a test rig and the associated methodology to characterise and analyse sloshing regimes in a half-filled, small-scale horizontal cylindrical tank under isothermal conditions, using water as a replacement fluid for LH2. The objectives were to map the sloshing stability boundaries and to analyse the associated regimes via dissipated energy. At this stage, parameters such as the tank geometry and dimensions were not considered. Non-isothermal effects were also neglected, since, under the excitation conditions examined, the fluid response was governed primarily by inertial and gravitational forces.
Under vertical sinusoidal excitation (4–10 Hz), the stability boundaries were mapped and ten sloshing modes were visually identified. The measured natural frequencies agreed well with the literature predictions, with the equivalent rectangle method giving the smallest errors. The remaining discrepancies are mainly due to surface tension effects at a small scale. As mode (1 0) involves the largest moving liquid mass, it was examined in detail. Dissipated energy from hysteresis loops was used to quantify the sloshing nonlinearity and intensity, revealing sharp increases at the onset of upper-wall impacts and strong sensitivity to small frequency changes at fixed excitation amplitudes. These results connect the force–displacement and force–velocity responses to the free-surface dynamics and provide practical indicators of intense liquid–structure interaction and enhanced damping.
Future work will focus on the second stage of the experimental investigation, namely a non-isothermal campaign employing a biphasic water–water vapour system to replicate the thermal stratification characteristic of LH2, with the aim of quantifying the sloshing-induced pressure drop across the different sloshing regimes that were identified in the stability diagram for mode (1 0).
Author Contributions
Conceptualisation, F.F. and L.C.; methodology, F.F.; validation, F.F., L.C., M.C., P.-V.R. and A.Ș.; formal analysis, F.F. and L.C.; investigation, F.F.; data curation, F.F., L.C. and M.C.; writing—original draft preparation, F.F.; writing—review and editing, L.C. and M.C.; project administration, L.C. All authors have read and agreed to the published version of the manuscript.
Funding
The research leading to these results was undertaken as part of the HASTA project, which has received funding from the European Union under grant agreement No. 101138003. The views and opinions expressed are, however, those of the authors only and do not necessarily reflect those of the European Union or the European Climate, Infrastructure, and Environment Executive Agency. Neither the European Union nor the granting authority can be held responsible for them.
Institutional Review Board Statement
Not applicable.
Informed Consent Statement
Not applicable.
Data Availability Statement
Data can be made available upon request.
Conflicts of Interest
The authors declare no conflicts of interest.
References
- Stautner, E.W.; Haran, K.S.; Ansell, P.J.; Minas, C. Aircraft Cryogenics, 1st ed.; Springer Nature: Cham, Switzerland, 2024; pp. 12–13. [Google Scholar]
- Ludwig, C.; Dreyer, M.E.; Hopfinger, E.J. Pressure variations in a cryogenic liquid storage tank subjected to periodic excitations. Int. J. Heat Mass Transfer 2013, 6, 223–234. [Google Scholar] [CrossRef] [Scilit]
- European Union Aviation Safety Agency. Certification Specifications and Acceptable Means of Compliance for Large Aeroplanes (CS-25); Amendment 28; European Union Aviation Safety Agency: Cologne, Germany, 2023; Available online: https://www.easa.europa.eu/en/document-library/certification-specifications/cs-25-amendment-28 (accessed on 13 October 2025).
- Das, S.P.; Hopfinger, E.J. Mass transfer enhancement by gravity waves at a liquid–vapour interface. Int. J. Heat Mass Transf. 2009, 52, 1400–1411. [Google Scholar] [CrossRef] [Scilit]
- Ibrahim, R.A. Liquid Sloshing Dynamics: Theory and Applications; Cambridge University Press United States of America: Cambridge, MA, USA, 2005; pp. 20–74, 338–350. [Google Scholar]
- Platyrrachos, M.A.; Karamanos, S.A. Finite Element Analysis of Sloshing in Horizontal-Cylindrical Industrial Vessels Under Earthquake Loading. Am. Soc. Mech. Eng. Press. Vessel. Pip. Div. 2005, 8, 63–73. [Google Scholar] [CrossRef] [Scilit]
- Hasheminejad, S.M.; Soleimani, H. An analytical solution for free liquid sloshing in a finite-length horizontal cylindrical container filled to an arbitrary depth. Appl. Math. Model. 2017, 48, 338–352. [Google Scholar] [CrossRef] [Scilit]
- Han, Y.; Zhu, X.; Li, T.; Guo, W.; Pan, L. A semi-analytical study of the three-dimensional liquid sloshing in a horizontal cylindrical tank with an arbitrary liquid depth. Ocean Eng. 2021, 238, 109722. [Google Scholar] [CrossRef] [Scilit]
- Ahizi, S.; Marques, P.A.; Monteiro, F.M.; Gonzalez, L.M.; Gambioli, F.; Scheufleur, H.; Abarca, R.; Mendez, M.A. Scaling laws for experimental characterization of sloshing effect in liquid hydrogen tanks. In Proceedings of the The 34th International Ocean and Polar Engineering Conference, Rhodes, Greece, 16 June 2024. [Google Scholar]
- Kobayashi, N.; Mieda, T.; Shibata, H.; Shinozaki, Y. A Study of the Liquid Slosh Response in Horizontal Cylindrical Tanks. J. Press. Vessel Technol. 1989, 111, 32–38. [Google Scholar] [CrossRef] [Scilit]
- Constantin, L.; De Courcy, J.; Titurus, B.; Rendall, T.C.S.; Cooper, J.E. Analysis of damping from vertical sloshing in a SDOF system. Mech. Syst. Signal Process. 2021, 152, 107452. [Google Scholar] [CrossRef] [Scilit]
- Martinez-Carrascal, J.; González-Gutiérrez, L.M. Experimental study of the liquid damping effects on a SDOF vertical sloshing tank. J. Fluids Struct. 2021, 100, 103172. [Google Scholar] [CrossRef] [Scilit]
- Constantin, L.; De Courcy, J.; Titurus, B.; Rendall, T.C.S.; Cooper, J.E. Sloshing induced damping across Froude numbers in a harmonically vertically excited system. J. Sound Vib. 2021, 510, 116302. [Google Scholar] [CrossRef] [Scilit]
- Benjamin, T.B.; Ursell, F. The stability of the plane free surface of a liquid in vertical periodic motion. Proc. R. Soc. Lond. A Math. Phys. Sci. 1954, 225, 505–515. [Google Scholar] [CrossRef] [Scilit]
- Constantin, L.; De Courcy, J.; Titurus, B.; Rendall, T.C.S.; Cooper, J.E. Nonlinear damping effects in vertically vibrating systems with violently sloshing liquid. J. Sound Vib. 2023, 544, 117405. [Google Scholar] [CrossRef] [Scilit]

Disclaimer/Publisher’s Note: The statements, opinions and data contained in all publications are solely those of the individual author(s) and contributor(s) and not of MDPI and/or the editor(s). MDPI and/or the editor(s) disclaim responsibility for any injury to people or property resulting from any ideas, methods, instructions or products referred to in the content. |
© 2026 by the authors. Licensee MDPI, Basel, Switzerland. This article is an open access article distributed under the terms and conditions of the Creative Commons Attribution (CC BY) license.