1. Introduction
The growing diffusion of Advanced Driver Assistance Systems (ADAS) plays a crucial role in enhancing road safety and supporting the long-term objectives of Vision Zero, a strategy introduced in Sweden in the late 1990s and now adopted worldwide, which aims to eliminate fatalities and serious injuries from road traffic through safer vehicles, infrastructures, and driving behaviors [
1,
2]. In recent years, both academia and industry have devoted significant attention to the definition of Key Performance Indicators (KPIs) for the evaluation of ADAS performance. Most of the existing contributions, however, concentrate on steady-state metrics such as lateral offset, lateral oscillations, or stability margins, often developed within the framework of regulatory requirements such as UNECE R79, the United Nations regulation that defines uniform provisions for steering equipment, including Automatically Commandend Steering Function (ACSF), commonly known as Lane Centering (LC) systems, and Corrective Steering Function (CSF), commonly known as Lane Keeping Assist (LKA) systems [
3,
4,
5]. While these indicators are essential for compliance and safety validation, they provide limited insight into how automated systems behave in transient maneuvers and how closely such behavior resembles that of human drivers, particularly with respect to comfort and acceptance.
In previous work, a KPI-based methodology was proposed to assess ADAS lane centering performance under steady-state conditions [
6]. The approach was validated across a virtual simulation environment and hardware-in-the-loop (HiL) platforms, showing its effectiveness in reducing development time and cost while supporting early-stage validation. Nevertheless, the analysis was restricted to straight-road scenarios, without the inclusion of a human driving reference and without addressing dynamic transitions, thus limiting its applicability to more realistic driving conditions. In this sense, the present work can be seen as a natural extension of the previous study, further advancing it by focusing on crucial aspects such as the ability to accurately capture system behavior during transient maneuvers, as well as emphasizing driver comfort and user experience. Both features represent key enablers for fostering wider adoption of these systems.
The present study extends this methodology by introducing a new set of KPIs specifically tailored for transient maneuvers. These include the Aggressiveness Index, the Smoothness Index, and the Satisfaction Index, designed to capture the dynamic response of the ADAS and benchmark it against human driver behavior. The motivation is to evaluate not only the technical stability of the system, but also its ability to reproduce natural, human-like control actions. From a human-centered perspective, there is a clear need for ADAS to evolve beyond simple regulatory compliance and technical robustness, towards design solutions that consider comfort, user acceptance, and alignment with driver expectations. In the literature and state of the art, strong attention is often given to driver subjectivity; however, maneuver evaluation is generally performed at an overall level through subjective questionnaires (QP), without a detailed and objective analysis of specific control actions [
7,
8]. To address this gap, we propose the definition of targeted Key Performance Indicators (KPIs) capable of objectively characterizing the behavior of specific transient maneuvers. These indicators enable the translation of the human’s subjective desired behavior into technical metrics, making it possible to develop and calibrate control systems that can not only reproduce human behavior in a natural and consistent way, but also achieve a superior performance while remaining aligned with the driver’s expectations and sensations.
2. Methodology, Application, and Environment
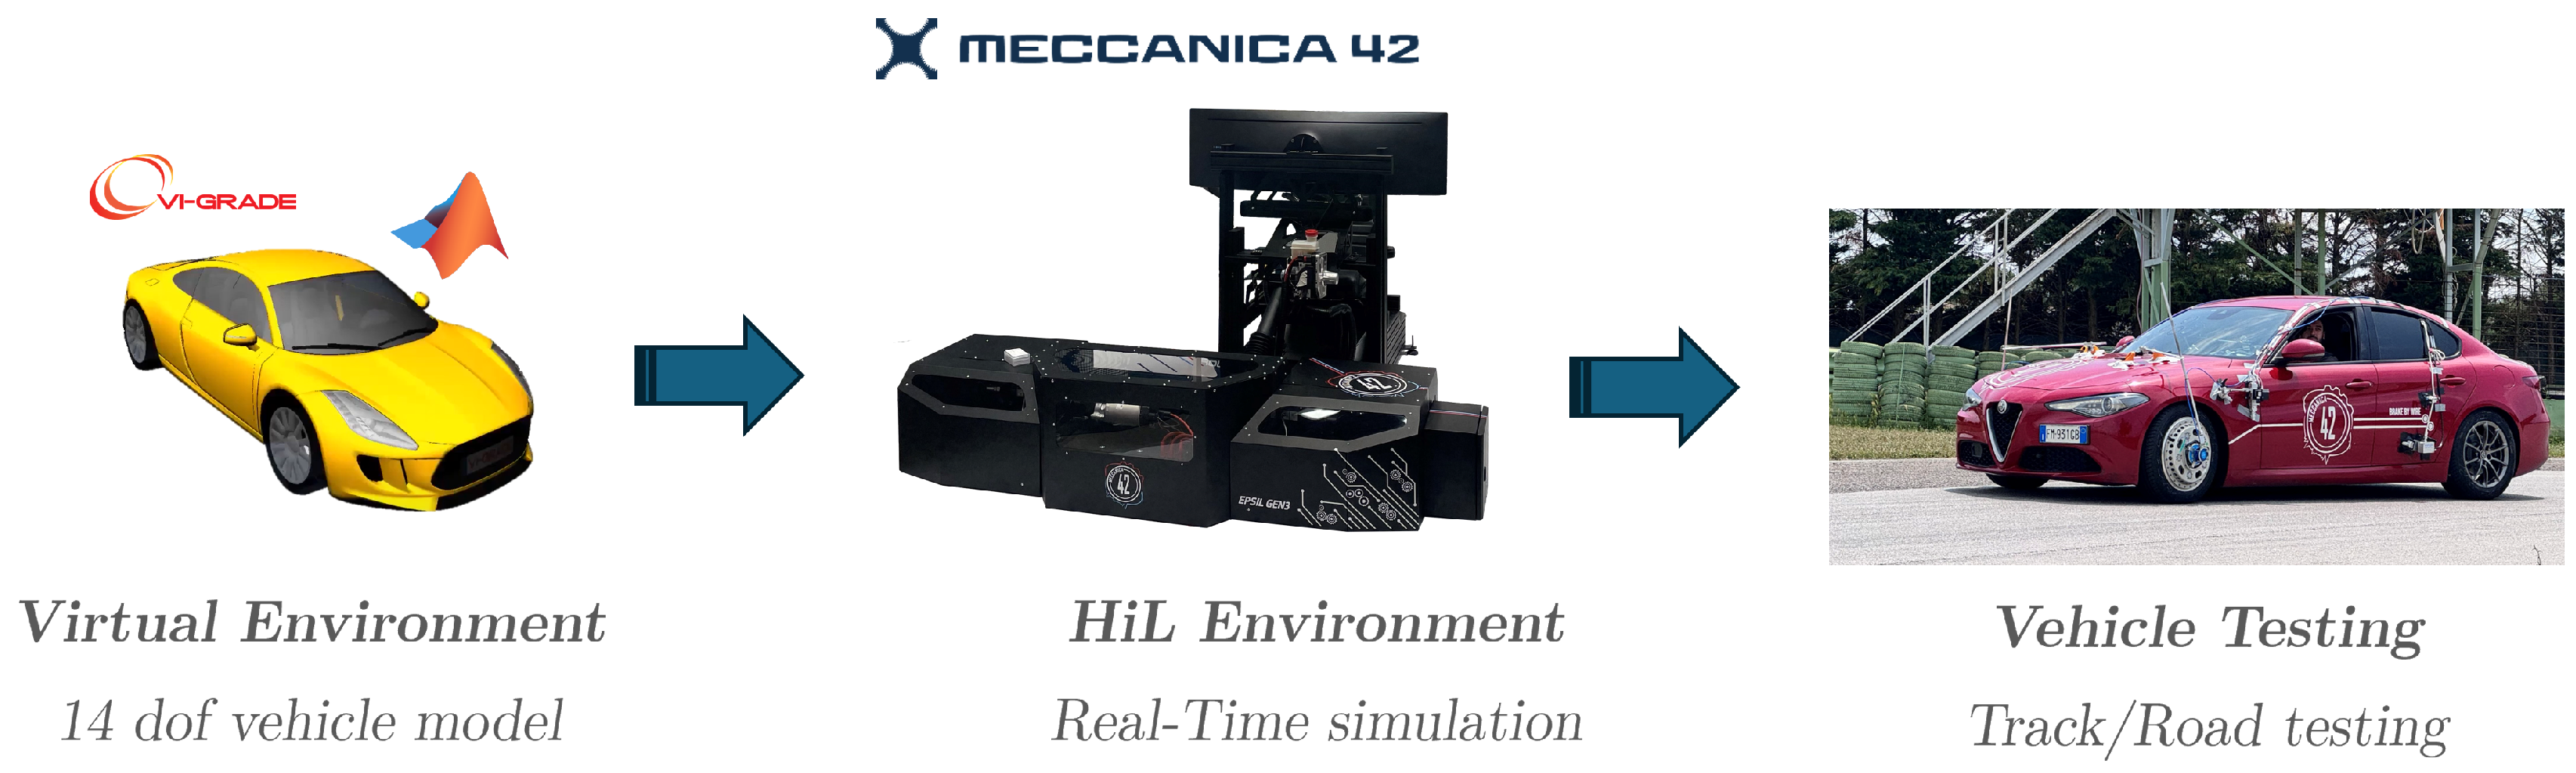
The development of an ADAS typically follows three main stages, as shown in
Figure 1.
Virtual Environment: Offline development within a simulated environment.
HiL Environment: Testing in a more advanced simulation setup, including static and dynamic simulators as well as Hardware-in-the-Loop (HiL) environments.
Vehicle Testing: Validation through road and track testing.
The application environment for this new methodology is primarily located in a HiL environment, where static or dynamic simulators with HiL configurations are employed. This stage is particularly valuable in the early steps of development, as it allows designers to exploit human perception in the loop. Compared to purely virtual simulations, HiL setups increase the level of ‘reality’ of the tests, while still being safer and faster than conducting experiments directly on the road. The environment referred to here is represented in the central section of
Figure 1.
The proposed methodology thus acts as a bridge between the initial and final phases, primarily because the Key Performance Indicators (KPIs) are developed and validated within the HiL environment, which itself represents an intermediate stage connecting early design with later road validation. Thanks to this foundation, the KPIs are structured to be applicable across all phases of development, providing a consistent reference throughout the entire workflow. By integrating metrics that also account for user perception, these indicators can be extended even to the stages that precede real-world driving, ensuring that human-centered aspects are considered from the very beginning. This approach not only simplifies the overall development process but also improves the quality of outcomes, as systems evolve in parallel with both technical requirements and human expectations. The ultimate goal is to influence system performance and behavior from the outset, using human performance as a reference benchmark. Since this benchmark reflects the subjectivity of final users, it makes the system more human-friendly and increases its likelihood of widespread adoption.
3. L2/L3 ADAS Model
In order to effectively exploit human perception during the evaluation of ADAS, it is essential that the model of the ADAS can run in real time within the simulator. To achieve this, the ADAS model was refined and improved with respect to the one presented in a previous work, where the system was developed across multiple environments: one dedicated to modeling a virtual camera for lane detection, and another focused on the control system itself [
6].
A key aspect of this improved model is its ability to handle transient and dynamic maneuvers, which are crucial for capturing realistic driving scenarios. This work therefore proposes a methodology based on Key Performance Indicators (KPIs) that can be used to identify and continuously monitor both the performance and behavior of the system throughout development.
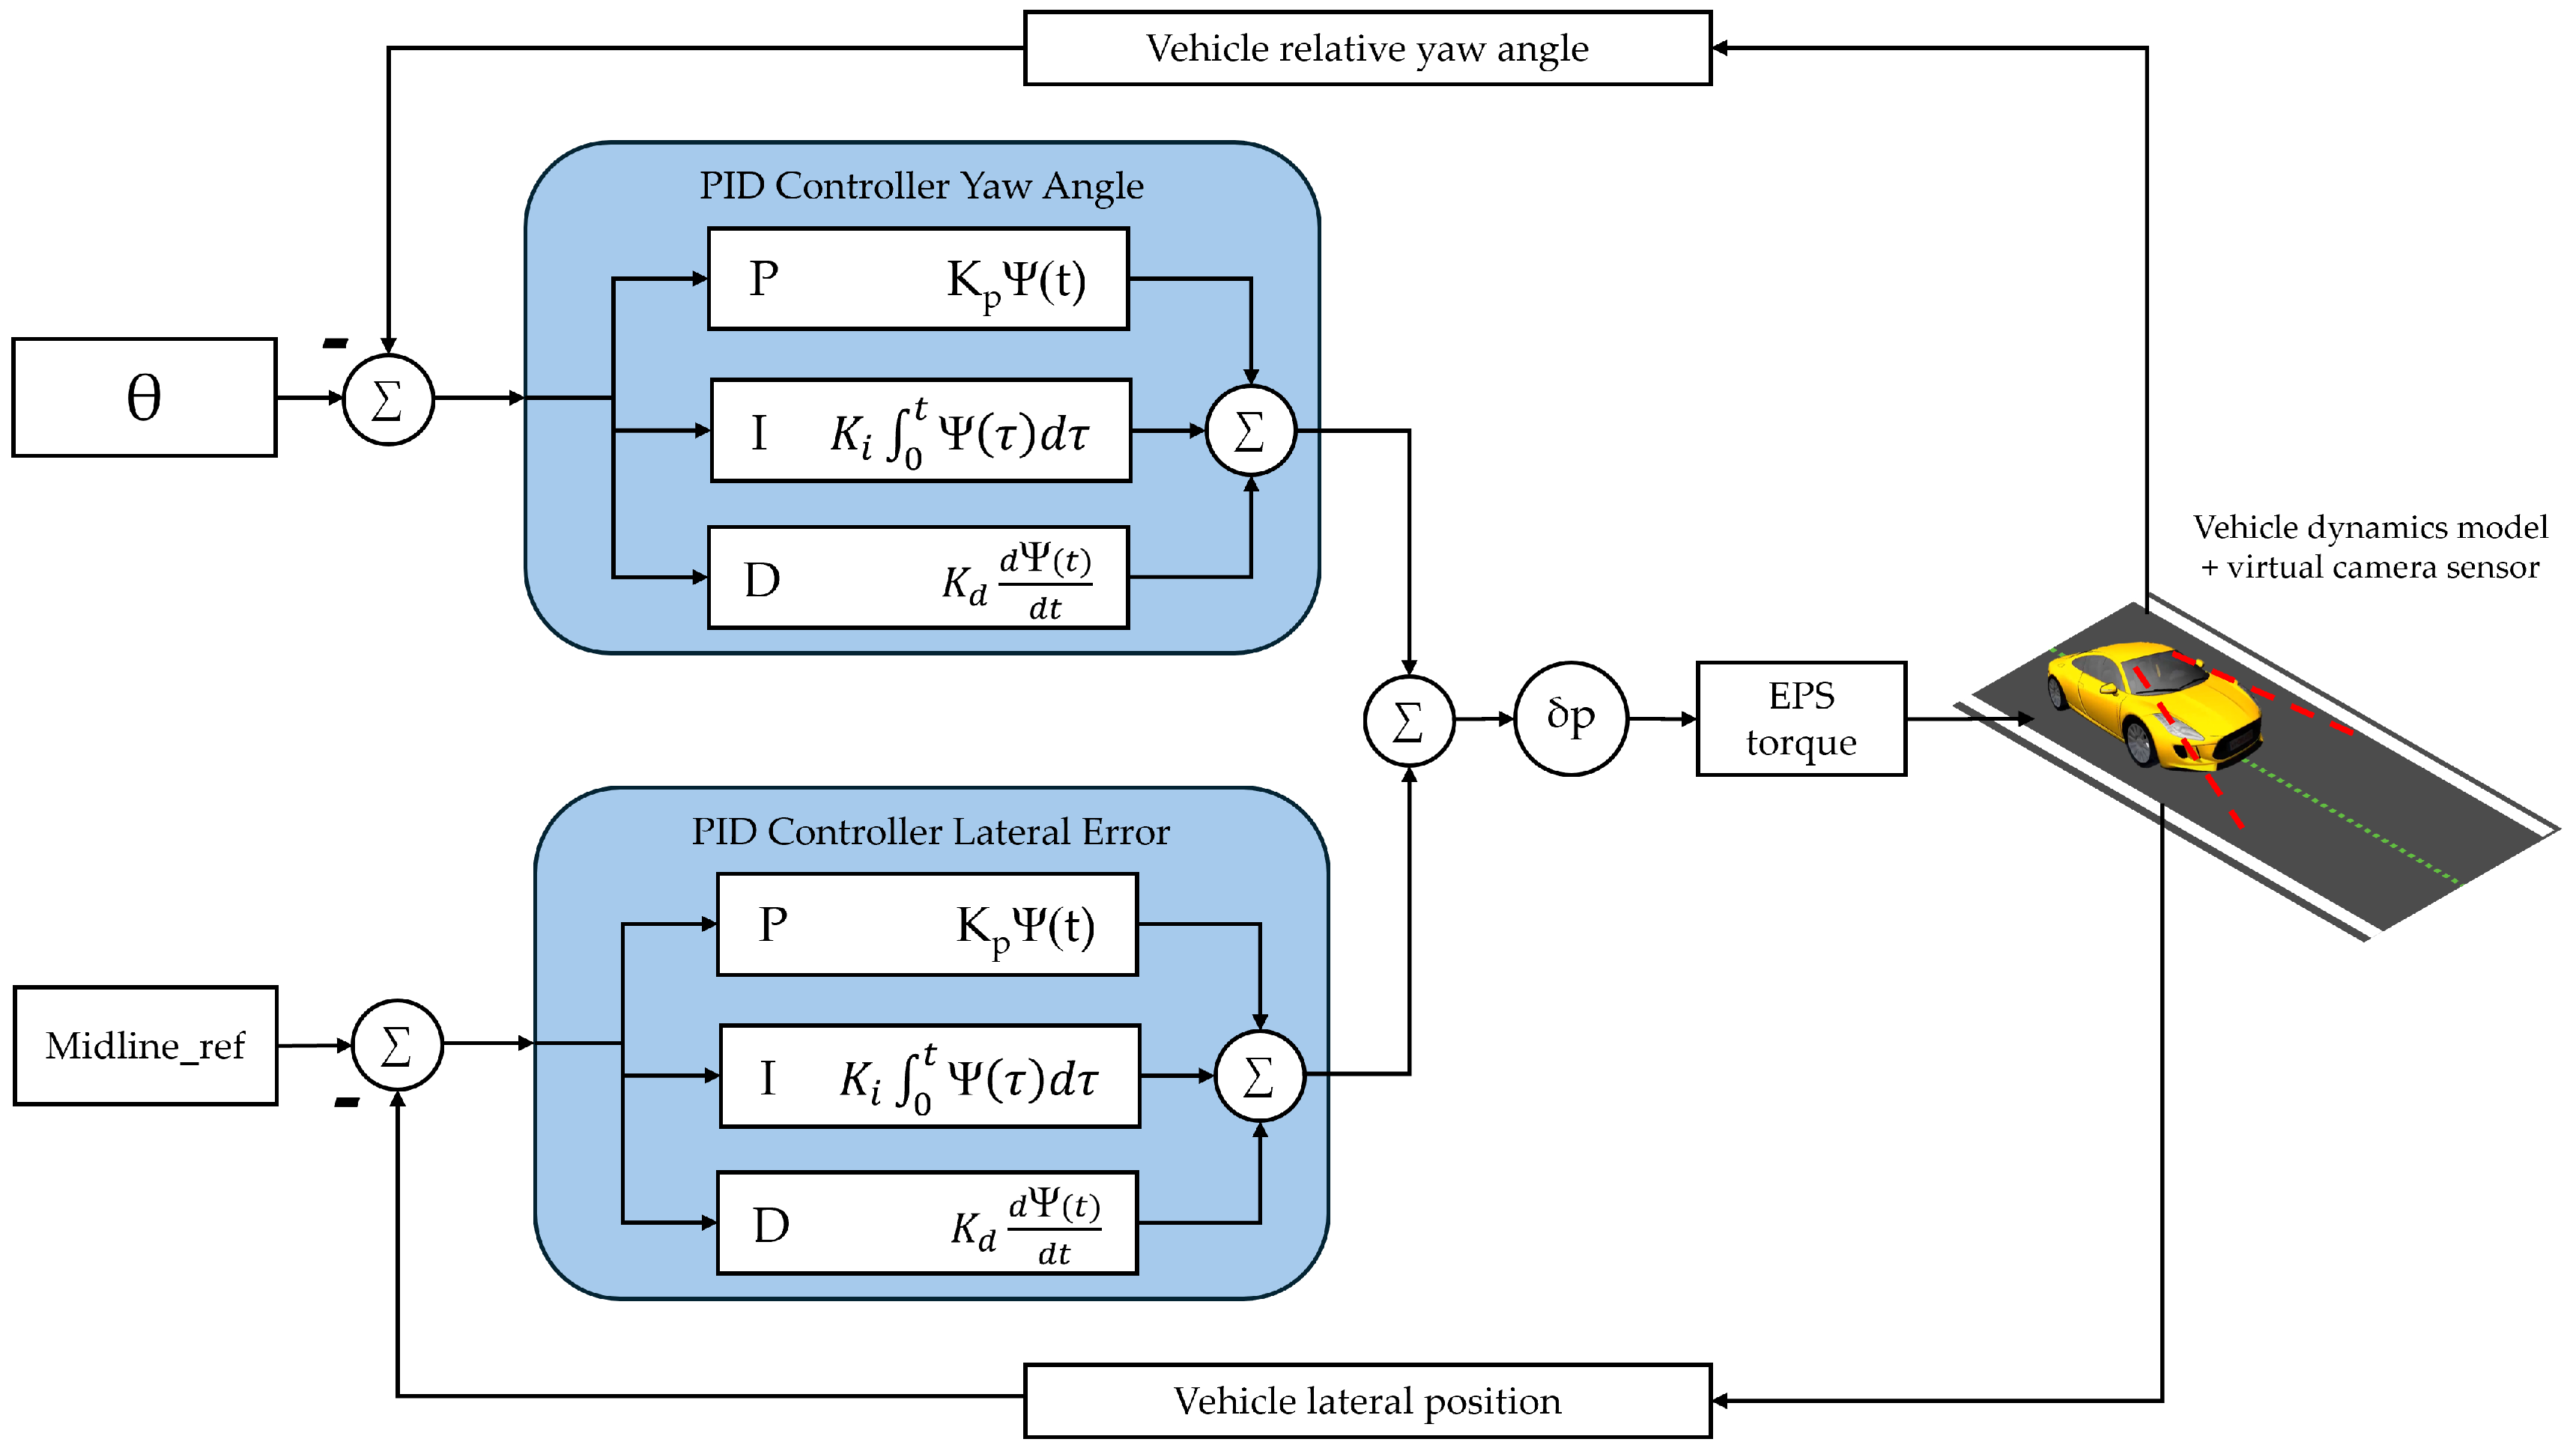
Beyond the traditional metric of lane deviation error, now the model integrates a control loop on the yaw rate, as shown in
Figure 2, which ensures not only that the vehicle remains centered within the lane, but also that it stays properly aligned along the intended trajectory. This dual-layer control enhances stability and realism, especially under demanding dynamic conditions.
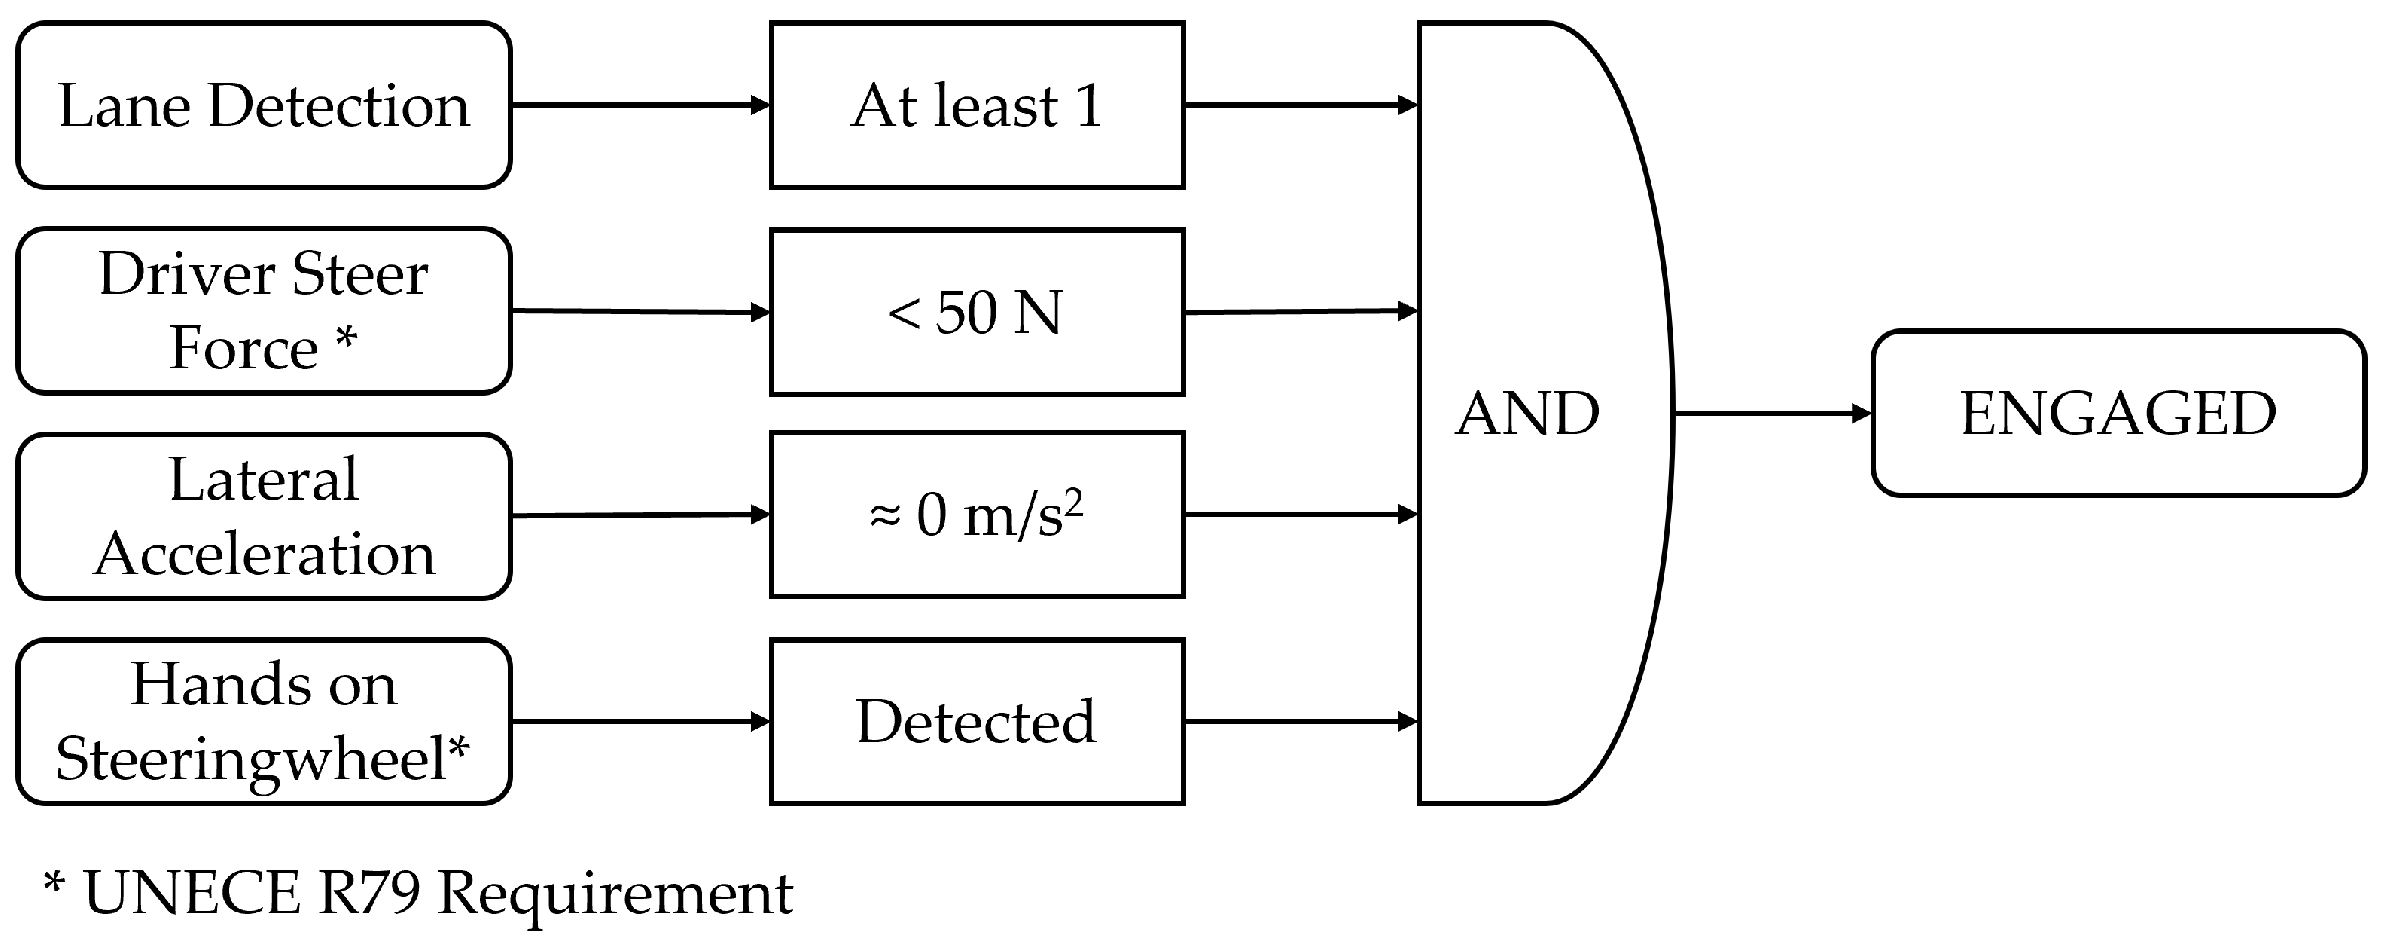
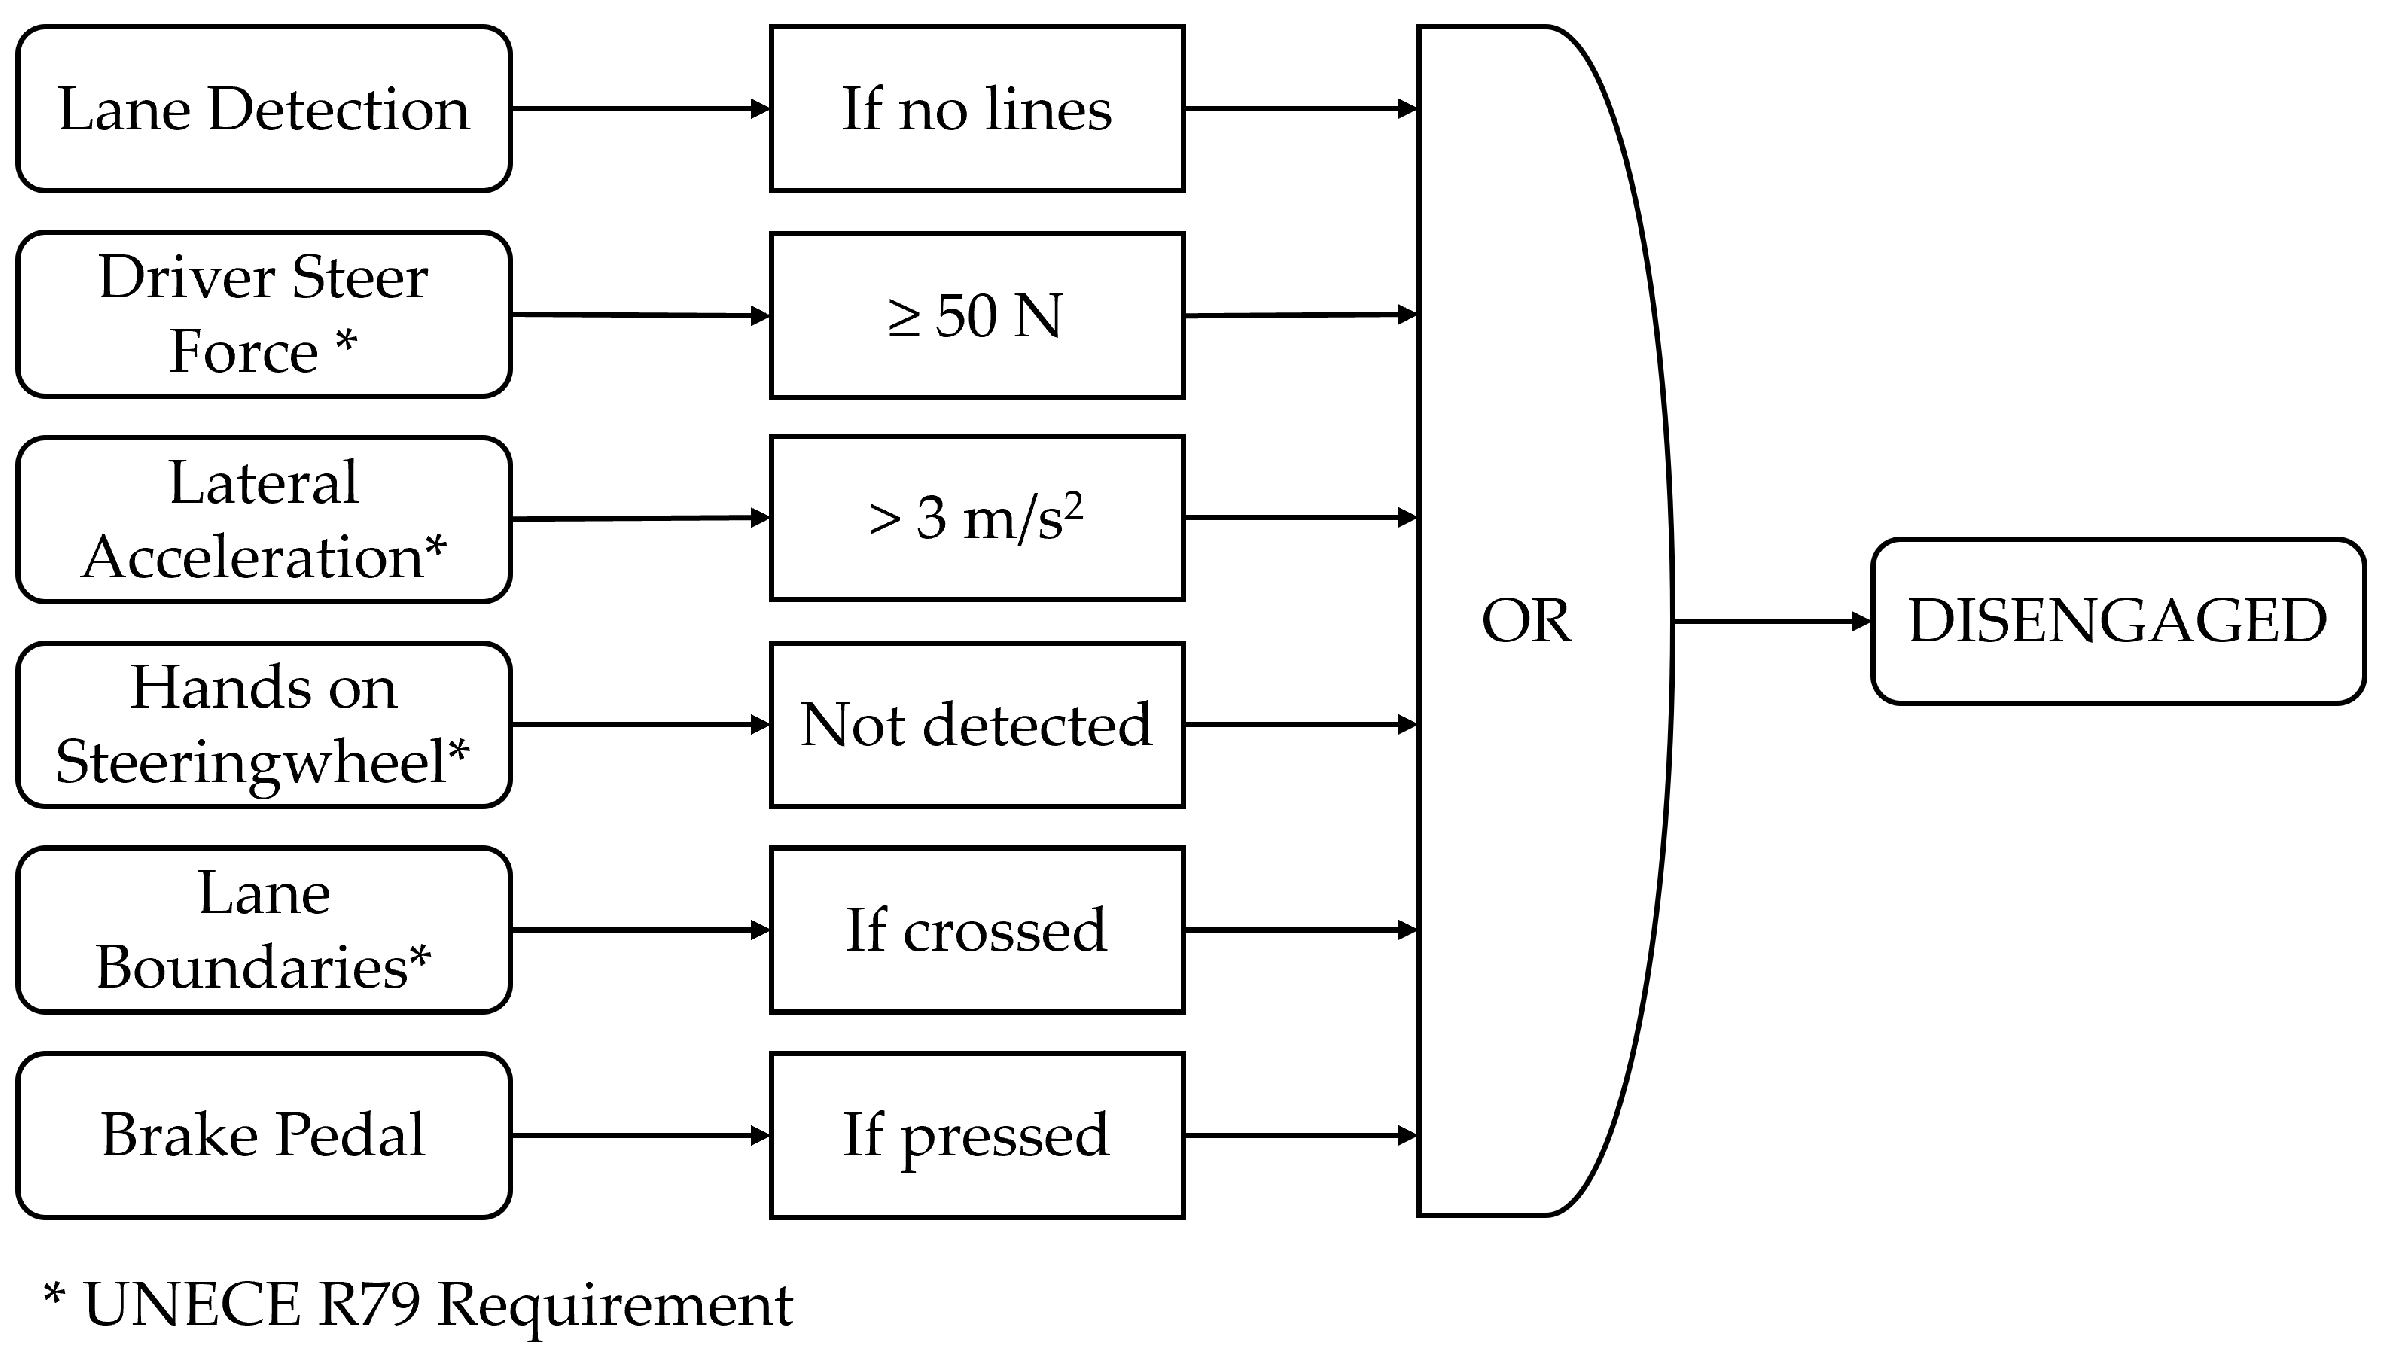
To further increase the immersive quality of the simulation for the driver, additional features have been implemented. While these do not directly affect the lane-keeping capability, they play a fundamental role in improving realism and are also aligned with UNECE R79 homologation requirements. Among these, the most relevant are the conditions for system engagement and disengagement, which are summarized in
Figure 3 and in
Figure 4.
This combination of real-time modeling, KPI-based evaluation, and enhanced simulation realism provides a comprehensive framework for assessing ADAS performance in a way that is both technically robust and closely aligned with human perception.
4. Testing Framework for Transient Maneuvers
To evaluate the ADAS under genuinely transient conditions, the system’s operating envelope from UNECE R79 is first defined. The regulation specifies speeds and lateral-acceleration limits and ranges for homologation, see
Table 1. In this work, those limits are treated as hard boundaries for both scenario design and acceptance. UNECE R79 regulation also prescribes two homologation tests:
However, these procedures primarily assess behavior over the entire curve using point KPIs—notably peak lateral acceleration and peak lateral jerk. While necessary, such metrics are insufficient for an in-depth assessment of transient performance. A system may satisfy these limits yet still exhibit overshoot, oscillations, or lateral deviation that degrade user comfort and discourage adoption.
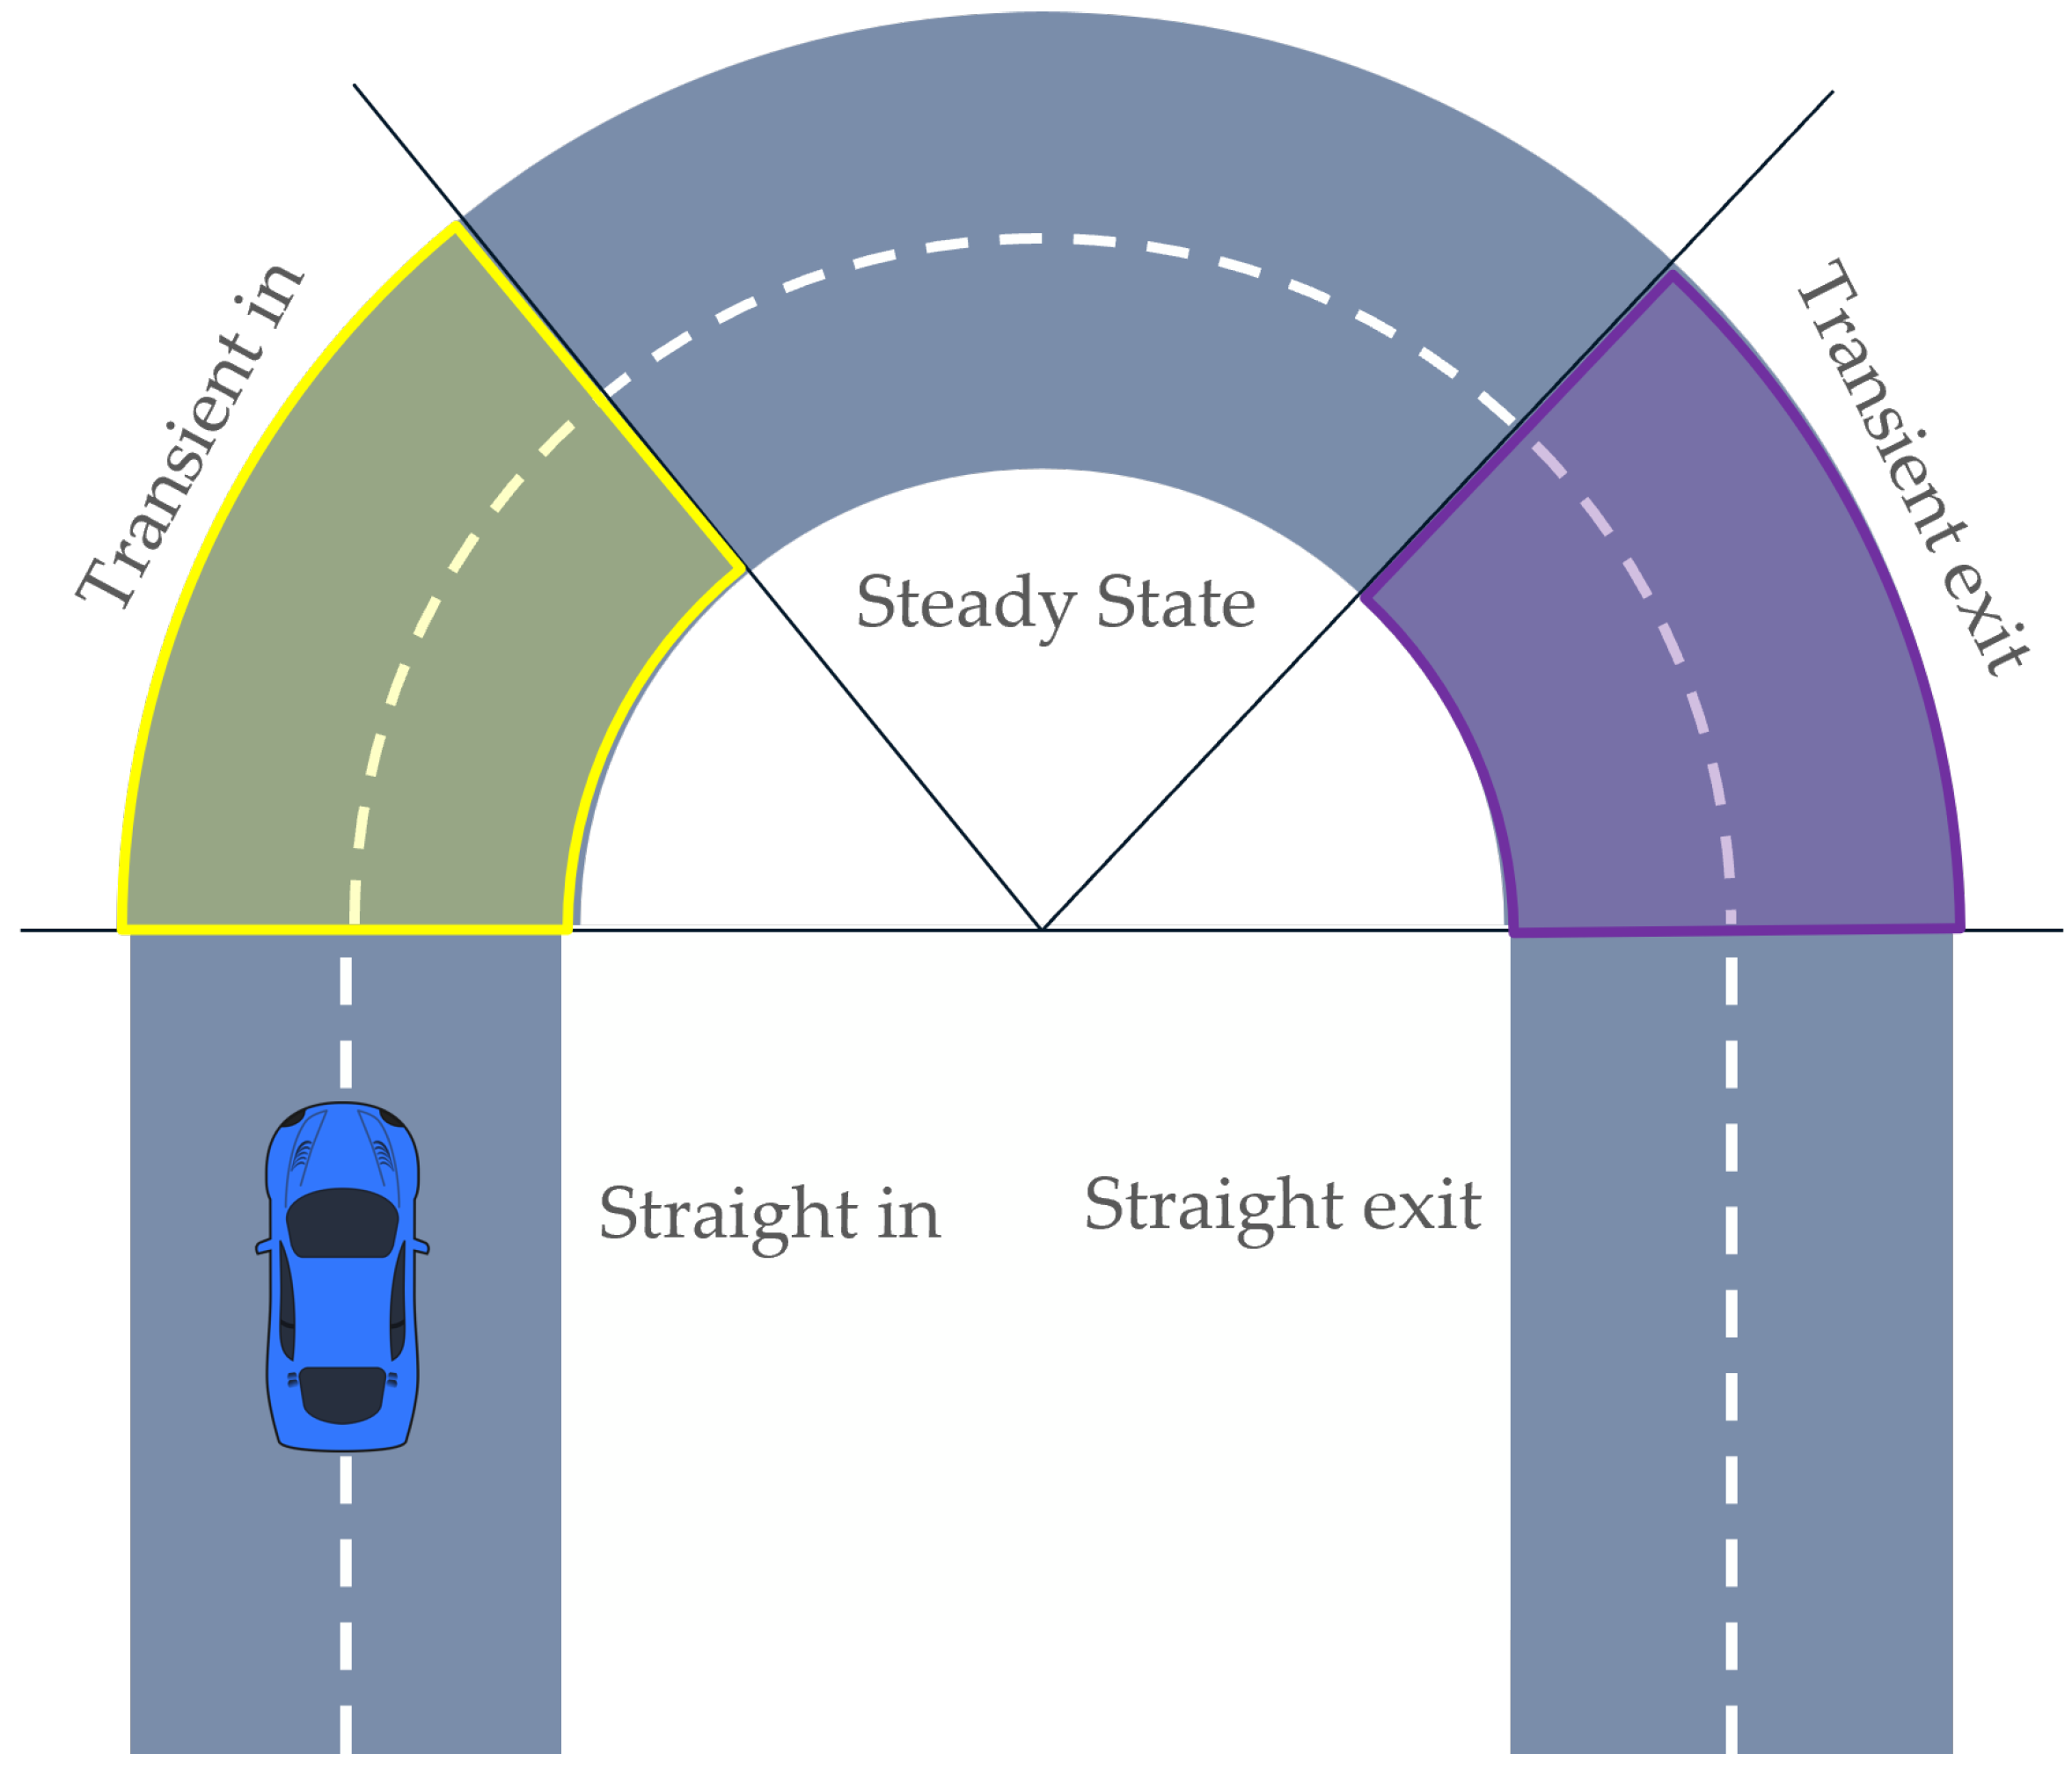
Consequently, we defined a matrix of cornering tests covering speed ranges and curvature radii compliant with the UNECE R79 envelope, focusing explicitly on the two transitional phases of the maneuver:
Within these transient regions, highlighted in
Figure 5, we introduced targeted KPIs to characterize performance and behavior for a more discriminative evaluation of transient dynamics than homologation peaks alone.
5. Transient KPIs Overview
Leveraging the curve-testing framework described above, we evaluated the ADAS in transient conditions and derived a set of candidate KPIs. Among several signal families (steer angle, lateral acceleration, etc.), yaw-rate-based metrics have been prioritized since yaw rate is straightforward to measure on the final vehicle and tightly coupled to field-of-view motion experienced by the driver, a stimulus that can be reliably reproduced and perceived by testers on a static simulator.”
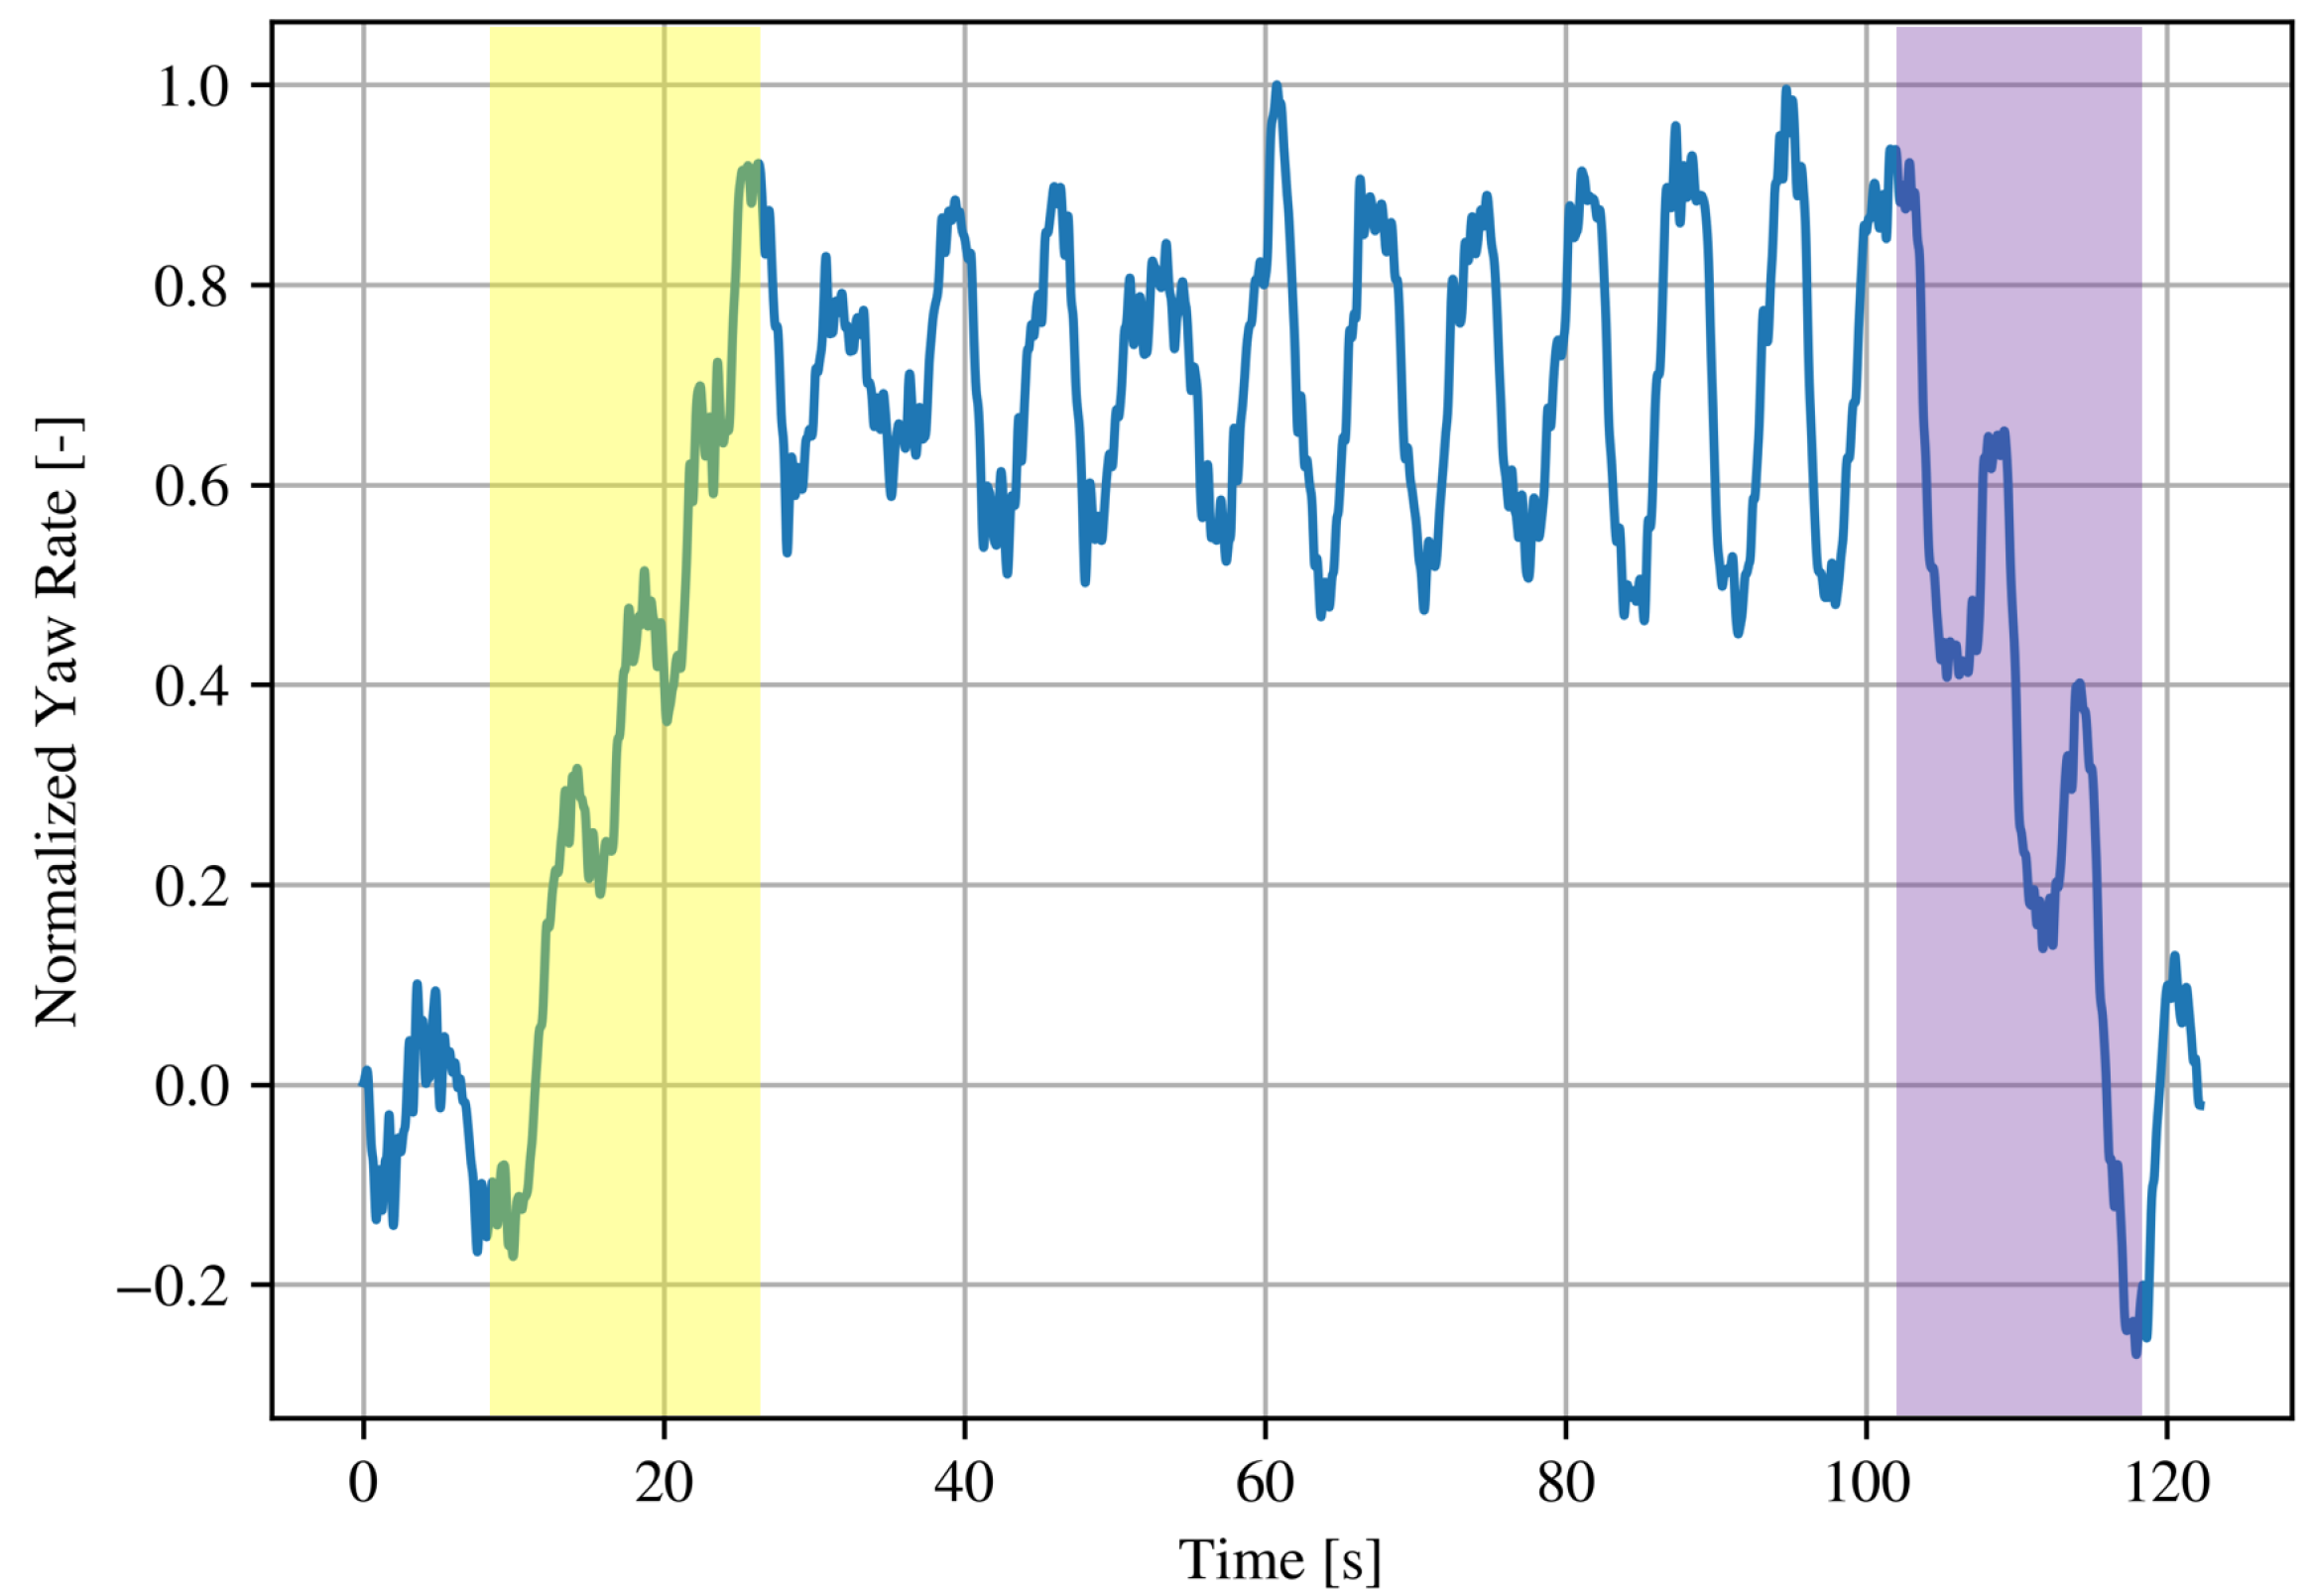
A typical cornering maneuver can be represented by the yaw-rate signal, which exhibits a characteristic trapezoidal shape. The entry and exit ramps correspond to the transient phases, as highlighted in
Figure 6. Within these regions we introduce three yaw-rate KPIs.
5.1. Aggressiveness Index (AI)
The AI is obtained by calculating the best-fit line of the yaw-rate signal within the transient window. The slope coefficient of this line defines the index. In essence, AI quantifies how rapidly the system changes the vehicle’s heading—that is, how quickly it initiates or completes a cornering maneuver. Higher AI values indicate a more abrupt and aggressive response, while lower values correspond to a smoother and more gradual maneuver.
5.2. Relative-Human Aggressiveness Index (RHAI)
The RHAI compares the system’s aggressiveness to that of a human driver under the same maneuver. It is defined as the ratio between the AI of the ADAS and the AI measured from a human baseline:
An RHAI greater than 1 means the system responds more abruptly than a human driver, while a value below 1 indicates a smoother, less aggressive response. This KPI provides a direct way to evaluate the transient behavior of the system relative to human driving performance.
5.3. Smoothness Index (SI)
The SI is calculated as the Root Mean Square Error (RMSE) between the actual yaw-rate signal and its best-fit line within the transient window. In practice, it measures how much the signal deviates from an ideal, smooth ramp. A high SI indicates greater dispersion and oscillations during curve entry or exit, meaning the maneuver is less stable. Conversely, a low SI means the yaw-rate follows the ramp closely, with minimal oscillations, reflecting a smoother and more composed transition.
5.4. Practical Implications
Taken together, these three indicators provide a comprehensive view of transient behavior. The Aggressiveness Index (AI) quantifies how quickly the system generates yaw during a maneuver. The Relative-Human Aggressiveness Index (RHAI) places this rate in direct comparison with human driving, showing whether the system behaves more abruptly or more gently than a driver. The Smoothness Index (SI) evaluates how closely the yaw-rate signal follows an ideal ramp, highlighting the presence (or absence) of oscillations and irregularities.
By combining speed, human-referenced scaling, and signal quality, these KPIs deliver a compact and interpretable description of system behavior that extends beyond traditional homologation metrics, which typically focus only on peak values.
Moreover, these indicators can be embedded into automated calibration processes. For instance, a grid search approach can systematically tune ADAS parameters to achieve target KPI values, balancing responsiveness, human-likeness, and smoothness in a data-driven manner [
9,
10,
11].
In the next chapter, this KPI framework is applied to a representative use case, showing how transient metrics can support objective comparison between control strategies and guide system tuning toward improved comfort and acceptance.
6. Specific Use Case and Results
To demonstrate the applicability of the proposed methodology, we focus on a representative use case: a vehicle negotiating a constant-radius curve of 520 m at a steady speed of 60 kph.
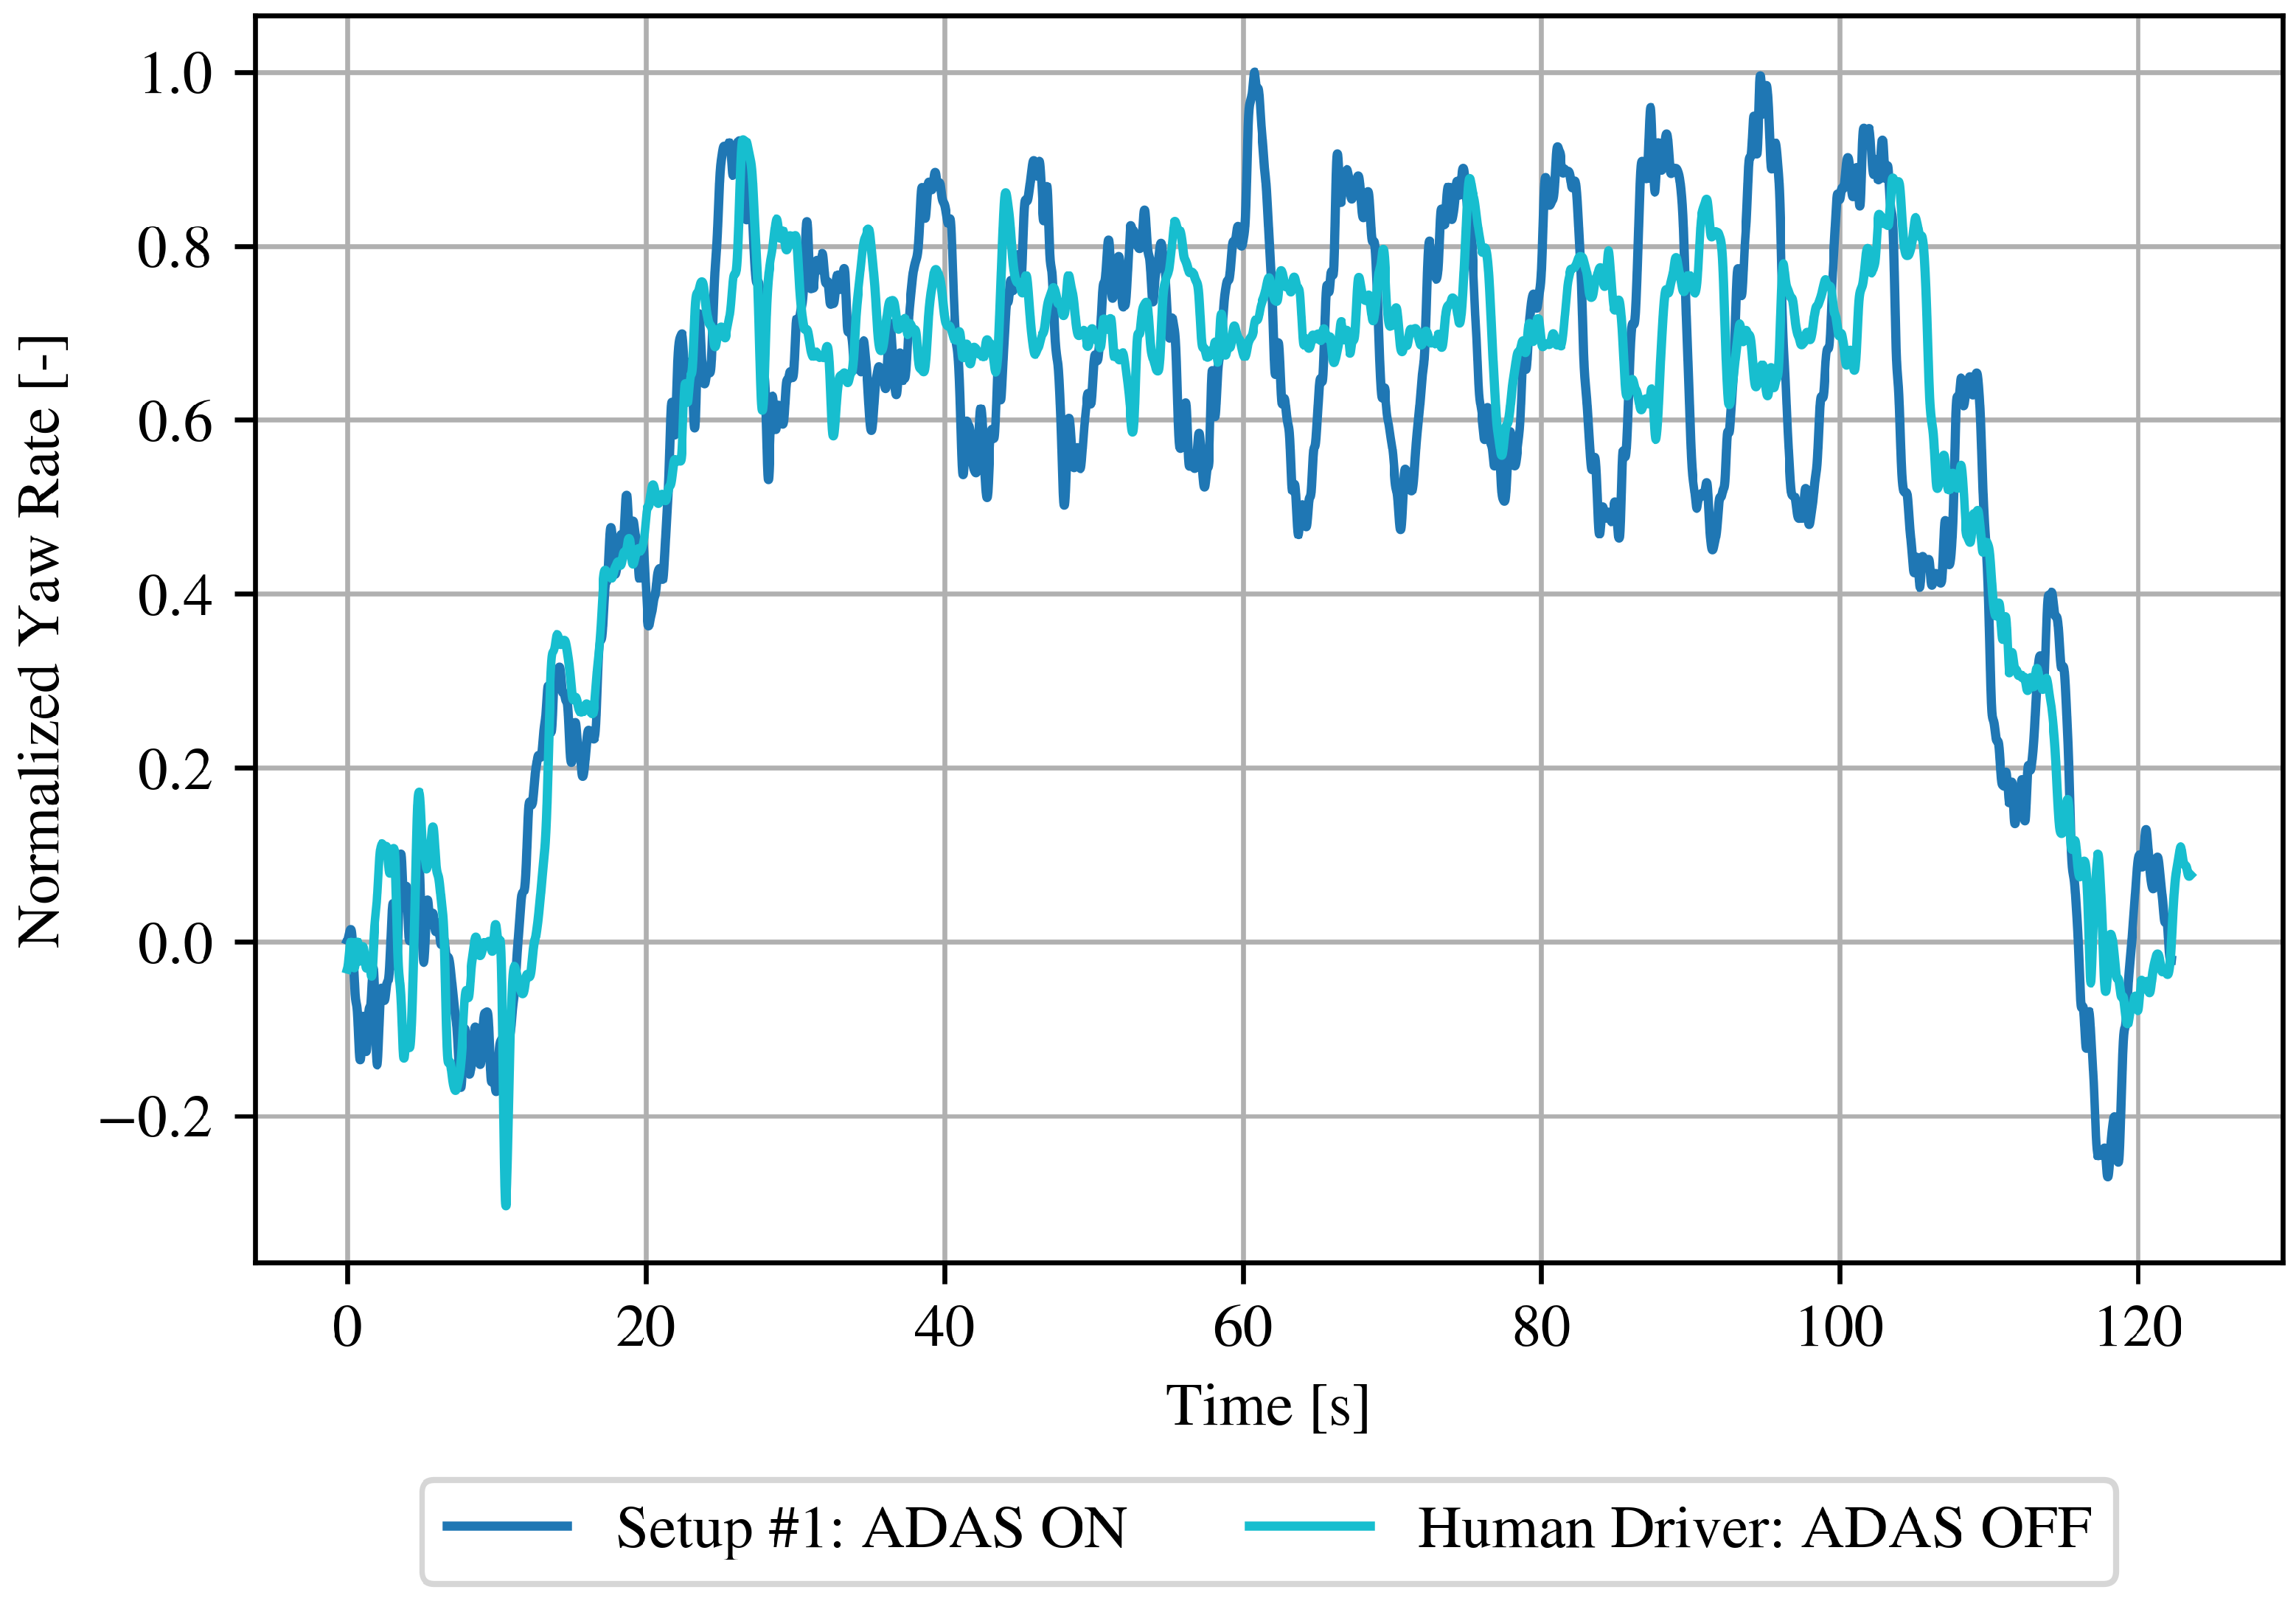
Figure 7 overlays the yaw-rate signal from the ADAS lane-keeping controller (initial PID tuning, Setup #1) with the trajectory of a human driver. While the ADAS is technically capable of completing the curve, its response clearly diverges from the human baseline. Pronounced oscillations appear not only in the transient entry and exit ramps, but also during the steady-state portion of the maneuver. By contrast, the human driver shows a smoother, more stable yaw-rate profile.
The contrast is further highlighted in
Table 2 and
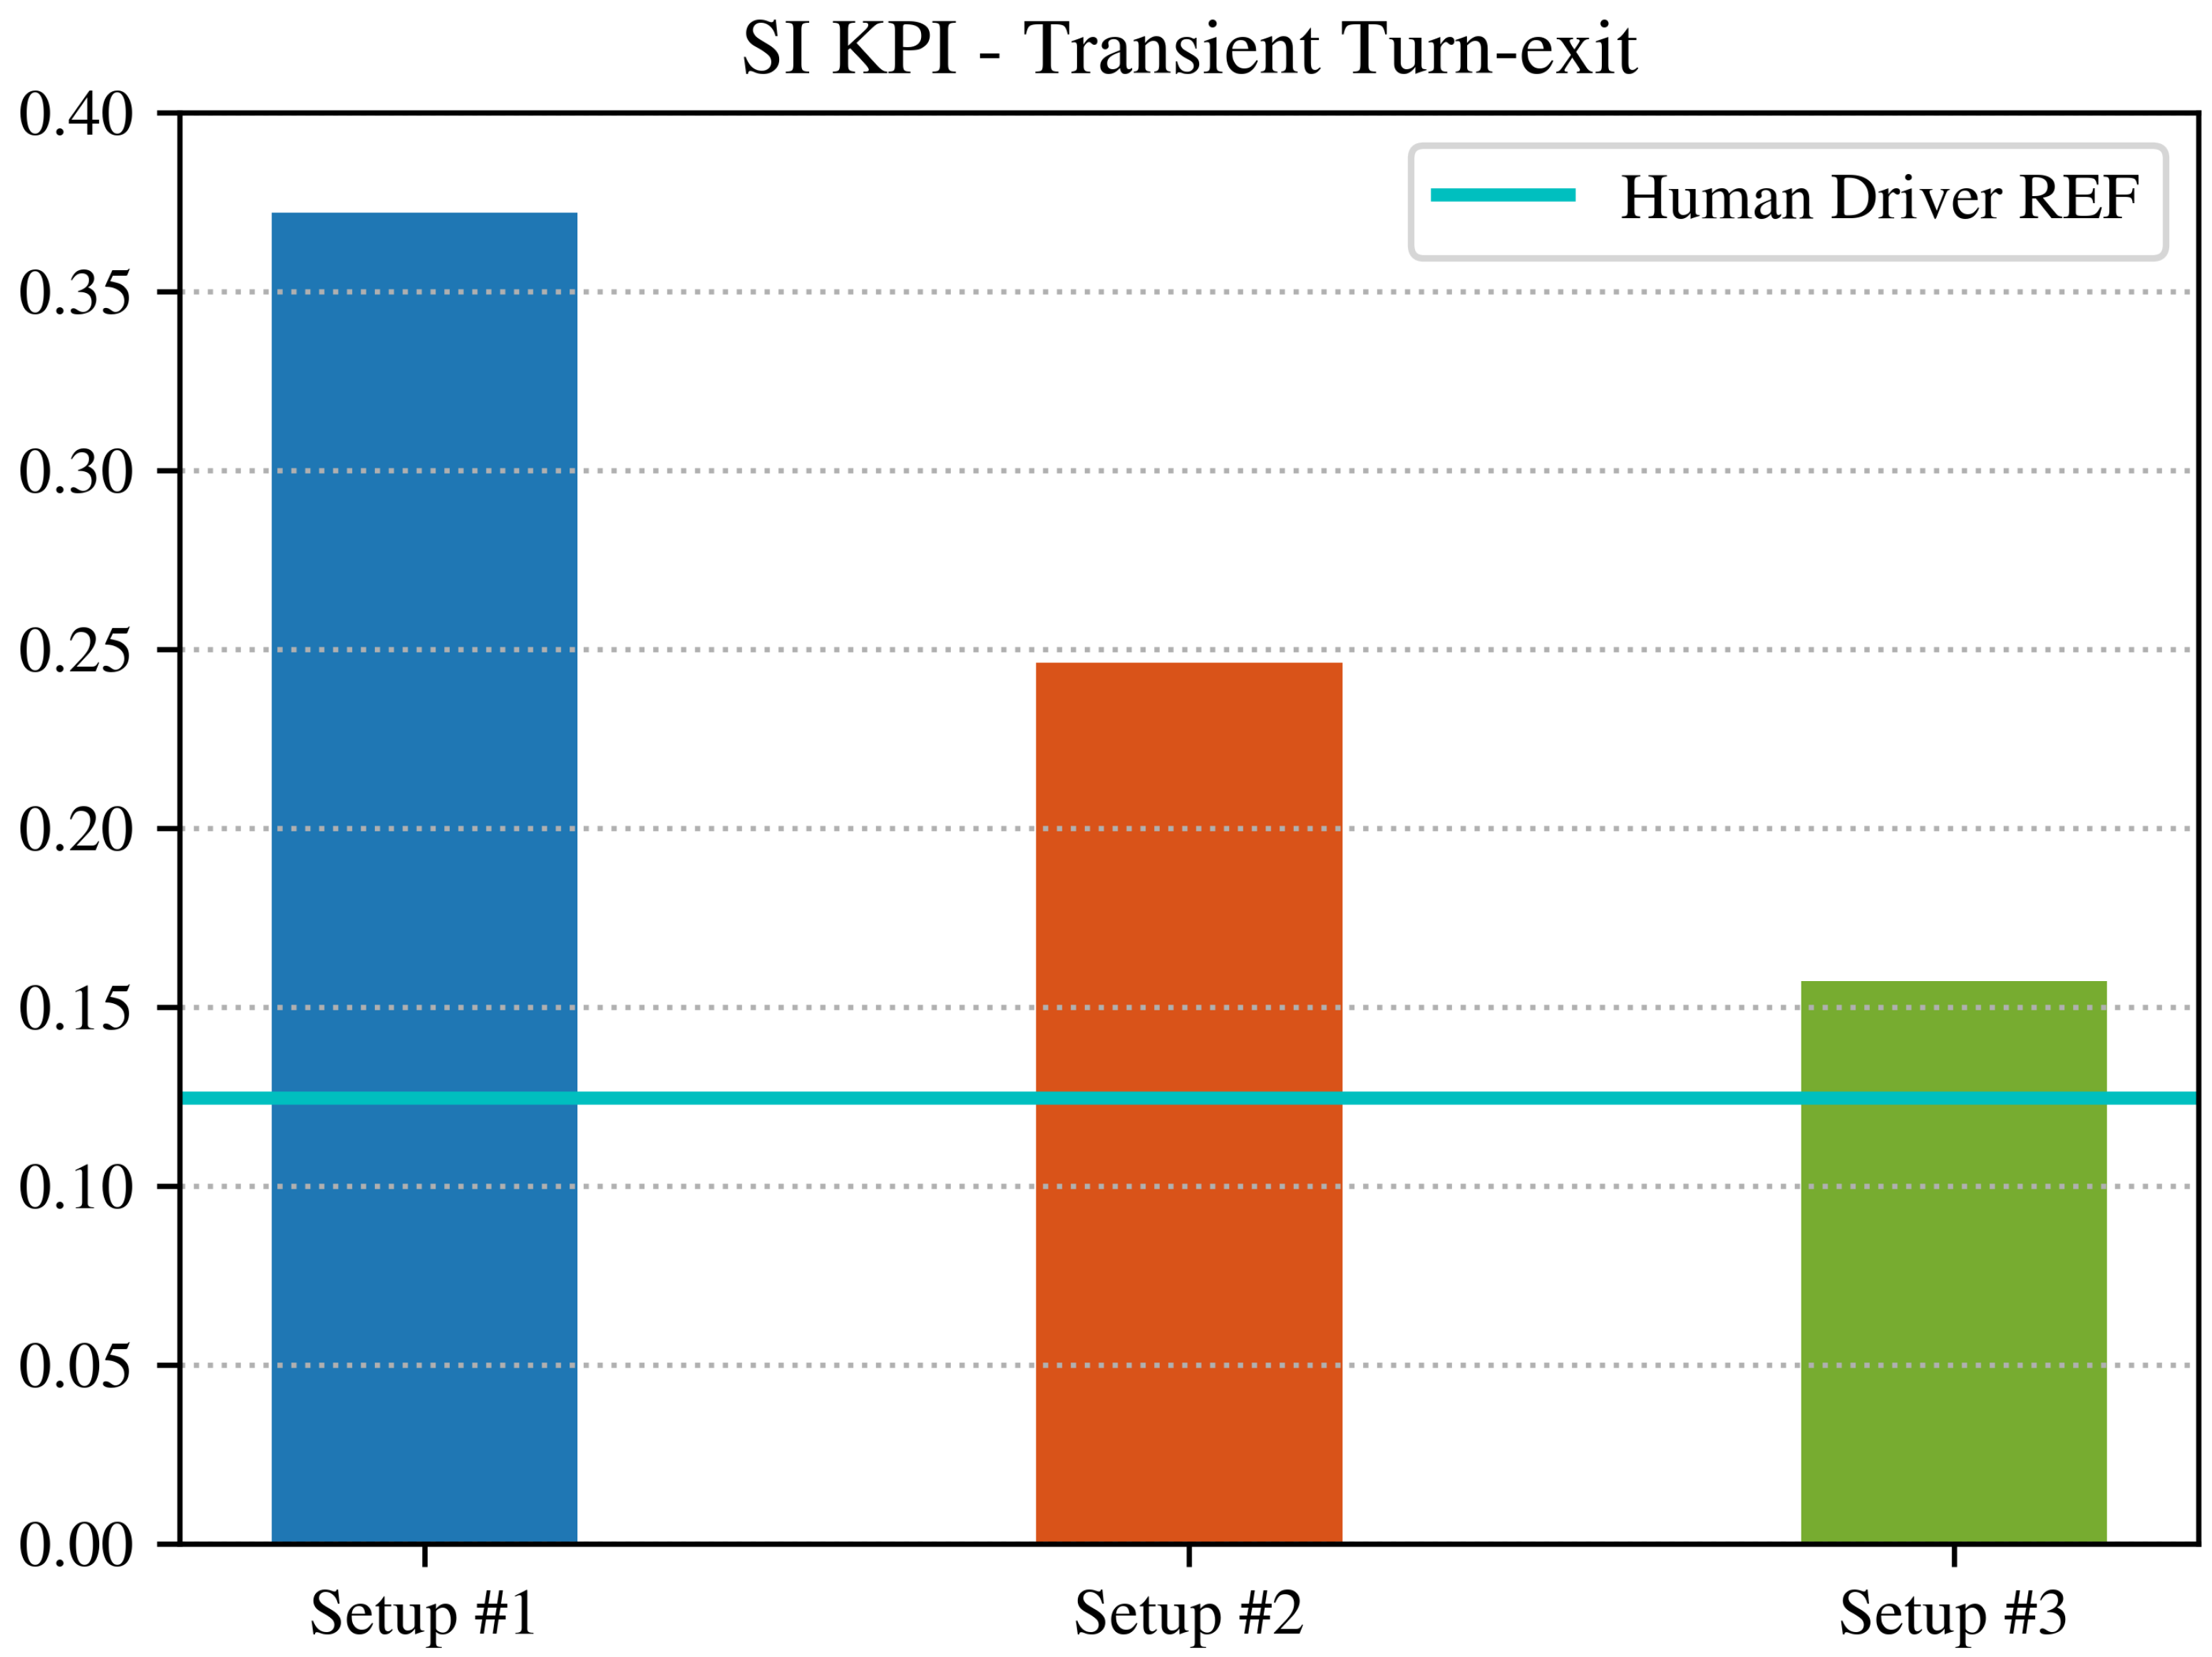
Table 3, which report KPI values for the entry and exit phases. For the entry ramp, the ADAS shows slightly higher aggressiveness (AI = 0.138 vs. 0.134 for the human reference) and comparable smoothness. For the exit ramp, however, discrepancies become more evident: the ADAS exhibits a similar AI magnitude but with opposite sign (–0.136 vs. –0.144), while its Smoothness Index is almost three times larger (0.3720 vs. 0.1247), confirming the presence of oscillations and instability.
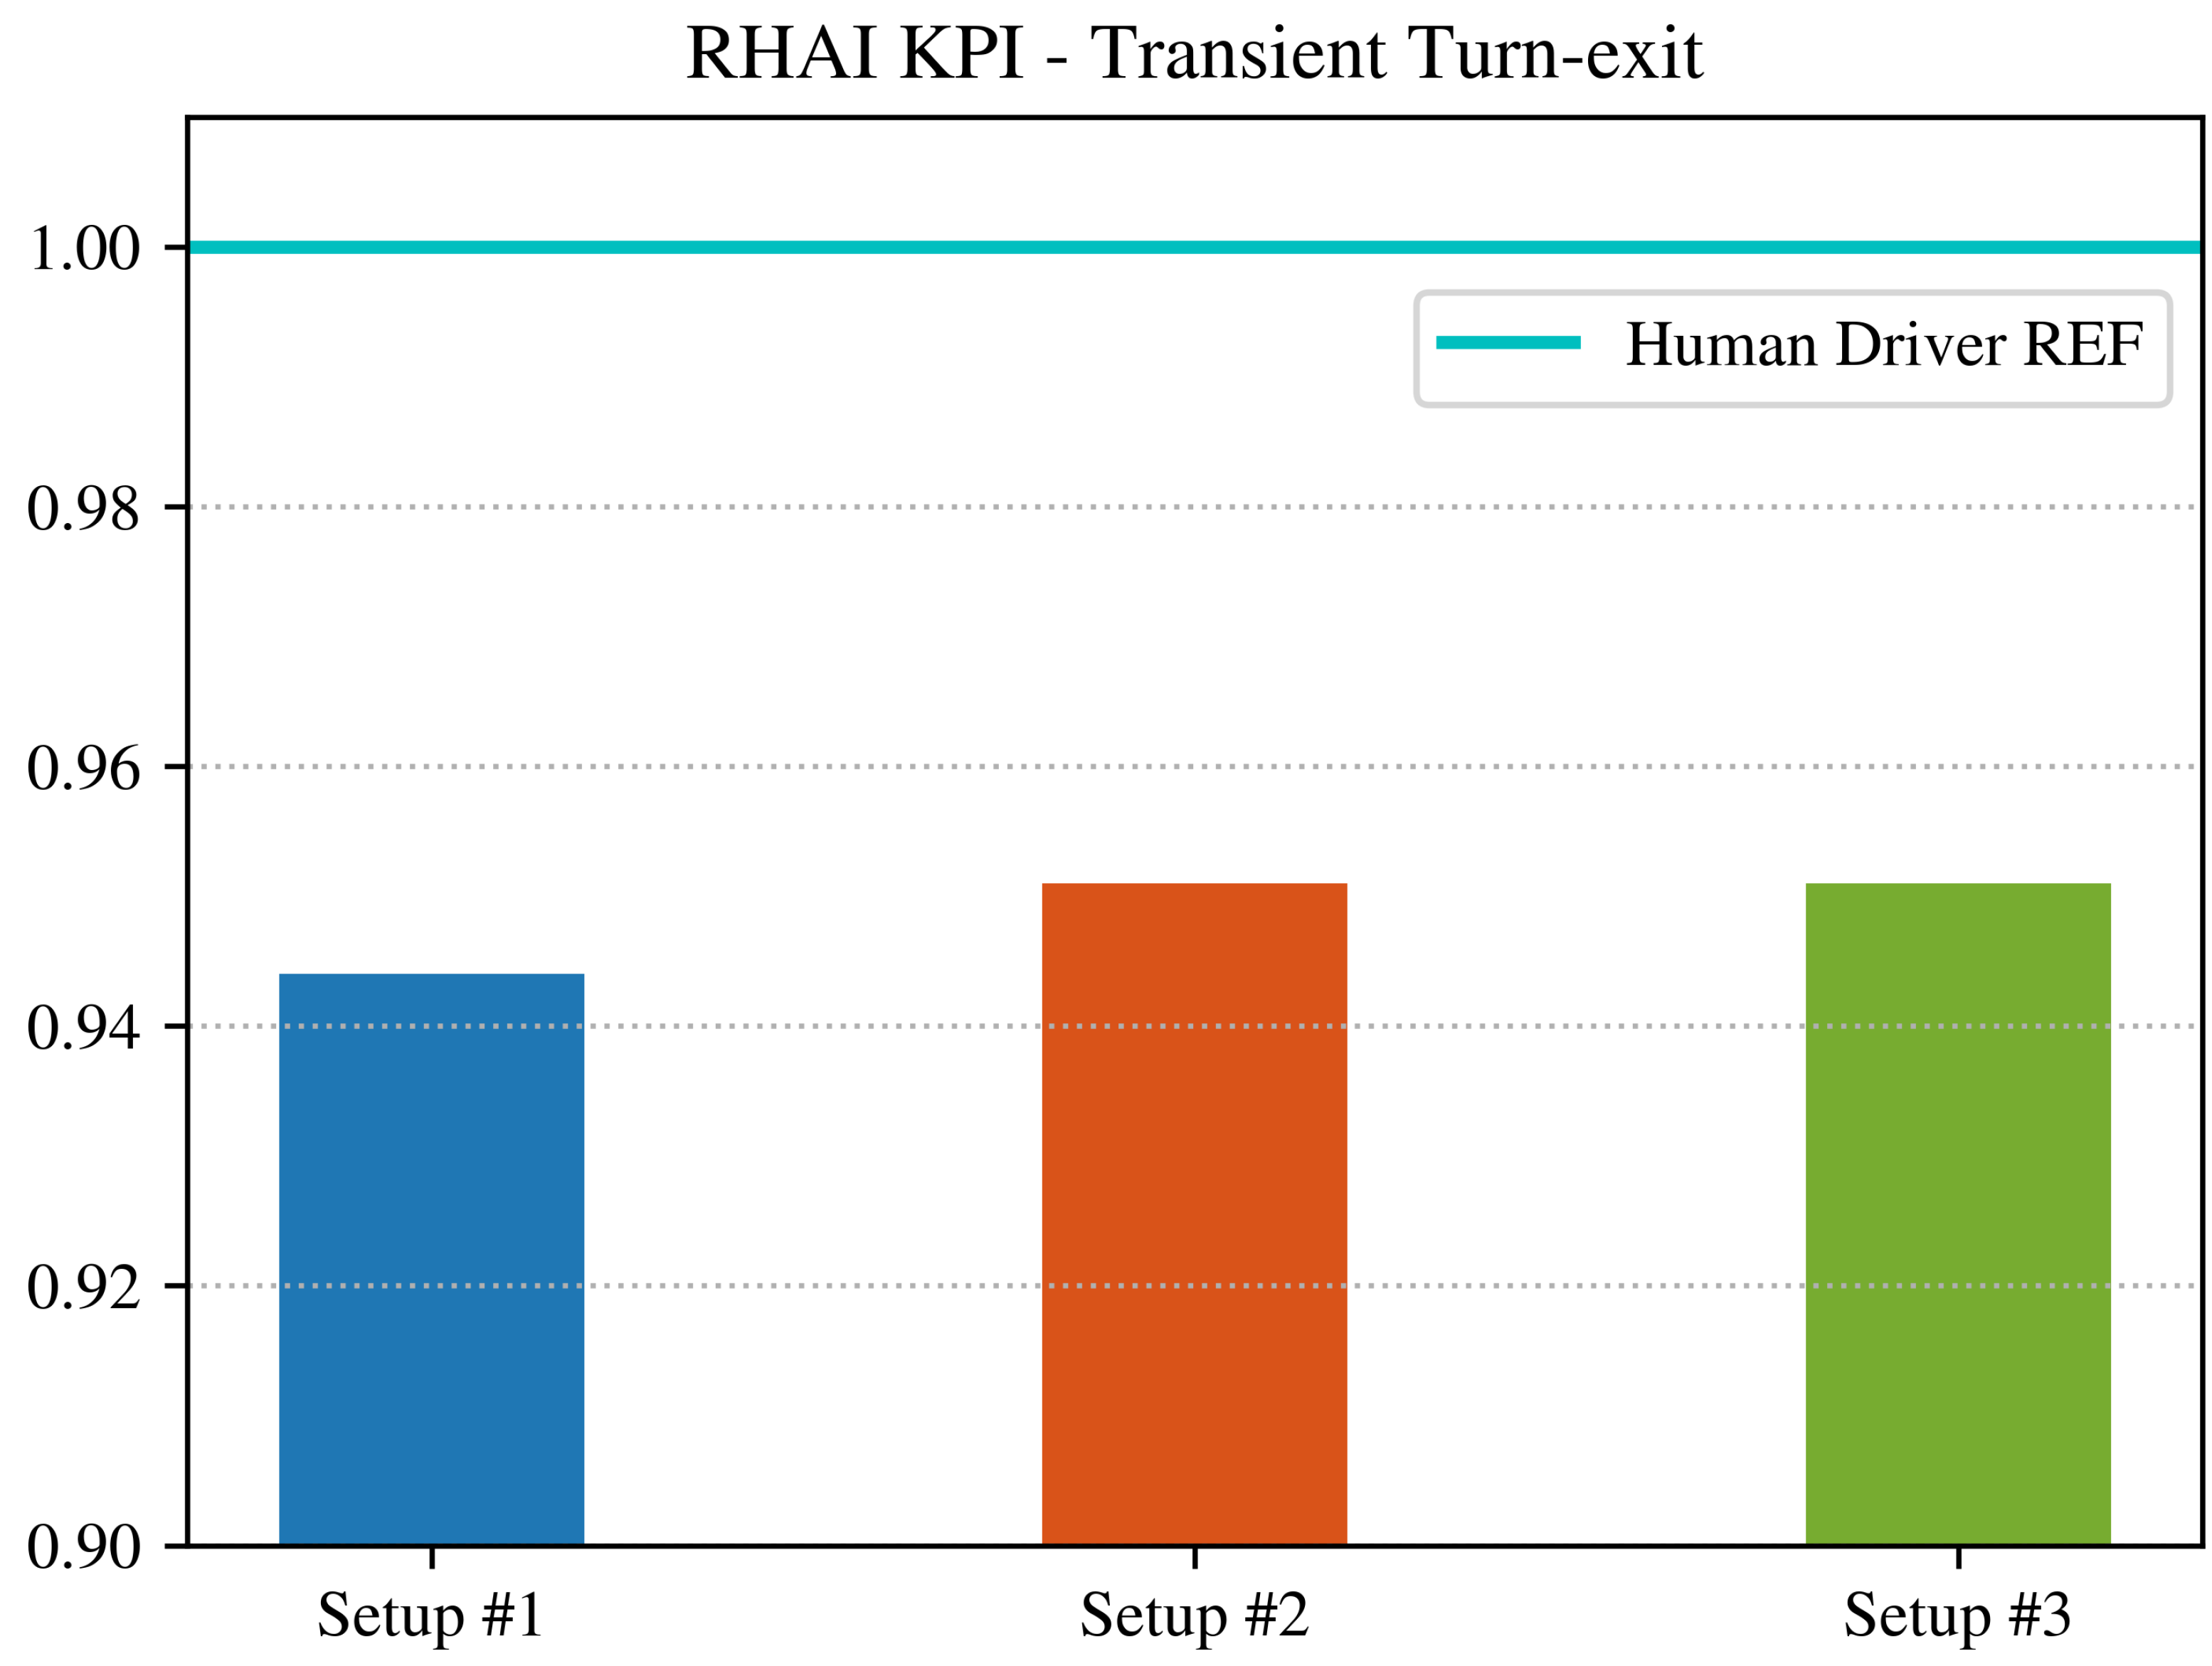
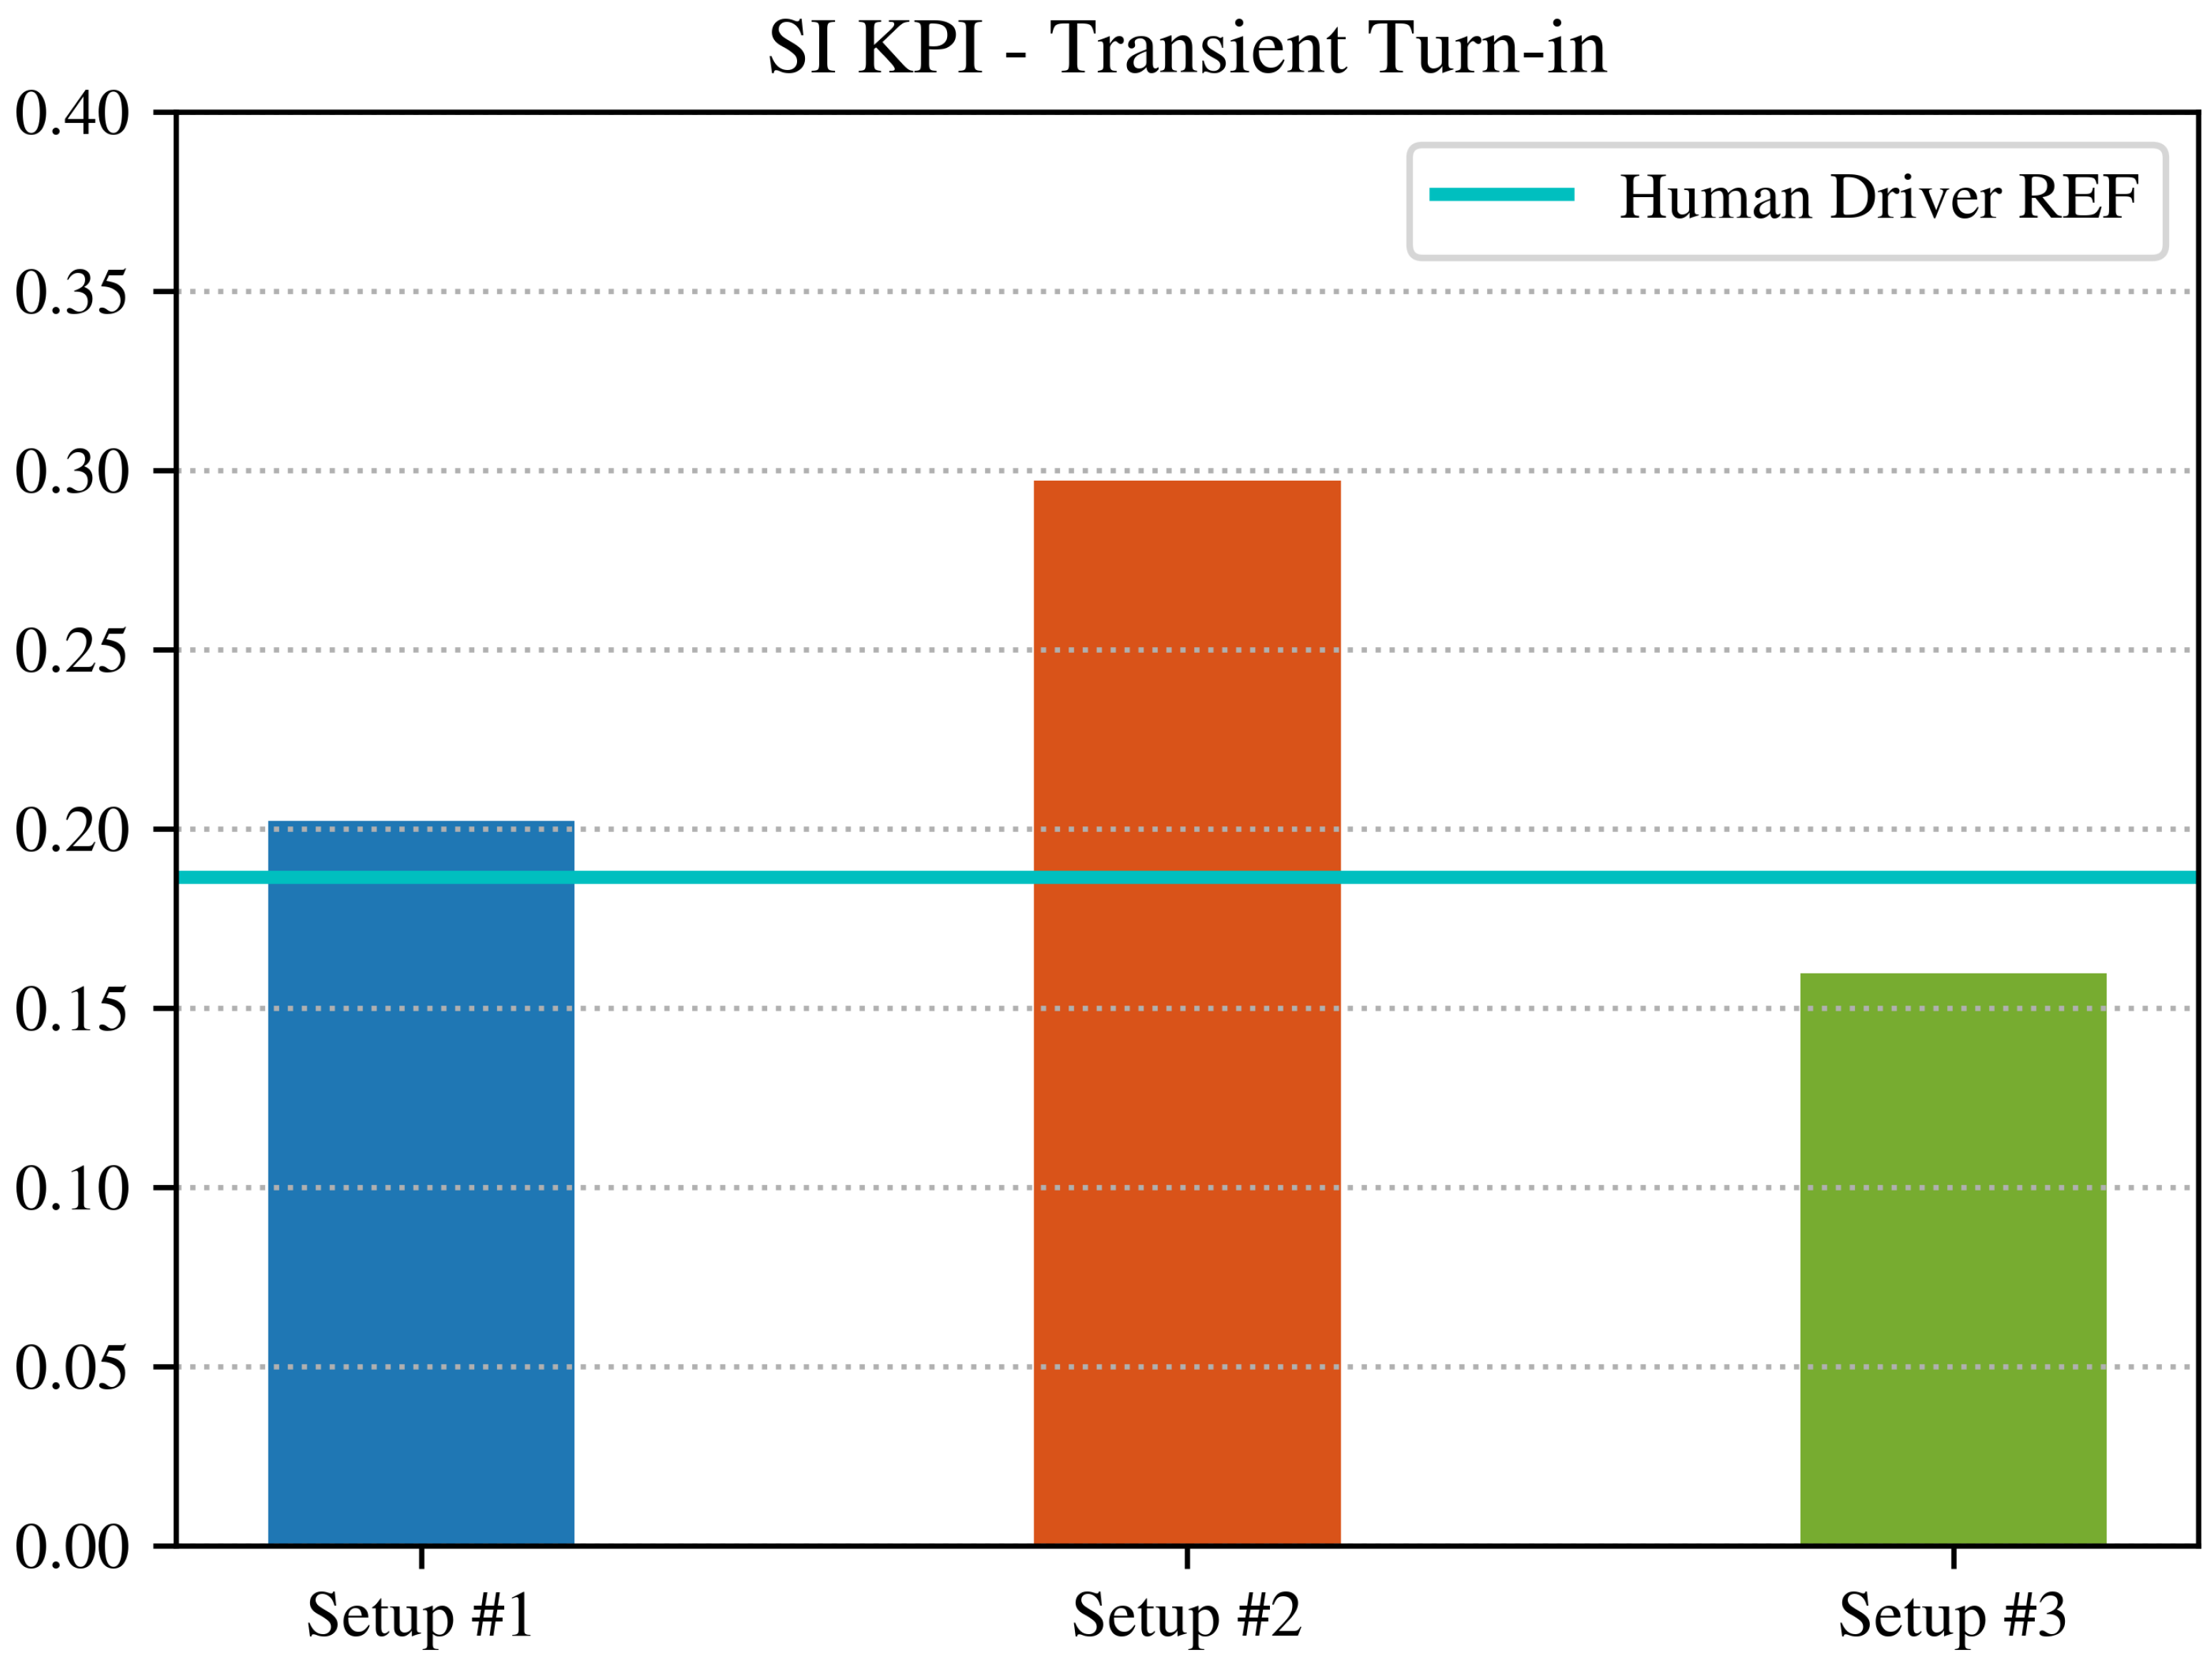
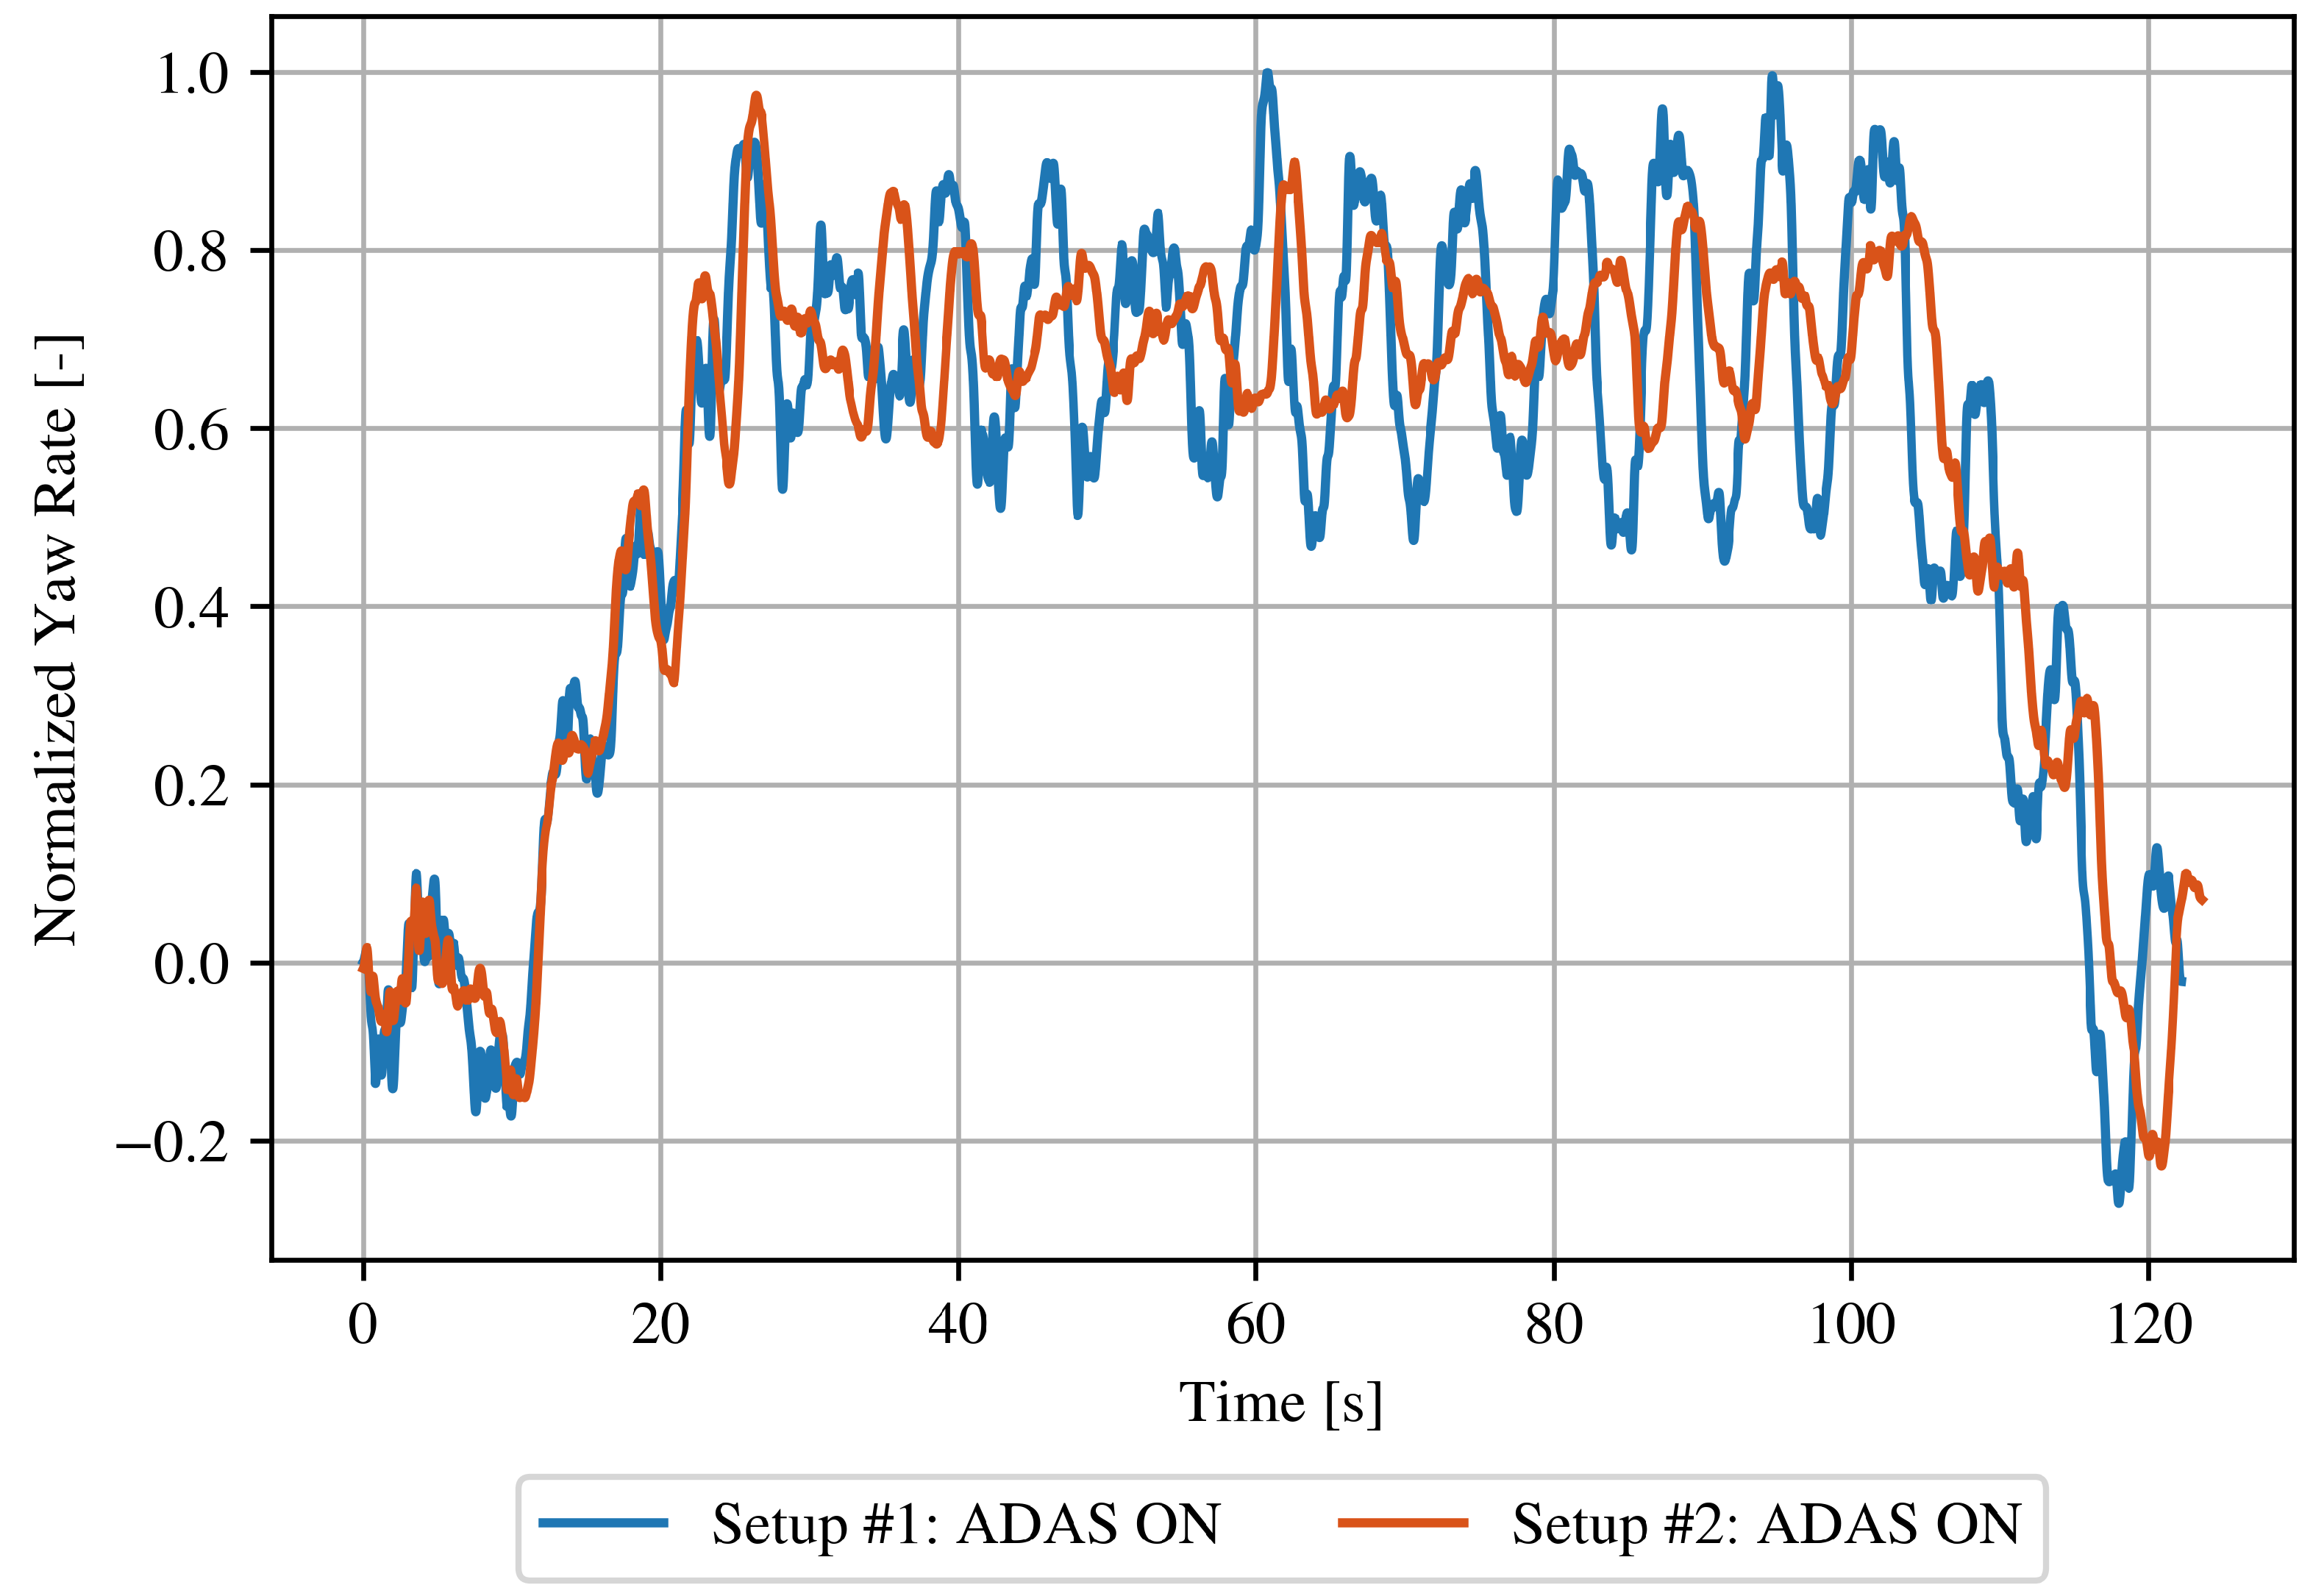
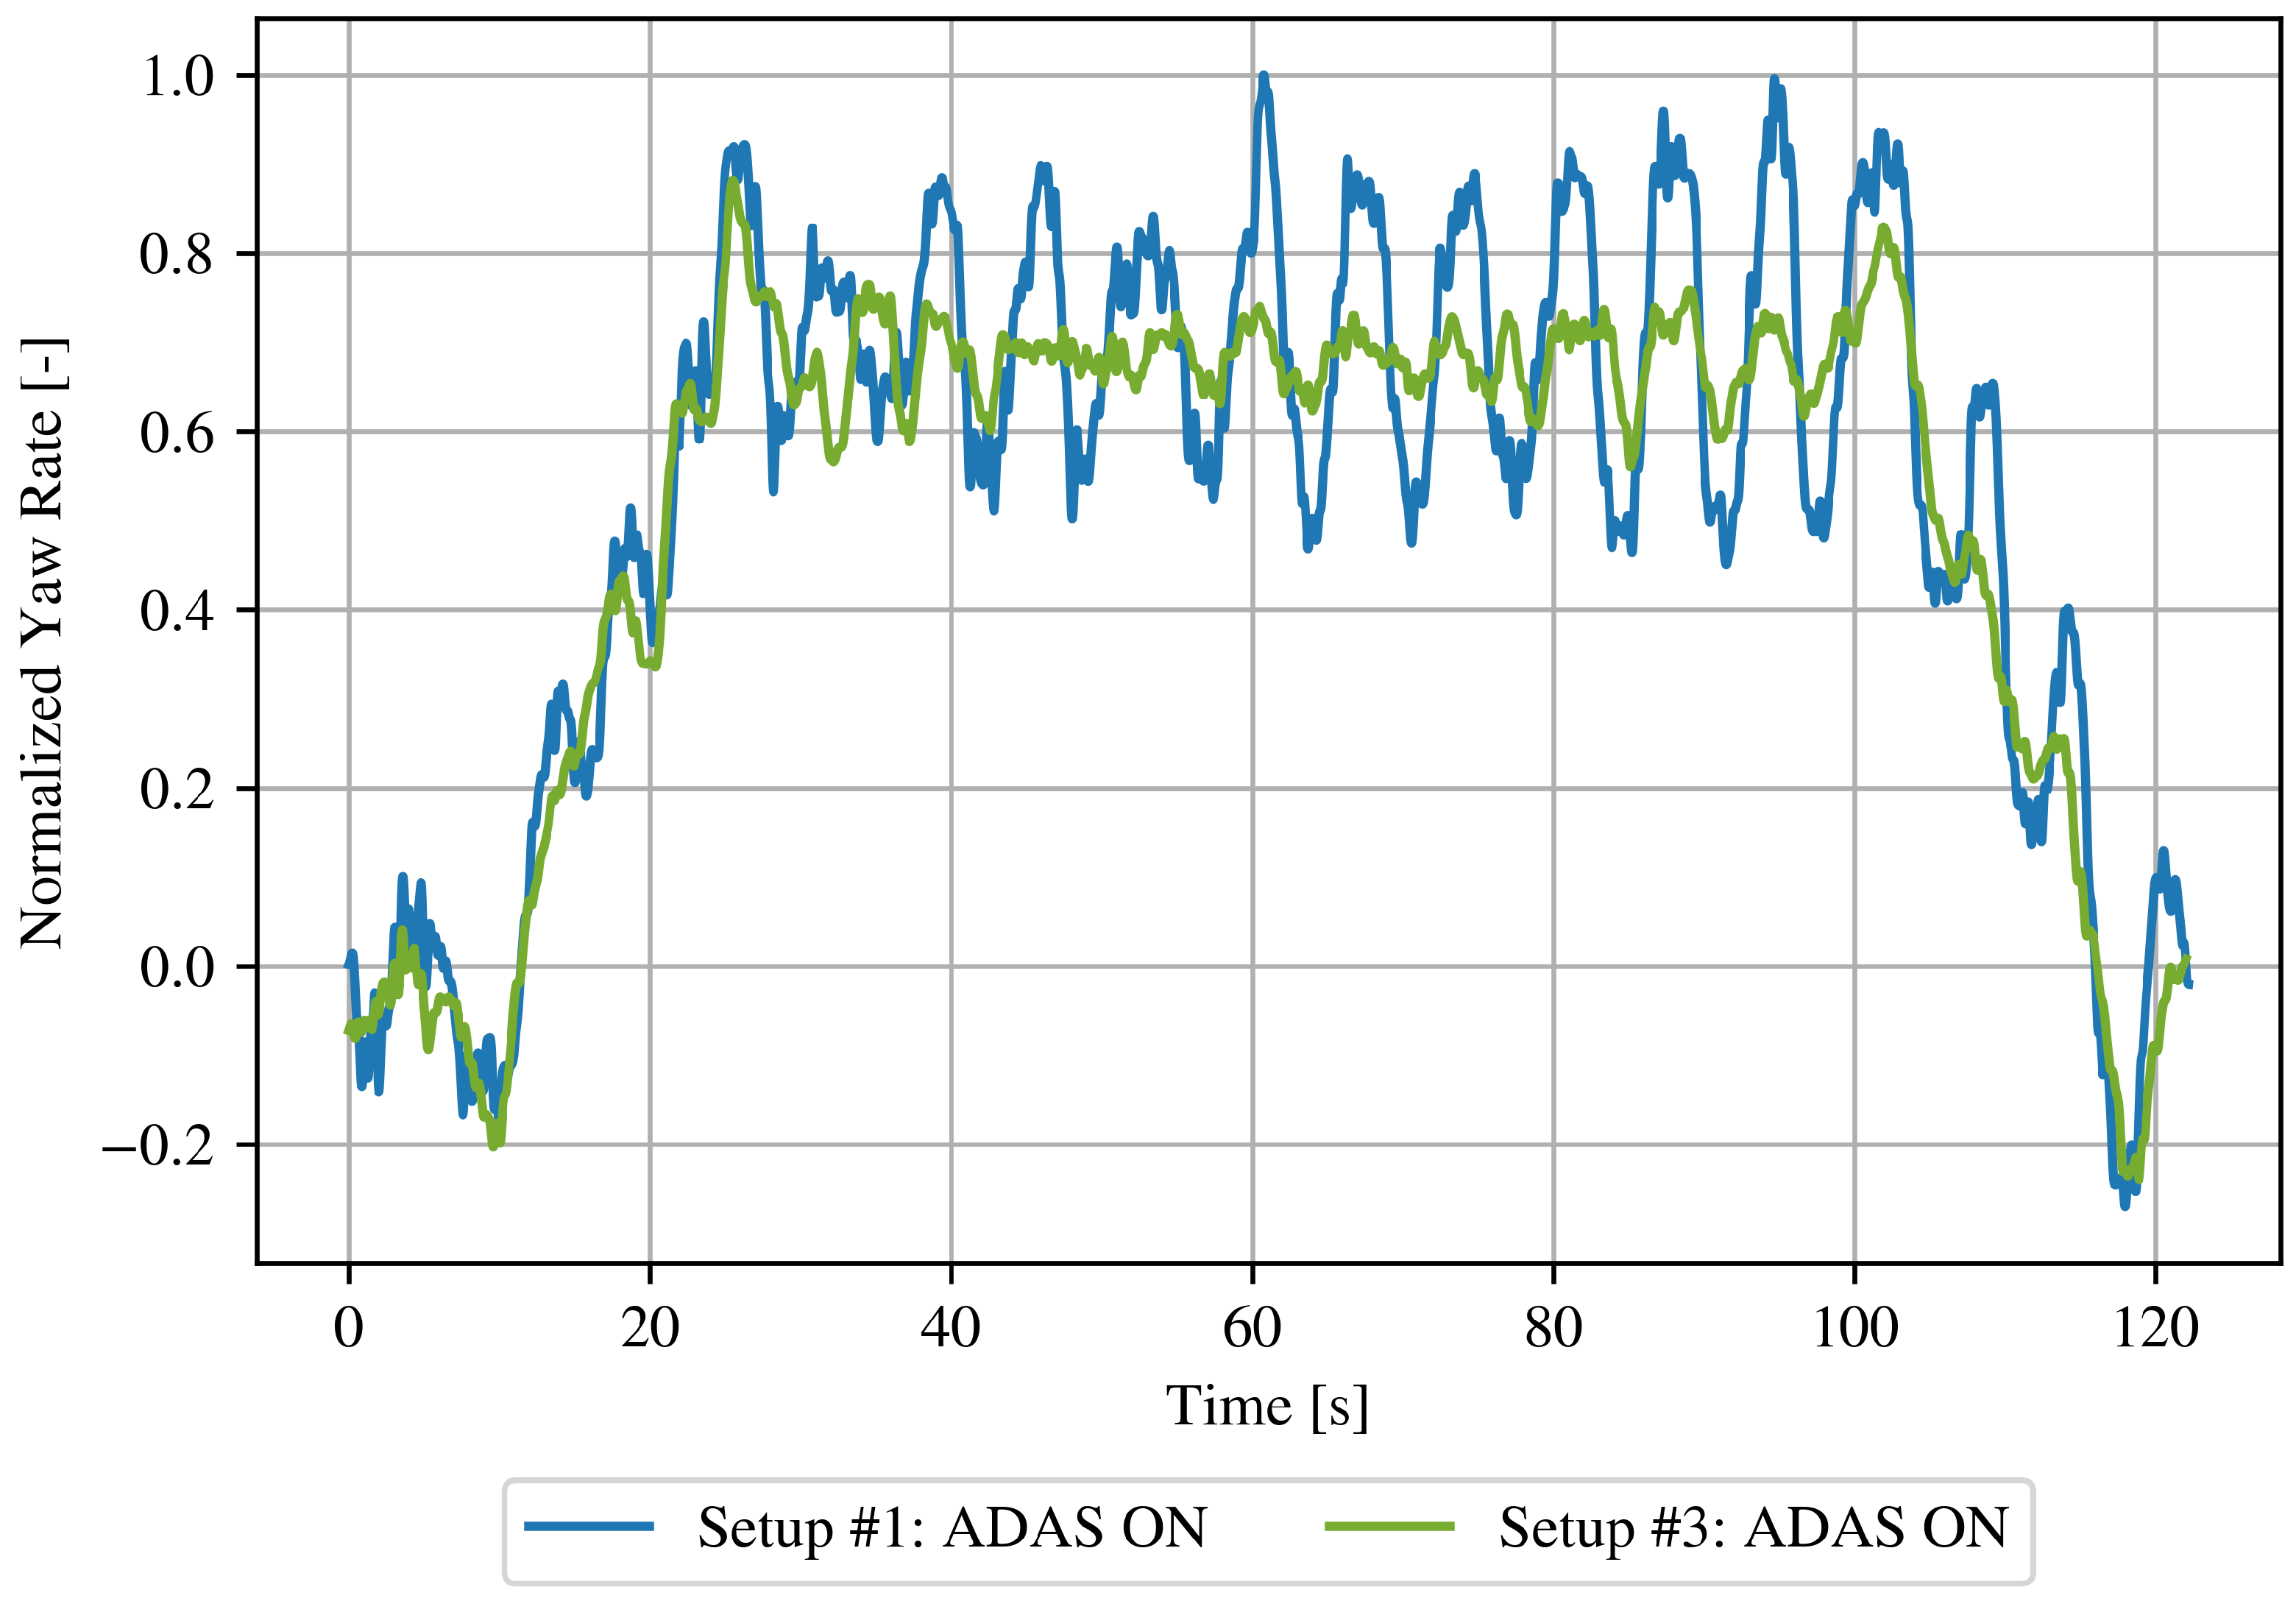
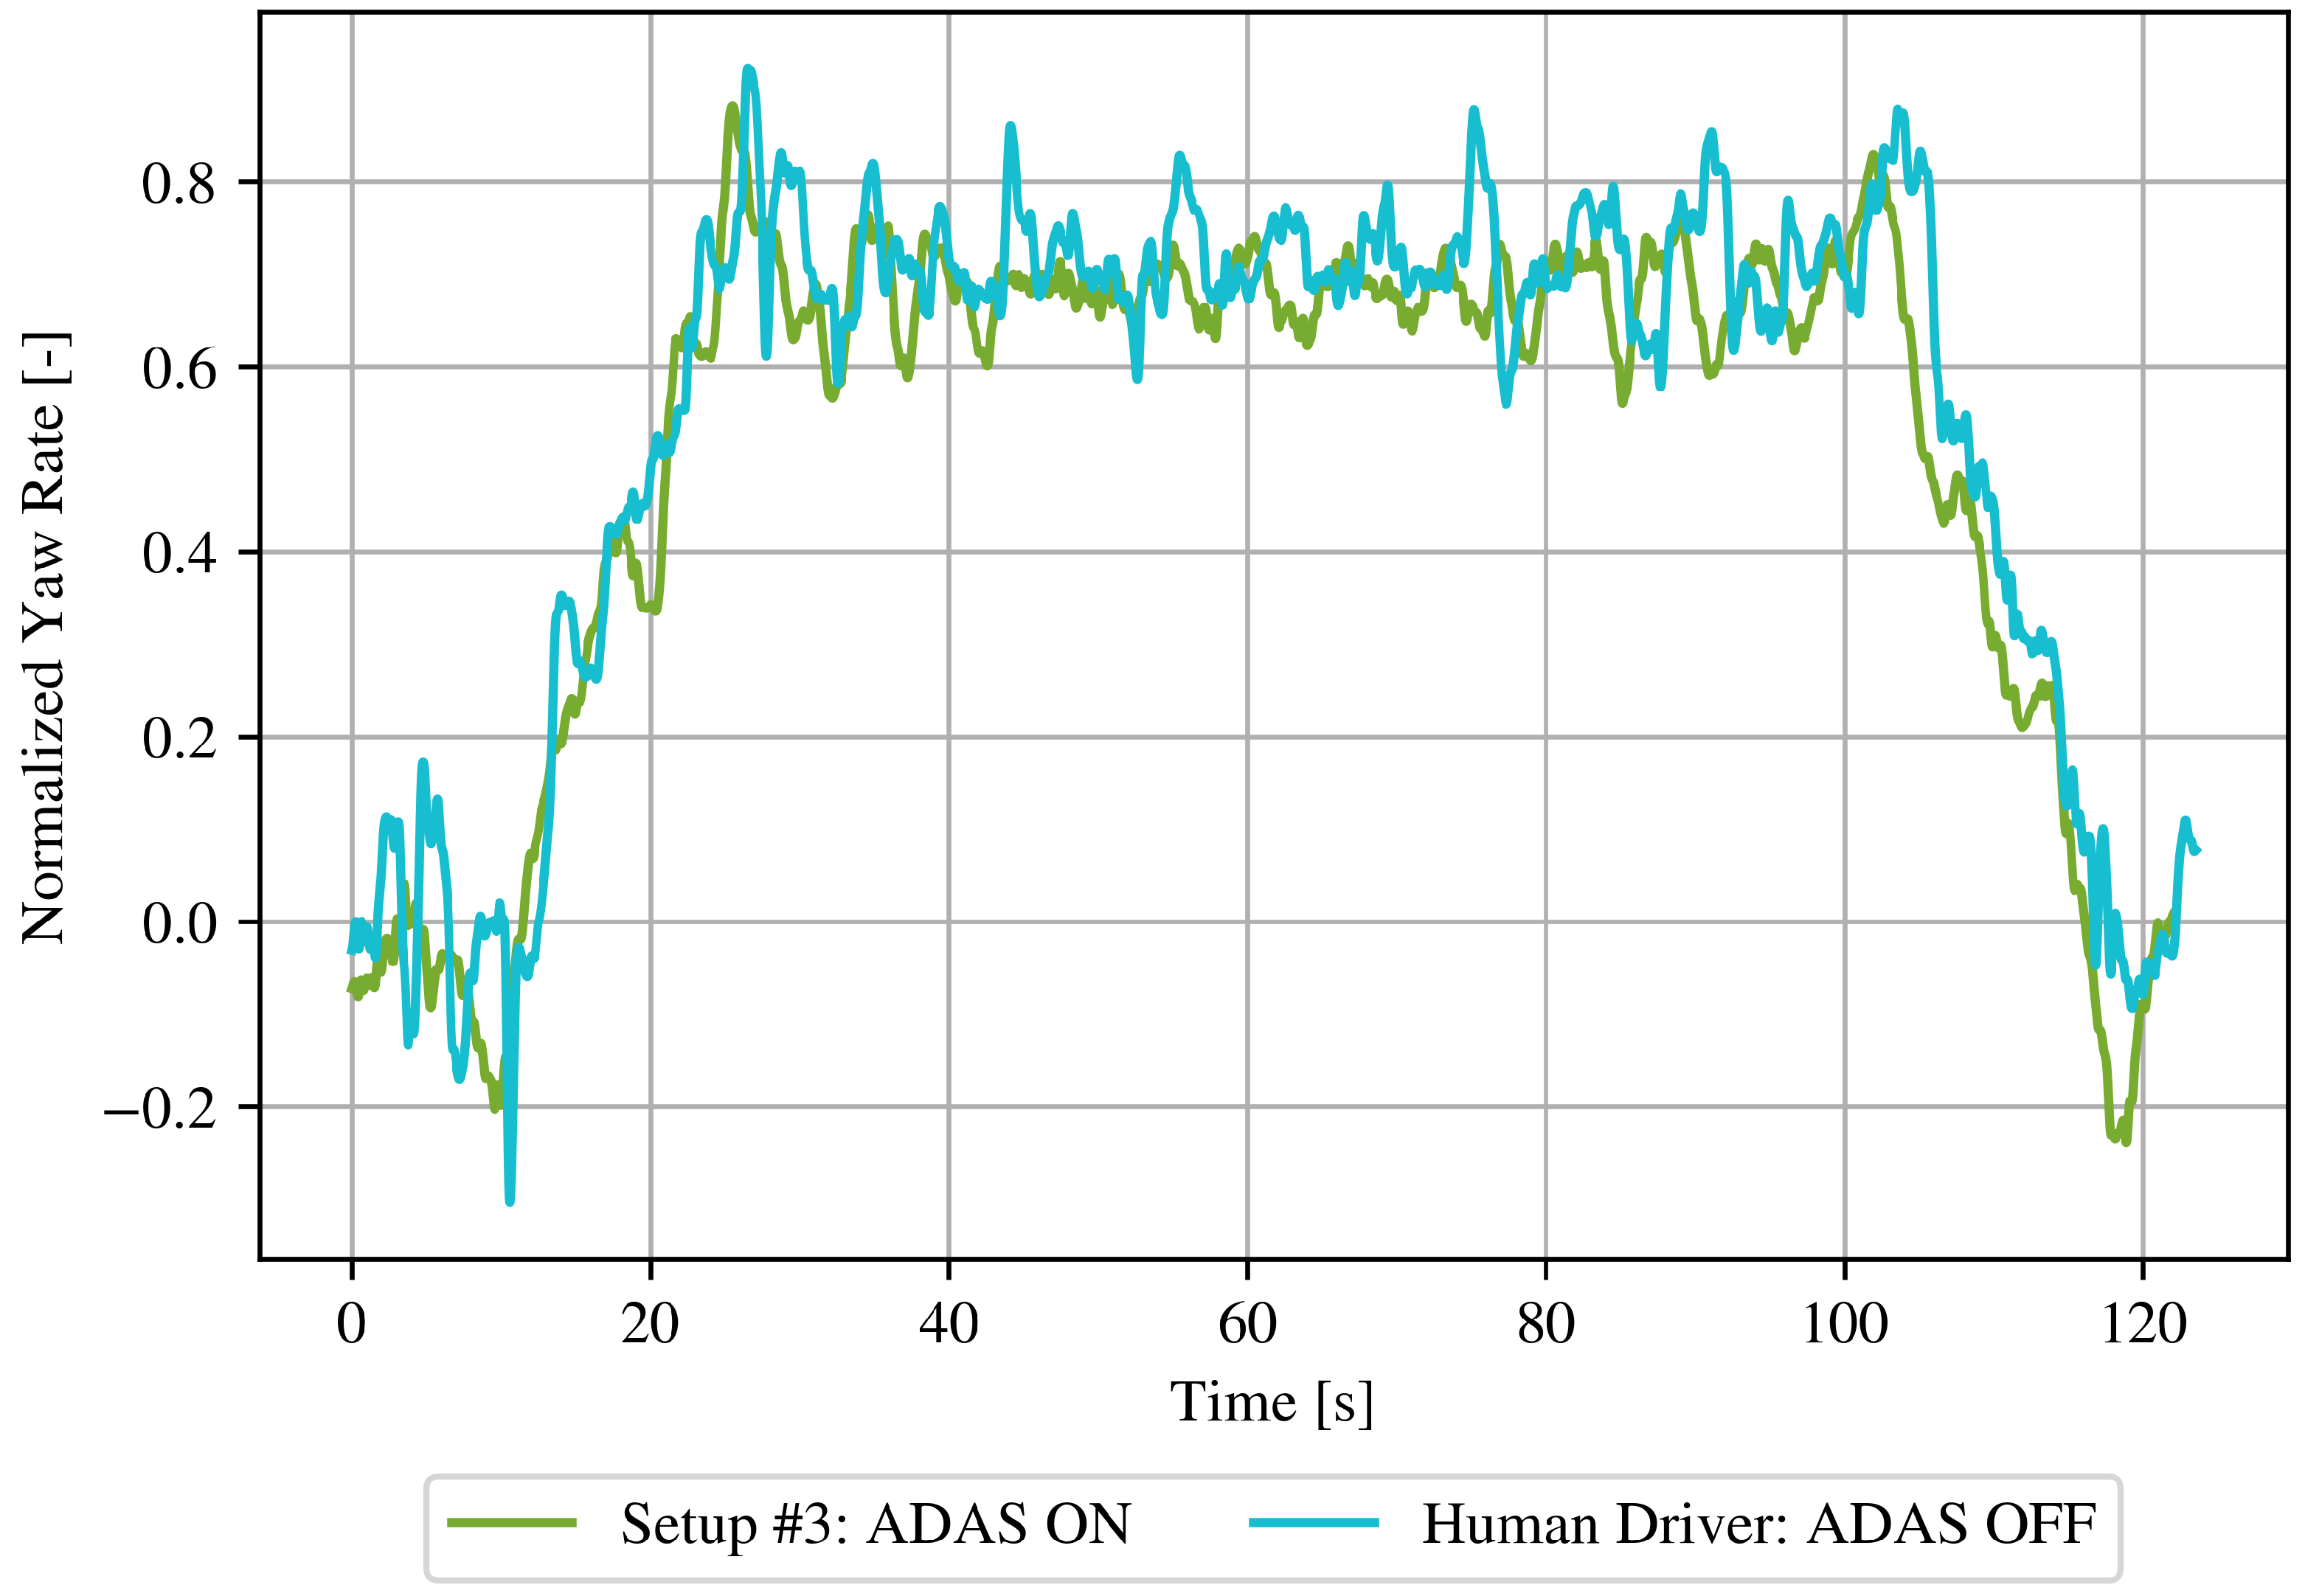
To reduce these deviations, we applied a grid-search optimization of the controller parameters. This process, though computationally intensive, can be executed offline, allowing rapid exploration of the parameter space and systematic scoring against human-referenced KPIs. Two optimization iterations (Setup #2 and Setup #3) were tested against the baseline Setup #1. The KPI tables show a progressive convergence toward the human reference values.
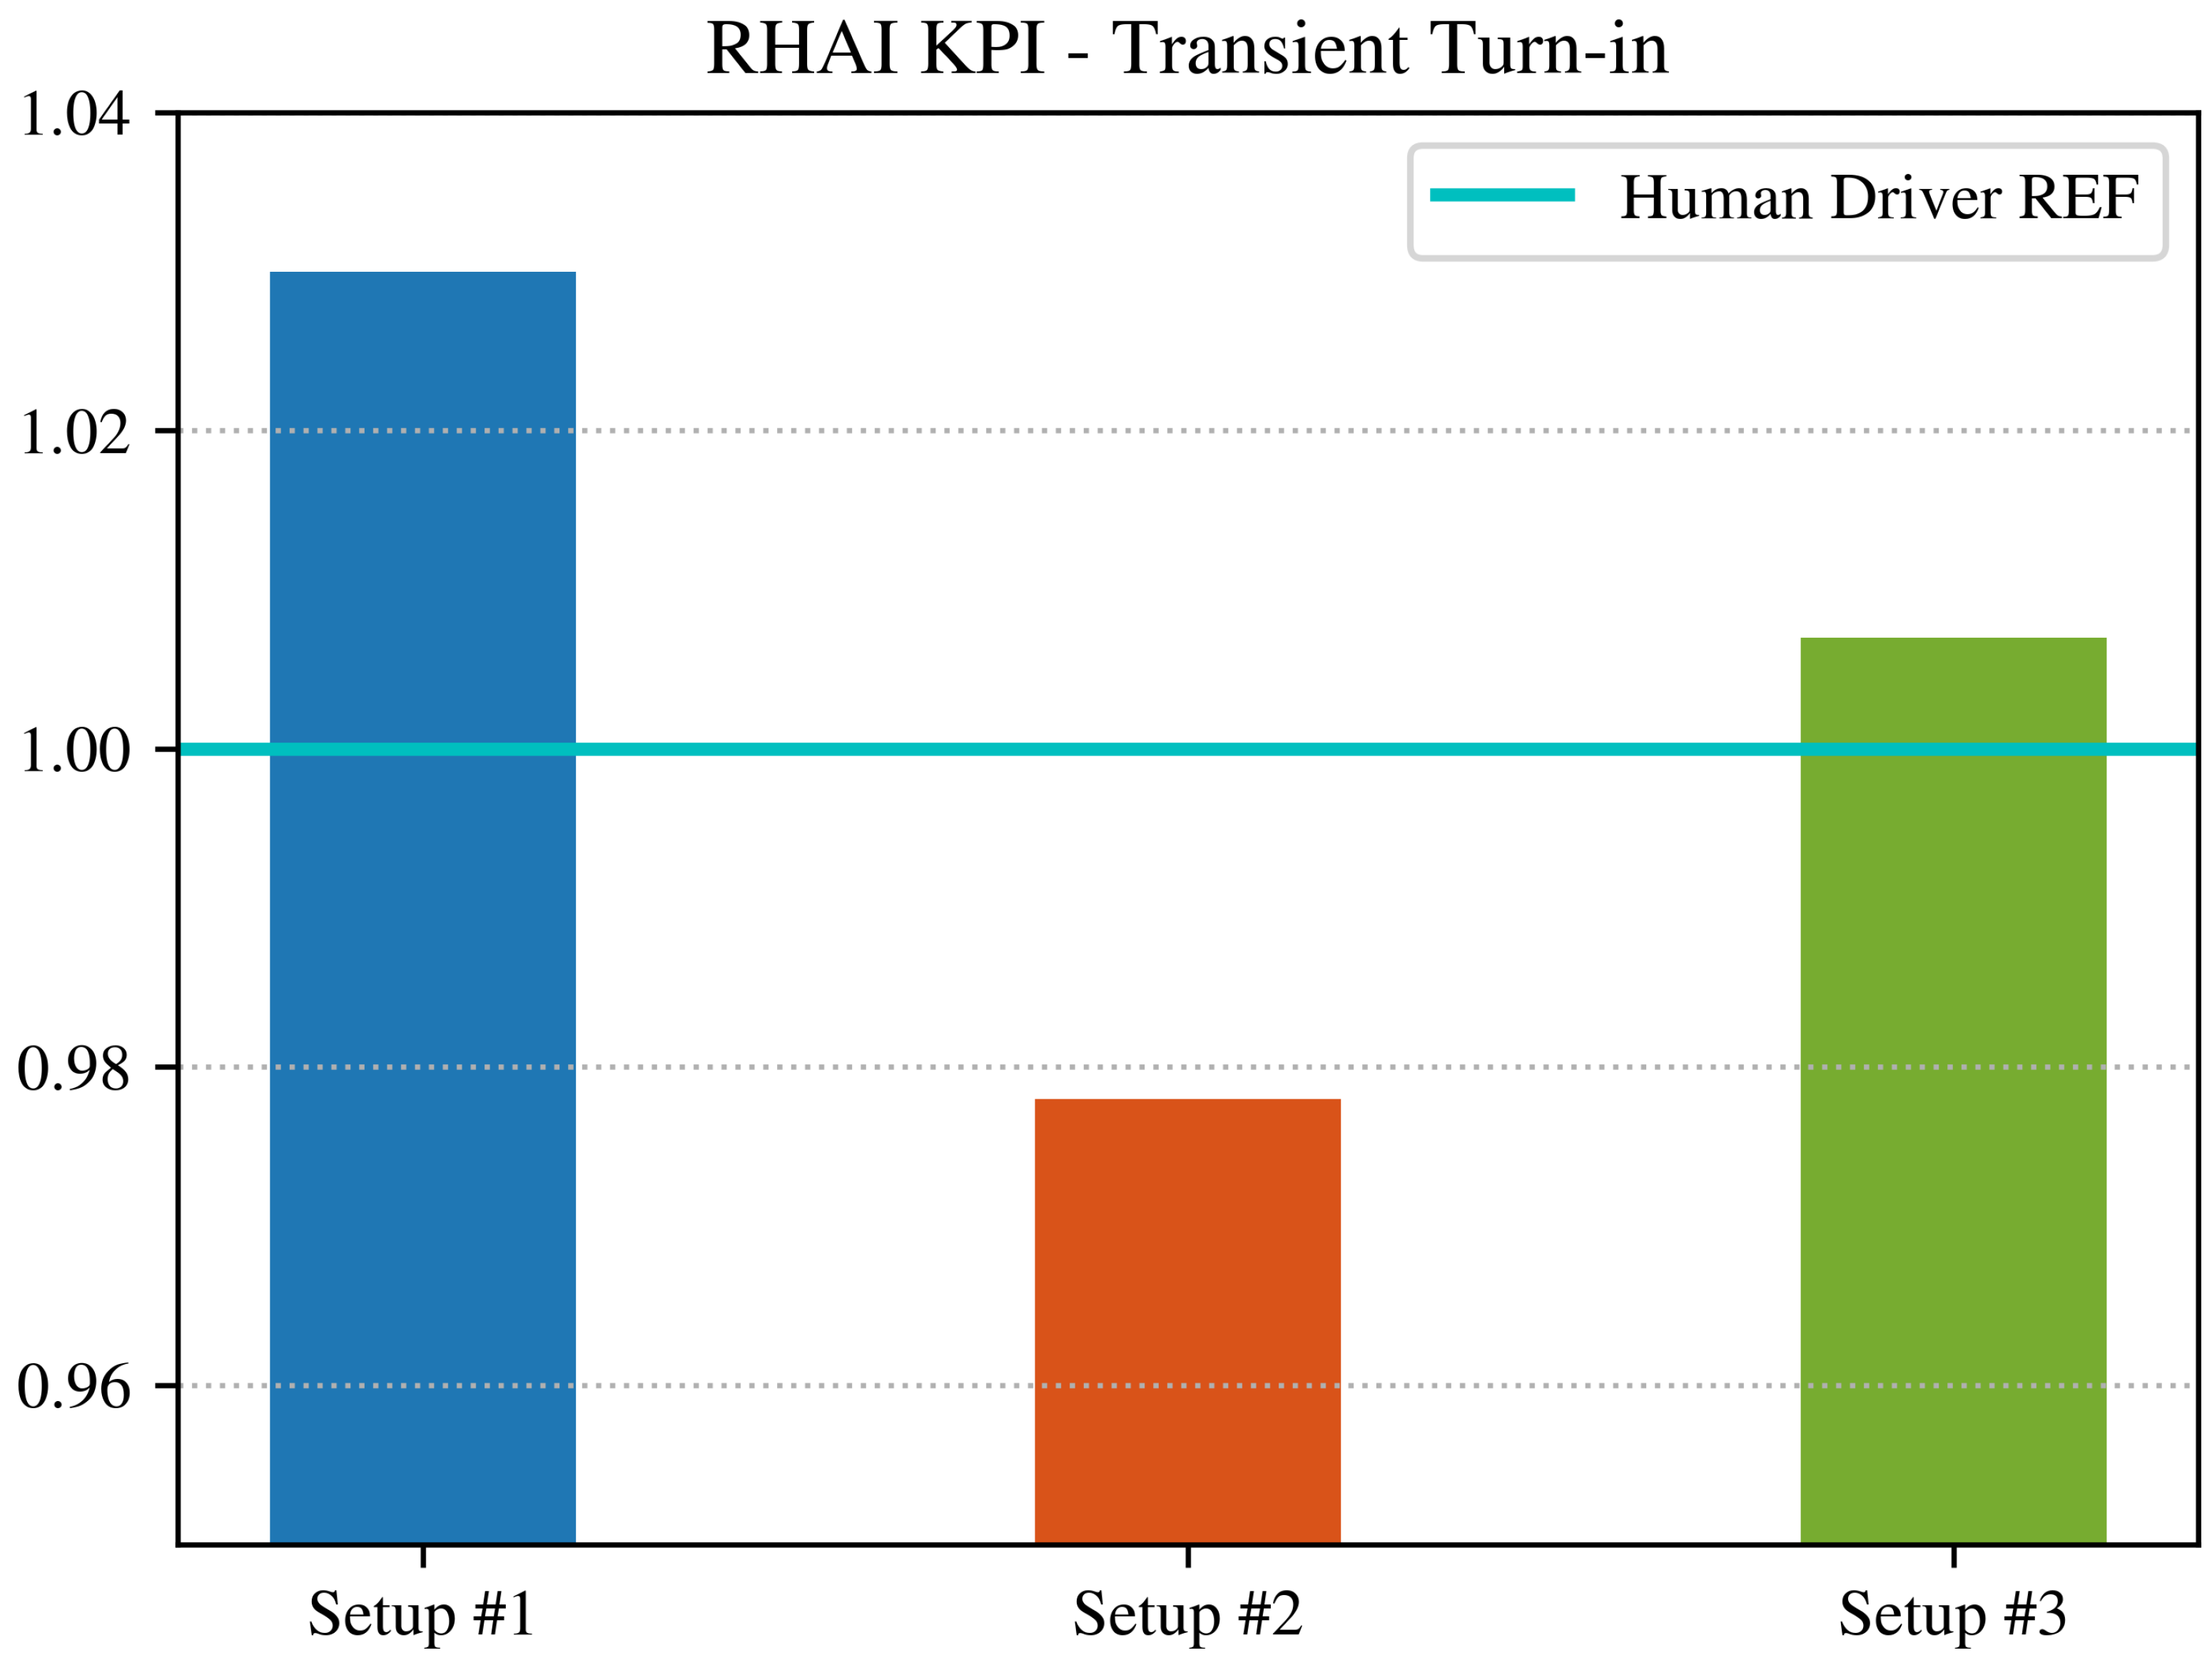
For the Relative-Human Aggressiveness Index (RHAI),
Figure 8 (entry) and
Figure 9 (exit) illustrate the evolution across setups. In the entry phase, RHAI steadily approaches 1.0, demonstrating successful alignment with human behavior. In the exit phase, improvements are smaller but still evident, reducing the discrepancy observed in Setup 1.
For the Smoothness Index (SI),
Figure 10 (entry) and
Figure 11 (exit) highlight significant reductions in oscillations. In the exit phase, SI decreases by more than 50%, bringing the ADAS much closer to the human reference. In the entry phase, Setup 3 even achieves a lower SI than the human driver, implying an exceptionally clean maneuver.
Signal qualitative comparisons reinforce these findings.
Figure 12 (Setup #1 vs. Setup #2) shows partial improvement in early entry, but persistent oscillations in late entry—consistent with the higher SI recorded. Exit behavior, however, is visibly smoother.
Figure 13 (Setup #1 vs. Setup #3) confirms more uniform progress, with reduced oscillations across the entire maneuver.
Figure 14 (Setup #3 vs. Human) shows strong overlap between the ADAS and the human yaw-rate traces, indicating that the controller has been tuned to reproduce human-like dynamics.
This use case demonstrates that the proposed KPIs are sensitive to transient-phase shortcomings that would remain hidden if only peak homologation metrics were used. Moreover, when integrated into an automated tuning process such as grid search, the KPIs provide concrete guidance for controller refinement, enabling measurable convergence toward human-like performance in both responsiveness and smoothness.
7. Conclusions
This work extends ADAS evaluation beyond steady-state compliance by introducing a human-referenced, transient-oriented KPI framework. Grounded in the UNECE R79 operating envelope, the approach augments homologation checks with three interpretable yaw-rate metrics—the Aggressiveness Index (AI), Relative-Human Aggressiveness Index (RHAI), and Smoothness Index (SI)—that quantify how quickly heading is built, how closely the response matches a human baseline, and how cleanly the maneuver is executed. Using real-time static-simulator trials and a representative curve test, we showed that these indicators reveal oscillations and overshoot not captured by peak metrics and provide actionable signals for tuning: a KPI-guided grid search reduced oscillatory behavior and moved the system toward human-like transients. Because the KPIs are simple to compute and available early (simulation/HiL), they enable faster iteration and traceable, user-centric design choices from the start of development.
Author Contributions
Conceptualization, L.R.; methodology, L.R., A.A. and L.V.; supervision, R.C. and C.A.; writing—review and editing, L.R., R.C. and C.A. All authors have read and agreed to the published version of the manuscript.
Funding
This research received no external funding. The study was developed as part of a joint laboratory project between Meccanica 42, the DINFO Department (Dipartimento di Ingegneria dell’Informazione) and the DIEF Department (Dipartimento di Ingegneria Industriale) at the University of Florence.
Institutional Review Board Statement
Not applicable.
Informed Consent Statement
Not applicable.
Data Availability Statement
Raw data and simulation results supporting the conclusions of this article will be made available by the authors upon request. Regarding the mathematical models used to generate the results, they cannot be shared as they are proprietary to Meccanica 42 S.r.l.
Conflicts of Interest
The authors declare no conflicts of interest.
Abbreviations
The following abbreviations are used in this manuscript:
| QP | Quality Profile |
| KPI | Key Performance Indicator |
| ADAS | Advanced Driver Assistance Systems |
| HiL | Hardware-in-the-loop |
| UNECE | United Nations Economic Commission for Europe |
| AI | Aggressiveness Index |
| RHAI | Relative Human Aggressiveness Index |
| SI | Smoothness Index |
References
- European Climate, Infrastructure and Environment Executive Agency. EU Road Safety: Towards “Vision Zero”; European Climate, Infrastructure and Environment Executive Agency: Brussels, Belgium, 2022. [Google Scholar]
- Aleksa, M.; Schaub, A.; Erdelean, I.; Wittmann, S.; Soteropoulos, A.; Fürdös, A. Impact analysis of Advanced Driver Assistance Systems (ADAS) regarding road safety—Computing reduction potentials. Eur. Transp. Res. Rev. 2024, 16, 39. [Google Scholar] [CrossRef]
- UN Regulation No. 79 Revision 5 | UNECE. Available online: https://unece.org/transport/documents/2023/10/working-documents/un-regulation-no-79-revision-5 (accessed on 5 October 2025).
- Alfatti, F.; Lelli, L.; Annicchiarico, C.; Capitani, R. Tool and Methodology Development for LCA Hardware in the Loop Testing. In 13th International Munich Chassis Symposium 2022; Pfeffer, P., Ed.; Springer: Berlin/Heidelberg, Germany, 2024; pp. 194–202. [Google Scholar] [CrossRef]
- Wei, S.; Pfeffer, P.E.; Edelmann, J. State of the Art: Ongoing Research in Assessment Methods for Lane Keeping Assistance Systems. IEEE Trans. Intell. Veh. 2023, 9, 5853–5875. [Google Scholar] [CrossRef]
- Ronchi, L.; Annicchiarico, C.; Capitani, R. Development, Testing, and Validation of ADAS L2/L3 Systems: A KPI-Based Methodology. Eng. Proc. 2025, 85, 38. [Google Scholar] [CrossRef]
- Bernsteiner, S.; Lindvai-Soos, D.; Holl, R.; Eichberger, A. Subjective Evaluation of Advanced Driver Assistance by Evaluation of Standardized Driving Maneuvers; SAE: New York, NY, USA, 2013; 2013-01-0724. [Google Scholar] [CrossRef]
- Neidlein, D.; Becker, M.; Wrodartschik, S.; Schick, B. KPI-Based Attribute Development of Lane Keeping Assist Systems. In 13th International Munich Chassis Symposium 2022; Pfeffer, P., Ed.; Springer: Berlin/Heidelberg, Germany, 2024; pp. 163–177. [Google Scholar] [CrossRef]
- Bischl, B.; Binder, M.; Lang, M.; Pielok, T.; Richter, J.; Coors, S.; Thomas, J.; Ullmann, T.; Becker, M.; Boulesteix, A.L.; et al. Hyperparameter Optimization: Foundations, Algorithms, Best Practices and Open Challenges. arXiv 2021, arXiv:2107.05847. [Google Scholar] [CrossRef]
- Dangeti, P. Statistics for Machine Learning, 1st ed.; Packt Publishing Limited: Birmingham, UK, 2017. [Google Scholar]
- Raschka, S.; Mirjalili, V. Python Machine Learning: Machine Learning and Deep Learning with Python, Scikit-Learn, and TensorFlow 2, 3rd ed.; Packt Publishing: Birmingham, UK, 2020. [Google Scholar]
| Disclaimer/Publisher’s Note: The statements, opinions and data contained in all publications are solely those of the individual author(s) and contributor(s) and not of MDPI and/or the editor(s). MDPI and/or the editor(s) disclaim responsibility for any injury to people or property resulting from any ideas, methods, instructions or products referred to in the content. |