


Abstract
This research addresses the urgent need to reduce carbon emissions in the footwear manufacturing industry by utilizing digital twin technology with project management frameworks. It focuses on identifying critical emission sources across the entire life cycle of shoe production from (i) material sourcing, (ii) manufacturing, and (iii) transportation, to (iv) end-of-life disposal. By data collection, infusing project management, and integrating digital twin approaches, the study offers a dynamic, data-driven method to simulate, monitor, and optimize carbon reduction strategies in real time. An extensive literature review and industry data analysis informs the assessment of carbon emissions and energy consumption patterns. Based on these insights, a tailored project management approach is followed to analyze the feasibility of the footwear sector to adopt sustainable practices such as renewable energy adoption, eco-friendly material sourcing, and closed-loop production systems. Validation was conducted using plant simulation software to model emissions scenarios and evaluate the effectiveness of proposed interventions. Case studies from leading brands, including Nike, Adidas, and Puma, were examined for Scope 1, 2 and 3, to extract the best practices and strategic insights. The research underscores the importance of combining digital tools with sustainability goals to create an environmentally conscious manufacturing ecosystem, highlights the role of policymakers in incentivizing green practices, and emphasizes collaborative industry efforts to accelerate change. The paper concludes by highlighting that digital twin systems provide effective, scalable solutions for reducing carbon emissions in footwear manufacturing.
1. Introduction
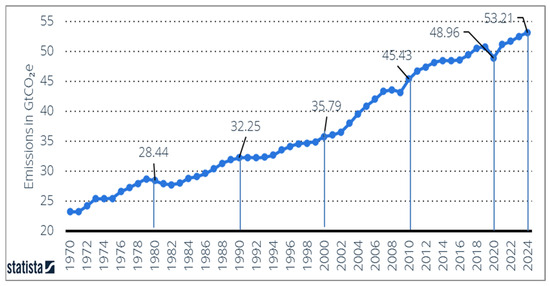
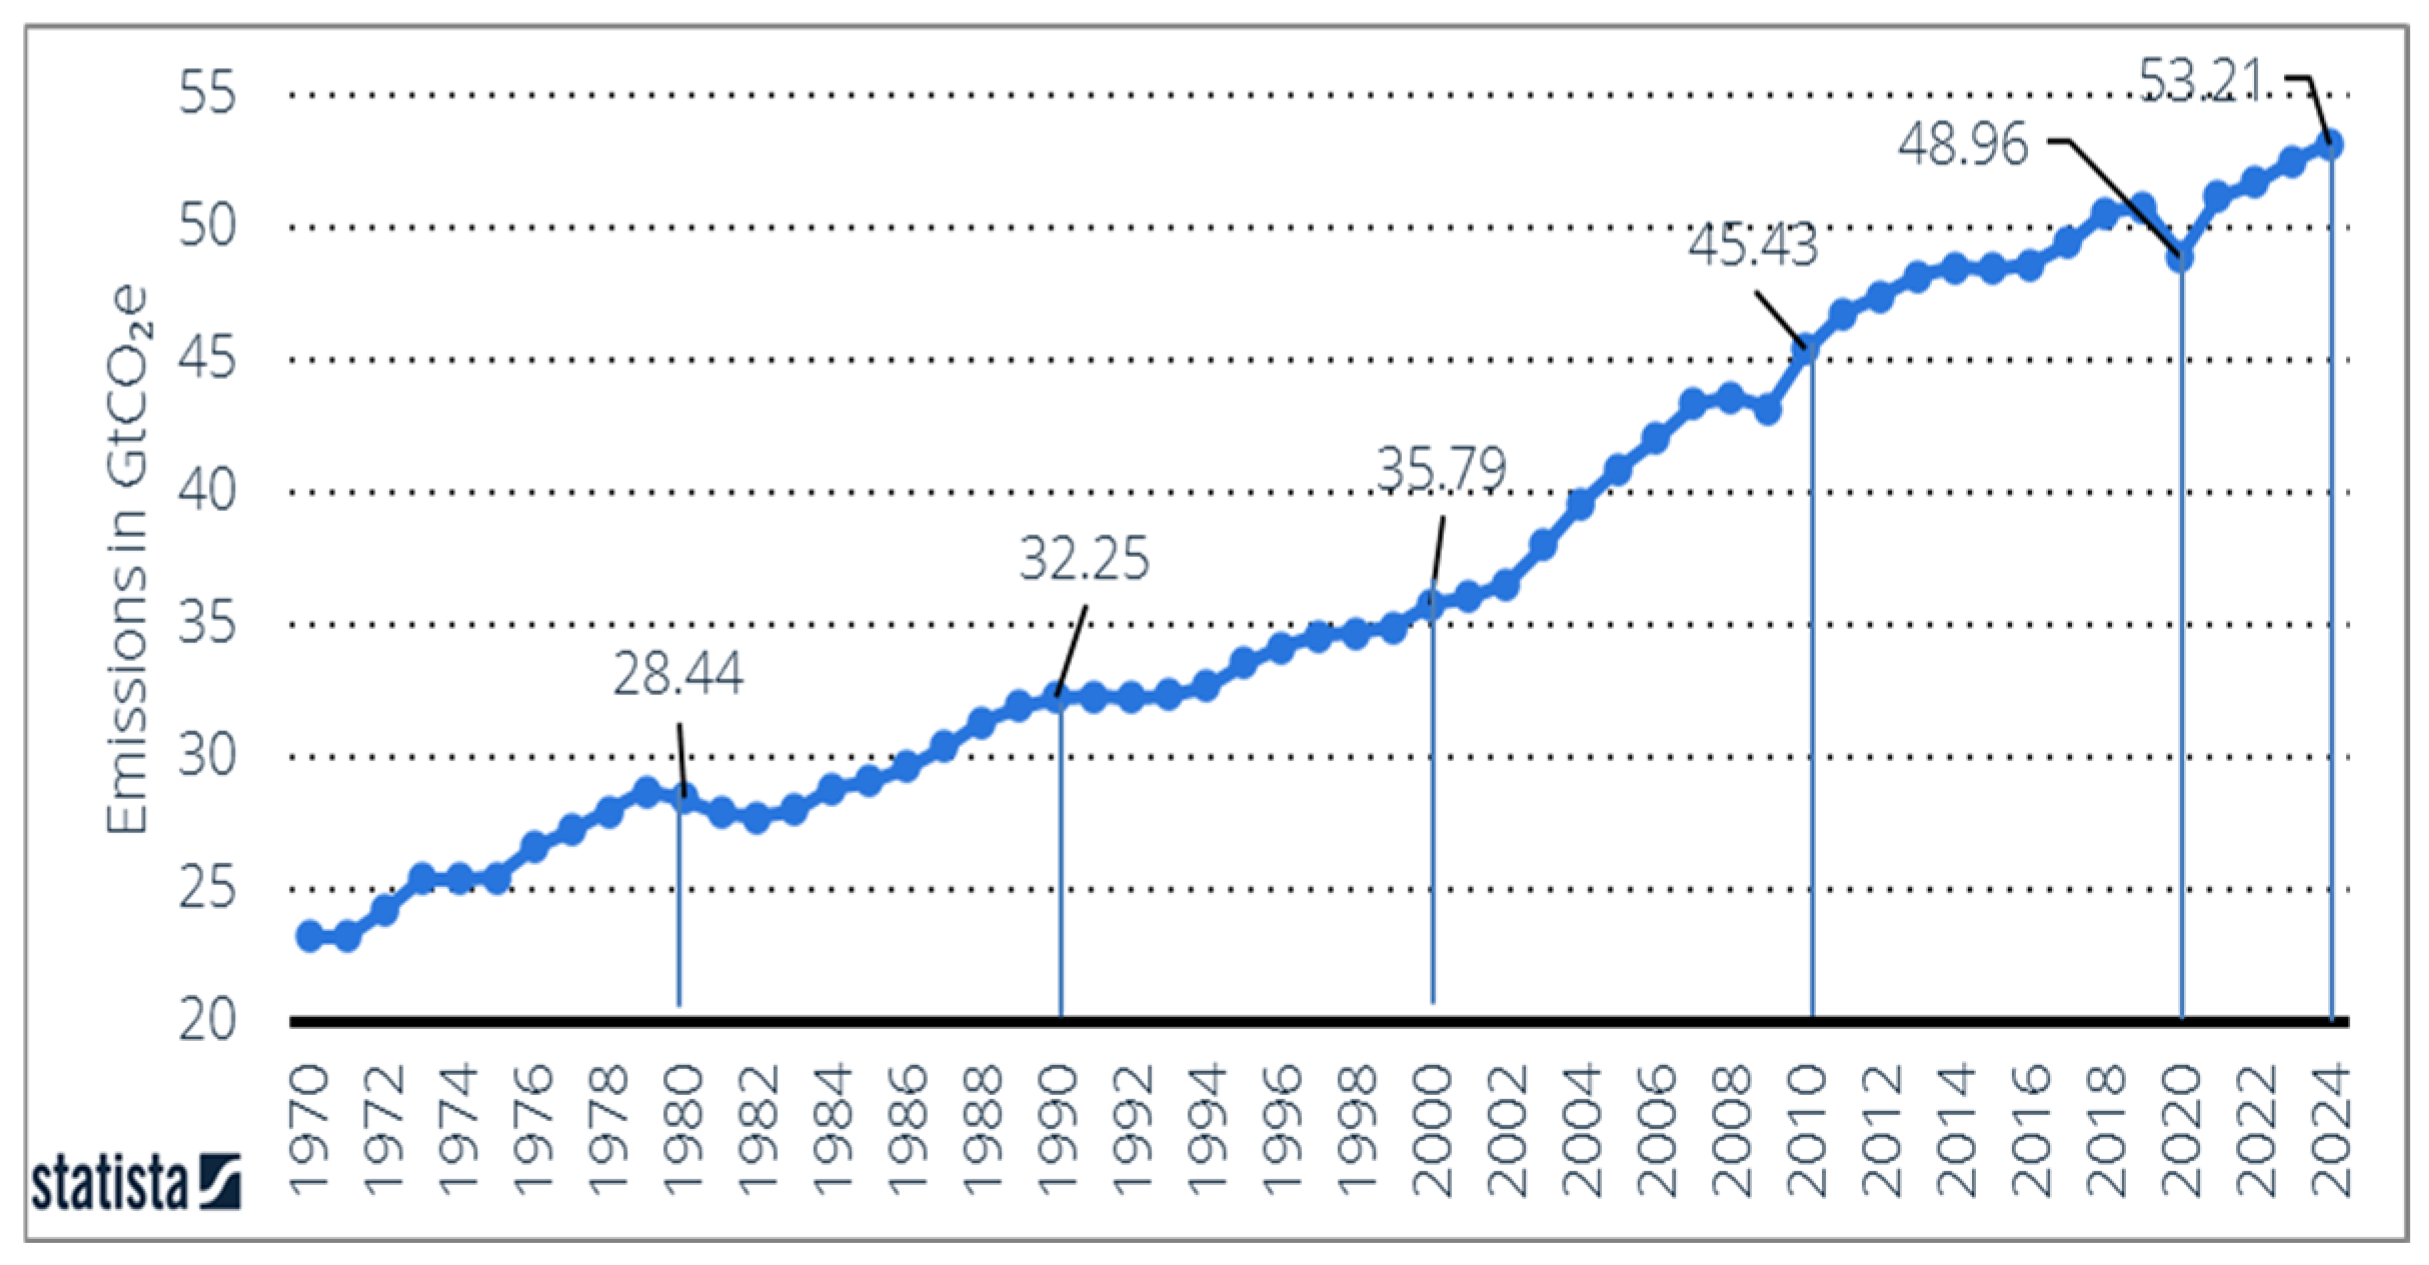
As per Statista [1], in 2024, global greenhouse gas (GHG) emissions (Figure 1) have increased by 1.2% every year, reaching a record high of 53.21 billion metric tons of carbon dioxide equivalent (CO2e), i.e., 53.21 GtCO2e (1 gigatonne (Gt) = 1 billion metric tonnes). When compared with 1990, this accounts for a 64% rise in GHG emissions. It is evident that GHG emissions have risen sharply over the past four decades. In 1980, emissions were around 27–28 GtCO2e, increasing to 32–33 GtCO2e, by 1990. The early 2000s marked a significant surge, reaching 35–36 GtCO2e, driven by industrial growth and energy demand. By 2010, emissions climbed to approximately 45 GtCO2e, and, despite a temporary dip during the COVID-19 pandemic, levels rebounded to about 48 GtCO2e in 2020. Recent estimates show continued growth, with 2024 emissions exceeding 53 GtCO2e, reflecting the persistent reliance on fossil fuels and rising energy consumption globally. This trajectory underscores the urgent need for aggressive mitigation strategies to meet climate targets. Based on the World Economic Forum (WEF) (2025) [2] and National Bureau of Economic Research (NBER) [3], data climate change costs a loss of 12% to the world’s gross domestic product (GDP) for every 1 °C of global warming owing to increases in GtCO2e. The WEF also highlights that the “social cost of carbon” cost is around $1056 per metric ton of CO2 emissions and is much higher than previous estimates (2023), which range between $51 and $190 per metric ton (the 2023 global CO2 emissions were 37.55 billion metric tons).
Figure 1.
Global GHG emissions 1990–2024 (source: STATISTA, 2024 [1]).
These CO2 emissions and climate change could cost the global economy an estimated US$178 trillion over the next 50 years if left unchecked, as a report from the Deloitte Center for Sustainable Progress (DCSP) released in the WEF states (2022) [4]. This has placed immense pressure on all industrial sectors to adopt more sustainable practices to reduce CO2 emissions. In general, the footwear industry, with its energy-intensive production processes and consumption of non-renewable resources, is a significant contributor to this global challenge and faces a critical need to mitigate its carbon footprint. As consumers’ awareness of environmental issues grow, the demand for sustainable and eco-friendly footwear manufacturing is rising, compelling manufacturers to re-evaluate their entire value chain. Examining everything from material sourcing and production to transportation and distribution requires a comprehensive approach, in order to critically identify key areas where carbon emissions can be effectively minimized.
This research proposes one solution through integrating digital twin (DT) technology into project management, offering powerful, data-driven solution to this complex problem. By creating a dynamic virtual model that mirrors physical manufacturing systems, companies can simulate, monitor, and optimize their production processes in real time. The present work validates this approach through a Siemens Plant Simulation case study and an analysis of strategies from industry leaders. The major aim of this research is to provide a practical DT framework that empowers footwear manufacturers to implement effective, targeted measures to reduce their carbon footprint and move towards a more environmentally, responsible future.
1.1. Literature Review
Early studies in the footwear sector [5] established the use of the Life Cycle Assessment (LCA), defining a functional unit of “one year of standard use” for consistent analysis. This approach was later expanded to examine the entire value chain, identifying manufacturing and tanning as primary environmental hotspots [6]. The environmental cost was subsequently quantified, with the carbon footprint of a standard pair of running shoes estimated at approximately 14 kg of CO2 equivalent, where material processing and manufacturing accounted for over 90% of the total emissions [7]. Efforts to mitigate this impact have focused on both process-level improvements and systemic changes. The importance of a circular economy was emphasized, highlighting product design strategies that enable disassembly and recycling to support a closed-loop system [8]. To align sustainability with operations, carbon footprint metrics were integrated into project scheduling, allowing for the simultaneous optimization of cost and environmental impact [9].
From a broader perspective, the concept of the digital twin presents a promising pathway for such optimization. The integration of digital twins enables the creation of cyber–physical production systems capable of real-time monitoring and data-driven decision making [10]. This concept evolved into the “Digital Twin Shop Floor (DTS),” a paradigm where virtual factory models facilitate the seamless interaction between physical and digital assets [11]. Its core function is to support operational decisions through predictive monitoring and historical performance tracking [12]. In digital twins, simulation remains the foundational technology, where real-time data exchange frameworks between virtual and physical models are essential [13]. This integration offers a comprehensive view of systems, enabling simulation across disciplines and throughout the product’s life cycle [14]. A recent case study demonstrated how simulation allows companies to test multiple scenarios virtually, significantly accelerating optimization and enhancing the quality of operational decisions [15].
From an industrial perspective, at present, leading brands have already begun implementing climate strategies. Nike [16] has set an ambitious target to achieve a 70% absolute reduction in GHG emissions in its owned or operated facilities by 2025, primarily by transitioning to 100% renewable electricity and electrifying its vehicle fleet. The company actively collaborates with its partners through a Supplier Climate Action Program (SCAP) to build climate capabilities and is committed to eliminating coal from its supply chain by 2030. It also focuses on circular economy initiatives, including product refurbishment and takeback programs to extend product life. Adidas [17] is guided by a clear roadmap toward climate neutrality, aiming for this in its own operations by 2025 and across its entire value chain by 2050. A cornerstone of their strategy is the increased use of sustainable materials; for example, the company is on track to use 100% recycled polyester in its products. It engages its partners through the “Adidas Decarbonization Manifesto,” which sets clear expectations for suppliers, and incentivizes high-performing partners. The company also has a comprehensive chemical management program, working with the Zero Discharge of Hazardous Chemicals (ZDHC) Foundation to eliminate hazardous substances from its supply chain. Puma [18] has implemented science-based CO2 emission targets to reduce greenhouse gases from both its own entities and its supply chain. The company’s strategy involves extensive supplier engagement, including training programs focused on cleaner production and the adoption of renewable energy. Demonstrating a deep commitment, climate-related targets are integrated into the performance bonuses for Puma’s global leadership team. Puma also actively collaborates with global initiatives like the UN-convened Fashion Industry Charter for Climate Action to work towards a net-zero goal by 2050 [18].
Building on the reviewed literature, this study establishes a solid foundation for applying simulation-validated digital twin frameworks to reduce carbon emissions in footwear manufacturing. It explores how digital twin-enabled project management can align sustainability strategies with advanced simulation and life cycle optimization. Although real-time data collection via IoT-linked sensors is planned for future implementation, the data used in this study is authentic and serves as a valid basis for digital twin modeling. The paper is structured as follows: Section 2 outlines materials and methods, including carbon footprint scopes (2.1), calculation (2.2), and data collection (2.3); Section 3 presents analysis and implementation, focusing on industry GHG emissions (3.1), reduction strategies by industries (3.2), digital twin deployment (3.3), and energy and carbon footprint analysis (3.4); and Section 4 concludes the study and offers key recommendations.
1.2. Research Gap and Novelty
This research addresses a gap in applying digital twin technology, specifically in relation to footwear manufacturing-related carbon reduction. While prior studies have explored LCA frameworks [5,6,7] and digital twins in generic manufacturing [10,11], none have demonstrated a simulation-validated, sector-specific approach tailored to footwear. The existing literature highlights environmental hotspots in tanning and manufacturing and emphasizes circular design [8] and sustainability-linked scheduling [9] but lacks the practical integration of digital twins for measurable carbon reduction in this domain. This study is the first to demonstrate sector-specific simulation-validated carbon reduction (34.5% per-unit intensity improvement) through process optimization in shoe manufacturing. The novelty lies in three aspects: (1) quantifying carbon benefits of bottleneck elimination using Tecnomatix-based energy analysis validated against ISO 14067:2018 standards; (2) demonstrating that 95.7% throughput improvement simultaneously reduces per-unit emissions, decoupling production growth from carbon growth; and (3) contextualizing manufacturing optimization within industry-wide benchmarked emission [16,17,18,19] data. This practical, simulation-first approach provides a replicable framework for manufacturers seeking scalable decarbonization under the Science-Based Targets initiative (SBTi) net-zero targets.
2. Materials and Methods
2.1. Carbon Footprint Scopes
Carbon footprint refers to the total greenhouse gas (GHG) emissions produced directly and indirectly by an entity, event, or product over its life cycle, measured in carbon dioxide equivalents (CO2e). To ensure accurate accounting, these emissions are categorized into three distinct scopes. (i) Scope 1 covers direct emissions from sources that are owned or controlled by a company, such as the fuel combusted in on-site factory boilers or in a fleet of delivery vehicles. (ii) Scope 2 includes indirect emissions from the generation of purchased energy, primarily the electricity used to power manufacturing facilities and offices. (iii) Scope 3 is the most extensive category, encompassing all other indirect emissions that occur in a company’s value chain, from the extraction of raw materials and employee commuting to the transportation of finished goods [20] and the product’s end-of-life treatment. The impact of a high carbon footprint is severe and wide ranging. Carbon emissions are the primary driver of climate change, contributing to a measurable rise in global temperatures of approximately 1.8 °F (1 °C) between 1901 and 2020, and the accelerated rate of sea level rise observed since 1993. These fundamental changes lead to a cascade of devastating effects, including (i) an increase in extreme weather events, (ii) the acidification of oceans which destroys coral reefs and harms marine life, and (iii) the rapid melting of glaciers and polar ice, which further disrupts the Earth’s delicate climate systems.
2.2. Carbon Footprint Calculation
Along with the last section explaining the scopes of carbon footprint, it is necessary to illustrate the practical application of GHG accounting in the footwear supply chain. This section provides a sample calculation first for shipment from Bangalore (BLR) airport to Birmingham (BHX) airport and then for a hypothetical company, “SoleStyle Inc.”
2.2.1. Air Cargo Emission Calculation: BLR → BHX
A sample calculation (Table 1) is shown below for the shipment of 1.0 tons of material from Bangalore (BLR) airport to Birmingham (BHX) airport. The calculations are based on data from Freightos [21] and follow the EN 16258:2012 standard (European Committee for Standardization, 2012; [22])
Table 1.
Calculation.
Assumptions: The default Environmental Weighting (Ew) value of 6.286 MJ/L per ton-kilometer for air is calculated by dividing the average Well-to-Wheels emissions for a jet fuel (mass equivalent) value of 87.5 gCO2/MJ [23] and dividing by the average WtW emissions for jet fuel (energy equivalent) produced conventionally, with a value of 0.550 kgCO2e/L. The default global warming (Gw) value of 0.550 kgCO2e/L per ton-kilometer for air cargo is obtained from the List of Emissions report [24], under the Freight Transport section. The default Energy-Related Emissions per Transport Unit (Et) value of 4.910 MJ/L per ton-kilometer for air is calculated by averaging the Long-Term Average Freight (LTA-F) and Latest Quarter Freight (LQ-F) values of aircraft fuel consumption intensity using the petroleum jet fuel table from the Argonne National Laboratory [25]. The default Gt value of 0.431 kgCO2e/L per ton-km for air cargo is obtained from the List of Emissions report [24].
Overall estimated carbon emissions:
(Step 1.3) Ew—Well-to-Wheels energy consumption: 51,858.37 MJ—Energy consumed across the entire fuel life cycle (extraction, refining, transport, and use); Gw—Well-to-Wheels GHG emissions: (Step 1.4) 4537.40 kgCO2e (emissions from fuel production, transport, and combustion), expressed in kgCO2e; (Step 1.5) Et—Tank-to-Wheels energy consumption: 40,506.62 MJ (energy consumed during flight only/operational phase (aircraft engines); and (Step 1.6) Gt—Tank-to-Wheels GHG emissions: 3555.67 kgCO2e (emissions from fuel combustion during flight). These four results have been established according to EN 16258:2012 (European Committee for Standardization, 2012) [22]. The methodology aligns with the principles of the EN ISO 14083:2023 standard [20], which prioritizes the use of primary, fuel-based data for accuracy. This calculation focuses exclusively on the transportation and logistics emissions (Scope 3) associated with a single shipment.
2.2.2. Scenario: Hypothetical Company—SoleStyle Inc. Shipment (Table 2)
Product: 10,000 pairs of athletic shoes. Total Weight: 5000 kg.
Transport Chain:
Leg 1 (Inbound): Raw materials (leather and rubber) are moved from a supplier (City A) to the manufacturing plant (City B). Leg 2 (Outbound): The finished shoes are transported from the plant (City B) to a central distribution center (City C). Leg 3 (Last Mile): The shipment is delivered from the distribution center (City C) to a retail store (City D).
Step 1: Data Collection (Primary Data): The initial step involves collecting actual fuel and energy consumption data for each segment of the transport chain.
Step 2: Emission Factors: Standardized emission factors from recognized sources (e.g., the Intergovernmental Panel on Climate Change (IPCC), United States Environmental Protection Agency (EPA), and European Environment Agency (EEA)) are used to convert energy consumption into greenhouse gas emissions, measured in kilograms of CO2 equivalent (kgCO2e). Diesel Emission Factor: 2.68 kgCO2e/L. Electricity Emission Factor: 0.233 kgCO2e/kWh.
Table 2.
Sample data of transportation of SoleStyle Inc.
Step 3: GHG Emissions Calculation: The core calculation used the following formulae. GHG Emissions = Fuel/Energy Consumed × Emission Factor. Inbound Leg (Diesel): 40 L × 2.68 kgCO2e/L = 107.2 kgCO2e. Outbound Leg (Diesel): 150 L × 2.68 kgCO2e/L = 402.0 kgCO2e. Last Mile Leg (Electric): 10 kWh × 0.233 kgCO2e/kWh = 2.33 kgCO2e.
Step 4: Total Emissions and Allocation: The emissions from each leg are summed to determine the total for the transport chain; total GHG emissions: 107.2 + 402.0 + 2.33 = 511.53 kgCO2e. To derive meaningful metrics for reporting and analysis, the total emissions are allocated per unit. Emissions per Pair of Shoes: 511.53 kgCO2e/10,000 pairs = 0.051 kgCO2e per pair. Emissions per Kilogram of Product: 511.53 kgCO2e/5000 kg = 0.102 kgCO2e per kg. This detailed, fuel-based calculation provides an accurate and verifiable measure of the transport-related carbon footprint for the shipment, fulfilling the core requirements of the EN ISO 14083:2023 standard [20].
2.3. Data Collection and Analysis
To analyze shoe manufacturing, it is essential to understand its basic process. While the exact steps may vary depending on the shoe’s style or type, most shoes follow five key stages: (i) design—creating the shoe’s shape using a “last” and designing both the left and right versions; (ii) cutting—using steel dies to cut materials, with each shoe part and size requiring a specific die; (iii) stitching—assembling the upper parts of the shoe; (iv) lasting and assembly—shaping the upper around the last and attaching the outsole, often with a mounting machine; and (v) finishing—adding final touches such as laces or polishing. Although the full process can involve 70 to 300 steps depending on the shoe type, many tasks are now automated using specialized machinery. To assess the industry’s carbon footprint, secondary data was collected from the 2024 sustainability reports of Nike [16], Adidas [17], Puma [18], and Frasers Group [19], offering insights into emission sources and reduction efforts.
3. Analysis and Implementation
3.1. Industry GHG Emissions Analysis
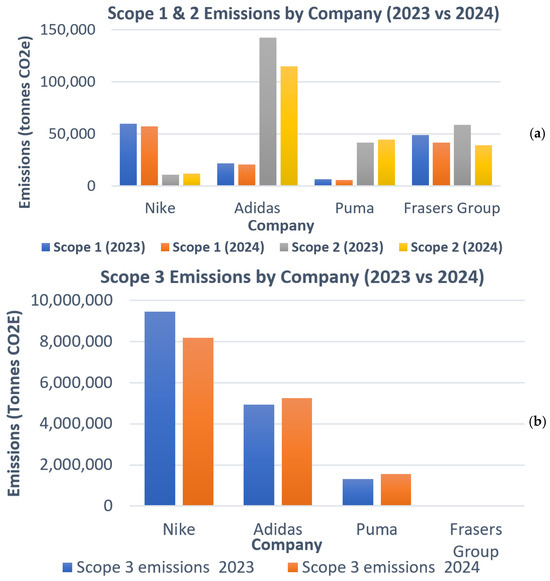
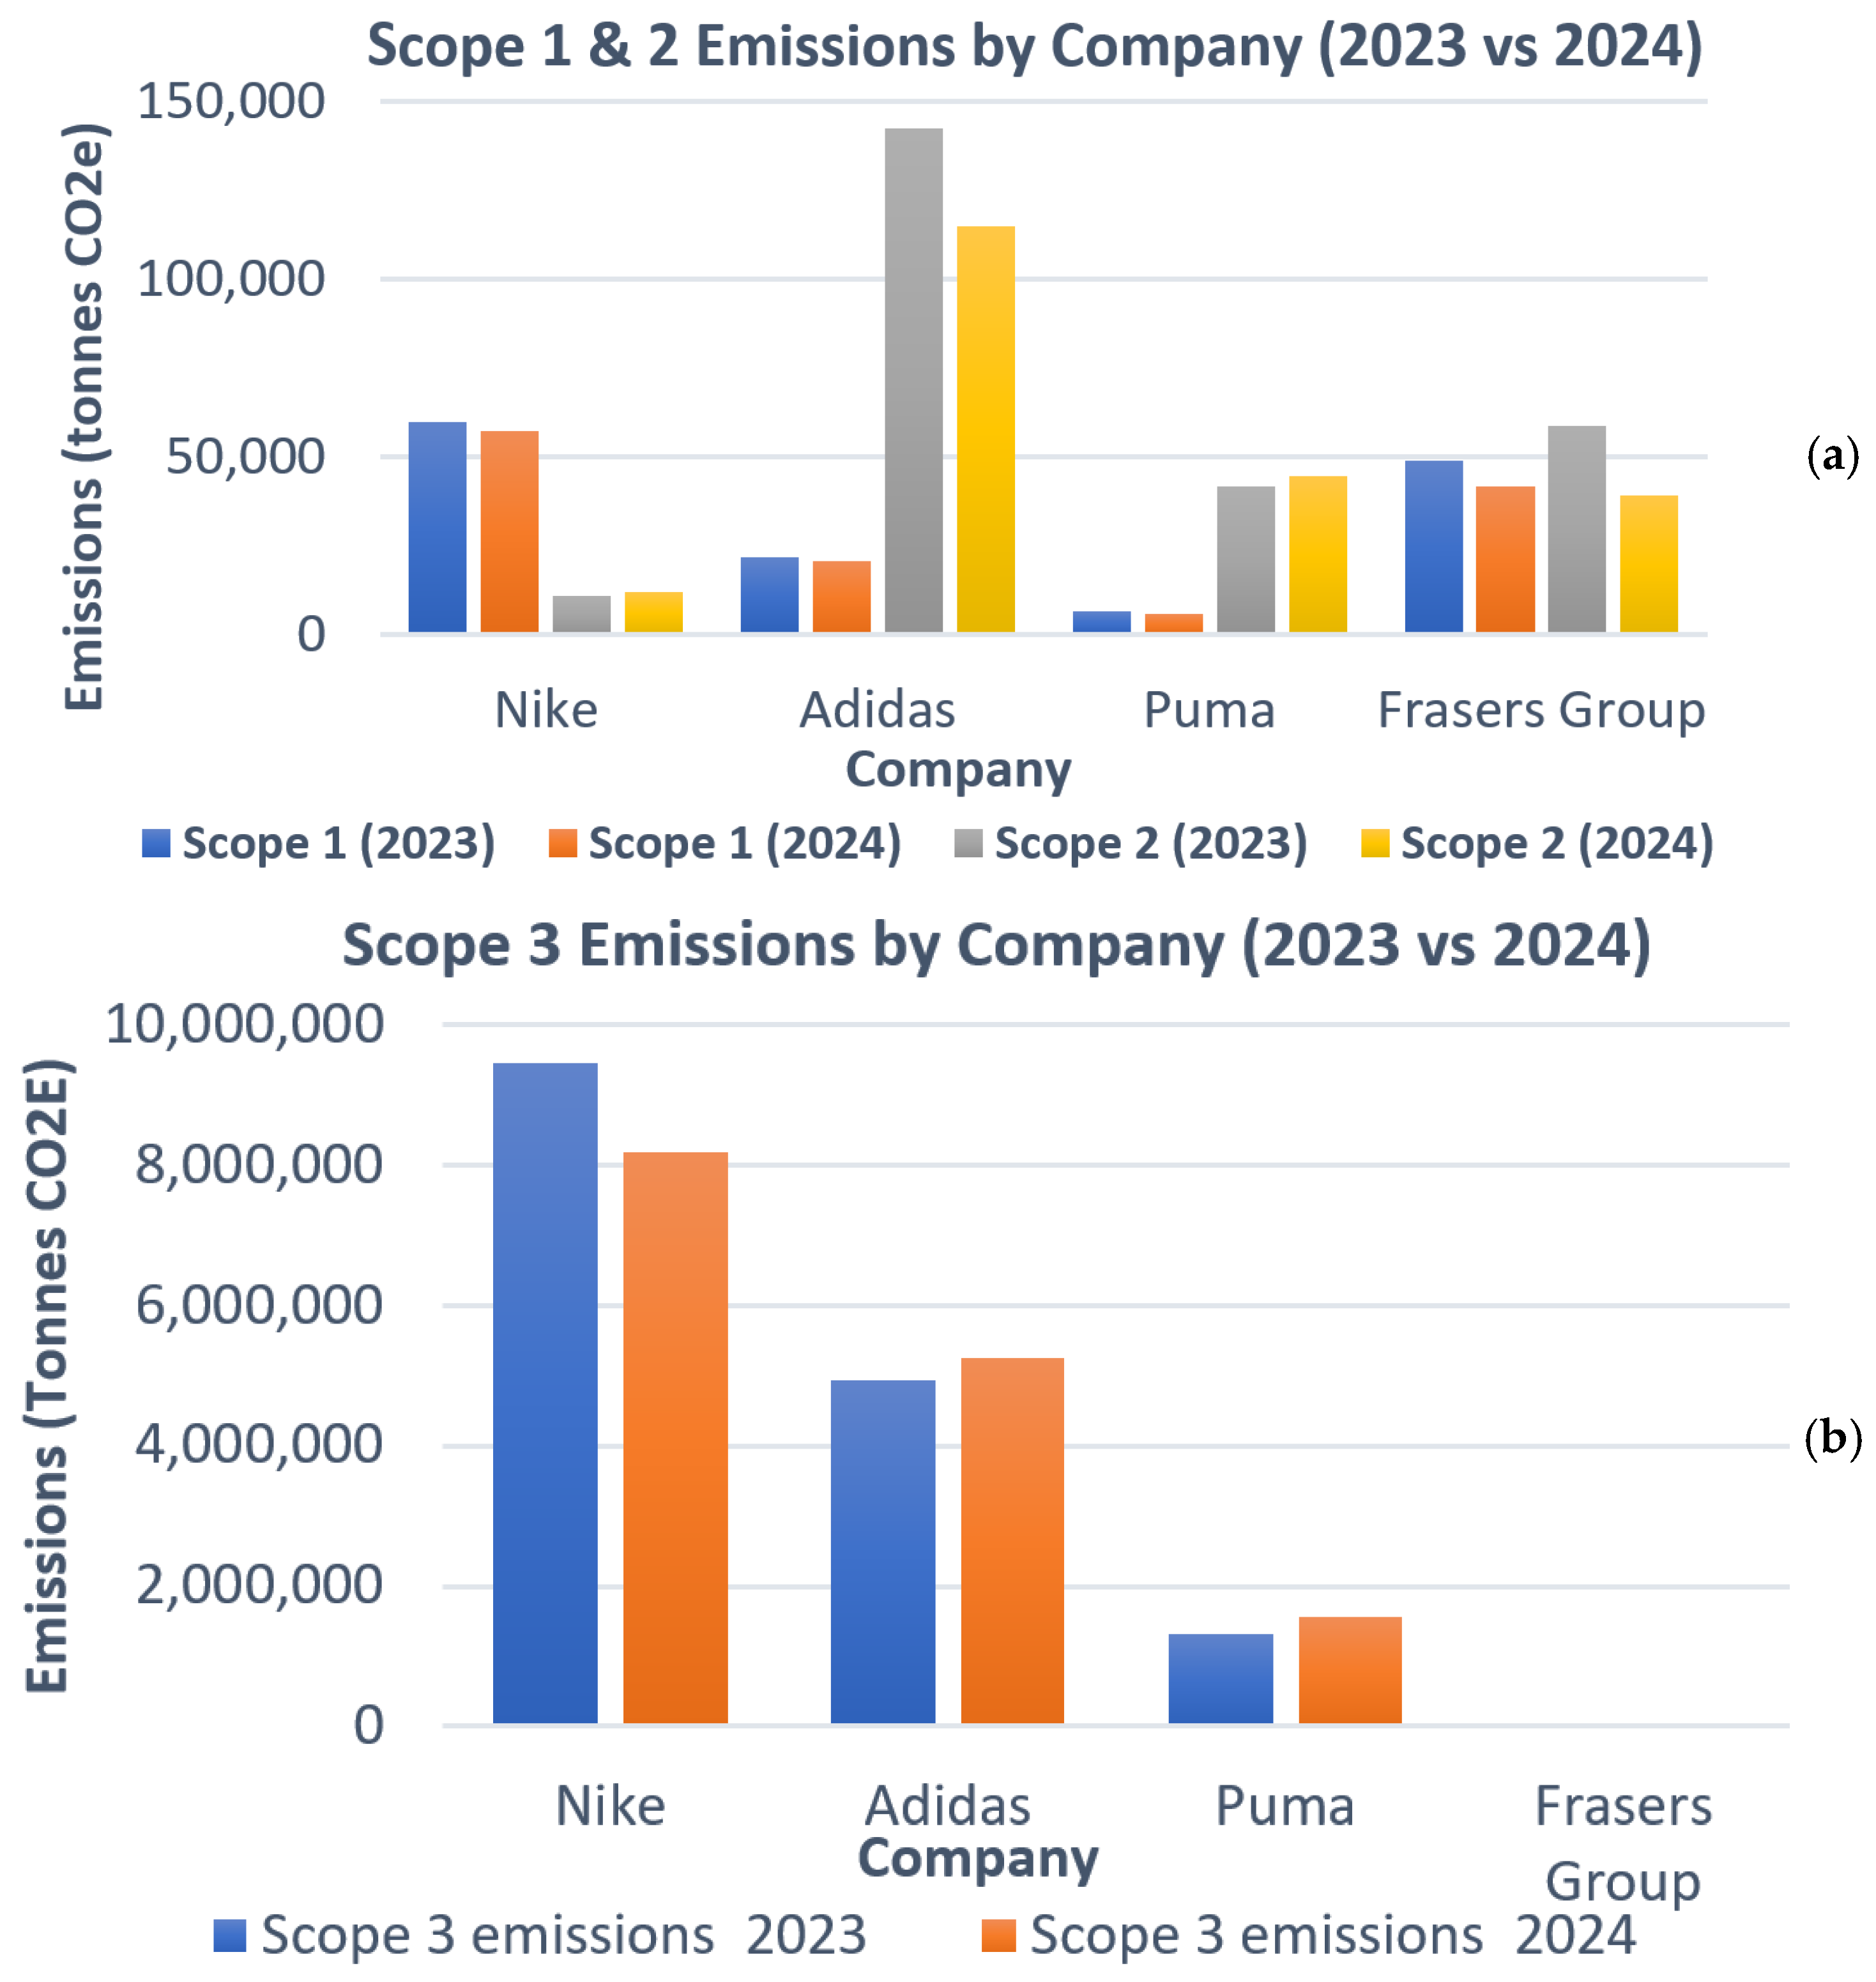
The collected data on greenhouse gas (GHG) emissions is presented in Table 3 and the associated bar charts are given in Figure 2a,b. The data shows notable variations in greenhouse gas emissions across Scopes 1, 2, and 3 for Nike [16], Adidas [17], Puma [18], and Frasers Group [19] between 2023 and 2024. These figures highlight that while operational and electricity-related emissions are improving for most brands, supply chain emissions often exceeding millions of tons pose the greatest challenge to achieving net-zero goals. These findings also underscore the urgent need for manufacturers to adopt a comprehensive approach, addressing emissions beyond their direct operational control.
Table 3.
GHG emissions of Nike, Adidas, Puma and Frasers Group (in tons CO2e) (source: [16,17,18]).
Figure 2.
Bar charts for (a) Scope 1 and 2 emissions by company and (b) Scope 3 emissions by company.
3.2. Carbon Reduction Strategies Adopted by Industries
Nike [16] reduced emissions in its owned facilities by 69% from FY2020, supported by 96% renewable electricity. The supplier emissions dropped 36%, and 48% of materials were environmentally preferred, cutting 1.1 million metric tons of CO2e. The waste per unit fell 11%, with 98% diverted from landfill. Nike also restored 6.9 billion L of water and adopted clean chemistry for key chemicals, aiming for net zero by 2050. Adidas [17] cut Scope 1 and 2 emissions by 17%, Scope 3 by 20%, and carbon intensity by 5.3%. It has reached 99% recycled polyester, sources sustainable cotton, and audits 99% of leather. Coal boilers are being phased out, rooftop solar has doubled, and suppliers secured 25,000 MWh of renewable energy. Circularity and chemistry improvements align with its net-zero goals. Puma [18] achieved 90% product sustainability using recycled polyester and cotton, and launched RE:FIBRE recycling. It has cut 86% of its operational emissions, reduced its supply chain emissions by 17%, and runs on 100% renewable electricity. Its airfreight use stayed below 1%, and waste per footwear pair dropped 87.8%. Puma continues investing in circularity and safe chemistry. From the data, it is evident that leading footwear brands have adopted multi-faceted strategies to reduce their carbon footprint, focusing on sustainable materials, supply chain decarbonization, and circular economy practices.
3.3. Digital Twin Deployment: Insights from a Case Study
While leading footwear brands focus on sustainable materials and supply chain decarbonization, production efficiency remains a critical lever for reducing energy consumption and associated carbon emissions. To explore this dimension, a digital twin-based case study was conducted using the Tecnomatix Plant Simulation (version 2504). This approach enables the creation of a dynamic virtual model of a shoe manufacturing line to analyze material flow, identify bottlenecks, and test improvement scenarios in a risk-free environment. The initial layout was simulated for an 8 h shift to establish the baseline throughput, resource utilization, and energy impact. Based on the initial results, a targeted modification was made to the virtual model, and the simulation was run again to quantify the impact of the change. The next two sections provide details on how this is implemented.
3.3.1. Current Layout Analysis
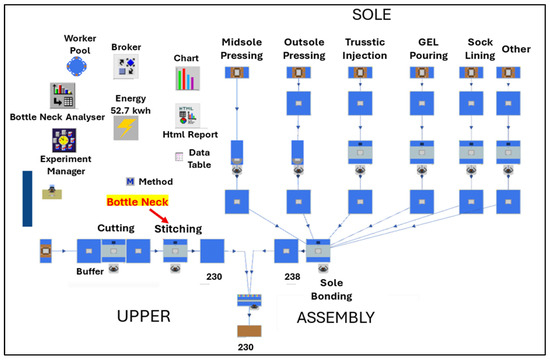
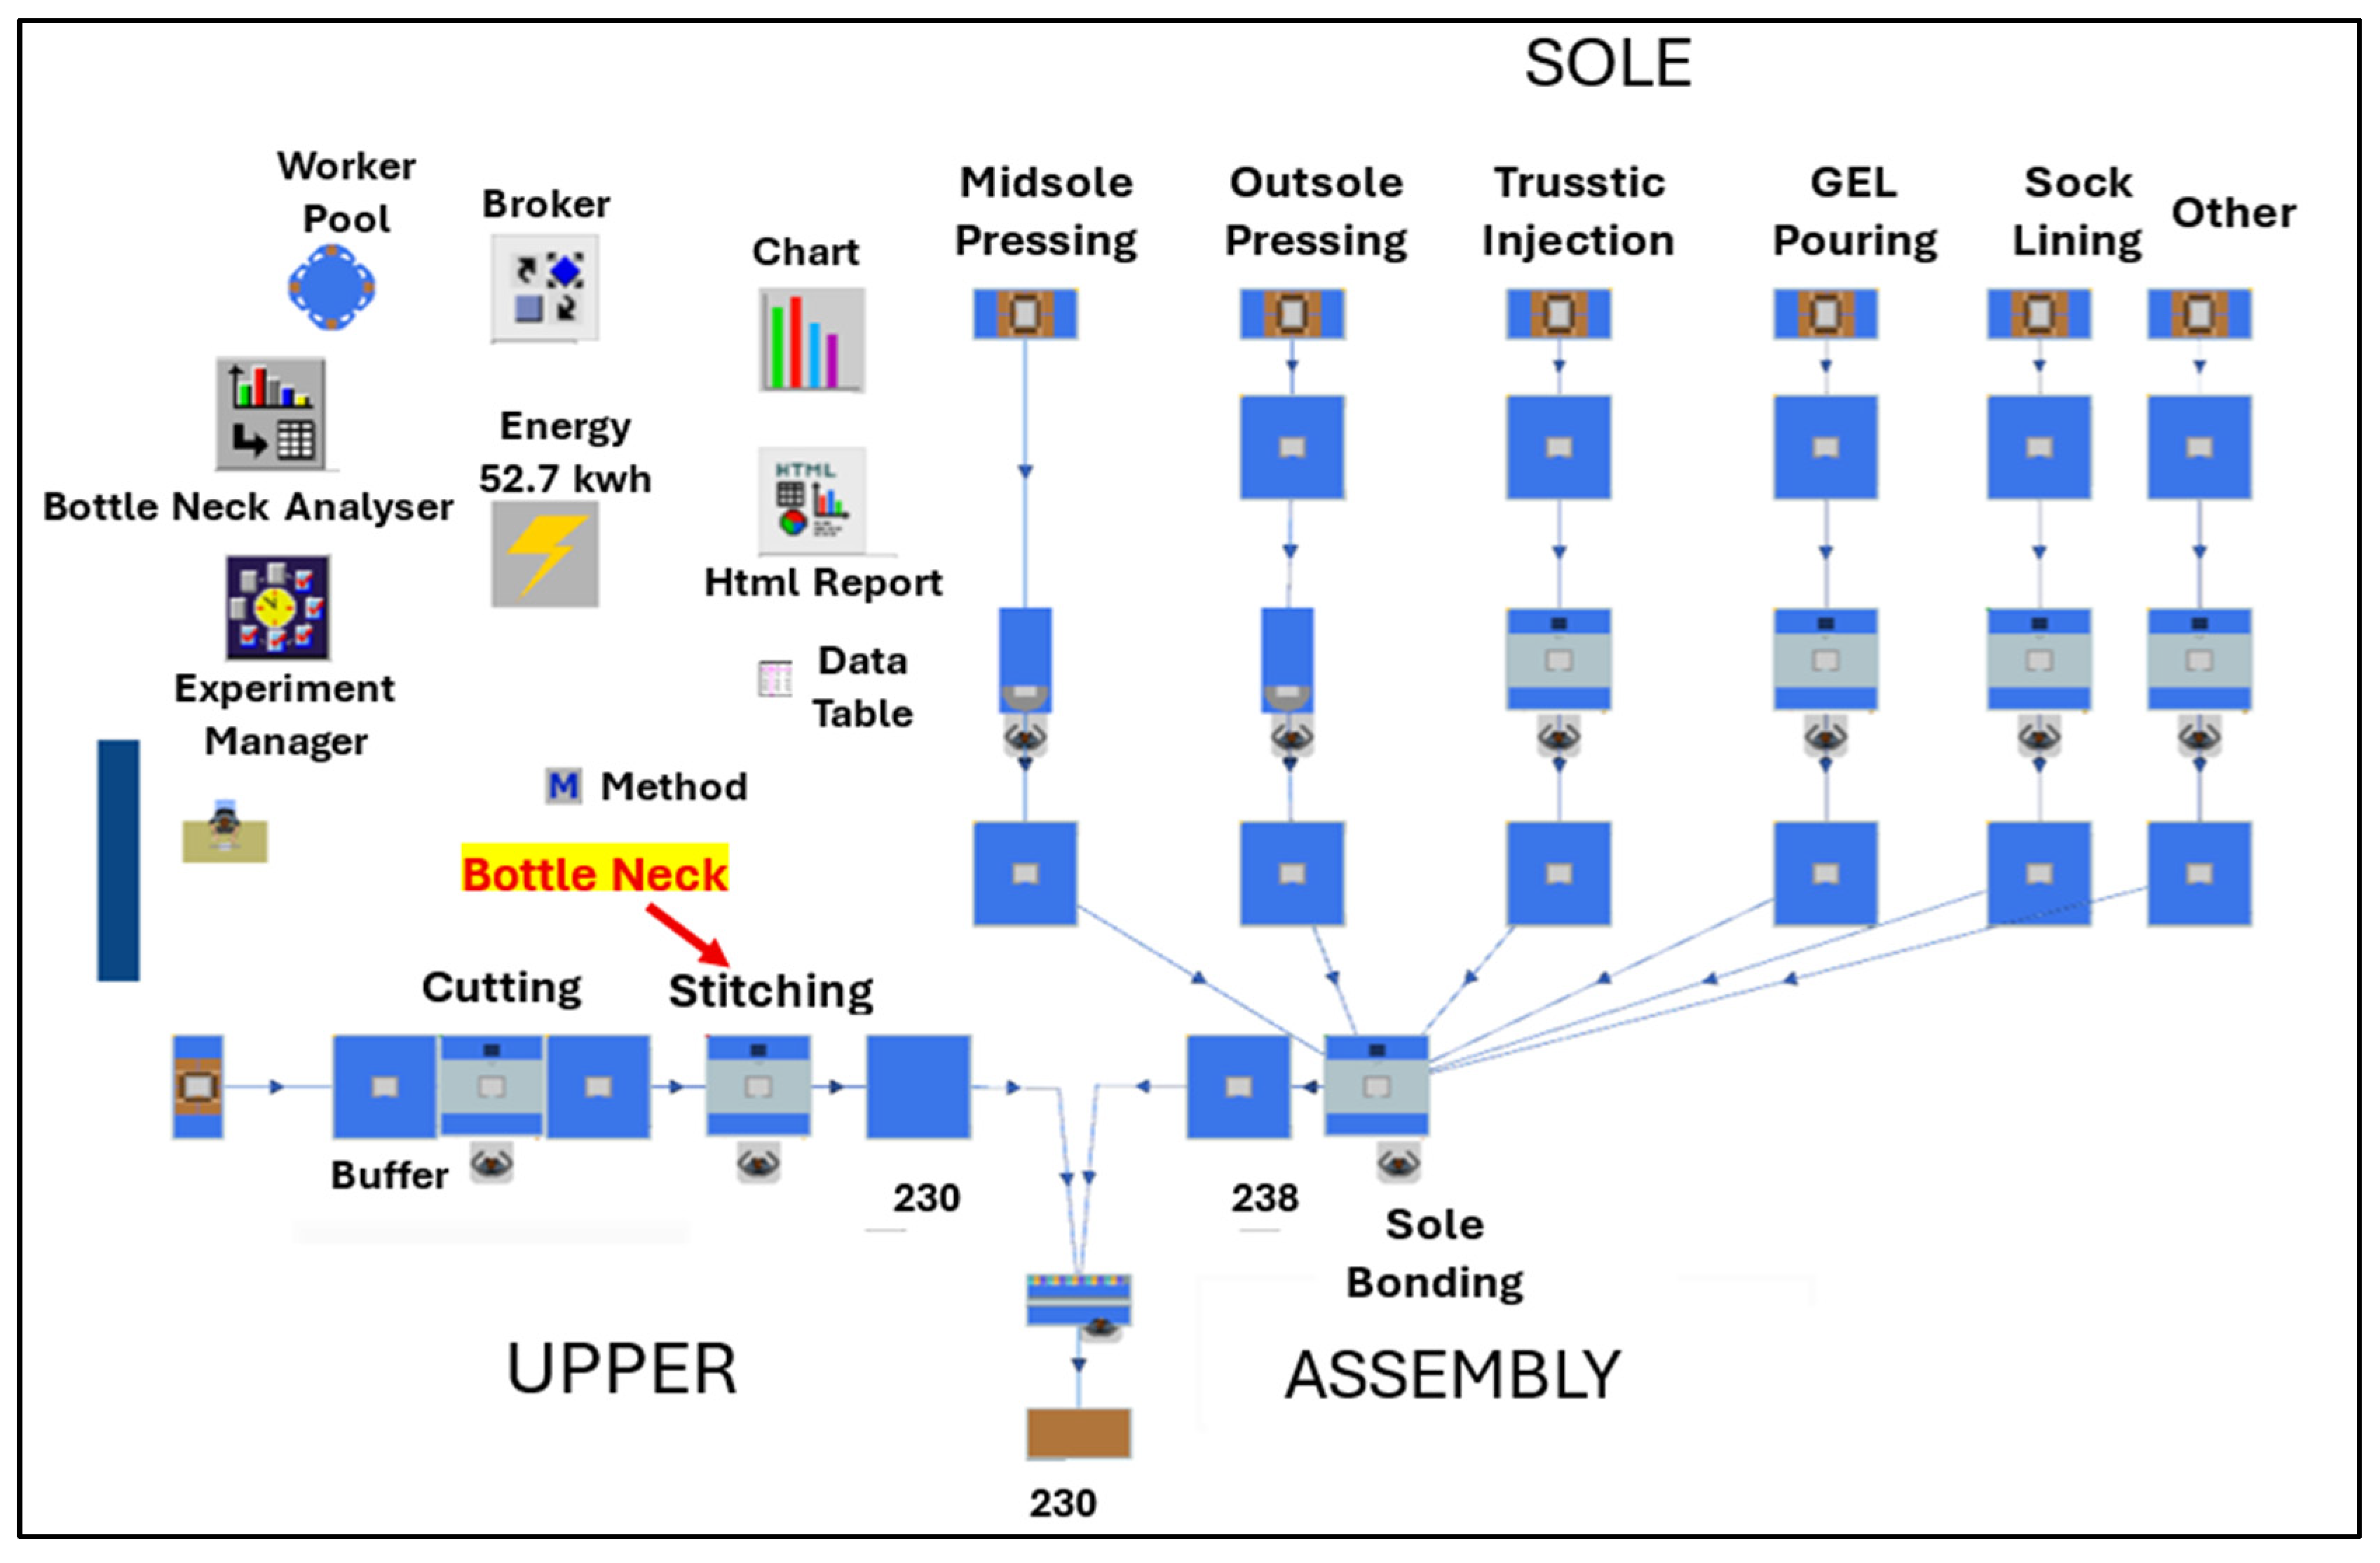
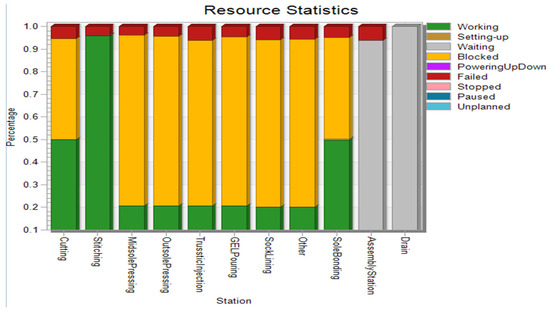
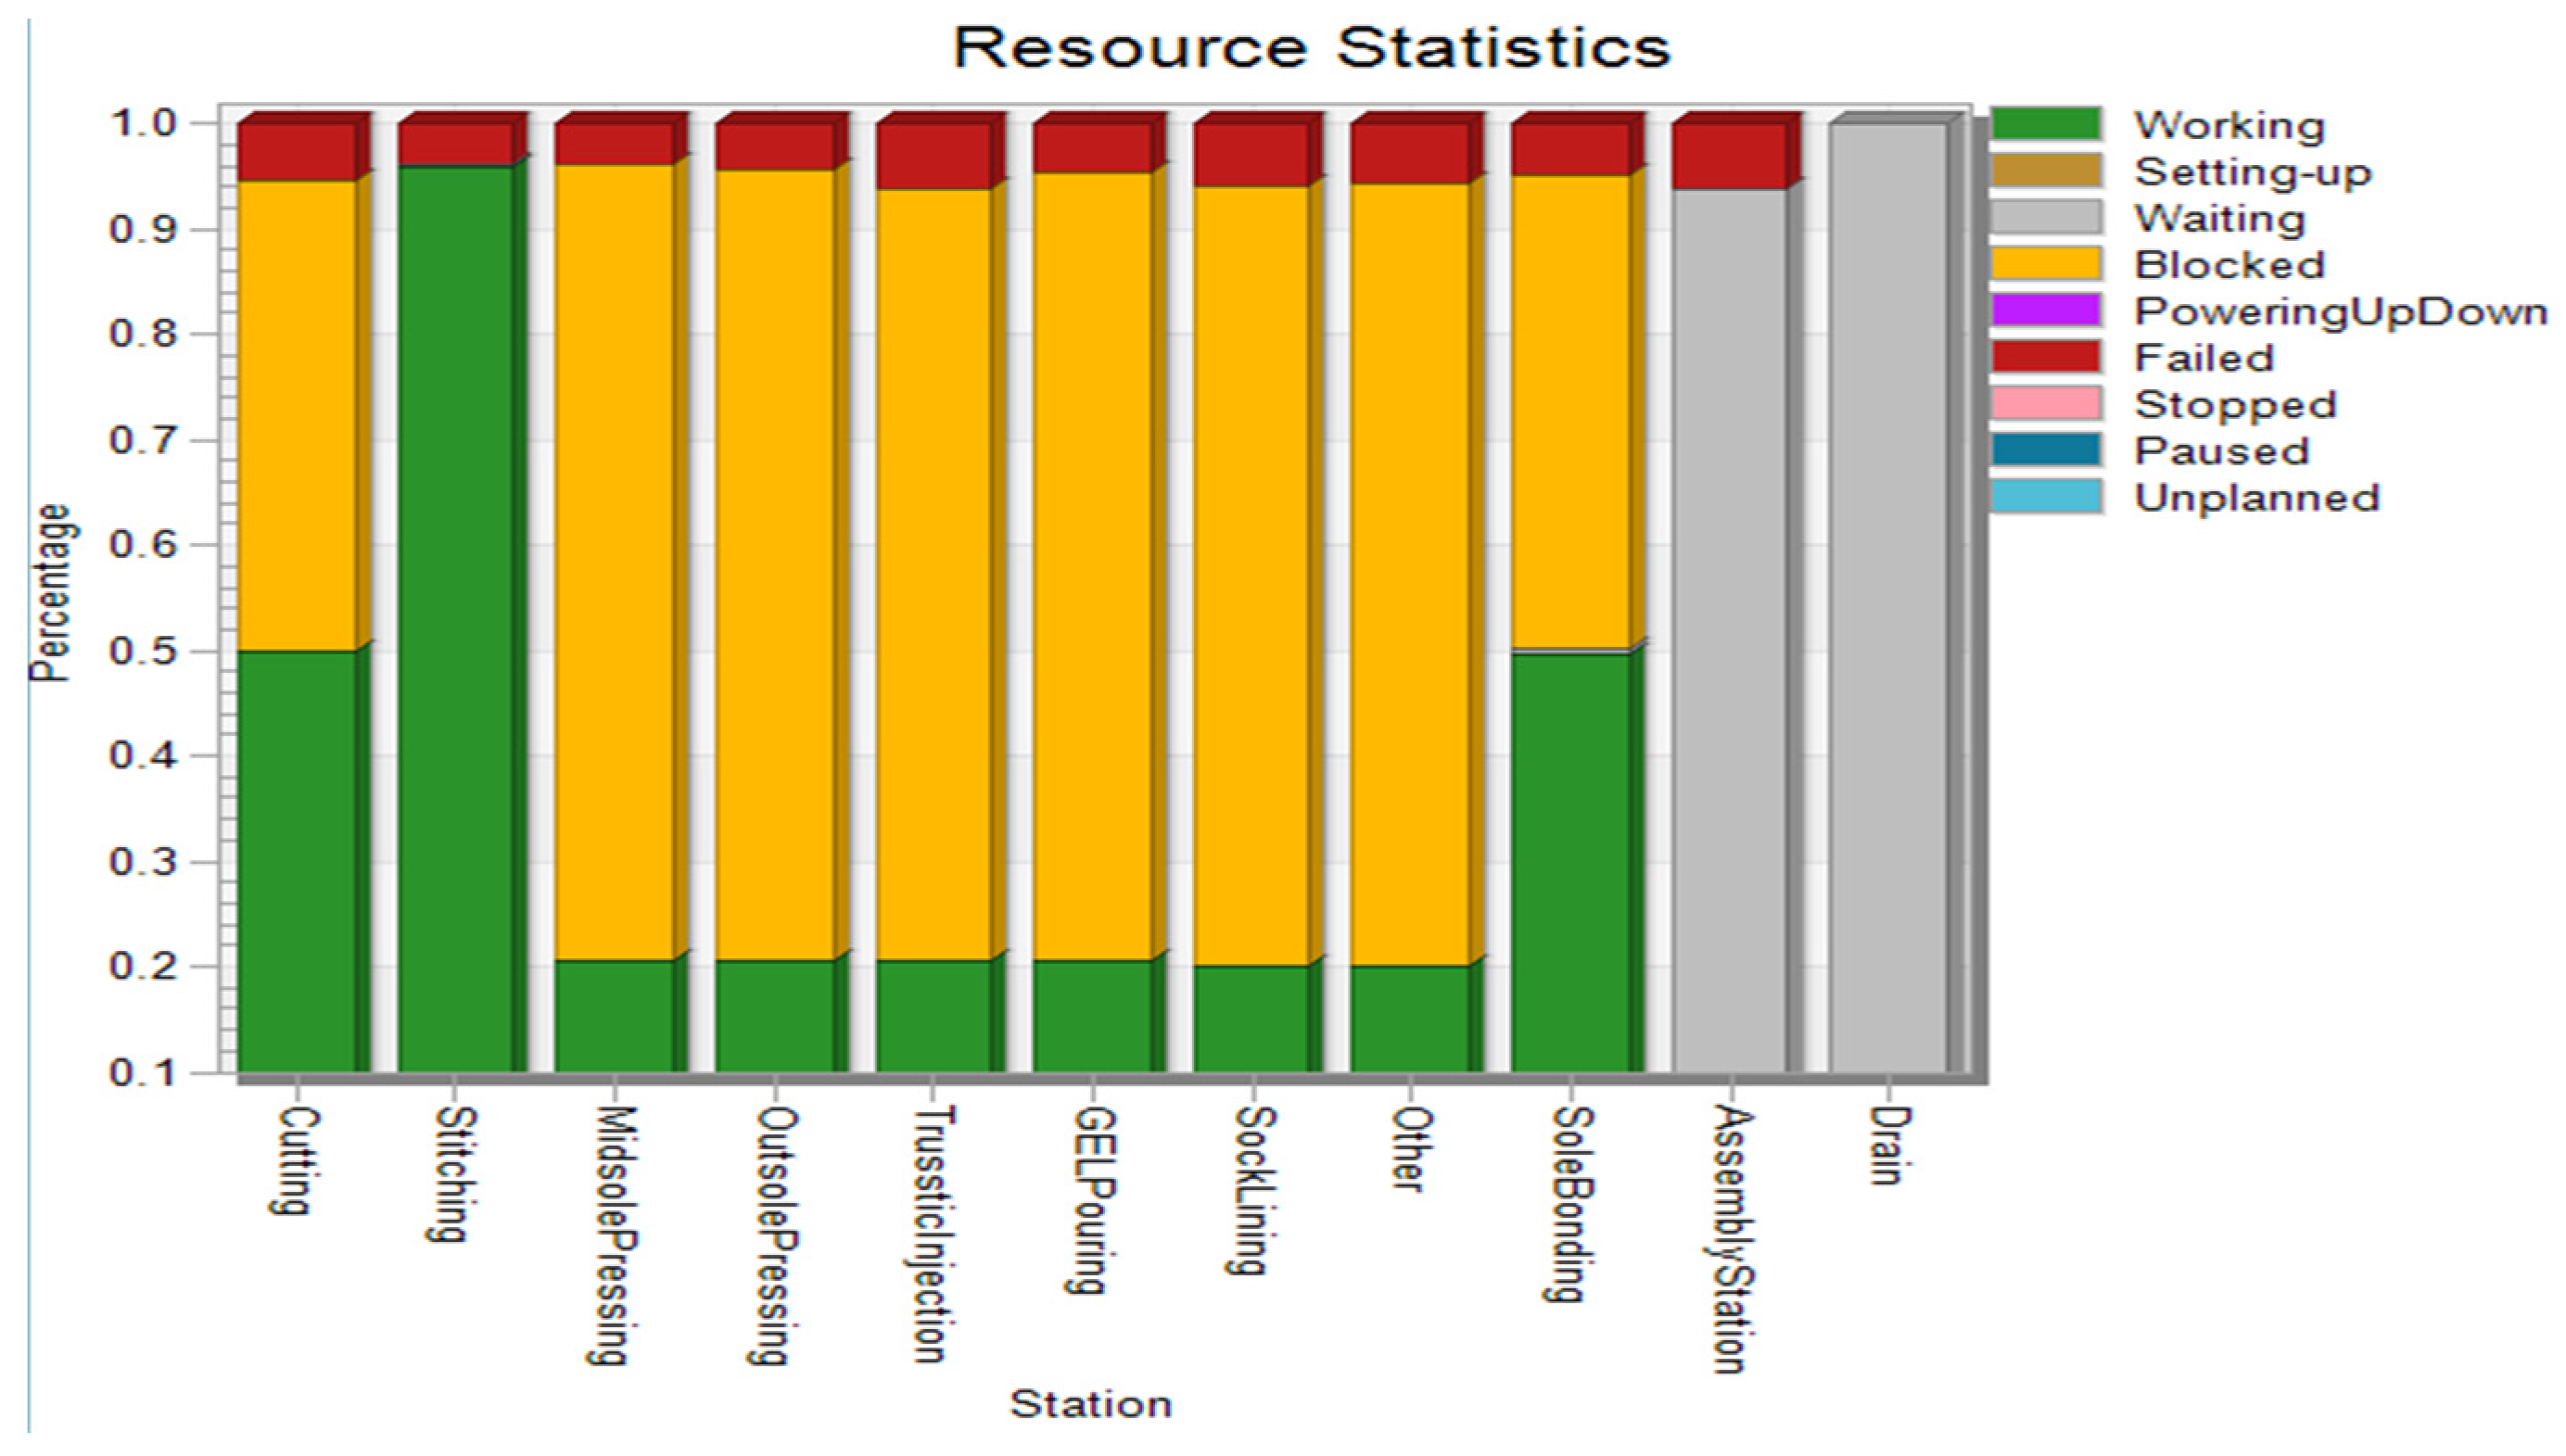
Figure 3 illustrates the current production layout modeled in the Tecnomatix Plant Simulation, comprising nine sequential workstations. Each workstation features a single-machine setup, covering key stages: (i) cutting, (ii) stitching, (iii) midsole pressing, (iv) outsole pressing, (v) Trusstic injection, (vi) gel pouring, (vii) sock lining, (viii) sole bonding, and (ix) finishing. An 8 h shift simulation resulted in a total throughput of 230 units. The analysis of the resource statistics from the simulation (Figure 4) reveals a critical bottleneck at the stitching station, which was operating at full capacity. As a result, non-value-added “Storage” time accounted for 84.06% of a product’s time in the system (Table 4).
Figure 3.
Current production layout in 2D.
Figure 4.
Chart of utilization of stations of current layout.
Table 4.
Drain statistics of current layout.
3.3.2. Proposed Layout Optimization
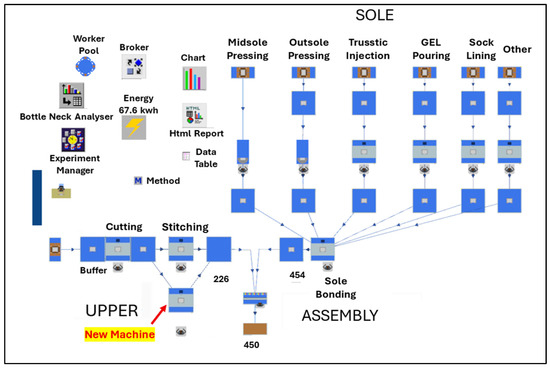
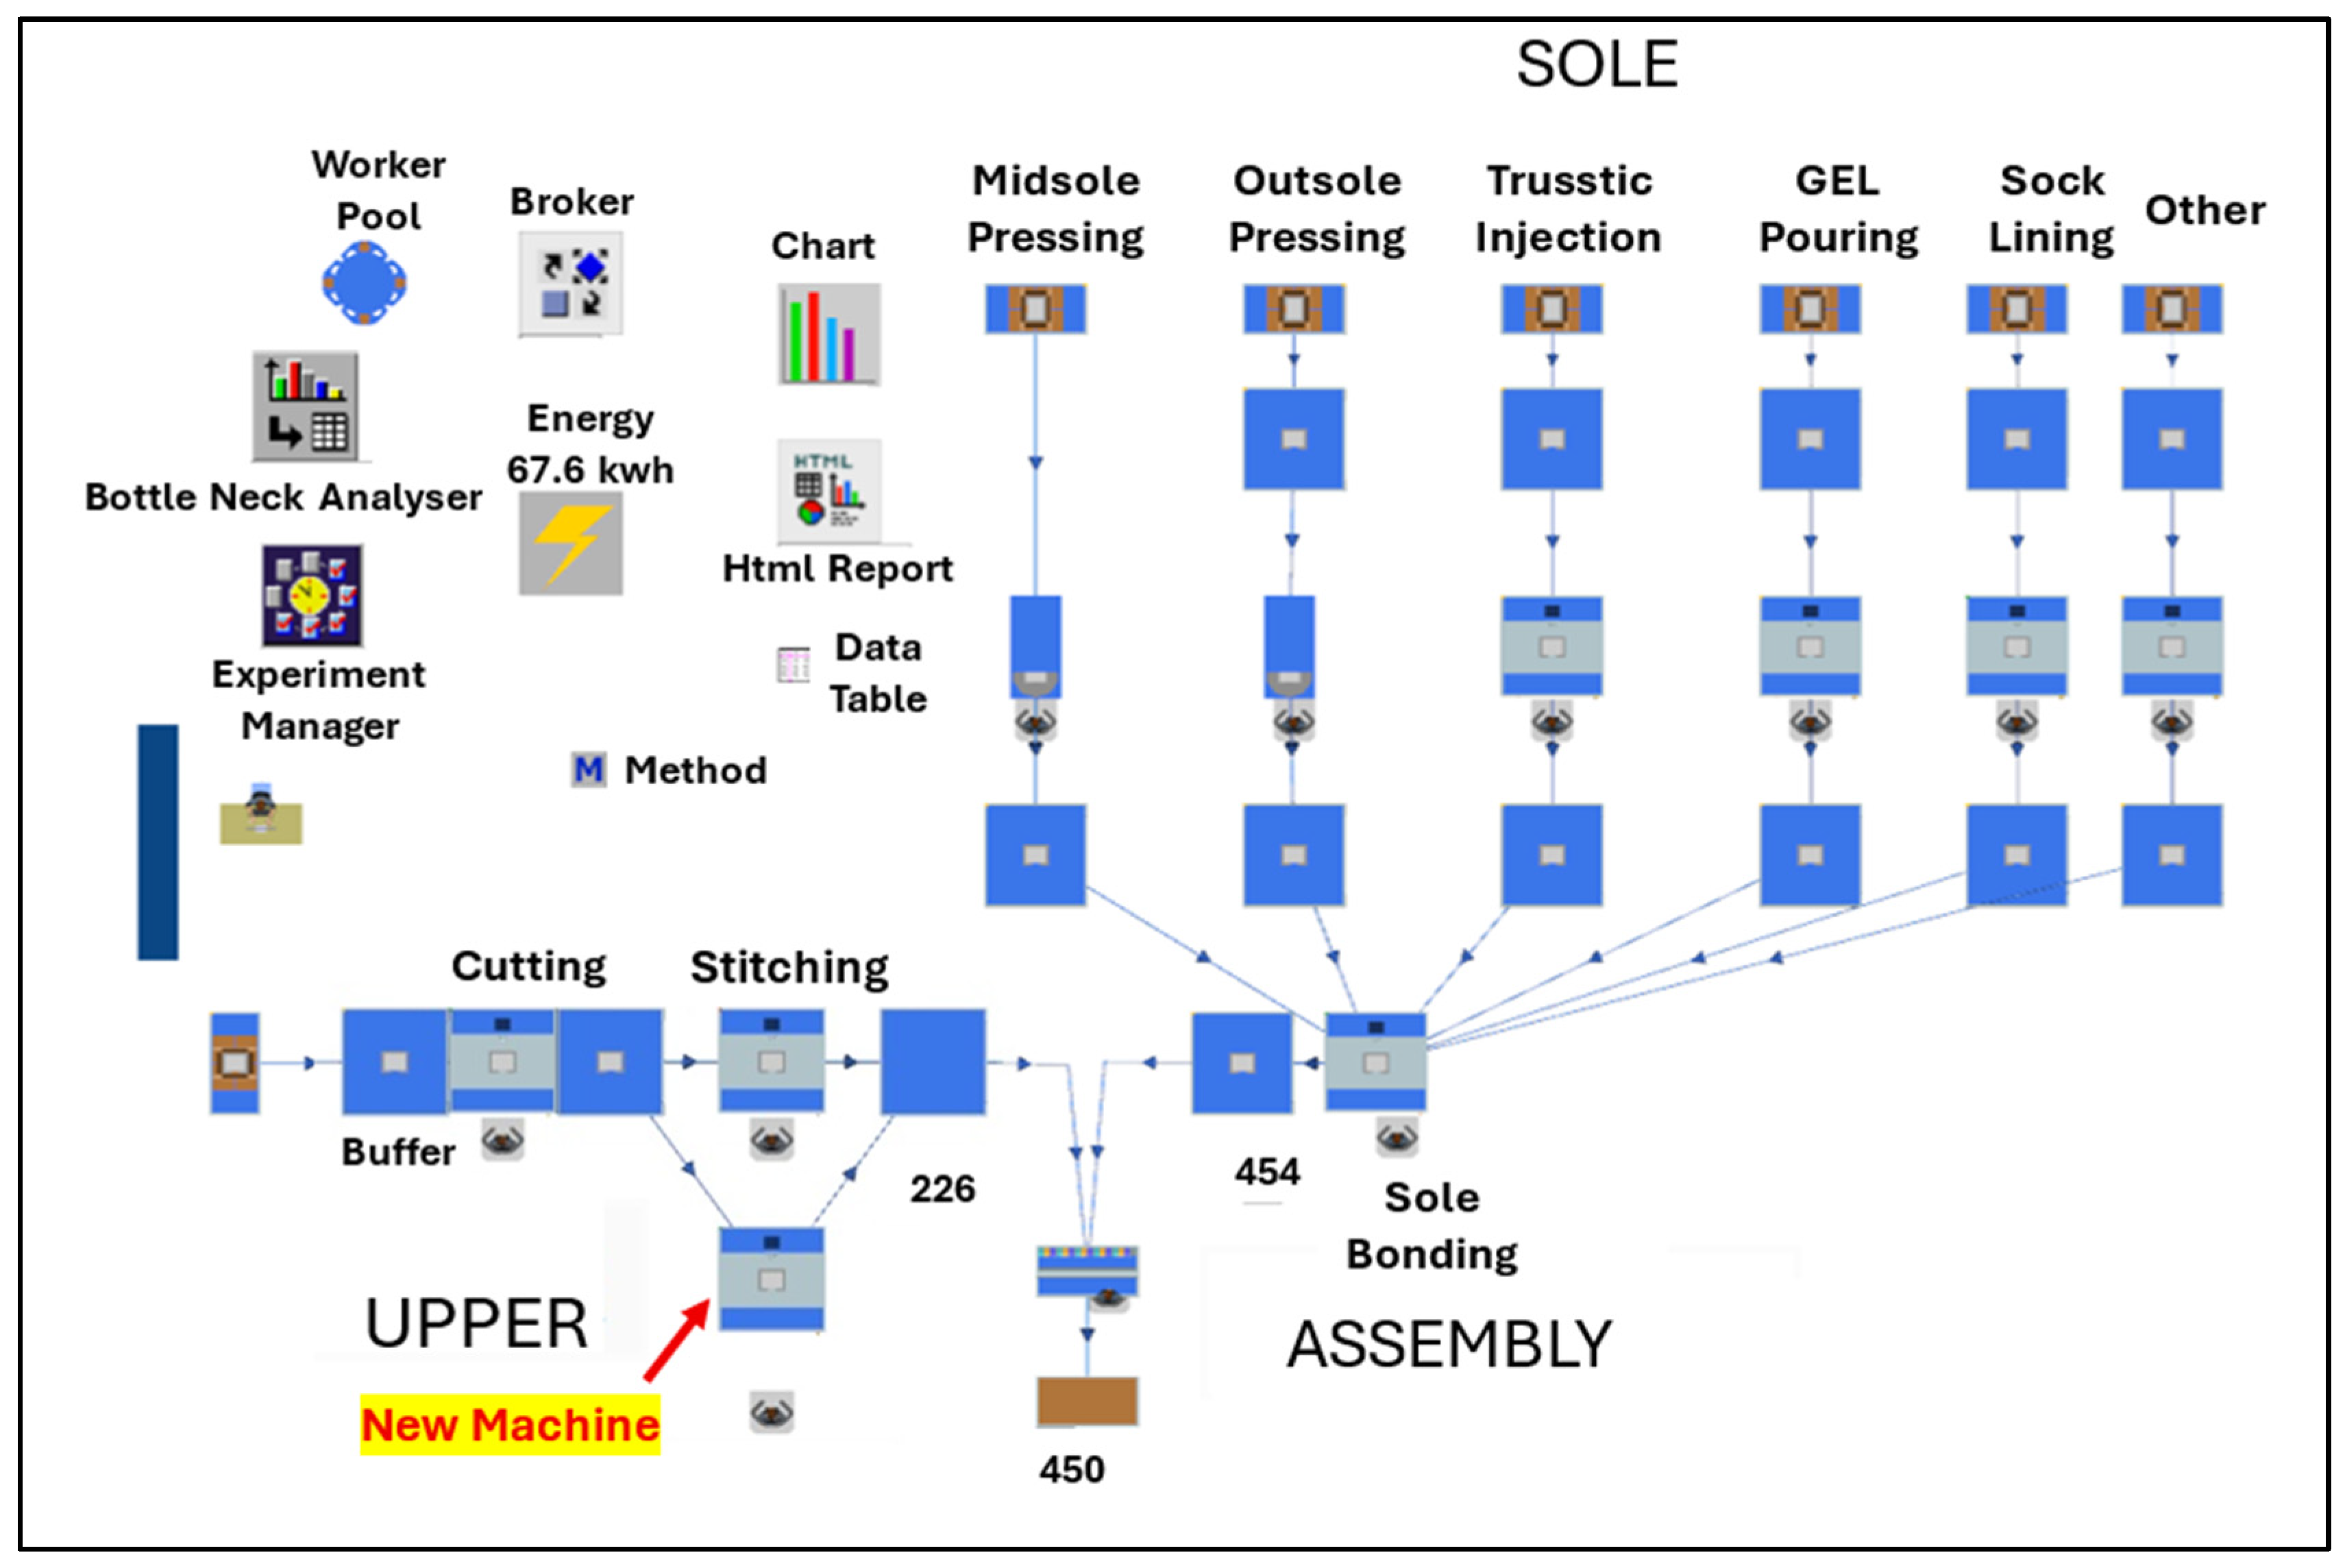
Based on the bottleneck of stitching station, a targeted optimization was implemented. This is performed by adding a second stitching machine (stitching 1) in parallel into the virtual model (Figure 5). This is to resolve the bottleneck identified in the current layout (Figure 3), enabling balanced capacity utilization across workstations. The 8 h shift was simulated again using this modified configuration.
Figure 5.
Proposed layout in 2D.
3.3.3. Results of Optimization in Proposed Layout
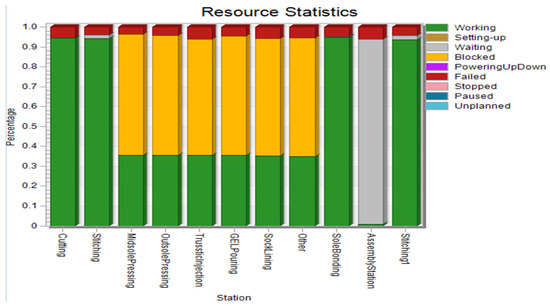
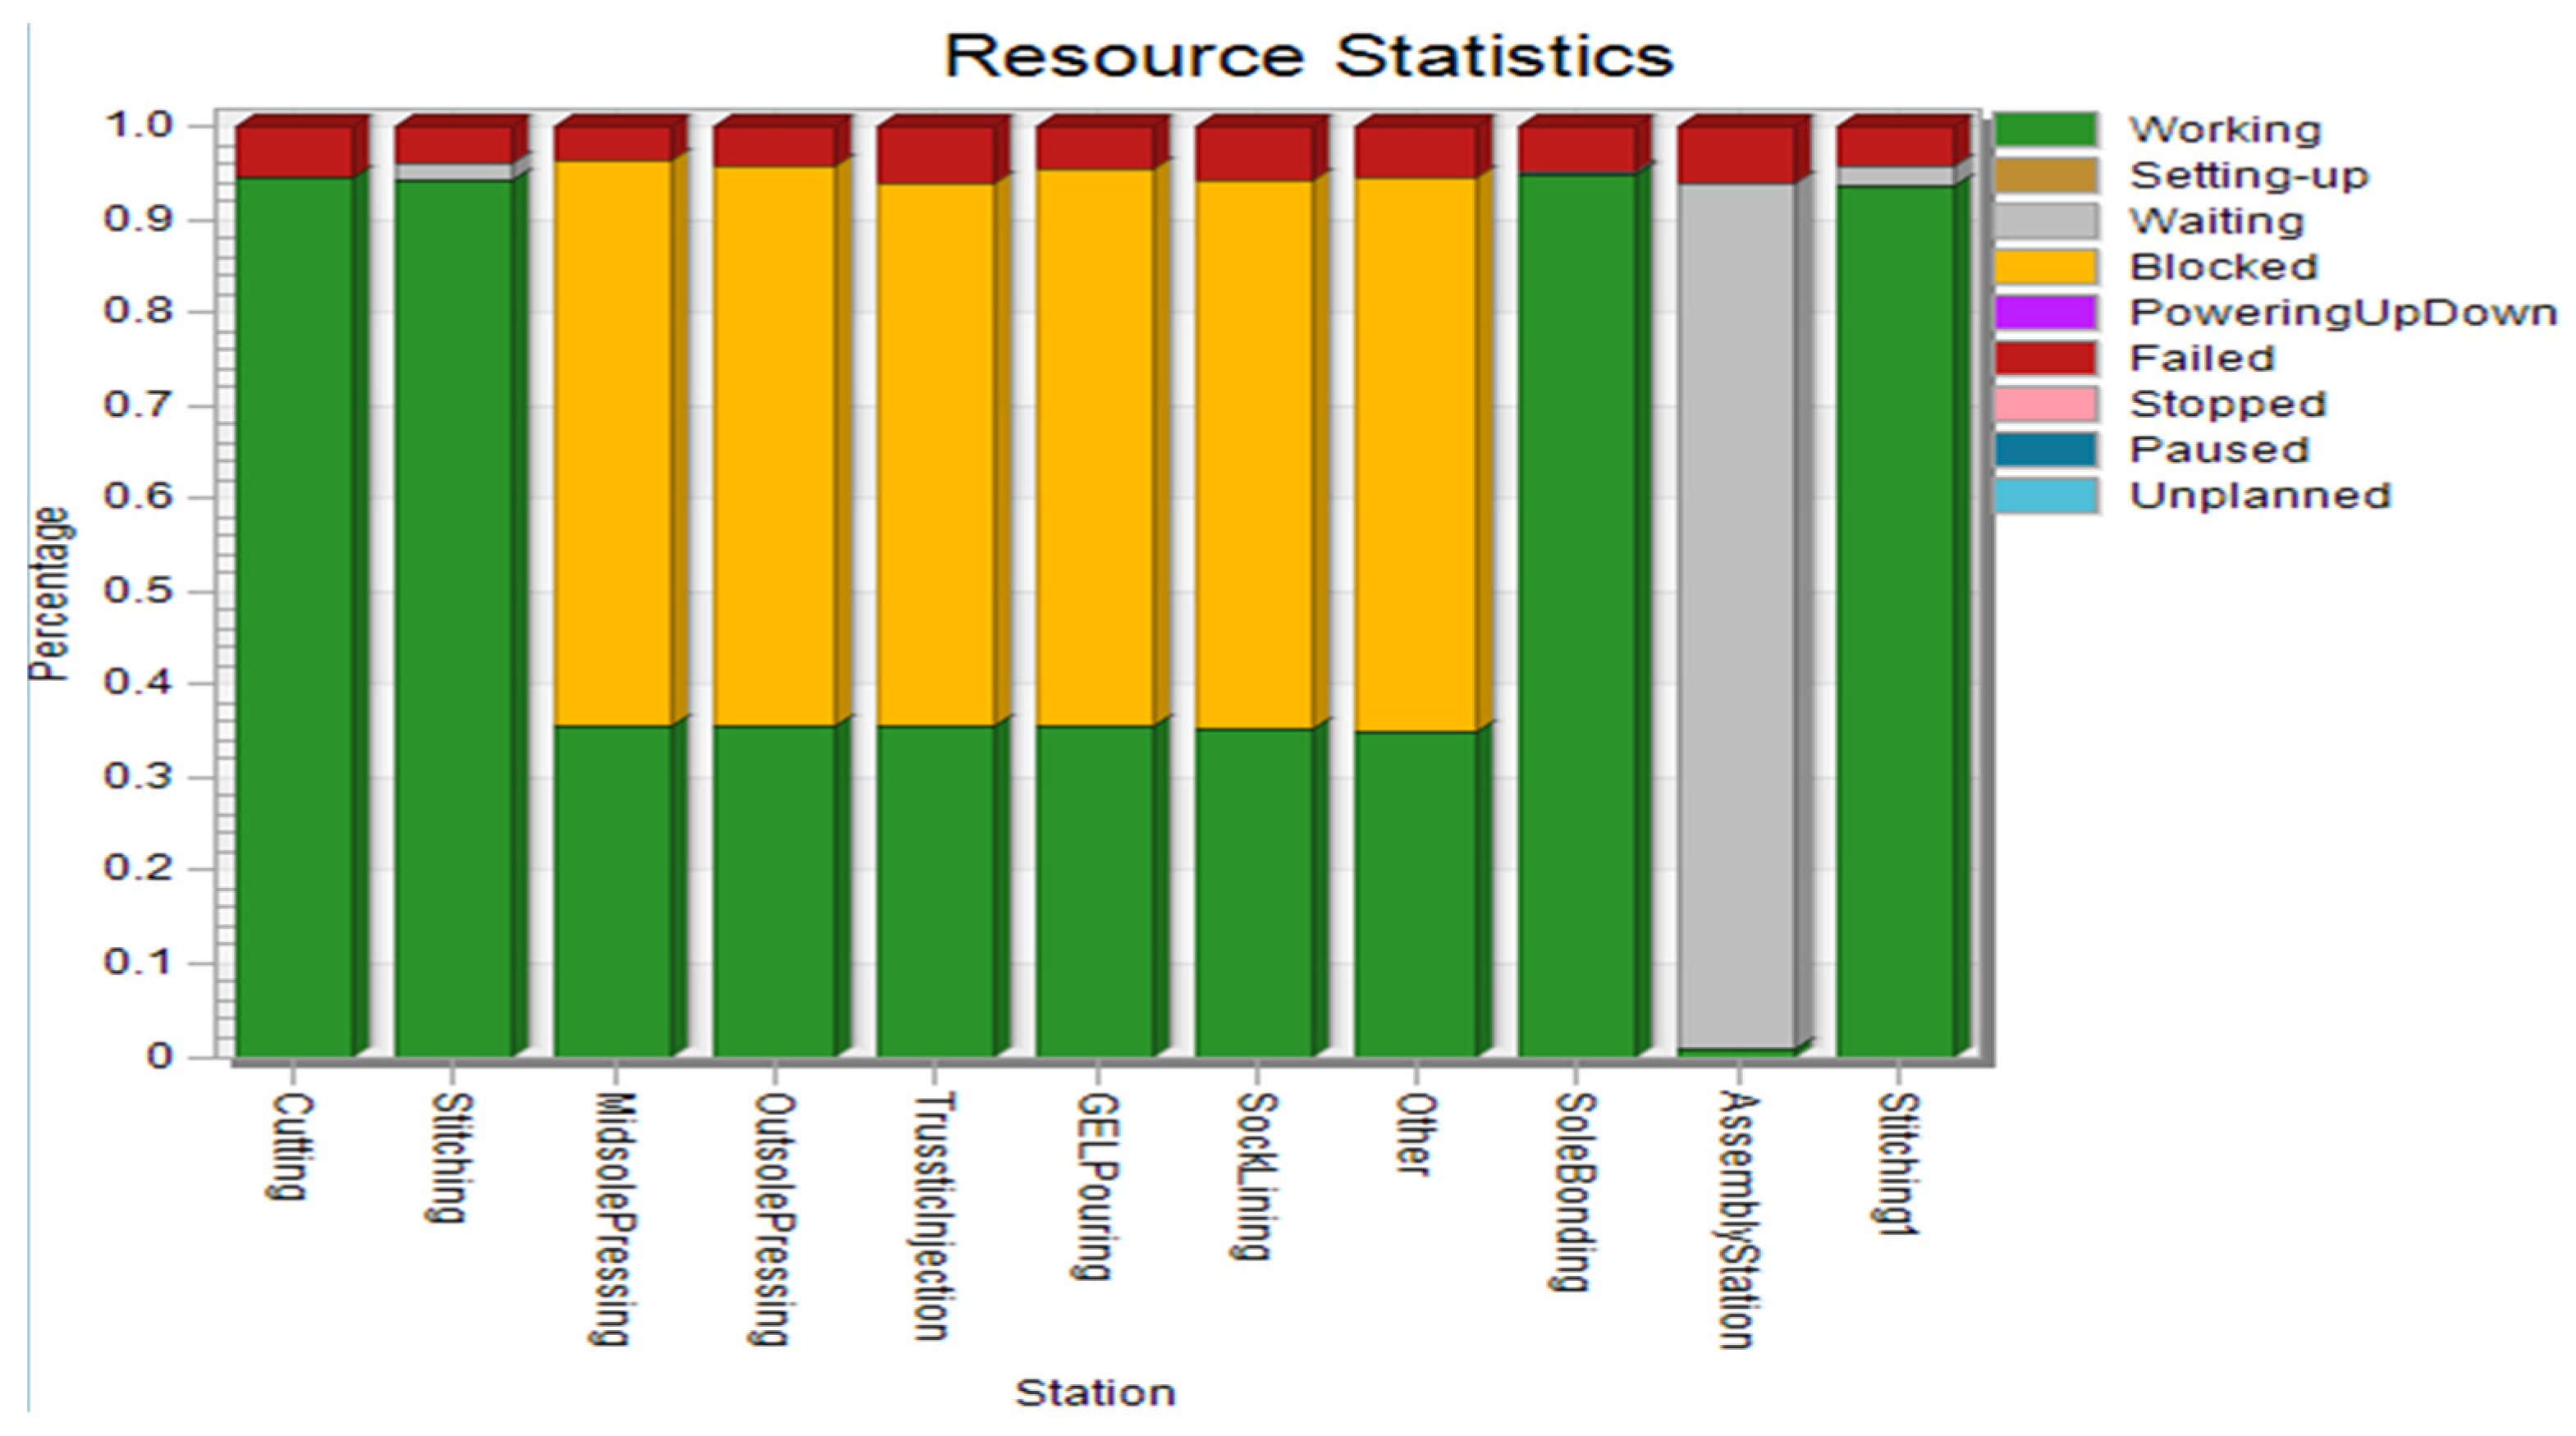
The simulation results demonstrated substantial improvements. The throughput increased to 450 units—a 95% rise in productivity (Table 5) compared to the current layout (Table 4). Most notably, the “value-added” portion of the product life cycle rose from 7.96% to 21.71%, representing a 2.73× improvement in process efficiency. This is mainly because adding a parallel stitching configuration eliminated the previous bottleneck, ensuring more uniform utilization across all workstations (Figure 6) when compared to the current layout (Figure 4).
Table 5.
Drain statistics of proposed layout.
Figure 6.
Chart of utilization of stations of proposed layout.
3.3.4. Critical Analysis and Explanation to Production Efficiency Improvement
The 2.73× improvement in value-added time (from 7.96% to 21.71%) was driven by bottleneck elimination and line rebalancing. The current layout’s stitching station operating at 100% capacity forced products to spend 84% of the cycle time in non-productive queues. Adding a second stitching machine redistributed the load, reducing the utilization to approximately 60% while increasing the throughput to 95.7%. This improved balance enabled continuous material flow, reduced queue accumulation, and increased productive transformation time.
3.4. Energy Consumption and Carbon Footprint Analysis
To quantify the carbon reduction potential of the digital twin optimization, energy consumption data was extracted directly from the Tecnomatix Plant Simulation software (version 2504) using its built-in Energy Analyzer module (Table 6). This tool captures comprehensive energy consumption across all operational states (working, operational, standby, and failed states), providing an accurate assessment of electricity consumption per 8 h shift in accordance with the ISO 14067:2018 methodology. The simulation tracked the energy consumption of nine key workstations and other finishing operations. Each workstation’s power rating and utilization patterns were monitored throughout the 8 h simulation period. Based on this, carbon footprint is calculated following a three-step methodology aligned with ISO 14067:2018 standards.
Table 6.
Workstation energy consumption from Tecnomatix simulation.
Step 1: Total Energy Extraction: The energy consumption data for each workstation was extracted from the Tecnomatix Energy Analyzer, which aggregates energy across all operational states. The total energy per 8 h shift is calculated as follows:
- E_total = Σ(E_i), where E_i represents the energy consumption (kWh) of workstation i over the simulation period.
Step 2: Carbon Emission Calculation: Carbon emissions are calculated using the location-based emission factor for the UK electricity grid:
- CO2e = E_total × EF, where EF = 0.233 kg CO2e/kWh (UK grid emission factor; [21]).
- Current Layout: CO2e_current = (52.71 kWh × 0.233 kg CO2e/kWh)
- ○
- =12.28 kg CO2e per shift.
- Proposed Layout: CO2e_proposed = 67.58 kWh × 0.233 kg CO2e/kWh
- ○
- =15.75 kg CO2e per shift
Step 3: Per-Unit Carbon Intensity: The carbon intensity per unit is calculated by dividing the total shift emissions by the production output: CI = CO2e_shift/Units_produced;
- Current Layout: CI_current = (12.28 kg CO2e/230 units)
- ○
- =0.0534 kg CO2e/unit = 53.4 g CO2e/unit;
- Proposed Layout: CI_proposed = (15.75 kg CO2e/450 units)
- ○
- =0.0350 kg CO2e/unit = 35.0 g CO2e/unit;
- Carbon Intensity Reduction:
- ○
- ΔCI = [(CI_current − CI_proposed)/CI_current] × 100%
- ○
- =[(53.4 − 35.0)/53.4] × 100% = 34.5% reduction
This represents a significant decoupling of production growth from carbon emission growth. Table 7 presents the comprehensive comparison of energy consumption, carbon emissions, and production metrics between the current and proposed layouts. While the total energy consumption increased by 28.20% due to higher machine utilization rates, the per-unit carbon footprint decreased by 34.5%, demonstrating that digital twin-optimized manufacturing can simultaneously achieve a higher throughput and lower environmental impact per unit produced. The productivity improvement (95.70%) compared to the energy increase (28.20%) results in a ratio of 3.39:1, meaning productivity grew 3.39 times faster than energy consumption. This indicates that the bottleneck elimination and line balancing achieved through digital twin simulation delivers both economic and environmental benefits. On an annual basis (assuming 250 working days), this optimization would produce an additional 55,000 pairs of shoes while maintaining a per-unit carbon footprint that is 34.5% lower than the initial layout. Overall, this case study shows that a digital twin approach enables precise, high-impact interventions in production systems. These improvements deliver multiple benefits such as (i) reduced idle time, (ii) lower equipment stress, (iii) decreased work-in-process inventory, and, most critically for this study, (iv) reduced energy consumption and (v) reduced carbon emissions per unit produced.
Table 7.
Energy consumption and carbon emissions comparison.
4. Conclusions
This study concludes that integrating digital twin technology into project management is an effective, data-driven strategy for reducing the footwear industry’s carbon footprint. The analysis of Nike [16], Adidas [17], and Puma [18] reveals progress in sustainable materials, renewable energy, and waste reduction, though supply chain emissions remain a significant challenge. The plant simulation case study validated the digital twin approach by demonstrating that a single, virtually tested process change increased throughput by 95%, while reducing energy use and the waste per unit. The data used in this study originates from authentic and reliable sources [1,2,3,4,16,17,18,20], serving as a valid foundation for digital twin modeling. A customized physical model of real-time data collection via Siemens IoT 2050-linked sensors (Version: FS AB (06/2023), Manufacturer: Siemens AG, Nürnberg, Germany) to the Siemens Insights hub (an IIoT platform) to plant simulation is validated through manufacturing execution system (MES) (Version 1.2.1.8, Manufacturer: FESTO Didactic, St. Ingbert–Rohrbach, Germany) workflows. This was performed by using our inhouse customized-setup FESTO cyber-physical (CP) lab (Manufacturer: Festo Didactic SE, Denkendorf, Germany). This simulation-first method enables manufacturers to de-risk investments, enhance productivity, and move toward both environmental and economic sustainability. From this work, it can also be understood that industrial strategies offer valuable insights for brands and policymakers, including collaboration, renewable energy adoption, sustainable sourcing, traceability, circular economy principles, and robust waste management. Policymakers can accelerate progress through incentives, regulations, and awareness campaigns. Aligning digital innovation with sustainability enables measurable advancement toward net-zero goals. By combining predictive modeling, real-time analytics, and virtual testing, operations can be optimized, inefficiencies can be reduced, and environmental impacts can be effectively managed. This convergence of digital and green innovation strengthens decision making and futureproofs the industry against evolving consumer expectations and regulatory pressures.
Author Contributions
Conceptualization, M.R.D. and A.A.; methodology, M.R.D. and A.A.; software, S.G., M.R.D. and A.A.; validation, M.R.D., A.A. and S.G.; formal analysis, M.R.D., A.A. and S.G.; investigation, M.R.D. and A.A.; resources, A.A., M.K. and T.L.; data curation, M.R.D., A.A., M.K. and T.L.; writing—original draft preparation, M.R.D. and A.A.; writing—review and editing, M.R.D., A.A., M.K. and T.L.; visualization, M.R.D., A.A., M.K. and T.L.; supervision, A.A. and A.A.; project administration, M.R.D., A.A., M.K. and T.L. All authors have read and agreed to the published version of the manuscript.
Funding
This research received no external funding.
Institutional Review Board Statement
The work has been approved and cleared by Coventry University Ethical approval process; Ethics Approval Number: P151383.
Informed Consent Statement
Not Applicable.
Data Availability Statement
The data presented in this study are available upon request from the corresponding author.
Conflicts of Interest
The authors declare no conflict of interest.
References
- Statista. Global Greenhouse Gas Emissions 1970–2024. Available online: https://www.statista.com/statistics/1285502/annual-global-greenhouse-gas-emissions/ (accessed on 10 October 2025).
- Charlton, E. This Is What Climate Change Costs Economies Around the World. World Economic Forum, 29 November 2023. Available online: https://www.weforum.org/stories/2023/11/climate-crisis-cost-global-economies/ (accessed on 10 October 2025).
- National Bureau of Economic Research. Homepage. Available online: https://www.nber.org/ (accessed on 10 October 2025).
- Deloitte Center for Sustainable Progress. Deloitte Research Reveals Inaction on Climate Change Could Cost the World’s Economy US$178 Trillion by 2070. Deloitte, 23 May 2022. Available online: https://www.deloitte.com/global/en/about/press-room/deloitte-research-reveals-inaction-on-climate-change-could-cost-the-world-economy-us-dollar-178-trillion-by-2070.html (accessed on 10 October 2025).
- Perdijk, E.W.; Luijten, J.; Selderijk, A.J. An Eco-Label for Footwear; Background Report (Report Number: 9041); CEA, Communication and Consultancy on Environment and Energy, Centrum TNO Leather and Shoes: Rotterdam, The Netherlands, 1994. [Google Scholar]
- Milà, L.; Domènech, X.; Rieradevall, J.; Fullana, P.; Puig, R. Application of life cycle assessment to footwear. Int. J. Life Cycle Assess. 1998, 3, 203–208. [Google Scholar] [CrossRef] [Scilit]
- Cheah, L.; Ciceri, N.D.; Olivetti, E.; Matsumura, S.; Forterre, D.; Roth, R.; Kirchain, R. Manufacturing-focused emissions reductions in footwear production. J. Clean. Prod. 2013, 44, 18–29. [Google Scholar] [CrossRef] [Scilit]
- Bocken, N.M.P.; de Pauw, I.; Bakker, C.; van der Grinten, B. Product design and business model strategies for a circular economy. J. Ind. Prod. Eng. 2016, 33, 308–320. [Google Scholar] [CrossRef] [Scilit]
- Rahman, H.F.; Servranckx, T.; Chakrabortty, R.K.; Vanhoucke, M.; Sawah, S.E. Manufacturing project scheduling considering human factors to minimize total cost and carbon footprints. Appl. Soft Comput. 2022, 131, 109764. [Google Scholar] [CrossRef] [Scilit]
- Rosen, R.; Von Wichert, G.; Lo, G.; Bettenhausen, K.D. About The Importance of Autonomy and Digital Twins for the Future of Manufacturing. IFAC-PapersOnLine 2015, 48, 567–572. [Google Scholar] [CrossRef] [Scilit]
- Tao, F.; Zhang, M. Digital Twin Shop-Floor: A new Shop-Floor paradigm towards smart manufacturing. IEEE Access 2017, 5, 20418–20427. [Google Scholar] [CrossRef] [Scilit]
- Park, K.T.; Nam, Y.W.; Lee, H.S.; Im, S.J.; Noh, S.D.; Son, J.Y.; Kim, H. Design and implementation of a digital twin application for a connected micro smart factory. Int. J. Comput. Integr. Manuf. 2019, 32, 596–614. [Google Scholar] [CrossRef] [Scilit]
- Wang, S.; Wan, J.; Zhang, D.; Li, D.; Zhang, C. Towards smart factory for industry 4.0: A self-organized multi-agent system with big data based feedback and coordination. Comput. Netw. 2016, 101, 158–168. [Google Scholar] [CrossRef] [Scilit]
- Boschert, S.; Rosen, R. Digital Twin—The simulation aspect. In Mechatronic Futures; Hehenberger, P., Bradley, D., Eds.; Springer: Cham, Switzerland, 2016; pp. 59–74. [Google Scholar]
- Mehkri, Z. How Digital Twin Simulations Advance Digital Transformation in Manufacturing. Control Engineering, 7 April 2023. Available online: https://www.controleng.com/articles/how-digital-twin-simulations-advance-digital-transformation-in-manufacturing/ (accessed on 10 October 2025).
- Nike, Inc. Nike Sustainability. Available online: https://www.nike.com/sustainability (accessed on 10 October 2025).
- Adidas AG. Adidas Sustainability. Available online: https://www.adidas.co.uk/sustainability (accessed on 10 October 2025).
- PUMA SE. PUMA’s Approach on Sustainability. Available online: https://about.puma.com/en/sustainability/our-approach (accessed on 10 October 2025).
- Frasers Group PLC. Annual Report & Accounts 2024. 2024. Available online: https://www.frasers.group/financials (accessed on 10 October 2025).
- ISO 14083:2023; Greenhouse Gases—Quantification and Reporting of Greenhouse Gas Emissions Arising from Transport Chain Operations. ISO: Geneva, Switzerland, 2023. Available online: https://www.iso.org/standard/78864.html (accessed on 10 October 2025).
- Freightos. Freight CO2 Emissions Calculator. Available online: https://www.webcargo.co/knowledge-base/tools/freight-CO2-emissions-calculator/ (accessed on 10 October 2025).
- EN 16258:2012; Methodology for Calculation and Declaration of Energy Consumption and GHG Emissions of Transport Services (Freight and Passengers). European Committee for Standardization: Brussels, Belgium, 2012. Available online: https://standards.iteh.ai/catalog/standards/cen/e9512863-2632-47df-b6cf-648d725a01e3/en-16258-2012 (accessed on 10 October 2025).
- de Jong, S.; Antonissen, K.; Hoefnagels, R.; Lonza, L.; Wang, M.; Faaij, A.; Junginger, M. Life-cycle analysis of greenhouse gas emissions from renewable jet fuel production. Biotechnol. Biofuels 2017, 10, 64. [Google Scholar] [CrossRef] [Scilit] [PubMed]
- CO2-Emissiefactoren. Downloads. Available online: https://co2emissiefactoren.nl/downloads/ (accessed on 10 October 2025).
- Argonne National Laboratory. Lifecycle Analysis of Alternative Aviation Fuels (GREET Model). 2016. Available online: https://publications.anl.gov/anlpubs/2016/05/127787.pdf (accessed on 10 October 2025).

Disclaimer/Publisher’s Note: The statements, opinions and data contained in all publications are solely those of the individual author(s) and contributor(s) and not of MDPI and/or the editor(s). MDPI and/or the editor(s) disclaim responsibility for any injury to people or property resulting from any ideas, methods, instructions or products referred to in the content. |
© 2026 by the authors. Licensee MDPI, Basel, Switzerland. This article is an open access article distributed under the terms and conditions of the Creative Commons Attribution (CC BY) license.