Reducing Carbon Emissions in Shoe Manufacturing Through Digital Twin-Enabled Project Management †
 ,
,
Abstract
1. Introduction
1.1. Literature Review
1.2. Research Gap and Novelty
2. Materials and Methods
2.1. Carbon Footprint Scopes
2.2. Carbon Footprint Calculation
2.2.1. Air Cargo Emission Calculation: BLR → BHX
2.2.2. Scenario: Hypothetical Company—SoleStyle Inc. Shipment (Table 2)

| Transport Leg | Mode of Transport | Fuel/Energy Type | Distance | Fuel/Energy Consumed |
|---|---|---|---|---|
| Inbound | Medium-duty diesel truck | Diesel | 200 km | 40 L |
| Outbound | Heavy-duty diesel truck | Diesel | 500 km | 150 L |
| Last-Mile | Electric Van | Electricity | 50 km | 10 kWh |
2.3. Data Collection and Analysis
3. Analysis and Implementation
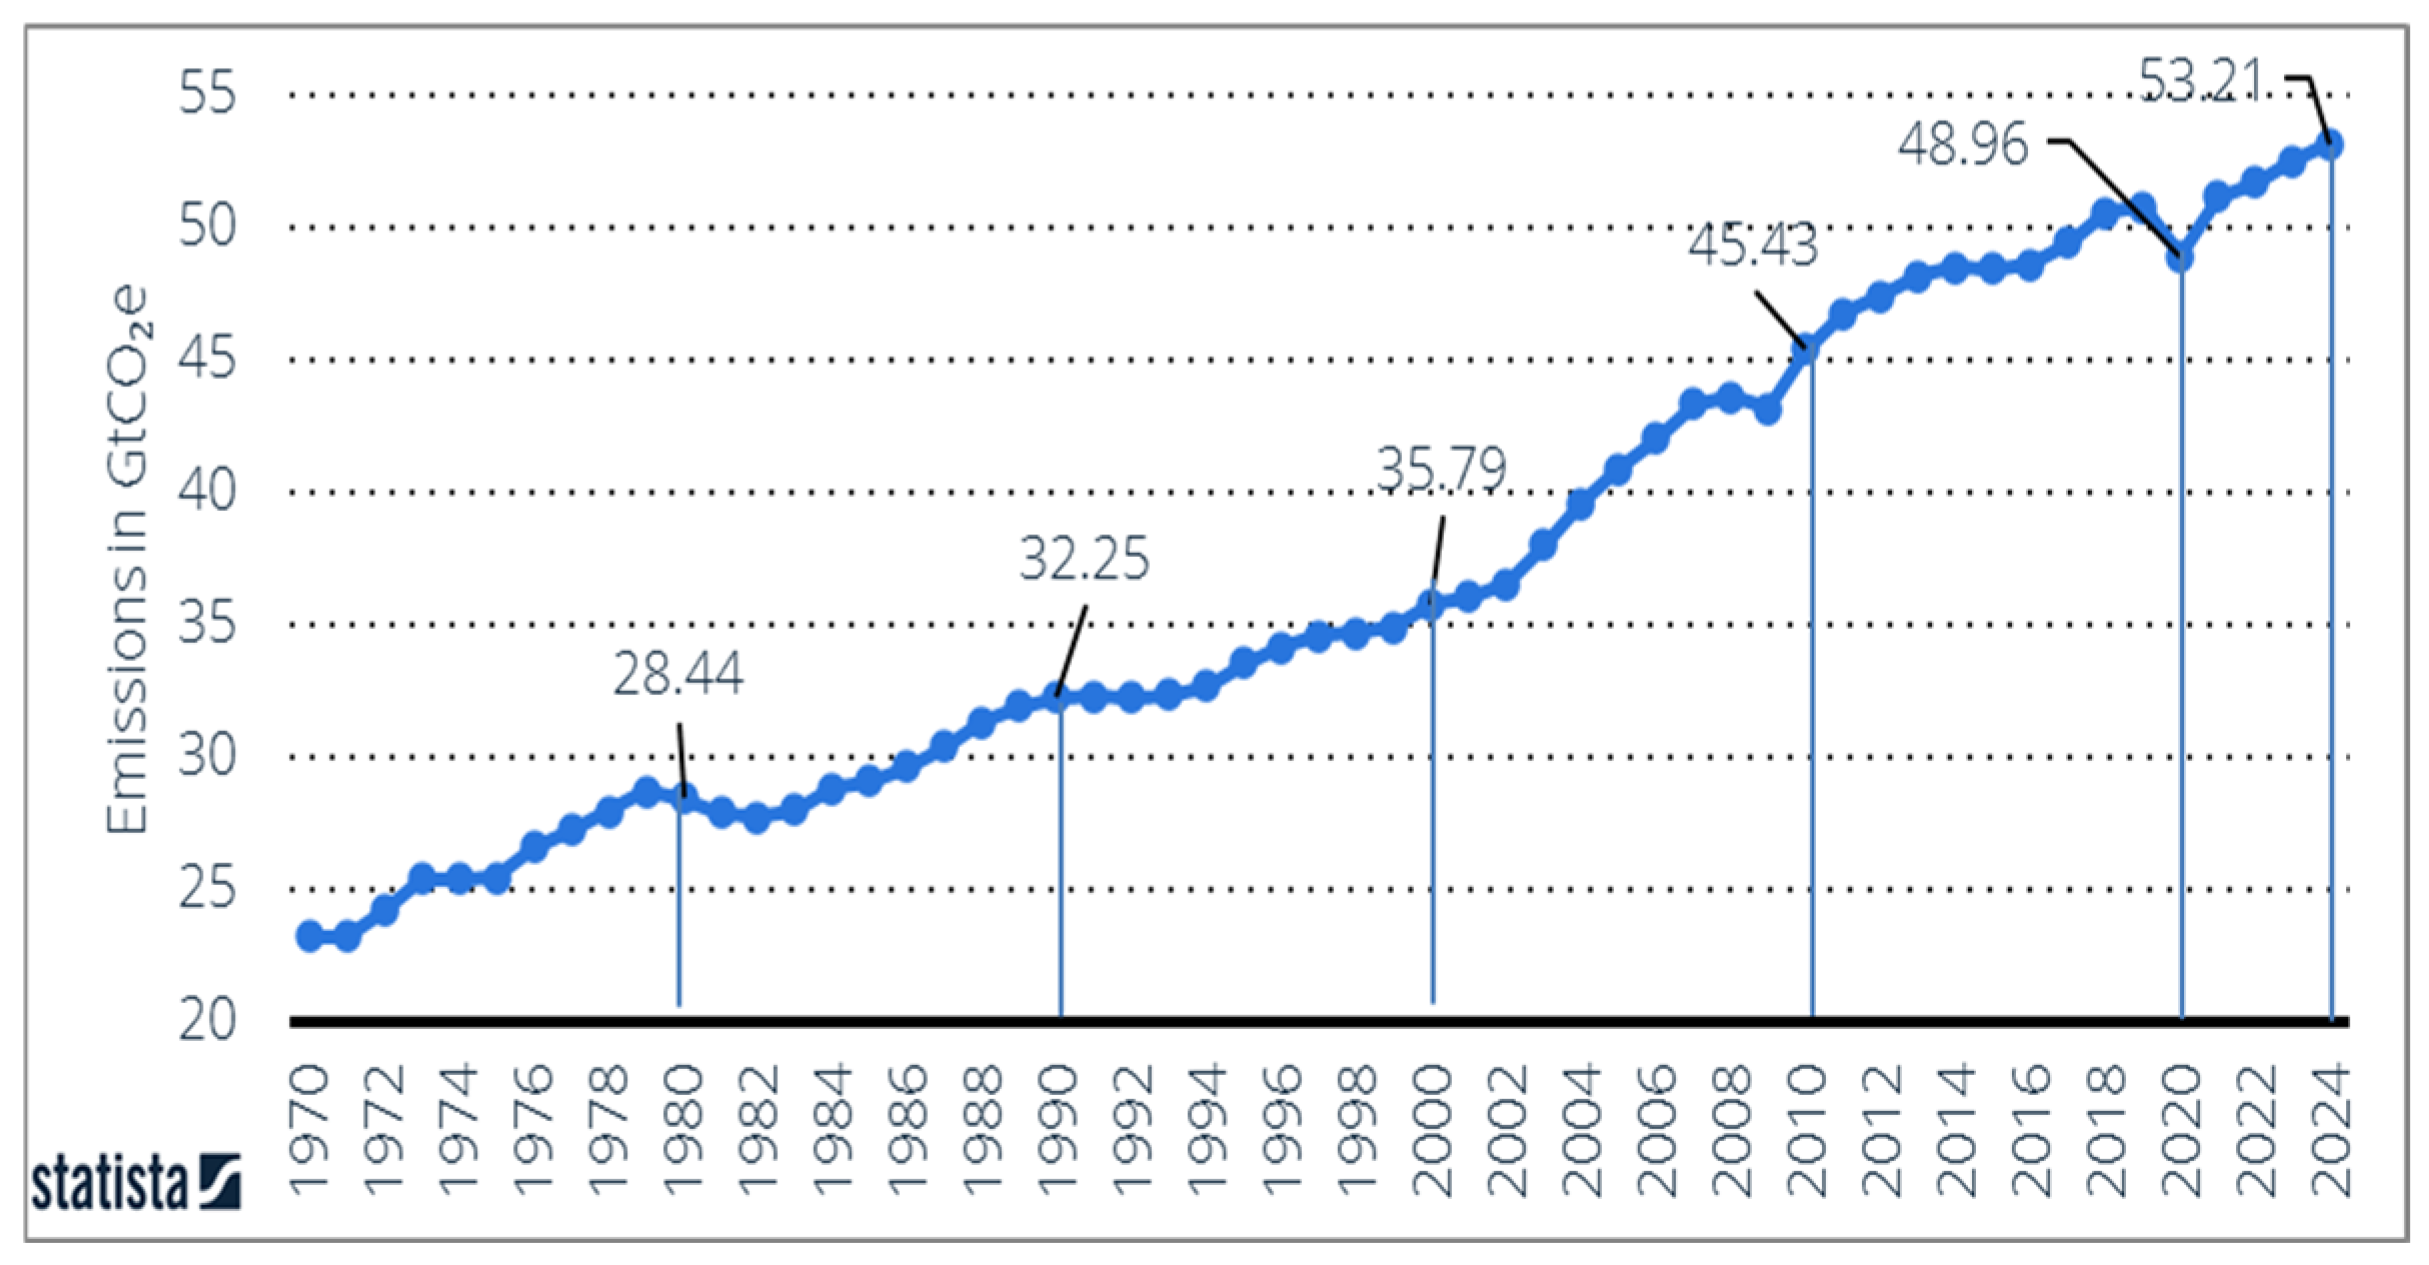
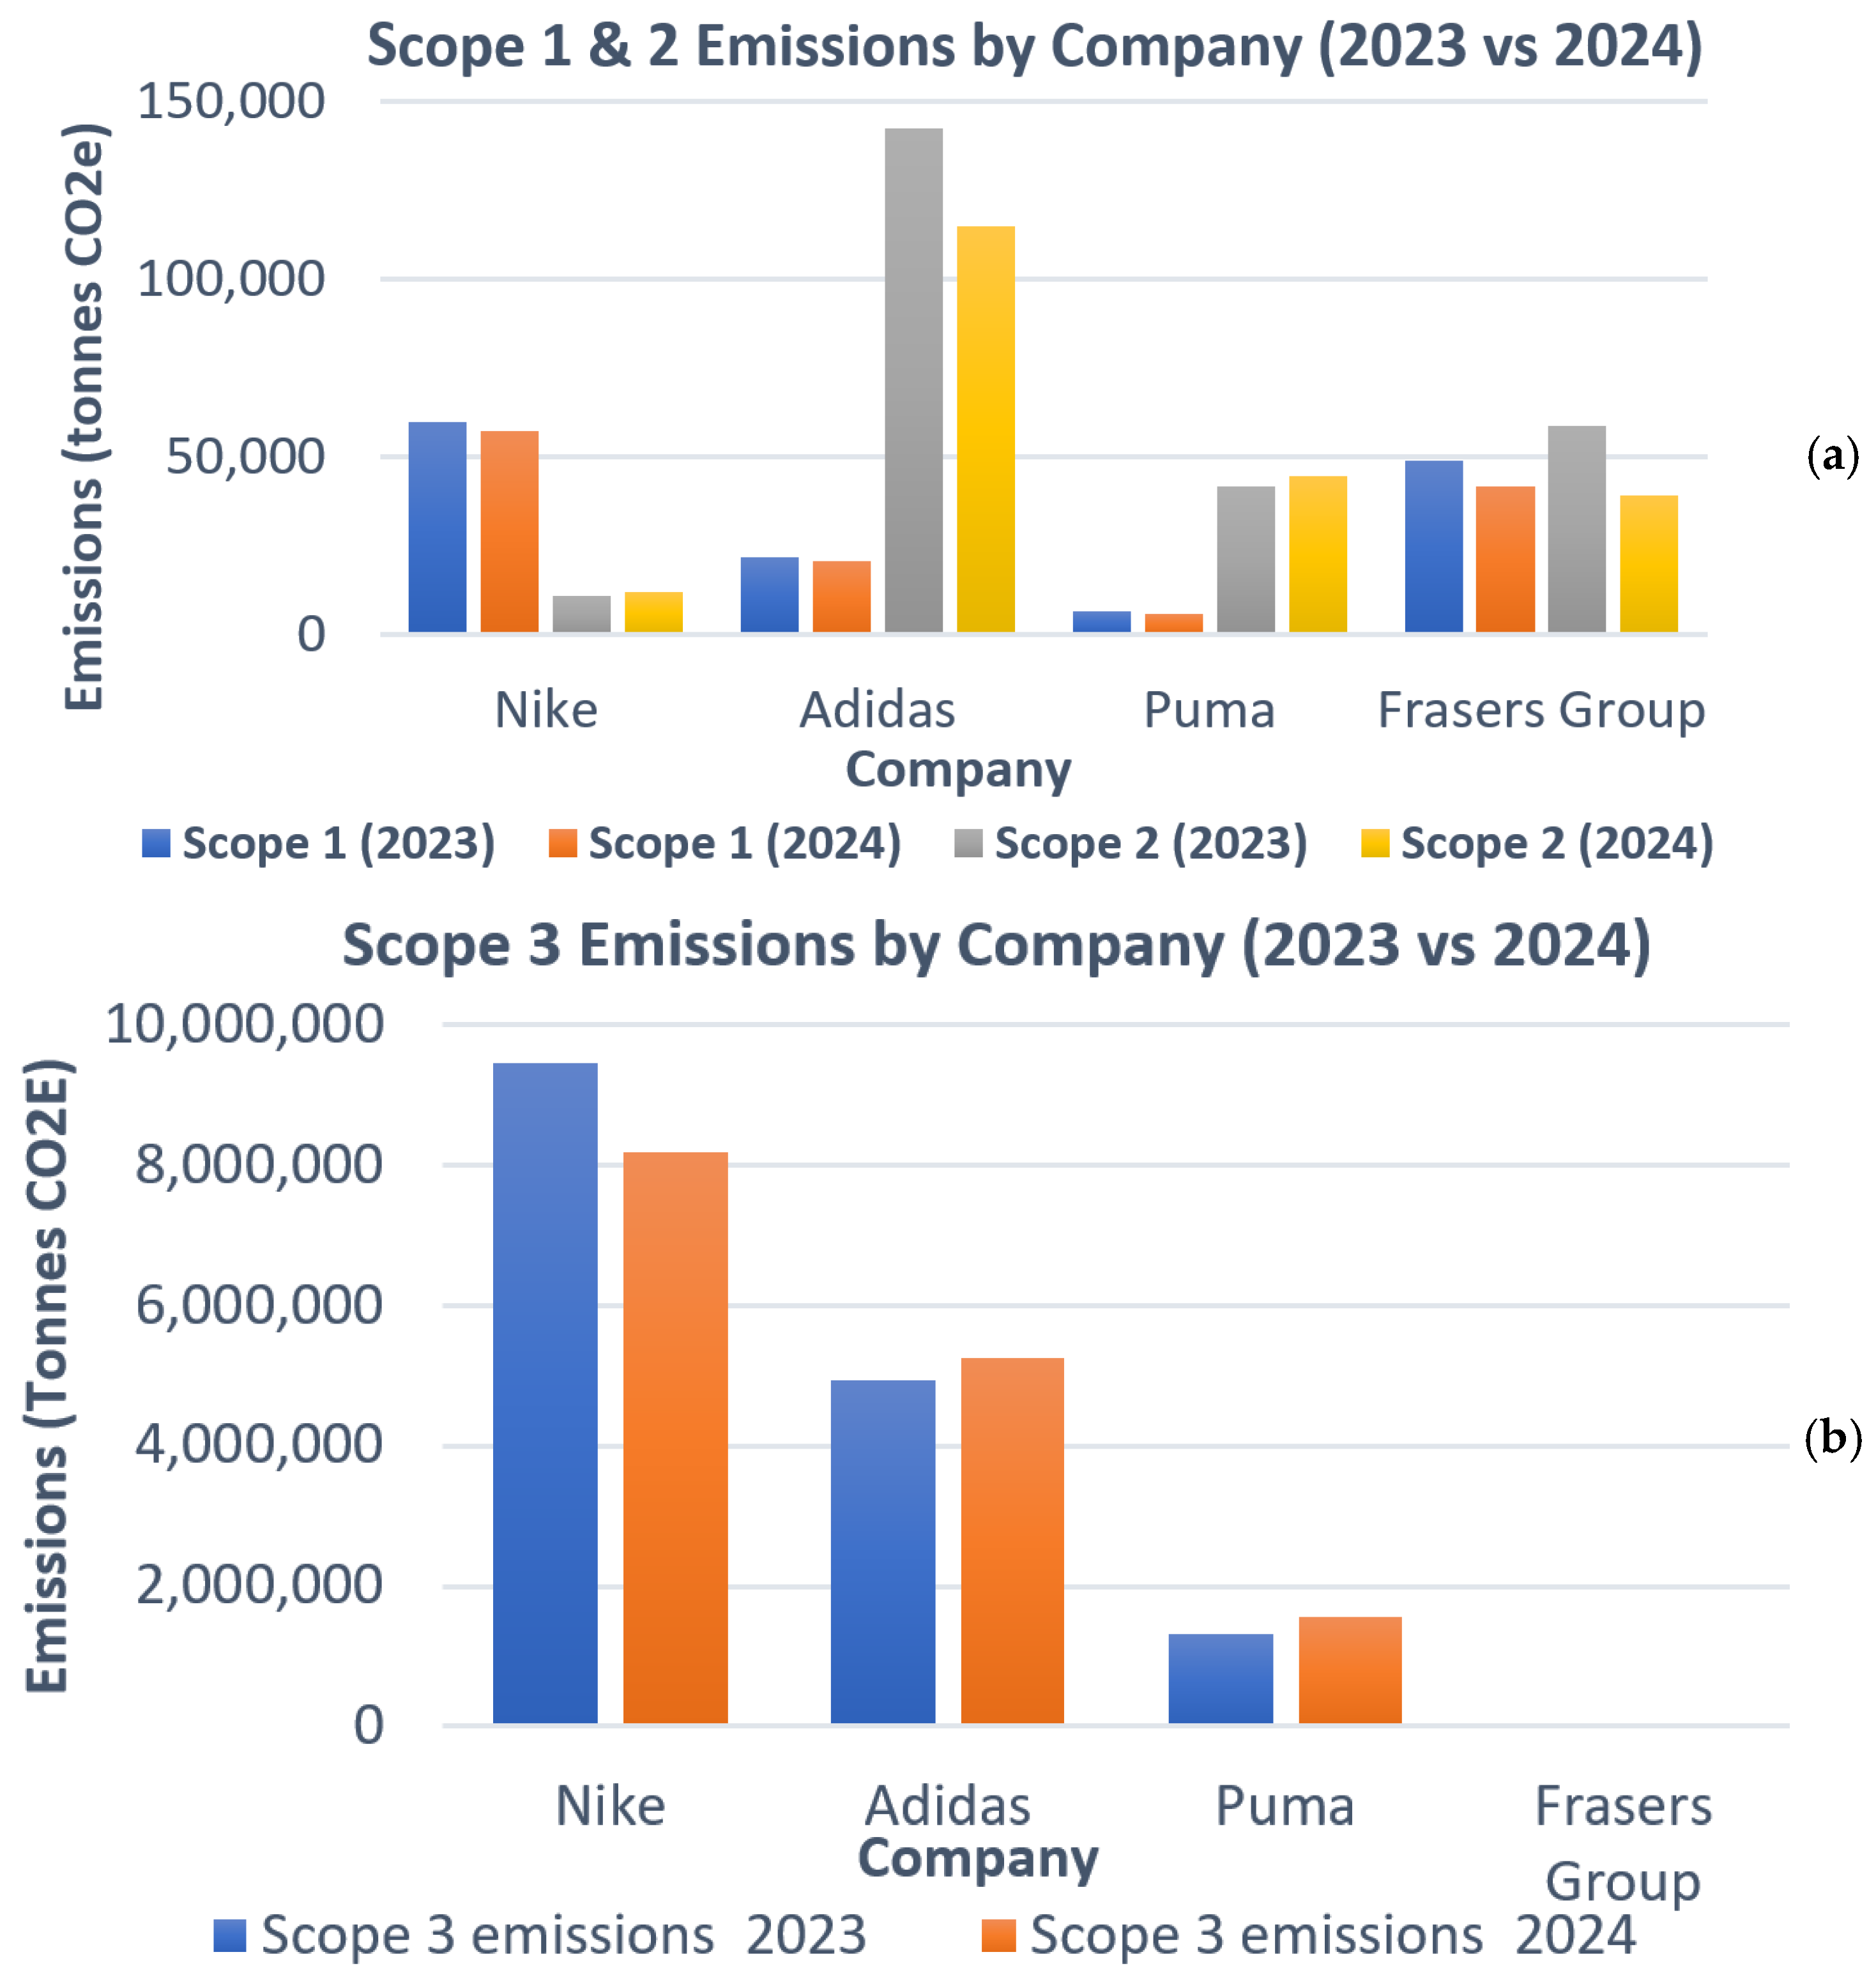
3.1. Industry GHG Emissions Analysis
3.2. Carbon Reduction Strategies Adopted by Industries
3.3. Digital Twin Deployment: Insights from a Case Study
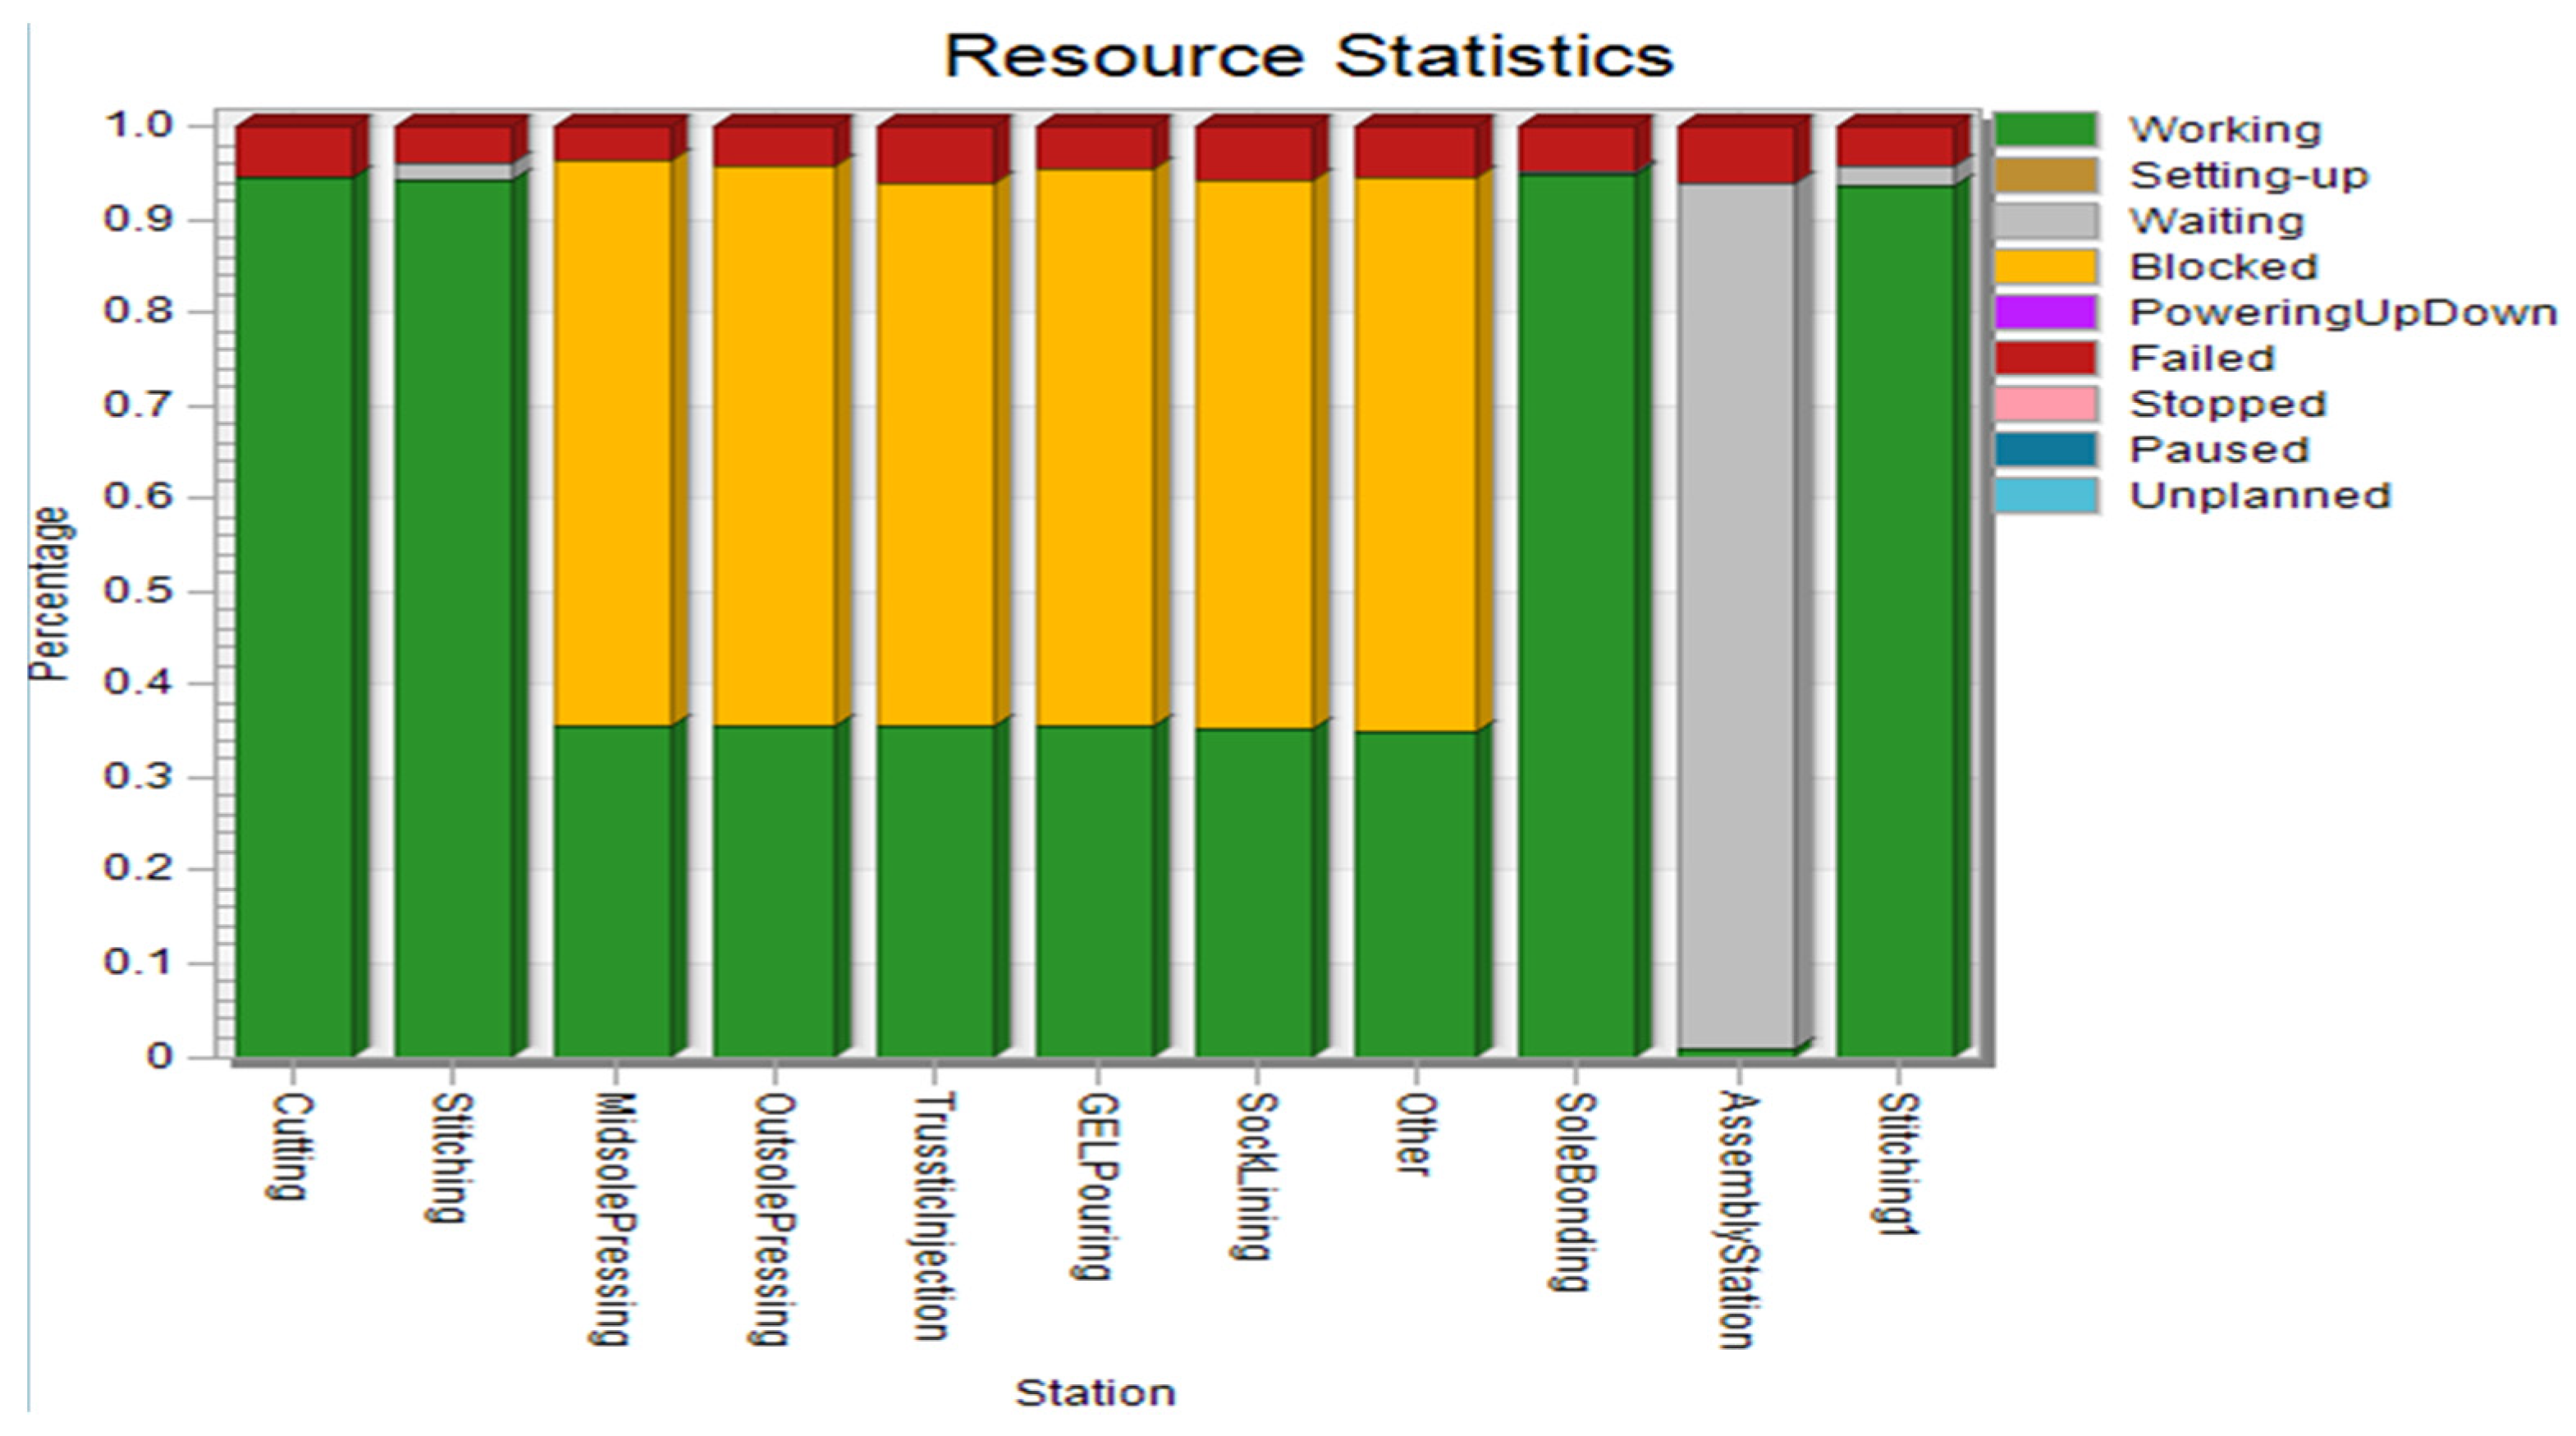
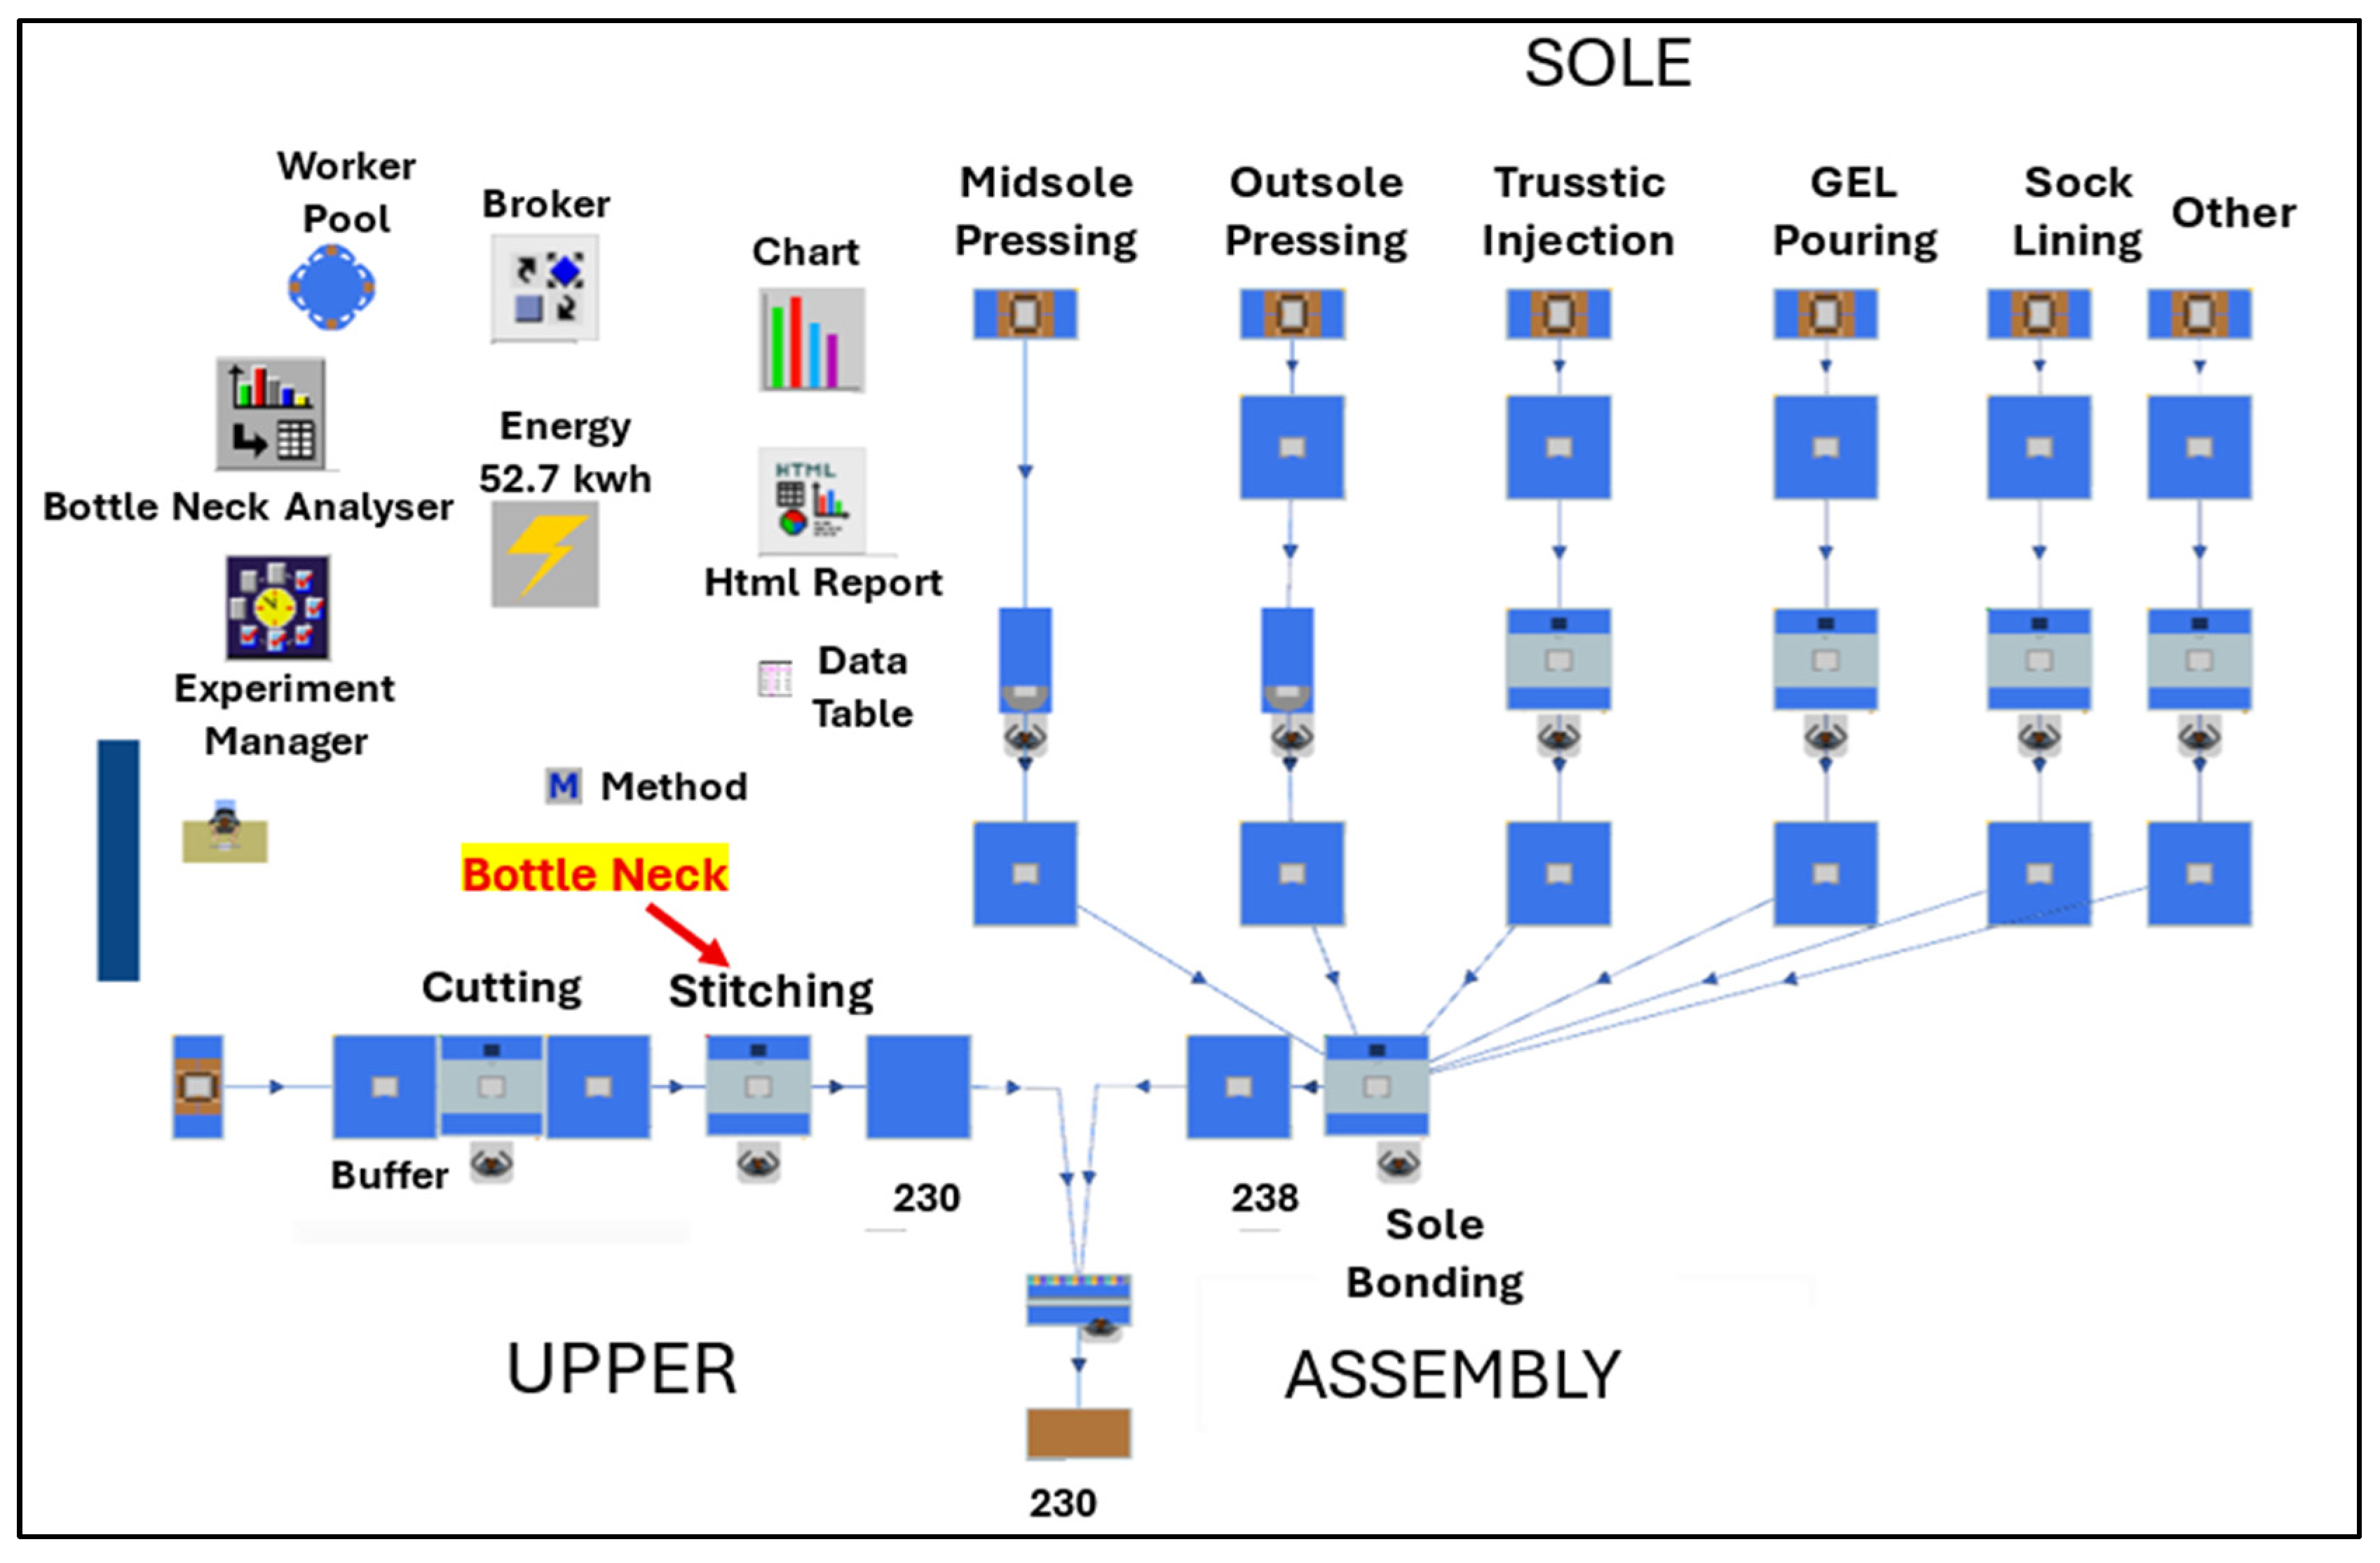
3.3.1. Current Layout Analysis
3.3.2. Proposed Layout Optimization
3.3.3. Results of Optimization in Proposed Layout
3.3.4. Critical Analysis and Explanation to Production Efficiency Improvement
3.4. Energy Consumption and Carbon Footprint Analysis
- E_total = Σ(E_i), where E_i represents the energy consumption (kWh) of workstation i over the simulation period.
- CO2e = E_total × EF, where EF = 0.233 kg CO2e/kWh (UK grid emission factor; [21]).
- Current Layout: CO2e_current = (52.71 kWh × 0.233 kg CO2e/kWh)
- ○
- =12.28 kg CO2e per shift.
- Proposed Layout: CO2e_proposed = 67.58 kWh × 0.233 kg CO2e/kWh
- ○
- =15.75 kg CO2e per shift
- Current Layout: CI_current = (12.28 kg CO2e/230 units)
- ○
- =0.0534 kg CO2e/unit = 53.4 g CO2e/unit;
- Proposed Layout: CI_proposed = (15.75 kg CO2e/450 units)
- ○
- =0.0350 kg CO2e/unit = 35.0 g CO2e/unit;
- Carbon Intensity Reduction:
- ○
- ΔCI = [(CI_current − CI_proposed)/CI_current] × 100%
- ○
- =[(53.4 − 35.0)/53.4] × 100% = 34.5% reduction
4. Conclusions
Author Contributions
Funding
Institutional Review Board Statement
Informed Consent Statement
Data Availability Statement
Conflicts of Interest
References
- Statista. Global Greenhouse Gas Emissions 1970–2024. Available online: https://www.statista.com/statistics/1285502/annual-global-greenhouse-gas-emissions/ (accessed on 10 October 2025).
- Charlton, E. This Is What Climate Change Costs Economies Around the World. World Economic Forum, 29 November 2023. Available online: https://www.weforum.org/stories/2023/11/climate-crisis-cost-global-economies/ (accessed on 10 October 2025).
- National Bureau of Economic Research. Homepage. Available online: https://www.nber.org/ (accessed on 10 October 2025).
- Deloitte Center for Sustainable Progress. Deloitte Research Reveals Inaction on Climate Change Could Cost the World’s Economy US$178 Trillion by 2070. Deloitte, 23 May 2022. Available online: https://www.deloitte.com/global/en/about/press-room/deloitte-research-reveals-inaction-on-climate-change-could-cost-the-world-economy-us-dollar-178-trillion-by-2070.html (accessed on 10 October 2025).
- Perdijk, E.W.; Luijten, J.; Selderijk, A.J. An Eco-Label for Footwear; Background Report (Report Number: 9041); CEA, Communication and Consultancy on Environment and Energy, Centrum TNO Leather and Shoes: Rotterdam, The Netherlands, 1994. [Google Scholar]
- Milà, L.; Domènech, X.; Rieradevall, J.; Fullana, P.; Puig, R. Application of life cycle assessment to footwear. Int. J. Life Cycle Assess. 1998, 3, 203–208. [Google Scholar] [CrossRef] [Scilit]
- Cheah, L.; Ciceri, N.D.; Olivetti, E.; Matsumura, S.; Forterre, D.; Roth, R.; Kirchain, R. Manufacturing-focused emissions reductions in footwear production. J. Clean. Prod. 2013, 44, 18–29. [Google Scholar] [CrossRef] [Scilit]
- Bocken, N.M.P.; de Pauw, I.; Bakker, C.; van der Grinten, B. Product design and business model strategies for a circular economy. J. Ind. Prod. Eng. 2016, 33, 308–320. [Google Scholar] [CrossRef] [Scilit]
- Rahman, H.F.; Servranckx, T.; Chakrabortty, R.K.; Vanhoucke, M.; Sawah, S.E. Manufacturing project scheduling considering human factors to minimize total cost and carbon footprints. Appl. Soft Comput. 2022, 131, 109764. [Google Scholar] [CrossRef] [Scilit]
- Rosen, R.; Von Wichert, G.; Lo, G.; Bettenhausen, K.D. About The Importance of Autonomy and Digital Twins for the Future of Manufacturing. IFAC-PapersOnLine 2015, 48, 567–572. [Google Scholar] [CrossRef] [Scilit]
- Tao, F.; Zhang, M. Digital Twin Shop-Floor: A new Shop-Floor paradigm towards smart manufacturing. IEEE Access 2017, 5, 20418–20427. [Google Scholar] [CrossRef] [Scilit]
- Park, K.T.; Nam, Y.W.; Lee, H.S.; Im, S.J.; Noh, S.D.; Son, J.Y.; Kim, H. Design and implementation of a digital twin application for a connected micro smart factory. Int. J. Comput. Integr. Manuf. 2019, 32, 596–614. [Google Scholar] [CrossRef] [Scilit]
- Wang, S.; Wan, J.; Zhang, D.; Li, D.; Zhang, C. Towards smart factory for industry 4.0: A self-organized multi-agent system with big data based feedback and coordination. Comput. Netw. 2016, 101, 158–168. [Google Scholar] [CrossRef] [Scilit]
- Boschert, S.; Rosen, R. Digital Twin—The simulation aspect. In Mechatronic Futures; Hehenberger, P., Bradley, D., Eds.; Springer: Cham, Switzerland, 2016; pp. 59–74. [Google Scholar]
- Mehkri, Z. How Digital Twin Simulations Advance Digital Transformation in Manufacturing. Control Engineering, 7 April 2023. Available online: https://www.controleng.com/articles/how-digital-twin-simulations-advance-digital-transformation-in-manufacturing/ (accessed on 10 October 2025).
- Nike, Inc. Nike Sustainability. Available online: https://www.nike.com/sustainability (accessed on 10 October 2025).
- Adidas AG. Adidas Sustainability. Available online: https://www.adidas.co.uk/sustainability (accessed on 10 October 2025).
- PUMA SE. PUMA’s Approach on Sustainability. Available online: https://about.puma.com/en/sustainability/our-approach (accessed on 10 October 2025).
- Frasers Group PLC. Annual Report & Accounts 2024. 2024. Available online: https://www.frasers.group/financials (accessed on 10 October 2025).
- ISO 14083:2023; Greenhouse Gases—Quantification and Reporting of Greenhouse Gas Emissions Arising from Transport Chain Operations. ISO: Geneva, Switzerland, 2023. Available online: https://www.iso.org/standard/78864.html (accessed on 10 October 2025).
- Freightos. Freight CO2 Emissions Calculator. Available online: https://www.webcargo.co/knowledge-base/tools/freight-CO2-emissions-calculator/ (accessed on 10 October 2025).
- EN 16258:2012; Methodology for Calculation and Declaration of Energy Consumption and GHG Emissions of Transport Services (Freight and Passengers). European Committee for Standardization: Brussels, Belgium, 2012. Available online: https://standards.iteh.ai/catalog/standards/cen/e9512863-2632-47df-b6cf-648d725a01e3/en-16258-2012 (accessed on 10 October 2025).
- de Jong, S.; Antonissen, K.; Hoefnagels, R.; Lonza, L.; Wang, M.; Faaij, A.; Junginger, M. Life-cycle analysis of greenhouse gas emissions from renewable jet fuel production. Biotechnol. Biofuels 2017, 10, 64. [Google Scholar] [CrossRef] [Scilit] [PubMed]
- CO2-Emissiefactoren. Downloads. Available online: https://co2emissiefactoren.nl/downloads/ (accessed on 10 October 2025).
- Argonne National Laboratory. Lifecycle Analysis of Alternative Aviation Fuels (GREET Model). 2016. Available online: https://publications.anl.gov/anlpubs/2016/05/127787.pdf (accessed on 10 October 2025).


| Step 0 | This transport service is composed of one leg |
| Step 1 | LEG 1: Leg air: BLR airport -> BHX airport. |
| Step 1.1 | Great circle distance of 8154.82 km. |
| Step 1.2 | Adding 95.0 km in accordance with EN 16258:2012(E) 8.2.3.1; the total is 8249.82 km. |
| Step 1.3 | The default value of 6.286 multiplied by an estimated 8249.82 km and weight of 1.0 ton gives Ew = 51,858.37 MJ. |
| Step 1.4 | The default value of 0.55 multiplied by an estimated 8249.82 km and weight of 1.0 ton gives Gw = 4537.4 kg. |
| Step 1.5 | The default value of 4.91 multiplied by an estimated 8249.82 km and weight of 1.0 ton gives Et = 40,506.62 MJ. |
| Step 1.6 | The default value of 0.431 multiplied by an estimated 8249.82 km and weight of 1.0 ton gives Gt = 3555.67 kg. |
| GHG Emissions (in tons CO2e) | Scope 1 Emissions | Scope 2 Emissions | Scope 3 Emissions | |||
|---|---|---|---|---|---|---|
| Year (Change) | Year (Change) | Year (Change) | ||||
| 2023 | 2024 | 2023 | 2024 | 2023 | 2024 | |
| Nike (page 13/24 Nike Report) | 59,672 | 57,390 | 11,051 | 12,120 | 9,466,520 | 8,196,965 |
| (−3.82%) | (9.67%) | (−13.41%) | ||||
| Adidas (page 192 Adidas Report) | 21,779 | 20,844 | 142,457 | 114,970 | 4,937,382 | 5,248,523 |
| (−4%) | (−19%) | (6%) | ||||
| Puma (page 115/118 puma Report) | 6709 | 5950 | 41,675 | 44,715 | 1,326,791 | 1,575,252 |
| (−11%) | (7%) | (19%) | ||||
| Frasers Group (page 44 Frasers Report) | 49,081 | 41,693 | 58,755 | 39,163 | 15,436 | 15,457 |
| (−17.72%) | (−33.33%) | (0.14%) | ||||
| Name | Mean Lifetime | Throughput | Throughput per Hour | Production | Storage | Value Added |
|---|---|---|---|---|---|---|
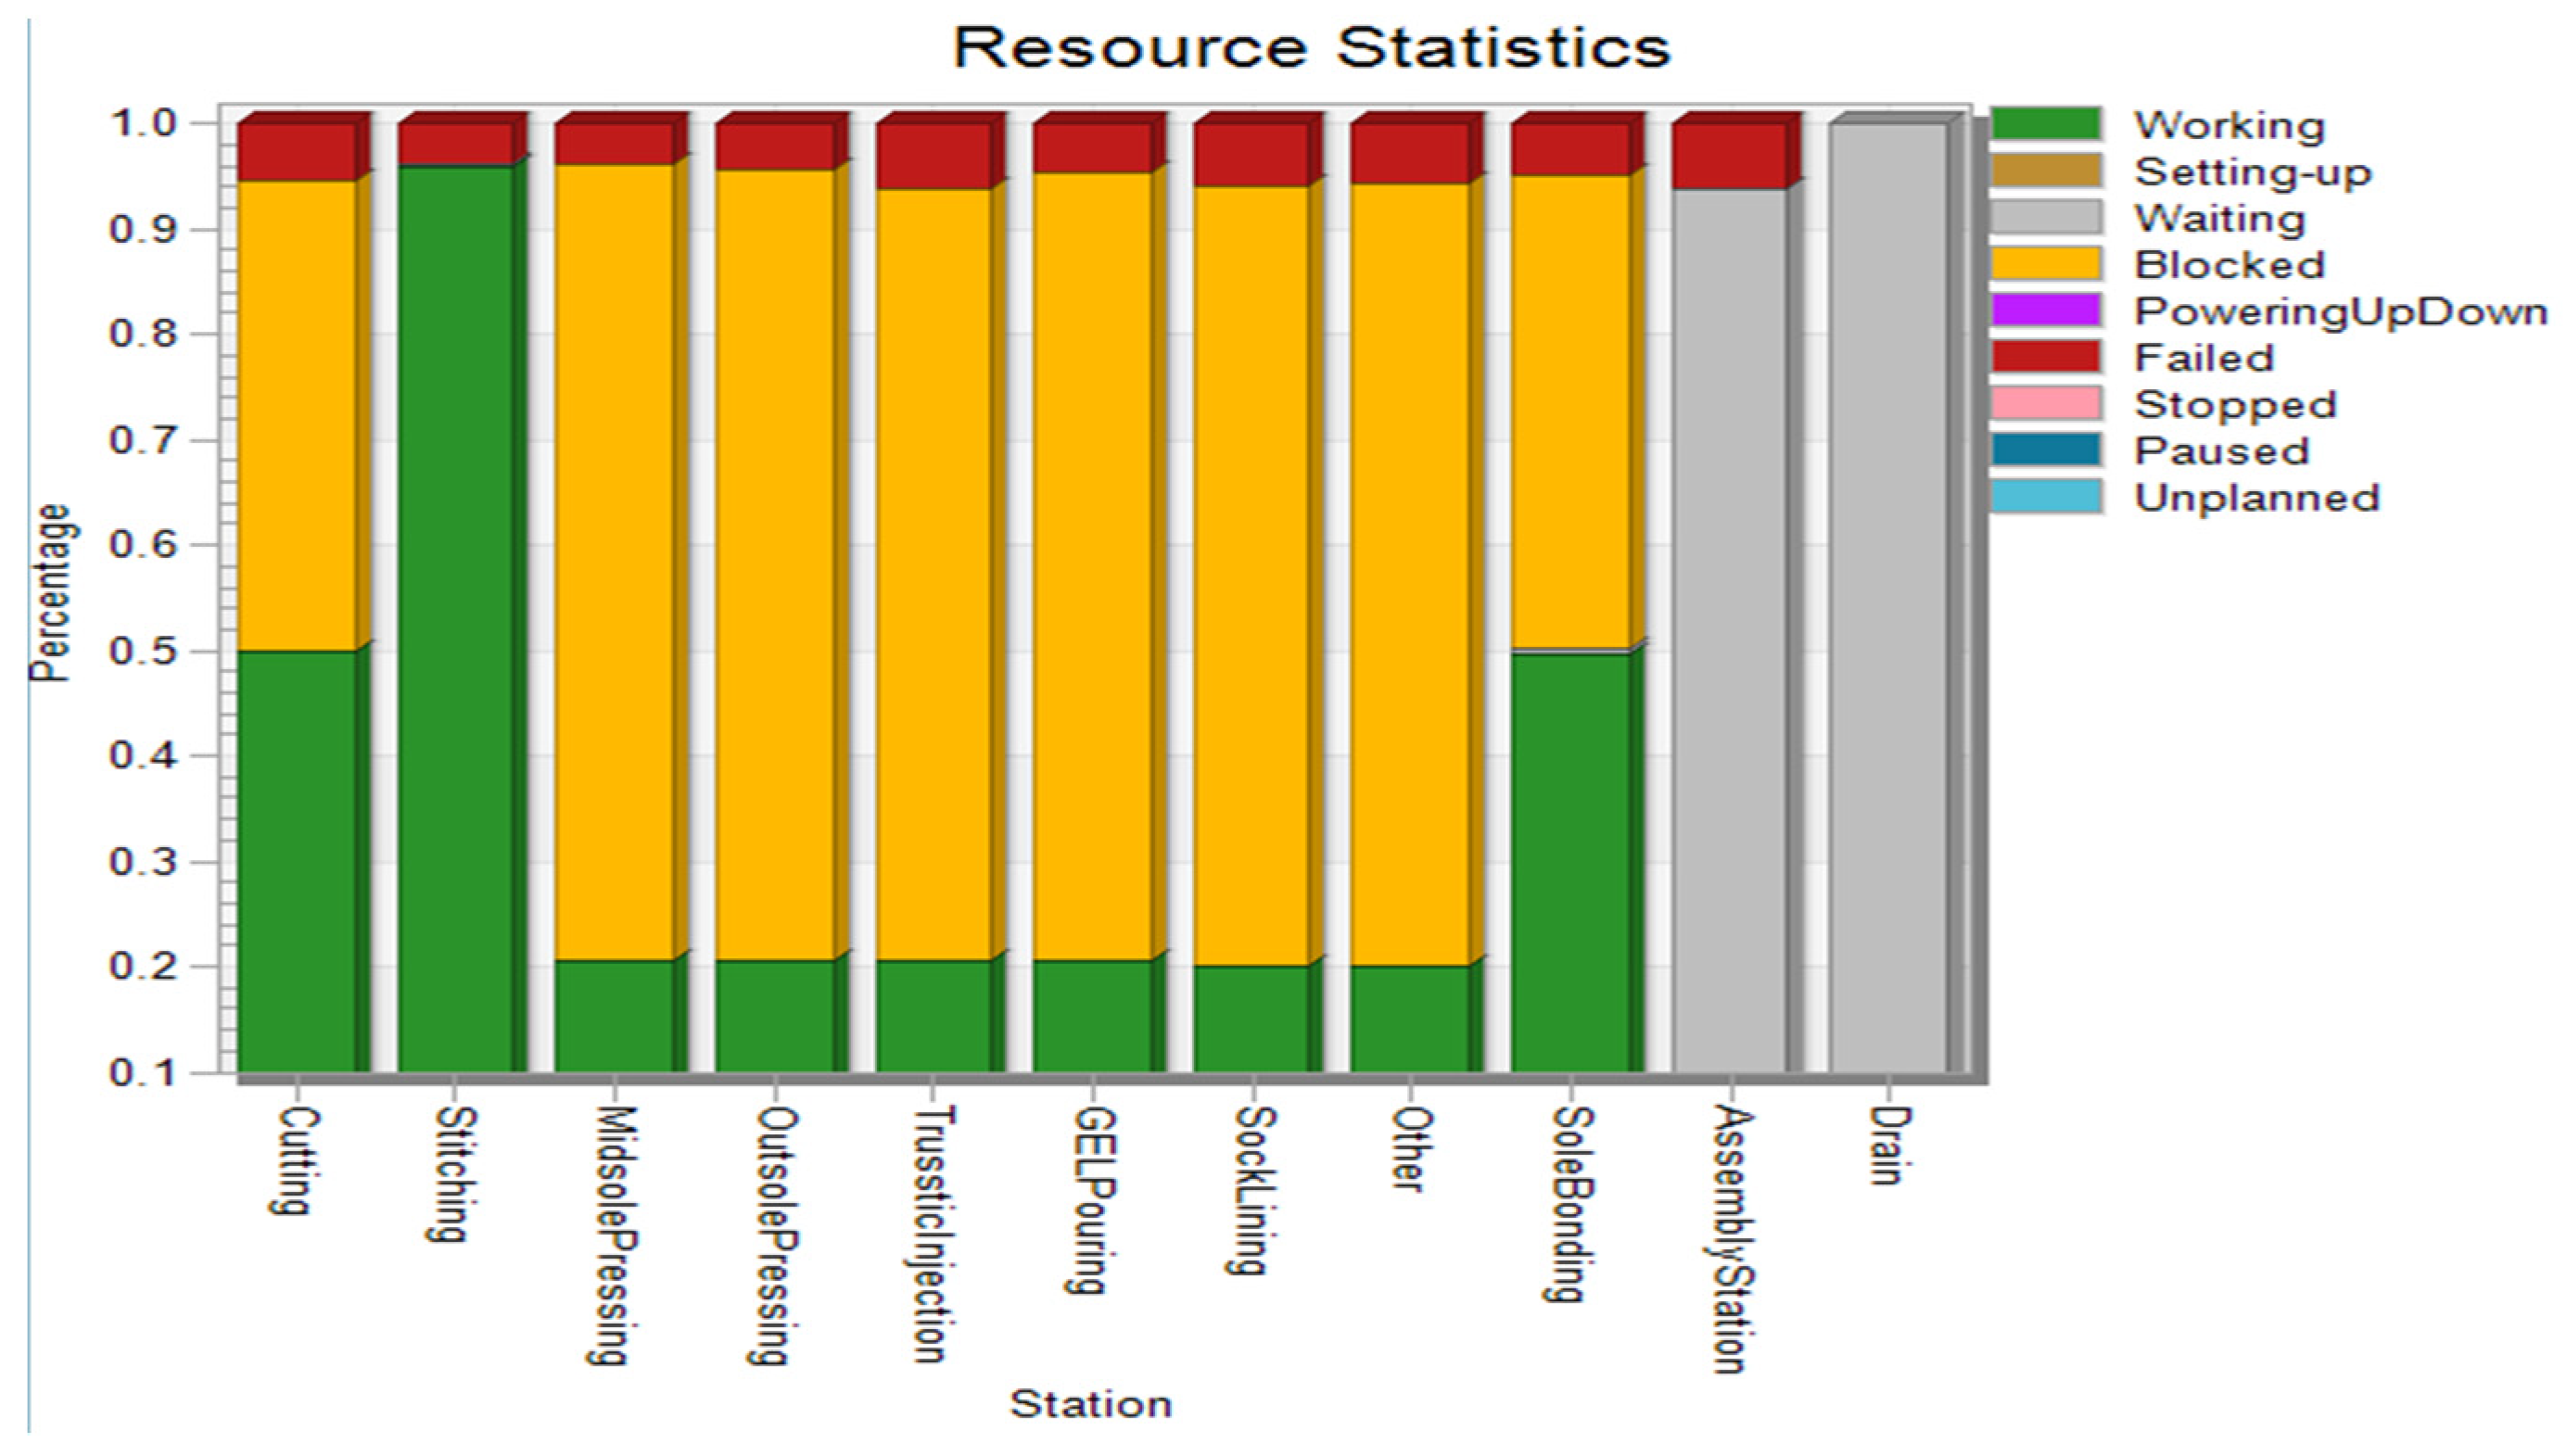
| Part | 37:47.7 | 230 | 28.75 | 15.94% | 84.06% | 7.96% |
| Name | Mean Life Time | Throughput | Throughput per Hour | Production | Storage | Value Added |
|---|---|---|---|---|---|---|
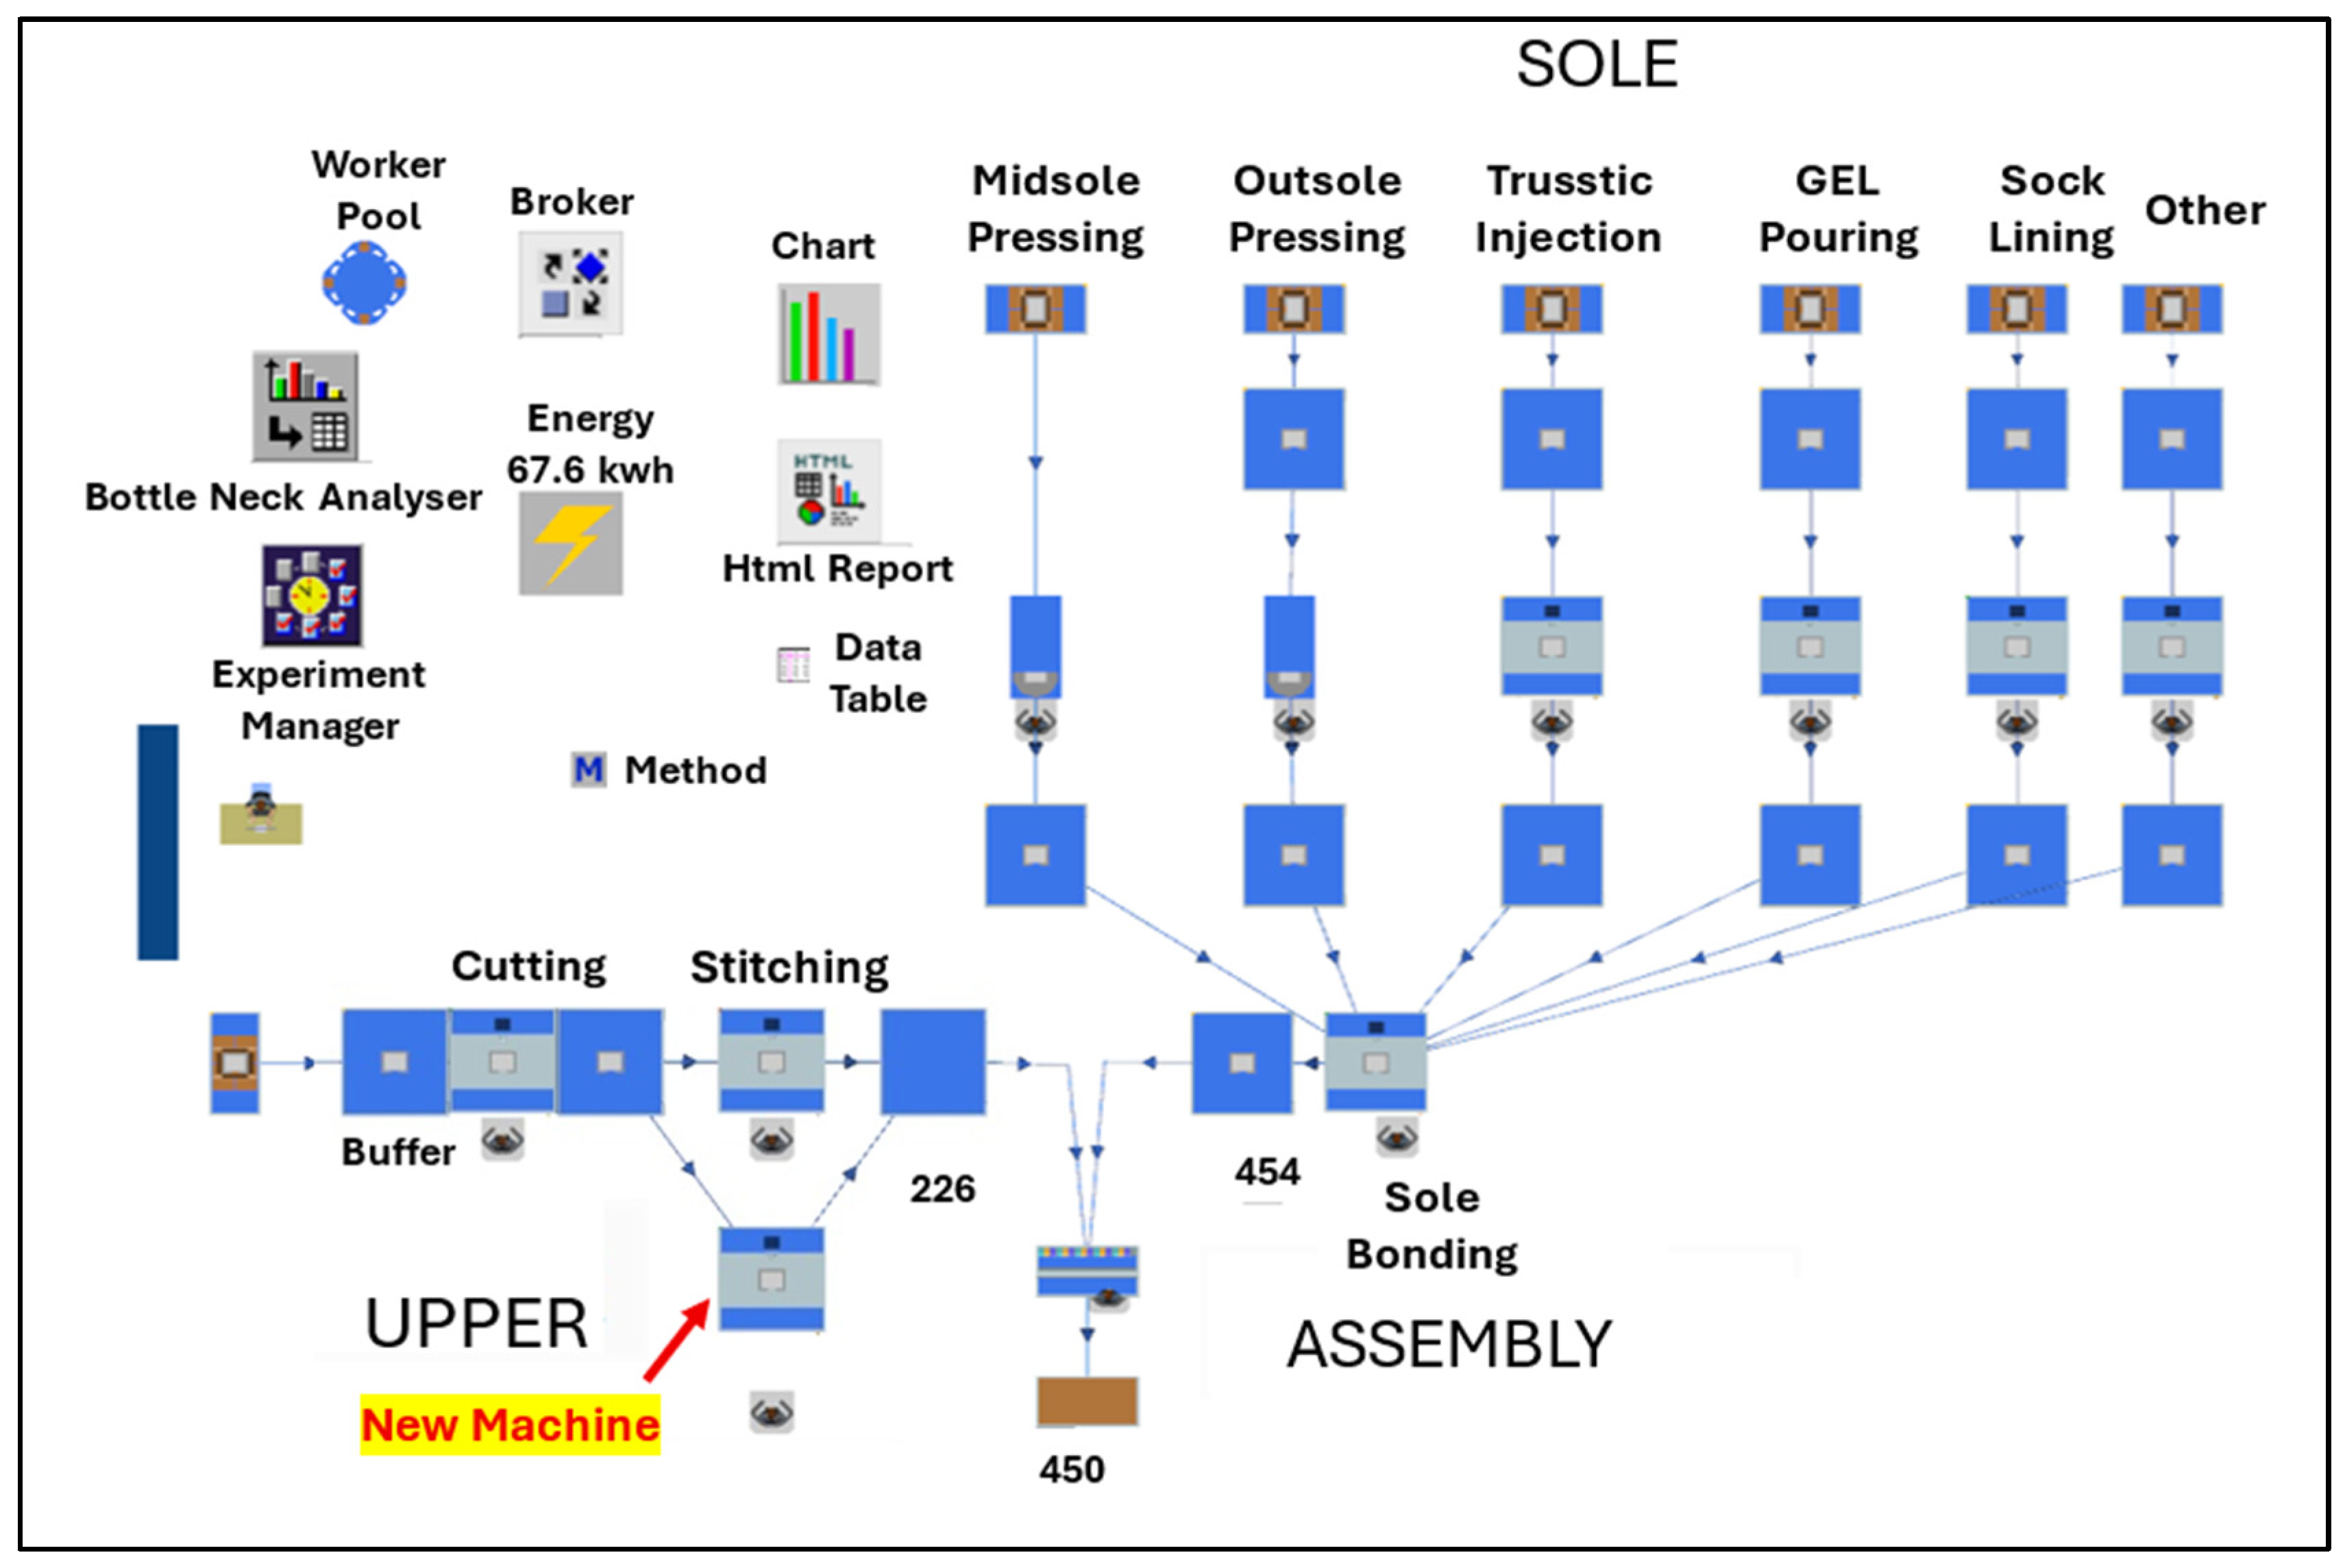
| Part | 13:51.3 | 450 | 56.25 | 30.93% | 69.07% | 21.71% |
| Workstation | Current Layout Energy (kWh) | Proposed Layout Energy (kWh) |
|---|---|---|
| Cutting | 5.996 | 7.781 |
| Stitching | 7.836 | 7.769 |
| Midsole Pressing | 4.817 | 5.417 |
| Outsole Pressing | 4.817 | 5.417 |
| Trusstic Injection | 4.817 | 5.417 |
| GEL Pouring | 4.817 | 5.414 |
| Sole Bonding | 5.988 | 7.789 |
| Assembly Station | 4.016 | 4.031 |
| Sock Lining | 4.805 | 5.406 |
| Other (Finishing) | 4.8 | 5.4 |
| Stitching1 (2nd machine) | — | 7.746 |
| Total Energy (kWh/shift) | 52.71 | 67.58 |
| Parameter | Current Layout | Proposed Layout | Change |
|---|---|---|---|
| Production output (units/shift) | 230 | 450 | 95.70% |
| Total energy (kWh/shift) | 52.71 | 67.58 | 28.20% |
| Energy intensity (kWh/unit) | 0.229 | 0.15 | −34.50% |
| CO2e per shift (kg) | 12.28 | 15.75 | 28.20% |
| CO2e per unit (g) | 53.4 | 35 | −34.50% |
| Annual production (250 days) | 57,500 | 112,500 | 95.70% |
| Annual CO2 footprint (metric tons) | 3.07 | 3.94 | 28.20% |
Disclaimer/Publisher’s Note: The statements, opinions and data contained in all publications are solely those of the individual author(s) and contributor(s) and not of MDPI and/or the editor(s). MDPI and/or the editor(s) disclaim responsibility for any injury to people or property resulting from any ideas, methods, instructions or products referred to in the content. |
© 2026 by the authors. Licensee MDPI, Basel, Switzerland. This article is an open access article distributed under the terms and conditions of the Creative Commons Attribution (CC BY) license.
Share and Cite
Devireddy, M.R.; Anbalagan, A.; George, S.; Kauffman, M.; Long, T. Reducing Carbon Emissions in Shoe Manufacturing Through Digital Twin-Enabled Project Management. Eng. Proc. 2026, 130, 3. https://doi.org/10.3390/engproc2026130003
Devireddy MR, Anbalagan A, George S, Kauffman M, Long T. Reducing Carbon Emissions in Shoe Manufacturing Through Digital Twin-Enabled Project Management. Engineering Proceedings. 2026; 130(1):3. https://doi.org/10.3390/engproc2026130003
Chicago/Turabian StyleDevireddy, Mohan Reddy, Arivazhagan Anbalagan, Shone George, Marcos Kauffman, and Tengfei Long. 2026. "Reducing Carbon Emissions in Shoe Manufacturing Through Digital Twin-Enabled Project Management" Engineering Proceedings 130, no. 1: 3. https://doi.org/10.3390/engproc2026130003
APA StyleDevireddy, M. R., Anbalagan, A., George, S., Kauffman, M., & Long, T. (2026). Reducing Carbon Emissions in Shoe Manufacturing Through Digital Twin-Enabled Project Management. Engineering Proceedings, 130(1), 3. https://doi.org/10.3390/engproc2026130003