Abstract
One of the major determinants of crop productivity and sustainable agricultural practices is soil fertility. Proper soil assessment helps farmers make informed decisions about nutrients and fertilizers. This study utilizes 16 machine learning classifiers for soil fertility prediction, including learner-based, ensemble-based, instance-based, and probabilistic-based models. The model’s performance is assessed using accuracy, precision, recall, and F1-score. This paper presents a machine learning model for predicting soil fertility based on soil physicochemical characteristics. The data used in the research comprise vital soil parameters: nitrogen, phosphorus, potassium, pH, organic carbon, electrical conductivity, and micronutrients. Missing-value imputation, label encoding, and feature standardization are among the data preprocessing methods used to enhance data quality. Correlation analysis, ANOVA F-score, and mutual information were used to assess feature importance and determine the most significant soil characteristics. The experimental observation reveals that the RF model achieves an accuracy of 90.91% compared to the other models. Additional assessment using multi-class Receiver Operating Characteristic (ROC) and Precision–Recall (PR) curves showed excellent discriminative ability across the dominant soil fertility, which was of high quality. The findings show that machine learning models, especially ensemble-based models, are effective at estimating soil fertility levels. The proposed framework provides a data-driven, reliable decision-support system to assess soil fertility, enabling farmers and agricultural experts to enhance nutrient management and crop production.
1. Introduction
Soil fertility is one of the critical determinants of agricultural productivity, crop quality, and the long-term sustainability of farming systems. Healthy edaphic habitats provide the nutrients plants need for growth and directly affect food security and economic stability, especially in agrarian economies. Accurate estimates of soil fertility can be used to optimize fertilizer applications, improve crop production, and reduce the environmental degradation caused by excessive chemical inputs. Traditional approaches to measuring soil fertility rely on laboratory tests of its chemical properties, which are often time-intensive and expensive and require specialized facilities. These restrictions make alternative methods less available to small and marginal farmers, particularly in rural, resource-constrained areas. In addition, the manual interpretation of soil test results is subject to bias and does not scale well when faced with large volumes of soil data. In this respect, machine learning (ML) methods have become powerful tools for extracting salient patterns from complex, high-dimensional agricultural data. ML-based models can reproduce non-linear dependencies between soil characteristics and the degree of fertility and provide an objective, automated substitute for traditional assessment procedures. Many studies have explored the use of ML algorithms in the agricultural sector for activities such as crop prediction, soil prediction, and nutrient prescription. Although positive findings have been reported, many studies that have survived focus on a small number of models or use accuracy-based assessment, which may be insufficient to capture performance in multi-class or imbalanced settings. Also, there is a strengthened lack of focus on model interpretability and the use of overall performance measures, including Receiver Operating Characteristic (ROC) and Precision–Recall (PR) curves. To prevent these failures, this research paper proposes an integrated ML model to forecast soil fertility based on physicochemical soil properties. The approach embraces data preprocessing with systematics, statistical measurement of feature importance, and a broad comparative study of 15 supervised ML classifiers that span a variety of learning paradigms. In addition to the traditional performance measurements, the discriminative strength of the high-end model is evaluated using multi-class ROC-AUC and PR-AUC analyses under one-vs.-rest strategy. Moreover, feature importance analysis identifies key soil parameters that can be used to predict fertility, thereby enhancing model interpretability and usefulness.
1.1. Objective of the Study
In this paper, our primary objective is to predict soil fertility using machine learning models. This study utilizes linear, probabilistic, and instance-based learning to predict whether the soil is fertile or not.
1.2. Major Contributions
- In this study, we employed sixteen machine learning classifiers across the different performance metrics that are used for handling class imbalance issues for soil fertility prediction
- The study clearly examines the trade-offs between accuracy and F1-score, providing insights about model generalization and dependability rather than isolated performance improvements.
- The paper presents strong evidence demonstrating that ensemble learning techniques consistently outperform non-ensemble models in terms of both performance and stability
This study consists of four sections, where Section 1 presents the need for agriculture and the role of soil fertility prediction using machine learning models, and Section 2 discusses the state-of-the-art of soil fertility predictions. Section 3 develops the proposed model, where we discuss each phase, starting from data collection to prediction. Section 4 presents the results and discussion, followed by the conclusion.
2. Literature Review
Raut, S. and Chitre, V. [1], the authors, discussed how the Internet of Things (IoT), sensor technologies, and machine learning (ML) can be used to modernize the traditional farming methods and prevent the lack of productivity that can be explained by soil erosion and a lack of nutrients. They have explored various hardware settings, including Arduino, Raspberry Pi, and wireless sensor networks (WSN), along with sensors that detect pH, temperature, and NPK levels. Pant, J. et al. [2] used algorithms such as J48 and K-nearest neighbors (KNN) in studies that focus on individual crop systems to classify and predict the outputs of wheat. In India, numerous studies have used Decision Trees, Random Forests, and SVMs to classify a wide range of agricultural soil parameters across different states. Terhoeven-Urselmans T. et al. [3] presented the soil fertility prediction. In their study, the authors have considered 971 diversified samples. The ISRIC database has been considered. Apart from this, the performance measure (RMSE) used is 0.75 Ph unit, 0.12, and 0.15, respectively. Chandra, H. et al. [4] performed experimental work on soil fertility prediction using XAI. This work used an RF-based model and analyzed the physical and biological properties of the dataset to support plant growth. It has been observed that the model has an accuracy of 97.02%. Shahare, Y.R. et al. [5] presented a paper on soil fertility prediction based on a Random Forest classifier. The author had used the performance metrics to analyze the soil properties. The metrics used include AUC, precision, recall, F1-score, and error rate. The author applied the regression approach, including MSE and R2, and achieved 93% accuracy during training; during testing, the model’s accuracy was 83%.
Kassim, Y.B. et al. [6] proposed a dual-methodology framework called ASUR, which uses Random Forest classifiers and regressors to predict soil fertility levels (Low, Medium, and High) in the Bhandara district of Maharashtra, India. The authors examined a location-specific dataset that included 12 key chemical variables: the main macronutrients (N, P, K), the micronutrients (Zn, Fe, Cu, Mn, B, S), and the important physicochemical characteristics (pH, EC, OC). They divided the dataset into an 80:20 ratio (training:testing) and then evaluated the model using a tenfold cross-validation. Selvi, C. T. et al. [7] conducted their study on eight experimental plots located in the territories of two villages (Bognaayili and Gauwogo) during 2022 and 2023. High-resolution RGB imagery was collected for further analysis. Abekoon, T. et al. [8] conducted a study exploring the limitations of traditional manual soil testing, including high financial requirements and long processing time, and proposed a deep learning model, the Enhanced Spatiotemporal Graph Neural Network (STGNN). To support the model’s relevance in agronomic studies, their study used a publicly available Kaggle dataset containing 18,850 samples with essential chemical constituents annotated (Nitrogen, Phosphorus, Potassium, and pH). The study used Adaptive Graph Convolutional Layers (AGCL) to learn complex spatial interactions in the dataset and Gated Recurrent Units (GRU) to learn temporal dynamics. Gouda, M., et al. [9] developed a model based on an ANN with a multilayer feedforward network for predicting soil organic carbon in arid zones. The experimental observation revealed that ANN achieved the highest R2 with 0.84 compared to the other models such as GPR. The author utilizes the cross validation techniques to confirm the accuracy of the models.
3. Material/Methods
3.1. Dataset Description
The data used in this paper were collected from the Kaggle repository and comprised 880 soil samples, described in terms of 12 physicochemical soil properties and one dependent variable: soil fertility. It is well-structured and has no missing values, suggesting that the dataset is ready for machine learning analysis without preprocessing. The input parameters are Nitrogen (N) and Potassium (K) as integer values, whereas Phosphorus (P) and other chemical variables are presented as floating-point values of continuous type. The soil reaction is measured using pH, salinity, and electrical conductivity (EC). Organic Carbon (OC) will indicate the content of organic matter in the soils, whereas Sulfur (S) will indicate the availability of secondary nutrients. The dataset contains micronutrients: Zinc (Zn), Iron (Fe), Copper (Cu), Manganese (Mn), and Boron (B). The target variable is the output, an integer-coded categorical variable that indicates soil fertility levels, which were subsequently assigned qualitative values: Low, Medium, and High. The data is of mixed type; it includes 11 continuous numerical features, 2 discrete numerical features, and 1 categorical target variable. Figure 1 presents the proposed model for soil fertility prediction.
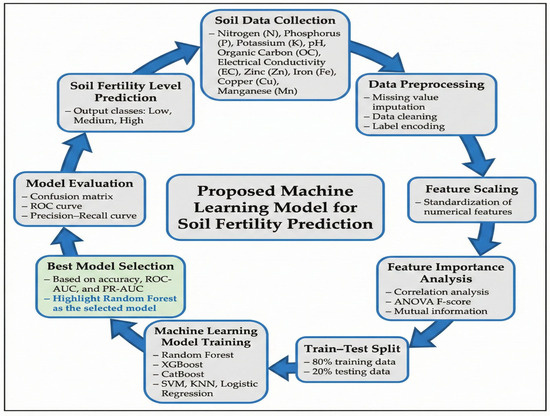
Figure 1.
Proposed Model for Soil Fertility Prediction Using Machine Learning.
Most soil parameters are expressed as continuous numerical values, but some, namely Nitrogen and Potassium, are represented as discrete numerical values. These physicochemical measurements are treated as input variables of the machine learning models used herein. The data set as a whole consists of eleven continuous numerical variables, two discrete numerical variables, and a categorical target variable, making it an appropriate data set for classification using machine learning methods.
3.2. Data Preprocessing
Data preprocessing was performed to improve data quality and ensure compatibility with machine learning algorithms. First, all missing values that were found in the numeric features were treated by mean imputation, whereby the missing value was replaced by the mean value of the particular feature. In this method, the dataset’s statistical properties are preserved without removing any samples.
The data used in this study were obtained from an open-source Kaggle repository containing soil fertility records. It contains 880 soil samples used to reflect the physicochemical properties of soil from agricultural fields. Such samples define soil features using 12 important soil parameters and a target variable representing soil fertility. This was followed by feature scaling via standardization, which sets all input features to have zero mean and unit variance. Distance-based and gradient-based models can be strongly influenced by feature scaling, as features with a larger range will dominate and thus influence the models.
After preprocessing and feature analysis, the data were split into training and test sets to evaluate the predictive accuracy of the machine learning models. It included 880 soil samples, of which 80% (704) formed the training set and 20% (176) the testing set.
3.3. Feature Importance Analysis Before Model Training
Before training the model, the filter-based feature importance analysis was performed to determine the impact of each of the soil characteristics on the fertility level of the soil. This was the analysis that was conducted without any predictive model in order to have an independent result on feature relevance. The statistical methods, such as correlation analysis, Analysis of Variance (ANOVA), and F-test, have been used. Linear associations between soil parameters and fertility levels were assessed through correlation analysis, whereas the ANOVA F-test was applied to test the discriminative capacity of each of the features in fertility classes. The importance scores calculated were represented as bar plots to emphasize the most significant soil parameters.
3.3.1. Exploratory Analysis of Soil Nutrients
Figure 2 presents plots of the feature distribution, indicating that the Nitrogen (N) range is wide, with several samples clustered around 200–350, suggesting substantial variation in nitrogen levels in the soil samples. Phosphorus (P) shows a skewed distribution, with most values below 20 and a few samples displaying much higher concentrations. The distribution of potassium (K) is nearly normal, with most values between 350 and 600, indicating moderate variability. The pH values in the soil are closely clustered between 6.5 and 7.5, indicating a predominantly neutral soil state in the dataset. Organic Carbon (OC) has a right-skewed distribution, with most values less than 2, indicating a generally low organic matter content. In general, the distributions reveal the variability and skewness of the important soil parameters, which should be scaled to features before training a model.
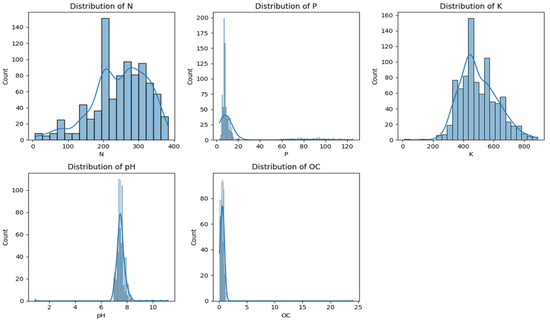
Figure 2.
Feature distribution plot for soil fertility prediction.
Figure 3 shows a pair plot of the correlations between the major soil parameters (Nitrogen, Phosphorus, Potassium, and pH) across soil fertility classes. It is possible to identify clear clustering patterns for Nitrogen (N) and Potassium (K), with high-fertility classes likely to be correlated with high levels of these nutrients. Phosphorus (P) exhibits visible separation with higher values, and lesser values are prevalent across all classes; thus, there is partial overlap. Soil pH values are mostly clustered in a narrow range around neutral, making it difficult to classify soils based on pH alone. All in all, the pair-wise visualizations indicate that nitrogen and potassium have significant nutrient-related attributes that are more important in differentiating fertility than pH, thereby explaining their significance in the predictive modelling process.
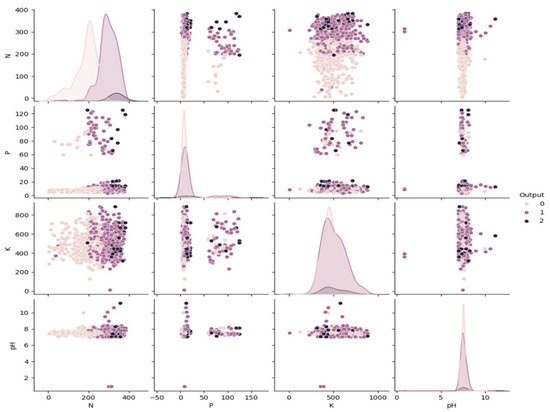
Figure 3.
Correlation between the soil parameters through a pair plot.
3.3.2. Correlation Heat Map
Figure 4 presents the correlation heatmap. Nitrogen (N) is positively correlated with soil fertility output the most (0.70), and this indicates its dominant position in the prediction of fertility. Phosphorus (P) and Potassium (K) have moderate positive relations (0.22 and 0.10, respectively), whereas there is a weaker positive association between phosphorus and pH (0.08). Carbon Organic (OC) and Electrical Conductivity (EC) also exhibit a weak positive correlation (0.12) and a weak negative correlation (−0.05), respectively, which denotes a weak adverse influence of the soil salinity. Iron (Fe) and Zinc (Zn) are positively correlated with fertility, and Copper (Cu) and Sulfur (S) are negatively correlated. In general, the quantitative analysis proves that the primary nutrients, especially nitrogen, have a greater contribution to the classification of soils in terms of their fertility.
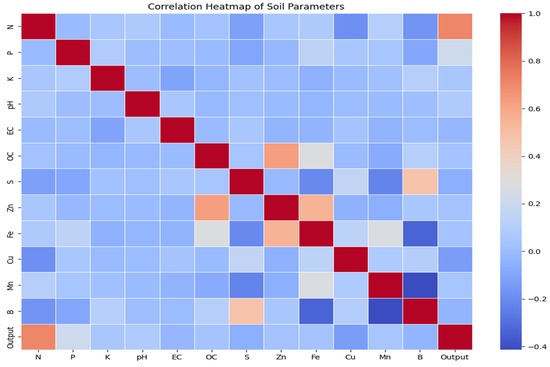
Figure 4.
Correlation heatmap for soil fertility prediction.
The target variable converts the level of soil fertility into three categories. The use of numerical labels is such that Class 0 is low-fertility soil, Class 1 is medium-fertility soil, and Class 2 is high-fertility soil. This is a categorical encoding that enables the application of a supervised classification algorithm to forecast soil fertility.
Figure 5 presents the results of the ANOVA F-score analysis, demonstrating that Nitrogen (N) is the most significant factor in differentiating soils in terms of fertility, with Phosphorus (P) and Copper (Cu) as the other significant factors. The other soil parameters, like pH, Sulfur (S), Iron (Fe), and Potassium (K), have relatively lower yet measurable contributions, whereas micronutrients like Zinc (Zn), Boron (B), and Manganese (Mn) have very little influence.
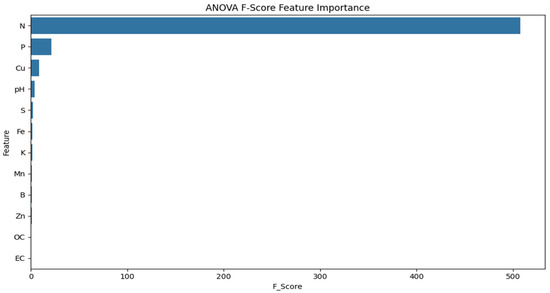
Figure 5.
ANOVA F-score of important features.
Correlation analysis has shown in Figure 6 that Nitrogen (N) has the best positive relationship with the level of soil fertility, which is followed by Phosphorus (P), thus making them very vital in the determination of soil fertility. PH, Potassium (K), Manganese (Mn), Iron (Fe), and Organic Carbon (OC) have weak positive relationships and indicate a moderate effect on the classification of fertility. Conversely, Electrical Conductivity (EC), Boron (B), Sulfur (S), and Copper (Cu) exhibit poor negative correlation, meaning that they have little or negative relations with the levels of soil fertility. In general, the results focus on the prevailing role of primary nutrients over secondary and micronutrients.
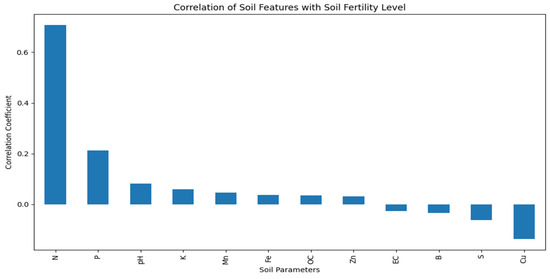
Figure 6.
Soil parameters versus the level of soil fertility.
3.4. Train-Test Split
In this study, the data was divided into training and testing subsets by splitting the data into 80:20. The stratified sampling method was used to retain the original distribution of classes in the soils in terms of their fertility in both subsets. Learning model parameters were done on the training set, and the unbiased performance evaluation was done on the test set.
3.5. Machine Learning Models
To provide a comprehensive measure of predictive performance, 15 supervised machine learning classification models were run. These models cover a wide variety of learning paradigms, including linear, non-linear, ensemble-based, boosting-based, and neural network. The reviewed classifiers are Logistic Regression, K-Nearest Neighbors, Support Vector Machine, Decision Tree, Random Forest, Extra Trees, Gradient Boosting, AdaBoost, Naive Bayes, Linear Discriminant Analysis, Multi-layer Perceptron, Ridge Classifier, Stochastic gradient Descent Classifier, XGBoost (version 2.0.3), LightGBM (version 4.3.0), and CatBoost (version 1.2.5). To ensure a fair basis for comparison, default hyperparameter settings were used to train all models. The method allows the objective testing of the innate learning ability of each model in the soil fertility prediction problem.
3.6. Model Evaluation Metrics
Several classification measures were used to assess model performance. The main criterion applied at the first level in comparing the models was accuracy. Further, precision, recall, and F1-score were calculated to assess class-wise prediction quality. For the best-performing model, Receiver Operating Characteristic (ROC) and Precision–Recall (PR) curves were generated in a multi-class setting. A one-vs.-rest approach was used to calculate class-wise ROC-AUC and PR-AUC. There was also a calculation of macro-averaged AUC scores to provide a comprehensive measure of performance across all fertility classes, especially given the possibility of class imbalance.
3.7. Model Configuration
In the current study, for all the machine learning algorithms used, the default hyperparameter values have been used in order to ensure fairness while comparing one algorithm against another. Using the default hyperparameter values is helpful in assessing the performance of the algorithm without any external factors affecting the process. But it should be noted that there is scope for improving the performance of the machine learning algorithms used through hyperparameter tuning, as well.
3.8. Minority Class Performance
However, the low accuracy achieved by Class 2 suggests that class imbalance and feature distribution overlap exists. These drawbacks could be overcome in future research through the use of sophisticated techniques like data sampling, cost-sensitive analysis, and class weighting, which will enhance the predictive accuracy of minority classes.
Table 1 shows the relative performance of 16 machine learning models, measured by accuracy, precision, recall, and F1-score, for predicting soil fertility levels. The highest accuracy of 90.91 indicates that the Random Forest classifier has the highest precision (0.94) and, consequently, the highest effectiveness in classifying soil fertility levels, with the fewest false positives, compared to all other models. It has a lower recall (0.67), though the overall F1-score (0.69) indicates equal performance across classes. Extra Trees, CatBoost, and XGBoost are other ensemble-based models that also performed well, with accuracies over 88 percent and fairly balanced precision–recall trade-offs. Gradient Boosting and LightGBM also demonstrated the efficiency of ensemble learning methods for soil fertility classification. Linear models, such as Logistic Regression, Ridge Classifier, and SGD Classifier, achieved moderate results, indicating they are not particularly powerful at capturing complex nonlinear relationships among soil parameters.

Table 1.
Performance analysis of different machine learning classifiers for soil fertility prediction.
Figure 7 presents the model accuracy comparison of different machine learning models. This value indicates the precision of different machine learning models to forecast the extent of soil fertility. As can be observed, ensemble-based models such as Random Forest, CatBoost, and XGBoost are superior to other classifiers, suggesting they can capture complex relationships among soil parameters. Models such as Logistic Regression, SGD Classifier, and LightGBM are also competitive and achieve quite high accuracy. Simpler models like Naive Bayes achieve much lower accuracy, indicating that they are not particularly effective on this dataset. In general, the findings indicate that ensemble learning techniques are more appropriate for predicting soil fertility levels.
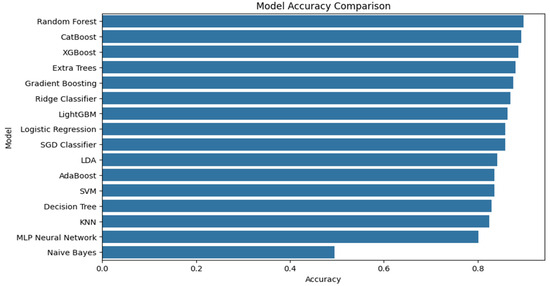
Figure 7.
Comparison between the classification accuracy of the various machine learning models.
Figure 8 presents the confusion matrix, showing the classification performance of the Random Forest model for the three soil fertility classes. The model appropriately categorized most samples into classes 0 and 1, correctly predicting 74 and 83 samples, respectively. The few misclassifications are evident, mostly between adjacent fertility levels, which is natural given the similarities in soil properties. In class 2, the model makes fewer correct predictions, indicating its inability to differentiate this class from others, likely due to fewer samples or mixed feature distributions. In general, the confusion matrix shows high predictive power for the Random Forest model, especially for the most prevalent fertility classes.
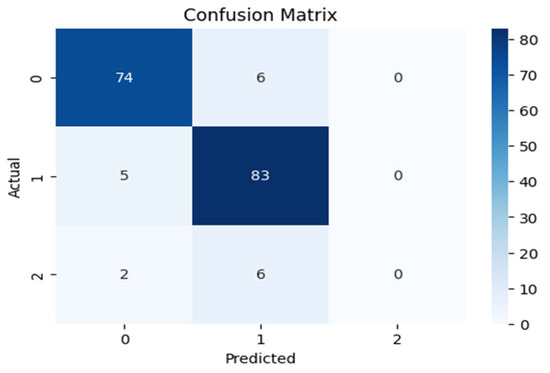
Figure 8.
Confusion matrix for RF mode for soil fertility level.
Figure 9 discusses the metrics of performance by class, revealing that the Random Forest model has high precision, recall, and F1-score for Class 0 and Class 1, whereby all the metrics have a value of more than 0.88, which indicates reliability and consistency in the classification of both Class 0 and Class 1 soils in terms of their soil fertility. Class 2, in turn, shows poorer results, indicating an inability to correctly distinguish this category, which could be explained by class imbalance and a similar distribution of features. In general, the findings show that the model has strong predictive power for the majority classes of fertility and that there is room to improve its ability to predict the minority classes.
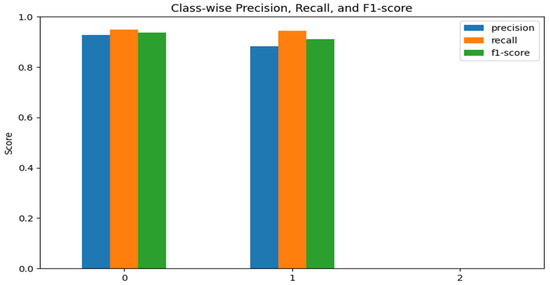
Figure 9.
Class-wise Precision, Recall, F1-score for soil fertility prediction.
Figure 10 presents the learning curve, which indicates that the accuracy of the training process, as measured by the Random Forest model, is very high, and the model has a high learning capacity, as evidenced by its very close to 1.0 at all training sizes. The validation accuracy also increases consistently with increasing training size and levels off at 0.89–0.90, indicating that better generalization is achieved with additional data. The fact that the training and validation accuracies differ only slightly at larger sample sizes indicates limited overfitting and high model stability. Overall, the learning curve indicates that the model is advantageous, with improved performance on additional training data and stable performance on unseen samples.
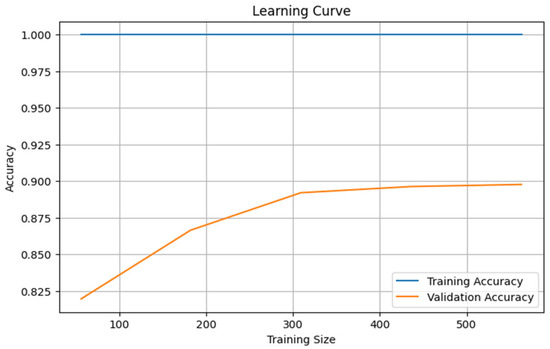
Figure 10.
Learning Curve for soil fertility prediction.
Figure 11 presents the ROC curves showing how well the Random Forest model classifies the soil fertility using the one-vs.-rest approach. The model has shown strong discriminative power between Class 0 and Class 1, with AUCs of 0.97 and 0.94, respectively. The results show that the model is very effective at differentiating these fertility classes from the other classes. In comparison, Class 2 has a lower AUC of 0.75, indicating that the class is more difficult to predict, perhaps due to class imbalance or similarities in soil properties. All in all, the ROC analysis demonstrates the good predictive power of the Random Forest model, especially for the most prevalent soil fertility classes.
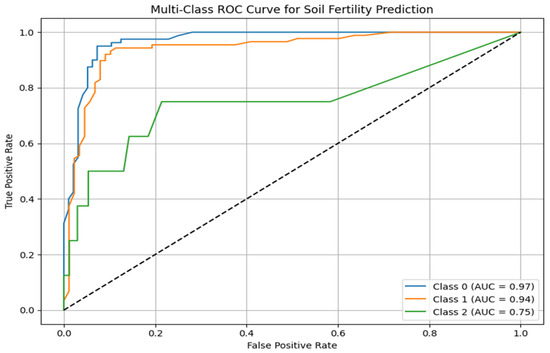
Figure 11.
Multi-class ROC curves of the prediction of the level of soil fertility using the Random Forest model.
Figure 12 discusses the Precision–Recall curves, which show the relationship between the precision and recall of each soil fertility category. The Random Forest model achieves strong results for Classes 0 and 1, with PR-AUCs of 0.95 and 0.92, respectively, indicating stable, accurate predictions for these two fertility levels. Conversely, Class 2 has a much lower PR-AUC of 0.32, indicating lower predictive reliability. The tendency can be attributed to class imbalance and overlapping feature distributions. All in all, the PR-AUC analysis of the Research Question reveals the strength of using the Random Forest model across the overwhelming fertility classes and the necessity of developing a stronger strategy to better represent minority fertility levels.
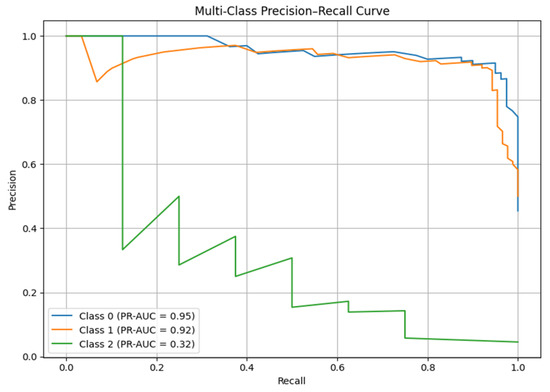
Figure 12.
Precision–Recall multi-class curve for the soil fertility level of the RF model.
Figure 13 presents the probability distribution of the predictions, showing the accuracy of the Random Forest model across soil fertility classes. Class 0 and Class 1 distributions are fairly disaggregated and concentrated toward higher probability values, indicating high model confidence in predicting these classes. Class 2, on the other hand, exhibits a sharp peak at lower probability values, indicating lower confidence and greater uncertainty in its predictions. This observation aligns with previous assessment outcomes and suggests that class imbalance or shared feature attributes may reduce the model’s ability to reliably forecast the minority fertility category.
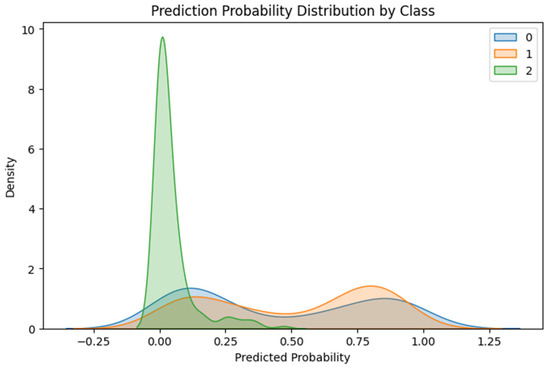
Figure 13.
Prediction Probability Distribution Plot.
Figure 14 presents the ranking of machine learning models for soil fertility prediction. It has been observed that an ensemble-based ML model performs well. The figure illustrates the ranking of different ML models, and it shows that the RF model gives the best results. The obtained accuracy of 0.90, precision of 0.93, recall of 0.67, and F1-score is 0.69. We also noticed that all ensemble models’ performance is above or equal to 88%. This trend underscores the importance of ensemble learning for capturing non-linear relationships among soil characteristics, such as nutrient concentrations, pH, and organic matter. Probabilistic models, such as NB, do not perform well on this dataset for soil fertility prediction.
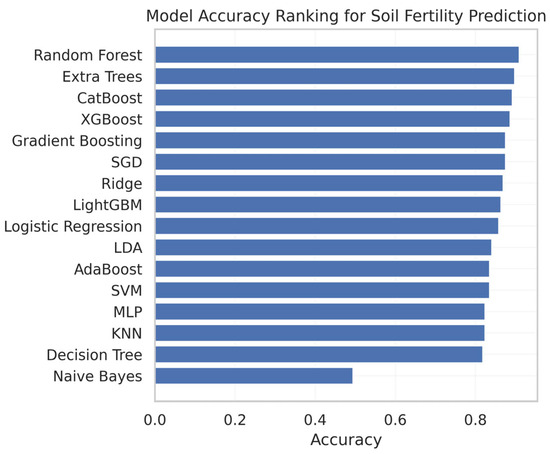
Figure 14.
Model accuracy ranking for soil fertility prediction.
Figure 15 presents the relationship between accuracy and F1-score for soil fertility prediction. This figure demonstrates the model’s generalizability and robustness to the class imbalance problem. The RF model performs well and achieves the highest accuracy of 0.90 compared to the other models, but its significantly lower F1-score indicates an imbalance between precision and recall. We observed that even high-accuracy models can underperform when class imbalance is considered, which is important for soil fertility prediction because minority classes often reflect damaged or nutrient-deficient soils.
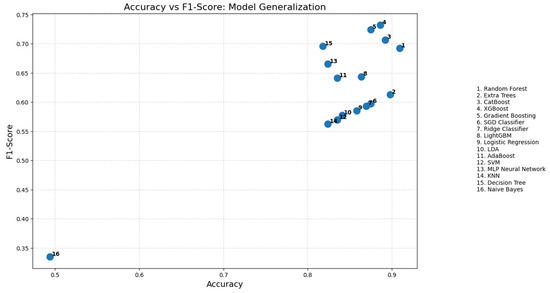
Figure 15.
Model generalization between accuracy and F1-score.
Figure 16 presents a comprehensive heatmap of the performance of all machine learning models across the performance metrics. We noticed that an ensemble model consistently performs well, achieving high scores across all metrics. It means that the model is robust. But the linear model and probabilistic model are not up to the mark (performance score drops, especially recall and F1-score).
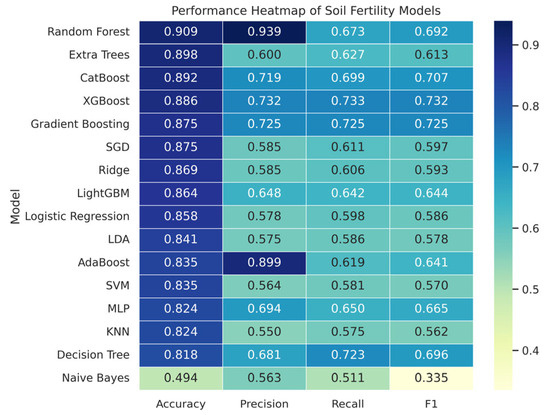
Figure 16.
Performance heatmap for soil fertility prediction.
Figure 17 presents a box plot of the performance metrics for soil fertility prediction. It highlights the central tendency, dispersion, and outliers. The performance metrics accuracy exhibits the highest median value. However, the distributions of precision, recall, and F1-score show greater variability, indicating inconsistent performance across classes. Precision varies significantly, indicating that various models struggle to maintain consistent confidence in predicting fertile and non-fertile soil classes. The presence of outliers in the F1-score indicates that some models fail to balance precision and recall, underscoring the inadequacy of accuracy as a standalone evaluation metric for soil fertility prediction. The performance metrics, such as accuracy, remain stable across all models, whereas precision, recall, and F1-score show greater variability. It underscores the need for a multimetric evaluation for soil fertility prediction.
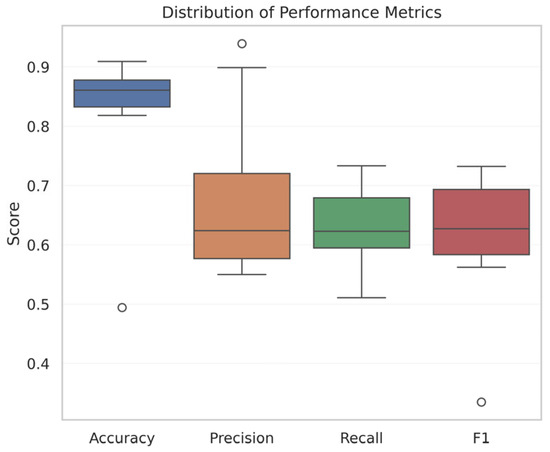
Figure 17.
Metrics distribution for soil fertility prediction.
The above-mentioned Figure 18 presents the comparative F1-score distribution between the ensemble and non-ensemble models. This visualization demonstrates how the model is robust for soil fertility prediction. It has been observed that ensemble-based models are obtaining the highest median F1-score. Non-ensemble models, on the other hand, exhibit higher variability, a lower median performance, and noticeable low-performing outliers.
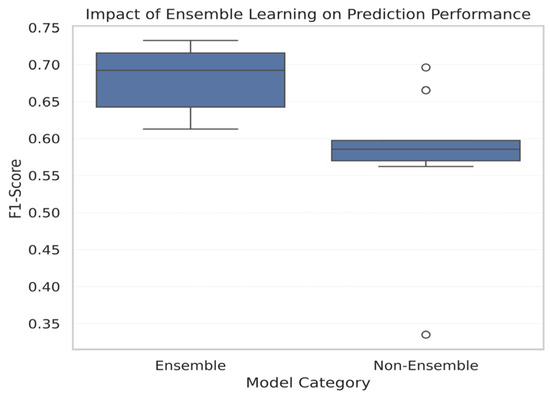
Figure 18.
Impact of ensemble and non-ensemble models for soil fertility prediction.
4. Conclusions
This study presents sixteen machine learning classifiers for soil fertility prediction. We have collected the data from the Kaggle repositories. We focused much on physicochemical soil characteristics and analyzed the features. It has been observed that RF achieves the highest accuracy of 90.91% as comparison to the other models. Apart from the evaluation of the performance metrics of the different model, we also find the ROC and Precision–Recall curves for strengthening of the chosen model. This study suggested that an effective ML model can detect soil fertility and offer a scalable data-driven solution to promote the sustainable management of agriculture.
Author Contributions
Conceptualisation, H.B. and B.N.; methodology, P.K.M.; software, P.K.M.; validation, R.P., N.P. and P.K.M.; formal analysis, R.P.; investigation, N.P.; resources, R.P.; data curation, P.K.M.; writing—original draft preparation, R.K.G.; writing—review and editing, R.P.; visualization, N.P. and P.K.M.; supervision, R.P.; project administration, N.P.; funding acquisition, N.P. All authors have read and agreed to the published version of the manuscript.
Funding
This research received no external funding.
Institutional Review Board Statement
Not applicable.
Informed Consent Statement
Not applicable.
Data Availability Statement
The data that support the findings of this study are available from the corresponding author upon reasonable request.
Acknowledgments
During the preparation of this work, the author Harmesh Behera would like to thank his supervisor, Rasmita Panigrahi, School of Engineering and Technology, and his co-supervisor, Neelamadhab Padhy, Research and Development, Computational Science, GIET University, Gunupur, as well as our university agriculture department for permitting us to conduct different tests on soils of different crops and interact with the Agriculture officers.
Conflicts of Interest
The authors declare no conflict of interest.
Abbreviations
The following abbreviations are used in this manuscript:
| ML | Machine Learning |
| DL | Deep Learning ‘ |
| XGB | Extreme Gradient Boosting |
| AdaBoost | Adaptive Boosting |
| CatBoost | Categorical Boosting |
| LightGBM | Light Gradient Boosting Machine |
| KNN | K-Nearest Neighbors |
References
- Raut, S.; Chitre, V. Soil monitoring and testing using IoT for fertility level and crop prediction. In Proceedings of the 3rd International Conference on Advances in Science & Technology (ICAST), Mumbai, India, 8–9 April 2020. [Google Scholar]
- Pant, J.; Pant, P.; Pant, R.P.; Bhatt, A.; Pant, D.; Juyal, A. Soil quality prediction for determining soil fertility in Bhimtal Block of Uttarakhand (India) using machine learning. Int. J. Anal. Appl. 2021, 19, 91–109. [Google Scholar] [CrossRef]
- Terhoeven-Urselmans, T.; Vagen, T.G.; Spaargaren, O.; Shepherd, K.D. Prediction of soil fertility properties from a globally distributed soil mid-infrared spectral library. Soil Sci. Soc. Am. J. 2010, 74, 1792–1799. [Google Scholar] [CrossRef]
- Chandra, H.; Pawar, P.M.; Elakkiya, R.; Tamizharasan, P.S.; Muthalagu, R.; Panthakkan, A. Explainable AI for soil fertility prediction. IEEE Access 2023, 11, 97866–97878. [Google Scholar] [CrossRef]
- Shahare, Y.R.; Singh, M.P.; Singh, S.P.; Singh, P.; Diwakar, M. ASUR: Agriculture soil fertility assessment using a random forest classifier and regressor. Procedia Comput. Sci. 2024, 235, 1732–1741. [Google Scholar] [CrossRef]
- Kassim, Y.B.; Pinto, F.; MacCarthy, D.S.; Bindraban, P.; Chirinda, N.; Stomph, T.; Struik, P.C. Can drone images predict within-field variability in soil fertility? A case study in the Northern Region of Ghana. Front. Soil Sci. 2025, 5, 1548645. [Google Scholar] [CrossRef]
- Selvi, C.T.; Manimaraboopathy, M.; Jeyalakshmi, M.; Narmadha, G. Intelligent Soil Fertility Forecasting Using Enhanced STGNN and Hybrid Swarm-Based Optimisation. Results Eng. 2025, 27, 106866. [Google Scholar] [CrossRef]
- Abekoon, T.; Sajindra, H.; Rathnayake, N.; Ekanayake, I.U.; Jayakody, A.; Rathnayake, U. A novel application with explainable machine learning (SHAP and LIME) to predict soil N, P, and K nutrient content in cabbage cultivation. Smart Agric. Technol. 2025, 11, 100879. [Google Scholar] [CrossRef]
- Gouda, M.; Abu-hashim, M.; Nassrallah, A.; Khalil, M.N.; Hendawy, E.; Benhasher, F.F.; Mohamed, E.S. Integration of remote sensing and artificial neural networks for the prediction of soil organic carbon in arid zones. Front. Environ. Sci. 2024, 12, 1448601. [Google Scholar] [CrossRef]


Disclaimer/Publisher’s Note: The statements, opinions and data contained in all publications are solely those of the individual author(s) and contributor(s) and not of MDPI and/or the editor(s). MDPI and/or the editor(s) disclaim responsibility for any injury to people or property resulting from any ideas, methods, instructions or products referred to in the content. |
© 2026 by the authors. Licensee MDPI, Basel, Switzerland. This article is an open access article distributed under the terms and conditions of the Creative Commons Attribution (CC BY) license.