


Abstract
Diffuse reflectance infrared Fourier transform spectroscopy (DRIFTS) offers organic solvent-free powder analysis with high solid-state sensitivity. This positions the technique at the intersection of green analytical chemistry, solid form control, and ICH Q14-aligned, science- and risk-based method development. Despite these advantages, it remains marginal in regulated quality control. This review assesses the DRIFTS literature from Kubelka–Munk theory to current uses in pharmaceutical assays, solid-form quantification, drug-excipient interactions and medicines quality control, and asks why these favourable ergonomics have not been translated into regulatory acceptance. Seven of the nine univariate DRIFTS assays identified operate within a window of about 0.1–3.5% w/w analyte in KBr; two exceed it, with one reaching 30% w/w. Contrary to the common characterisation of the field as univariate, eighteen multivariate DRIFTS assay methods were identified together with a further nine multivariate solid-form methods, published continuously since 1988; what has remained univariate is the single-analyte tablet assay built on peak-area integration. This range is best read as an empirically observed working window for the systems reviewed rather than as a universal limit. Robustness evidence is dominated by single-laboratory, single-instrument, single-lot studies; where multi-lot performance was tested for polymorphic impurities, calibration models transferred poorly and standard outlier diagnostics disagreed. Reports are systematically silent on particle size distribution, packing protocol, diluent water content and ambient humidity. DRIFTS is well-suited to bounded roles: identity confirmation, solid-form screening, compatibility studies and in-house assay of formulations with a known, stable matrix. To advance the field, future efforts must prioritise rigorous evidentiary discipline over the development of new instrumentation.
1. Introduction
Infrared absorption spectrophotometry holds a unique place in pharmaceutical analysis. Although it is one of the most widely used techniques in pharmacopeial testing, its application is primarily limited to qualitative identification rather than quantitative analysis. The European Pharmacopoeia references infrared spectrophotometry in over 1200 individual monographs, highlighting its importance as a routine identification tool [1]. In most cases, however, determination of drug content and assay measurements are carried out using chromatographic techniques, while infrared spectroscopy serves mainly to confirm the identity of pharmaceutical substances. This preference has a strong historical basis. Traditionally, mid-infrared spectra of solid materials were obtained by transmission through alkali-halide discs, a method that is highly sensitive to sample preparation. Factors such as the degree of grinding, disc thickness, moisture uptake, and pressure-induced polymorphic transformations can significantly affect the resulting spectrum. As a result, achieving the consistency required for reliable quantitative analysis has often been challenging.
The Attenuated Total Reflectance (ATR) technique reduced much of the burden but analyses only micrometres of the substance in optical contact with the crystal, a suboptimal sampling approach for heterogeneous powdered mixtures. Neither mode was well-matched to routine content determination. Diffuse reflectance infrared Fourier transform spectroscopy (DRIFTS) was developed to bridge this gap for the analysis of solid-state compounds. Radiation incident on a bed of particles is partly reflected at the front surface and partly transmitted into the bed. The transmitted component undergoes multiple refraction, scattering and absorption before re-emerging over a wide solid angle. It is this multiply scattered component that carries absorption information from the bulk. Fuller and Griffiths demonstrated in 1978 that Fourier transform instrumentation, with its throughput and multiplex advantages, made routine collection of this weak signal practical [2] and the aperture-exclusion optics they introduced to discriminate against front-surface specular reflection remain the basis of commercial accessories.
The analytical consequences are attractive. Sample preparation reduces to dilution in a non-absorbing halide and gentle trituration. No pellet is pressed, no solvent is consumed, no extraction is performed, and the sample is recoverable. Measurement times are minutes rather than the tens of minutes typical of chromatographic runs. Because the signal originates in the bulk rather than at a contact interface, sampling is more representative than ATR. Because the mid-infrared fingerprint region resolves subtle differences in hydrogen bonding and lattice packing, DRIFTS is intrinsically sensitive to solid form, a property of increasing regulatory significance as polymorph control has moved from a development concern to a lifecycle one.
The characteristics coincide with three trends currently influencing the field. Green analytical chemistry has incorporated consideration of solvent use into its design, with quantitative methods for assessment that DRIFTS performs well in [3,4,5]. Solid-state control has broadened from simply confirming identity to quantitatively defining solid-state composition, a shift reflected in the widening range of solid-state techniques now assessed for polymorph identification and quantification against pharmacopeial detection and quantitation limits [6]. Moreover, the adoption of ICH Q14 in November 2023, together with the revision of ICH Q2 to encompass spectroscopic and multivariate procedures, has created a regulatory framework in which a well-characterised spectroscopic method may compete with chromatography on its own terms rather than as a compendial exception [7,8].
Against this favourable backdrop, the position of DRIFTS in regulated pharmaceutical quality control remains marginal. It appears in no major pharmacopeial assay monograph. It is largely absent from process analytical technology deployments, where near-infrared and Raman spectroscopy dominate. Its published literature, though spanning more than three decades, is thin relative to that of near-infrared reflectance and shows little evidence of cumulative methodological development. The methodological development of the technique from its optical foundations, through the pharmaceutical applications built on them, to the regulatory framework now surrounding it is set out in Figure 1.
Figure 1.
Methodological milestones in the development of DRIFTS for pharmaceutical analysis. Only events verified against a retrieve3d source are shown, and the horizontal axis is ordinal rather than linear in time. The timeline is a record of methodological development, not a measure of publication activity; no bibliometric claim is made or implied. Created in BioRender. Bhongade, B. (2026) https://BioRender.com/tkckqpd.
While a substantial body of validated methods demonstrates that DRIFTS operates reliably under controlled conditions, a critical gap remains between its verified performance and widespread laboratory adoption. Understanding the physical constraints governing DRIFTS, coupled with addressing systematic reporting omissions in the literature, is essential to defining the analytical shifts required for broader technological translation. This review investigates the underlying causes of this stagnation by evaluating the fundamental optical physics of the measurement and the evidentiary structure of the existing literature.
2. Scope and Evidence Base
This review addresses mid-infrared diffuse reflectance applied to pharmaceutical materials: active pharmaceutical ingredients, excipients, and solid and semi-solid dosage forms. Near-infrared diffuse reflectance is discussed only comparatively. However, the sampling geometry is analogous; the near-infrared region is dominated by overtone and combination bands of markedly lower specificity, and its regulatory, instrumental and chemometric literature is separate and far larger. Diffuse reflectance in catalysis, geology, soil science, polymer characterisation and cultural heritage, which together account for most DRIFTS publications, is outside the scope of this review except where the underlying optics inform the pharmaceutical case. Sources were identified by structured searching of Scopus and PubMed/MEDLINE, supplemented by a semantic literature sweep and by backward citation tracing. Records were retained if they reported a mid-infrared diffuse reflectance measurement on a pharmaceutical material and were excluded if diffuse reflectance was confined to the near-infrared region or the matrix was non-pharmaceutical. After de-duplication, 20,327 unique records were screened, 322 were assessed in full against the inclusion criteria, and 34 primary studies were retained. Three categories were screened exhaustively rather than thematically: univariate assay, multivariate assay and solid-form quantification. The electronic search was supplemented by backward citation tracing from the retrieved primary literature and from the reference lists of the principal DRIFTS pharmaceutical assay papers. Table 1 outlines the scope of the review and the corresponding limits on what it claims.
Table 1.
Scope and evidence base of this review.
3. Physical Basis and Its Analytical Consequences
This section provides a concise and precise description of the experimental results, their interpretation, and the experimental conclusions that can be drawn.
3.1. Two Reflection Pathways
Radiation striking a particulate bed divides into two components with entirely different information content (Figure 2A). The specular component is reflected at the front surface of individual particles according to the Fresnel relations. Its intensity depends on the complex refractive index of the material. Because the real part of the refractive index varies steeply across an absorption band (anomalous dispersion), the specular contribution imposes derivative-shaped distortions on strong bands. The diffuse component penetrates the bed, undergoes multiple scattering and absorption events, and re-emerges having sampled a distribution of path lengths. It is principally this component that behaves in a manner amenable to quantitation. The distinction is practical rather than absolute. Czaja and co-workers showed that a modified specular reflectance accessory operated in a diffuse-reflectance-like collection mode supported partial least squares quantitation of cinnarizine in commercial tablets, with relative standard errors of prediction of 2.1–2.2%, closely comparable to the 2.4–2.5% obtained on the same samples with a conventional DRIFTS accessory [9]. Front-surface reflection therefore does carry concentration information; it is distorted by anomalous dispersion in a band-dependent way, so recovering that information requires multivariate calibration rather than the univariate band integration on which most pharmaceutical DRIFTS assays rely.
Figure 2.
Physical basis of the DRIFTS measurement. (A) Incident radiation divides into a front-surface specular component, distorted by anomalous dispersion across absorption bands, and a multiply scattered diffuse component carrying bulk absorption information. (B) Aperture−exclusion optics preferentially reject the specular component. (C) Experimental DRIFTS spectra of levofloxacin, neat and at 1% w/w in dried potassium bromide. (D) Variables entering the scattering coefficient s and hence the measurand. The ordinate in (C) is pseudo-absorbance, log10(1/R), as reported by the instrument and not the Kubelka–Munk remission function. (A,B,D) are schematic and not to scale; (C) is measured data.
Practical DRIFTS therefore consists largely of measures to suppress the first component and stabilise the second. Aperture-exclusion optics, introduced by Fuller and Griffiths, collect radiation preferentially from angles at which specular reflection is not expected (Figure 2B). Dilution in a non-absorbing halide of comparable refractive index reduces the absorption coefficient of the bed so that all bands remain weak, minimising both saturation and specular distortion (Figure 2C). This is why the near-universal practice of diluting to a few percent in dry potassium bromide is not merely a sensitivity convenience but an optical necessity: the spectrum of a neat pharmaceutical powder is not a scaled version of the diluted spectrum but a differently weighted and partly distorted one, in which the bands ride on a large scattering background [10,11]. Those sources support the general optical argument; the background behaviour itself is shown experimentally in Figure 2C for levofloxacin. The neat powder returns a reflectance no higher than about 28% anywhere between 650 and 3000 cm−1, falling to roughly 3% at the strongest bands, so the whole spectrum sits in the low-reflectance region where the remission function is steep and error-amplifying (Figure 3A,C), whereas the 1% w/w dilution returns a flat baseline across the same region. Baseline correction does not render the two spectra equivalent. Relative to the 1621 cm−1 band, the individual band ratios change substantially on dilution by a mean of 28% across six fingerprint bands and by 54% and 67% at 1585 and 1502 cm−1, respectively, with the largest changes falling between 1500 and 1620 cm−1. This is the behaviour anticipated above: in the neat powder the specular contribution and the strong scattering background weight the spectrum differently from the dilute, weakly absorbing bed, so the neat spectrum is not a scaled version of the diluted one. Dilution therefore both restores usable reflectance and alters the relative band pattern, and the same behaviour is observed for ciprofloxacin in the spectra presented in Section 6.1.
Figure 3.
Behaviour of the Kubelka–Munk formalism. (A) The remission function f(R∞) is steeply non-linear at low reflectance and flattens across the mid-range. (B) Ideal proportionality between f(R∞) and concentration (dashed) compared with the behaviour expected when the analyte contributes to the scattering coefficient (solid), for three values of s. (C) Relative error propagated into f(R∞) by an absolute error of ±0.01 in R∞.
3.2. The Kubelka–Munk Formalism and Where It Fails
The quantitative framework universally invoked in DRIFTS derives from the two-flux radiative transfer treatment of Kubelka and Munk [12] developed for paint films and later adapted to powders [13]. For an optically thick (semi-infinite) diffusely scattering layer, the remission function is
where R∞ is the absolute reflectance relative to a non-absorbing standard, k the absorption coefficient and s the scattering coefficient. Provided s is constant, f(R∞) is proportional to k and therefore to analyte concentration, giving the diffuse reflectance analogue of the Beer–Lambert relation. The remission function must be distinguished from the quantity most commonly plotted by commercial instrument software, namely pseudo-absorbance, log10(1/R). The two are monotonically related but are not proportional to one another, and relative band intensities are not preserved between them; the transform actually used should therefore be stated whenever band ratios or integrated peak areas are reported. The experimental spectra presented in this review are plotted as pseudo-absorbance. The remission function is occasionally used as derived: the extent of neutralisation of the carboxylic acid function in Carbopol 974P NF has been determined by diffuse reflectance through the Kubelka–Munk function with an internal standard and first-derivative ratioing, giving a response linear across the full 0–100% neutralisation range with no detectable particle-size or sample-preparation effect [14]. That this is the exception rather than the rule is itself a reporting finding.
f(R∞) = (1 − R∞)2/2R∞ = k/s
Every practical difficulty in quantitative DRIFTS resides in that proviso. The derivation assumes a continuous, homogeneous, semi-infinite medium with isotropic scattering and no front-surface reflection. A pharmaceutical powder bed satisfies none of these conditions. The remission function is steeply non-linear in R∞ (Figure 3A). At low reflectance, a small absolute error in R∞ propagates into a large relative error in f(R∞); the function flattens across the mid-reflectance range and steepens again as R∞ approaches unity (Figure 3C). Effective reflectance is thus not an arbitrary quantity, and the common approach of diluting to bring the peak pseudo-absorbance below about two units is practical in making the measurement manageable.
Scattering does not have a concentration-independent value. With an increasing analyte concentration, there is an increasing contribution of the analyte to the scattering coefficient, and the semi-infinite approximation is deteriorated due to absorption. The combination of both leads to deviation from linearity in calibration in the same way (Figure 3B). Scattering is influenced by particle size and not in a weak way. From the study by Christy et al., beds of particles of the same composition but different sizes yield different diffuse reflectance spectra, and the Kubelka–Munk function remains linear only at low concentrations [15]. Particle size should not be read as acting monotonically: once particle dimensions approach the wavelength of the probing radiation, size modifies the effective scattering coefficient in a system-dependent manner, so the practical consequence is loss of simple proportionality between the remission function and concentration rather than a shift in one direction. Subsequently, they proposed an improved remission function that explicitly includes particle size [16]. Such a correction has been in use for three decades, but it is not commonly used in pharmaceutical DRIFTS studies. The dependence is nonetheless quantifiable: for phenytoin, the integrated absorbance at 1724 cm−1 was shown to follow log(I0/I) = K1/D50 = K2Su against both the specific surface area obtained by nitrogen adsorption and the reciprocal of the mean particle diameter measured by electron microscopy in the bulk drug and in a binary blend with lactose [17]. Particle size is therefore not merely a caution to be noted but a measurable term in the response.
The diluent is important, as shown when comparing germanium, silicon, diamond, potassium chloride, and a chalcogenide glass as DRIFTS matrices, where both particle size and matrix refractive index influence the spectrum produced [18]. The use of potassium bromide as the diluent in pharmaceutical studies is due mainly to convention and cost considerations. It is hygroscopic, so its water content is an uncontrolled experimental variable unless drying and storage are specified.
Two distinct sources of departure from ideal behaviour should be kept apart. The first is a limitation of the model. The Kubelka–Munk treatment is an idealised two-flux radiative-transfer solution for a homogeneous, isotropically scattering, semi-infinite layer, and it supplies no universal particle-size correction because departure from linearity is a coupled consequence of absorption, scattering, particle dimensions, refractive-index contrast and packing acting together. Since those contributions are not separable in a single closed-form expression, s is best regarded as an effective, system-dependent quantity rather than a transferable constant. The second is a limitation of the sample. Real pharmaceutical beds are heterogeneous, polydisperse and variably packed, so successive preparations of nominally identical material need not share the same effective s. The remedies differ accordingly: mathematical correction and scatter-corrected multivariate calibration address the first, whereas experimental control of particle size, packing and diluent condition addresses the second, and the two are not interchangeable. The reporting consequences of this distinction are taken up in Section 7.3.
3.3. The Variables That Actually Govern the Measurement
The scattering coefficient s that appears in the denominator of the measurand is a function of particle size and its distribution, packing density and surface levelling in the sample cup, diluent identity and dryness, and the refractive index of the analyte, which in turn, depends on solid form (Figure 2D). Instrument-side variables enter separately: spectral resolution determines how sharply the band is rendered and hence its integrated area, and the scan number sets the noise floor against which that area is integrated. The depth from which the returned radiation originates is a further variable that is almost never stated, although it was characterised for diffuse reflectance sampling early in the technique’s pharmaceutical history [19].
Two of these were confirmed experimentally as dominant in the only DRIFTS studies identified in this review that applied formal design of experiments to method development. Panda and co-workers, developing a DRIFTS assay for pimavanserin tartrate within an ICH Q14 framing, identified experiment room temperature, scan number and spectral resolution as critical method variables and found resolution to be the parameter most strongly affecting peak-area measurement, requiring an explicit control strategy [20]. A later method for neratinib from the same group examined resolution and scan number by central composite design [21]. Resolution affects the measurement not through information content but through the apparent integrated area of a band whose true width is unchanged. An assay reporting a peak area without reporting the resolution at which it was integrated has omitted a determinant of its own result. This is the single most consequential and most frequently omitted item in the DRIFTS methods literature.
A qualification is warranted here. The sensitivity to resolution and particle size described above is a property of univariate peak-area integration. With a well-designed multivariate calibration, in particular one whose training set deliberately spans the expected ranges of band shape, sieve fraction and packing, the influence of these variables on the predicted concentration can be substantially reduced, and experienced practitioners report achieving this. That reduction is, however, a property of the calibration rather than of the measurement: it holds within the variance space represented in the training set and does not establish invariance to a particle-size distribution or an instrument configuration lying outside it. The claim made in this review is therefore specific to the univariate methods that dominate the pharmaceutical DRIFTS assay literature.
4. Qualitative and Characterisation Applications
4.1. Identity and Fingerprinting
For identity confirmation, DRIFTS is straightforwardly serviceable. The mid-infrared fingerprint region provides the requisite specificity for compendial identity testing, whereas diffuse reflectance sampling precludes the polymorphic transitions associated with alkali halide disc compression, thereby preserving the native crystal structure. Diffuse reflectance is also tolerant of dark, opaque and strongly absorbing materials that transmit poorly, and requires only milligram quantities.
Neither the United States Pharmacopeia (USP) general chapter ⟨854⟩ nor its companion informational chapter ⟨1854⟩ excludes reflectance sampling. The compendial requirement is to use the region from approximately 3800 to 650 cm−1 and to validate the procedure for its purpose [22,23]. The revised European Pharmacopoeia (Ph. Eur.) chapter 2.2.24 was rewritten to expand its treatment of Fourier transform instrumentation and reflectance sampling, with equipment performance criteria and guidance on the use of stored reference spectra [1]. Reflectance sampling is methodologically permissible within the compendial framework, though it is not the default modality, and primary reference spectral libraries remain predominantly transmission-based. Because diffuse reflectance alters relative band intensities, library matching across sampling modes requires either mode-matched libraries or documented correlation, and this remains an under-addressed practical obstacle.
4.2. Solid-Form Characterisation
Solid-form work is where DRIFTS has made its most substantial and most durable pharmaceutical contribution. Hartauer, Miller and Guillory established the template in 1992: binary mixtures of sulfamethoxazole polymorphs analysed by diffuse reflectance, with partial least squares regression resolving heavily overlapped spectra, predicting validation-set composition to within 4% and remaining valid over a four-week testing period [24]. The study anticipated subsequent developments by using binary mixtures, latent-variable regression, and an explicit definition of model lifetime.
Subsequent work extended the approach in scope rather than in kind. Pöllänen and colleagues characterised the polymorphic composition of sulfathiazole [25]. The shift from a binary to a ternary system was made by Kipouros et al. [26], where carbamazepine forms I, III, and IV were measured simultaneously using the technique of DRIFTS with multivariate calibration, an important step as the measurement of ternary systems requires chemometric power instead of band ratioing. Tantishaiyakul et al. studied the ternary system involving piroxicam polymorphs in the presence of pharmaceutical excipients [27].
Bugay and co-workers compared diffuse reflectance infrared and powder X-ray diffraction for quantifying cefepime dihydrate in the monohydrate [28], an important design because it benchmarks the spectroscopic result against the accepted reference method for solid form. Cross-technique designs of this kind are older than the quantitative literature itself: thirteen bulk lots of spironolactone were classified into four polymorphic types from the 3600–3200 cm−1 diffuse reflectance pattern and the same specimens examined by FT-Raman as early as 1992 [29], and the polymorphs of a new anti-inflammatory drug were characterised on the same basis the following year [30]. Neural-network models were applied to diffuse reflectance polymorph quantification from 1999, first to ranitidine hydrochloride as bulk drug and in tablets [31] and then across a 1–100% w/w range of form 2 in form 1 with a minimum quantifiable level of 5.2% and a detection limit of 1.5% w/w when diffuse reflectance and powder X-ray diffraction were combined [32]. Mebendazole polymorphs were determined by PLS2 and principal component regression with conventional potassium bromide transmission spectra measured alongside for comparison [33], and later as a ternary mixture of forms A to C by neural networks on second-derivative spectra, reaching prediction errors of 1.65–1.85% w/w against 2.68–3.40% for PLS with orthogonal signal correction [34]. The most complete figures-of-merit treatment in this literature remains the determination of the polymorphic purity of carbamazepine over 80–100% w/w form III by PLS with net analytical signal, for which sensitivity, analytical sensitivity, selectivity, confidence limits, repeatability, intermediate precision, accuracy and signal-to-noise ratio were all computed, with a maximum absolute error of 2% and an average error of 0.53% [35].
DRIFTS is also suited to following solid-state transformations. It is sensitive to hydrogen bonding between water and drug molecules and can detect incipient hydrate formation, in some systems before powder X-ray diffraction does [36]. Combined with variable-temperature cells, it supports kinetic study of metastable-to-stable conversions. Process-induced transformation is tractable on the same basis: ranitidine hydrochloride form 1 milled for up to 240 min at three jacket temperatures was followed by diffuse reflectance alongside powder X-ray diffraction, solid-state NMR and differential scanning calorimetry, and the route from form 1 through the amorphous state to form 2 tracking the relationship between powder temperature and the glass transition [37]. Diffuse reflectance is equally used in polymorph and pseudopolymorph screening, as in the resolution of one polymorphic and three pseudopolymorphic forms of indapamide [38], and in a single workflow alongside in-line ATR monitoring of the crystallisation that produced the material [39].
A structural observation regarding this body of literature is warranted. Almost all the above-mentioned studies quantify form composition using synthetic mixtures prepared from well-characterised pure forms originating from a single material lot. While this represents a logical initial experiment, it does not confirm method performance on genuine manufacturing materials. The exceptions are instructive and few: the spironolactone survey examined thirteen commercial bulk lots as received [29], and the milling study followed a transformation induced by processing rather than prepared by weighing [37]. Table 2 depicts DRIFTS applications in the solid-form analysis of pharmaceuticals.
Table 2.
Diffuse reflectance methods for solid-form pharmaceutical analysis in chronological order.
4.3. Drug–Excipient Compatibility
Compatibility screening is a natural application of DRIFTS. Binary drug–excipient blends are prepared, stressed and examined for band shifts, broadening or intensity changes diagnostic of interaction. Because the technique is non-destructive, requires no solvent that might provoke interaction, and samples the blend as a physical mixture rather than through a contact interface, the measurement is well-matched to the question. Infrared spectroscopy is now firmly established in this role, generally in combination with differential scanning calorimetry and powder X-ray diffraction [42,43]. The same sampling mode also detects interactions that arise in the dissolution medium rather than in the blend, as in the saquinavir mesylate–sodium decyl sulphate salt that crystallised during an anomalous dissolution test and was then characterised by diffuse reflectance alongside single-crystal diffraction [44].
Interpretive caution is nonetheless required, as band shifts in a diffuse reflectance spectrum can arise from changes in the scattering environment as readily as from molecular interactions. An excipient that alters the particle size distribution or the effective refractive index of the bed will change relative band intensities without any chemical interaction whatsoever. Compatibility conclusions drawn from DRIFTS require physical-mixture controls at matched particle size, and reports that do not describe such controls should be read conservatively.
5. Quantitative Applications
5.1. Univariate Peak-Area Calibration
The most common approach to performing an assay of pharmaceutical samples using DRIFTS follows a remarkably straightforward protocol: dilute the sample in dry KBr to various concentrations, record the peak area under a well-defined carbonyl band, and then fit a regression to the area versus concentration.
The methods developed on this template are internally consistent and, within their stated ranges, perform respectably. Ciprofloxacin hydrochloride was quantified using the carbonyl band near 1710–1703 cm−1, linear from 0.3 to 1.5% w/w with a correlation coefficient of 0.998, intraday and interday relative standard deviations below 2.5%, and recovery from three marketed tablet brands between 98.5 and 99.0% of label claim [45]. Levofloxacin was quantified at approximately 1724 cm−1, with a linear range of 0.3 to 1.8% w/w and a correlation coefficient of 0.999, yielding mean recoveries of 101.3% from three marketed brands and 98.1% from a laboratory physical mixture [11]. Ranolazine was quantified using the carbonyl band near 1689 cm−1 over 1–3% w/w [46]. Pimavanserin tartrate was quantified at 1614 cm−1 over 1.0–3.5 µg mg−1, with recovery above 100% and relative standard deviation below 1% [20]. Neratinib was quantified at 2204.64 cm−1 over 5–30 µg mg−1 [21]. Four further methods have since been reported on the same template: methylcobalamin and pregabalin determined simultaneously in a combined tablet over 0.2–1.2% and 1–6% w/w, respectively [47], tramadol hydrochloride in capsules over 0.6–3.0% w/w [48], and pravastatin sodium over 5–30% w/w [49].
Earlier work established that multi-analyte determination is feasible on the same basis. Park and co-workers quantified ethenzamide, isopropylantipyrine, caffeine and allylisopropylacetylurea simultaneously in a tablet by diffuse reflectance spectroscopy with linear stepwise multiple regression, reducing an analysis that required roughly forty hours by conventional gas and ultraviolet methods to about six [50]. Baucells and colleagues applied diffuse reflectance spectroscopy to the determination of caffeine in an industrial context [51]. Table 3 presents the quantitative methods together with the figures of merit reported in the original studies.
Table 3.
Quantitative DRIFTS methods for pharmaceutical assay, divided by calibration approach. (a) Univariate peak-area calibration; (b) multivariate calibration; (c) calibration approach not recoverable from the retrievable record.
5.2. Multivariate Approaches
Latent-variable regression addresses the selectivity limitation of univariate band integration and is essential wherever bands overlap, as they do in form mixtures and complex formulations. Its application in pharmaceutical DRIFTS has been concentrated on solid-form quantitation [24,25,26,27], but it is not confined to it, and the assay literature is not univariate. Multivariate calibration has been applied to diffuse reflectance assay continuously since 1988; the present review identifies eighteen such assay methods (Table 3) alongside a further nine multivariate solid-form methods (Table 2), with twenty-seven studies in all. The approaches span linear stepwise multiple regression [50], principal component regression [33,55], artificial neural networks [31,32,34,52], partial least squares with its interval and synergy-interval variants [56,58,60,62,63], net analytical signal [35] and multivariate statistical process control [39]. Several were validated against a chromatographic reference method and agreed with it [60,62,63]. What has remained univariate is the single-analyte tablet assay built on peak-area integration, which is where the working-window observation below applies, and the two streams rarely cite one another. For instance, in the reported methods for pimavanserin and neratinib, chemometrics is applied only to the design of experiments for process optimisation, whereas final quantitation relies entirely on single-band peak areas [20,21].
This oversight represents a notable limitation, given that multivariate calibration combined with appropriate scatter correction is the established strategy to address the physical variability that inherently limits diffuse reflectance infrared Fourier transform spectroscopy (DRIFTS). Standard normal variate transformation, multiplicative scatter correction and derivative preprocessing were developed for near-infrared reflectance precisely because scattering confounds concentration there as well, and the fusion of scatter correction approaches continues to yield improvements in tablet property prediction [68]. Applying this toolkit systematically to mid-infrared diffuse reflectance of pharmaceutical solids would be a straightforward and likely productive line of work. They do not control the physical scattering process, and they do not guarantee invariance to a particle-size distribution, packing state or diluent condition lying outside that space. Preprocessing is therefore complementary to experimental control of the sampling variables, not a substitute for it.
5.3. The Narrow Working Window, and What It Means
Assembling the validated ranges of the univariate assay methods above yields the review’s central empirical observation (Figure 4). Seven of the nine cluster between 0.1 and 3.5% w/w analyte in potassium bromide. The lowest, the pimavanserin method, reaches 0.10 to 0.35% w/w and is also the method developed under the most rigorous experimental design. Two lie above the cluster: a pregabalin method linear to 6% w/w [47] and a pravastatin sodium method linear to 30% w/w [49], both reported as validated to ICH expectations. The second of these is an order of magnitude above the upper bound of the cluster, which is the strongest available evidence that the bound is a property of the system rather than of the technique. This clustering is unlikely to be coincidental, but it should be read as an empirically observed working range for the systems reviewed rather than as a universal boundary. The two limits have different origins. At the lower end, the analyte band area becomes small relative to baseline uncertainty in a measurement whose reflectance-to-remission transformation amplifies error; this bound is method- and instrument-dependent, and the pimavanserin method reaches 0.10% w/w under a formally optimised design. At the upper end, the analyte contributes materially to the scattering coefficient and the constant-s assumption underlying the Kubelka–Munk treatment degrades; this bound is physically grounded but will vary with band strength, particle size, optical contrast and packing. What the reviewed literature supports is that a bounded region exists and is rarely stated, not that its limits are fixed at 0.1 and 3.5% w/w for all systems.
Figure 4.
Validated calibration ranges reported for univariate DRIFTS assay methods identified in this review. Values are transcribed from the cited primary sources; ranges originally expressed in µg mg−1 have been converted arithmetically to % w/w. Seven of the nine methods identified fall within a window of approximately 0.1–3.5% w/w analyte in potassium bromide; two exceed it, one of them by an order of magnitude. The shaded band marks the 0.3–3% w/w window reported in the first submission of this review. The window is an empirical observation about this set of methods, not a universal limit.
Two implications follow. The first is a design constraint that is usually left implicit: because the analyte is diluted into the halide, the working window imposes a required dilution ratio, and a high-dose tablet may demand dilution factors at which the sub-sampling error may exceed the spectroscopic error. The representativeness advantage that diffuse reflectance holds over ATR is thereby partly surrendered at the weighing and trituration step, and DRIFTS assay reports rarely quantify this contribution.
The second is that the window is a specification rather than a defect. A technique remains usable within a defined operating envelope, provided that envelope is stated, yet the literature rarely does so.
5.4. The Transferability Problem
This instructive pharmaceutical DRIFTS study describes a methodological failure involving low-concentration polymorphic impurities (up to 2% w/w) in an API. Using partial least squares models derived from a single API lot, the authors achieved robust cross-validation for strongly absorbing impurities, contrasted by inadequate predictive performance for weakly absorbing bands. Applied to independent API lots, predictions for both were biased and contained outliers. Critically, the Q-residuals criterion identified the problem while two other outlier criteria did not. Rebuilding the models with mixtures spanning several lots did not simply improve matters: the model for the strongly responding impurity became noticeably worse, while the weakly responding one changed only marginally [40]. A companion study on the same system reached the same conclusion while setting the Q residuals criterion, Hotelling T2 and the score bi-plot side by side: Q residuals disqualified a large number of prediction samples that the other two criteria passed without comment [41]. The choice of diagnostic, not the regression, decided whether the excursion was seen at all.
Several conclusions follow, and they generalise beyond that specific system, provided five performance questions are kept separate. Internal validation asks whether a model reproduces the composition of samples drawn from the same population as the calibration set; cross-validation within a single lot answers only this. External prediction asks whether the model is accurate on samples held out from model building but still drawn from that population. Robustness asks whether performance survives deliberate variation in method parameters such as resolution, sieve fraction and packing. Calibration transfer asks whether the model, or a mathematically mapped version of it, remains valid on a second instrument. The applicability domain asks whether a new sample lies within the region of spectral space that the calibration actually spans, and it is the question that outlier diagnostics are intended to answer. Read in these terms, the reported failure is not a failure of partial least squares but a failure of the calibration set to represent the variance that future samples would present: lot-to-lot differences in particle size distribution and crystal habit alter s and therefore the measurand itself, carrying new samples outside the applicability domain. Two practical consequences follow. First, the choice of outlier diagnostic determines whether that excursion is detected at all, which is why the Q-residuals criterion identified the problem while two other criteria did not. Second, expanding a calibration is not monotonically beneficial: broadening the spectral space can degrade performance for a component that was already well-modelled, as was observed here.
Set against this, the current evidence for the DRIFTS assay, based on a single laboratory, a single instrument, few commercial tablets, and no multi-lot API challenge or inter-instrument testing, supports a much more limited conclusion than authors typically claim. Methods validated on that basis are appropriately described as fit for in-house quality control under fixed conditions, which is broadly what the more careful authors do claim [11,45,46]. They are not evidence of transferability, and the field has not systematically tested it.
6. DRIFTS Among Competing Sampling Modes
Rational technique selection requires an explicit account of what each sampling mode measures. Figure 5 presents a comparative evaluation and selection logic, while this section examines the primary trade-offs governing decision-making.
Figure 5.
Technique selection. (A) Comparative appraisal of infrared and Raman sampling modes against six attributes relevant to pharmaceutical solid analysis, expressed as high, moderate or low suitability. Cells marked “not feasible” denote an attribute that the physics forecloses rather than one on which the mode merely scores poorly. The entries are qualitative judgements by the authors, formed from the corpus reviewed here and not from measured quantities; the panel is an aid to reasoning and should not be read as a ranking. (B) Selection logic leading to DRIFTS, with the sampling controls that its physics requires.
Against ATR, DRIFTS offers greater bulk representativeness and lower risk of pressure-induced form change, at the cost of a dilution and trituration step and greater sensitivity to particle size. Head-to-head comparisons exist, but they are seldom built upon. Thiamine hydrochloride has been measured by ATR, diffuse reflectance and Raman spectroscopy on the same tablets [59]; vitamin C by six modes including diffuse reflectance, ATR, photoacoustic and Raman detection, returning coefficients of determination from 0.95 to 0.999 on identical samples with diffuse reflectance at 0.976 against 0.999 for ATR [53]; polymorphic spironolactone by FT-Raman against diffuse reflectance [29]; mebendazole and bucillamine each by conventional potassium bromide transmission against diffuse reflectance [33,55]; pyrantel with praziquantel by ultraviolet against infrared [61]; and cinnarizine by a diffuse reflectance accessory against a modified specular reflectance accessory [9]. A quantum cascade laser study reports non-contact diffuse reflectance at a 15 cm working distance with an analytical sensitivity equivalent to 0.05% of active ingredient and places its accuracy and precision against near-infrared, ATR and Raman [64]. Mazurek and Szostak have separately compared ATR with Raman for diclofenac sodium tablets [69], and the same authors measured the contribution of sampling area to error directly, acquiring one set of tablets on two accessories whose beam areas differed about sevenfold and reporting relative standard errors of prediction of 1.3–2.9% against 1.0–1.7% [57]. What is missing is therefore not the comparison but its uptake: these studies are rarely cited by the single-analyte assay papers that followed, and technique choice in those papers is still rarely justified by measured performance.
Against transmission through alkali halide discs, DRIFTS is faster, avoids compaction, and does not require optical-quality disc formation; it accepts greater band-intensity distortion in return. Compared with near-infrared diffuse reflectance, DRIFTS provides much greater spectral specificity through fundamental rather than overtone transitions, enabling band assignment and univariate calibration. However, unlike near-infrared methods, it cannot readily analyse intact dosage units because mid-infrared radiation lacks sufficient penetration depth. This is the decisive difference for process analytical technology, and it explains the near-total dominance of near-infrared and Raman spectroscopy in that domain [70,71,72,73]. It is not a deficiency that DRIFTS can remedy; it is a boundary of applicability. Compared with Raman spectroscopy, DRIFTS is cheaper, free of fluorescence interference and free of sample-heating risk, but less able to measure through packaging and generally less sensitive to low-frequency lattice modes.
A specific niche deserves mention. Reflectance infrared spectroscopy, predominantly in the ATR configuration, has been applied to the rapid screening of substandard and falsified medicines, where the analytical question is whether a formulation contains approximately the declared quantity of the declared substance rather than whether it meets a narrow assay specification [74]. This is a setting in which the DRIFTS working window is well-matched to the requirement. The absence of solvent and cold chain is a practical advantage, and moderate accuracy is sufficient for triage. Most reported screening work in this area has nonetheless used ATR or portable near-infrared instrumentation [74,75,76,77,78], and the case for mid-infrared diffuse reflectance in field screening remains largely untested.
6.1. Experimental Comparison of Sampling Modes
To place the comparison above on a measured rather than asserted footing, mid-infrared spectra of two fluoroquinolone antibacterials, ciprofloxacin and levofloxacin, were acquired as the neat powders and as 1% w/w dilutions in dried potassium bromide, by both diffuse reflectance and attenuated total reflectance, on one instrument under matched conditions (Figure 6). These spectra illustrate the sampling-mode differences discussed above; they are not offered as a validated comparative study, and the observations below are qualified accordingly. Two differences between the sampling modes are apparent.
Figure 6.
Experimental mid-infrared spectra of ciprofloxacin and levofloxacin, acquired in the authors’ laboratory on one instrument under the conditions given in Section 6.1.1. (A,B) Diffuse reflectance compared with attenuated total reflectance for the same 1% w/w dilution in dried potassium bromide plotted on a common ordinate. As discussed in Section 6.1.2, 1% w/w is the working condition for diffuse reflectance but not for attenuated total reflectance, so the comparison at matched loading is not a general sensitivity ranking. (C) Ciprofloxacin by diffuse reflectance, neat and at 1% w/w. (D) Intensity of three lower-wavenumber bands relative to the carboxyl C=O stretch in the neat powders after baseline correction, showing that ATR over-weights the lower-wavenumber region in both compounds. (E) Principal band assignments for ciprofloxacin at 1% w/w by diffuse reflectance; assignments are listed in Table 4. The ordinate is pseudo-absorbance, log10(1/R), as reported by the instrument throughout, and not the Kubelka–Munk remission function.
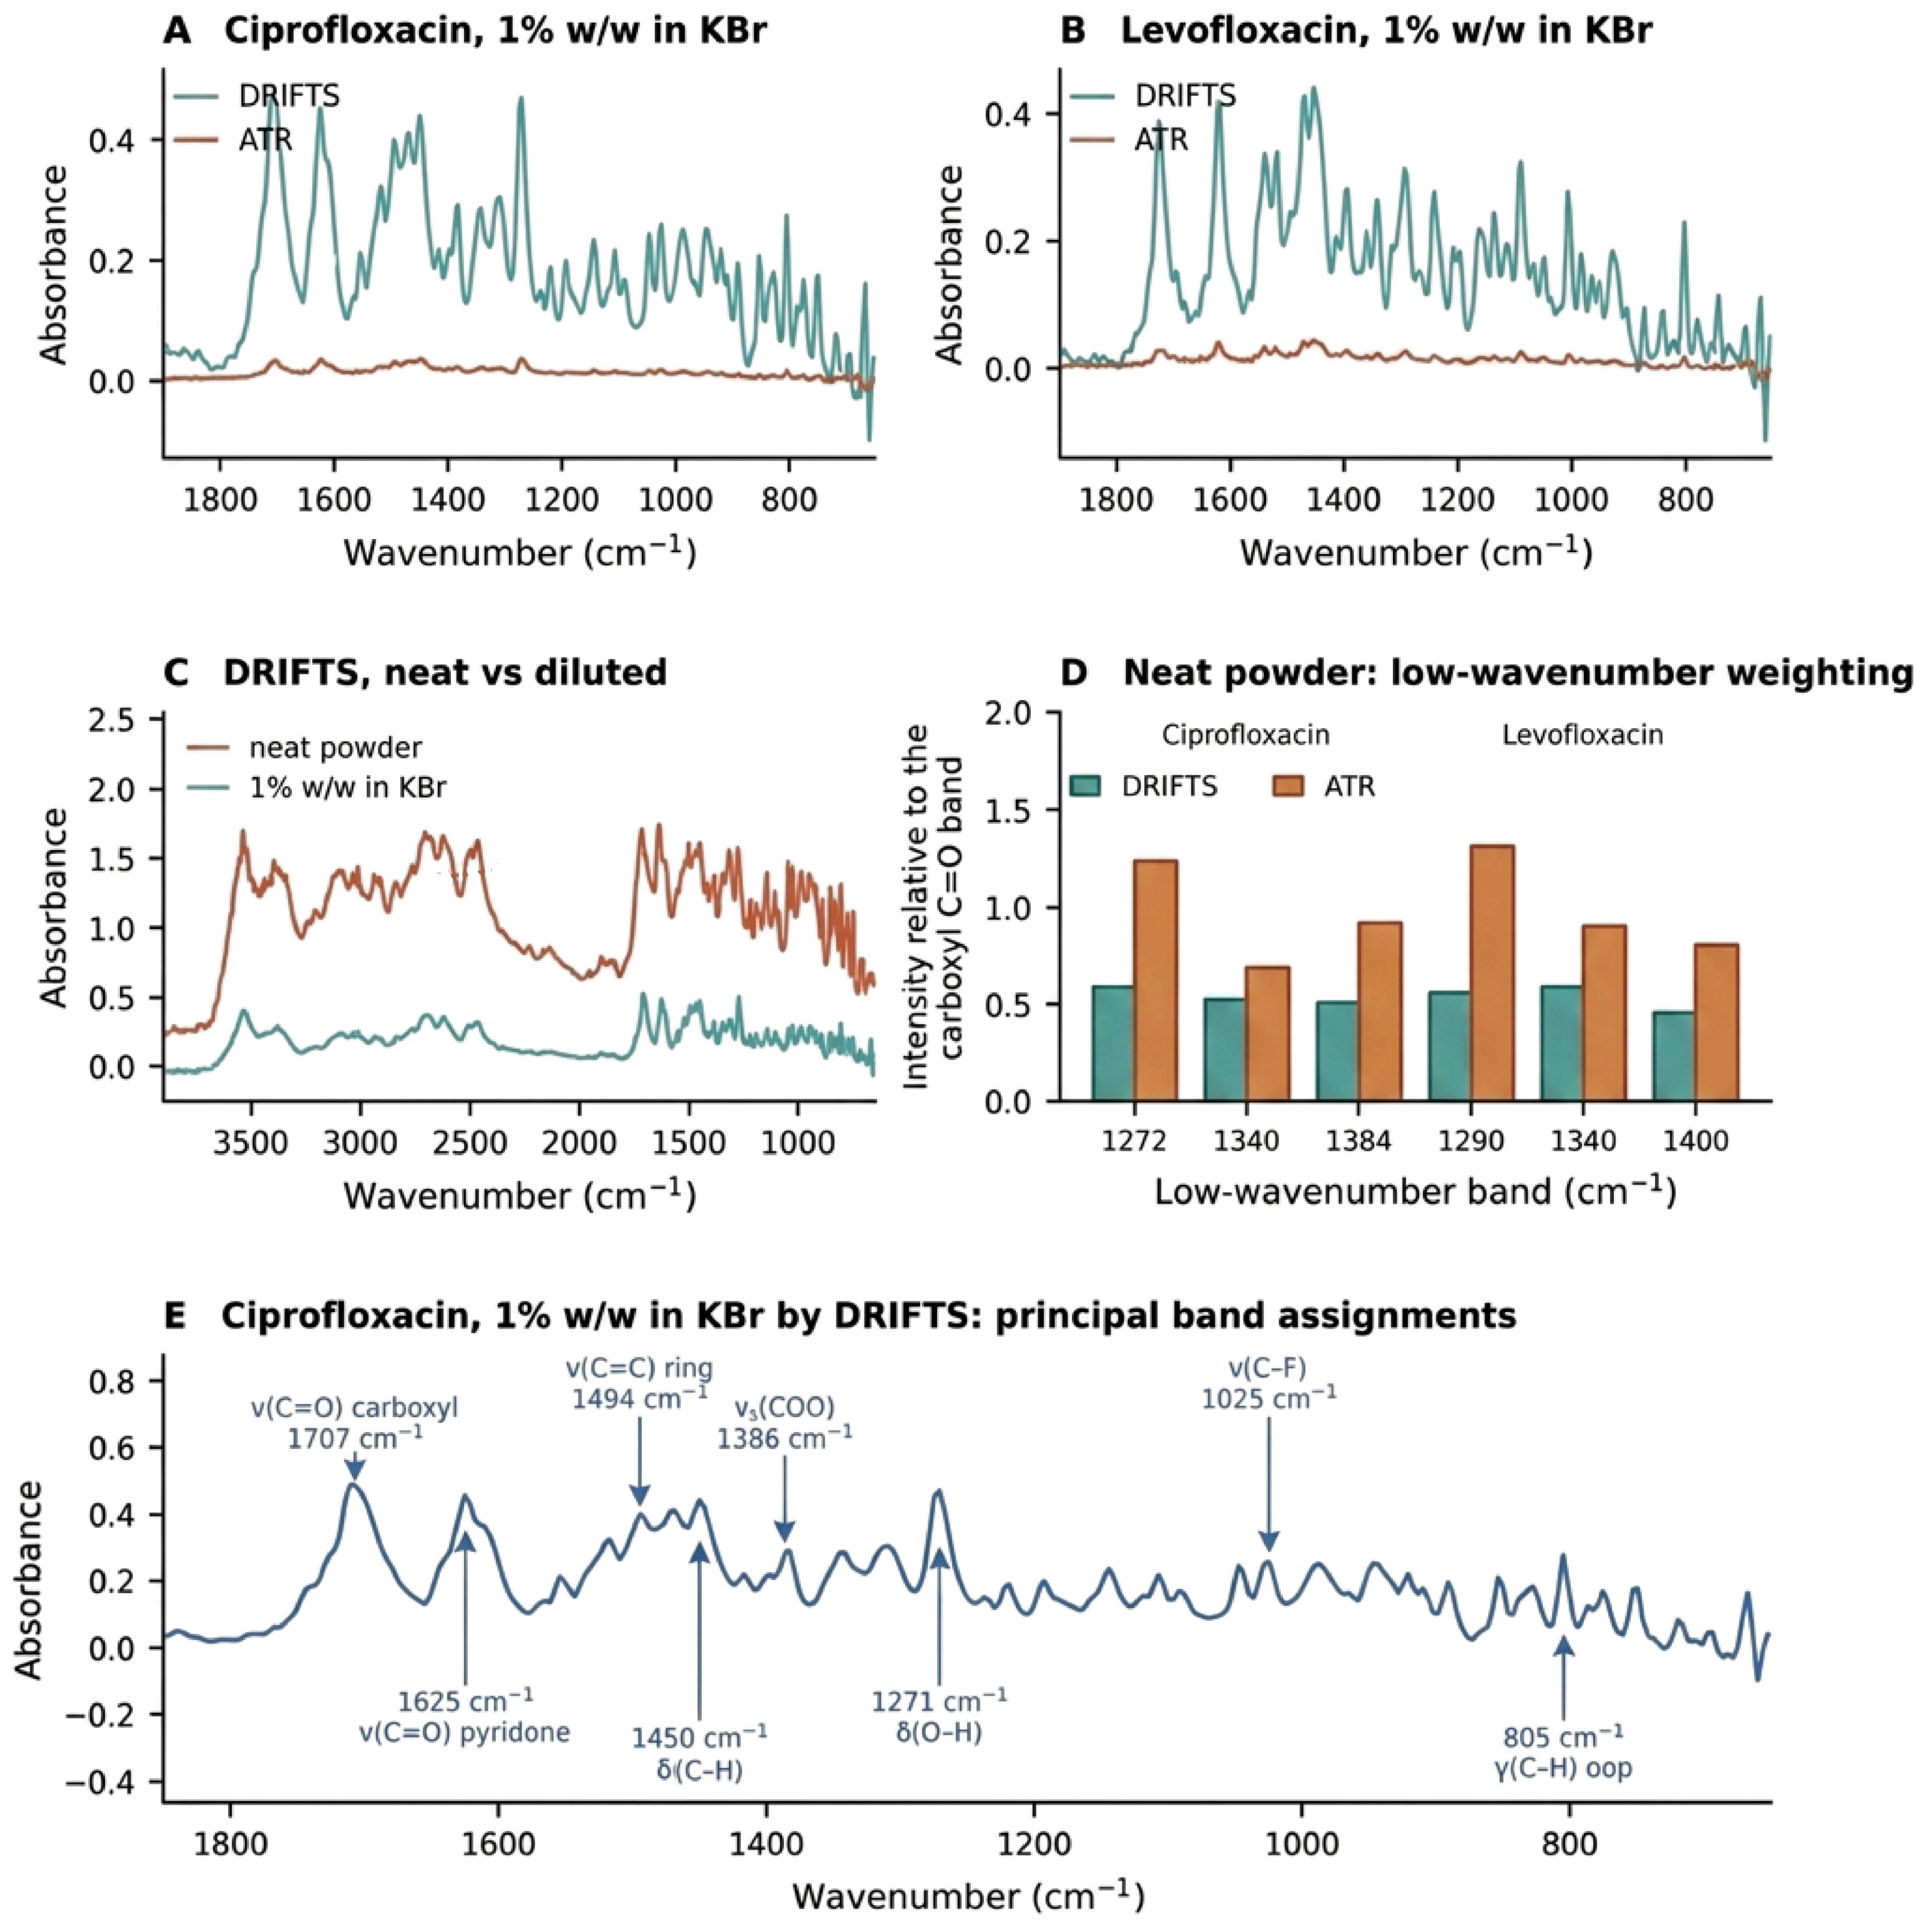
Table 4.
Principal band assignments for the spectra of Figure 6.
6.1.1. Acquisition Conditions
Because Section 7.3 of this review argues that the DRIFTS literature under-reports the variables that physically govern the measurement, the conditions under which the spectra of Figure 2C and Figure 6 were acquired are reported here in full. The spectra are illustrative rather than the product of a validated comparative study. The following conditions apply to all eight spectra unless stated otherwise.
- Instrument and accessories. Spectra were recorded on an Agilent Cary 630 FTIR spectrometer (Agilent Technologies, Santa Clara, CA, USA) controlled by MicroLab PC software for data collection, and Agilent Resolution Pro software was used to analyse the data. The optical engine has a high-throughput Michelson interferometer with fixed and moving flat mirrors, a ZnSe beamsplitter, a wire-wound infrared source and a low-power solid-state reference laser, and a 1.3 mm thermoelectrically cooled DTGS detector.
- Diffuse reflectance spectra were acquired with the Agilent Diffuse Reflectance sampling accessory for the Cary 630. It uses a four-position sliding sample holder: position 1 carries a permanently mounted diffuse gold reference, and positions 2–4 accept powder samples. ATR spectra were acquired with the Agilent single-reflection diamond ATR sampling accessory. The instrument identifies each accessory by RFID upon mounting. Accessory alignment is factory-set, and no optical adjustment was made;
- Acquisition parameters. Spectra were collected at 8 cm−1 resolution with 32 co-added scans, identical for all eight spectra, over the range 4000–650 cm−1. The instrument’s maximum resolution is 2 cm−1;
- Materials. The pure samples of ciprofloxacin and levofloxacin were obtained as a gift from Julphar Gulf Pharmaceutical Industries (Ras Al Khaimah, United Arab Emirates); Ras Al Khaimah and the potassium bromide FT-IR grade was purchased from Sigma-Aldrich (Burlington, MA, USA, CAS Number: 7758-02-3);
- Diluent condition. Potassium bromide was dried at 40° for 6 h and stored in a desiccator before use;
- Sample preparation. Appropriate quantity of drug was diluted with potassium bromide to obtain around 1000 mg and was triturated in a porcelain mortar and pestle to ensure sample homogeneity;
- Packing and presentation. Each sample position was filled completely, levelled with a flat-edged spatula and struck off to remove overfill, giving packing to a fixed volume. The holder detents were used to index each position into the beam;
- Background reference. Background spectra were recorded against the diffuse gold reference in position 1 of the sample holder. A background was collected immediately before each sample spectrum;
- ATR conditions. The ATR element was a type IIa synthetic diamond with a single reflection. Its sampling surface is 1 mm in diameter, with an active area of about 200 µm. Nominal penetration depth is about 2 µm at 1700 cm−1. Contact pressure was applied with the accessory’s slip-clutch press, turned clockwise to its detent. The clutch limits applied pressure to a fixed device maximum, so contact force was the same for every measurement;
- Data treatment. Baselines were removed by asymmetric least squares with a second-difference smoothness penalty (λ = 1 × 10⁵, asymmetry p = 0.001, twenty iterations) over the stated window before the band ratios were computed. Peak band signal was taken as the maximum baseline-corrected ordinate over 1000–1800 cm−1, the baseline offset being the fifth percentile of the ordinate in that window. Noise was estimated as the root-mean-square residual about a linear fit over 2000–2300 cm−1, a region free of bands in both compounds, and the signal-to-noise ratio is the ratio of those two quantities. The ordinate throughout is pseudo-absorbance, log10(1/R), as reported by the instrument, and not the Kubelka–Munk remission function;
- Replication and parameters not recorded. One preparation and one spectrum were used per condition, so the values in Section 6.1.2 carry no replicate-based uncertainty and are indicative rather than estimates of stated precision. Particle size distribution was not measured, the powders being triturated but not size-classified, and ambient temperature and relative humidity were not recorded. Section 7.3 names these among the parameters this literature routinely omits; we declare ours rather than pass over them.
Because these conditions were matched across sampling modes but were not varied systematically, the comparisons in Section 6.1 are indicative of the differences between the modes under one set of conditions and do not constitute a robustness or ruggedness assessment.
6.1.2. Observations
The first concerns the signal available from a dilute analyte held in a scattering matrix. At 1% w/w in potassium bromide, diffuse reflectance returns a markedly larger peak band signal than the attenuated total reflectance over 1000–1800 cm−1, with signal-to-noise ratios of 60 against 10 for ciprofloxacin and 74 against 16 for levofloxacin (Figure 6A,B). That comparison is informative about one specific situation, namely a few percent of analyte dispersed through a halide bed, and it is not a general statement about the relative sensitivity of the two accessories. Attenuated total reflectance would not normally be operated on a diluted sample, and measuring it that way places it in an intrinsically unfavourable condition, because only about one part in a hundred of the material contacting the crystal is analyte. Measured instead on the neat powders, as ATR would ordinarily be used, the ATR signal is roughly nine to eleven times larger than at 1% w/w; the advantage of diffuse reflectance at its own working dilution over ATR on neat material is then approximately 1.2-fold, with signal-to-noise ratios of 60 against 57 for ciprofloxacin and 74 against 60 for levofloxacin. The appropriate conclusion is therefore not that diffuse reflectance is the more sensitive technique but that it tolerates the dilution its own optics require, whereas attenuated total reflectance does not; the ratios quoted at matched 1% w/w loading should not be read as a sensitivity ranking. It is also worth noting that dilution to 1% w/w attenuates the ATR signal far less than the hundredfold that proportional surface coverage would predict, which is consistent with preferential contact of analyte particles with the crystal and is itself a reason for caution in interpreting ATR measurements made on diluted powders. In both modes, the ordinate is the instrument-reported pseudo-absorbance, so these are comparisons of the signal obtained in each accessory rather than of molar absorptivity.
The second concerns the fidelity of relative band intensities and can be assessed on the neat powders where no dilution confound exists. After baseline correction, attenuated total reflectance systematically over-weights the lower-wavenumber region relative to the carboxyl C=O stretch. The δ(O–H) band near 1271 cm−1 in ciprofloxacin has an intensity of 0.60 relative to the carboxyl stretch by diffuse reflectance but 1.24 by ATR; the corresponding figures for the 1290 cm−1 band of levofloxacin are 0.57 and 1.32 (Figure 6D). The effect is reproduced in both compounds and across three band pairs in each and is consistent with the wavelength dependence of the ATR evanescent penetration depth. Diffuse reflectance therefore returns relative band intensities closer to those expected from transmission, which matters wherever band ratios carry analytical weight. This reading assumes that no penetration-depth (advanced ATR) correction was applied to the attenuated total reflectance spectra.
Principal band assignments for both compounds are given in Table 4 and are marked on the ciprofloxacin spectrum in Figure 6E. The carboxylic acid and pyridone carbonyl stretches observed here at 1707 and 1625 cm−1 for ciprofloxacin and at 1726 and 1618 cm−1 for levofloxacin agree with the published vibrational literature for fluoroquinolones [79,80,81]. Neither observation overturns the position taken in this review: DRIFTS is advantageous for dilute analytes in a scattering matrix and for the fidelity of band ratios. Meanwhile, ATR remains faster for neat material and requires no dilution step, and neither mid-infrared mode can interrogate an intact dosage unit.
7. Regulatory Relevance
Three questions are often merged in discussions of the regulatory standing of diffuse reflectance, and separating them clarifies what is and is not an obstacle. First, is diffuse reflectance acceptable in principle under the existing framework? On the evidence set out below, it is that neither the United States Pharmacopeia nor the European Pharmacopoeia excludes reflectance sampling [1,22,23], and ICH Q2(R2) explicitly extends validation principles to spectroscopic and multivariate procedures [7]. Second, do compendial precedents exist for quantitative DRIFTS assays? They do not, and this is a real gap with practical consequences because no worked precedent exists for the sampling-specific controls such an assay would require. Third, does the published literature supply sufficient robustness and transferability evidence to support implementation in regulated quality control? It does not, and this is the binding constraint. The deficit identified in this review is therefore evidentiary rather than regulatory, and the term regulatory readiness is used throughout in that sense.
7.1. Compendial Position
The compendial establishment of mid-infrared spectroscopy is for identity and, in defined cases, for quantitation. The USP general chapter ⟨854⟩ sets out requirements, including validation expectations for drug product assay, with ⟨1854⟩ providing supporting theory and practice [22,23]. Furthermore, Ph. Eur. 2.2.24 was comprehensively revised in 2018, removing obsolete instrumentation, extending the treatment of Fourier transforming instruments and reflectance sampling, and adding equipment performance criteria [1]. Neither pharmacopoeia forecloses diffuse reflectance. What is absent is any monograph assay employing it and, consequently, any worked compendial precedent for the sampling-specific controls a DRIFTS assay would require.
7.2. ICH Q2(R2) and Q14
The adoption of ICH Q14 alongside the revised ICH Q2(R2) at Step 4 in November 2023 materially changed the regulatory landscape [7,8]. The revision of Q2 explicitly extended validation principles to spectroscopic and spectrometric data, including procedures requiring multivariate analysis. Q14 describes science- and risk-based approaches to procedure development, distinguishing a minimal from an enhanced approach and addressing multivariate procedures, real-time release testing and lifecycle change management.
For DRIFTS, this framework is unusually well-matched because the enhanced approach asks precisely the questions that the technique’s physics makes unavoidable. Defining an analytical target profile requires an explicit statement of the concentration range, which, for DRIFTS, is optically bounded. Identifying critical method parameters directs attention to the scattering variables, which the literature currently underreports. Establishing a method operable design region provides a mechanism for defining the particle-size and packing envelope within which performance is demonstrated. And lifecycle management provides the vehicle for the multi-lot verification shown to be necessary.
Panda and colleagues demonstrated the approach concretely, identifying critical method variables by risk assessment, establishing that resolution required an explicit control strategy, and validating against ICH expectations [20]. This remains, in the evidence located here, the most methodologically complete DRIFTS assay development published, and it is instructive that it is also the one achieving the lowest working range.
7.3. What DRIFTS Reports Systematically Omit
Comparing the pharmaceutical DRIFTS literature with the factors established as physically determinative reveals a consistent pattern of omission. The principal gaps are as follows.
- Particle size distribution. Sieve fraction or measured distribution for the analyte, diluent and formulation powder is rarely reported, despite documented dependence of the remission function on particle size [15,16];
- Packing protocol. The fill method, levelling procedure and packing density are rarely specified, although all three affect the scattering coefficient;
- Diluent condition. Potassium bromide’s drying regime, storage and water content are seldom stated, notwithstanding its hygroscopicity;
- Environmental conditions. Ambient temperature and relative humidity during acquisition are rarely recorded, although temperature has been identified as a critical method variable [20];
- Acquisition parameters. Resolution and scan number are more often reported than the above but by no means universally, and their effects on integrated peak area are rarely acknowledged;
- Lot provenance. The number of independent API and excipient lots contributing to calibration and validation is rarely stated, which is the single most consequential omission considering the transferability evidence [40];
- Instrument multiplicity. Validation across multiple spectrometers is essentially absent.
The consequence is that most published DRIFTS methods may not be reproduced from their descriptions, and their robustness claims may not be independently evaluated. Rather than reflecting the shortcomings of individual researchers who adhere to their respective journals’ standards, this observation points to a collective lack of rigorous reporting conventions. Addressing this gap represents the most tractable challenge identified in our analysis. Table 5 maps these omissions against the stated regulatory expectations.
Table 5.
Mapping of regulatory expectations onto the current DRIFTS methods literature.
8. Green and Sustainable Analytical Chemistry
Environmental arguments for using DRIFTS are solid and uniquely uncontroversial. The technique does not need any organic solvent, produces very little waste apart from a few hundred milligrams of halide-diluted powder, does not require extraction, derivatisation, or mobile phase preparation, and needs only a small amount of power for the instrument over several minutes. Compared with a liquid chromatographic assay that uses hundreds of millilitres of eluent containing acetonitrile per run, the difference is not small.
The Analytical Eco-Scale scores penalties based on deviation from the perfect green procedure [5]. The Green Analytical Procedure Index and its additional component present the effect of the environment in the form of a structured icon [4,82]. The AGREE scale scores twelve green analytical chemistry principles within one score in the form of a clock [3]. AGREEprep is focused specifically on sample preparation [83], and comparative studies of these scales are now also possible [84,85]. The White Analytical Chemistry assessment adds to the evaluation framework the ability to balance greenness, analytical performance and applicability [86], while the Blue Applicability Grade Index formalises method applicability [87].
This addition is relevant in the current context. While the method can be green but not applicable, a pure environmental assessment of the method would reward DRIFTS precisely because of its simplicity, which constrains its application domain. The neratinib method was evaluated using the AGREE and White Analytical Chemistry assessment [21], and this framework, which combines environmental performance and applicability, is the right one. Thus, the recommendation is clear: DRIFTS method reports must include greenness assessment and an assessment of the applicability of the method.
Two critical caveats temper the environmental claim. First, potassium bromide incurs a manufacturing, drying, and disposal footprint, and life-cycle accounting for the halide diluent has not been performed. Second, a method requiring extensive multi-lot revalidation cannot be deemed straightforwardly green if the revalidation burden exceeds the per-analysis resource savings. Greenness assessments in the DRIFTS literature are conducted per analysis and do not capture lifecycle cost.
9. Critical Synthesis
Five structural weaknesses account for the gap between the demonstrated capability of DRIFTS and its limited adoption. They are ordered here by tractability, with the most tractable first.
First is a reporting deficit. The variables that physically govern the measurement are not reported at a level permitting replication. This is the cheapest problem to fix and requires no new experiments.
Second is an evidentiary monoculture. The literature is dominated by single-laboratory, single-instrument, single-lot validations, and the two studies that tested multi-lot transferability for polymorphic impurities both found it wanting, while also showing that the choice of outlier criterion determines whether failure is detected at all [40,41]. Until multi-lot and multi-instrument designs become normal, robustness claims will remain unsupported.
Third is a divided literature. Multivariate calibration has been applied to diffuse reflectance assay since 1988 and to solid-form quantification since the early 1990s, yet the single-analyte tablet assay has remained univariate throughout, and the two streams rarely cite one another. The consequence is not an absence of method development but a failure of transfer between the neighbouring literature: corrections to the remission function for particle size have been in place since 1995 and are essentially unused in either stream [16].
Fourth, benchmarking without uptake. Comparative studies placing diffuse reflectance alongside ATR, transmission, near-infrared or Raman on identical samples have been published repeatedly since 1992 and are set out in Section 6, yet technique choice in subsequent assay papers is still rarely justified by the measured performance. The evidence exists and is simply not used, which prevents the technique from establishing where it outperforms the alternatives.
Fifth, there is a hard physical limitation. Mid-infrared radiation cannot penetrate a solid tablet, so DRIFTS is not amenable to full-dosage testing without destructive sampling and/or in-line process monitoring. This limitation is irreparable and represents the ultimate boundary of the scope of technology.
The first four limitations are addressable through methodological modifications. The existence of these indicates a community that has viewed DRIFTS as a handy technology for individual methods papers rather than one deserving systematic development, and this community produces a wide-ranging but shallow literature: many analytes, each studied only once.
10. Opportunities and Research Priorities
Six avenues would make significant contributions to this field. They have been put forward not as goals but as research programmes with an empirical focus and are briefly summarised in Table 6.
Table 6.
Research priorities.
Studies involving multi-lot and multi-instrument validation: What is needed here is a well-designed transferability study of a mid-IR diffuse reflectance method: using multiple lots of APIs with different particle size distributions, multiple lots of excipients, two or more spectrometers, and the rigorous testing of calibration transfer. Such a study would either validate or invalidate the method. Either outcome would be much more useful than another single-lot method.
Comparative investigation of scatter compensation and scatter-aware calibration design: Three strategies should be evaluated against one another on common pharmaceutical datasets rather than adopted by default. The first is empirical preprocessing—the algorithm suite established for near-infrared reflectance, which is straightforward to transfer to mid-infrared pharmaceutical diffuse reflectance but untested at scale [68]. The second is physically informed correction, principally the particle-size-corrected remission function [16]. The third is calibration design that represents the expected scatter variance explicitly, so that the applicability domain covers the particle-size and packing states future samples will present. The three address different parts of the problem, and only the third can extend validity beyond the calibrated variance space.
Engineering particle size explicitly: Instead of treating particle size as noise, it should be controlled as a method parameter: sieve fractions stated, distributions measured, and the sensitivity of the calibration slope to size fraction determined and published.
ICH Q14-native method development: Complete enhanced approach development including a stated analytical target profile, risk assessment to determine critical method parameters, method operable design space and control strategy. The pimavanserin case points toward that path [20]; the area requires a number of these investigations.
Comparative benchmarking as routine: Method development should report DRIFTS alongside at least one alternative sampling mode measured on the same samples, following the thiamine template [59], so that technique selection rests on measured performance rather than on convenience.
Deployment with bounded application: It would make sense to use DRIFTS not to achieve the chromatographic standard of assay but for applications that by their nature are appropriate for its use: quick medicine screening in resource-limited conditions [74], in-process form identification, compatibility screening, and raw material identification on arrival.
11. Conclusions
DRIFTS is a capable, solvent-free, solid-form-sensitive technique whose pharmaceutical literature has not matured in proportion to its age. Validated univariate assays perform well within a working window of roughly 0.3 to 3% w/w analyte in potassium bromide, with one formally optimised method reaching 0.10% w/w. That window is bounded at its upper end by the optics of diffuse reflection and at its lower end by baseline uncertainty rather than by detector sensitivity alone. It is system-specific, and it is rarely acknowledged as a specification. The evidence supporting robustness is structurally weak: single-lot, single-instrument designs predominate, and when transferability has been tested directly, it has not been demonstrated.
The positive interpretation of DRIFTS is that it is an under-characterised rather than an underperforming technique. The physics underlying DRIFTS is well-known and has been so for decades. The necessary corrections to address its main confounding factor have been known since the 1990s, and ICH Q14 offers a regulatory framework with requirements almost identical to those for the variables that need controlling. What is lacking is the evidentiary discipline that would connect them: multi-lot and multi-instrument validation, systematic scatter correction, explicit particle-size control, and reporting detailed enough to permit replication.
The evidence reviewed here supports three tiers of application. First is established qualitative identity confirmation and solid-form characterisation, where DRIFTS has a durable record and its sensitivity to hydrogen bonding and crystal packing is well-demonstrated. Second is demonstrated under controlled conditions: quantitative assay of formulations with a stable, characterised matrix, where validated methods perform well within a declared range but on single-laboratory, single-lot designs. Third is promising but insufficiently demonstrated: transferable assay in regulated quality control and in field deployment, where the published evidence does not yet establish robustness across lots, instruments or laboratories. The working range observed across the reviewed assays is bounded, and that bound should be declared as part of the method rather than discovered by the next analyst. The transferability gap is evidentiary rather than physical, and it can be closed by the study designs set out in Section 10.
Author Contributions
Conceptualization, B.A.B.; Methodology, B.A.B. and A.A.A.; Validation, B.A.B., A.A.A. and N.D.A.; Formal Analysis, B.A.B. and R.B.P.; Investigation, B.A.B. and A.A.A.; Resources, B.A.B. and A.A.A.; Data Curation, B.A.B. and A.A.A.; Writing—Original Draft Preparation, B.A.B. and A.A.A.; Writing—Review and Editing, N.D.A., R.B.P. and S.B.S.; Visualisation, B.A.B. and N.D.A.; Project Administration, B.A.B. and S.B.S. All authors have read and agreed to the published version of the manuscript.
Funding
This work received no external funding.
Data Availability Statement
Acknowledgments
B.A.B. and A.A.A. thank Ismail Ibrahim Ali Matalka, Mohamed El-Tanani, Research and PG Studies, RAK Medical and Health Sciences University, Ras Al Khaimah, for his support and encouragement. During the preparation of this manuscript, the authors used Grammarly and Claude (web-based version) for language editing and proofreading. BioRender AI was used to improve the quality of generated figures. After using these tools, the authors reviewed and edited the content as needed and took full responsibility for the originality and accuracy of the final publication.
Conflicts of Interest
The authors declare no conflicts of interest.
Abbreviations
The following abbreviations are used in this manuscript:
| AGREE | Analytical GREEnness metric |
| API | Active pharmaceutical ingredient |
| ATP | Analytical target profile |
| ATR | Attenuated total reflectance |
| CMP | Critical method parameter |
| DoE | Design of experiments |
| DRIFTS | Diffuse reflectance infrared Fourier transform spectroscopy |
| FTIR | Fourier transform infrared |
| ICH | International Council for Harmonisation |
| MODR | Method operable design region |
| MSC | Multiplicative scatter correction |
| NIR | Near-infrared |
| PLS | Partial least squares |
| PSD | Particle size distribution |
| PXRD | Powder X-ray diffraction |
| RSD | Relative standard deviation |
| SNV | Standard normal variate |
References
- European Directorate for the Quality of Medicines & HealthCare. European Pharmacopoeia General Chapter 2.2.24, Absorption Spectrophotometry, Infrared; Revised version adopted at the 160th session of the Ph. Eur. Commission; EDQM: Strasbourg, France, 2018. [Google Scholar]
- Fuller, M.P.; Griffiths, P.R. Diffuse reflectance measurements by infrared Fourier transform spectrometry. Anal. Chem. 1978, 50, 1906–1910. [Google Scholar] [CrossRef] [Scilit]
- Pena-Pereira, F.; Wojnowski, W.; Tobiszewski, M. AGREE—Analytical GREEnness metric approach and software. Anal. Chem. 2020, 92, 10076–10082. [Google Scholar] [CrossRef] [Scilit] [PubMed]
- Płotka-Wasylka, J. A new tool for the evaluation of the analytical procedure: Green Analytical Procedure Index. Talanta 2018, 181, 204–209. [Google Scholar] [CrossRef] [Scilit] [PubMed]
- Gałuszka, A.; Migaszewski, Z.M.; Konieczka, P.; Namieśnik, J. Analytical Eco-Scale for assessing the greenness of analytical procedures. TrAC Trends Anal. Chem. 2012, 37, 61–72. [Google Scholar] [CrossRef] [Scilit]
- Ticona Chambi, J.; Fandaruff, C.; Cuffini, S.L. Identification and quantification techniques of polymorphic forms—A review. J. Pharm. Biomed. Anal. 2024, 242, 116038. [Google Scholar] [CrossRef] [Scilit] [PubMed]
- International Council for Harmonisation. ICH Q2(R2): Validation of Analytical Procedures; Step 4 version, 1 November 2023; ICH: Geneva, Switzerland, 2023. [Google Scholar]
- International Council for Harmonisation. ICH Q14: Analytical Procedure Development; Step 4 version, 1 November 2023; ICH: Geneva, Switzerland, 2023. [Google Scholar]
- Czaja, T.; Mazurek, S.; Szostak, R. Quantitative analysis of solid samples using modified specular reflectance accessory. Talanta 2016, 161, 655–659. [Google Scholar] [CrossRef] [Scilit] [PubMed]
- Spragg, R. Reflection Measurements in IR Spectroscopy; Technical note; PerkinElmer Inc.: Waltham, MA, USA, 2013. [Google Scholar]
- Alnaqbi, A.Y.M.S.; Bhongade, B.A.; Azzawi, A.A. New validated diffuse reflectance infrared Fourier transform spectroscopic method for the quantification of levofloxacin in pharmaceutical dosage form. Indian. J. Pharm. Sci. 2021, 83, 430–436. [Google Scholar] [CrossRef] [Scilit]
- Kubelka, P.; Munk, F. Ein Beitrag zur Optik der Farbanstriche. Z. Tech. Phys. 1931, 12, 593–601. [Google Scholar]
- Kortüm, G. Reflectance Spectroscopy: Principles, Methods, Applications; Springer: Berlin/Heidelberg, Germany, 1969. [Google Scholar]
- Juang, R.H.; Storey, D.E. Quantitative determination of the extent of neutralization of carboxylic acid functionality in Carbopol 974P NF by diffuse reflectance Fourier transform infrared spectrometry using Kubelka-Munk function. Pharm. Res. 1998, 15, 1714–1720. [Google Scholar] [CrossRef] [Scilit] [PubMed]
- Christy, A.A.; Liang, Y.-Z.; Hui, C.; Kvalheim, O.M.; Velapoldi, R.A. Effect of particle size on diffuse reflectance infrared spectra of polystyrene spheres. Vib. Spectrosc. 1993, 5, 233–241. [Google Scholar] [CrossRef] [Scilit]
- Christy, A.A.; Kvalheim, O.M.; Velapoldi, R.A. Quantitative analysis in diffuse reflectance spectrometry: A modified Kubelka–Munk equation. Vib. Spectrosc. 1995, 9, 19–27. [Google Scholar] [CrossRef] [Scilit]
- Otsuka, M.; Matsuda, Y. Comparative evaluation of mean particle size of bulk drug powder in pharmaceutical preparations by Fourier-transformed powder diffuse reflectance infrared spectroscopy and dissolution kinetics. J. Pharm. Sci. 1996, 85, 112–116. [Google Scholar] [CrossRef] [Scilit] [PubMed]
- TeVrucht, M.L.E.; Griffiths, P.R. Quantitative investigation of matrices for diffuse reflectance infrared Fourier transform spectrometry. Talanta 1991, 38, 839–849. [Google Scholar] [CrossRef] [Scilit] [PubMed]
- Iwaoka, T.; Shinya, T.; Tabata, F. Nondestructive in situ FTIR measurement by diffuse reflectance spectrometry—Penetration depth, surface measurement and interior analysis. Anal. Sci. 1991, 7, 403–406. [Google Scholar]
- Panda, S.S.; Bera, R.K.V.V.; Panda, J. Chemometry-assisted diffuse reflectance infrared Fourier transform spectroscopy (DRIFTS) method for quantification of a novel antipsychotic agent in pharmaceuticals: A case study on ICH Q14 concept. Vib. Spectrosc. 2020, 107, 103039. [Google Scholar] [CrossRef] [Scilit]
- Panda, S.S.; Kumar, A.; Bera, R.K.V.V. Diffuse reflectance infrared Fourier transform spectroscopic method for estimation of neratinib in pharmaceuticals: Application to analytical quality by design and greenness assessment. Indian Drugs 2024, 61, 30–39. [Google Scholar] [CrossRef] [Scilit]
- United States Pharmacopeia. General Chapter ⟨854⟩ Mid-Infrared Spectroscopy; USP–NF; USP: Rockville, MD, USA, 2022. [Google Scholar]
- United States Pharmacopeia. General Chapter ⟨1854⟩ Mid-Infrared Spectroscopy—Theory and Practice; USP-NF; USP: Rockville, MD, USA, 2025. [Google Scholar]
- Hartauer, K.J.; Miller, E.S.; Guillory, J.K. Diffuse reflectance infrared Fourier transform spectroscopy for the quantitative analysis of mixtures of polymorphs. Int. J. Pharm. 1992, 85, 163–174. [Google Scholar] [CrossRef] [Scilit]
- Pöllänen, K.; Häkkinen, A.; Huhtanen, M.; Reinikainen, S.-P.; Karjalainen, M.; Rantanen, J.; Louhi-Kultanen, M.; Nyström, L. DRIFT-IR for quantitative characterization of polymorphic composition of sulfathiazole. Anal. Chim. Acta. 2005, 544, 108–117. [Google Scholar] [CrossRef] [Scilit]
- Kipouros, K.; Kachrimanis, K.; Nikolakakis, I.; Tserki, V.; Malamataris, S. Simultaneous quantification of carbamazepine crystal forms in ternary mixtures (I, III and IV) by diffuse reflectance FTIR spectroscopy (DRIFTS) and multivariate calibration. J. Pharm. Sci. 2006, 95, 2419–2431. [Google Scholar] [CrossRef] [Scilit] [PubMed]
- Tantishaiyakul, V.; Permkam, P.; Suknuntha, K. Use of DRIFTS and PLS for the determination of polymorphs of piroxicam alone and in combination with pharmaceutical excipients: A technical note. AAPS PharmSciTech 2008, 9, 95–99. [Google Scholar] [CrossRef] [Scilit] [PubMed][Green Version]
- Bugay, D.E.; Newman, A.W.; Findlay, W.P. Quantitation of cefepime·2HCl dihydrate in cefepime·2HCl monohydrate by diffuse reflectance IR and powder X-ray diffraction techniques. J. Pharm. Biomed. Anal. 1996, 15, 49–61. [Google Scholar] [CrossRef] [Scilit] [PubMed]
- Neville, G.A.; Beckstead, H.D.; Shurvell, H.F. Utility of Fourier transform-Raman and Fourier transform-infrared diffuse reflectance spectroscopy for differentiation of polymorphic spironolactone samples. J. Pharm. Sci. 1992, 81, 1141–1146. [Google Scholar] [CrossRef] [Scilit] [PubMed]
- Roston, D.A.; Walters, M.C.; Rhinebarger, R.R.; Ferro, L.J. Characterization of polymorphs of a new anti-inflammatory drug. J. Pharm. Biomed. Anal. 1993, 11, 293–300. [Google Scholar] [CrossRef] [Scilit] [PubMed]
- Agatonovic-Kustrin, S.; Tucker, I.G.; Schmierer, D. Solid state assay of ranitidine HCl as a bulk drug and as active ingredient in tablets using DRIFT spectroscopy with artificial neural networks. Pharm. Res. 1999, 16, 1477–1482. [Google Scholar] [CrossRef] [Scilit] [PubMed]
- Agatonovic-Kustrin, S.; Rades, T.; Wu, V.; Saville, D.; Tucker, I.G. Determination of polymorphic forms of ranitidine-HCl by DRIFTS and XRPD. J. Pharm. Biomed. Anal. 2001, 25, 741–750. [Google Scholar] [CrossRef] [Scilit] [PubMed]
- Aboul-Enein, H.Y.; Bunaciu, A.A.; Fleschin, S. Analysis of mebendazole polymorphs by Fourier transform IR spectrometry using chemometric methods. Biopolymers 2002, 67, 56–60. [Google Scholar] [CrossRef] [PubMed]
- Kachrimanis, K.; Rontogianni, M.; Malamataris, S. Simultaneous quantitative analysis of mebendazole polymorphs A-C in powder mixtures by DRIFTS spectroscopy and ANN modeling. J. Pharm. Biomed. Anal. 2010, 51, 512–520. [Google Scholar] [CrossRef] [Scilit] [PubMed]
- Braga, J.W.B.; Poppi, R.J. Figures of merit for the determination of the polymorphic purity of carbamazepine by infrared spectroscopy and multivariate calibration. J. Pharm. Sci. 2004, 93, 2124–2134. [Google Scholar] [CrossRef] [Scilit] [PubMed]
- Heinz, A.; Strachan, C.J.; Gordon, K.C.; Rades, T. Analysis of solid-state transformations of pharmaceutical compounds using vibrational spectroscopy. J. Pharm. Pharmacol. 2009, 61, 971–988. [Google Scholar] [CrossRef] [PubMed]
- Chieng, N.; Zujovic, Z.; Bowmaker, G.; Rades, T.; Saville, D. Effect of milling conditions on the solid-state conversion of ranitidine hydrochloride form 1. Int. J. Pharm. 2006, 327, 36–44. [Google Scholar] [CrossRef] [Scilit] [PubMed]
- Ghugare, P.; Dongre, V.; Karmuse, P.; Rana, R.; Singh, D.; Kumar, A.; Filmwala, Z. Solid state investigation and characterization of the polymorphic and pseudopolymorphic forms of indapamide. J. Pharm. Biomed. Anal. 2010, 51, 532–540. [Google Scholar] [CrossRef] [Scilit] [PubMed]
- Pöllänen, K.; Häkkinen, A.; Reinikainen, S.-P.; Rantanen, J.; Karjalainen, M.; Louhi-Kultanen, M.; Nyström, L. IR spectroscopy together with multivariate data analysis as a process analytical tool for in-line monitoring of crystallization process and solid-state analysis of crystalline product. J. Pharm. Biomed. Anal. 2005, 38, 275–284. [Google Scholar] [CrossRef] [Scilit] [PubMed]
- Šašić, S.; Gilkison, A.; Henson, M. DRIFTS-based multivariate calibration and prediction of low-concentration polymorphic impurities in multiple lots of an active pharmaceutical ingredient, and outlier criteria. J. Pharm. Biomed. Anal. 2018, 148, 265–272. [Google Scholar] [CrossRef] [Scilit] [PubMed]
- Šašić, S.; Gilkison, A.; Henson, M. Multivariate modeling of diffuse reflectance infrared Fourier transform (DRIFT) spectra of mixtures with low-content polymorphic impurities with analysis of outliers. Int. J. Pharm. 2018, 536, 251–260. [Google Scholar] [CrossRef] [Scilit] [PubMed]
- Bunaciu, A.A.; Hoang, V.D.; Aboul-Enein, H.Y. Fourier transform infrared spectroscopy used in drug–excipient compatibility studies. Appl. Spectrosc. Rev. 2025, 60, 385–403. [Google Scholar] [CrossRef] [Scilit]
- Ledeti, I.; Bolintineanu, S.; Vlase, G.; Circioban, D.; Ledeti, A.; Vlase, T.; Suta, L.-M.; Caunii, A.; Murariu, M. Compatibility study between antiparkinsonian drug levodopa and excipients by FTIR spectroscopy, X-ray diffraction and thermal analysis. J. Therm. Anal. Calorim. 2017, 130, 433–441. [Google Scholar] [CrossRef] [Scilit]
- Fandaruff, C.; Caon, T.; Araya-Sibaja, A.M.; Rauber, G.S.; Silva, M.A.S.; Simões, C.M.O.; de Campos, C.E.M.; Bortoluzzi, A.J.; Resende, J.A.L.C.; Cuffini, S.L. A new saquinavir mesylate-sodium decyl sulfate salt discovered by serendipity during an anomalous dissolution test. Pharm. Res. 2022, 39, 189–200. [Google Scholar] [CrossRef] [Scilit] [PubMed]
- Bhongade, B.; Talath, S.; Dhaneshwar, S. A validated method for the quantitation of ciprofloxacin hydrochloride using diffuse reflectance infrared Fourier transform spectroscopy. Int. J. Spectrosc. 2014, 2014, 294612. [Google Scholar] [CrossRef] [Scilit]
- Bhongade, B.A.; Dhaneshwar, S.R. Diffuse reflectance infrared Fourier transform spectroscopy (DRIFTS) application in pharmaceutical analysis: Method for quantification of ranolazine in tablet dosage form. Vib. Spectrosc. 2017, 93, 52–56. [Google Scholar] [CrossRef] [Scilit]
- Dange, S.S.; Kalyankar, T.M.; Adhav, S.; Anita, K. A validated method for quantitation of pregabalin and methylcobalamin using diffuse reflectance infrared Fourier transform spectroscopy. Indian Drugs 2020, 57, 55–61. [Google Scholar] [CrossRef] [Scilit]
- Burela, V.S.G.P.; Nammi, U.R.; Mandalemula, P. New diffuse reflectance infrared Fourier transform spectroscopy for the estimation of tramadol hydrochloride capsules. Int. J. Pharm. Pharm. Sci. 2023, 15, 22–26. [Google Scholar] [CrossRef] [Scilit]
- Dubey, S.; Pandey, R.; Shukla, S.S. A validated method development for quantification of pravastatin sodium using diffuse reflectance Fourier transform spectroscopy. Indian J. Pharm. Educ. Res. 2017, 51, s115–s121. [Google Scholar] [CrossRef] [Scilit]
- Park, M.; Yoon, H.; Kim, K.; Cho, J. Quantitative analysis by diffuse reflectance infrared Fourier transform and linear stepwise multiple regression analysis I—Simultaneous quantitation of ethenzamide, isopropylantipyrine, caffeine and allylisopropylacetylurea in tablet. Arch. Pharm. Res. 1988, 11, 99–113. [Google Scholar] [CrossRef] [Scilit]
- Baucells, M.; Ferrer, N.; Gómez, P.; Lacort, G.; Roura, M. Quantitative analysis of caffeine applied to pharmaceutical industry. J. Mol. Struct. 1993, 294, 219–222. [Google Scholar] [CrossRef] [Scilit]
- Agatonovic-Kustrin, S.; Alany, R. Application of diffuse reflectance infrared Fourier transform spectroscopy combined with artificial neural networks in analysing enantiomeric purity of terbutaline sulphate bulk drug. Anal. Chim. Acta. 2001, 449, 157–165. [Google Scholar] [CrossRef] [Scilit]
- Yang, H.; Irudayaraj, J. Rapid determination of vitamin C by NIR, MIR and FT-Raman techniques. J. Pharm. Pharmacol. 2002, 54, 1247–1255. [Google Scholar] [CrossRef] [Scilit] [PubMed]
- Dijiba, Y.K.; Zhang, A.; Niemczyk, T.M. Determinations of ephedrine in mixtures of ephedrine and pseudoephedrine using diffuse reflectance infrared spectroscopy. Int. J. Pharm. 2004, 289, 39–49. [Google Scholar] [CrossRef] [Scilit] [PubMed]
- Bunaciu, A.A.; Aboul-Enein, H.Y.; Fleschin, S. Quantitative analysis of bucillamine and its pharmaceutical formulation using FT-IR spectroscopy. Farmaco 2005, 60, 685–688. [Google Scholar] [CrossRef] [Scilit] [PubMed]
- Parisotto, G.; Ferrão, M.F.; Furtado, J.C.; Molz, R.F. Determination of amoxicillin content in powdered pharmaceutical formulations using DRIFTS and PLS. Rev. Bras. Cienc. Farm. 2007, 43, 89–96. [Google Scholar] [CrossRef] [Scilit][Green Version]
- Szostak, R.; Mazurek, S. The influence of sample area on diclofenac sodium quantification by diffuse reflectance IR spectroscopy. Talanta 2011, 84, 583–586. [Google Scholar] [CrossRef] [Scilit] [PubMed]
- Müller, A.L.H.; Picoloto, R.S.; Ferrão, M.F.; da Silva, F.E.B.; Müller, E.I.; Flores, E.M.M. Simultaneous diffuse reflectance infrared determination of clavulanic acid and amoxicillin using multivariate calibration techniques. Drug Test. Anal. 2012, 4, 500–506. [Google Scholar] [CrossRef] [Scilit] [PubMed]
- Mazurek, S.; Szostak, R. Quantitative analysis of thiamine hydrochloride in tablets—Comparison of infrared attenuated total reflection, diffuse reflectance infrared and Raman spectroscopy. Vib. Spectrosc. 2012, 62, 10–16. [Google Scholar] [CrossRef] [Scilit]
- Piantavini, M.S.; Pontes, F.L.D.; Uber, C.P.; Stremel, D.P.; Sena, M.M.; Pontarolo, R. Chemometric quality inspection control of pyrantel pamoate, febantel and praziquantel in veterinary tablets by mid infrared spectroscopy. Spectrochim. Acta A Mol. Biomol. Spectrosc. 2014, 125, 396–403. [Google Scholar] [CrossRef] [Scilit] [PubMed]
- Piantavini, M.S.; Pontes, F.L.D.; Weiss, L.X.; Sena, M.M.; Pontarolo, R. Comparison between ultraviolet and infrared spectroscopies for the simultaneous multivariate determination of pyrantel and praziquantel. J. Braz. Chem. Soc. 2015, 26, 1387–1395. [Google Scholar] [CrossRef] [Scilit]
- da Silva, F.E.B.; Flores, E.M.M.; Parisotto, G.; Müller, E.I.; Ferrão, M.F. Green method by diffuse reflectance infrared spectroscopy and spectral region selection for the quantification of sulphamethoxazole and trimethoprim in pharmaceutical formulations. Acad. Bras. Cienc. 2016, 88, 1–15. [Google Scholar] [CrossRef] [Scilit] [PubMed]
- Marson, B.M.; de Oliveira Vilhena, R.; de Souza Madeira, C.R.; Pontes, F.L.D.; Piantavini, M.S.; Pontarolo, R. Simultaneous quantification of artesunate and mefloquine in fixed-dose combination tablets by multivariate calibration with middle infrared spectroscopy and partial least squares regression. Malar. J. 2016, 15, 109. [Google Scholar] [CrossRef] [Scilit] [PubMed]
- Galán-Freyle, N.J.; Pacheco-Londoño, L.C.; Román-Ospino, A.D.; Hernandez-Rivera, S.P. Applications of quantum cascade laser spectroscopy in the analysis of pharmaceutical formulations. Appl. Spectrosc. 2016, 70, 1511–1519. [Google Scholar] [CrossRef] [Scilit] [PubMed]
- Panda, S.S.; Bera, R.K.V.V. Diffuse reflectance Fourier transform infrared spectroscopic quantification of two novel drugs in pharmaceuticals: A new case study for chemometrics assisted analytical procedure development approach. Indian Drugs 2022, 59, 57–65. [Google Scholar] [CrossRef] [Scilit]
- Novack, A.C.; Cobre, A.F.; Madeira, C.R.S.; Guimarães, T.M.; Fachi, M.M.; Piantavini, M.S.; Pontarolo, R. A mid-infrared spectrophotometric method for simultaneous quantification of naltrexone and bupropion with multivariate calibration. J. Braz. Chem. Soc. 2023, 34, 537–548. [Google Scholar] [CrossRef] [Scilit]
- Attia, K.A.M.; El-Olemy, A.; Serag, A.; Abbas, A.E.F.; Eid, S.M. Environmentally sustainable DRS-FTIR probe assisted by chemometric tools for quality control analysis of cinnarizine and piracetam having diverged concentration ranges: Validation, greenness, and whiteness studies. Spectrochim. Acta A Mol. Biomol. Spectrosc. 2023, 302, 123161. [Google Scholar] [CrossRef] [Scilit] [PubMed]
- Mishra, P.; Nordon, A.; Roger, J.-M. Improved prediction of tablet properties with near-infrared spectroscopy by a fusion of scatter correction techniques. J. Pharm. Biomed. Anal. 2021, 192, 113684. [Google Scholar] [CrossRef] [Scilit] [PubMed]
- Mazurek, S.; Szostak, R. Comparison of infrared attenuated total reflection and Raman spectroscopy in the quantitative analysis of diclofenac sodium in tablets. Vib. Spectrosc. 2011, 57, 157–162. [Google Scholar] [CrossRef] [Scilit]
- Gottfries, J.; Depui, H.; Fransson, M.; Jongeneelen, M.; Josefson, M.; Langkilde, F.; Witte, D. Vibrational spectrometry for the assessment of active substance in metoprolol tablets: A comparison between transmission and diffuse reflectance near infrared spectrometry. J. Pharm. Biomed. Anal. 1996, 14, 1495–1503. [Google Scholar] [CrossRef] [Scilit] [PubMed]
- Berntsson, O.; Danielsson, L.G.; Johansson, M.O.; Folestad, S. Quantitative determination of content in binary powder mixtures using diffuse reflectance near infrared spectrometry and multivariate analysis. Anal. Chim. Acta. 2000, 419, 45–54. [Google Scholar] [CrossRef] [Scilit]
- Saeed, M.; Probst, L.; Betz, G. Assessment of diffuse transmission and reflection modes in near-infrared quantification, part 2: Diffuse reflection information depth. J. Pharm. Sci. 2011, 100, 1130–1141. [Google Scholar] [CrossRef] [Scilit] [PubMed]
- Kolomiets, O.; Hoffmann, U.; Geladi, P.; Siesler, H.W. Quantitative determination of pharmaceutical drug formulations by near-infrared spectroscopic imaging. Appl. Spectrosc. 2008, 62, 1200–1208. [Google Scholar] [CrossRef] [Scilit] [PubMed]
- Lawson, G.; Ogwu, J.; Tanna, S. Quantitative screening of the pharmaceutical ingredient for the rapid identification of substandard and falsified medicines using reflectance infrared spectroscopy. PLoS ONE 2018, 13, e0202059. [Google Scholar] [CrossRef] [Scilit] [PubMed]
- Wang, W.; Keller, M.D.; Baughman, T.; Wilson, B.K. Evaluating low-cost optical spectrometers for the detection of simulated substandard and falsified medicines. Appl. Spectrosc. 2020, 74, 323–333. [Google Scholar] [CrossRef] [Scilit] [PubMed]
- Awotunde, O.; Roseboom, N.; Cai, J.; Hayes, K.; Rajane, R.; Chen, R.; Yusuf, A.; Lieberman, M. Discrimination of substandard and falsified formulations from genuine pharmaceuticals using NIR spectra and machine learning. Anal. Chem. 2022, 94, 12586–12594. [Google Scholar] [CrossRef] [Scilit] [PubMed]
- Awotunde, O.; Cai, J.; El Azar, C.G.; Medina, D.; Eyolfson, S.I.; Hayes, K.; Waffo, C.; Marini Djang’eing’a, R.; Ziemons, E.M.; Sacré, P.-Y.; et al. Field assessment of active ingredient quantity in pharmaceutical tablets with limited calibration of near infrared spectra: An application to ciprofloxacin tablets. J. Pharm. Biomed. Anal. 2024, 246, 116189. [Google Scholar] [CrossRef] [Scilit] [PubMed]
- Winkler Martinez, E.; Tfayli, A.; Chaminade, P.; Tfaili, S. Vibrational spectroscopies for the identification of substandard and falsified drugs: Handheld and portable devices, multispectral and hyperspectral imagers. Spectrochim. Acta A Mol. Biomol. Spectrosc. 2026, 357, 127836. [Google Scholar] [CrossRef] [Scilit] [PubMed]
- Sousa, C.P.; Coutinho-Neto, M.D.; Liberato, M.S.; Lima, F.C.D.A.; Camargo, A.P. Ciprofloxacin (Zwitterion, Chloride, and Sodium Forms): Experimental and DFT Characterization by Vibrational and Solid-State NMR Spectroscopies. ACS Omega 2025, 10, 48773–48786. [Google Scholar] [CrossRef] [Scilit] [PubMed]
- Hasan, E.; Ali, S.; Zia, A.; Begum, S.; Khan, S.T.; Bukhari, S. A Facile Synthesis of Iron Oxide Nanoparticles as a Nano-Sensor to Detect Levofloxacin and Ciprofloxacin in Human Blood and Evaluation of Their Biological Activities. RSC Adv. 2024, 14, 36041–36052. [Google Scholar] [CrossRef] [Scilit] [PubMed]
- Rusu, A.; Imre, S.; Mare, A.D.; Lungu, I.-A.; Pascu, G.-A.; Uivarosi, V. Synthesis, Characterization and Antibacterial Activity of a New Derivative of Levofloxacin. J. Chil. Chem. Soc. 2020, 65, 4857–4860. [Google Scholar] [CrossRef] [Scilit]
- Płotka-Wasylka, J.; Wojnowski, W. Complementary green analytical procedure index (ComplexGAPI) and software. Green Chem. 2021, 23, 8657–8665. [Google Scholar] [CrossRef] [Scilit]
- Wojnowski, W.; Tobiszewski, M.; Pena-Pereira, F.; Psillakis, E. AGREEprep—Analytical greenness metric for sample preparation. TrAC Trends Anal. Chem. 2022, 149, 116553. [Google Scholar] [CrossRef] [Scilit]
- Sajid, M.; Płotka-Wasylka, J. Green analytical chemistry metrics: A review. Talanta 2022, 238, 123046. [Google Scholar] [CrossRef] [Scilit] [PubMed]
- Yin, L.; Yu, L.; Guo, Y.; Wang, C.; Ge, Y.; Zheng, X.; Zhang, N.; You, J.; Zhang, Y.; Shi, M. Green analytical chemistry metrics for evaluating the greenness of analytical procedures. J. Pharm. Anal. 2024, 14, 101013. [Google Scholar] [CrossRef] [Scilit] [PubMed]
- Nowak, P.M.; Wietecha-Posłuszny, R.; Pawliszyn, J. White Analytical Chemistry: An approach to reconcile the principles of Green Analytical Chemistry and functionality. TrAC Trends Anal. Chem. 2021, 138, 116223. [Google Scholar] [CrossRef] [Scilit]
- Manousi, N.; Wojnowski, W.; Płotka-Wasylka, J.; Samanidou, V. Blue applicability grade index (BAGI) and software: A new tool for the evaluation of method practicality. Green Chem. 2023, 25, 7598–7604. [Google Scholar] [CrossRef] [Scilit]
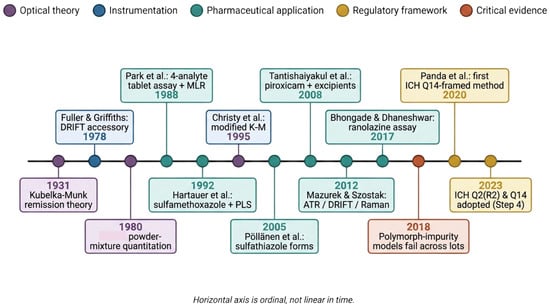
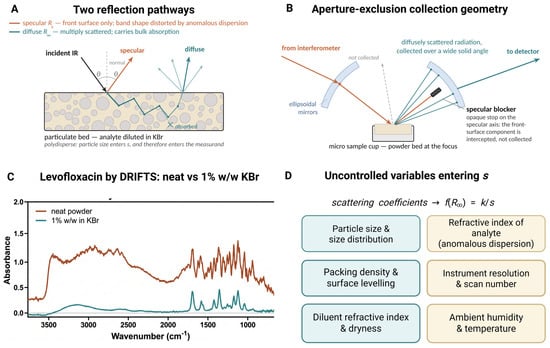
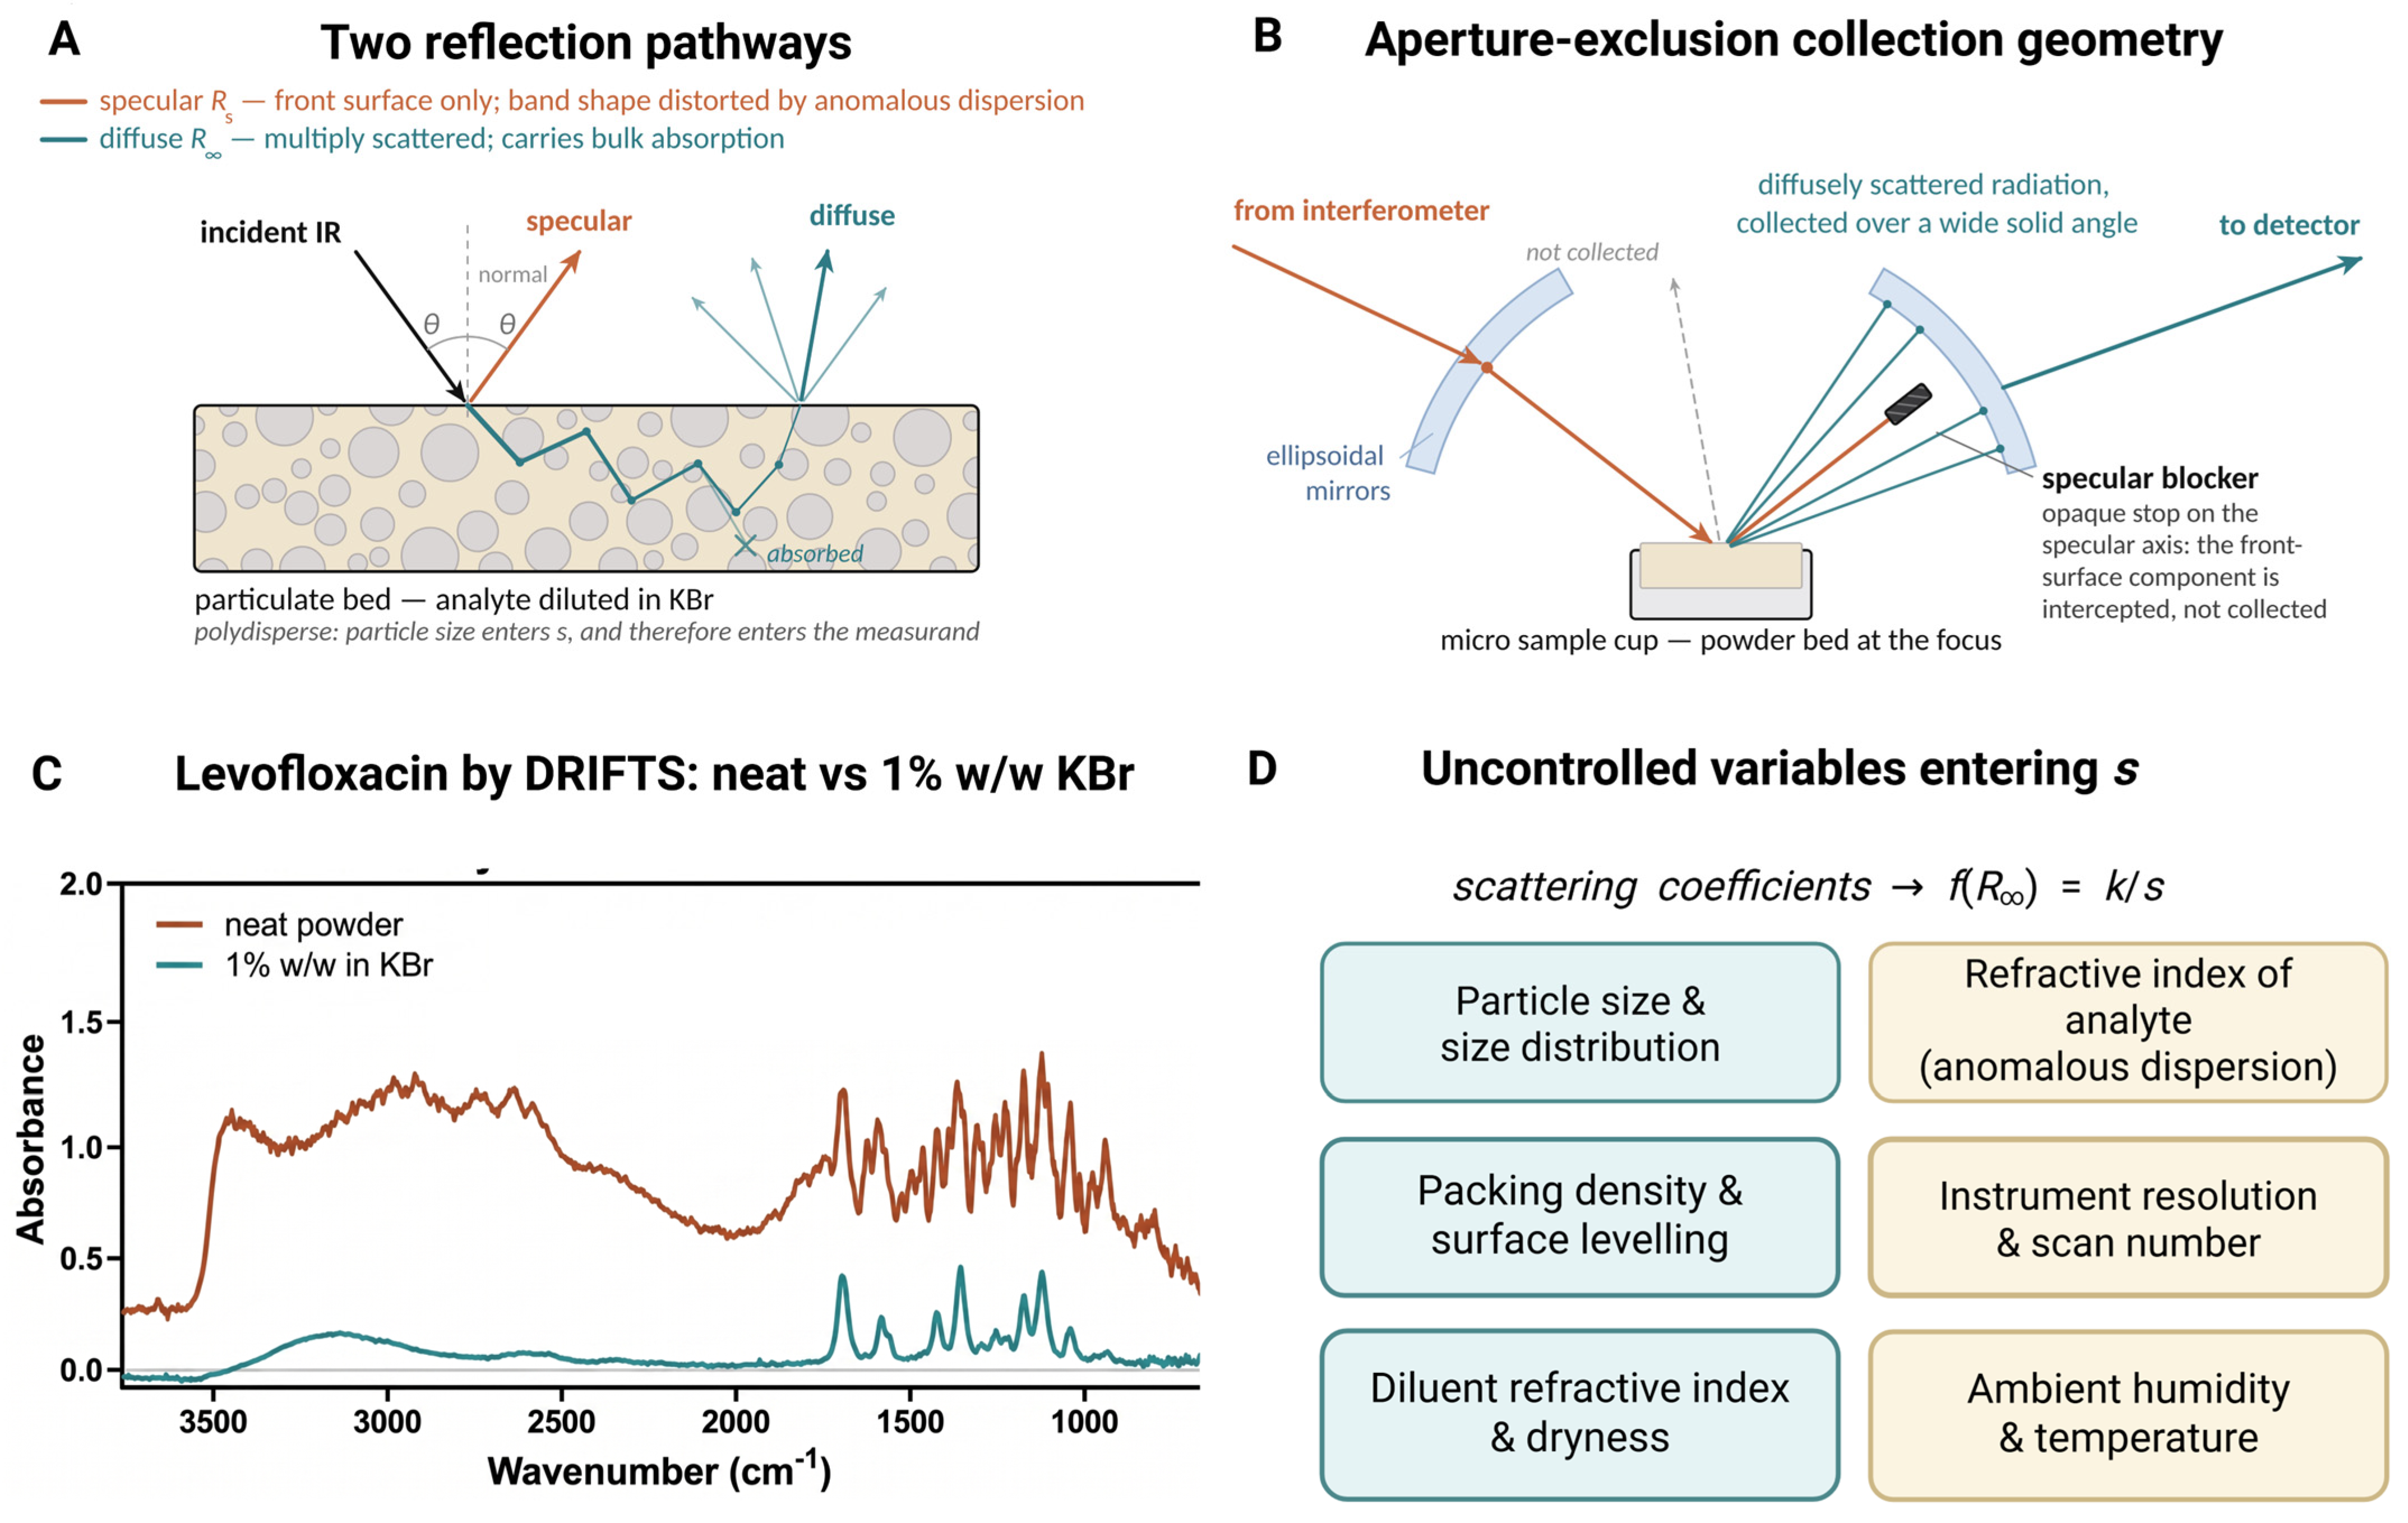
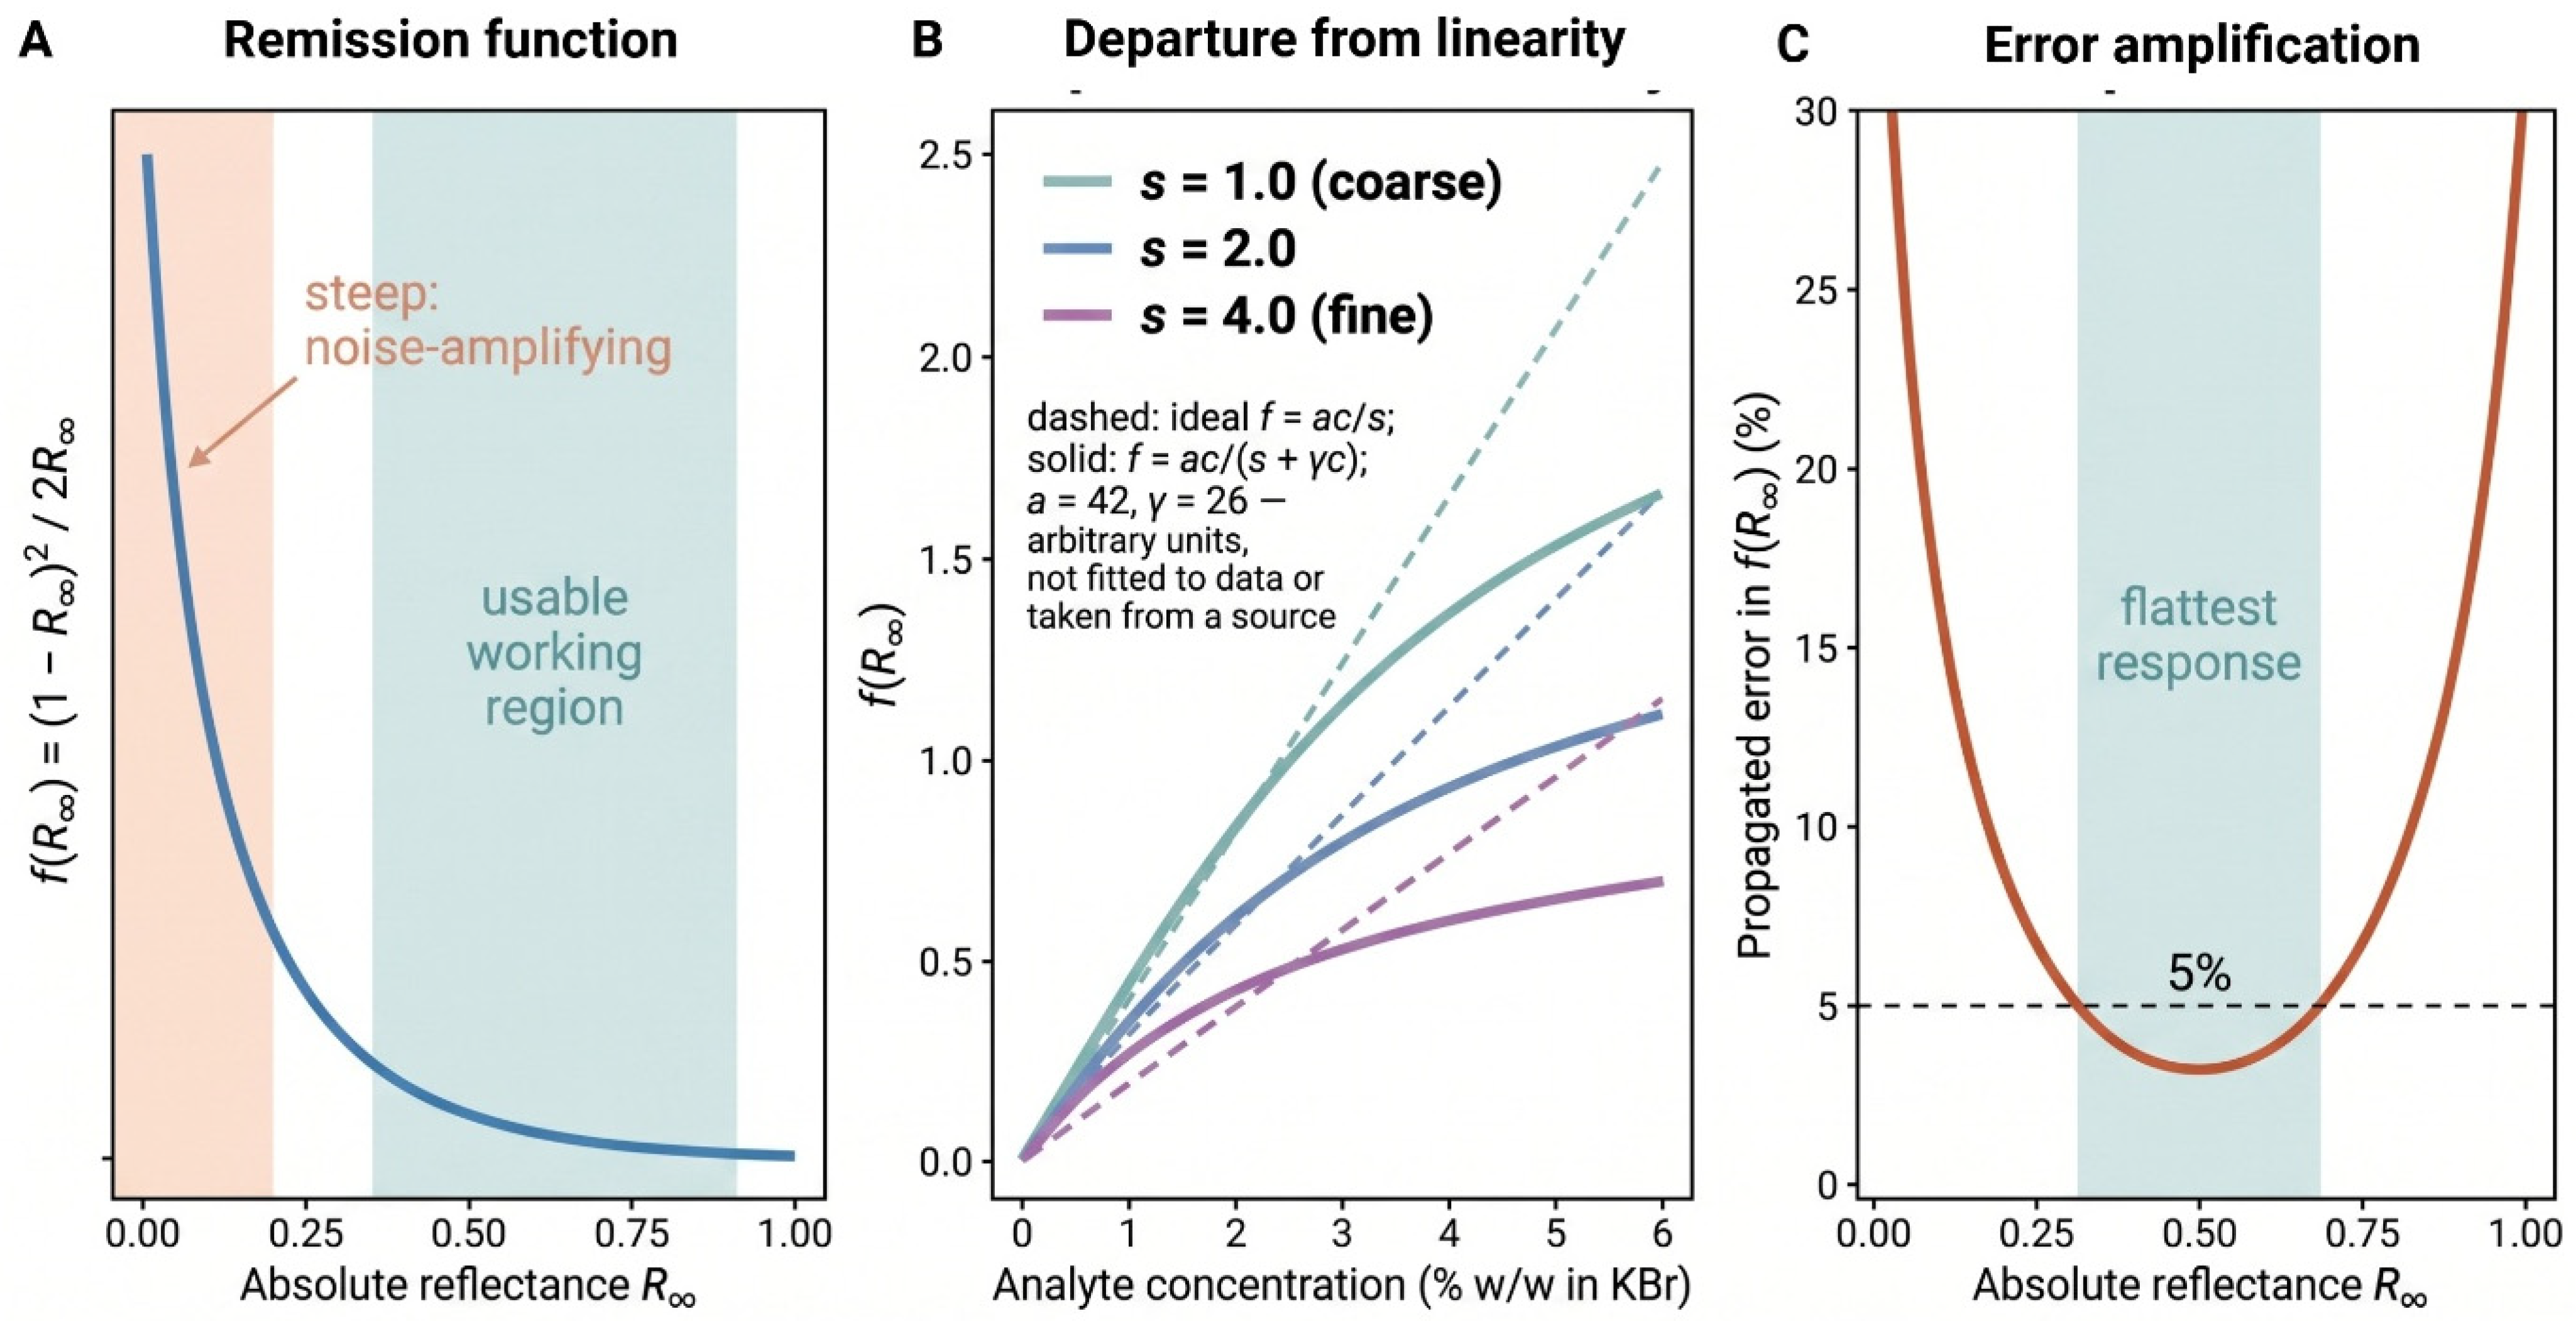
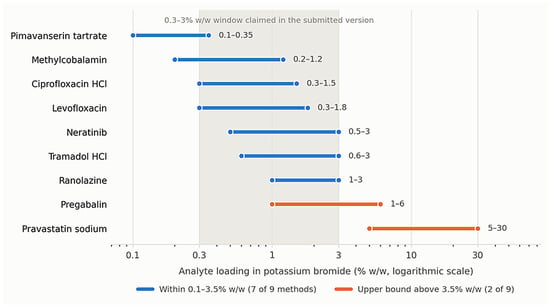
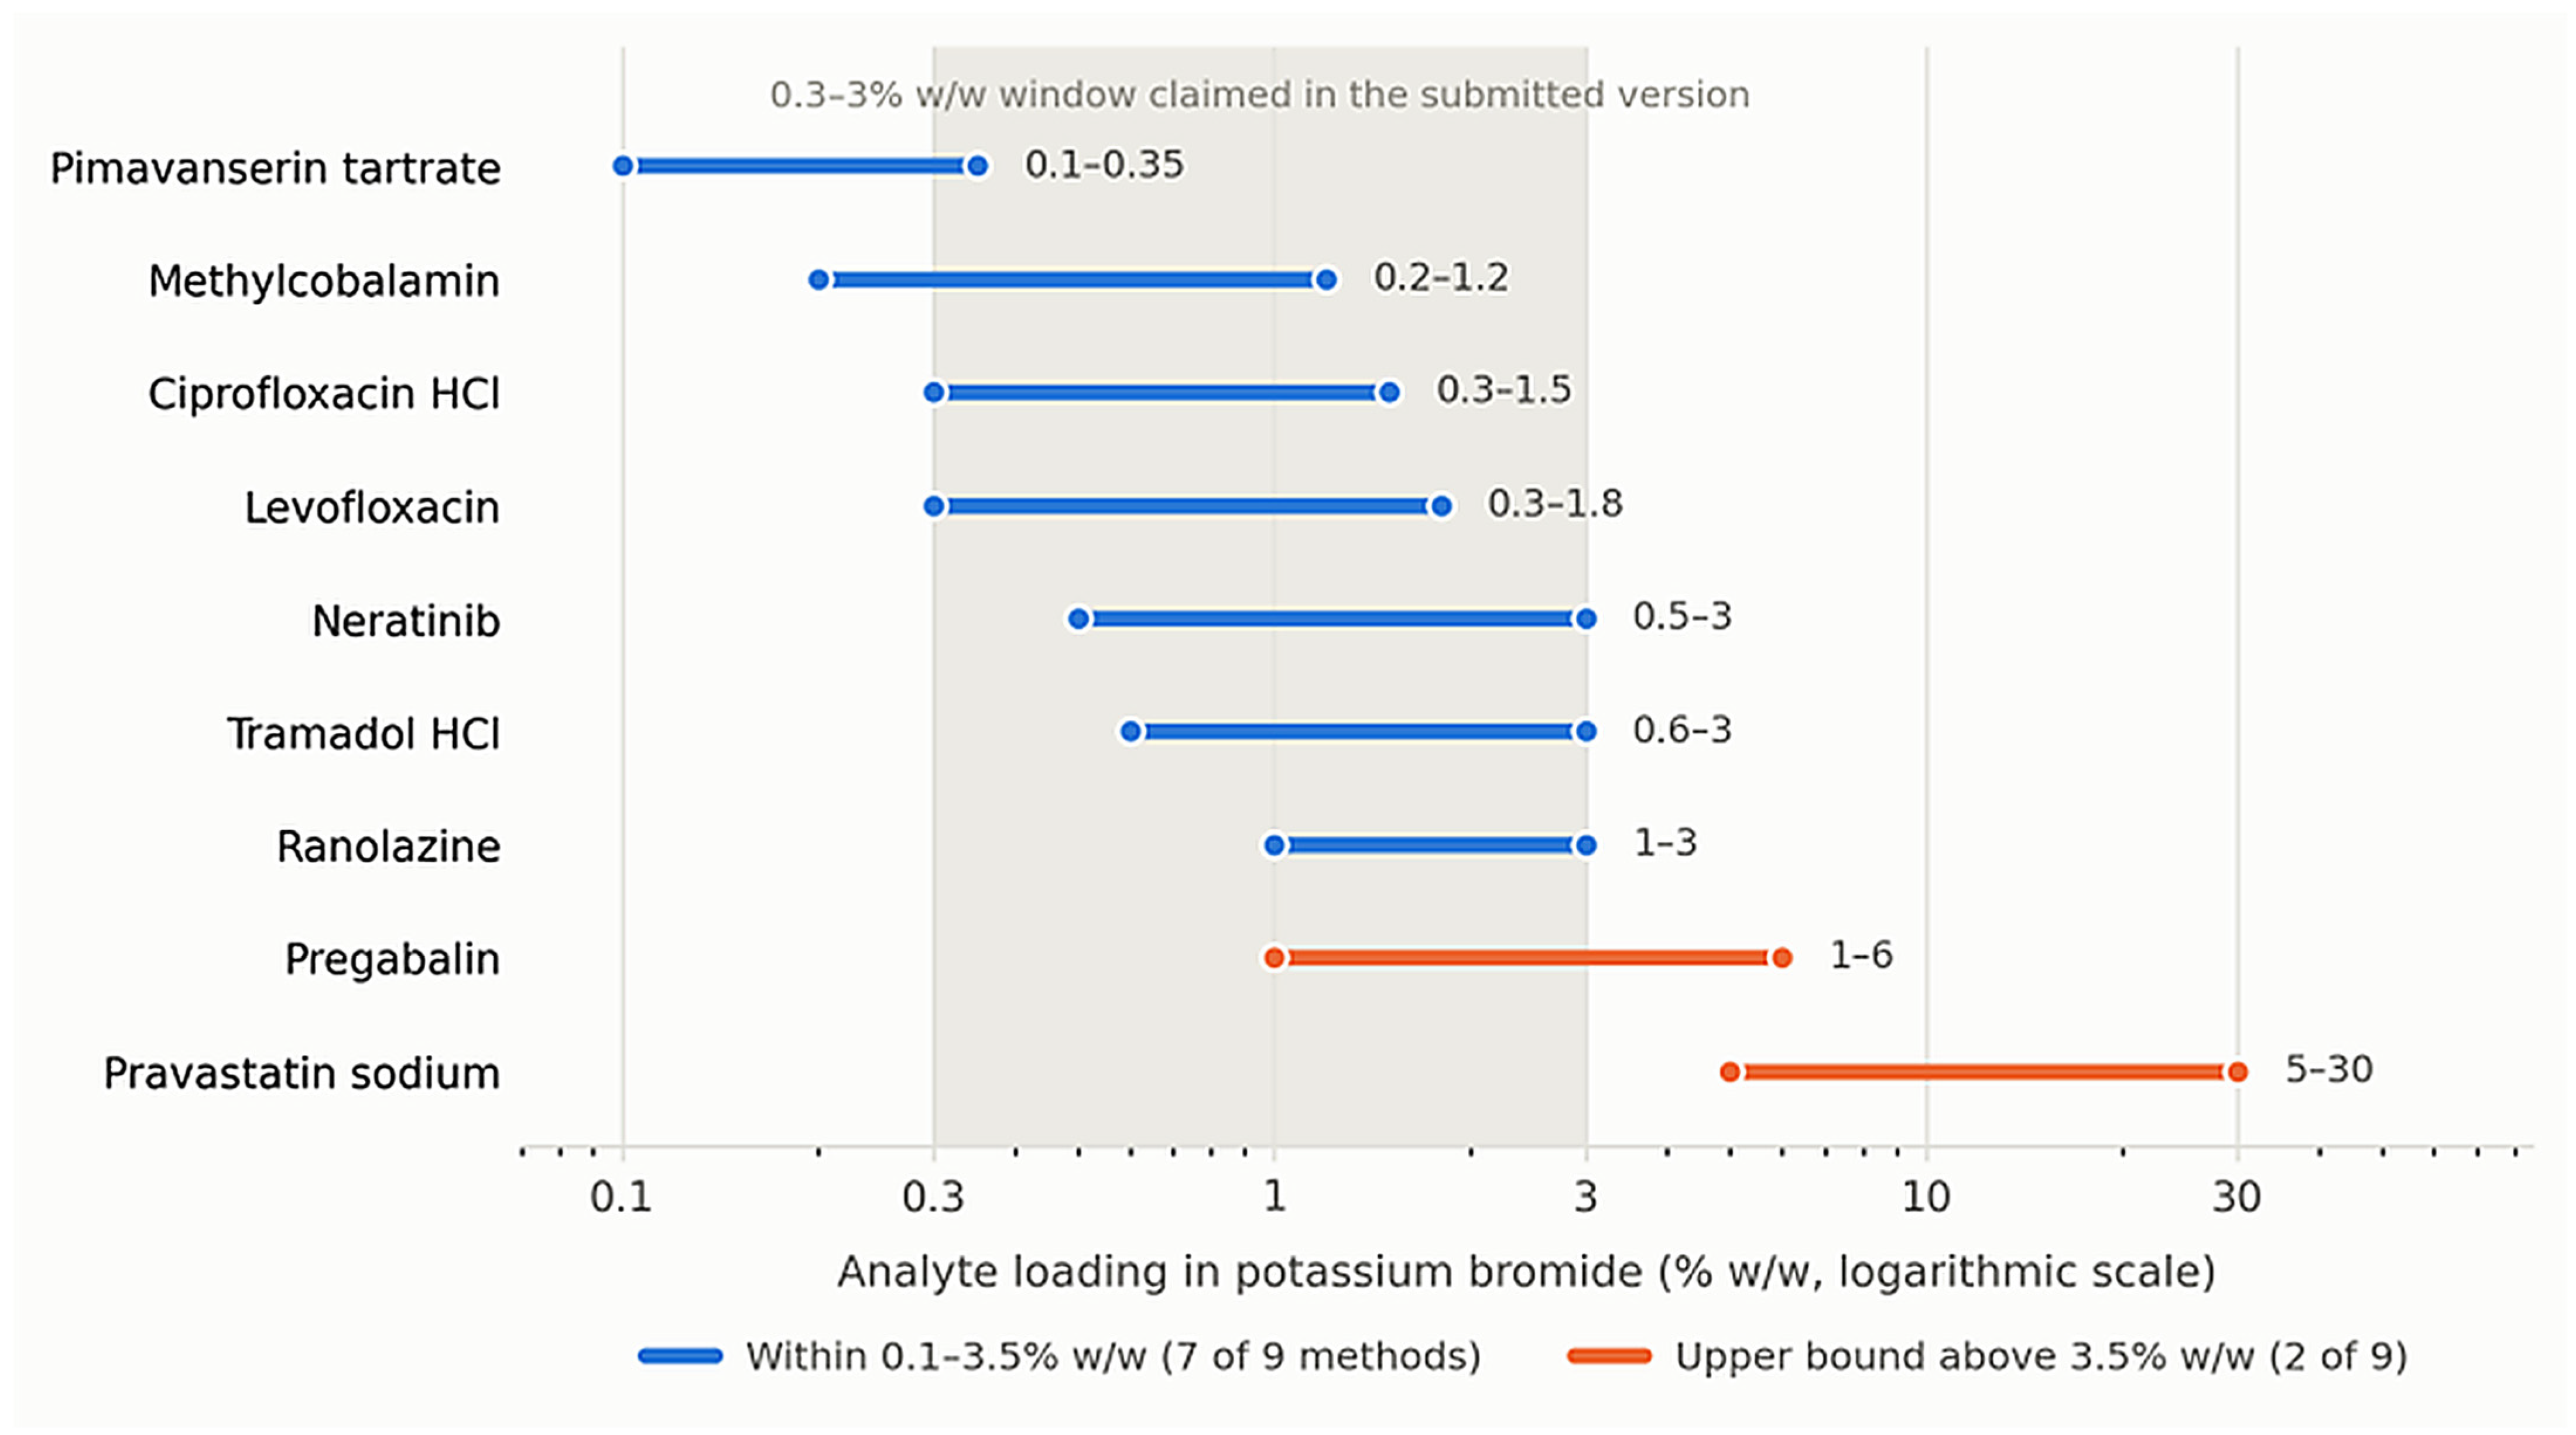
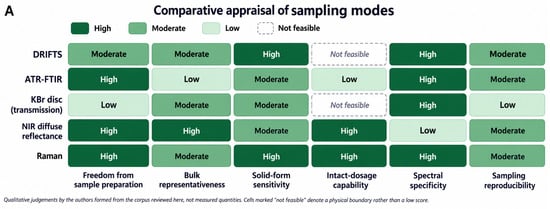
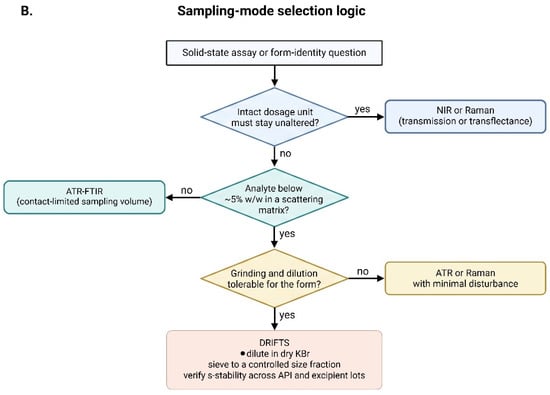
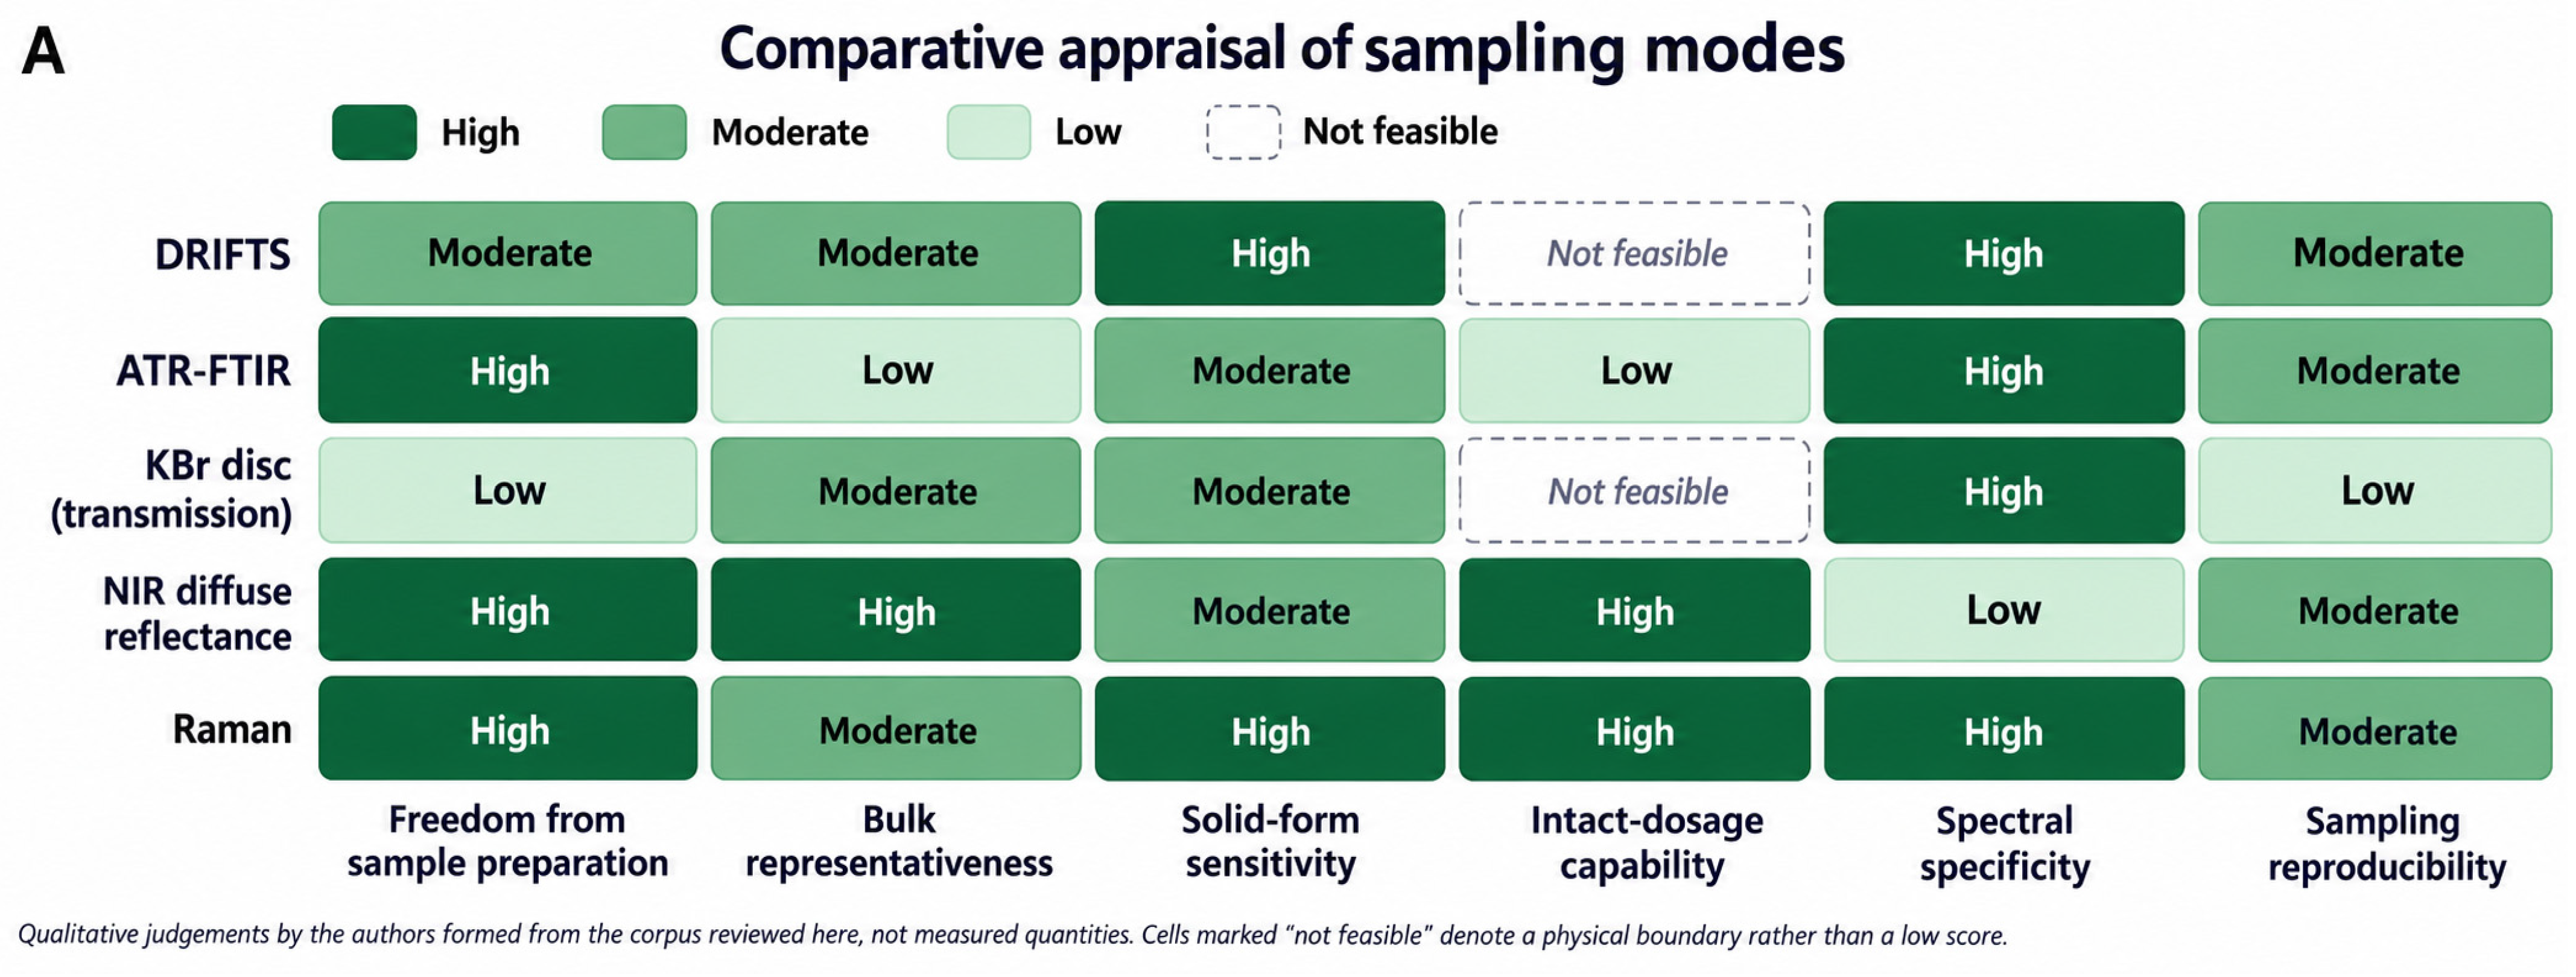
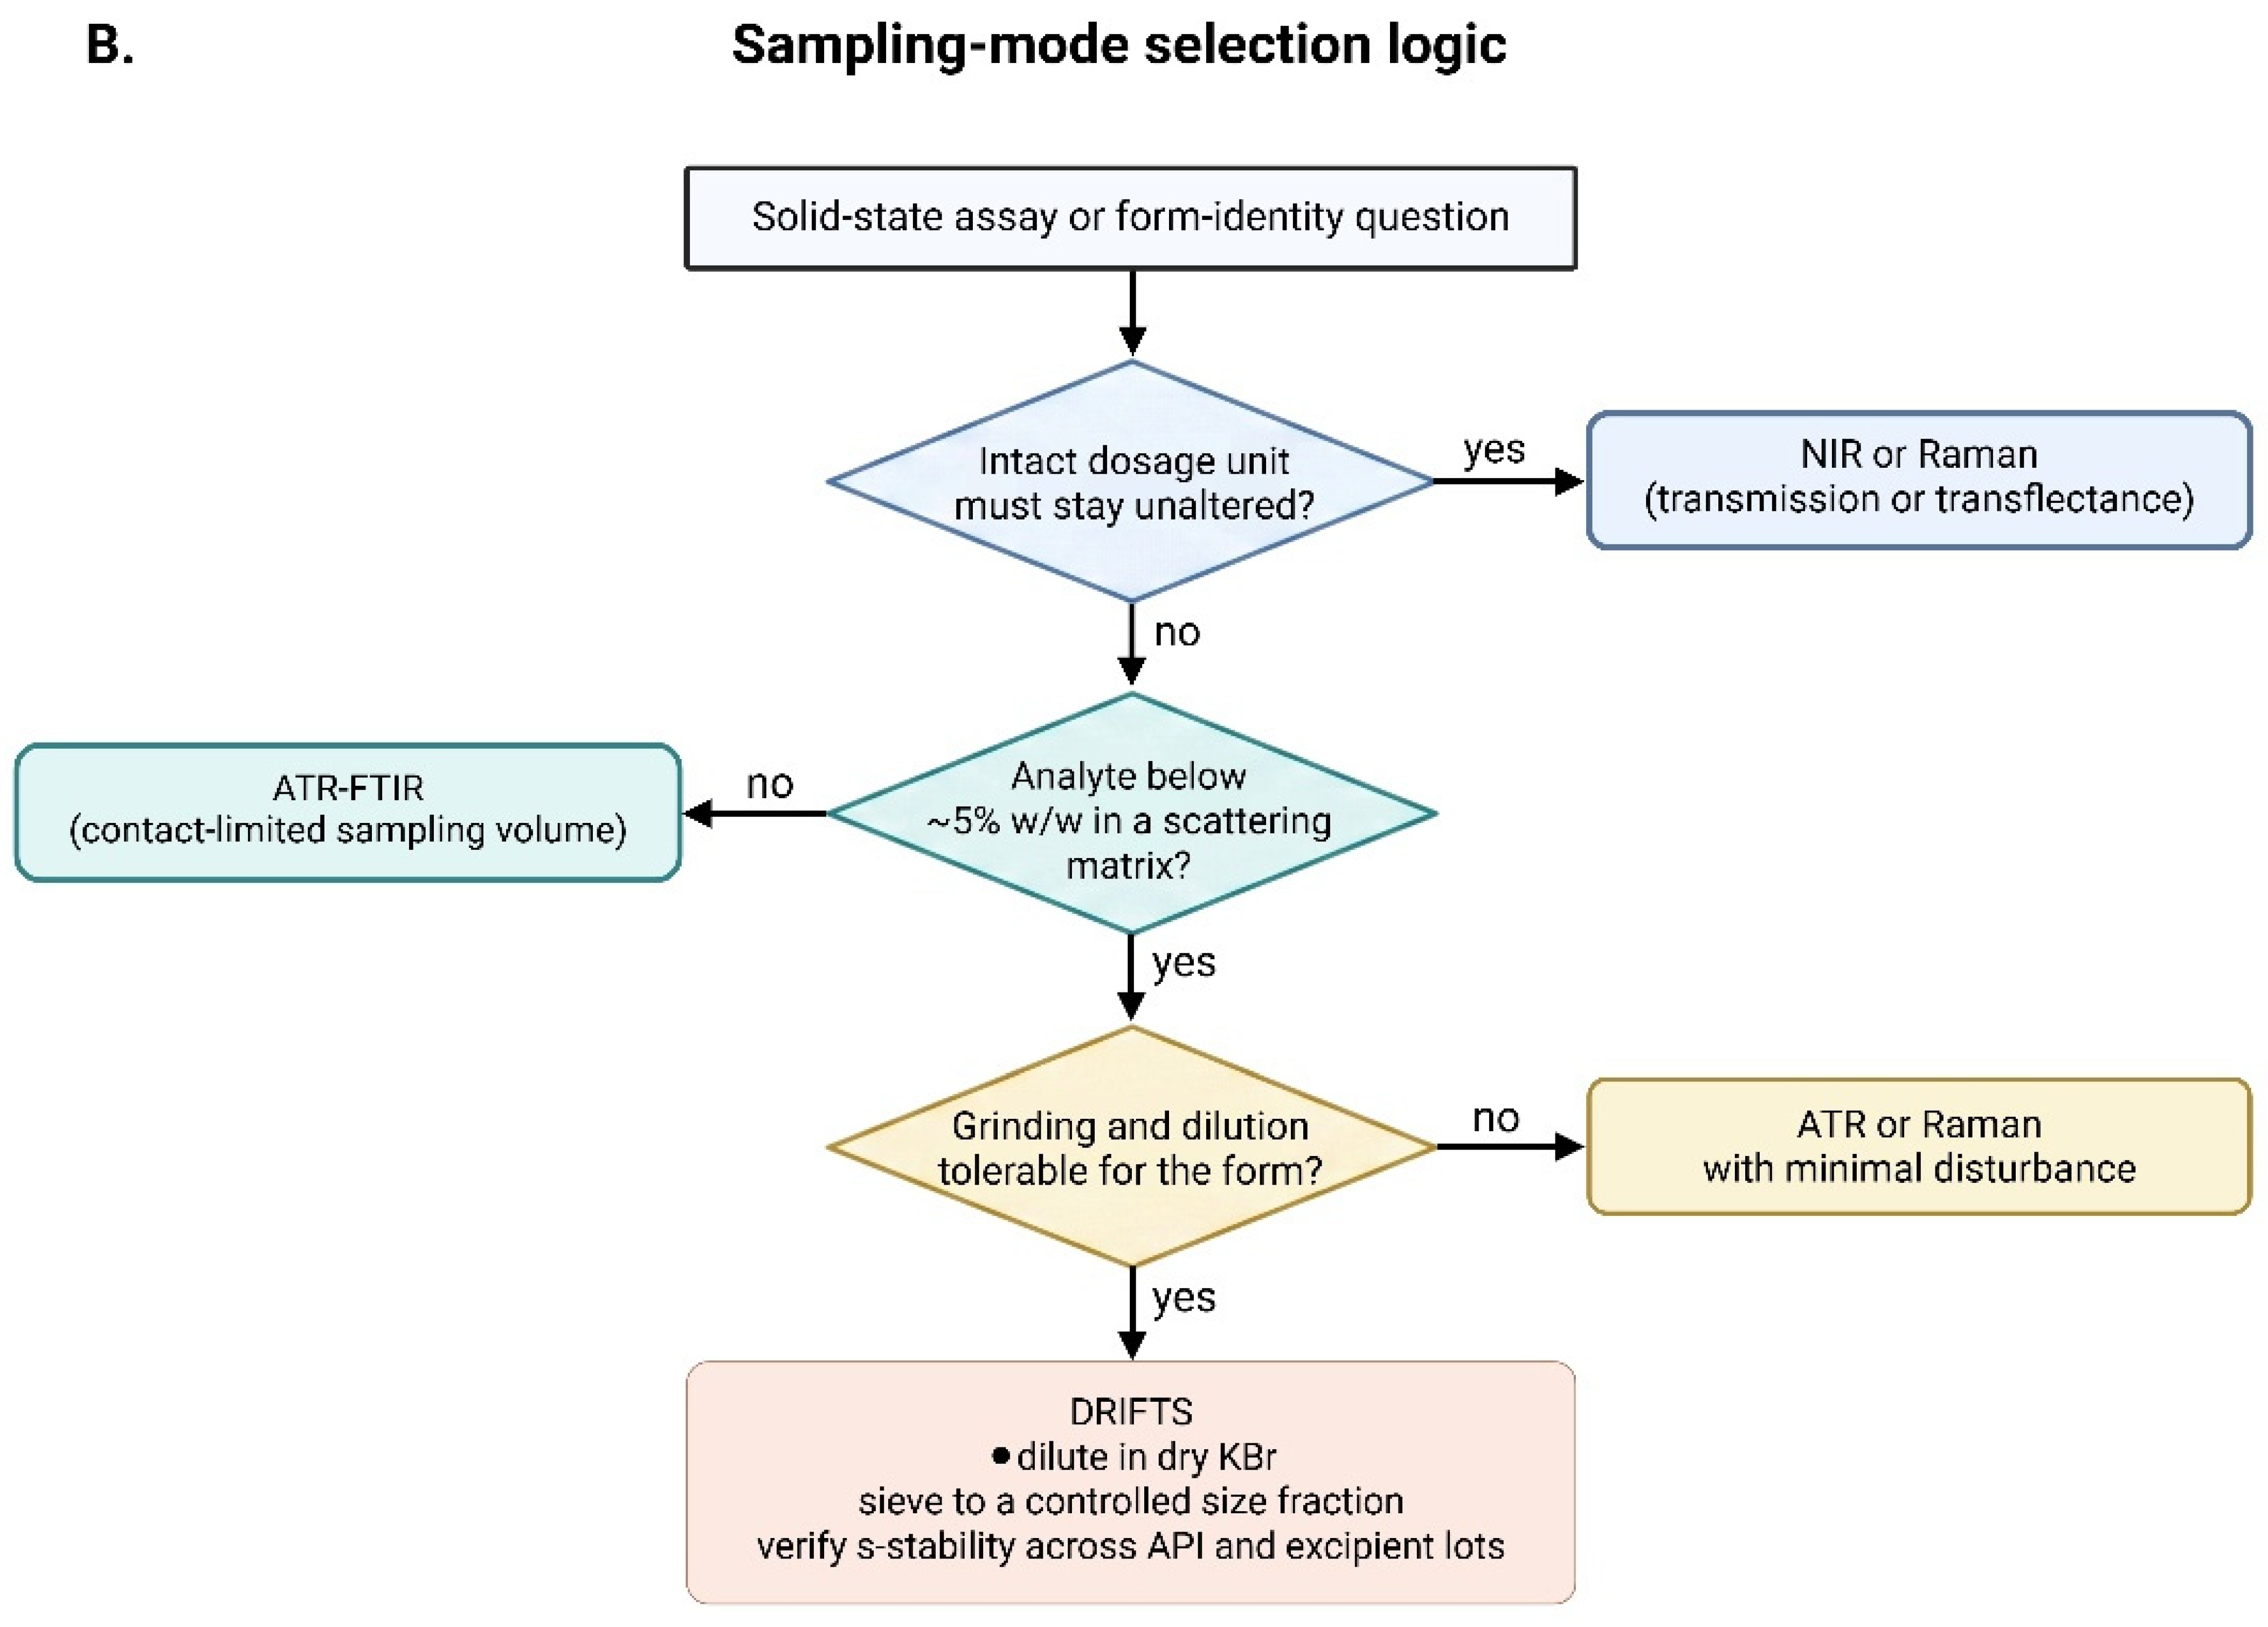

Disclaimer/Publisher’s Note: The statements, opinions and data contained in all publications are solely those of the individual author(s) and contributor(s) and not of MDPI and/or the editor(s). MDPI and/or the editor(s) disclaim responsibility for any injury to people or property resulting from any ideas, methods, instructions or products referred to in the content. |
© 2026 by the authors. Licensee MDPI, Basel, Switzerland. This article is an open access article distributed under the terms and conditions of the Creative Commons Attribution (CC BY) license.