


Abstract
DNA methylation is a central epigenetic regulator of genome stability, developmental plasticity, and stress adaptation in plant tissue culture systems. During dedifferentiation, callus formation, organogenesis, somatic embryogenesis, transformation, and prolonged subculture, DNA methylation patterns can be extensively remodeled, thereby contributing to regeneration competence and somaclonal variation. To detect such changes, traditional methylation-detection methods, including bisulfite-based sequencing and methylation-sensitive polymerase chain reaction, provide high analytical output but remain labor-intensive (2–3 days), destructive (requiring microgram amounts of DNA), and difficult to deploy as rapid screening tools across large tissue-culture plantlets. Surface-enhanced Raman scattering (SERS) offers a complementary route by coupling molecular fingerprinting with plasmonic signal amplification. Controlled systems have demonstrated highly sensitive detection of methylation-associated molecular signatures, with reported detection limits reaching the nanomolar-to-submicromolar range depending on analyte type, substrate architecture, and measurement conditions. However, these quantitative values primarily come from synthetic DNA or model systems and should be interpreted cautiously when applied to complex plant tissue culture samples. This review critically examines current SERS-based strategies for DNA methylation analysis, emphasizing substrate selection, signal-enhancement mechanisms, SERS enhancement mechanisms, surface functionalization, and computational spectral analysis. SERS has emerged as a promising complementary technology for DNA methylation analysis due to its molecular fingerprinting capability and high sensitivity. However, direct demonstrations of SERS-based DNA methylation detection in plant tissue culture systems remain limited. Current evidence largely originates from synthetic DNA models, purified nucleic acid systems, and non-plant biological applications, providing methodological foundations rather than complete plant validation. Future studies are required to establish plant-specific substrates, calibration strategies, and biological validation workflows.
1. Introduction
The introduction of plant tissue culture techniques marks a major advance in plant biology, with potential applications in meeting the global demand for increased food production. These methods are integral to crop improvement strategies and play a crucial role in large-scale micropropagation, genetic engineering, germplasm conservation, and the production of natural phytochemicals [1,2,3]. Among these techniques, micropropagation stands out as especially valuable for crop development because it allows the generation of large numbers of pathogen-free, genetically consistent, and physiologically stable plants [4,5]. Although tissue culture-derived plants are expected to be uniform, achieving this consistency is not always straightforward.
The in vitro environment can subject plant cells to additional stresses, resulting in genetic and epigenetic alterations in regenerated plants. This phenomenon is referred to as tissue culture-induced variation (TCIV), commonly known as somaclonal variation, a concept first described by Larkin and Scowcroft [6]. Somaclonal variation is widely reported in plant tissue-culture systems, although its frequency and extent vary substantially with genotype and culture conditions [6,7]. As a result of TCIV, micropropagation can produce clones that do not accurately reflect the original plants’ genetic makeup, creating challenges for researchers and propagators who require clonal uniformity. Nonetheless, the inherent instability of in vitro systems also offers a unique opportunity to isolate desirable variants through selective breeding [8,9]. TCIV may be mitotically or meiotically stable [10,11], and may occasionally lead to plant variants useful in crop improvement programs [12]. Some tissue-culture-induced changes persist through mitotic propagation, whereas a smaller subset may be transmitted through meiosis to subsequent generations. Researchers have successfully applied this stability in ornamental plants and tree species, where the primary regenerants are often the final product [13,14]. Over a plant’s life cycle, environmental factors and genetic changes can drive DNA methylation, which may trigger epigenetic variations that persist across generations [15,16]. In some cases, these epigenetic changes result in inherited modifications to gene expression without altering the underlying genetic sequence [17,18].
DNA methylation refers to the modification of cytosine bases in DNA [19]. This epigenetic change is involved in various biological processes, such as gene expression regulation, chromatin silencing, genomic imprinting, and cell differentiation in plants [20]. Studies have shown that cytosine methylation patterns change significantly in plant genomes grown under in vitro conditions, often leading to observable phenotypic variations [21,22,23]. DNA methylation changes often accompany broader genomic and epigenomic instability during tissue culture and may contribute to altered transposable-element activity and gene regulation [13,20]. DNA methylation is one of the most commonly observed covalent base modifications across a wide range of taxonomic groups [24]. Specific DNA methyltransferases add methyl groups to cytosine during post-replicative DNA modifications, with 5-methylcytosine (5-mC) being the predominant form in both higher plants and mammals [24].
Several methods can detect genome-wide methylation changes in plant tissue culture. Many of these techniques depend on comprehensive knowledge of the organism’s genome sequence [25], as with bisulfite modification [26] and chromatin immunoprecipitation (ChIP) [27,28]. Methylation-sensitive amplification polymorphism (MSAP), a variation in the amplified fragment length polymorphism (AFLP) method [29], does not require prior genome sequencing. Advanced separation methods like high-performance capillary electrophoresis (HPCE) [30] and high-performance liquid chromatography (HPLC) [31] are also used to analyze cytosine methylation. Although established methods offer different levels of quantitative and sequence-specific information, their suitability for high-throughput screening may be constrained by platform-dependent requirements for DNA input, chemical or enzymatic processing, amplification, sequencing, analysis time, and cost [32].
In this regard, Surface-Enhanced Raman Spectroscopy (SERS) has emerged as a promising analytical technique, largely because DNA bases have a strong affinity for noble-metal nanostructure surfaces, producing well-defined spectral patterns [33,34]. SERS offers a unique analytical approach by leveraging plasmonic enhancement to detect vibrational changes, whether intrinsic or probe-induced, associated with methylated DNA [35,36,37,38,39]. By combining molecular specificity, high sensitivity, rapid data acquisition, and compatibility with both label-free and label-assisted techniques, SERS can achieve detection limits as low as 10−7 mol L−1, with relatively simple sample preparation. These capabilities have stimulated interest in SERS as a rapid complementary platform for methylation screening alongside established molecular and sequencing-based approaches [40,41,42,43,44]. Despite its potential, the application of surface-enhanced Raman spectroscopy (SERS) to detect DNA methylation in plants, particularly in tissue culture systems, remains underexplored. While SERS enables highly sensitive, label-free biomolecular detection, recent advances have emphasized nucleic acid sensing and DNA methylation analysis rather than plant epigenetics [38,45]. Plant applications remain scarce, highlighting a promising research opportunity for tissue-culture epigenetics and monitoring.
From 2015 to 2025, interest in, and the number of studies on, detection techniques like SERS in food and agricultural sciences rose notably. These studies include the application of nanotechnology to reduce bacterial contamination in plant tissue culture [46], innovations in SERS for precision agriculture, including plant health monitoring and crop quality assessments [47,48], DNA nanotechnology in SERS with a focus on precision engineering, dynamic biosensing, and future perspectives [49], advancements in functional nucleic acid-based SERS sensing strategies [50], the use of nanomaterials for developing next-generation DNA methylation biosensors [51], and applications in evaluating seed viability, seed health, predicting pest incidences in seeds, and monitoring seed viability during storage.
This review explores the fundamental principles, recent technological advances, and novel methodologies in Surface-Enhanced Raman Spectroscopy (SERS) for detecting DNA methylation in plant tissue cultures. This review critically evaluates whether current SERS technologies can be translated from model DNA systems to DNA-methylation screening in plant tissue culture. It emphasizes substrate reproducibility, methylation-specific recognition, plant-matrix effects, CG/CHG/CHH context resolution, computational spectral analysis, and validation against established methylation methods. More specifically, it fills a significant gap at the intersection of plant epigenetics, tissue culture, and plasmonic spectroscopy by assessing how SERS-based methylation detection can be tailored to the unique analytical needs of plant systems, rather than relying predominantly on biomedical models. By integrating recent advances in plasmonic sensing with epigenetic modifications in tissue culture, this review aims to showcase SERS’s analytical capabilities in plant biotechnology, examine current limitations, and explore the key challenges and prospects shaping its broader adoption.
In the literature surveyed in Web of Science (i.e., “SERS”, and “DNA methylation”, and “plasmonic nanomaterials”, and “plant tissue culture”, and “SERS substrate”, and “SERS detection of DNA methylation” from January 2015 to December 2025), only peer-reviewed journals were included, and generic SERS studies that were not genomic DNA were excluded, as shown in Figure 1. In addition, most studies involving SERS techniques on Lens.org (using the same search keywords as Web of Science) were concentrated in biology, chemistry, medicine, and nanotechnology (Figure 2A). Using Lens.org, we reported the number of studies using the same techniques (Figure 2B). This article is a narrative review with a structured literature selection. Thus, the objective was not to conduct a formal systematic review or meta-analysis, but rather to synthesize the state of knowledge, identify converging findings, highlight technology-specific trade-offs, and outline research gaps relevant to both scientific and applied contexts.
Figure 1.
Bibliography of SERS detection of DNA methylation (data from Web of Science and analyzed by VOSviewer software, Version 1.6.20).
Figure 2.
Scholarly work. (A) Fields of study (data taken from Lens.org) and (B) number of publications from January 2015 to 31 December 2025.
2. Fundamental Principles of SERS-Based DNA Methylation Detection
2.1. SERS Enhancement Mechanisms
Although SERS has been widely applied across many research fields, its enhancement mechanism remains complex and is not yet fully understood. The scientific community generally recognizes two mechanisms: physical (electromagnetic) enhancement and chemical enhancement [52]. Physical enhancement occurs when incident light interacts with a metal surface and induces collective oscillation of free electrons. When the frequency of the incident electromagnetic wave approaches the natural oscillation frequency of these electrons, surface plasmon resonance (SPR) is generated, strengthening the local electromagnetic field and consequently enhancing Raman signals of molecules located on or near the metal surface. When this plasmonic resonance is confined to nanoscale regions, it is known as localized surface plasmon resonance (LSPR) (Figure 3A,B). Under optimized conditions, LSPR-mediated enhancement can reach up to 1014 [53,54]. Narrow gaps between adjacent plasmonic nanostructures can generate highly intensified electromagnetic fields known as “hot spots” (Figure 3C), which play a central role in Raman signal amplification [55]. Although molecules located within hotspot regions may represent less than 1% of the total molecular population, they can contribute more than 50% of the overall Raman signal [56]. Chemical enhancement is generally attributed to charge-transfer interactions between the SERS-active substrate and adsorbed molecules under laser irradiation. This interaction modifies the polarizability of the molecule–substrate system, thereby increasing Raman scattering intensity [57]. Overall, SERS enhancement, as shown in Figure 4A,B, is considered to result from combined physical and chemical contributions, although electromagnetic enhancement is often regarded as the dominant factor.
Figure 3.
Schematic diagrams of the electromagnetic enhancement mechanism of SERS. Adapted from Zong et al. [58] with permission from American Chemical Society. (A) Normal Raman scattering, (B) LSPR enhancement mechanism, and (C) electromagnetic enhancement.
Figure 4.
Charge-transfer enhancement mechanism of SERS. Adapted from Cortes et al. [59] with permission from American Chemical Society. (A) When NB molecules are positioned close to the AgNP surface, charge transfer is facilitated, producing a relatively small negative reduction potential. (B) When NB molecules are located farther from the AgNP surface, charge-transfer efficiency decreases, and the reduction potential may become more negative.
The SERS substrate is therefore critical for achieving strong and reproducible Raman enhancement for DNA Methylation Detection as shown Table 1. For the same analyte, the enhancement factor (EF) can vary considerably depending on substrate material, morphology, and interparticle spacing [60]. SERS substrates are commonly classified as noble-metal and non-metal nanomaterials. Gold and silver are the most widely investigated because their plasmon resonance regions cover much of the visible and near-infrared spectral range. Various noble-metal morphologies, including gold nanospheres, nanoprisms, and nanostars, have demonstrated strong SERS enhancement [61,62,63]. Non-metal substrates generally include semiconductors and two-dimensional materials, but their enhancement is typically weaker, and they are often combined with plasmonic materials [64,65].
SERS substrates can also be categorized as colloidal or solid substrates. Colloidal substrates offer simple preparation, high sensitivity, and low cost, with enhancement arising mainly from nanoparticle tips, edges, and interparticle gaps [66]. Aggregation can reduce interparticle distances and generate additional hotspots, while anisotropic nanoparticles with sharp tips and edges can provide stronger enhancement and lower detection limits. However, uncontrolled aggregation produces non-uniform hotspots and variable hotspot numbers, reducing stability and reproducibility [67,68]. Colloidal substrates are also sensitive to temperature, pH, and ionic strength. Researchers have therefore developed solid substrates by immobilizing nanoparticles on supporting surfaces to improve stability and reproducibility [69]. Nanoparticle assembly methods include chemisorption, physisorption, capillary-driven assembly, and surface-energy-driven assembly [70]. Compared with colloidal substrates, solid substrates generally provide better uniformity and stability, although fabrication is more complex. Thus, developing controllable high-density hotspots, efficiently confining analytes within hotspot regions, and generating dynamic hotspots remain important directions for advancing SERS technology [71].
2.2. Surface Functionalization
Surface functionalization is essential for improving SERS selectivity because it controls analyte capture, orientation, and localization within electromagnetic hotspots, as shown in Figure 5. DNA probes, aptamers, anti-5-methylcytosine recognition systems, and hybridization-based approaches can improve detection specificity and reduce interference from complex plant DNA extracts [72]. This is particularly important in plant tissue culture systems, where polysaccharides, phenolic compounds, and secondary metabolites can interfere with nanoparticle interactions and alter DNA accessibility. Incorporation of antifouling components, such as polyethylene glycol spacers and zwitterionic materials, may improve analytical performance in plant samples [73].
Electrostatic functionalization offers a simple strategy to control analyte–nanoparticle interactions by exploiting charge complementarity. Citrate- or CTAB-modified nanoparticles can selectively attract oppositely charged molecules, improving hotspot accessibility and signal intensity [74,75]. However, these systems may suffer from aggregation, instability, and matrix-dependent variability, limiting their application in complex biological samples. Host–guest recognition strategies using molecules such as cyclodextrins, cucurbiturils, and calixarenes provide additional molecular selectivity through hydrogen bonding, hydrophobic interactions, and π–π stacking [76,77,78]. Although these systems can substantially improve sensitivity, challenges remain regarding nanoparticle reproducibility and stability. Biological recognition approaches using DNA probes, antibodies, and aptamers offer high specificity and are particularly promising for methylation-specific detection. These systems can guide target molecules into hotspot regions and improve discrimination between methylated and unmethylated sequences. However, complex preparation procedures and interference from biological matrices remain major limitations.
Molecular imprinting and chemical derivatization offer alternative approaches to enhance selectivity. Molecularly imprinted polymers create artificial recognition sites, while chemical derivatization generates characteristic Raman-active products with improved detection specificity. Nevertheless, both strategies require further optimization to improve reproducibility and compatibility with complex plant samples. In conclusion, future SERS-based DNA methylation platforms should integrate advanced hotspot engineering with selective surface chemistry and computational spectral analysis. Such integration will be essential to overcome current limitations in sensitivity, reproducibility, and matrix interference, and to enable reliable SERS applications in plant tissue culture biotechnology [79].
Figure 5.
Surface modification strategies for enhanced DNA adsorption in direct SERS. (A) Electrostatic confinement of negatively charged dsDNA between spermine-coated Ag nanoparticles enhances methylation-dependent spectral features, (B) (b-1) Molecular structure of 5-methyl cytosine (mC). SERS spectra of ds1 and dsmC, and the difference spectrum dsmC-ds1. For the sake of clarity, the digitally subtracted spectrum was multiplied by a factor of two. (b-2) Detail of the 700–840 cm−1 region for the SERS spectra of ds1 + dsmC at different cytosine base ratios RmC = [mC]/([C] + [mC]) (from the top to the bottom, RmC = 0, 0.045, 0.091, 0.182, 0.273, 0.364, and 0.455). The overall ds concentration was kept constant at 630 ng mL−1. (b-3) Ratiometric peak intensities I732/I788 vs. the molar ratio RmC = [mC]/([C] + [mC]), (C) (c-1) Molecular structure of N6-methyladenine (mA). SERS spectra of ds1 and dsmA, and the difference spectrum dsmA−ds1. For the sake of clarity, the digitally subtracted spectrum was multiplied by two. (c-2) Detail of the 700–760 cm−1 region for the SERS spectra of ds1 + dsmA at different adenine base ratios RmA = [mA]/([A] + [mA]) (from the top to the bottom RmA = 0, 0.1, 0.2, 0.3, 0.4, 0.5, and 0.6). The overall ds concentration was kept constant at 630 ng mL−1. (c-3) Ratiometric peak intensities I743/I730 vs. molar ratio RmA. Adapted from Guerini et al. [80] with permission from Wiley. (D) Positively charged PDDA-modified Au-HPOC substrate for electrostatic interaction with DNA and analysis of base mutations by spectral differentiation. Adapted from Xing et al. [81] with permission from American Chemical Society.
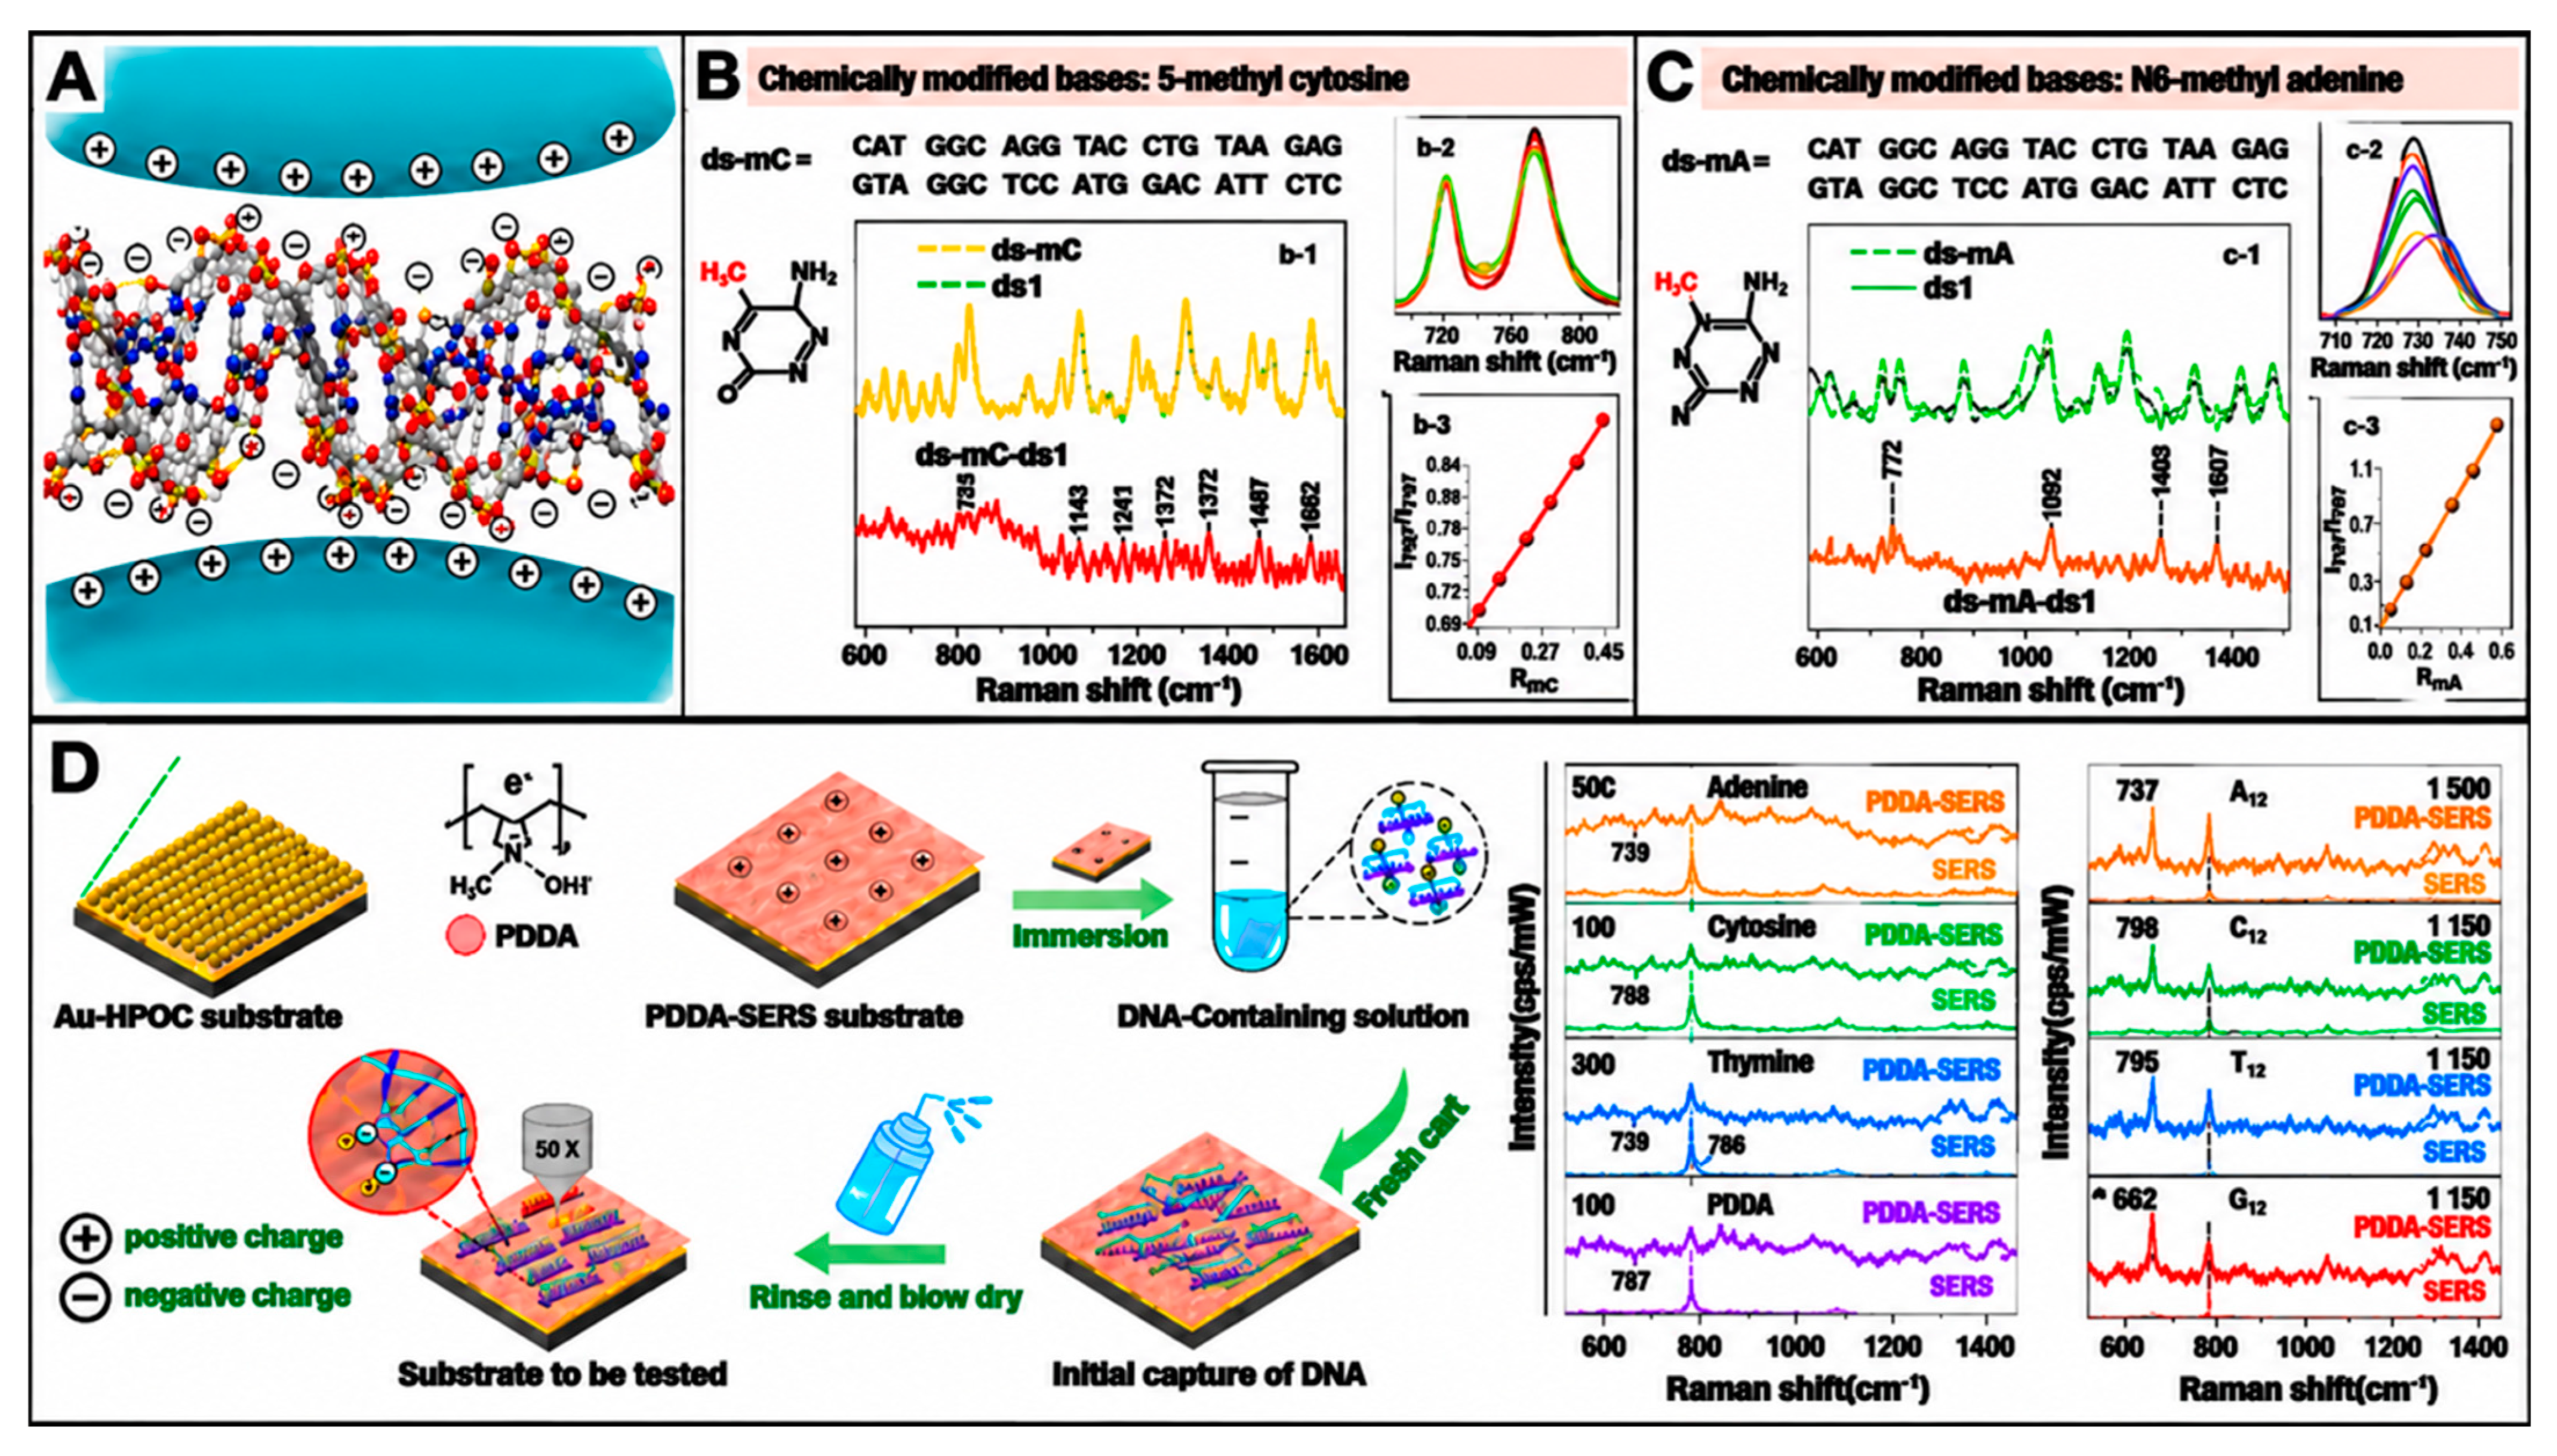
Table 1.
Comparative Overview of SERS Nanostructure Platforms for DNA Methylation Detection.
3. DNA Methylation as an Analytical Target in Plant Tissue Culture
3.1. SERS for Nucleic Acid and DNA Methylation Analysis
3.1.1. SERS Detection of DNA Structural Features
SERS provides a rapid molecular-fingerprint approach for characterizing nucleic acids because adenine, guanine, cytosine, thymine, uracil, ribose-phosphate groups, and base-stacking interactions generate Raman-active vibrational features. Early SERS studies demonstrated sensitive detection of DNA/RNA mononucleotides, while subsequent studies showed that SERS can support direct analysis of DNA duplexes, DNA base composition, sequence-related changes, and single-base mismatches [72,80,89,90,91]. These characteristics make nucleic-acid SERS attractive for rapid screening of DNA and RNA targets. However, peak position and intensity can vary with metal surface chemistry, ionic strength, pH, DNA conformation, strand length, and adsorption orientation; therefore, spectral interpretation should remain conservative and assay-specific.
For plant stress studies, nucleic-acid SERS can provide base-specific or probe-specific signatures following appropriate extraction and cleanup. Researchers have widely explored direct SERS analysis of nucleic acids because DNA and RNA bases generate characteristic vibrational fingerprints that support molecular recognition. Nevertheless, spectral interpretation depends strongly on substrate chemistry, adsorption orientation, aggregation state, and sample purity [34]. Plant-relevant SERS miRNA sensing has also been demonstrated using inverse molecular sentinel nanoprobes for in vivo detection of miR156 in Arabidopsis tissues [92], as shown in Figure 6, while more recent in vivo SERS nanosensors have enabled monitoring of multiple stress-related endogenous molecules in living plants [93]. Such findings support the feasibility of Raman-based sensing under biologically relevant plant conditions. It ought to be noted that these related plant/nucleic-acid SERS technologies (Arabidopsis miR156 SERS, SERS detection of RNA m6A and formaldehyde from histone-demethylase activity) demonstrate methodological feasibility.
Figure 6.
(A). Plasmonic nanoprobes for in vivo multimodal sensing and bioimaging of microRNA within plants. (B) (b-1) Schematic representation of the iMS sensing mechanism. (b-2) Detection of miR156 target using iMS nanoprobes labeled with Cy7. SERS response of iMS nanoprobes in the absence of target (OFF, blue spectrum) and in the presence of 2 μM synthetic miR156 target DNA (ON, red spectrum). (C) Multifunctional SERS tags within an A. thaliana leaf. (c-1) Superposition of the Raman intensity map of the infiltrated leaf, calculated as the background-subtracted intensity of the 927 cm−1 peak of Cy7.5 in each pixel, over the bright-field image of the leaf. (c-2) Spectra from two different pixels of the Raman intensity map: one from the location infiltrated with SERS tags (purple) and one from a noninfiltrated region of the leaf (black). (c-3) TPL map superimposed over bright-field image of the leaf (SERS tags appear white) and (c-4) Au XRF image to demonstrate location and quantification of SERS tags. Adapted from Crawford et al. [92] with permission from American Chemical Society.
3.1.2. SERS Detection of DNA Methylation Markers
DNA methylation is a central epigenetic target because methylation changes may occur in CG, CHG, and CHH contexts and may influence promoters, transposable elements, ion-transporter genes, osmoprotectant pathways, redox genes, and stress-memory loci [94]. SERS can detect methylation-associated spectral changes in cytosine-rich or CpG-containing DNA under controlled conditions. Recent label-free SERS studies of genomic DNA cytosine methylation have reported methylation-associated spectral features, while cation-mediated adsorption to silver nanoparticles has improved genomic DNA signal generation and interpretation of methylation-related bands [44,95,96]. A recent SERS-focused review further highlighted expanding strategies for DNA methylation analysis, including label-free platforms, nanostructured substrates, and data-driven spectral interpretation [44].
3.1.3. Challenges in Translating Synthetic DNA Results to Plant Genomic DNA
Although SERS demonstrates considerable potential for DNA structural and methylation analysis, translating results obtained from synthetic or purified DNA systems to complex plant genomic DNA remains challenging. Plant tissues contain pigments, salts, polysaccharides, phenolics, proteins, and metabolites that may adsorb onto plasmonic substrates or generate strong background signals. Therefore, crude plant extracts should not be interpreted directly as epigenetic fingerprints without appropriate blank extracts, unmethylated DNA controls, methylated DNA standards, spike-in controls, and matrix-matched calibration sets. In addition, in vitro plant stress tolerance is regulated by interacting layers of DNA methylation, histone modifications, chromatin remodeling, histone variants, and non-coding RNAs rather than by a single molecular marker [97,98].
The main limitations of nucleic-acid and DNA-methylation SERS in plant systems include plant-matrix interference, variable adsorption orientation, substrate heterogeneity, spectral overlap, limited genomic-site resolution, and incomplete calibration transfer between instruments. SERS-based miRNA or ncRNA signals should therefore be benchmarked against qRT-PCR, small RNA sequencing, long-read transcriptomics, or sequence-specific hybridization assays before inferring epigenetic regulation under salinity. Machine-learning-assisted spectral deconvolution may improve classification of methylated and unmethylated signals, but models should be trained using biologically realistic plant matrices with independent validation sets and sequencing-confirmed methylation states. Future studies should standardize DNA extraction, compare colloidal and solid substrates, include methylated and unmethylated reference materials, report spectral preprocessing transparently, and validate performance across tissues, genotypes, salt concentrations, exposure durations, and field-like conditions.
3.2. Sample Preparation and SERS Measurement
The choice of sample preparation method in SERS measurements, either drop-cast (solid-state) or colloidal (in-liquid), significantly affects reproducibility and experimental outcomes [50,99,100]. Each method involves unique interactions between the sample and plasmonic nanostructures and requires specific considerations. In drop-cast solid-state measurements, samples were deposited onto a SERS-active substrate. After air drying, the sample formed a thin solid film that interacted directly with the substrate’s plasmonic hot spots. This approach further ensured that hot spots were localized to the substrate surface, resulting in strong and stable interactions between the adsorbed DNA and the substrate. Solid-state measurements are highly stable, as the DNA molecules remain immobilized, minimizing issues such as motion or signal fluctuation [101]. This stability makes them ideal for high-sensitivity applications such as detailed mapping of DNA structure or methylation patterns. However, drying can alter DNA’s natural conformation (from B-form to A-form) and change nucleobase orientation relative to the metal surface, ultimately affecting the Raman signal [102]. Additionally, uneven DNA distribution and fixed positions on the substrate can introduce high variability in SERS spectra across replicates [58].
In colloidal measurements, DNA molecules are dispersed in a liquid suspension containing plasmonic nanoparticles. Interactions occur dynamically in the liquid phase. For example, aggregation of nanoparticles can be induced (e.g., by adding salts) to create plasmonic hot spots in the interparticle gaps [38,44,103,104]. Such dynamic interactions provide a flexible platform for studying DNA under physiologically relevant conditions, allowing monitoring of molecular processes such as hybridization or enzymatic reactions. Colloidal SERS measurements are straightforward to prepare as they do not require drying or fixation steps. Additionally, detection in aqueous media maintains homogeneity and improves sample photostability. However, excessive aggregation may reduce hotspot accessibility, lower signal intensity, or cause nanoparticle precipitation [105].
Further, coadsorbed species and the local microenvironment influence spectral characteristics, particularly peak relative intensity. Consequently, even identical DNA molecules may produce markedly different spectral features when adsorbed on different metal surfaces or under varying experimental conditions. This variability poses a significant challenge for direct SERS-based DNA identification, even for qualitative analysis [105]. Sample purity is a critical factor and should be ensured through appropriate purification steps, such as spin-column cleanup, to remove residual nucleotides, enzymes, salts, buffers, proteins, cellular debris, and dye molecules. Subsequent absorbance measurements of A260/A280 and A260/A230 provide a quantitative indication of nucleic acid purity. High-purity DNA samples typically exhibit an A260/A280 ratio of 1.8–2.0 and an A260/A230 ratio of 2.0–2.2 [106]. Anything in contact with the plasmonic nanostructure generates a SERS signal. Extracting and purifying DNA is critical to ensure high-quality material for downstream applications such as SERS-based DNA methylation detection. Purification ensures the DNA sample is free of contaminants such as proteins, ions, or other nucleic acids that could interfere with SERS signals. After extraction and purification, DNA molecules could be further preprocessed to optimize DNA interaction with plasmonic substrates. For instance, bisulfite conversion or DNA amplification could be performed [107]. These methods enable the identification and quantification of methylation patterns by chemically modifying DNA and increasing the number of target sequences for detection.
Direct SERS Spectral Analysis
In direct SERS, DNA methylation levels are represented by characteristic SERS peaks, where intensities at specific positions reflect the DNA’s methylation state. One of the most prominent spectral regions for DNA methylation analysis is the peak observed at 1000–1014 cm−1, attributed to the rocking vibrations of the methyl group on 5mC [108]. This peak serves as a methylation-associated Raman feature under the reported DNA methylation assay conditions and is consistently identified across studies. Its intensity correlates with methylation levels, increasing with hypermethylation and decreasing with hypomethylation, as observed in diseases such as leukemia. Additional methylation-associated peaks appear at 1239 and 1639 cm−1, corresponding to C–H and C=O stretching vibrations, respectively, further highlighting methylation-induced structural changes in DNA [108].
The spectral range between 785 and 800 cm−1 is well studied. Unmethylated cytosine exhibits a distinct peak at 785 cm−1, corresponding to the ring breathing mode. Upon methylation, this peak diminishes or shifts, reflecting the chemical and structural alterations in the DNA. In a study by Xie et al., gold nanostars were utilized to make plasmonic Pickering emulsion SERS detection of 5mC. Compared with the C peak at 793 cm−1, 5mC showed a blue shift to 758 and 782 cm−1 [109]. In another study by the same group, they used nanostars to make carbon nanotubes for label-free detection of m6A modification in RNA [110]. Vibrations from the DNA phosphate backbone, typically observed at 1085 cm−1, also show intensity and position shifts due to methylation-induced conformational changes [103].
Peaks between 1345 and 1365 cm−1 are another significant spectral region in DNA methylation studies, often associated with C–H bending vibrations and ring-stretching modes of cytosine and guanine in the DNA molecule [36,44]. In the context of methylation, this peak also reflects contributions from 5mC, capturing structural and vibrational changes induced by adding a methyl group to cytosine. In methylated DNA, the 1350 cm−1 peak is influenced by the altered electronic environment and molecular vibrations resulting from the methyl group. However, slight shifts in the position of the 1350 cm−1 peak may occur depending on the interaction between the DNA molecule and the SERS substrate. Variations in LSPR effects, particularly in solid substrates such as gold nanohole arrays, can induce these shifts, further highlighting this peak’s sensitivity to methylation. This peak often shows intensity changes proportional to methylation levels. The enhancement is attributed to the additional vibrational modes introduced by the methyl group near the aromatic ring of cytosine. The 1350 cm−1 peak serves as a complementary marker to more prominent methylation-associated bands, such as those at 1005 and 785 cm−1. Although it is not typically used as a standalone indicator, including it in spectral analysis improves the reliability of methylation studies.
Apart from causing spectral differences, methylation has also been found to influence the metal–DNA interaction. This happens when DNA methylation alters the local electron density, hydrophobicity, and steric configuration of nucleobases, thereby influencing DNA adsorption geometry and charge-transfer interactions on metal surfaces. Some studies using both AuNPs and AgNPs show that hypermethylation in genomic DNA induces higher affinity for metal surfaces than hypomethylated DNA [95,111]. Although SERS spectral differences are often subtle because the DNA backbone and nucleobases dominate, methylation can modulate vibrational polarizability and orientation-dependent SERS enhancement.
Single-peak or peak-ratio analysis is a common tool and does not require sophisticated data-processing techniques. However, using the entire SERS spectrum for DNA methylation analysis offers a comprehensive approach [50,112]. Unlike focusing solely on individual peaks, full-spectrum analysis captures a wider range of vibrational modes, providing detailed insights into methylation-specific modifications and broader structural alterations in the DNA molecule. This method allows researchers to identify subtle spectral variations that might otherwise go unnoticed when analyzing single peaks [113]. Despite these advantages, whole-spectrum analysis also presents challenges. The data complexity requires robust computational tools for processing and interpretation. Processing steps such as baseline correction and normalization are essential for quantitative comparison. Additionally, variability in SERS substrates, such as differences in hotspot density or uniformity, can affect the entire spectrum and requires consistent experimental controls [112,113,114,115,116]. Overlapping peaks in complex DNA samples may also complicate interpretation, but multivariate statistical methods can resolve these overlaps and extract relevant features [112]. One of the primary benefits of using the entire spectrum is the ability to apply multivariate statistical and computational methods, such as principal component analysis (PCA), partial least-squares regression (PLSR), artificial intelligence (AI), machine learning (ML) algorithms, linear discriminant analysis (LDA), receiver operating characteristic (ROC) curve, and classification and regression trees (CART) analysis [112,113,114,115,116]. These approaches allow researchers to classify methylation patterns and distinguish methylated from unmethylated DNA based on spectral patterns, even when individual peaks show little differentiation.
4. SERS-Based DNA Methylation Detection Strategies: Labeled and Label-Free Approaches
SERS relies on enhanced Raman scattering when analyte molecules sit near plasmonically active nanostructures, most commonly gold or silver [72]. The dominant amplification source is electromagnetic enhancement from localized surface plasmon resonance, especially within nanogaps or other highly confined hotspots. Additional chemical enhancement can arise from charge-transfer interactions between the substrate and the analyte [41,43]. For DNA methylation detection, the analytical target is the structural and vibrational consequence of cytosine methylation. Methyl groups alter local bonding environments and affect Raman-active modes, which can be detected directly or through reporter-assisted strategies [39]. Under properly engineered adsorption and hotspot conditions, SERS can distinguish methylated and unmethylated DNA by monitoring characteristic band shifts or relative intensity changes, as shown in Figure 7. Representative studies include plasmonic gold nanohole arrays for label-free methylation discrimination, zirconium-modified silver nanoparticles for direct methylation reading, and high-ionic-strength gold nanoparticle assemblies for CpG methylation identification [44]. From an assay-design perspective, SERS methylation strategies fall into two broad categories.
Figure 7.
Schematic overview of direct SERS, where DNA adsorbs onto plasmonic nanostructures (e.g., gold nanoparticles), and methylation-associated vibrational fingerprints are read directly from the DNA.
4.1. Label-Free SERS Detection
When DNA molecules adsorb onto or sit near metallic nanostructures, such as Au or Ag, localized surface plasmon resonances (LSPRs) generate enhanced electromagnetic fields that amplify Raman scattering from molecules on or near the plasmonic surface [50,117]. This interaction produces SERS spectra that provide molecular fingerprints of DNA, including information related to base composition and methylation status [83,118]. Unlike labeled approaches, label-free SERS directly interrogates intrinsic vibrational signatures of DNA or methylation-enriched DNA without requiring fluorescent dyes, enzymatic conversion, or reporter molecules. This simplifies sample preparation and enables rapid screening; however, it requires highly reproducible substrates, controlled DNA adsorption, and robust spectral analysis. In direct SERS detection of DNA methylation, 5-methylcytosine (5mC) is commonly evaluated through characteristic Raman bands, including approximately 785 cm−1 associated with cytosine ring breathing, 1005 cm−1 related to 5mC ring breathing, and 1350 cm−1 associated with C–H bending and C/G ring stretching vibrations.
Recent studies have demonstrated the capability of label-free SERS for DNA methylation analysis. Zhang et al. developed a silver nanoparticle-based SERS platform modified with zirconium ions that enabled DNA base fingerprinting and discrimination between unmethylated and methylated DNA, including N6-methyladenine and 5-methylcytosine, using multivariate analysis approaches such as principal component analysis (PCA) [38], as shown in Figure 8A. Alom et al. further reported label-free detection of genomic DNA cytosine methylation using gold nanoparticles under high ionic strength conditions, identifying methylation-associated spectral features near 1350 cm−1 [44].
Figure 8.
(A) Schematic diagram for the SERS detection of DNA with AgZNPs, (B) the SERS spectra for DNA with different base sequences and lengths, and (C) (a) the SERS spectra of unmethylated DNA (M0, black line), N6-methylated adenine (MA, red line), and MA-M0 (blue line), (b) The SERS spectra of M0 (black line), 5-methylated cytosine (MC, red line), and MC-M0 (blue line) and (c) The PCA of the spectral data set. Score plot of the first two principal components following PCA analysis of Raman spectra recorded from methylated and unmethylated DNA samples. The red, blue, and green spheres represent M0, MC, and MA, respectively. Adapted from Zhang et al. [38] with permission from Elsevier.
Despite these advantages, direct SERS measurements can be influenced by DNA sequence variation, strand conformation, matrix components, nanoparticle interactions, substrate morphology, and hotspot distribution. Therefore, researchers often apply normalization approaches, including internal peak ratios (e.g., I785/I730), ratiometric analysis (e.g., CG/AT ratio), and baseline correction methods, to reduce spectral variability and improve reliability. Furthermore, SERS does not directly identify individual methylated cytosine residues; instead, it detects changes in vibrational features associated with DNA structure and DNA–nanoparticle interactions. Consequently, appropriate methylated/unmethylated controls and complementary molecular validation methods should support spectral interpretation.
For plant tissue culture applications, label-free SERS represents a promising approach for rapid comparative profiling of DNA methylation-associated changes in explants, callus, embryogenic tissues, and regenerated plants with minimal sample modification. However, biological matrix complexity and spectral variability remain major challenges requiring advanced preprocessing and chemometric strategies.
4.2. Label-Based Strategies
In label-based SERS, Raman reporters, sequence-specific probes, affinity ligands, or amplification steps improve selectivity and sensitivity [42]. This approach is more adaptable to locus-specific and multiplexed measurements, though it adds assay complexity. Label-based SERS strategies improve signal contrast and analytical control by incorporating Raman reporters, affinity ligands, or amplification chemistry. A landmark example is the ligase chain reaction-coupled SERS method of Wang et al., which enabled CpG-resolution methylation detection and detected methylation differences as low as about 10%. Such designs are especially promising when the goal is to monitor selected loci rather than global methylation shifts [37].
A plasmonic gold nanohole array (PGNA) with controlled hotspots was developed as a SERS substrate for DNA methylation detection. FDTD simulations optimized its geometry and plasmonic response to 785 cm−1, matching the cytosine ring-breathing band. EBL-fabricated PGNA exhibited an enhancement factor of ~106 and 7.1% RSD. The platform detected methylation changes as low as 1%, demonstrating high sensitivity and reproducibility [36], as shown in Figure 9.
Figure 9.
(A) Normalized averaged Raman spectra of unmethylated DNA (S1, curve (a)) and methylated DNA (100 μM) for different methylation levels (S2–S4, curve (b–d)) recorded on the PGNA. These spectra represent the means of 20 spectra for each DNA, and the spectra were normalized using the peak intensity at 680 cm−1. (B) Raman intensities for peaks at 785 cm−1, 1225 cm−1, and 1365 cm−1. (C) PCA analysis of the spectral data set. Scores plot of the first two principal components following PCA analysis of Raman spectra recorded from methylated and unmethylated DNA samples. (D) 2D synchronous and (E) asynchronous Raman correlation map in the region of 700–1500 cm−1. The color bar shows the different intensities of the 2D correlation peaks, which indicate the extent of correlation of S1–S4. (F) SERS spectra of unmethylated DNA (S9) and DNA containing one 5-methylcytosine (S10) and the difference spectrum of S10–S9. (G) SERS spectra of S9 and DNA containing one N6-methyladenine (S11) and the difference spectrum of S11–S9. (H,J) Details of the 600–800 cm−1 region for the (H) SERS spectra of (a–d): S1–S4 and (J) DNA mixture of S1 and S2 with ratios of (a–e): 0, 0.05, 0.1, 0.25, 0.5, 0.75, and 1.0, respectively. All the concentrations of DNA samples were prepared to be 100 μM (I,K) The dependence of the ratiometric peak intensities for 785 cm−1/680 cm−1 on (I) populations of methylcytosine in S1–S4 and (K) the molar ratios of S2 in DNA mixtures. Adapted from Luo et al. [116]. with permission from American Chemical Society.
This targeted logic is highly relevant to plant tissue culture. Many practical decisions in regeneration biology and clonal quality control depend on a limited number of informative loci rather than on full methylome maps. A label-based SERS platform that enriches methylated fragments or hybridizes to regeneration-associated targets could therefore provide a powerful intermediate layer between rapid screening and definitive sequencing.
Table 2 compares SERS-based strategies with established DNA methylation methods for plant tissue culture applications. SERS offers advantages including low DNA requirements, rapid analysis, minimal sample disruption, and high-throughput potential. However, it remains an emerging approach with limited validation in plants. Current performance should be considered preliminary and requires further benchmarking against established methods and validation across diverse plant systems.
Table 2.
Comparative Overview of SERS-Based and Conventional DNA Methylation Detection Methods for Plant Tissue Culture Applications.
Although label-free SERS provides a rapid and minimally processed approach for detecting methylation-associated molecular changes, its analytical information is limited to intrinsic vibrational differences arising from methylated DNA molecules. The characteristic Raman contribution of 5-methylcytosine reflects the presence and structural influence of the methyl group but does not identify the genomic sequence context of methylation. Therefore, label-free SERS cannot independently distinguish CG, CHG, and CHH methylation patterns, which represent biologically distinct regulatory contexts in plant genomes. In plant tissue culture systems, label-free SERS may therefore serve as a rapid screening platform for detecting global or relative methylation-associated changes among regenerated lines, but it should not replace locus-specific methylome approaches.
In contrast, label-based SERS integrates molecular recognition elements, including complementary nucleic acid probes, antibodies, aptamers, methylation-sensitive enzymes, or chemically modified recognition systems, to improve target specificity. These strategies can potentially enable detection of defined methylated loci or sequence contexts when combined with appropriate amplification or enrichment methods. However, such approaches require additional assay design and biological validation before they can be applied routinely for plant tissue culture quality control.
5. Evidence Supporting Translation to Plant Tissue Culture
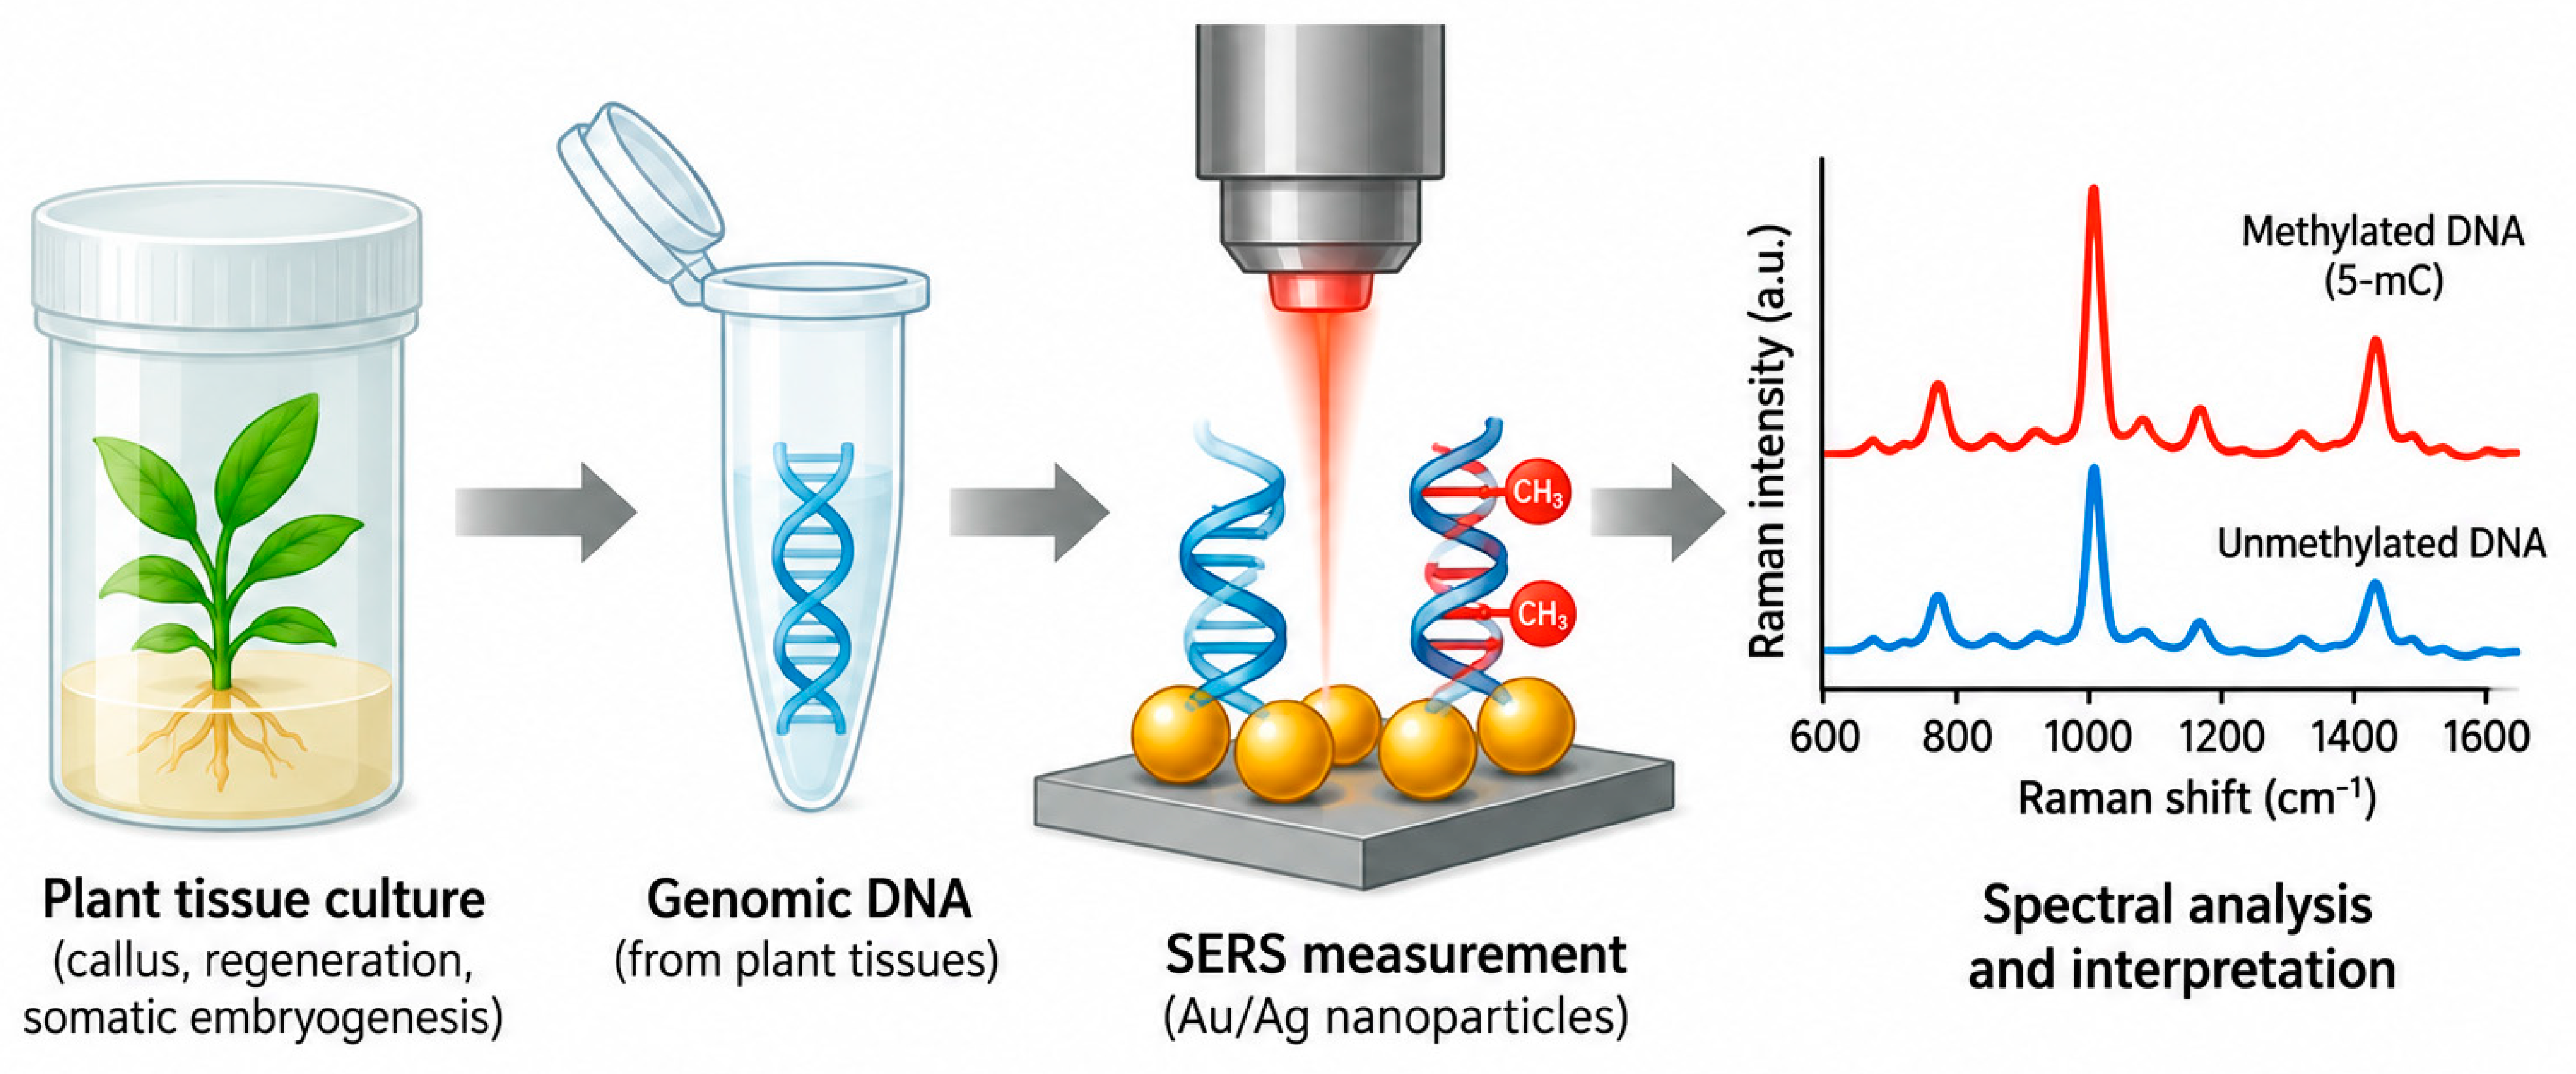
A successful integration of SERS with chemometrics for detecting DNA methylation was demonstrated by Abid et al. [119], as shown in Figure 10, Figure 11 and Figure 12, which also demonstrate the workflow of methylation-related biosensing and potential translation to plant tissue-culture samples. They used a hybrid Au@Ag core–shell nanopillar architecture as a plasmonic substrate and analyzed guanine adduct specimens across a concentration range of 1 nM to 10 µM. Their chemometric analysis showed that this approach could clearly distinguish nonmethylated guanine from its methylated variants at various positions, such as O6-methylguanine, N7-methylguanine, O6-hydroxyethylguanine, N7-2-hydroxyethylguanine, O6-benzylguanine, and O6-methyl-d3-guanine.
In a subsequent study, Luo et al. [120] used a planar gold SERS substrate to monitor the activity of M.SssI (CpG methyltransferase) on a target DNA fragment containing the sequence 5′-CCGG-3′. A probing DNA strand, designed with both a recognition motif and an extended spacer for hybridization chain reaction, was anchored via an Au–S bond at the 3′ end, with the 5′ end labeled with Cy5 as a Raman reporter. The signal intensity increased with M.SssI activity, enabling quantitative measurements with a detection limit of 2 × 10⁻⁴ U mL−1, comparable to fluorescence-based methods. This method also enabled selective detection of M.SssI in human serum, even in the presence of other methyltransferases, making it highly valuable for methylation research in disease contexts and plant biology.
Mirajkar et al. [121] demonstrated that SERS could distinguish genomic methylated DNA from Brassica juncea and Arabidopsis thaliana using Ag and Au nanoparticles (NPs). Changes in surface plasmon resonance confirmed DNA adsorption, while circular dichroism demonstrated alterations in gDNA helicity. Dynamic light scattering and transmission electron microscopy showed greater aggregation of gDNA-functionalized Au NPs than Ag NPs, while zeta-potential measurements indicated good stability. SERS revealed adenine and deoxyribose as major DNA sites interacting with the metal surfaces. The detection limits were approximately 10 and 1 ng μl−1 for Ag and Au NPs, respectively. Wavelength-dependent Raman measurements indicated that charge-transfer effects contributed alongside electromagnetic enhancement [121]. Genomic DNA was isolated using the CTAB method, while Ag and Au nanoparticles, synthesized through standard reduction protocols [122,123], served as the enhancing substrates. This study underscored SERS’s potential for analyzing plant genomic DNA. Although SERS has not been extensively used to study histone demethylation in plants, Wang et al. [124] described a simple assay to monitor the activity of two histone demethylases by detecting formaldehyde, a byproduct released during demethylation. In this method, a thiolated probe reacted with formaldehyde to form an adduct, which was then covalently bound to peptide-stabilized Au nanoparticles. This technique shows significant promise, as the same byproduct is produced during oxidative demethylation of proteins, nucleic acids, and other biological molecules.
Moreover, SERS was used to characterize DNA from eight Solanum tuberosum L. cultivars and populations and two Vitis vinifera L. varieties. Acidic pH induced SERS intensity changes and wavenumber shifts, indicating altered DNA–AgNP interactions and structural modifications. DNA bands showed FWHMs of 8–34 cm−1, with (sub)picosecond molecular dynamics and relaxation times of 0.31–1.33 ps [125], as shown in Figure 10. In addition, a study assessed genomic DNA from five non-cryopreserved tomato cultivars and evaluated cryopreservation-induced structural changes using SERS (400–1800 cm−1). Siriana DNA showed the weakest changes, whereas Pontica was most responsive. Cryopreservation mainly affected the 1511–1652 cm−1 region, associated with dA, dG, and dT residues, suggesting base unstacking. Both C2′-endo-anti and C3′-endo-anti conformations were detected. No significant structural changes were observed in Siriana, Darsirius, or Kristin. These findings demonstrate SERS’s potential for investigating DNA structural changes and DNA–ligand interactions during plant cryopreservation [126], as shown in Figure 11.
In another application, duplex SERS nanotags based on silica-coated dimeric and trimeric Au nanoparticles with 4-mercapto-3-nitrobenzoic acid and 4-mercaptobenzoic acid as Raman reporters were used to simultaneously monitor DNA methylation levels and quantitatively assess total genomic DNA methylation [127]. In that approach, genomic DNA was enzymatically digested into fragments. Biotin-dNTPs were incorporated into the fragment ends with DNA polymerase, followed by incubation with streptavidin magnetic beads and SERS nanotags. The beads captured all available biotinylated DNA, and the streptavidin-SERS nanotags served as an internal control for total DNA amount. At the same time, nanotags labeled with methyl-binding domain proteins specifically bound methylated DNA. Using Raman intensity data, researchers could quantify total percentage methylation. Taken together, these studies indicate that SERS already has several analytical features required for plant tissue-culture applications, including high sensitivity, compatibility with limited DNA input, and the ability to resolve methylation-associated spectral changes in nucleic-acid-derived systems. Although most current demonstrations remain outside direct plant tissue-culture workflows, the evidence strongly supports applying SERS to somaclonal-variation monitoring, clonal fidelity screening, and regeneration-state assessment in plant biotechnology. The next critical step is proof of principle, followed by validation in plant tissue-culture materials.
Figure 10.
(A) Surface-enhanced Raman spectra of Solanum tuberosum L. DNAs isolated from Buzau population, Lazarea population, Patraque d’Auvergne, and RFA Roclas Clone 2.6 Ferma, as labeled in the figure. Renishaw inVia Reflex Raman spectrometer with an excitation laser line at 532 nm was used. Markers with * indicate buffer bands that are not superimposed on DNA profiles. (B) Surface-enhanced Raman spectra of Solanum tuberosum L. DNAs isolated from Vitelotte Negresse, Roclas Clone C, RFA Roclas Clone 2.6 Ferma, and Blue Congo, as labeled in the figure. Renishaw inVia Reflex Raman spectrometer with an excitation laser line at 532 nm was used. Markers with * indicate buffer bands that are not superimposed on DNA profiles. Adapted from Dina et al. [125] with permission from Elsevier.
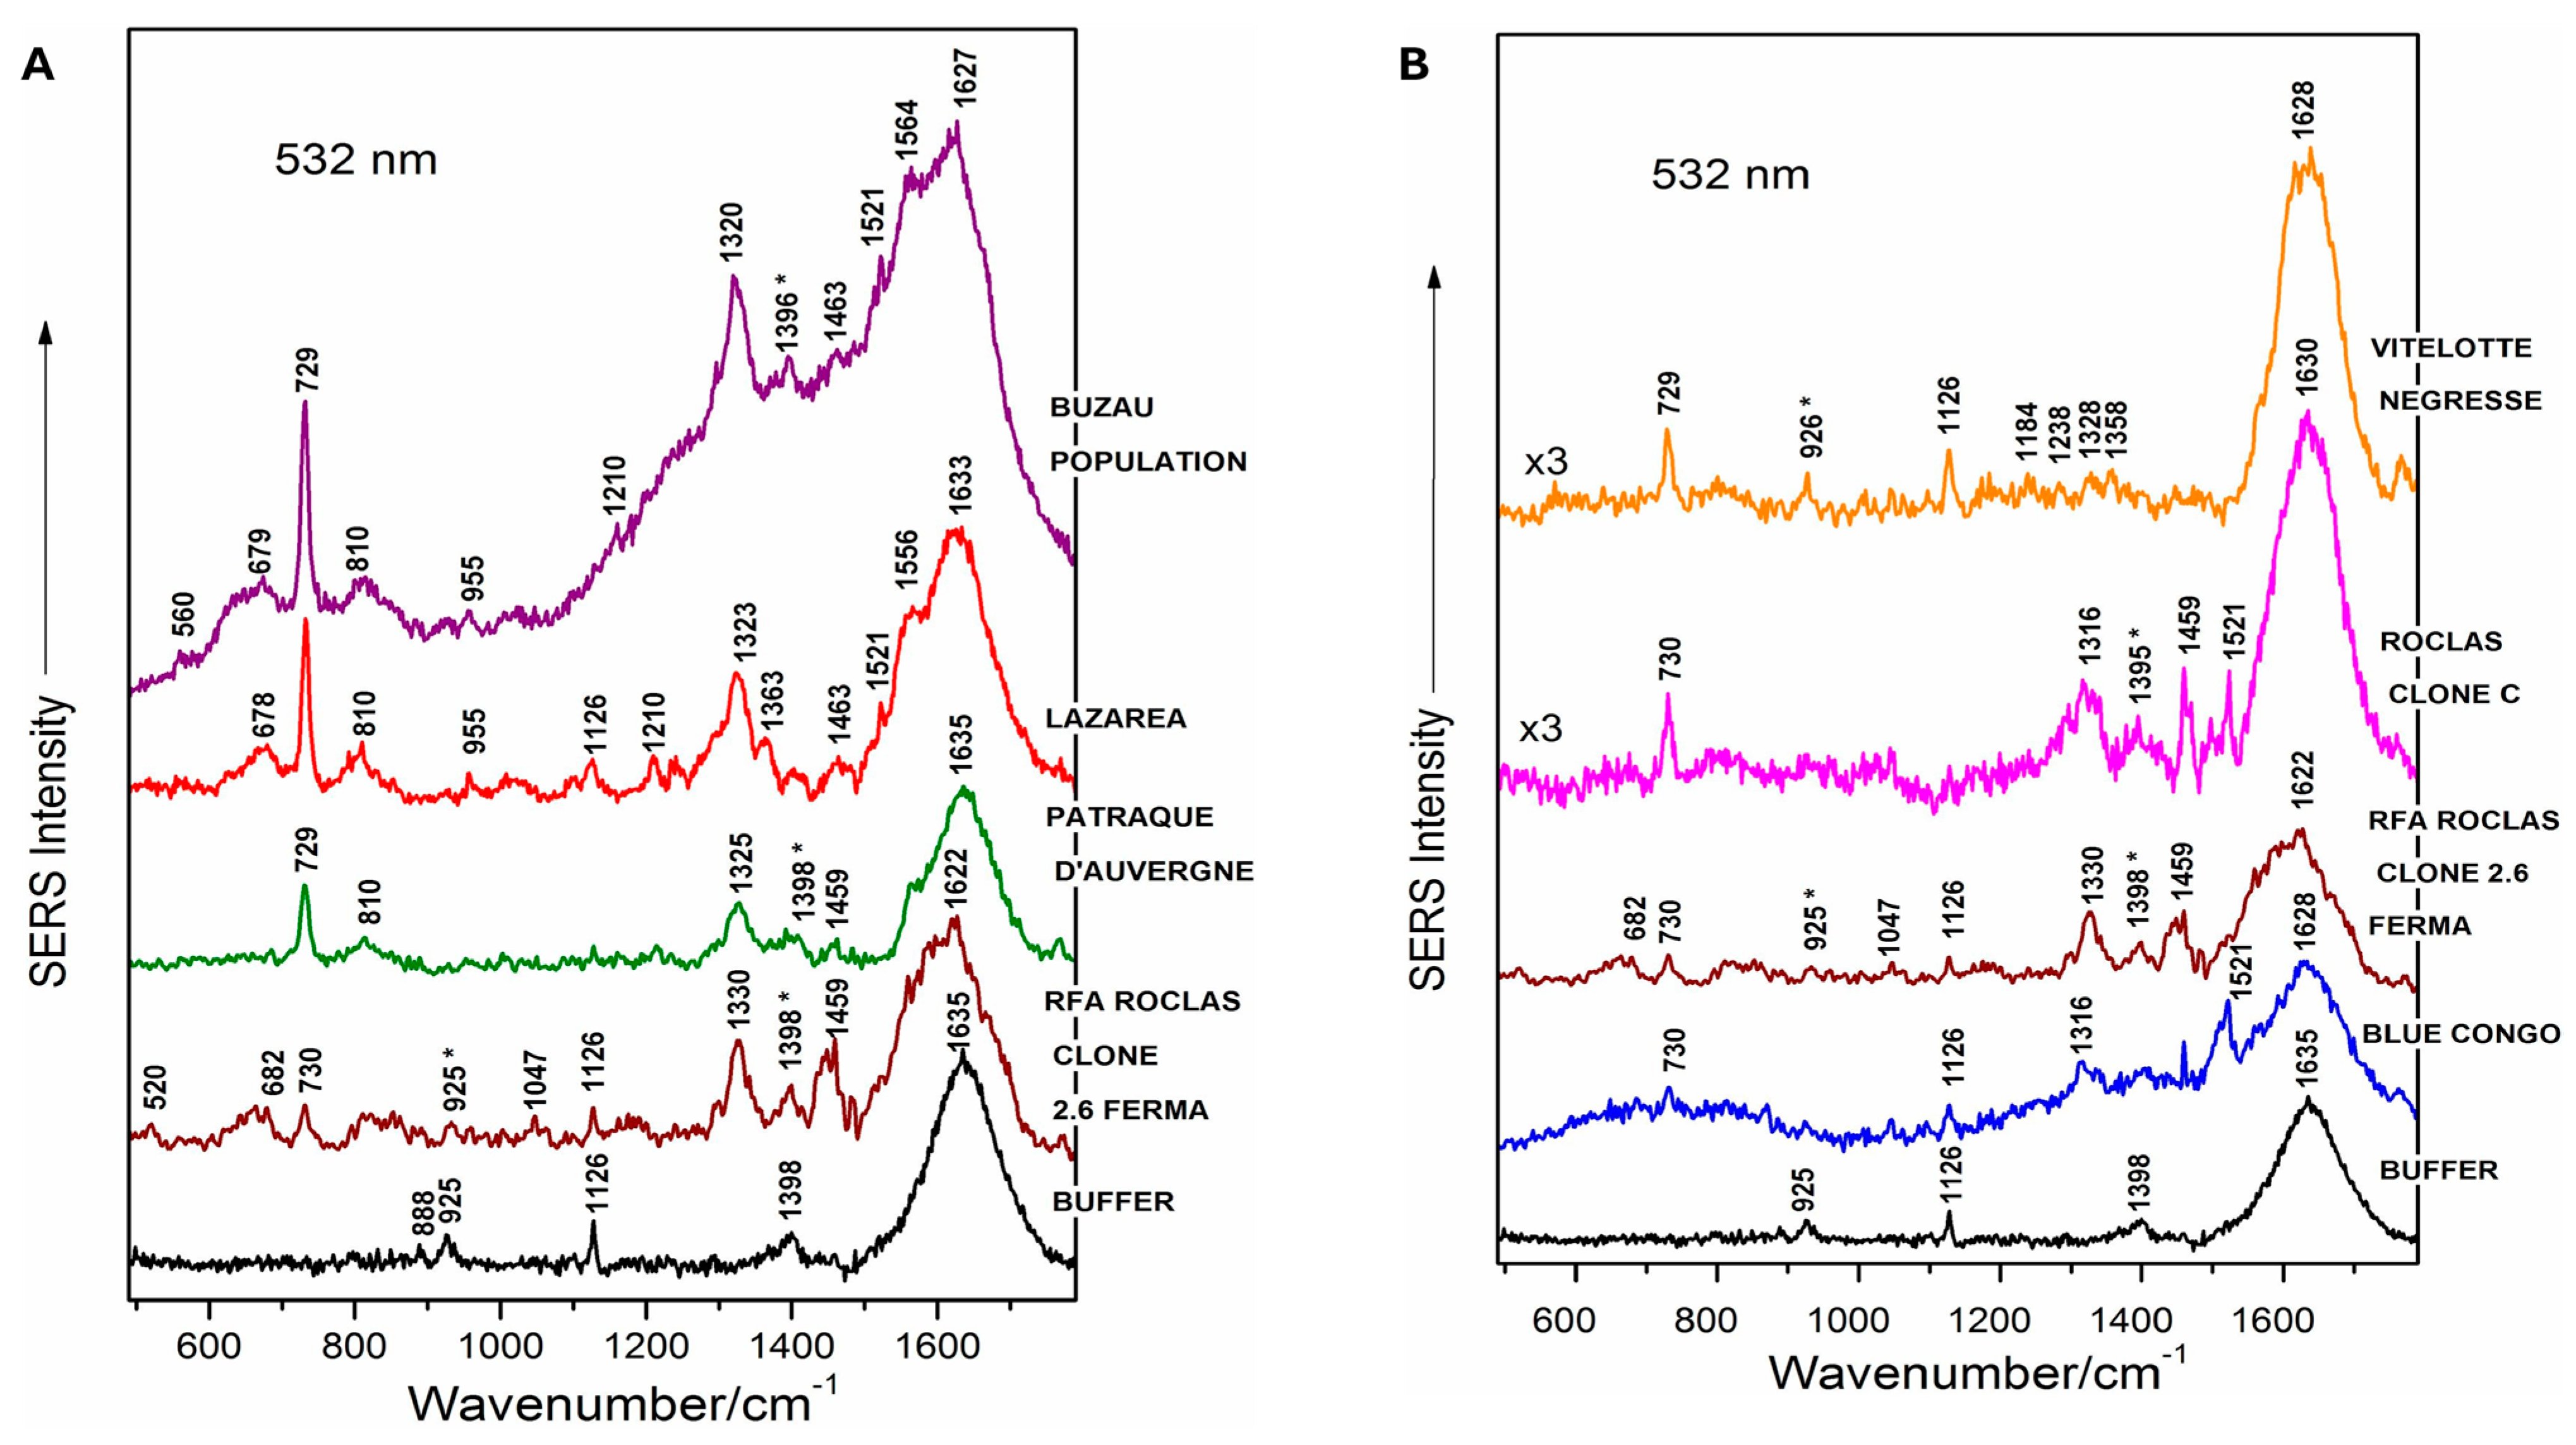
Figure 11.
(A) SERS spectra of five genomic DNAs isolated from leaves of in vitro-grown tomato cultivars (Siriana, Darsirius, Kristin, Pontica and Capriciu) in non-cryopreserved controls, as labeled in the figure. Bottom, Raman spectrum of the silver colloid and buffer (blank spectrum). (B) SERS spectra of genomic DNA isolated from leaves of tomato cultivar Siriana, in a non-cryopreserved control plant and after liquid nitrogen treatment. (C) SERS spectra of genomic DNA isolated from leaves of tomato cultivar Darsirius, in a non-cryopreserved control plant and after the cryopreservation process. (D) SERS spectra of genomic DNA isolated from leaves of tomato cultivar Kristin, in a non-cryopreserved control plant and after liquid nitrogen treatment [126].
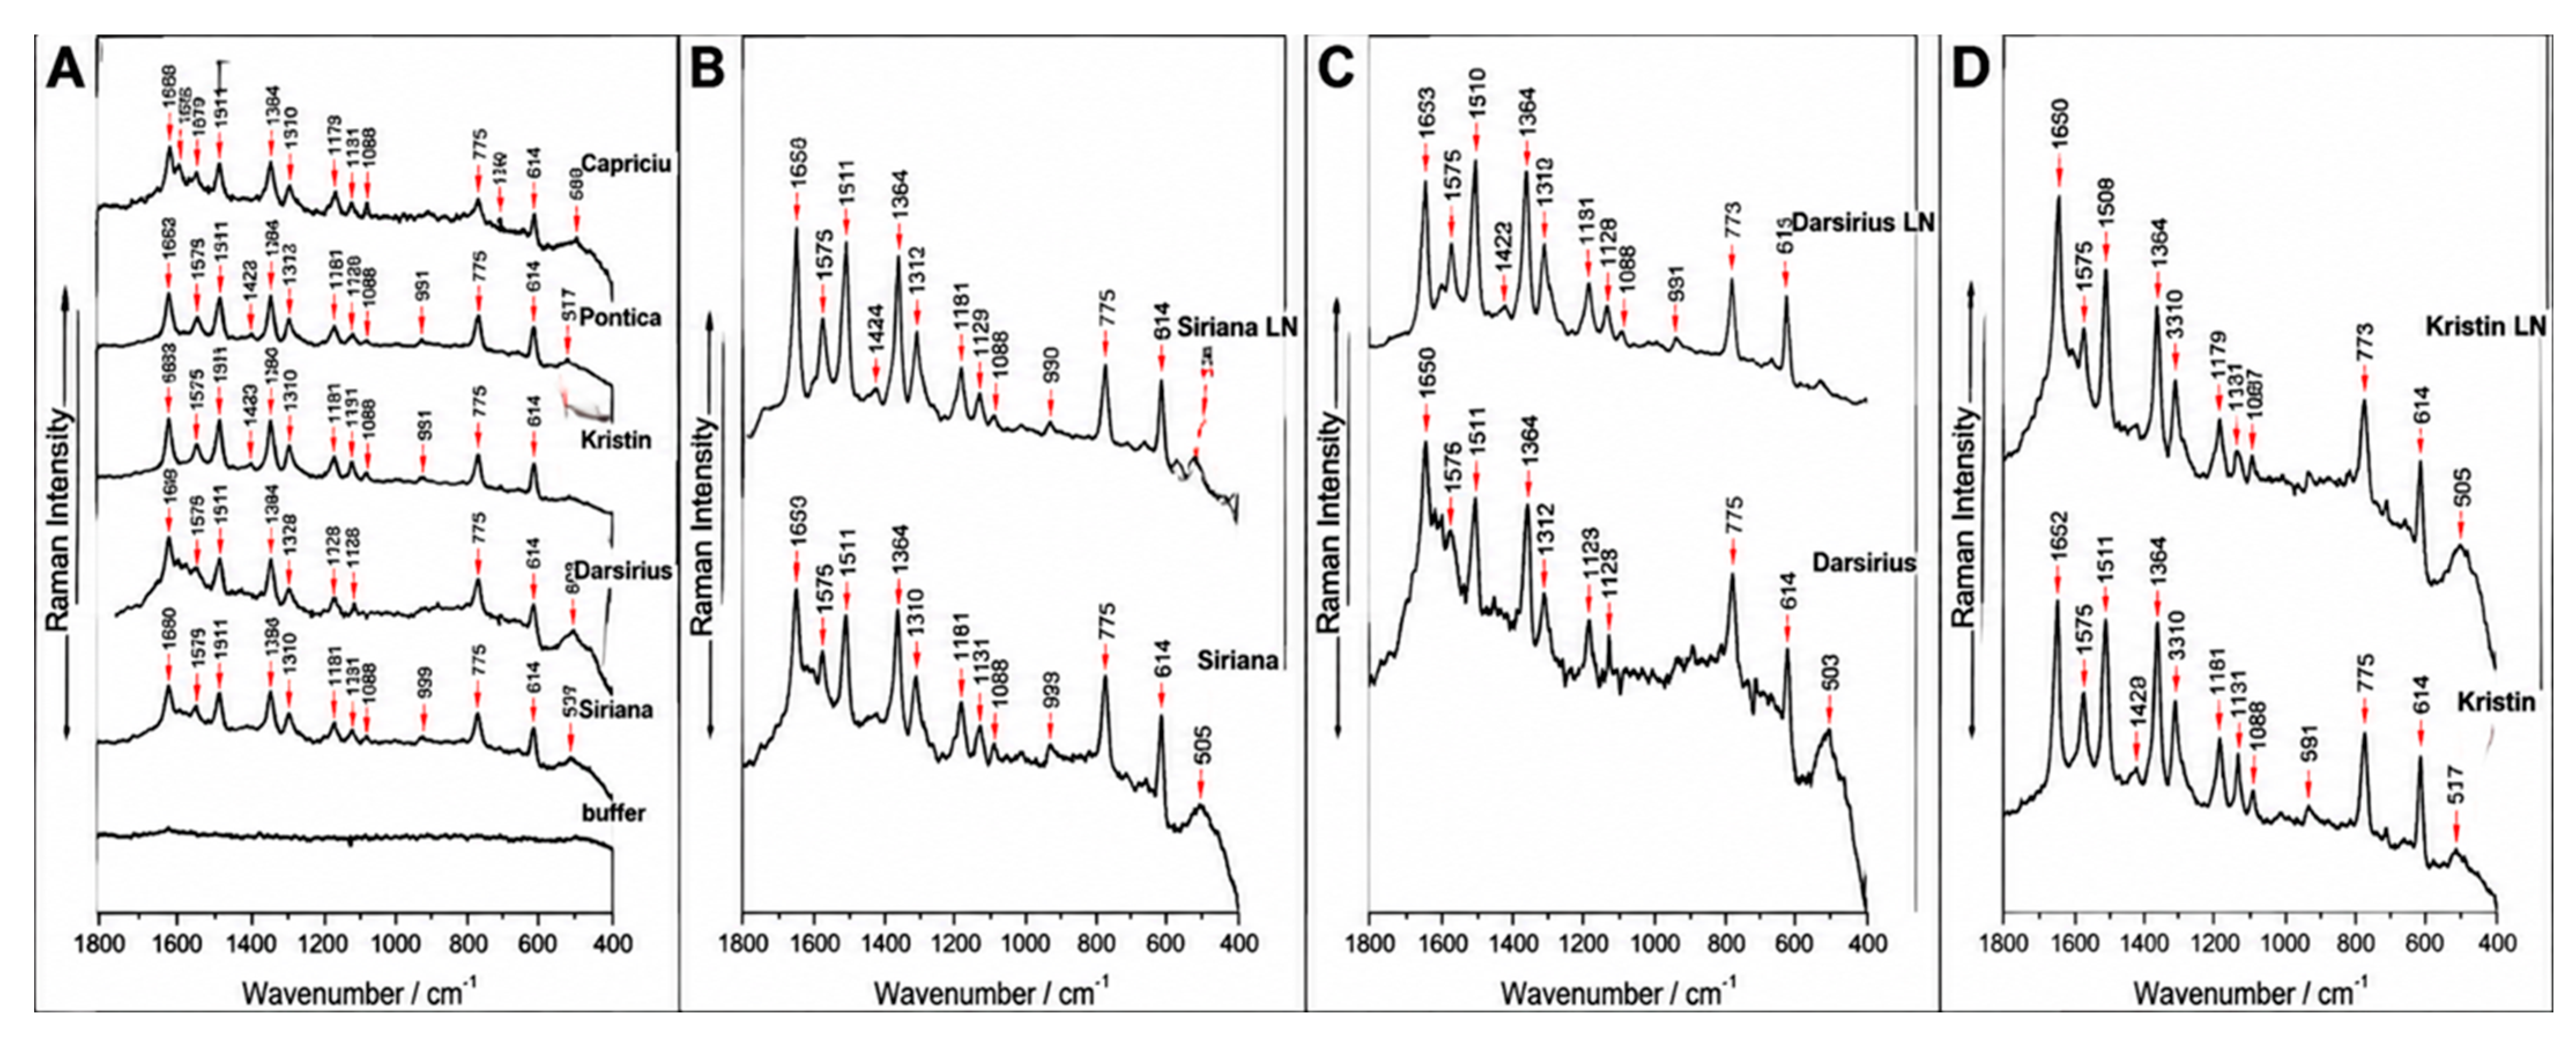
Figure 12.
Representative SERS workflow for methylation-related biosensing and potential translation to plant tissue-culture samples.
6. Challenges and Limitations
A key challenge in this field is integrating SERS-based DNA methylation detection into practical plant tissue culture workflows. The first limitation stems from the nature of the samples themselves. Plant tissue culture materials rarely match the consistency of purified DNA standards or uncontaminated biomedical samples. DNA yields are often minimal, fragmentation levels can vary among explants, calli, embryogenic tissues, and regenerants, and co-extracted substances such as polysaccharides, phenolics, pigments, salts, and residual culture media can disrupt nanoparticle aggregation, DNA adsorption geometry, and spectral background signals. Additionally, methylation reprogramming during tissue culture is inherently dynamic, with various culture stages, regeneration pathways, and genotypes showing distinct methylation patterns. This is especially pertinent in plants, where methylation occurs across CG, CHG, and CHH sequence contexts, rather than being primarily restricted to CpG sites. Recent findings show that even advanced nanopore platforms struggle to accurately detect CHH methylation across species, underscoring the ongoing difficulty of developing calibration models for plant systems [32,128,129].
Therefore, any SERS platform for plant tissue culture must address not only ultra-trace methylation signals but also sample heterogeneity, plant-specific matrix interference, and context-dependent methylation architecture.
A second significant constraint stems from the SERS methodology itself. Label-free methylation assays have shown that SERS can directly detect methylated DNA, for example, by using zirconium-modified silver nanoparticles to capture DNA base fingerprints and identify subtle methylation changes [38]. However, these assays are highly sensitive to variations in substrate reproducibility, hotspot distribution, ionic strength, and DNA conformation. The greatest sensitivity improvements often arise from colloidal aggregation or tightly coupled nanostructures, but these features tend to compromise repeatability and quantitative accuracy. More broadly, recent reviews of SERS microdevices and nucleic-acid-mediated SERS biosensors show that successful application depends on integrating reproducible substrates, assay chemistry, sample preparation, portable readers, and robust spectral analysis into a single workflow. For plant tissue culture, this integration is even more critical, as no standardized pipeline currently links DNA extraction, sample cleanup, substrate selection, hotspot engineering, spectral preprocessing, and external validation against bisulfite sequencing or long-read methylation references. As a result, the main bottleneck in the field is not the lack of SERS sensitivity, but rather the absence of a plant-validated, reproducible, and quantitatively benchmarked analytical workflow.
A further plant-specific limitation concerns methylation-context resolution. The vibrational fingerprint of 5-methylcytosine is identical regardless of whether it occurs in a CG, CHG, or CHH context. In plants, however, these contexts have distinct biological functions: CG methylation is primarily maintained by MET1 and is associated with gene-body methylation; CHG methylation is maintained by CMT3 and linked to transposable element silencing; and CHH methylation is established de novo by DRM2 and CMT2 and is particularly dynamic during tissue culture and stress responses. Standard label-free SERS cannot distinguish among these contexts, meaning that a global “methylation increase” signal could originate from any or all of them. This is especially problematic because tissue-culture-induced epigenetic changes often disproportionately affect CH contexts. To address this issue, future plant-oriented SERS assays will need to incorporate sequence-specific probes, such as locked nucleic acids or peptide nucleic acids, or be combined with methylation-sensitive restriction enzymes that selectively cleave unmethylated DNA at defined contexts. No such context-resolving SERS assay has yet been demonstrated in plants, and this remains a critical gap.
Successful SERS-based DNA methylation analysis requires highly purified genomic DNA because all molecules interacting with plasmonic nanostructures contribute to the Raman signal. Unlike synthetic DNA models, plant tissue culture-derived DNA contains polysaccharides, polyphenols, pigments, proteins, salts, and secondary metabolites that may compete for adsorption sites, generate spectral interference, influence nanoparticle behavior, and reduce methylation-related signal reproducibility. The dynamic nature of explants, callus, and regenerated tissues further affects DNA quantity and quality, requiring extraction protocols optimized specifically for SERS applications. Efficient contaminant removal through optimized lysis, precipitation, column-based purification, or magnetic cleanup is essential. DNA quality assessment using A260/A280 and A260/A230 ratios provides preliminary validation of sample purity. Future studies should incorporate standardized extraction workflows, methylated/unmethylated controls, spike-in references, and matrix-matched calibration to improve reproducibility, calibration transfer, and biological interpretation of SERS-based methylation profiles.
7. Future Perspectives and Strategies
The future of SERS likely lies in developing it as a complementary rapid-screening platform, rather than merely an alternative to sequencing technologies. In plant tissue culture, this would involve using SERS to distinguish between stable cultures and those experiencing methylation drift, identify regenerable lines versus those with regeneration challenges, and recognize transformation-derived materials that display unique epigenetic profiles, with confirmation through bisulfite or nanopore sequencing. Future research should focus on developing plant-specific spectral calibration sets from various plant tissues such as explants, calli, somatic embryos, regenerated shoots, and long-term in vitro cultures, and independently validating them against robust methylation references. These calibration sets should account for CG, CHG, and CHH methylation patterns, rather than relying on biomedical models that focus only on CpG methylation. At the substrate level, advances should focus on reproducible hotspot engineering, including nanoimprinted plasmonic crystals, organized plasmonic arrays, and DNA-templated or nucleic-acid-assisted nanostructure assembly. These platforms provide better control of signal enhancement than random colloidal aggregation, making them more suitable for quantitative analysis in plant systems [130]. Additionally, assay design should evolve to include not only label-free fingerprinting but also methods like affinity-assisted enrichment, sequence-specific hybridization, and functional nucleic acid recognition, enabling both broad methylation screening and precise targeting of regeneration-related loci.
7.1. Integration with Microfluidics, Portable Readers, and Machine Learning
An equally important future priority is integrating microdevices, portable readers, and machine learning. Recent reviews of SERS-based microdevices show that microfluidic platforms, chip-based substrates, and compact Raman systems are already moving nucleic-acid sensing beyond conventional laboratory formats [131]. At the same time, machine-learning-assisted SERS has proven valuable for extracting distributed methylation-associated features from complex spectra, rather than relying solely on single-band comparisons [39]. In plant tissue culture, this will likely be essential, as plant-derived matrices are chemically complex and many methylation-induced spectral changes are subtle. Artificial intelligence and multivariate chemometrics will therefore be needed to convert high-dimensional spectra into actionable outputs, such as tissue-culture stage, methylation stability class, or predicted somaclonal-variation risk.
7.2. A Milestone-Based Roadmap for Deployment
The performance criteria proposed in this roadmap should be considered conceptual development targets rather than established analytical standards. Future SERS-based methylation platforms should prioritize key analytical and biological performance characteristics, including high repeatability, reliable discrimination of biologically meaningful methylation differences, robust calibration transfer across substrates and instruments, and independent validation using standardized reference materials and sequencing-confirmed methylation states. These requirements require systematic benchmarking, multi-platform comparisons, and extensive biological testing across diverse plant species, genotypes, and tissue-culture stages.
Future machine-learning frameworks should incorporate rigorous spectral preprocessing, including baseline correction, normalization, noise reduction, and feature selection. Models should also account for substrate-to-substrate variability, Raman instrument differences, and batch effects. Robust evaluation should strictly separate training, validation, and independent test datasets, followed by external validation using sequencing-confirmed methylation profiles. Also, the spectrum must be split at the independent biological-sample level, not randomly at the spectrum level. Achieving transferability, reproducibility, and biologically meaningful detection capability will be essential before SERS-based methylation profiling can be considered for routine application.
7.3. Barriers to Adoption in Plant Biotechnology
Even with strong technical performance, adoption will still face nontechnical barriers. These include limited familiarity with SERS instrumentation in plant tissue-culture laboratories, the perceived complexity of substrate fabrication, the absence of regulatory or industry guidelines defining what constitutes “epigenetic stability” based on SERS output, and the need for rigorous cross-validation against established methods before broader acceptance by researchers, funding panels, and applied users. Addressing these barriers will require targeted training initiatives, low-cost substrate kits, and collaborative ring tests between nanotechnology and plant biology groups. If pursued systematically, SERS could evolve from a promising proof of concept to a practical technology for epigenetic quality control, in vitro conservation, and regeneration optimization in plant biotechnology.
8. Conclusions
In this review, we have explored the significant potential of SERS as a powerful tool for detecting DNA methylation in plant tissue cultures. By harnessing the plasmonic enhancement capabilities of nanomaterials, SERS can offer high sensitivity, rapid analysis, and monitoring of DNA methylation changes. While growing methodological literature supports its feasibility, challenges such as plant-specific matrix interference, sample heterogeneity, and substrate reproducibility still hinder widespread application in plant biotechnology.
Despite these limitations, integrating SERS with advanced computational techniques, substrate engineering, and functionalization strategies holds promise for overcoming these obstacles. Future research should focus on refining SERS systems to address plant-specific challenges and developing standardized, reproducible workflows. As SERS evolves into a robust and accessible analytical tool, it could significantly enhance quality control, clonal fidelity screening, and regeneration monitoring in plant tissue culture, advancing plant biotechnology applications.
Ultimately, SERS, with its ability to provide quick, potentially scalable epigenetic assessments, could become a valuable addition to existing plant tissue culture methodologies, bridging the gap between basic research and practical agricultural advancements. Further development of machine learning models and hybrid workflows could make SERS a practical tool for both academic research and industrial applications, fostering a new era of epigenetic analysis in plants. Therefore, SERS should currently be considered a complementary screening technology with strong future potential rather than a fully established replacement for conventional plant methylation analysis approaches.
Author Contributions
B.B.B.: Conceptualization, Validation, Writing—review and editing, Writing—original draft, Methodology. I.D.B.: Validation, Writing—review and editing, Methodology. K.N.: Supervision, Validation, Writing—review and editing. R.A.A.: Validation, Writing—review and editing. All authors have read and agreed to the published version of the manuscript.
Funding
This research received no external funding.
Data Availability Statement
No new data were created or analyzed in this study. Data sharing is not applicable to this article.
Acknowledgments
Generative AI (GPT-4) was used solely to enhance the visual quality of the graphical abstract and Figure 12. It was not used to generate or interpret scientific data, conduct the literature review, or draft the scientific content. The authors reviewed and approved the final figure.
Conflicts of Interest
Author Isaac Duah Boateng is employed by Certified Group as a scientist, and Kate Nyarko is employed by Arkema Inc. as a scientist; they declare no conflicts of interest. The remaining authors declare that the review article was conducted in the absence of any commercial or financial relationships that could be construed as a potential conflict of interest.
References
- Abdul Aziz, A.; Masmoudi, K. Molecular breakthroughs in modern plant breeding techniques. Hortic. Plant J. 2025, 11, 15–41. [Google Scholar] [CrossRef] [Scilit]
- Ugandhar, T. Advances in plant breeding: Enhancing crop productivity, resilience, and sustainability through modern techniques. Sci. Rev. Biol. 2025, 3, 1–6. [Google Scholar] [CrossRef] [Scilit]
- Neelakandan, A.K.; Wang, K. Recent progress in the understanding of tissue culture-induced genome level changes in plants and potential applications. Plant Cell Rep. 2012, 31, 597–620. [Google Scholar] [CrossRef] [Scilit] [PubMed]
- Debnath, S.C. Thidiazuron in Micropropagation of Small Fruits. In Thidiazuron: From Urea Derivative to Plant Growth Regulator; Ahmad, N., Faisal, M., Eds.; Springer: Singapore, 2018; pp. 139–158. [Google Scholar]
- Pathi, K.M.; Sprink, T. Lupins in the genome editing era: Advances in plant cell culture, double haploid technology and genetic transformation for crop improvement. Front. Plant Sci. 2025, 16, 1601216. [Google Scholar] [CrossRef] [Scilit] [PubMed]
- Larkin, P.J.; Scowcroft, W.R. Somaclonal variation—A novel source of variability from cell cultures for plant improvement. Theor. Appl. Genet. 1981, 60, 197–214. [Google Scholar] [CrossRef] [Scilit] [PubMed]
- Algopishi, U.B.; Abdelghffar, A.M.; Al Aboud, N.M.; Safhi, F.A.; Fayad, E.; Alharbi, K.; Aljwaizea, N.I.; Hassanin, A.A. The genetic applications of plant cell and tissue culture techniques: Essential tools for genetic manipulation and crop improvement. Not. Bot. Horti Agrobot. Cluj Napoca 2025, 53, 14718. [Google Scholar] [CrossRef] [Scilit]
- Mohan Jain, S. Tissue culture-derived variation in crop improvement. Euphytica 2001, 118, 153–166. [Google Scholar] [CrossRef] [Scilit]
- Muhammad, M.; Basit, A.; Ameen, N.; Khan, A.; Wahab, A.; Nazim, M.; Waheed, A.; Rajput, V.D.; Li, L. Insights into molecular and biochemical approaches of multi-stress responses to horticultural crops. Plant Growth Regul. 2025, 105, 1889–1910. [Google Scholar] [CrossRef] [Scilit]
- Springer, N.M. Epigenetics and crop improvement. Trends Genet. 2013, 29, 241–247. [Google Scholar] [CrossRef] [Scilit] [PubMed]
- Bélanger, J.G.; Copley, T.R.; Hoyos-Villegas, V.; Charron, J.B.; O’Donoughue, L. A comprehensive review of in planta stable transformation strategies. Plant Methods 2024, 20, 79, Correction in Plant Methods 2024, 20, 158. [Google Scholar] [CrossRef] [Scilit] [PubMed]
- Peredo, E.L.; Revilla, M.A.; Arroyo-García, R. Assessment of genetic and epigenetic variation in hop plants regenerated from sequential subcultures of organogenic calli. J. Plant Physiol. 2006, 163, 1071–1079. [Google Scholar] [CrossRef] [Scilit] [PubMed]
- Kaeppler, S.M.; Kaeppler, H.F.; Rhee, Y. Epigenetic aspects of somaclonal variation in plants. Plant. Mol. Biol. 2000, 43, 179–188. [Google Scholar] [CrossRef] [Scilit] [PubMed]
- Verma, S. Role of plant tissue culture and seed technology in enhancing crop resilience- A review. J. Res. Agric. Anim. Sci. 2024, 11, 18–24. [Google Scholar] [CrossRef] [Scilit]
- Lukens, L.N.; Zhan, S. The plant genome’s methylation status and response to stress: Implications for plant improvement. Curr. Opin. Plant Biol. 2007, 10, 317–322. [Google Scholar] [CrossRef] [Scilit] [PubMed]
- Sousa, B.; Soares, C.; Oliveira-Pinto, P.R.; Santos, C.; Fidalgo, F.; Lino-Neto, T. Transcriptional dynamics of tomato plants under combined heat and salt stress. Physiol. Plant 2025, 177, e70501. [Google Scholar] [CrossRef] [Scilit] [PubMed]
- Kaeppler, S.M.; Phillips, R.L. Tissue culture-induced DNA methylation variation in maize. Proc. Natl. Acad. Sci. USA 1993, 90, 8773–8776. [Google Scholar] [CrossRef] [Scilit] [PubMed]
- Chen, Z.J. Empowering plant epigenetics to breed resilience of crops: From nucleolar dominance to transgenerational epigenetic inheritance. Plant Genome 2025, 18, e70064. [Google Scholar] [CrossRef] [Scilit] [PubMed]
- Bird, A. DNA methylation patterns and epigenetic memory. Genes Dev. 2002, 16, 6–21. [Google Scholar] [CrossRef] [Scilit] [PubMed]
- Park, S.Y.; Murthy, H.N.; Chakrabarthy, D.; Paek, K.Y. detection of epigenetic variation in tissue-culture-derived plants of Doritaenopsis by methylation-sensitive amplification polymorphism (MSAP) analysis. Vitr. Cell. Dev. Biol. Plant 2009, 45, 104–108. [Google Scholar] [CrossRef] [Scilit]
- Finnegan, E.J.; Peacock, W.J.; Dennis, E.S. Reduced DNA methylation in Arabidopsis thaliana results in abnormal plant development. Proc. Natl. Acad. Sci. USA 1996, 93, 8449–8454. [Google Scholar] [CrossRef] [Scilit] [PubMed]
- Chen, Y.; Sheng, F.; Wang, X.; Zhang, Z.; Qi, S.; Chen, L. Early epigenetic responses in the genomic DNA methylation fingerprints in cells in response to sublethal exposure of silver nanoparticles. Front. Bioeng. Biotechnol. 2022, 10, 927036. [Google Scholar] [CrossRef] [Scilit] [PubMed]
- Miryeganeh, M. Epigenetic mechanisms driving adaptation in tropical and subtropical plants: Insights and future directions. Plant Cell Environ. 2025, 48, 3487–3499. [Google Scholar] [CrossRef] [Scilit] [PubMed]
- Springer, N.M.; Schmitz, R.J. Exploiting induced and natural epigenetic variation for crop improvement. Nat. Rev. Genet. 2017, 18, 563–575. [Google Scholar] [CrossRef] [Scilit] [PubMed]
- Fulneček, J.; Kovařík, A. How to interpret methylation sensitive amplified polymorphism (MSAP) profiles? BMC Genet. 2014, 15, 2. [Google Scholar] [CrossRef] [Scilit] [PubMed]
- Li, R.; Hu, F.; Li, B.; Zhang, Y.; Chen, M.; Fan, T.; Wang, T. Whole genome bisulfite sequencing methylome analysis of mulberry (Morus alba) reveals epigenome modifications in response to drought stress. Sci. Rep. 2020, 10, 8013. [Google Scholar] [CrossRef] [Scilit] [PubMed]
- Kaufmann, K.; Muino, J.M.; Østerås, M.; Farinelli, L.; Krajewski, P.; Angenent, G.C. Chromatin immunoprecipitation (ChIP) of plant transcription factors followed by sequencing (ChIP-SEQ) or hybridization to whole genome arrays (ChIP-CHIP). Nat. Protoc. 2010, 5, 457–472. [Google Scholar] [CrossRef] [Scilit] [PubMed]
- Wang, C.; Xu, J.; Zhang, D.; Wilson, Z.A.; Zhang, D. An effective approach for identification of in vivo protein-DNA binding sites from paired-end ChIP-Seq data. BMC Bioinform. 2010, 11, 81. [Google Scholar] [CrossRef] [Scilit] [PubMed]
- Vos, P.; Hogers, R.; Bleeker, M.; Reijans, M.; Lee, T.V.D.; Hornes, M.; Friters, A.; Pot, J.; Paleman, J.; Kuiper, M.; et al. AFLP: A new technique for DNA fingerprinting. Nucleic Acids Res. 1995, 23, 4407–4414. [Google Scholar] [CrossRef] [Scilit] [PubMed]
- Smýkal, P.; Valledor, L.; Rodriguez, R.; Griga, M. assessment of genetic and epigenetic stability in long-term in vitro shoot culture of pea (Pisum sativum L.). Plant Cell Rep. 2007, 26, 1985–1998. [Google Scholar] [CrossRef] [Scilit] [PubMed]
- Renau-Morata, B.; Nebauer, S.G.; Arrillaga, I.; Segura, J. Assessments of somaclonal variation in micropropagated shoots of Cedrus: Consequences of axillary bud breaking. Tree Genet. Genomes 2005, 1, 3–10. [Google Scholar] [CrossRef] [Scilit]
- Chen, H.X.; Liu, Z.D.; Bai, X.; Wu, B.; Song, R.; Yao, H.C.; Chen, Y.; Chi, W.; Hua, Q.; Cheng, L.; et al. Accurate cross-species 5mC detection for Oxford Nanopore sequencing in plants with DeepPlant. Nat. Commun. 2025, 16, 3227. [Google Scholar] [CrossRef] [Scilit] [PubMed]
- Barhoumi, A.; Halas, N.J. Detecting chemically modified DNA bases using surface-enhanced Raman spectroscopy. J. Phys. Chem. Lett. 2011, 2, 3118–3123. [Google Scholar] [CrossRef] [Scilit] [PubMed]
- Garcia-Rico, E.; Alvarez-Puebla, R.A.; Guerrini, L. Direct surface-enhanced Raman scattering (SERS) spectroscopy of nucleic acids: From fundamental studies to real-life applications. Chem. Soc. Rev. 2018, 47, 4909–4923. [Google Scholar] [CrossRef] [Scilit] [PubMed]
- Braun, G.; Lee, S.J.; Dante, M.; Nguyen, T.Q.; Moskovits, M.; Reich, N. Surface-enhanced Raman spectroscopy for DNA detection by nanoparticle assembly onto smooth metal films. J. Am. Chem. Soc. 2007, 129, 6378–6379. [Google Scholar] [CrossRef] [Scilit] [PubMed]
- Luo, X.; Xing, Y.; Galvan, D.D.; Zheng, E.; Wu, P.; Cai, C.; Yu, Q. Plasmonic gold nanohole array for surface-enhanced Raman scattering detection of DNA methylation. ACS Sens. 2019, 4, 1534–1542. [Google Scholar] [CrossRef] [Scilit] [PubMed]
- Wang, Y.; Wee, E.J.H.; Trau, M. Highly sensitive DNA methylation analysis at CpG resolution by surface-enhanced Raman scattering via ligase chain reaction. Chem. Commun. 2015, 51, 10953–10956. [Google Scholar] [CrossRef] [Scilit] [PubMed]
- Zhang, Y.; Zhan, D.S.; Xu, X.Y.; Zhang, Z.; Hafez, M.E.; He, Y.; Li, Y.; Li, D.W. Label-free detection of DNA methylation by surface-enhanced Raman spectroscopy using zirconium-modified silver nanoparticles. Talanta 2023, 253, 123941. [Google Scholar] [CrossRef] [Scilit] [PubMed]
- Lu, D.; Chen, Y.; Ke, L.; Wu, W.; Yuan, L.; Feng, S.; Huang, Z.; Lu, Y.; Wang, J. Machine learning-assisted global DNA methylation fingerprint analysis for differentiating early-stage lung cancer from benign lung diseases. Biosens. Bioelectron. 2023, 235, 115235. [Google Scholar] [CrossRef] [Scilit] [PubMed]
- Mamián-López, M.B.; Begcy, K. Plasmonics: An optical approach to study plant epigenetics. Plasmonics 2023, 19, 687–697. [Google Scholar] [CrossRef] [Scilit]
- Issatayeva, A.; Farnesi, E.; Cialla-May, D.; Schmitt, M.; Rizzi, F.M.A.; Milanese, D.; Selleri, S.; Cucinotta, A. SERS-based methods for the detection of genomic biomarkers of cancer. Talanta 2024, 267, 125198. [Google Scholar] [CrossRef] [Scilit] [PubMed]
- Wang, C.; Weng, G.; Li, J.; Zhu, J.; Zhao, J. A review of SERS coupled microfluidic platforms: From configurations to applications. Anal. Chim. Acta 2024, 1296, 342291. [Google Scholar] [CrossRef] [Scilit] [PubMed]
- Michałowska, A.; Kudelski, A. Applications of surface enhanced Raman scattering (SERS) spectroscopy for detection of nucleic acids. Nanophotonics 2024, 13, 4577–4603. [Google Scholar] [CrossRef] [Scilit]
- Alom, K.M.; Tukova, A.; Lyu, N.; Rodger, A.; Wang, Y. Label-free surface-enhanced Raman scattering for genomic DNA cytosine methylation reading. Molecules 2025, 30, 403. [Google Scholar] [CrossRef] [Scilit] [PubMed]
- Michałowska, A.; Weyher, J.L.; Kudelski, A. Immobilization of DNA on nanostructured gold and silver substrates via alkanethiolate linkers: The influence of linker length. Spectrochim. Acta Part A Mol. Biomol. Spectrosc. 2025, 340, 126344. [Google Scholar] [CrossRef] [Scilit] [PubMed]
- Al Samir, E.A.; Albandar, I.; Kadhim, M.; Al Samir, S. The role of nanotechnology in the control of bacterial contamination in plant tissue culture: A review. Al Kunooze Sci. J. 2026, 12, 61–74. [Google Scholar] [CrossRef] [Scilit]
- Nguyen, H.A.; Nga, D.T.N.; Cuong, T.D.; Quan Doan, M.; Le, A.T. Advances in surface-enhanced Raman scattering applications for precision agriculture: Monitoring plant health and crop quality. RSC Adv. 2025, 15, 49320–49352. [Google Scholar] [CrossRef] [Scilit] [PubMed]
- Ren, X.; Lin, Y.; Campbell, C.; Weng, B.; Kotsifaki, D.G. From spectroscopy to nanophotonics: Eutting-edge optical methods in plant disease detection. Plant Pathol. 2026, 75, e70110. [Google Scholar] [CrossRef] [Scilit]
- He, W.; Huang, W.; Zhang, L.; Han, T.; Cheng, Y.; Rao, Y.; Guo, C.; Guo, M.; Lai, W. DNA nanotechnology in surface-enhanced Raman scattering: Precision engineering, dynamic biosensing, and future horizons. Anal. Sens. 2026, 6, e202500151. [Google Scholar] [CrossRef] [Scilit]
- Shi, L.; Liu, Y.; Li, X.; Zhang, H.; Wang, Z.; He, S.; Fan, D.; Huang, X.; Zi, Y.; Han, Y.; et al. Advances in functional nucleic acid SERS sensing strategies. ACS Sens. 2025, 10, 1579–1599. [Google Scholar] [CrossRef] [Scilit] [PubMed]
- Zou, A.; Zhu, X.; Fu, R.; Wang, Z.; Wang, Y.; Ruan, Z.; Xianyu, Y.; Zhang, J. Harnessing nanomaterials for next-generation DNA methylation biosensors. Small 2025, 21, 2408246. [Google Scholar] [CrossRef] [Scilit] [PubMed]
- Hoang, V.-T.; Tufa, L.T.; Lee, J.; Doan, M.Q.; Anh, N.H.; Tran, V.T.; Le, A.T. Tunable SERS activity of Ag@Fe3O4 core-shell nanoparticles: Effect of shell thickness on the sensing performance. J. Alloys Compd. 2023, 933, 167649. [Google Scholar] [CrossRef] [Scilit]
- Li, M.; Cushing, S.K.; Wu, N. Plasmon-enhanced optical sensors: A review. Analyst 2015, 140, 386–406. [Google Scholar] [CrossRef] [Scilit] [PubMed]
- Schlücker, S. Surface-enhanced Raman spectroscopy: Concepts and chemical applications. Angew. Chem. Int. Ed. Engl. 2014, 53, 4756–4795. [Google Scholar] [CrossRef] [Scilit] [PubMed]
- Hao, E.; Schatz, G.C. Electromagnetic fields around silver nanoparticles and dimers. J. Chem. Phys. 2004, 120, 357–366. [Google Scholar] [CrossRef] [Scilit] [PubMed]
- Fang, Y.; Seong, N.-H.; Dlott, D. Measurement of the Distribution of Site Enhancements in Surface-Enhanced Raman Scattering. Science 2008, 321, 388–392. [Google Scholar] [CrossRef] [Scilit] [PubMed]
- Ansar, S.M.; Li, X.; Zou, S.; Zhang, D. Quantitative Comparison of Raman Activities, SERS Activities, and SERS Enhancement Factors of Organothiols: Implication to Chemical Enhancement. J. Phys. Chem. Lett. 2012, 3, 560–565. [Google Scholar] [CrossRef] [Scilit] [PubMed]
- Zong, C.; Xu, M.; Xu, L.J.; Wei, T.; Ma, X.; Zheng, X.S.; Hu, R.; Ren, B. Surface-Enhanced Raman Spectroscopy for Bioanalysis: Reliability and Challenges. Chem. Rev. 2018, 118, 4946–4980. [Google Scholar] [CrossRef] [Scilit] [PubMed]
- Cortés, E.; Etchegoin, P.G.; Le Ru, E.C.; Fainstein, A.; Vela, M.E.; Salvarezza, R.C. Strong Correlation between Molecular Configurations and Charge-Transfer Processes Probed at the Single-Molecule Level by Surface-Enhanced Raman Scattering. J. Am. Chem. Soc. 2013, 135, 2809–2815. [Google Scholar] [CrossRef] [Scilit] [PubMed]
- Masango, S.S.; Hackler, R.A.; Large, N.; Henry, A.I.; McAnally, M.O.; Schatz, G.C.; Stair, P.C.; Van Duyne, R.P. High-Resolution Distance Dependence Study of Surface-Enhanced Raman Scattering Enabled by Atomic Layer Deposition. Nano Lett. 2016, 16, 4251–4259. [Google Scholar] [CrossRef] [Scilit] [PubMed]
- Kuttner, C.; Mayer, M.; Dulle, M.; Moscoso, A.; López-Romero, J.M.; Förster, S.; Fery, A.; Pérez-Juste, J.; Contreras-Cáceres, R. Seeded Growth Synthesis of Gold Nanotriangles: Size Control, SAXS Analysis, and SERS Performance. ACS Appl. Mater. Interfaces 2018, 10, 11152–11163. [Google Scholar] [CrossRef] [Scilit] [PubMed]
- Navarro, J.R.; Manchon, D.; Lerouge, F.; Blanchard, N.P.; Marotte, S.; Leverrier, Y.; Marvel, J.; Chaput, F.; Micouin, G.; Gabudean, A.M.; et al. Synthesis of PEGylated gold nanostars and bipyramids for intracellular uptake Synthesis of PEGylated gold nanostars and bipyramids for intracellular uptake. Nanotechnology 2012, 23, 465602. [Google Scholar] [CrossRef] [Scilit] [PubMed]
- Ziegler, C.; Eychmüller, A. Seeded Growth Synthesis of Uniform Gold. Nanoparticles with Diameters of 15–300 nm. J. Phys. Chem. C 2011, 115, 4502–4506. [Google Scholar] [CrossRef] [Scilit]
- Butmee, P.; Samphao, A.; Tumcharern, G. Reduced graphene oxide on silver nanoparticle layers-decorated titanium dioxide nanotube arrays as SERS-based sensor for glyphosate direct detection in environmental water and soil. J. Hazard. Mater. 2022, 437, 129344. [Google Scholar] [CrossRef] [Scilit] [PubMed]
- Columbus, S.; Hammouche, J.; Ramachandran, K.; Daoudi, K.; Gaidi, M. Assessing the efficiency of photocatalytic removal of alizarin red using copper doped zinc oxide nanostructures by combining SERS optical detection. J. Photochem. Photobiol. A Chem. 2022, 432, 114123. [Google Scholar] [CrossRef] [Scilit]
- Ren, W.; Fang, Y.; Wang, E. A Binary Functional Substrate for Enrichment and Ultrasensitive SERS Spectroscopic Detection of Folic Acid Using Graphene Oxide/Ag Nanoparticle Hybrids. ACS Nano 2011, 5, 6425–6433. [Google Scholar] [CrossRef] [Scilit] [PubMed]
- Zhai, W.-L.; Li, D.W.; Qu, L.L.; Fossey, J.S.; Long, Y.T. Multiple depositions of Ag nanoparticles on chemically modified agarose films for surface-enhanced Raman spectroscopy. Nanoscale 2012, 4, 137–142. [Google Scholar] [CrossRef] [Scilit] [PubMed]
- Zhai, J.; Wang, Y.; Zhai, Y.; Dong, S. Rapid fabrication of Au nanoparticle films with the aid of centrifugal force. Nanotechnology 2009, 20, 055609. [Google Scholar] [CrossRef] [Scilit] [PubMed]
- Fan, M.; Andrade, G.F.S.; Brolo, A.G. A review on the fabrication of substrates for surface enhanced Raman spectroscopy and their applications in analytical chemistry. Anal. Chim. Acta 2011, 693, 7–25. [Google Scholar] [CrossRef] [Scilit] [PubMed]
- Toderas, F.; Baia, M.; Baia, L.; Astilean, S. Controlling gold nanoparticle assemblies for efficient surface-enhanced Raman scattering and localized surface plasmon resonance sensors. Nanotechnology 2007, 18, 255702. [Google Scholar] [CrossRef] [Scilit]
- Liu, X.; Astruc, D. From Galvanic to Anti-Galvanic Synthesis of Bimetallic Nanoparticles and Applications in Catalysis, Sensing, and Materials Science. Adv. Mater. 2017, 29, 1605305. [Google Scholar] [CrossRef] [Scilit] [PubMed]
- Zangana, S.; Veres, M.; Bonyár, A. Surface-enhanced Raman spectroscopy (SERS)-based sensors for Deoxyribonucleic Acid (DNA) detection. Molecules 2024, 29, 3338. [Google Scholar] [CrossRef] [Scilit] [PubMed]
- Zhang, C.; Huang, H.; Wang, X.; Zhang, Y.; Sun, W.; Liu, Q.; Zhou, X.; Xu, W.; Luo, Y.; Huang, K.; et al. Zwitterions modified biosensors improve detection performance in complex food matrices. Trends Food Sci. Technol. 2024, 145, 104374. [Google Scholar] [CrossRef] [Scilit]
- Gu, Y.; Wu, S.; Luo, Z.; Lin, L.L.; Ye, J. Oppositely-charged silver nanoparticles enable selective SERS molecular enhancement through electrostatic interactions. Spectrochim. Acta A Mol. Biomol. Spectrosc. 2024, 322, 124852. [Google Scholar] [CrossRef] [Scilit] [PubMed]
- Ranishenka, B.V.; Panarin, A.Y.; Chelnokova, I.A.; Terekhov, S.N.; Mojzes, P.; Shmanai, V.V. modification of a SERS-active Ag surface to promote adsorption of charged analytes: Effect of Cu2+ ions. Beilstein J. Nanotechnol. 2021, 12, 902–912. [Google Scholar] [CrossRef] [Scilit] [PubMed]
- Hahm, E.; Jeong, D.; Cha, M.G.; Choi, J.M.; Pham, X.H.; Kim, H.M.; Kim, H.; Lee, Y.S.; Jeong, D.H.; Jung, S.; et al. β-CD Dimer-immobilized Ag assembly embedded silica nanoparticles for sensitive detection of polycyclic aromatic hydrocarbons. Sci. Rep. 2016, 6, 26082. [Google Scholar] [CrossRef] [Scilit] [PubMed]
- Chio, W.-I.K.; Moorthy, S.; Perumal, J.; Us, D.; Parkin, I.P.; Olivo, M.; Lee, T.C. Dual-triggered nanoaggregates of cucurbit [7] uril and gold nanoparticles for multi-spectroscopic quantification of creatinine in urinalysis. J. Mater. Chem. C 2020, 8, 7051–7058. [Google Scholar] [CrossRef] [Scilit]
- Hu, W.; Xia, L.; Hu, Y.; Li, G. Calixarene-based magnetic nanosponge decorating AgNPs for rapid and selective surface-enhanced Raman scattering analysis in complex samples. Anal. Chem. 2025, 97, 1347–1356. [Google Scholar] [CrossRef] [Scilit] [PubMed]
- Zhang, J.; Qi, P.; Xiao, L.; Yuan, M.; Chuan, J.; Zeng, Y.; Lin, L.-M.; Gu, Y.; Zhang, Y.; Liao, D.-F.; et al. Adapter-dependent Adapter Methylation Assay. arXiv 2024, arXiv:2410.04137. [Google Scholar]
- Guerrini, L.; Krpetić, Ž.; van Lierop, D.; Alvarez-Puebla, R.A.; Graham, D. Direct surface-enhanced Raman scattering analysis of DNA duplexes. Angew. Chem. Int. Ed. 2015, 54, 1144–1148. [Google Scholar] [CrossRef] [Scilit] [PubMed]
- Xing, X.; Zhao, Y.; Zhao, H.; Zhang, Y.; Chen, Z.; Liu, B.; Ren, B. Label-free detection of DNA base mutation and hybridized DNA by an electrostatically modified 3D plasmonic array. ACS Sens. 2024, 9, 4119–4126. [Google Scholar] [CrossRef] [Scilit] [PubMed]
- Chen, H.; Shao, L.; Li, Q.; Wang, J. Gold. nanorods and their plasmonic properties. Chem. Soc. Rev. 2013, 42, 2679–2724. [Google Scholar] [CrossRef] [Scilit] [PubMed]
- Kawasaki, D.; Nishitsuji, R.; Endo, T. Nanoimprinted plasmonic crystals for cost-effective SERS identification of methylated DNAs. Sensors 2024, 24, 4599. [Google Scholar] [CrossRef] [Scilit] [PubMed]
- Zheng, L.; Hu, F.; Zhao, Y.; Zhu, J.; Wang, X.; Su, M.; Liu, H. Core–satellite nanoassemblies as SPR/SERS dual-mode plasmonic sensors for sensitively detecting ractopamine in complex media. J. Agric. Food Chem. 2023, 71, 20793–20800. [Google Scholar] [CrossRef] [Scilit] [PubMed]
- Suster, M.C.; Szymańska, A.; Antosiewicz, T.J.; Królikowska, A.; Wróbel, P. Nanogap-engineered core-shell-like nanostructures for comprehensive SERS analysis. ACS Appl. Mater. Interfaces 2025, 17, 23076–23093. [Google Scholar] [CrossRef] [Scilit] [PubMed]
- Kühler, P.; Roller, E.M.; Schreiber, R.; Liedl, T.; Lohmüller, T.; Feldmann, J. Plasmonic DNA-origami nanoantennas for surface-enhanced Raman spectroscopy. Nano Lett. 2014, 14, 2914–2919. [Google Scholar] [CrossRef] [Scilit] [PubMed]
- Kim, M.; Ko, S.M.; Kim, J.M.; Son, J.; Lee, C.; Rhim, W.K.; Nam, J.M. Dealloyed intra-nanogap particles with highly robust, quantifiable surface-enhanced Raman scattering signals for biosensing and bioimaging applications. ACS Cent. Sci. 2018, 4, 277–287. [Google Scholar] [CrossRef] [Scilit] [PubMed]
- Han, Q.; Zhang, C.; Gao, W.; Han, Z.; Liu, T.; Li, C.; Wang, Z.; He, E.; Zheng, H. Ag-Au alloy nanoparticles: Synthesis and in situ monitoring SERS of plasmonic catalysis. Sens. Actuators B Chem. 2016, 231, 609–614. [Google Scholar] [CrossRef] [Scilit]
- Bell, S.E.J.; Sirimuthu, N.M.S. Surface-enhanced Raman spectroscopy (SERS) for sub-micromolar detection of DNA/RNA mononucleotides. J. Am. Chem. Soc. 2006, 128, 15580–15581. [Google Scholar] [CrossRef] [Scilit] [PubMed]
- Papadopoulou, E.; Bell, S.E.J. Label-free detection of single-base mismatches in DNA by surface-enhanced Raman spectroscopy. Angew. Chem. Int. Ed. 2011, 50, 9058–9061. [Google Scholar] [CrossRef] [Scilit] [PubMed]
- Madzharova, F.; Heiner, Z.; Gühlke, M.; Kneipp, J. Surface-enhanced hyper Raman spectra of adenine, guanine, cytosine, thymine, and uracil. J. Phys. Chem. C 2016, 120, 15415–15423. [Google Scholar] [CrossRef] [Scilit] [PubMed]
- Crawford, B.M.; Strobbia, P.; Wang, H.N.; Zentella, R.; Boyanov, M.I.; Pei, Z.M.; Sun, T.P.; Kemner, K.M.; Vo-Dinh, T. Plasmonic nanoprobes for in vivo multimodal sensing and bioimaging of MicroRNA within plants. ACS Appl. Mater. Interfaces 2019, 11, 7743–7754. [Google Scholar] [CrossRef] [Scilit] [PubMed]
- Son, W.K.; Choi, Y.S.; Han, Y.W.; Shin, D.W.; Min, K.; Shin, J.; Lee, M.J.; Son, H.; Jeong, D.H.; Kwak, S.Y. In vivo surface-enhanced Raman scattering nanosensor for the real-time monitoring of multiple stress signalling molecules in plants. Nat. Nanotechnol. 2023, 18, 205–216. [Google Scholar] [CrossRef] [Scilit] [PubMed]
- Zhang, H.; Lang, Z.; Zhu, J.-K. Dynamics and function of DNA methylation in plants. Nat. Rev. Mol. Cell Biol. 2018, 19, 489–506. [Google Scholar] [CrossRef] [Scilit] [PubMed]
- Iancu, S.D.; Moisoiu, V.; Tigu, B.A.; Stefancu, A.; Biro, O.M.; Tomuleasa, C.; Leopold, N. SERS-based detection of DNA methylation for cancer diagnosis: Cation-mediated adsorption to silver nanoparticles. PLoS ONE 2025, 20, e0325539. [Google Scholar] [CrossRef] [Scilit] [PubMed]
- Alom, K.M.; Tukova, A.; Lyu, N.; Rodger, A.; Wang, Y. Surface-enhanced Raman scattering for DNA methylation analysis: Advances and strategies. ACS Appl. Mater. Interfaces 2026, 18, 17377–17397. [Google Scholar] [CrossRef] [Scilit] [PubMed]
- Zhang, D.; Zhang, D.; Zhang, Y.; Li, G.; Sun, D.; Zhou, B.; Li, J. Insights into the epigenetic basis of plant salt tolerance. Int. J. Mol. Sci. 2024, 25, 11698. [Google Scholar] [CrossRef] [Scilit] [PubMed]
- Talarico, E.; Greco, E.; Guarasci, F.; Araniti, F.; Chiappetta, A.; Bruno, L. Epigenetic regulation of salt stress responses in rice: Mechanisms and prospects for enhancing tolerance. Epigenomes 2025, 9, 46. [Google Scholar] [CrossRef] [Scilit] [PubMed]
- Avni, A.; Joshi, A.; Walimbe, A.; Pattanashetty, S.G.; Mukhopadhyay, S. Single-droplet surface-enhanced Raman scattering decodes the molecular determinants of liquid-liquid phase separation. Nat. Commun. 2022, 13, 4378. [Google Scholar] [CrossRef] [Scilit] [PubMed]
- Dabodiya, T.S.; Sontti, S.G.; Wei, Z.; Lu, Q.; Billet, R.; Murugan, A.V.; Zhang, X. Ultrasensitive surface-enhanced Raman spectroscopy detection by porous silver supraparticles from self–lubricating drop evaporation. Adv. Mater. Interfaces 2022, 9, 2201998. [Google Scholar] [CrossRef] [Scilit]
- Ge, K.; Hu, Y.; Li, G. Recent progress on solid substrates for surface-enhanced Raman spectroscopy analysis. Biosensors 2022, 12, 941. [Google Scholar] [CrossRef] [Scilit] [PubMed]
- Azziz, A.; Edely, M.; Liu, Q.; Majdinasab, M.; Arib, C.; Xiang, Y.; Fu, W.; de la Chapelle, M.L. Study of the DNA structure and orientation using SERS: Influence of the hybridisation and mismatches. Int. J. Biol. Macromol. 2025, 307, 141859. [Google Scholar] [CrossRef] [Scilit] [PubMed]
- Xu, L.-J.; Lei, Z.C.; Li, J.; Zong, C.; Yang, C.J.; Ren, B. Label-free surface-enhanced Raman spectroscopy detection of DNA with single-base sensitivity. J. Am. Chem. Soc. 2015, 137, 5149–5154. [Google Scholar] [CrossRef] [Scilit] [PubMed]
- Li, X.; Yang, T.; Li, C.S.; Song, Y.; Wang, D.; Jin, L.; Lou, H.; Li, W. Polymerase chain reaction—Surface-enhanced Raman spectroscopy (PCR-SERS) method for gene methylation level detection in plasma. Theranostics 2020, 10, 898–909. [Google Scholar] [CrossRef] [Scilit] [PubMed]
- Pérez-Jiménez, A.I.; Lyu, D.; Lu, Z.; Liu, G.; Ren, B. Surface-enhanced Raman spectroscopy: Benefits, trade-offs and future developments. Chem. Sci. 2020, 11, 4563–4577. [Google Scholar] [CrossRef] [Scilit] [PubMed]
- Lucena-Aguilar, G.; Sánchez-López, A.M.; Barberán-Aceituno, C.; Carrillo-Ávila, J.A.; López-Guerrero, J.A.; Aguilar-Quesada, R. DNA source selection for downstream applications based on DNA quality indicators analysis. Biopreservation Biobanking 2016, 14, 264–270. [Google Scholar] [CrossRef] [Scilit] [PubMed]
- Li, Y.; Tollefsbol, T.O. DNA methylation detection: Bisulfite genomic sequencing analysis. In Epigenetics Protocols; Tollefsbol, T.O., Ed.; Humana Press: Totowa, NJ, USA, 2011; pp. 11–21. [Google Scholar]
- Li, L.; Lim, S.F.; Puretzky, A.; Riehn, R.; Hallen, H.D. DNA methylation detection using resonance and Nanobowtie-antenna-enhanced Raman spectroscopy. Biophys. J. 2018, 114, 2498–2506. [Google Scholar] [CrossRef] [Scilit] [PubMed]
- Xie, Y.; Chen, M.; Liu, X.; Su, X.; Li, M. Artificial intelligence-assisted label-free spectroscopic quantification of global DNA cytosine methylation in a miniature plasmonic pickering emulsion. Adv. Funct. Mater. 2023, 33, 2307091. [Google Scholar] [CrossRef] [Scilit]
- Xie, Y.; Tian, W.; Zheng, C.; Li, M. Quantitative label-free surface-enhanced Raman spectroscopic transcriptome-wide profiling of RNA adenosine methylation. Adv. Funct. Mater. 2026, 36, e70661. [Google Scholar] [CrossRef] [Scilit]
- Sina, A.A.I.; Carrascosa, L.G.; Liang, Z.; Grewal, Y.S.; Wardiana, A.; Shiddiky, M.J.; Gardiner, R.A.; Samaratunga, H.; Gandhi, M.K.; Scott, R.J.; et al. Epigenetically reprogrammed methylation landscape drives the DNA self-assembly and serves as a universal cancer biomarker. Nat. Commun. 2018, 9, 4915. [Google Scholar] [CrossRef] [Scilit] [PubMed]
- Lancia, G.; Durastanti, C.; Spitoni, C.; De Benedictis, I.; Sciortino, A.; Cirillo, E.N.; Ledda, M.; Lisi, A.; Convertino, A.; Mussi, V. Learning models for classifying Raman spectra of genomic DNA from tumor subtypes. Sci. Rep. 2023, 13, 11370. [Google Scholar] [CrossRef] [Scilit] [PubMed]
- Barucci, A.; D’Andrea, C.; Farnesi, E.; Banchelli, M.; Amicucci, C.; de Angelis, M.; Hwang, B.; Matteini, P. Label-free SERS detection of proteins based on machine learning classification of chemo-structural determinants. Analyst 2021, 146, 674–682. [Google Scholar] [CrossRef] [Scilit] [PubMed]
- Bi, X.; Lin, L.; Chen, Z.; Ye, J. Artificial intelligence for surface-enhanced Raman spectroscopy. Small Methods 2024, 8, e2301243. [Google Scholar] [CrossRef] [Scilit] [PubMed]
- Yi, J.; You, E.M.; Liu, G.K.; Tian, Z.Q. AI–nano-driven surface-enhanced Raman spectroscopy for marketable technologies. Nat. Nanotechnol. 2024, 19, 1758–1762. [Google Scholar] [CrossRef] [Scilit] [PubMed]
- Zhou, H.; Xu, L.; Ren, Z.; Zhu, J.; Lee, C. Machine learning-augmented surface-enhanced spectroscopy toward next-generation molecular diagnostics. Nanoscale Adv. 2023, 5, 538–570. [Google Scholar] [CrossRef] [Scilit] [PubMed]
- Tavakkoli Yaraki, M.; Tukova, A.; Wang, Y. Emerging SERS biosensors for the analysis of cells and extracellular vesicles. Nanoscale 2022, 14, 15242–15268. [Google Scholar] [CrossRef] [Scilit] [PubMed]
- Nguyen, A.H.; Lee, J.U.; Sim, S.J. Plasmonic coupling-dependent SERS of gold nanoparticles anchored on methylated DNA and detection of global DNA methylation in SERS-based platforms. J. Opt. 2015, 17, 114022. [Google Scholar] [CrossRef] [Scilit]
- Abid Hasan, S.M.; He, Y.; Chang, T.W.; Wang, J.; Gartia, M.R. Detecting DNA methylation using surface-enhanced Raman spectroscopy. J. Phys. Chem. C 2019, 123, 698–709. [Google Scholar] [CrossRef] [Scilit]
- Luo, X.; Kang, T.; Zhu, J.; Wu, P.; Cai, C. Sensitivity-improved SERS detection of Methyltransferase assisted by plasmonically engineered nanoholes array and hybridization chain reaction. ACS Sens. 2020, 5, 3639–3648. [Google Scholar] [CrossRef] [Scilit] [PubMed]
- Mirajkar, S.; Dhayagude, A.; Maiti, N.; Suprasanna, P.; Kapoor, S. Distinguishing genomic DNA of Brassica juncea and Arabidopsis thaliana using surface-enhanced Raman scattering. J. Raman Spectrosc. 2020, 51, 89–103. [Google Scholar]
- Turkevich, J.; Stevenson, P.C.; Hillier, J. A study of the nucleation and growth processes in the synthesis of colloidal gold. Discuss. Faraday Soc. 1951, 11, 55–75. [Google Scholar] [CrossRef] [Scilit]
- Leopold, N.; Lendl, B. A new method for fast preparation of highly surface-enhanced Raman scattering (SERS) active silver colloids at room temperature by reduction of silver nitrate with hydroxylamine hydrochloride. J. Phys. Chem. B 2003, 107, 5723–5727. [Google Scholar] [CrossRef] [Scilit]
- Wang, Y.; Deng, X.; Liu, J.; Tang, H.; Jiang, J. Surface enhanced Raman scattering based sensitive detection of histone demethylase activity using a formaldehyde-selective reactive probe. Chem. Commun. 2013, 49, 8489–8491. [Google Scholar] [CrossRef] [Scilit] [PubMed]
- Dina, N.E.; Muntean, C.M.; Bratu, I.; Tican, A.; Halmagyi, A.; Purcaru, M.A.; Coste, A. Structure and surface dynamics of genomic DNA as probed with surface-enhanced Raman spectroscopy: Trace level sensing of nucleic acids extracted from plants. Spectrochim. Acta Part A Mol. Biomol. Spectrosc. 2022, 279, 121477. [Google Scholar] [CrossRef] [Scilit] [PubMed]
- Muntean, C.M.; Leopold, N.; Tripon, C.; Coste, A.; Halmagyi, A. Surface-enhanced Raman spectroscopy of genomic DNA from in vitro grown tomato (Lycopersicon esculentum Mill.) cultivars before and after plant cryopreservation. Spectrochim. Acta Part A Mol. Biomol. Spectrosc. 2015, 144, 107–114. [Google Scholar] [CrossRef] [Scilit] [PubMed]
- Wang, Y.; Wee, E.J.H.; Trau, M. Accurate and sensitive total genomic DNA methylation analysis from sub-nanogram input with embedded SERS nanotags. Chem. Commun. 2016, 52, 3560–3563. [Google Scholar] [CrossRef] [Scilit] [PubMed]
- Chavan, S.N.; Pawar, K.S.; Mahale, U.S.; Korde, S.D. Genome level and epigenetic changes induced by tissue culture. Int. J. Adv. Res. Multidiscip. Trends IJARMT 2025, 2, 77–87. [Google Scholar]
- Adampourezare, M.; Hasanzadeh, M.; Seidi, F. Optical bio-sensing of DNA methylation analysis: An overview of recent progress and future prospects. RSC Adv. 2022, 12, 25786–25806. [Google Scholar] [CrossRef] [Scilit] [PubMed]
- Xie, Y.; Huang, J.; Yang, M.; Zhang, Y.; Zhang, X.; Xu, W.; Cao, J.; Zhu, L. Nucleic acid-mediated SERS Biosensors: Signal enhancement strategies and applications. Biosens. Bioelectron. 2025, 282, 117519. [Google Scholar] [CrossRef] [Scilit] [PubMed]
- Lee, S.; Dang, H.; Moon, J.I.; Kim, K.; Joung, Y.; Park, S.; Yu, Q.; Chen, J.; Lu, M.; Chen, L.; et al. SERS-based microdevices for use as in vitro diagnostic biosensors. Chem. Soc. Rev. 2024, 53, 5394–5427. [Google Scholar] [CrossRef] [Scilit] [PubMed]
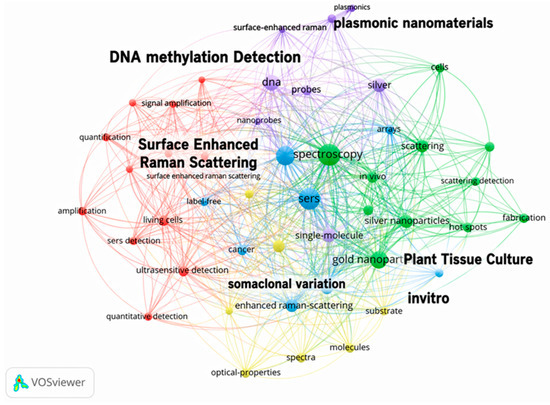
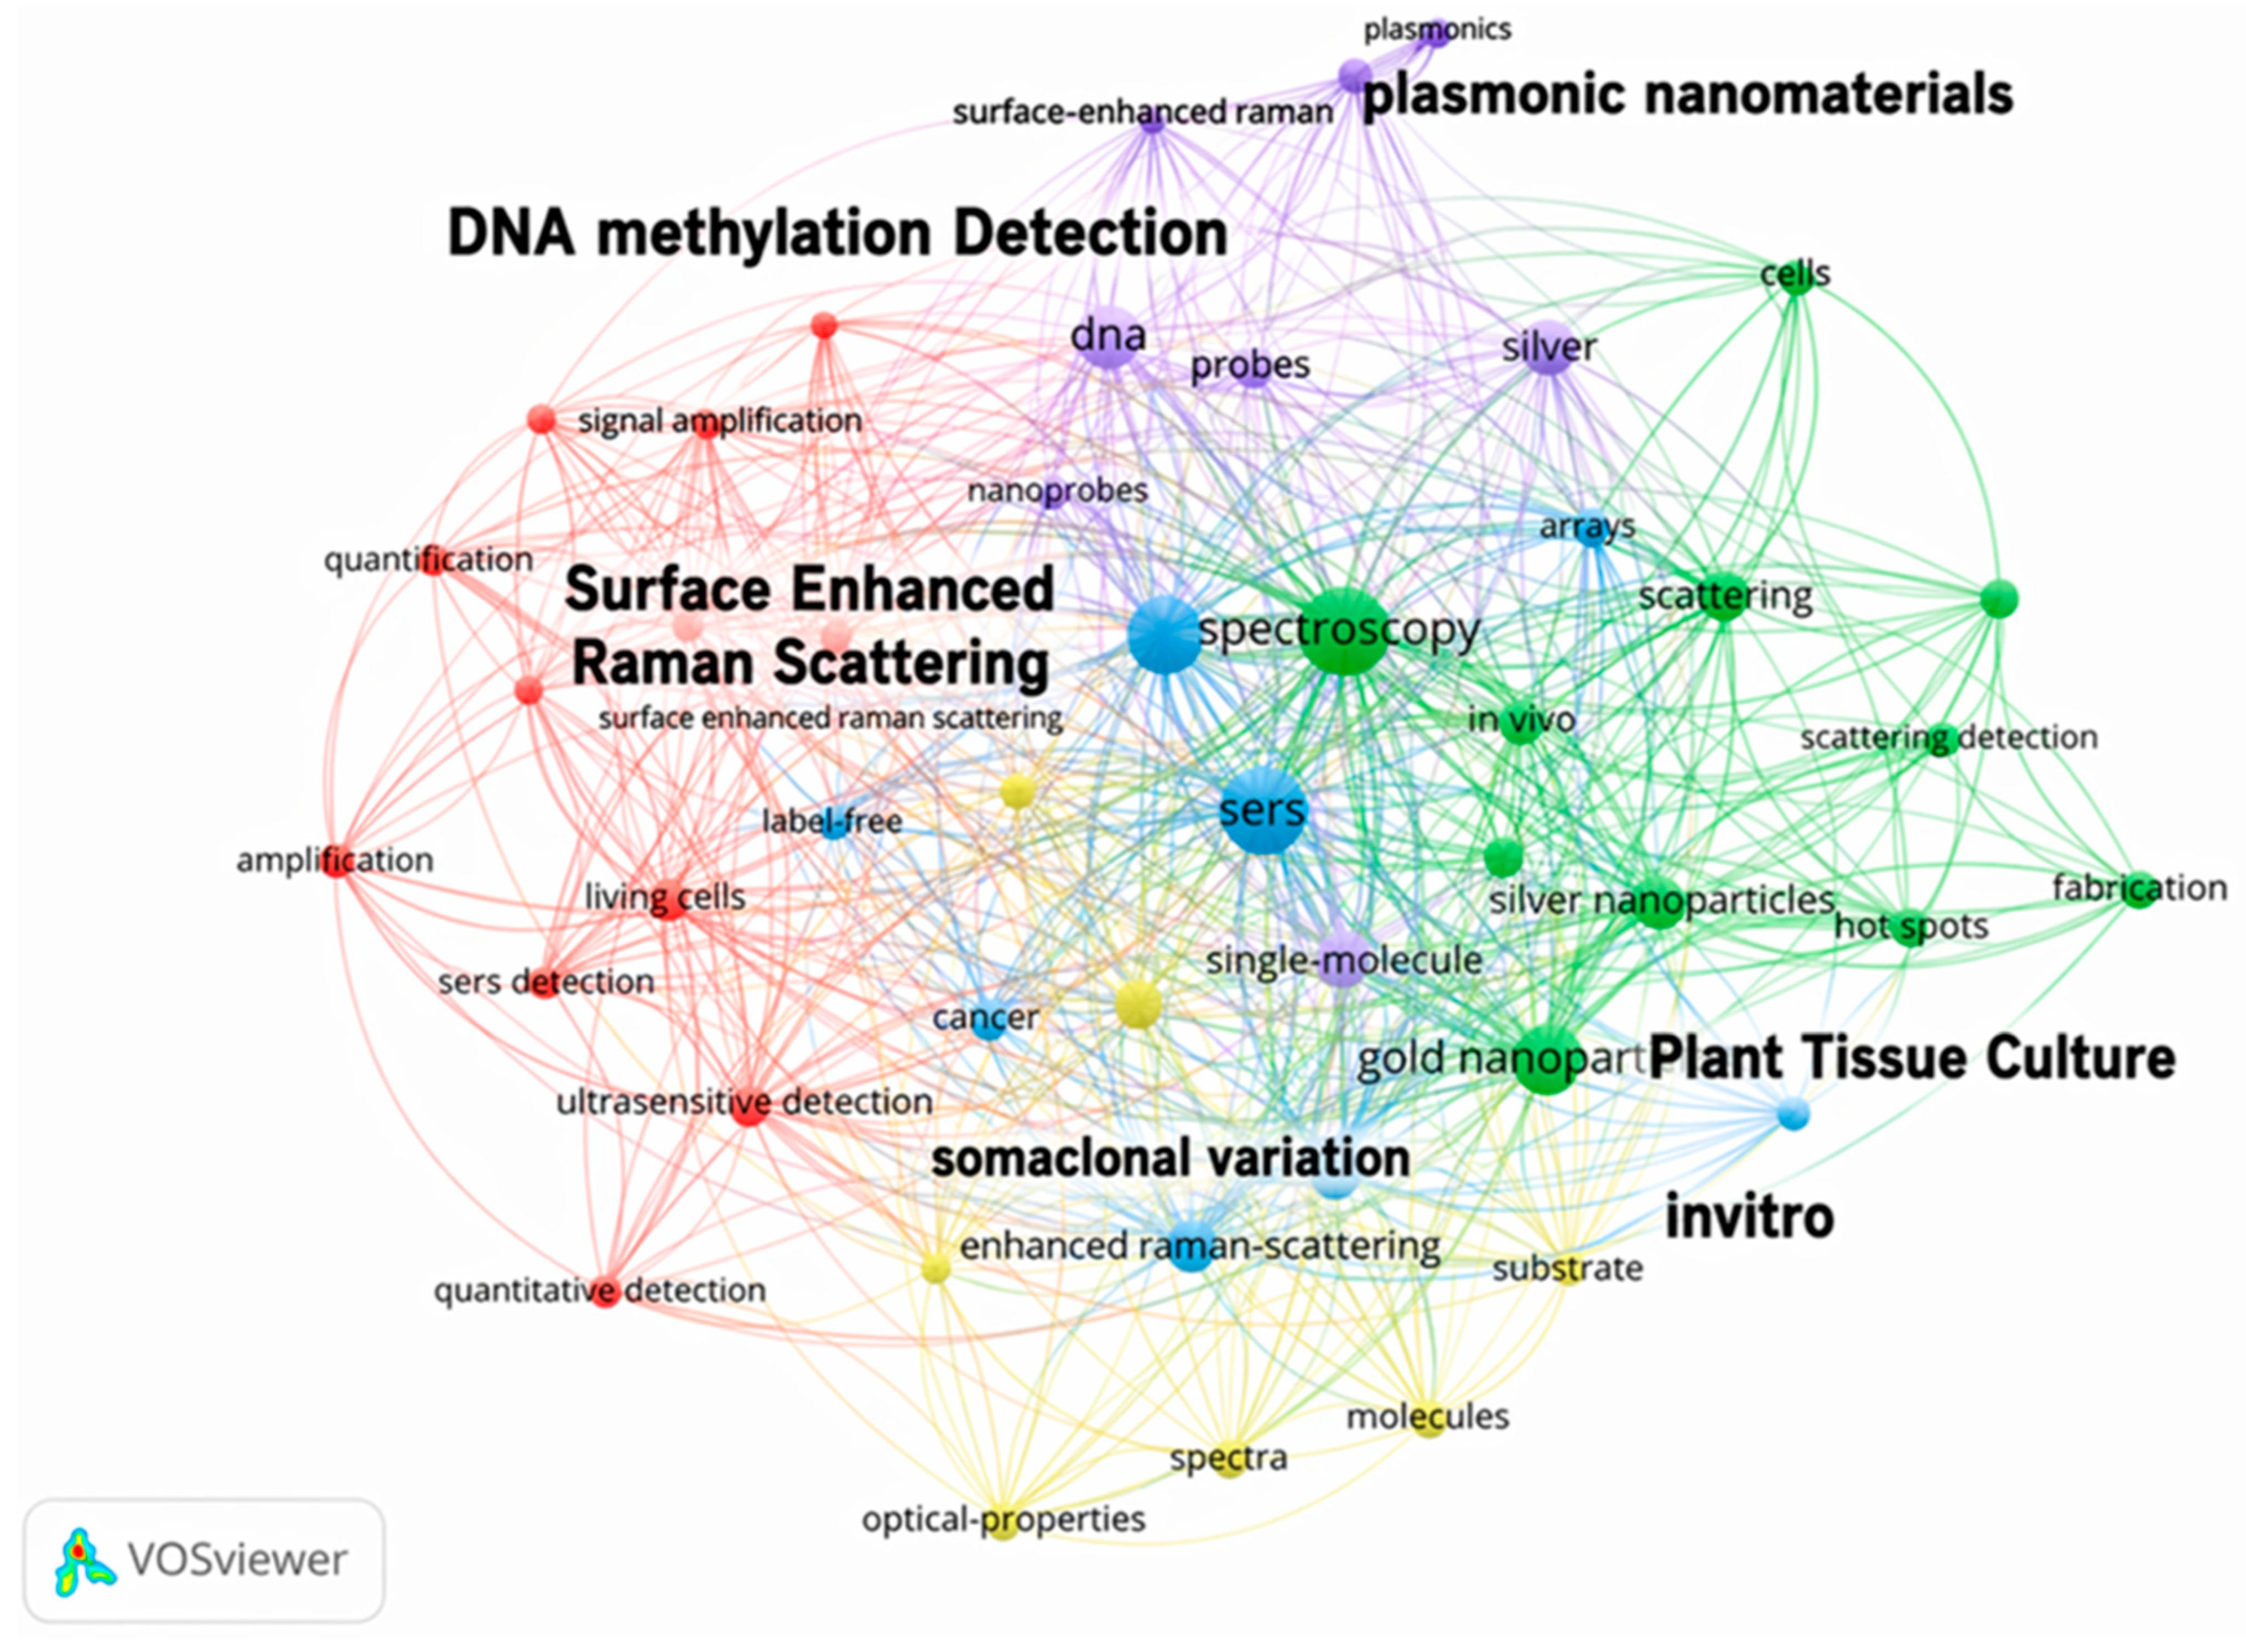
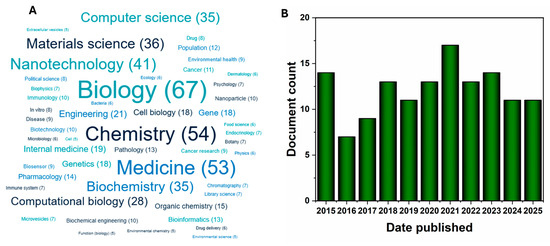
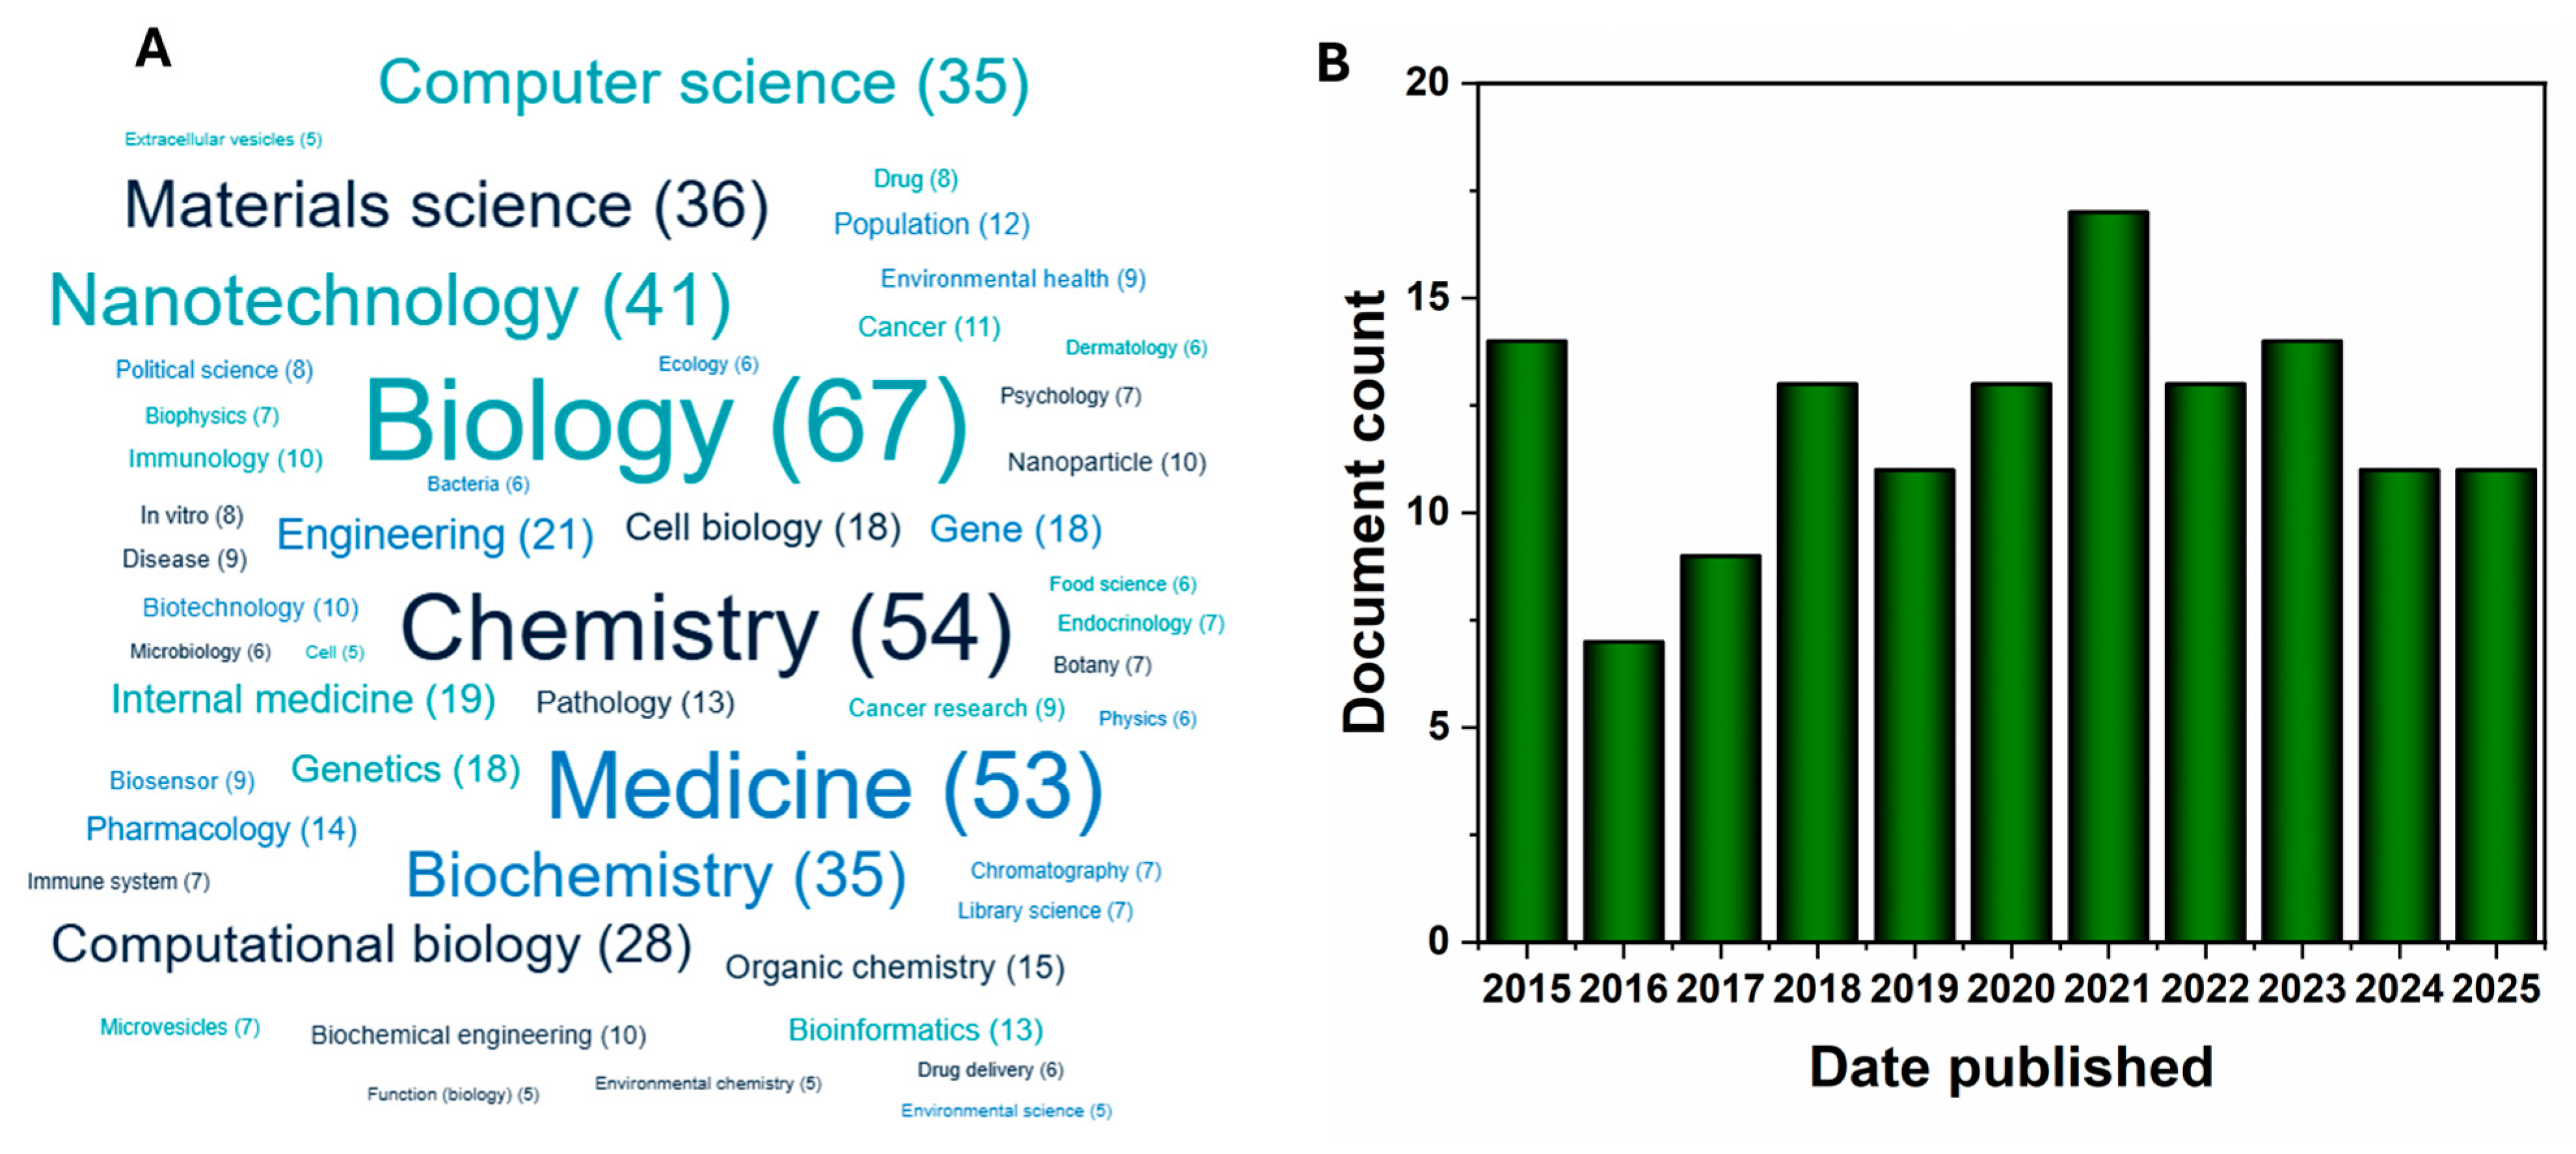
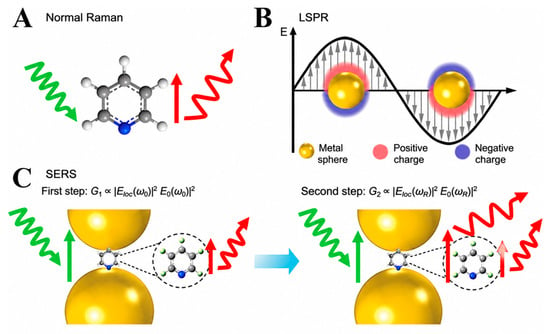
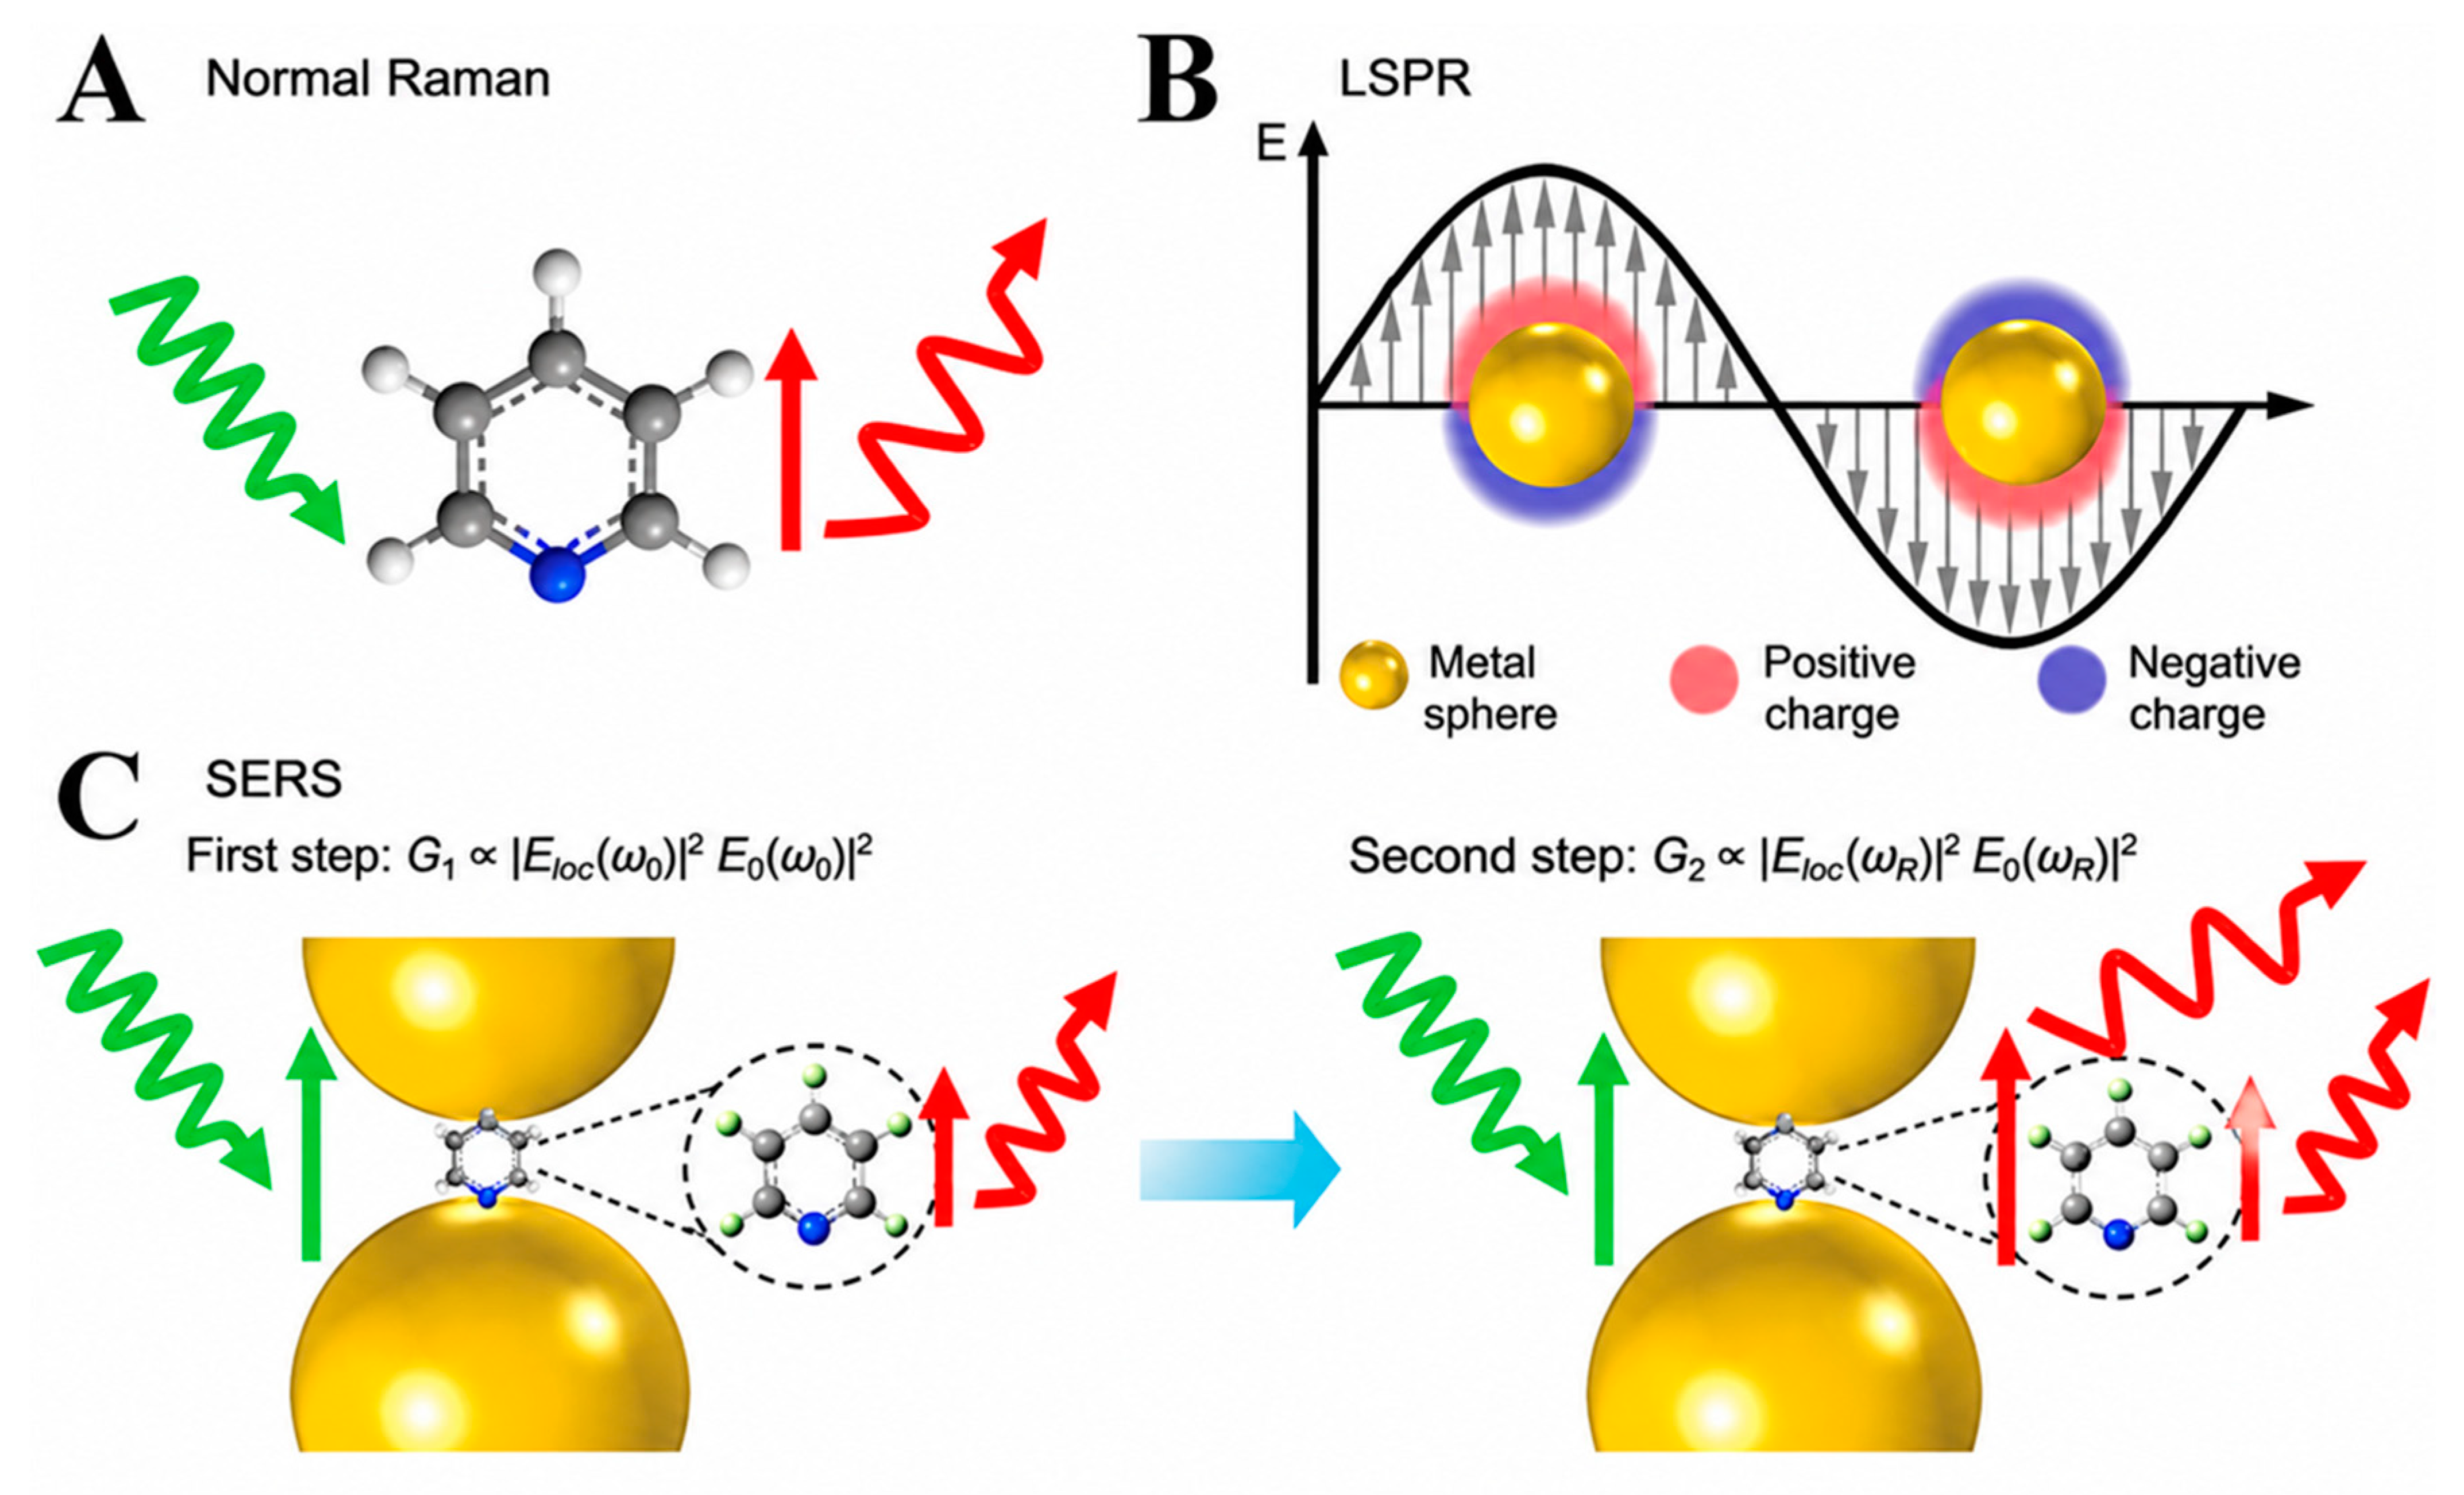
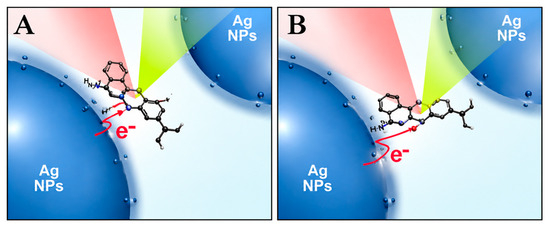
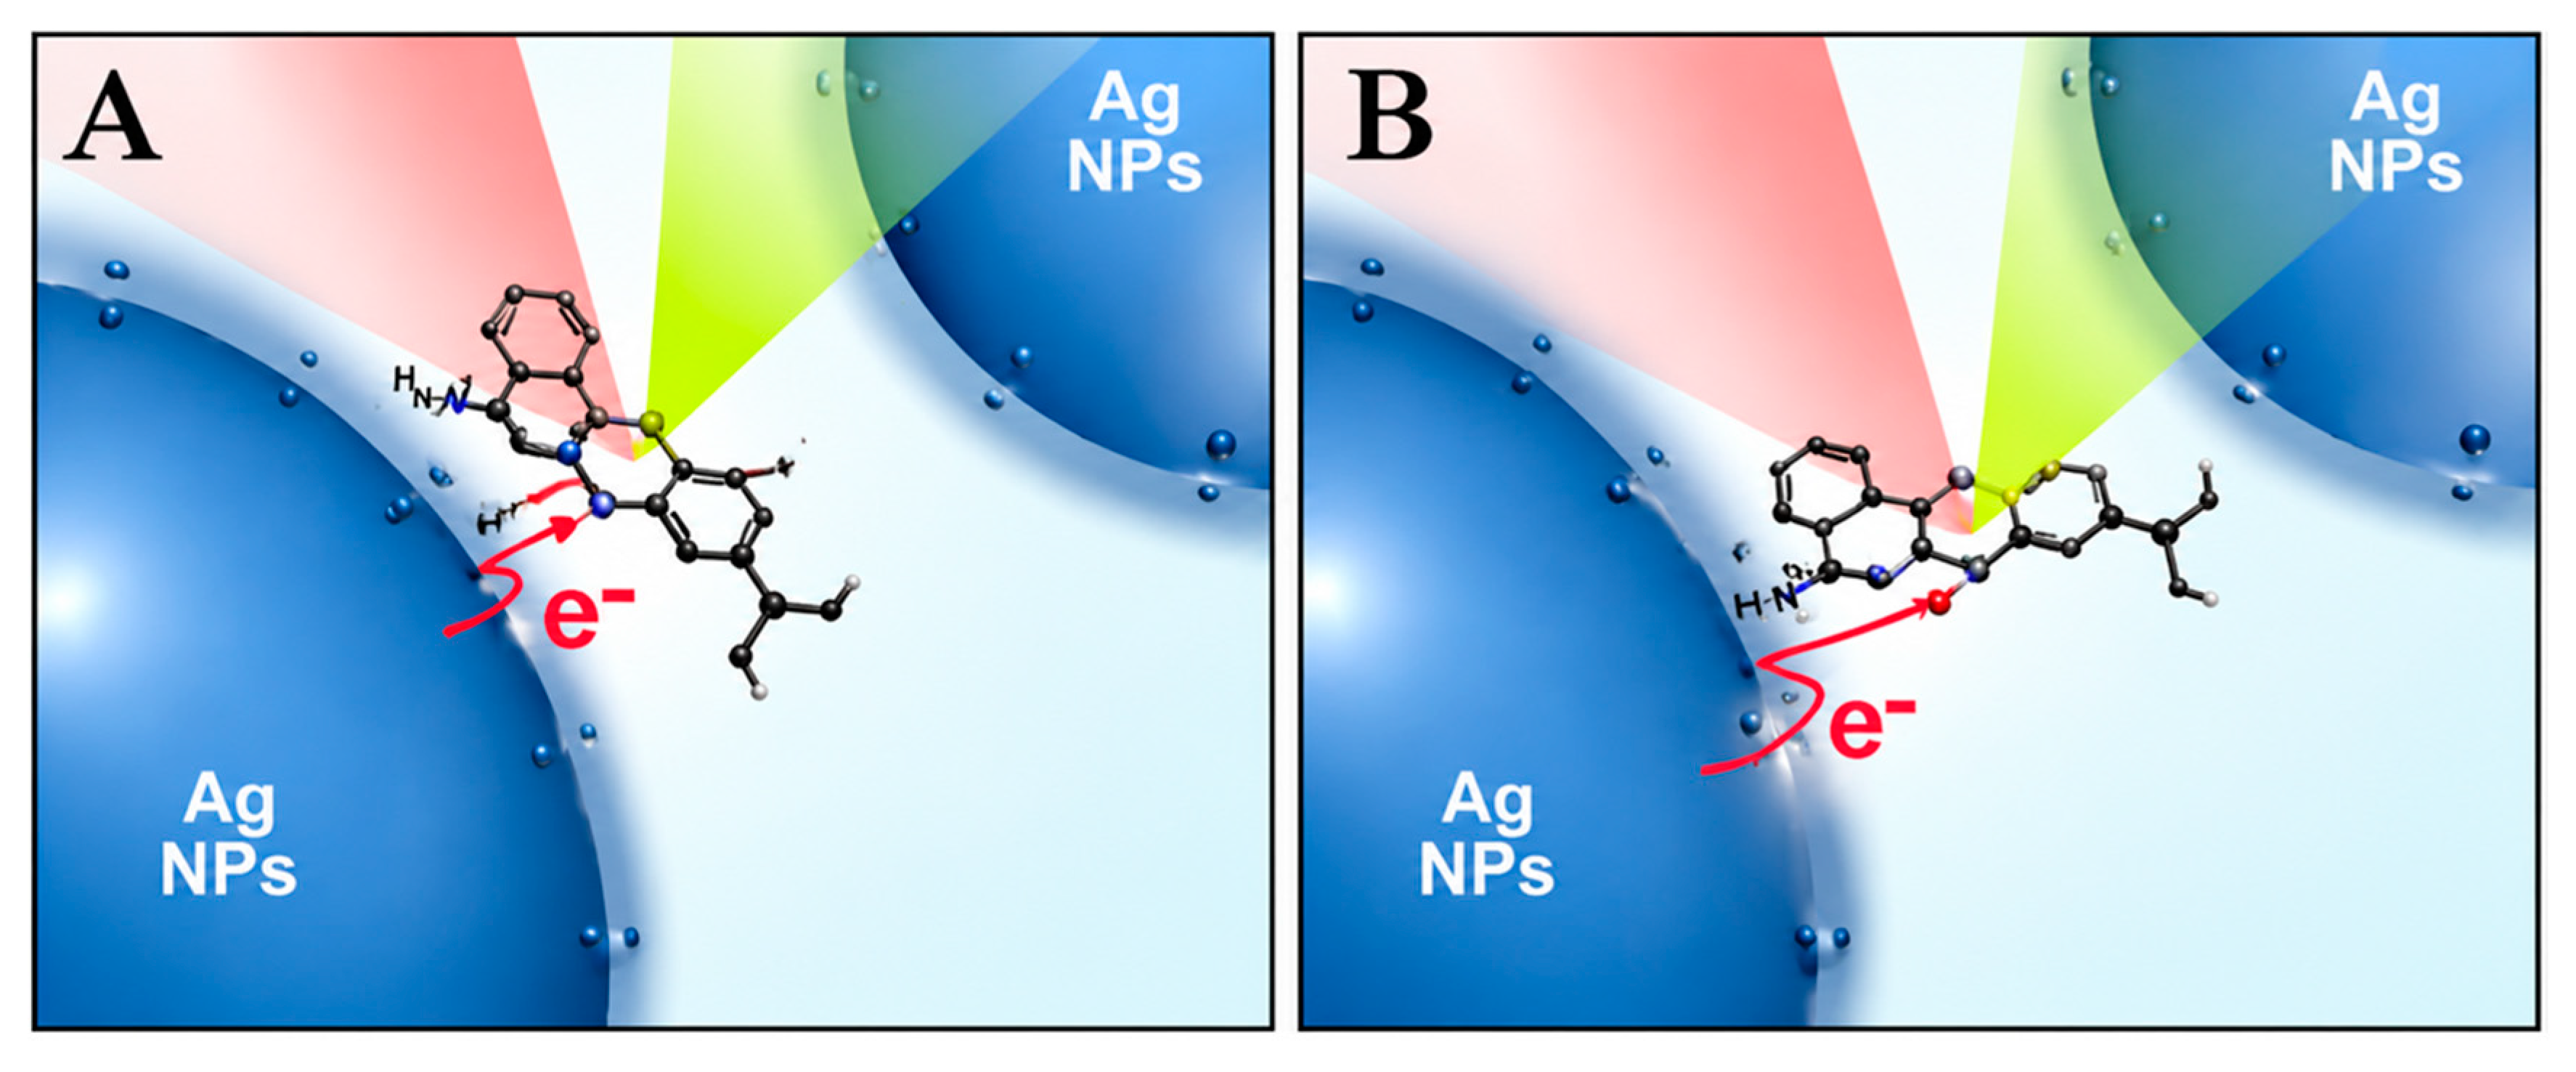
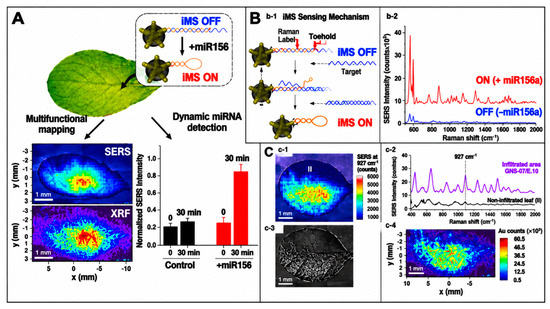
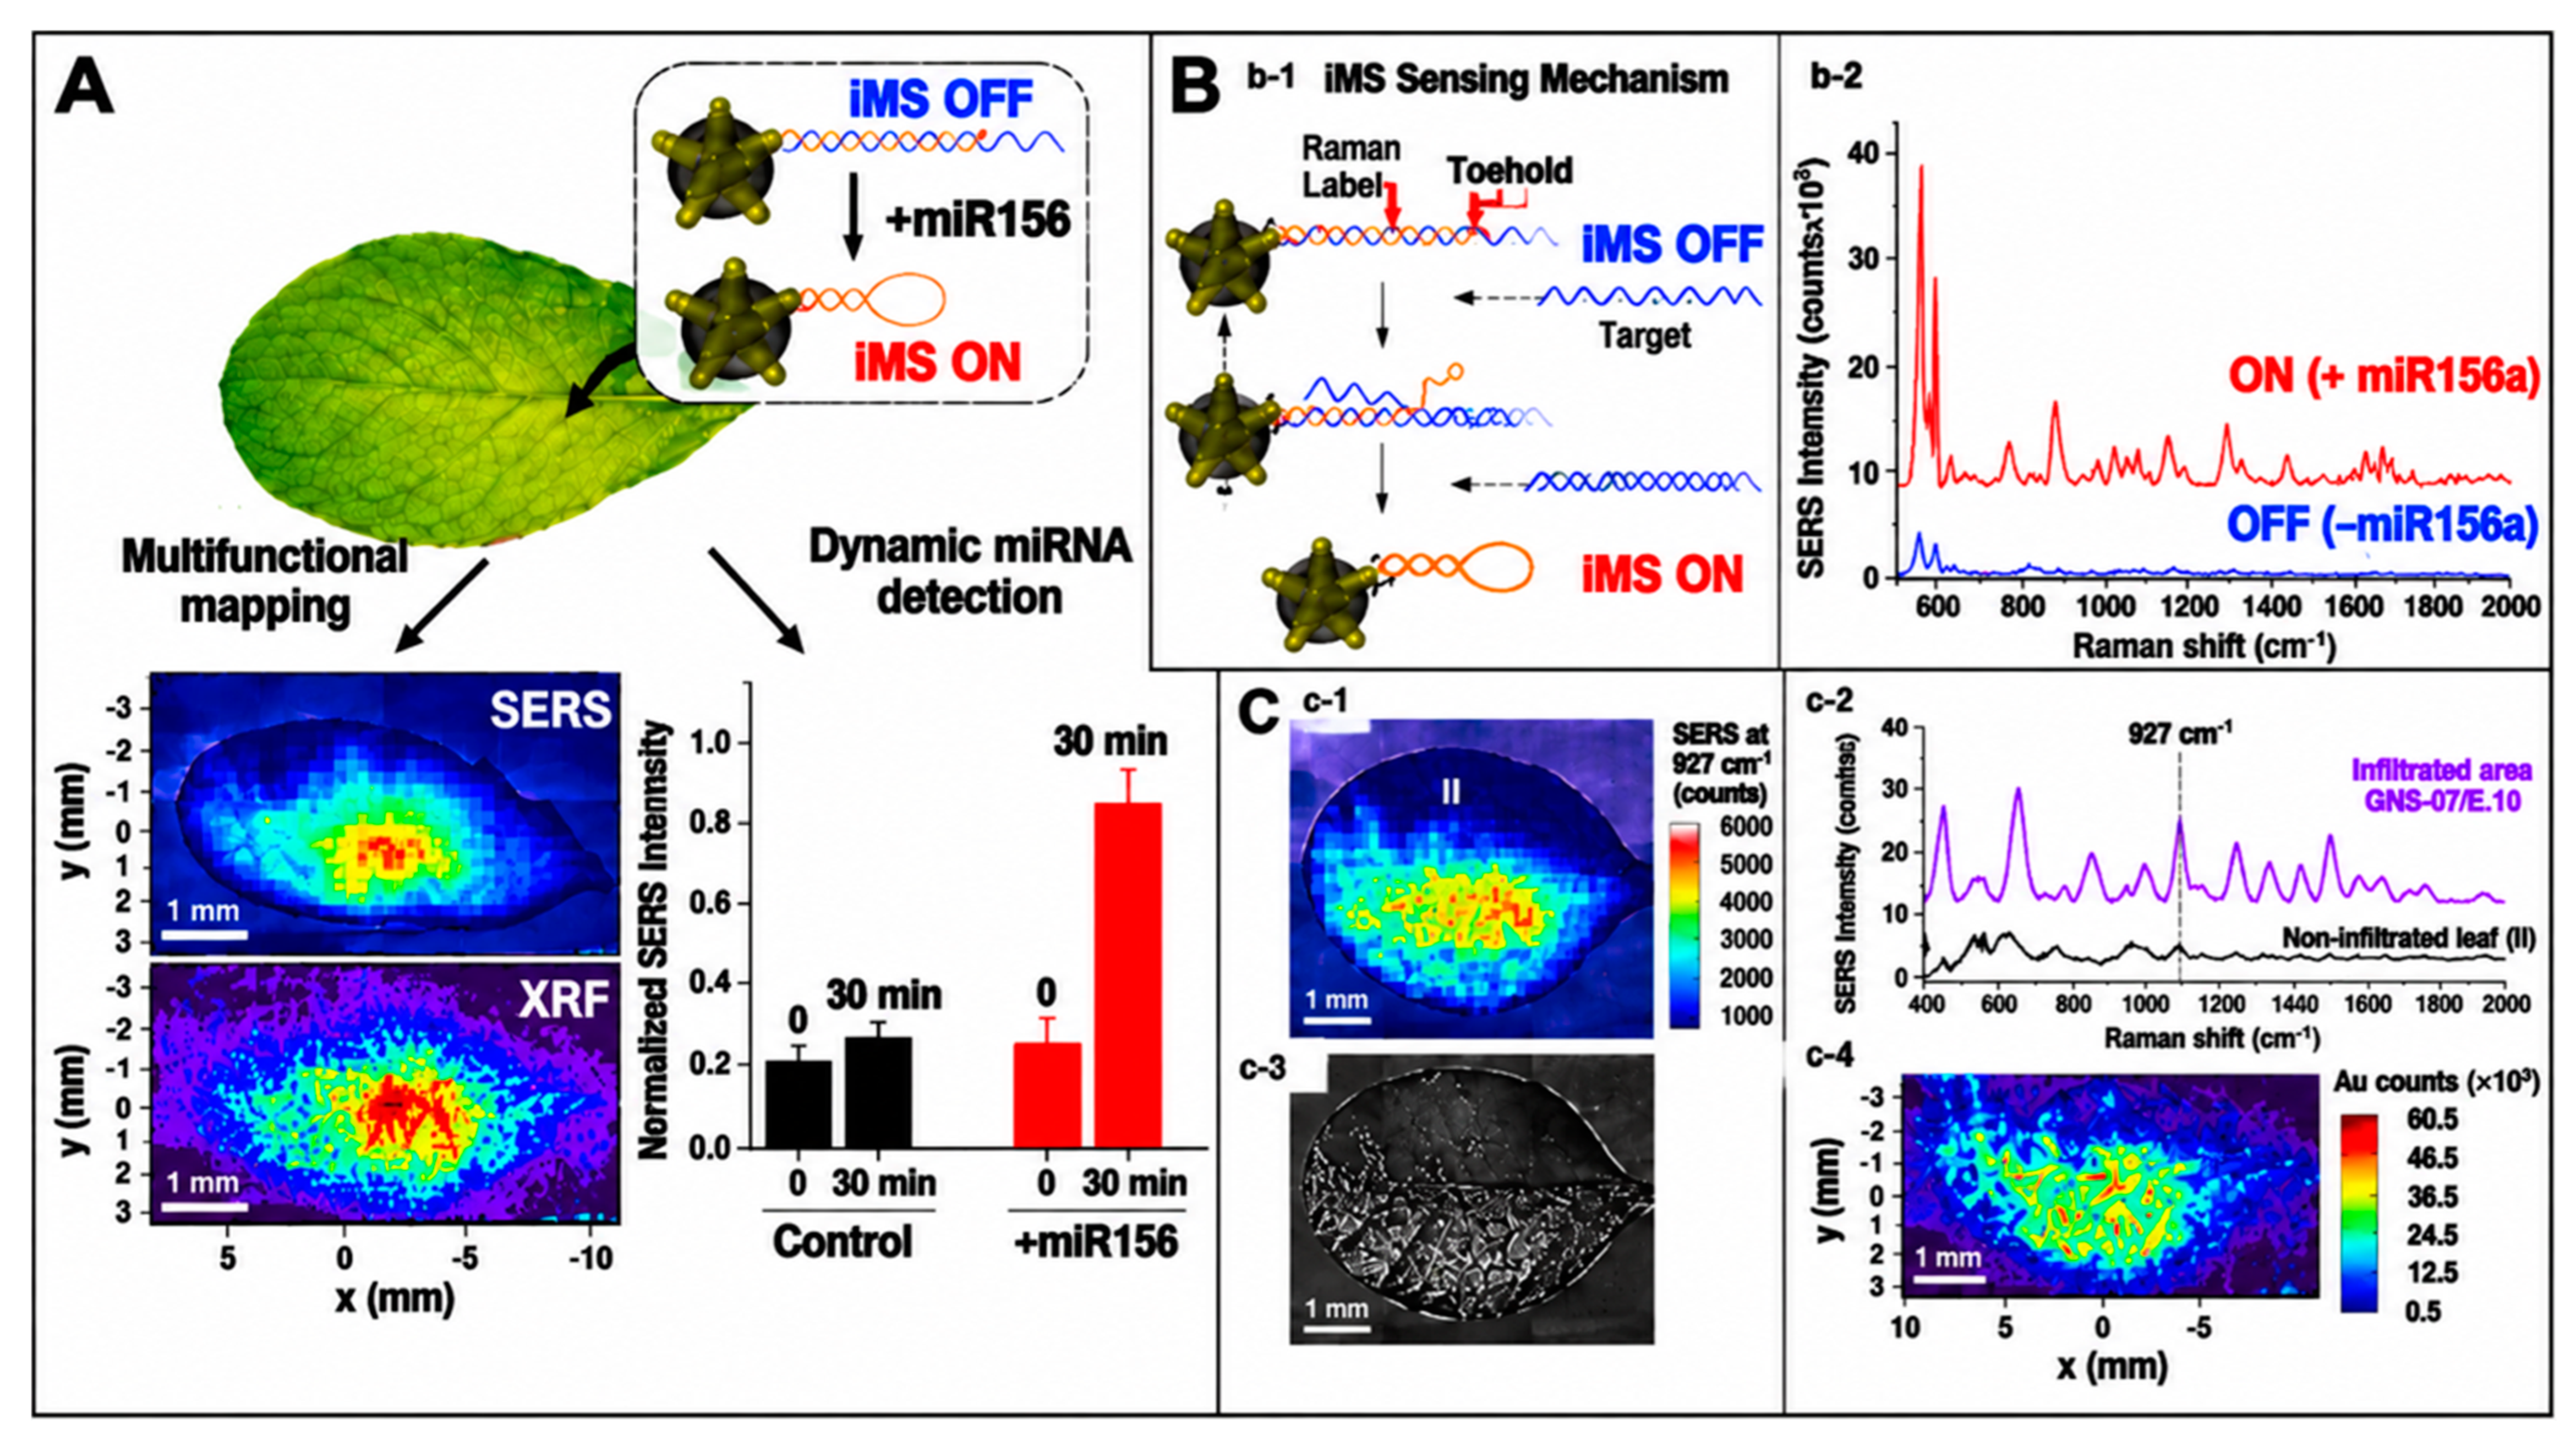
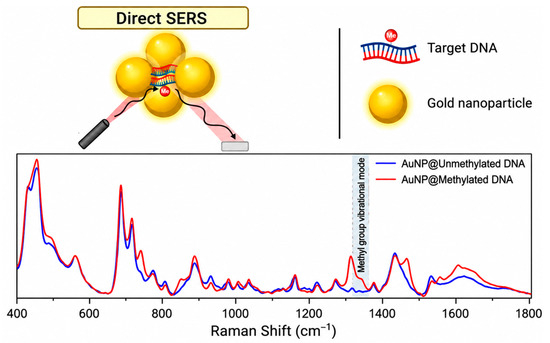
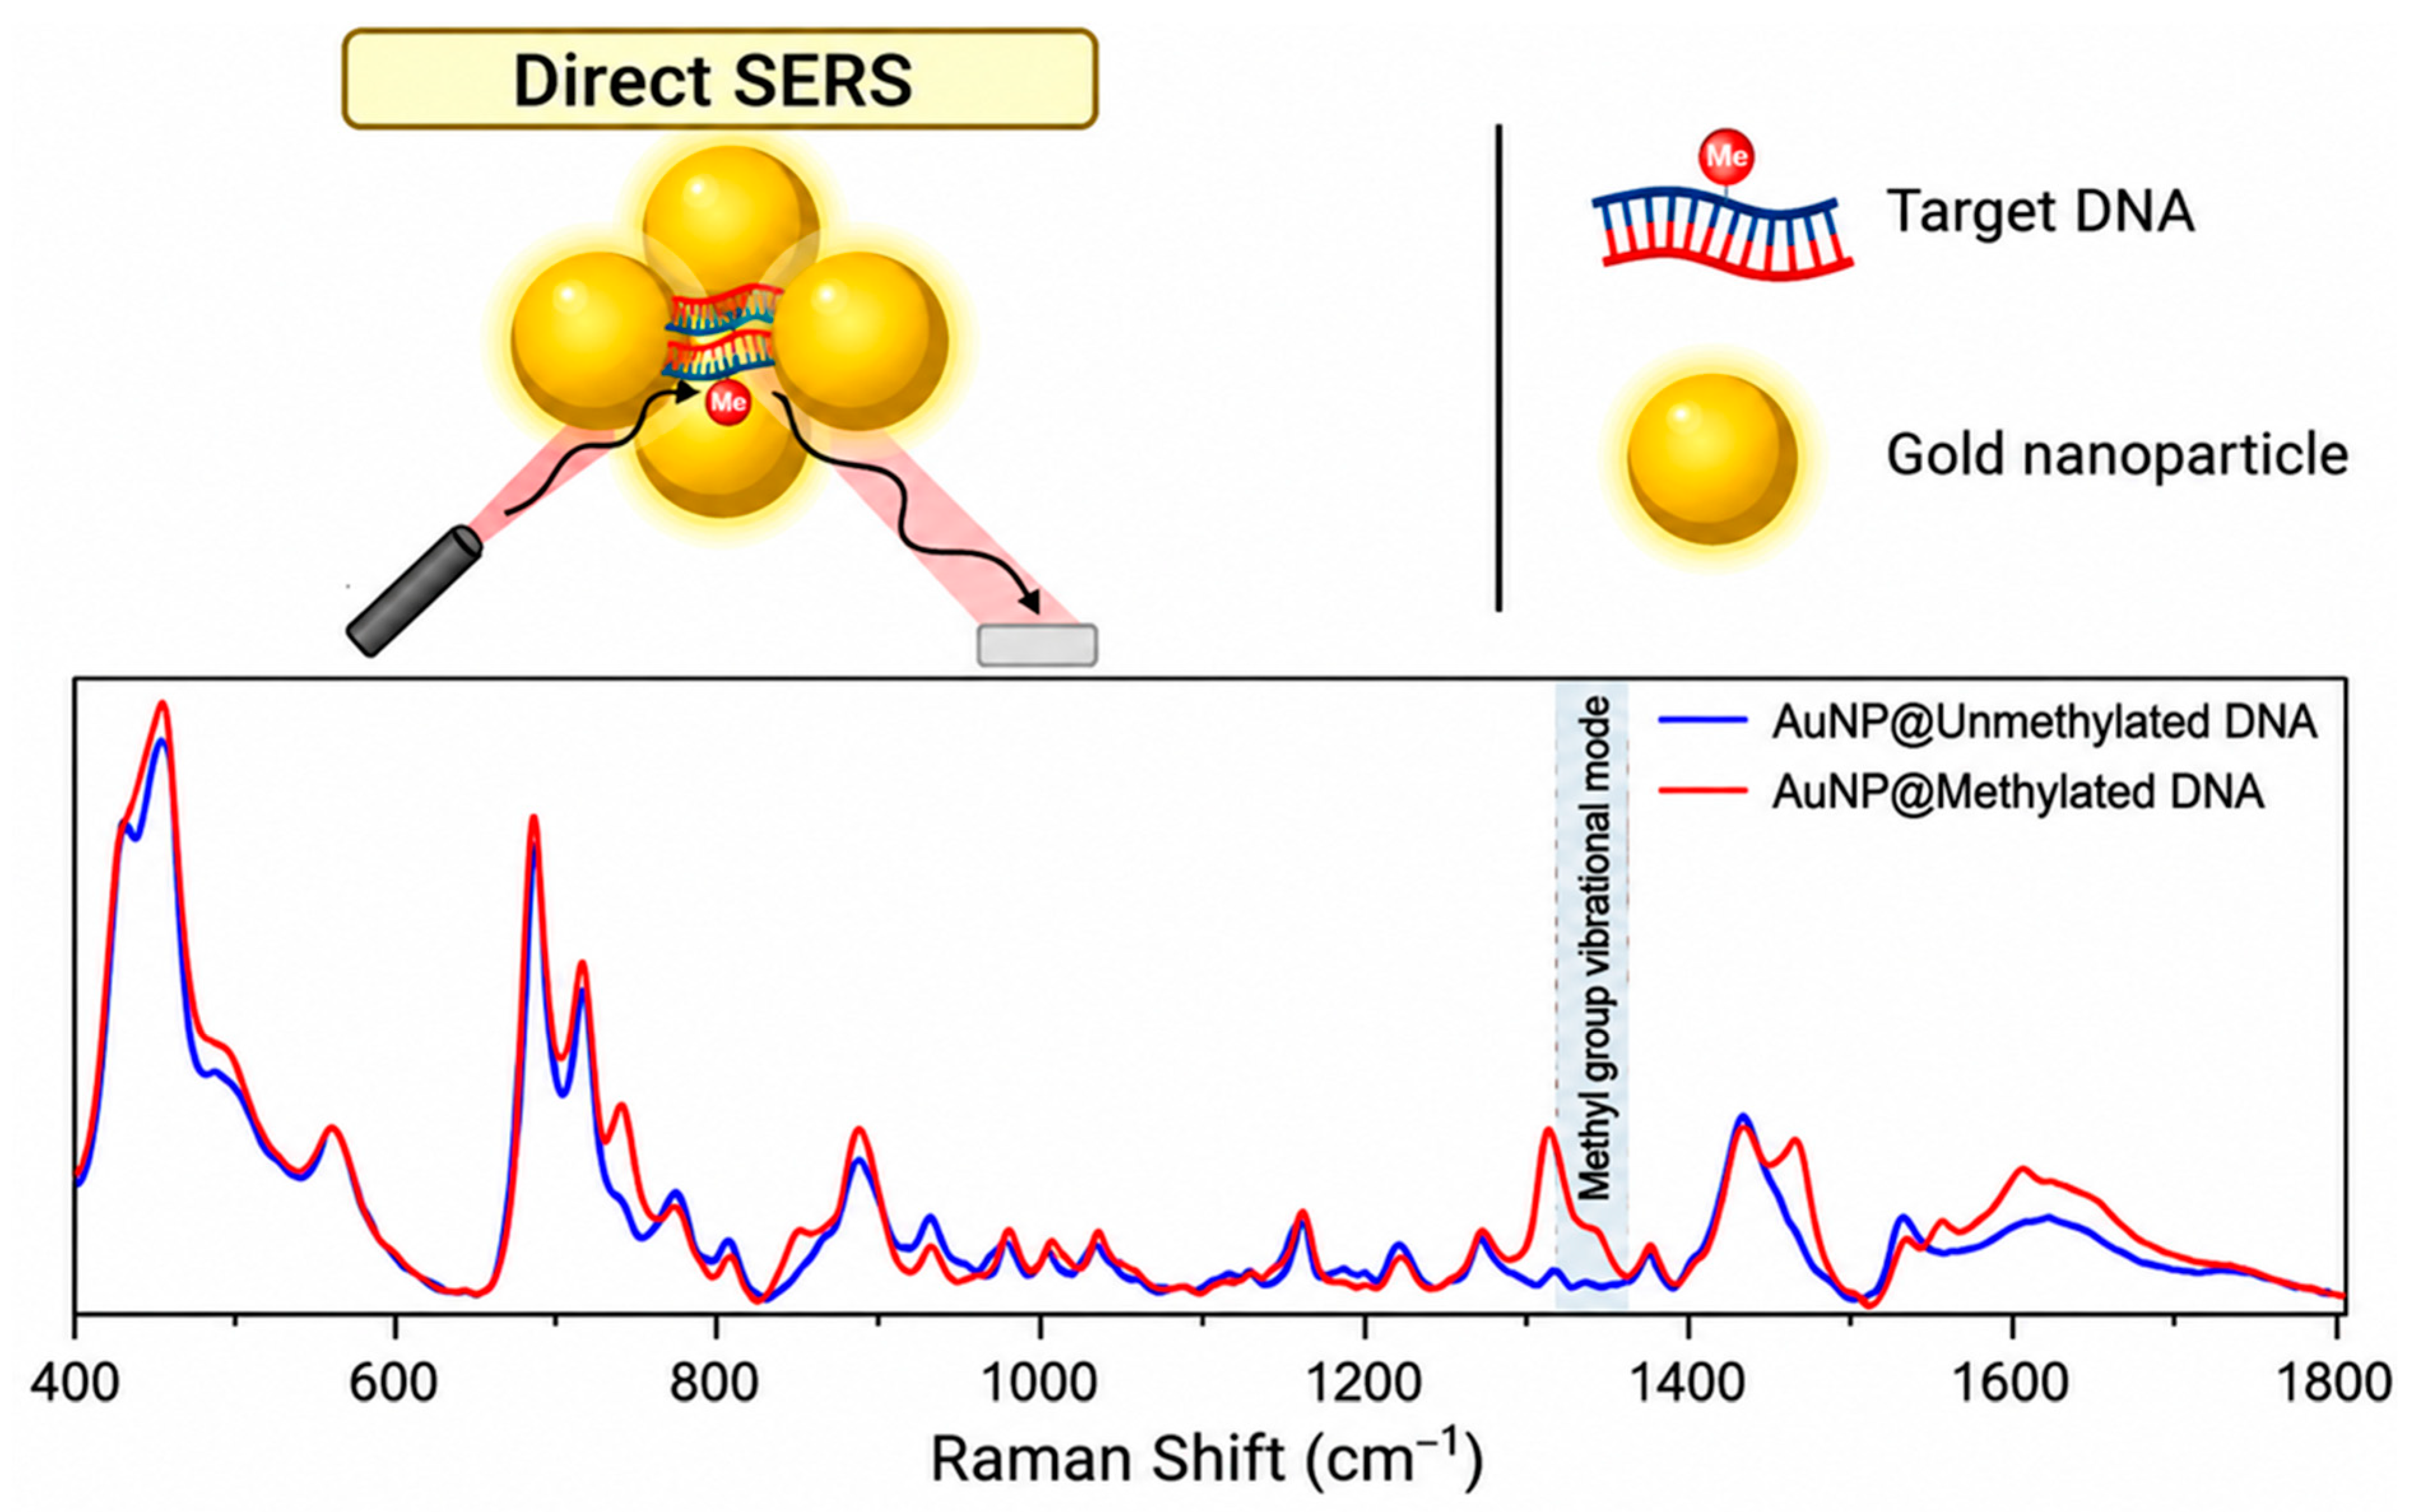
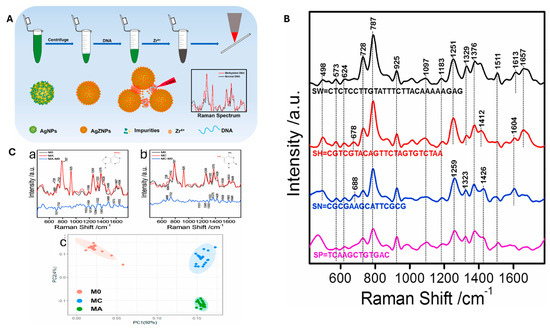
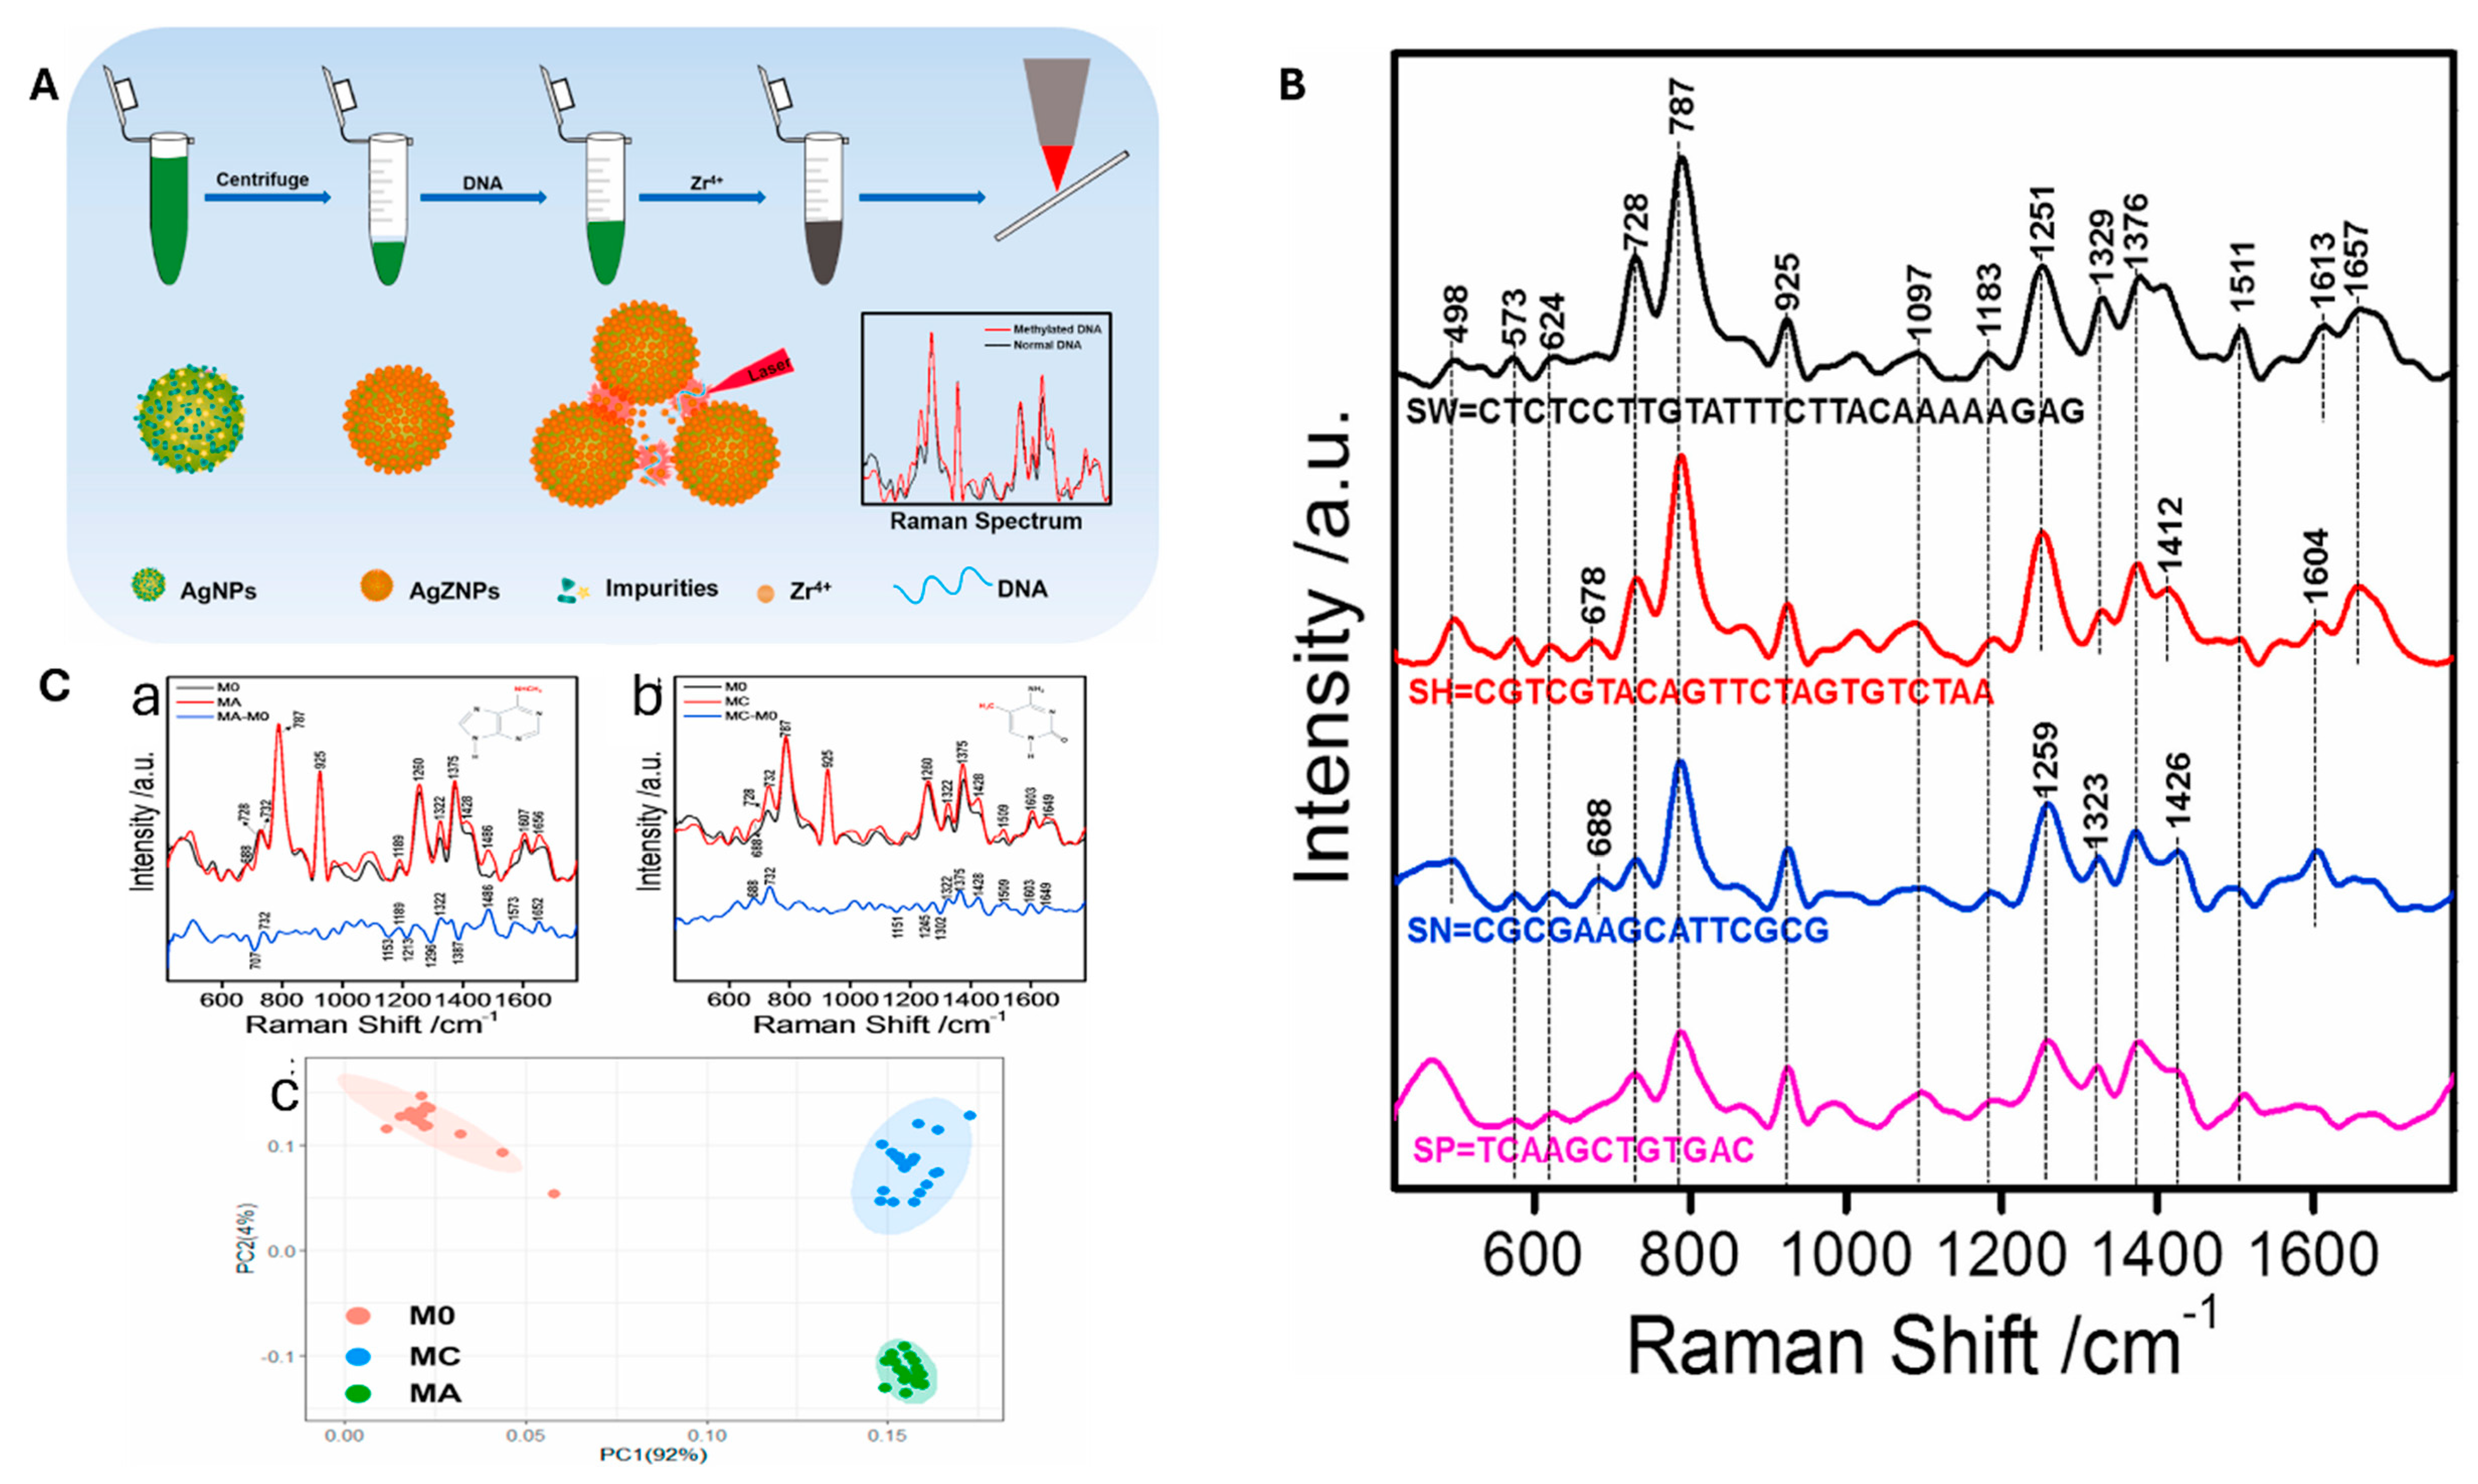
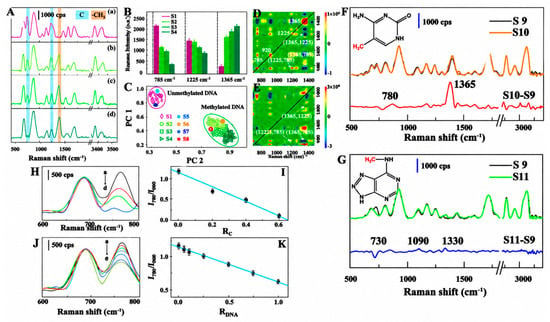
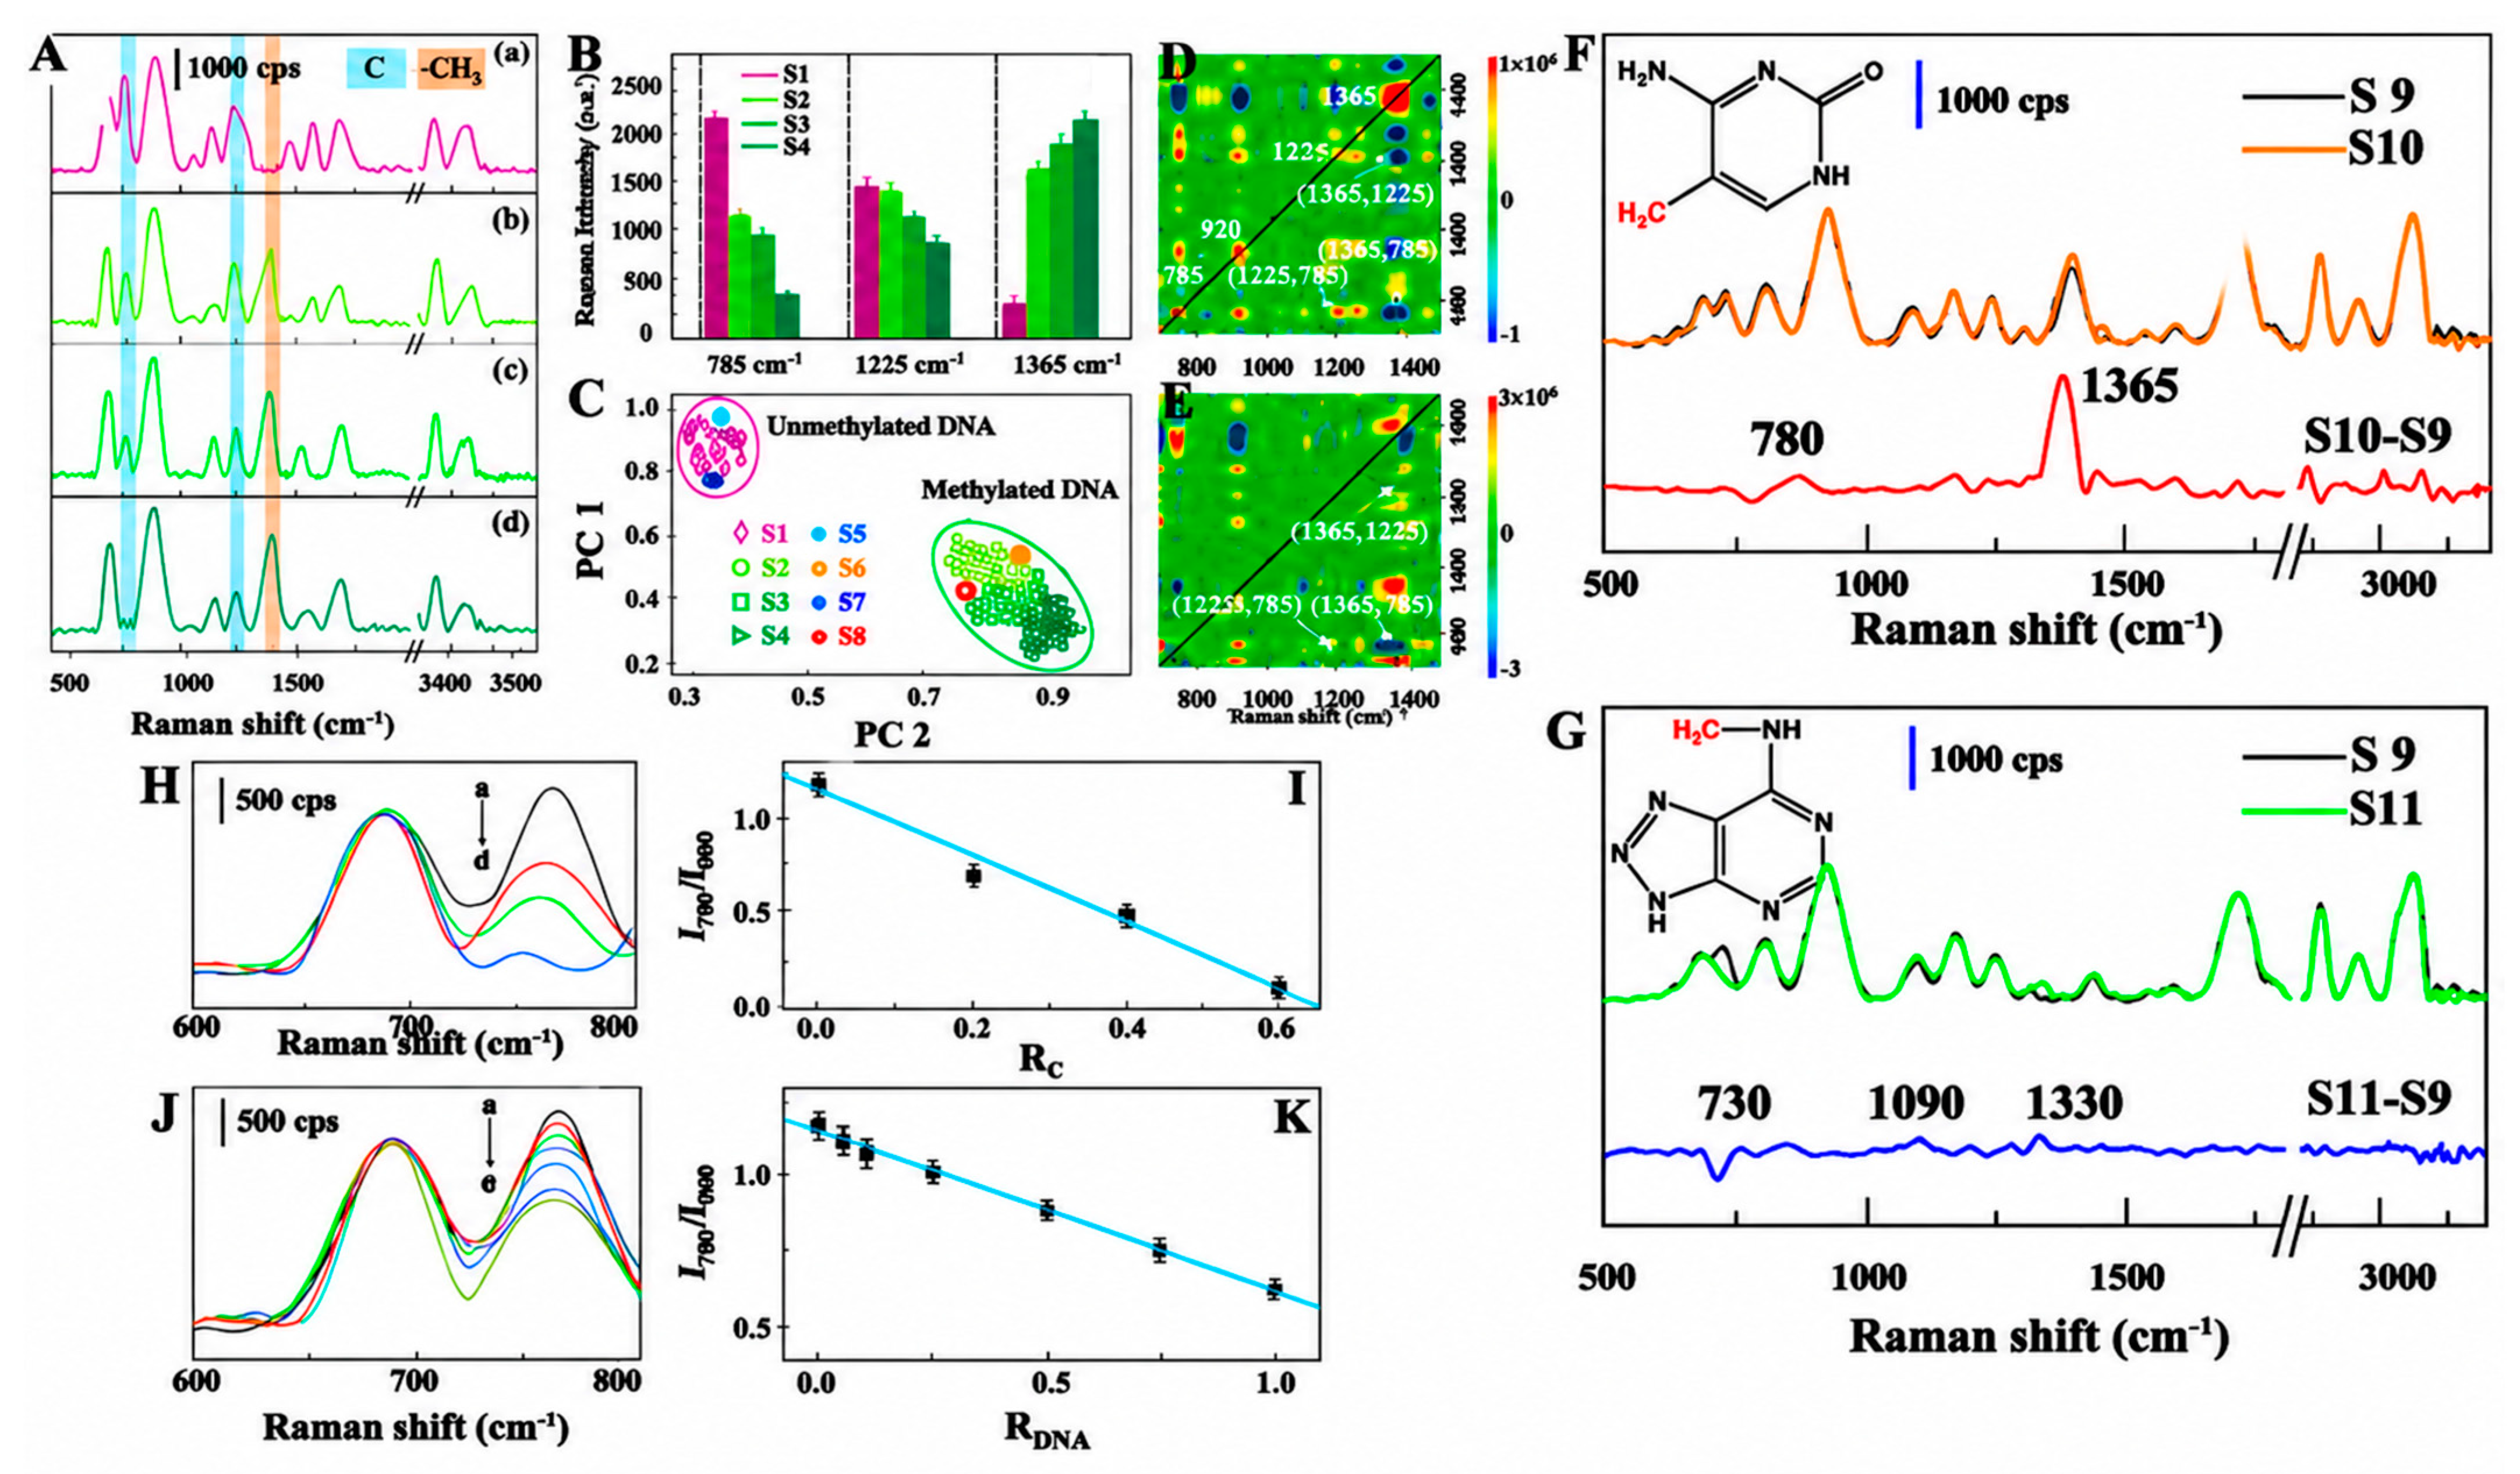

Disclaimer/Publisher’s Note: The statements, opinions and data contained in all publications are solely those of the individual author(s) and contributor(s) and not of MDPI and/or the editor(s). MDPI and/or the editor(s) disclaim responsibility for any injury to people or property resulting from any ideas, methods, instructions or products referred to in the content. |
© 2026 by the authors. Licensee MDPI, Basel, Switzerland. This article is an open access article distributed under the terms and conditions of the Creative Commons Attribution (CC BY) license.