


Abstract
Reliable determination of heavy rare earth elements (HREEs) in ores with multiple components through ICP-OES analysis is limited by their complex spectral signatures and dependency on the chemical matrix of each sample. A double gate-line selection method was developed that utilizes both correlation between candidate ICP-OES line intensity values and ICP-MS reference concentration values for 24 geological samples and standard addition recovery screening. The multi acid decomposition of all samples utilized HNO3, HCl, HF, HClO4, and H2O2. The eight selected lines were Gd at 335.048 nm, Tb at 350.914 nm, Dy at 353.171 nm, Ho at 345.600 nm, Er at 369.265 nm, Tm at 313.125 nm, Yb at 369.419 nm, and Lu at 291.139 nm. Limits of detection for the blank-derived data range from 0.02 to 0.10 mg/kg; the limit of quantification ranges from 0.07 to 0.32 mg/kg. However, the lower bound of calibration standards represents 2.00 mg/kg in the solid phase. Therefore, any results that fall below this threshold will be represented as estimated (extrapolated) rather than measured (quantitatively determined). CRM recoveries for the eight target analytes fell within the range of 91.67 to 105.78 percent; however, the two CRM comparisons where the analytical result for one or more target analytes exceeded the two-sided critical T-value (two tailed) of 2.31 were Tb in OREAS 465 and Er in OREAS 461. Due to the fact that the 24 samples analyzed for ICP-OES/ICP-MS correlation analysis were also used for the initial selection of candidate ICP-OES lines, the demonstrated correlations represent internal validity versus independent prediction. Single interferent controlled experiments and matrix-matched calibration experiments were not completed.
1. Introduction
Heavy rare earth elements (HREEs) include elements from Gd to Lu [1], and their magnetic, optical, luminescence, and catalytic characteristics support a wide range of applications in the fields of advanced electronics, defense technology, and low-carbon energy systems [2,3]. Therefore, an increasing demand for some HREEs is anticipated, while at the same time, there are limited economic recoverable sources and supply chain for these HREEs. This has resulted in many of the HREEs being classified by international agencies as “critical” or “strategic” raw materials [4].
The geologically diverse environment of Morocco makes it one of the most attractive areas in terms of discovering areas rich in HREE. In the context of these varied geologic systems, the area around Twihinate, also known as Bir Gandouz in the Saharan portion of Morocco, has become an emerging frontier in terms of discovery of alkaline silicate and carbonate complexes [5]. For evaluating commercially viable opportunities associated with such deposits, creating geochemical maps related to local deposits and establishing a strong national R.E. supply chain will require developing reliable, standard, and accurate geo-analytic methodologies [6]. A major source of improving local abilities for mineral prospecting and enhancing domestic resources mapping is generating high-quality, censored-free datasets describing the distribution of rare earth elements within various types of matrices found throughout Morocco [7].
Geochemists characterize the HREEs based upon how trace-to-ultra-trace amounts occur throughout the Earth’s crust. They typically occur as part of stable, structurally complex accessory minerals like monazite, xenotime, apatite, and carbonatites [8]. Consequently, extracting and determining the amount of HREEs contained in the various minerals represents significant challenges in terms of analytical methods [8]. In general, Inductively Coupled Plasma Mass-Spectrometry (ICP-MS) is considered one of the most viable methods for measuring trace and ultra-trace concentrations of lanthanides [9]. However, due to high costs associated with purchasing and maintaining equipment, the need for experienced operators, and susceptibility to interference from the matrix being analyzed, ICP-MS does not represent a practical solution for many mining laboratories. Inductively Coupled Plasma Optical Emission Spectroscopy (ICP-OES) represents a relatively more accessible alternative when compared to ICP-MS. For example, ICP-OES can be performed with much lower capital and operational costs than ICP-MS. In addition, ICP-OES generally provides faster sample throughput and better resistance to effects of dissolved solids. As a result of the increased sensitivity required to measure the lanthanide series elements, ICP-OES tends to provide slightly less sensitive results than those provided by ICP-MS [10].
Both ICP-OES and ICP-MS utilize similar sample preparation approaches. These include both wet acid digestion and microwave-assisted digestion. Wet digestion is utilized in this investigation and provides significantly lower equipment costs and higher sample throughput per batch. Microwave-assisted digestion may provide more uniform temperature control during digestion and reduced reagent usage. However, microwave-assisted digestion generally requires higher capital investment and lower sample throughput than wet digestion. A comparative study of lithium borate fusion versus four-acid digestion approaches for analyzing whole-rock geochemical samples emphasizes the trade-off that exists among different approaches to digesting geological materials for lithogeochemistry and mineral exploration purposes [11].
The purpose of this research is to evaluate a chemometric dual gate workflow that will allow researchers to choose the best ICP-OES emission lines for analysis of the eight heavy rare earth elements (HREE) present in complex mineral matrices. A total of 24 geological samples were analyzed as candidate lines using two different methods to screen potential lines. These included the relationship between ICP-OES signal intensity and ICP-MS reference concentration. Following initial screening, these candidate lines were further assessed using a standard addition recovery protocol. Due to the fact that all 24 samples used during line selection were also used for evaluation of the analytical procedure, the statistical results from both experiments are intended to provide insight into how consistent the results are within each experiment and should not be considered evidence for or against external validity [12]. Evaluation of the analytical procedure included the use of three types of quality control material: blank solutions; multiple analyses of certified reference materials (CRM); and spiked CRM samples. The tests conducted in this research are referenced against those found in ISO/IEC 17025:2017; ICH Q2(R2); and NF T90-210:2018 [13,14]. However, due to the fact that complete validation was not performed, no conclusion can be made about the applicability of this work outside of the sample set tested in this study. Therefore, while a line selection process has been demonstrated in this study, and an internally validated analytical procedure developed, its transferability to other sample sets is yet to be determined [15].
2. Materials and Methods
2.1. Standards and Reagents
In this research, we employed the individual standard solutions of the examined heavy rare earth elements, Dy, Ho, Er, Tm, Yb, Lu, Gd, and Tb, with a declared concentration of 1000 µg/mL in an acidic matrix of 5% (v/v) HNO3 (prepared by SPEX CertiPrep, Metuchen, NJ, USA). The next step included preparing the multi-element intermediate solution at 100 µg/mL through suitable dilution of the stock solutions of the previously mentioned heavy rare earth elements in the same acidic matrix. To assess the accuracy and dependability of the developed analytical method for this analysis, we applied three certified reference materials: OREAS 460, OREAS 461, and OREAS 465 (OREAS, Ore Research & Exploration Pty Ltd, Bayswater North, VIC, Australia). For plasma generation, high-purity argon gas (>99.99%) was utilized as plasma gas. In this analysis, the argon gas was obtained from Air Liquid Maroc (Casablanca, Morocco). Ultrapure water with conductivity <2 µSm−1 was drawn from Milli-Q water purification system (Millipore SAS, Molsheim, France) for preparation of all solutions and dilutions. All acids were of analytical grade and were employed for digestion of samples (HF (40%), HClO4 (70%), HNO3 (68%), and HCl (32%).
2.2. Apparatus
Heavy Rare Earth Element (HREE) concentrations were determined using Inductively Coupled Plasma Optical Emission Spectroscopy (ICP-OES), provided by Agilent Technologies, Mulgrave, VIC, Australia; Model: Agilent 5900. The ICP-OES was outfitted with an Autosampler; model ASX-560, supplied by Teledyne CETAC Technologies, Omaha, NE, USA. The Sample Introduction System included a SeaSpray U-Series concentric glass nebulizer (Agilent Technologies, Mulgrave, VIC, Australia; part no. G8010-60255); a double pass glass cyclone spray chamber compatible with the (Agilent Technologies, Mulgrave, VIC, Australia) systems; and a one-piece ICP-OES torch for aqueous samples; p/n G8010-60228.
The ICP-OES operating conditions are presented in Table 1.
Table 1.
ICP-OES operating conditions.
All Mass determinations on the samples were made on an analytical balance; RADWAG AS220; RADWAG Wagi Elektroniczne, Radom, Poland; maximum capacity: 220 g; readability: 0.1 mg. The digestion of the samples was completed using an electrical Sand Bath; SD type, supplied by Harry Gestigkeit GmbH; Düsseldorf, Germany [16].
2.3. Preparation of the Samples
In the present study, an optimal multi-acid-digestion scheme has been established to effectively extract HREEs and hard rock mineral phases from complex geological matrices. All of the geological samples were dried; they were all milled to a fine powder (<75 µm); a representative portion of each was accurately measured out (0.25 g). They were placed in a 150 mL PTFE beaker. A small amount (1 mL) of ultrapure deionized water was added to each beaker to assist in dissolving the mineral phase. The water was allowed to remain on the sample for 1 min before adding 5 mL of 68% nitric acid. The suspension containing the sample was then heated for 30 min at 95 °C. The heat promoted the oxidation of any organic or readily oxidizable material that may have existed in the mineral phase [16]. Following the heating process, 1 mL of 30% H2O2 was added dropwise while maintaining the temperature at 95 °C for 5 min. Hydrogen peroxide assisted in further oxidation of any remaining organic material, as well as sulfide bearing phases [17]. Next, 5 mL of 37% Hydrochloric (HCl) were added. The mixture remained at 95 °C for 15 min. HCl helped break down carbonates, oxides, sulfides, and other minerals that contained metals [18]. Then, 5 mL of 40% hydrofluoric acid (HF) were added gradually to the mixture, which had now cooled slightly. The mixture was heated again at 110 °C for 30 min. In addition to promoting further breakdown of the silicate matrix, it produced volatile fluorosilicon compounds. To avoid producing insoluble fluoride phases that could prevent complete dissolution of the sample matrix, HF is added last [19]. Once the digestion was completed, the mixture was treated with 2 milliliters of 70% perchloric acid (HCLO4). The mixture was heated between 180 and 190 °C for approximately 50 to 60 min. These conditions permitted any remaining organic material and the hardest, most resistant mineral phases to undergo decomposition [20]. Additionally, it permitted removal of any excess fluoride species that would otherwise interfere with analysis [1]. Heating was discontinued once a concentrated, solidified paste like residue had formed. Care was taken to avoid evaporating the mixture completely until such time as the residue was ready to be dissolved. The residue was then treated with seven 7.5 mL of fresh aqua-regia. The mixture was warmed so as to facilitate dissolution of any remaining metallic phases [21]. Once dissolved, the resultant solution was quantitatively transferred to a 50 mL polyethylene volumetric flask and brought to full volume with de-ionized water. A blank was made up using the same procedures for digestion and dilution as described above. This blank served as a means of assessing any possible contaminants that may arise from the reagents and/or during sample handling. Final solutions were analyzed using Inductively Coupled Plasma Optical Emission Spectrometry (ICP-OES) for determining HREE content. Corresponding digests were also analyzed using Inductively Coupled Mass Spectrometry (ICP-MS), and these results were utilized as references for selecting analytical lines and evaluating the method.
ICP-MS Reference Measurements
A Thermo Scientific iCAP MSX single quadrupole ICP-MS was used to determine reference HREE concentrations. The monitored isotopes included 157Gd, 160Gd, 159Tb, 163Dy, 165Ho, 166Er, 170Er, 169Tm, 172Yb, and 175Lu. Calibration over the range 0.5–100 ppb was achieved through external calibration. Rhodium and rhenium were added as internal standards at a final concentration of 10 ppb. All samples were initially digested in an acidic solution consisting of HClO4, HF, and HNO3. High concentration samples required a dilution of 1:50 prior to ICP-MS analysis, while lower concentration samples required a dilution of 1:10 using a diluent of 2% v/v HNO3. No collision gas was employed during measurement, and therefore no mathematical interference correction was necessary. Quality control was assessed by using OREAS 460 and a reagent blank. All results that fell below the method quantification limit are reported as <LOQ rather than as zero.
- Safety guidelines:
All heated HClO4 digestions took place inside of an appropriate, wash-down hood for the use of perchloric acid. In addition, organic materials were prohibited from being located near any areas where hot HClO4 was used. Also, all lab workers involved in the preparation of all of the vessels that contained either HClO4 or HF had to have their hands properly washed before they left the hood; otherwise, they would be required to leave immediately and obtain proper hand washing [22,23].
2.4. Sampling Context and Confidentiality Notice
The 24 geochemical samples (TWH_01–TWH_24) were taken over two separate field campaigns. These campaigns took place in the Twihinate Complex. This is a complex that includes both alkaline carbonatites and silicates, located near the town of Bir Gandouz in the northwestern region of Morocco. Because these samples originated from property with license agreements, exact location information was withheld due to company policies regarding confidentiality. In addition, the major element analysis for all samples is contained within Table 2, and HREE concentration results via ICP-MS are provided in Table 3.
Table 2.
Sample set (TWH_01–TWH_24): major-oxide composition (wt.%).
Table 3.
Sample set (TWH_01–TWH_24): ICP-MS reference HREE concentrations (mg kg−1).
Silica content ranged from 52.31 to 62.47 wt.%, alumina content varied in a range from 14.63–20.44 wt.%, potash oxide (K2O) content varied within a range from 9.89 to 13.25 wt.%, and ferric iron oxide (Fe2O3) content varied from 2.56–11.52 wt.% (Table 2), while calcium oxide, sodium oxide, titanium dioxide, magnesium oxide, manganese oxide, and phosphorous pentoxide were all less than 1.0 wt.%. Some samples had elevated levels for those elements listed above. High potassium oxide (K2O) percentages indicate an abundance of K-feldspar, while variations in the percentage of iron oxide (Fe2O3) can be attributed to varying amounts of biotite and/or iron bearing oxides. As such, the composition of the studied materials indicates that they are primarily alkaline silicate rocks. A mineralogical verification of the data would have been beyond the scope of this study [7].
Alkaline rock types that contain low amounts of SiO2 (silica undersaturated) like Nephelinite, Ijolite, phonolite, and Nephelinesyenite have been associated with carbonatites, whereas association of silica saturated rock types is generally rarer [24,25]. This type of geological setting supports the necessity for evaluating the analysis technique on chemically different alkaline samples.
2.5. Preparation of Calibration Standards
The calibration standards for ICP-OES were made from stock solutions of individual elements that had been certified. These stock solutions were diluted into nitric acid; each standard’s concentration can be found in Table 4. The ICP-OES standards were not matched to the multi-acid digests. No internal standard was included in the ICP-OES analysis. A 0.250 g portion of sample was added to 5 mL of 68% HNO3, 5 mL of 37% HCl, 5 mL of 40% HF, 2 mL of 70% HClO4, and 1 mL of 30% H2O2. The residue was then reconstituted with 7.5 mL of aqua regia and diluted to 50.0 mL; this corresponded to a nominal sample equivalent load of 5.0 g/L prior to any additional dilutions. Since digestion involved both evaporation and reconstitution, neither the final composition of acids nor the amount of dissolved solids was determined. Variations in acid concentration, viscosity, surface tension, and dissolved solid loads could potentially impact solution uptake, aerosol generation/transport, nebulizer performance, plasma loading, and the production of excited states for the analytes. While the CRM and spike recovery data provide evidence regarding the overall effects of the procedure being evaluated on the two sample types analyzed, these data also will not substitute for a comparison using either matrix-matched calibrants, standard additions, or an ICP-OES internal standard method. Therefore, residual matrix-dependent biases cannot be eliminated [26].
Table 4.
Calibration-solution concentrations (mg L−1) used for the investigated HREEs.
- Quality-control sequence and background correction:
The quality-assurance process involved a blank calibration solution, a blank solution containing reagents, certified reference materials (CRM), and duplicate samples. Calibration linearity was examined based on an R2 value greater than 0.995 as the acceptable criterion. A blank reagent solution was utilized to assess if contaminants were present during the sample preparation. Each batch of 10 samples contained one CRM that was analyzed to assess instrument drift. Duplicate samples consisted of 30 percent of all the samples. Duplicate samples were placed throughout the sequence of 20 samples [27]. Based on Table 5, background corrections were made by selecting the appropriate correction method for each analyte and its corresponding peak position. Left-side corrections were applied to Gd, Tb, and Dy; Fitted Interpolation was applied to Ho; Right-Side Corrections were applied to Er, Tm, Yb, and Lu.
Table 5.
Background-correction modes used for the selected HREE emission lines.
2.6. Chemometric Optimization and Cloud-Based Dual-Gate Line Selection Workflow
To find candidate ICP-OES emission lines that would be free from interference by major rock forming oxides (Fe2O3, Al2O3, SiO2, TiO2 and P2O5), as well as vanadium and light rare earths, a dual-gate workflow was utilized. All data processing for this study was completed with use of Python 3 via Google Colab. The key steps for data processing are detailed below in Table 6 [28].
Table 6.
Data Processing and Metrological Validation Pipeline.
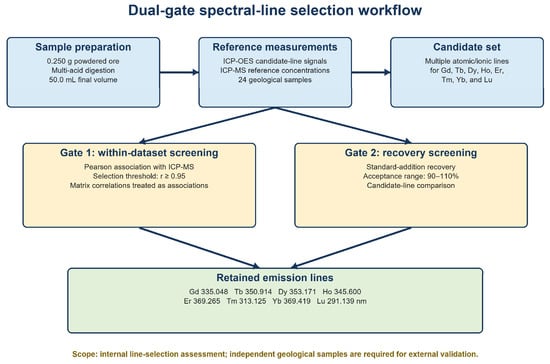
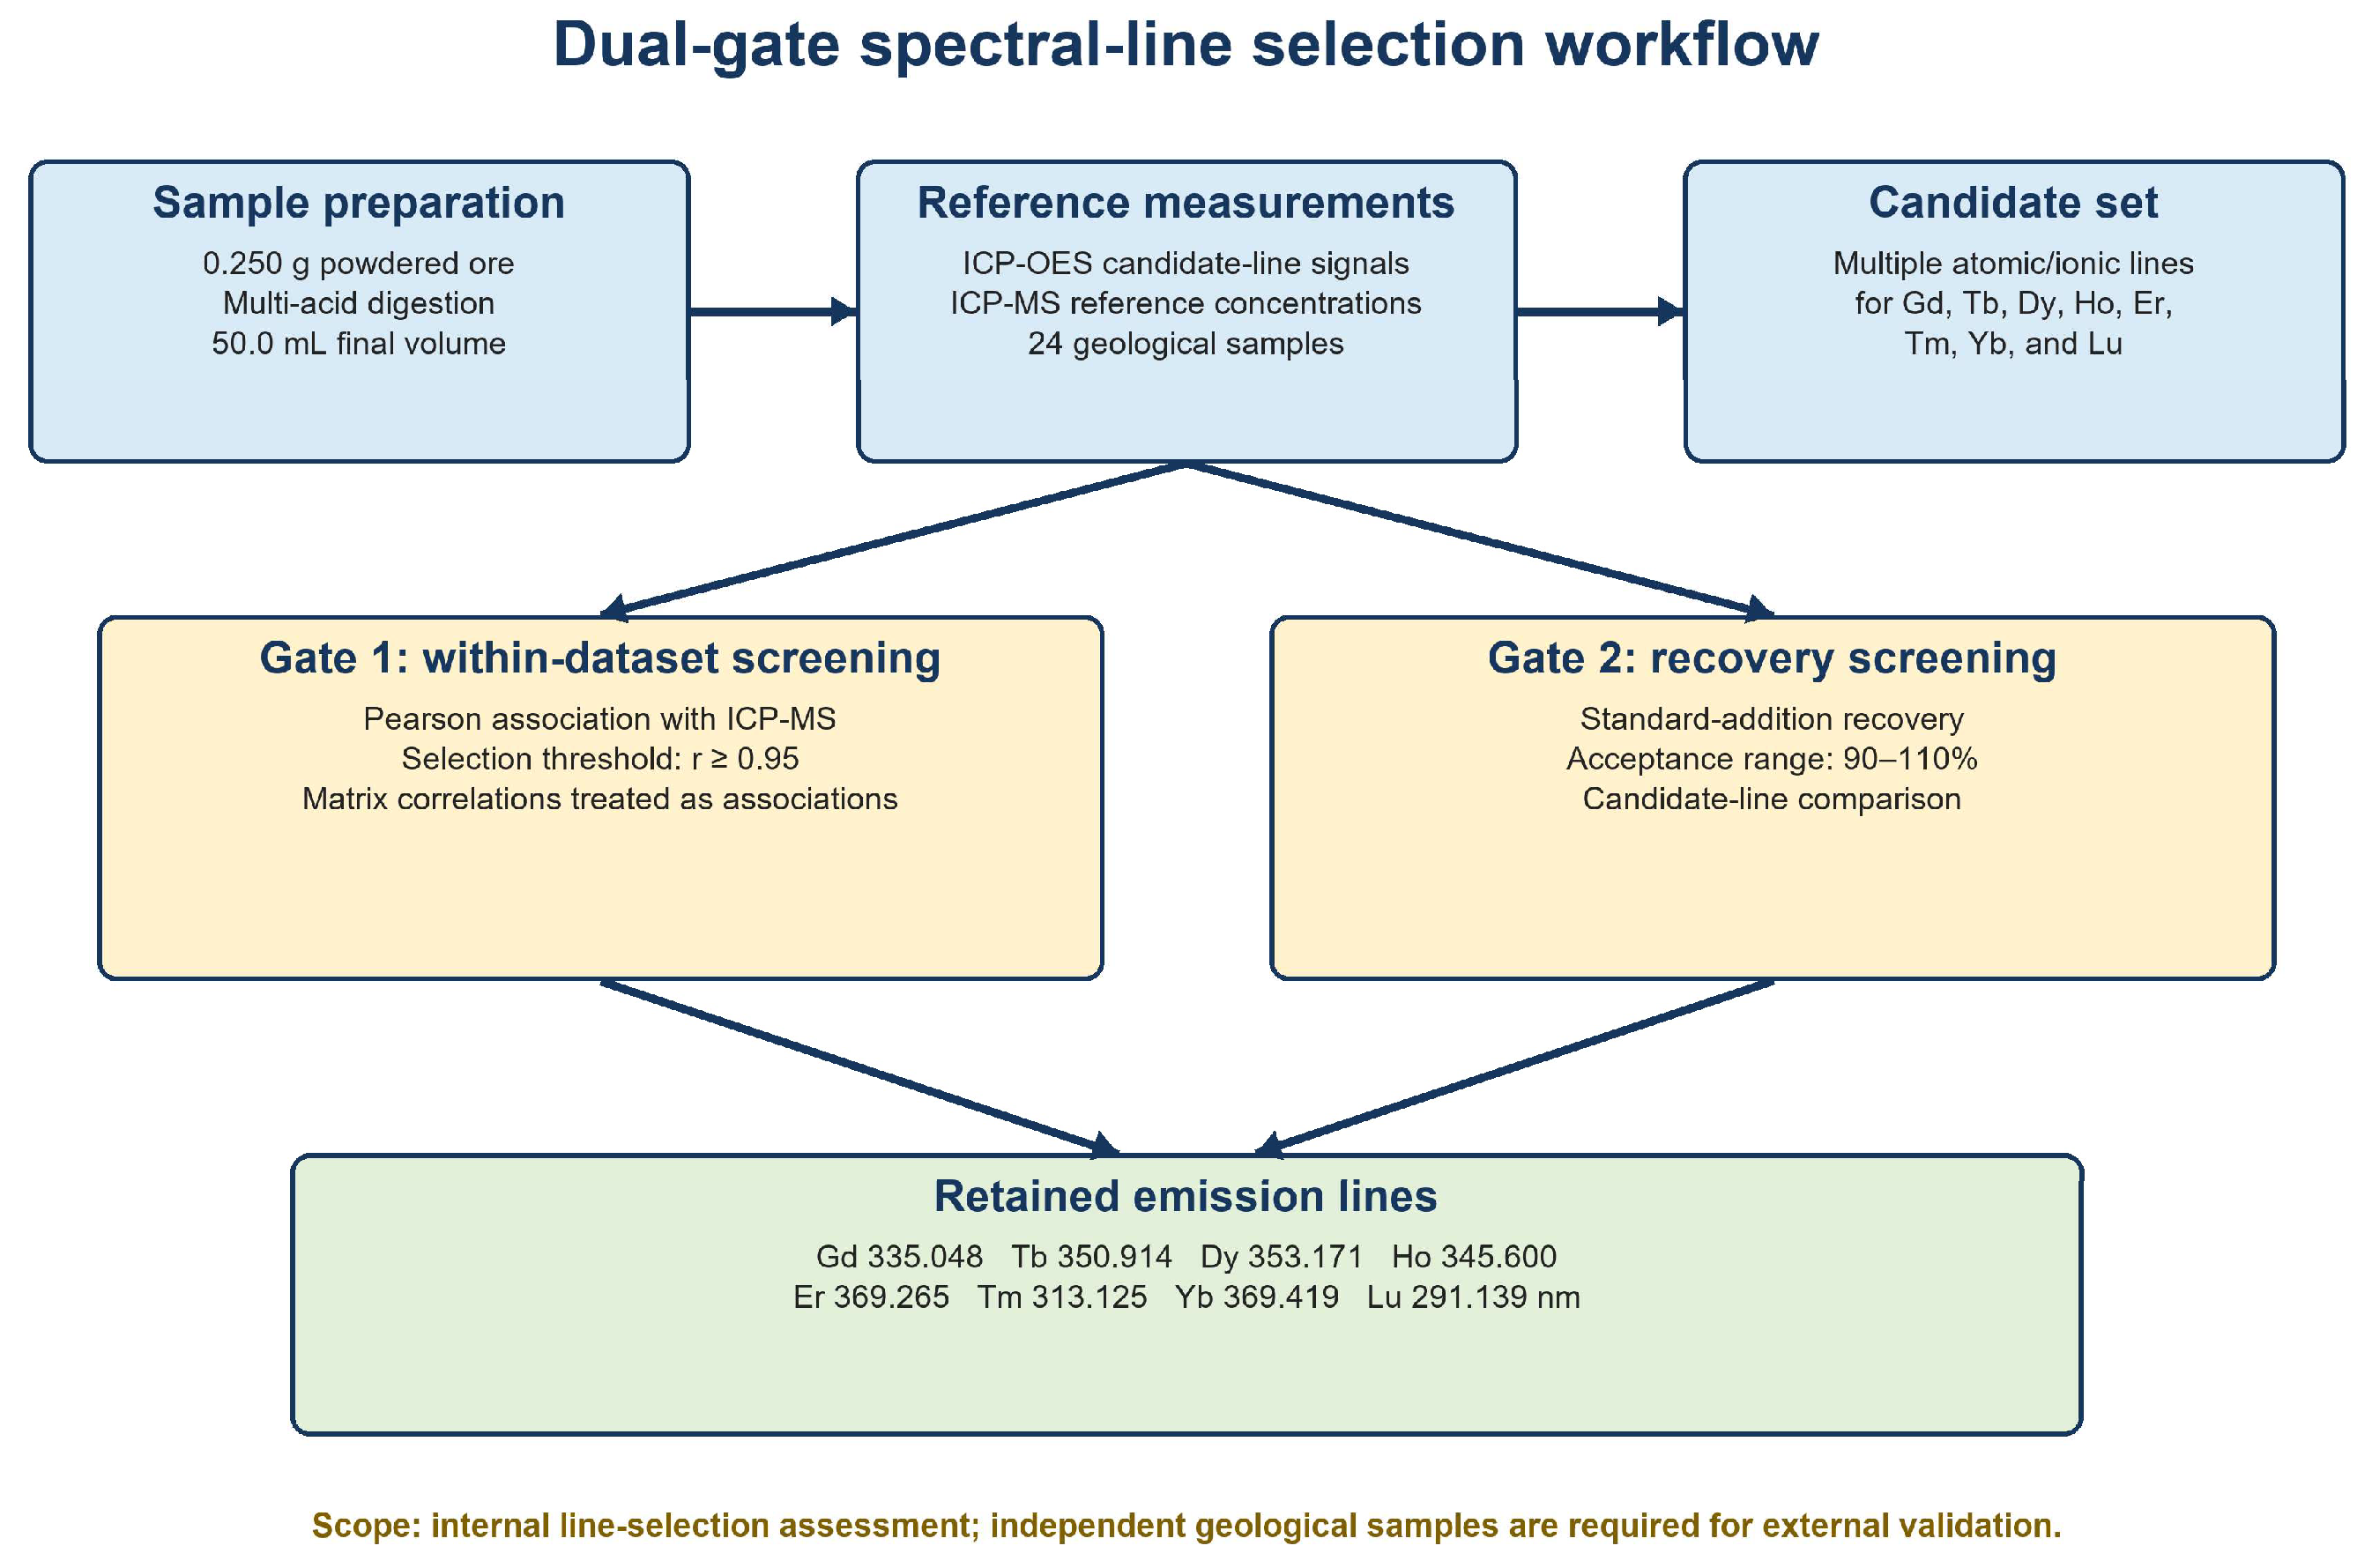
The workflow comprised two sequential screening gates (Figure 1):
Figure 1.
Modular flowchart of the proposed dual-gate (Gate 1/Gate 2) spectral line screening workflow for HREE analysis.
Gate 1 compared 10 possible atomic/ionic emissions for each heavy rare earth element (HREE) as determined by net ICP-OES intensities for 24 different geological samples representative of earth’s crust; the intensities for these possible lines were then correlated to the reference values for HREE (obtained via ICP-MS) from those same 24 samples; those possible lines whose correlation coefficients (r) were ≥0.95 were selected for consideration. Gate 1 also looked into how other elements in each sample affected the intensity correlations, as well as whether this indicated the presence of a matrix effect [29].
Gate 2 continued evaluation on the remaining lines using standard additions. Lines producing recoveries of 90–110% under the test spike conditions were selected for use. This assessment did not provide absolute protection from all plasma and/or matrix effects; it only provided a measure of performance under the testing conditions [30].
The overall wavelength selection strategy can be mathematically expressed as:
- L: Initial set of candidate analytical emission wavelengths evaluated for each.
- Loptimized: Final chemometrically optimized set of analytical emission wavelengths
- selected for HREE determination.
- λi: The ith candidate analytical emission wavelength belonging to L.
- ri: Correlation coefficient of the calibration curve at wavelength λi, used to assess linearity.
- Ri: Recovery (%) obtained at wavelength λi, used to evaluate method accuracy.
3. Results and Discussion
3.1. Spectral Line Selection and Statistical Optimization Strategy
The candidate emission line intensities from ICP-OES have been compared to the ICP-MS reference concentrations for the 24 geological samples. The correlation coefficient, Pearson’s r, has been applied as a within-dataset screening criterion where r values greater than 0.95 indicate retention. Because the same samples are used for further comparisons, the use of this screening method is intended to provide no measure of performance when using an independent sample set [31,32].
3.1.1. Linear Tracking and Within-Dataset Screening
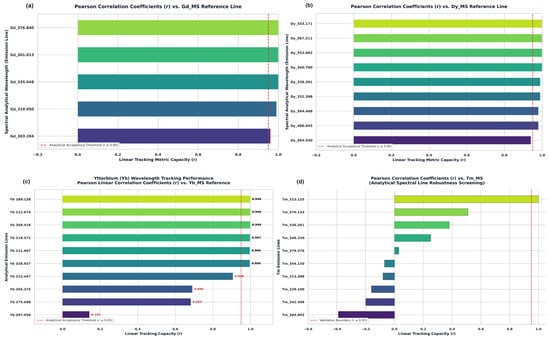
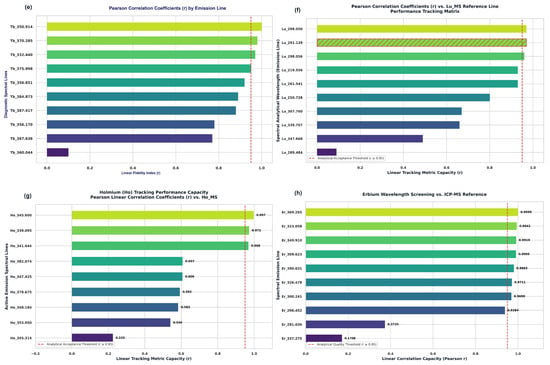
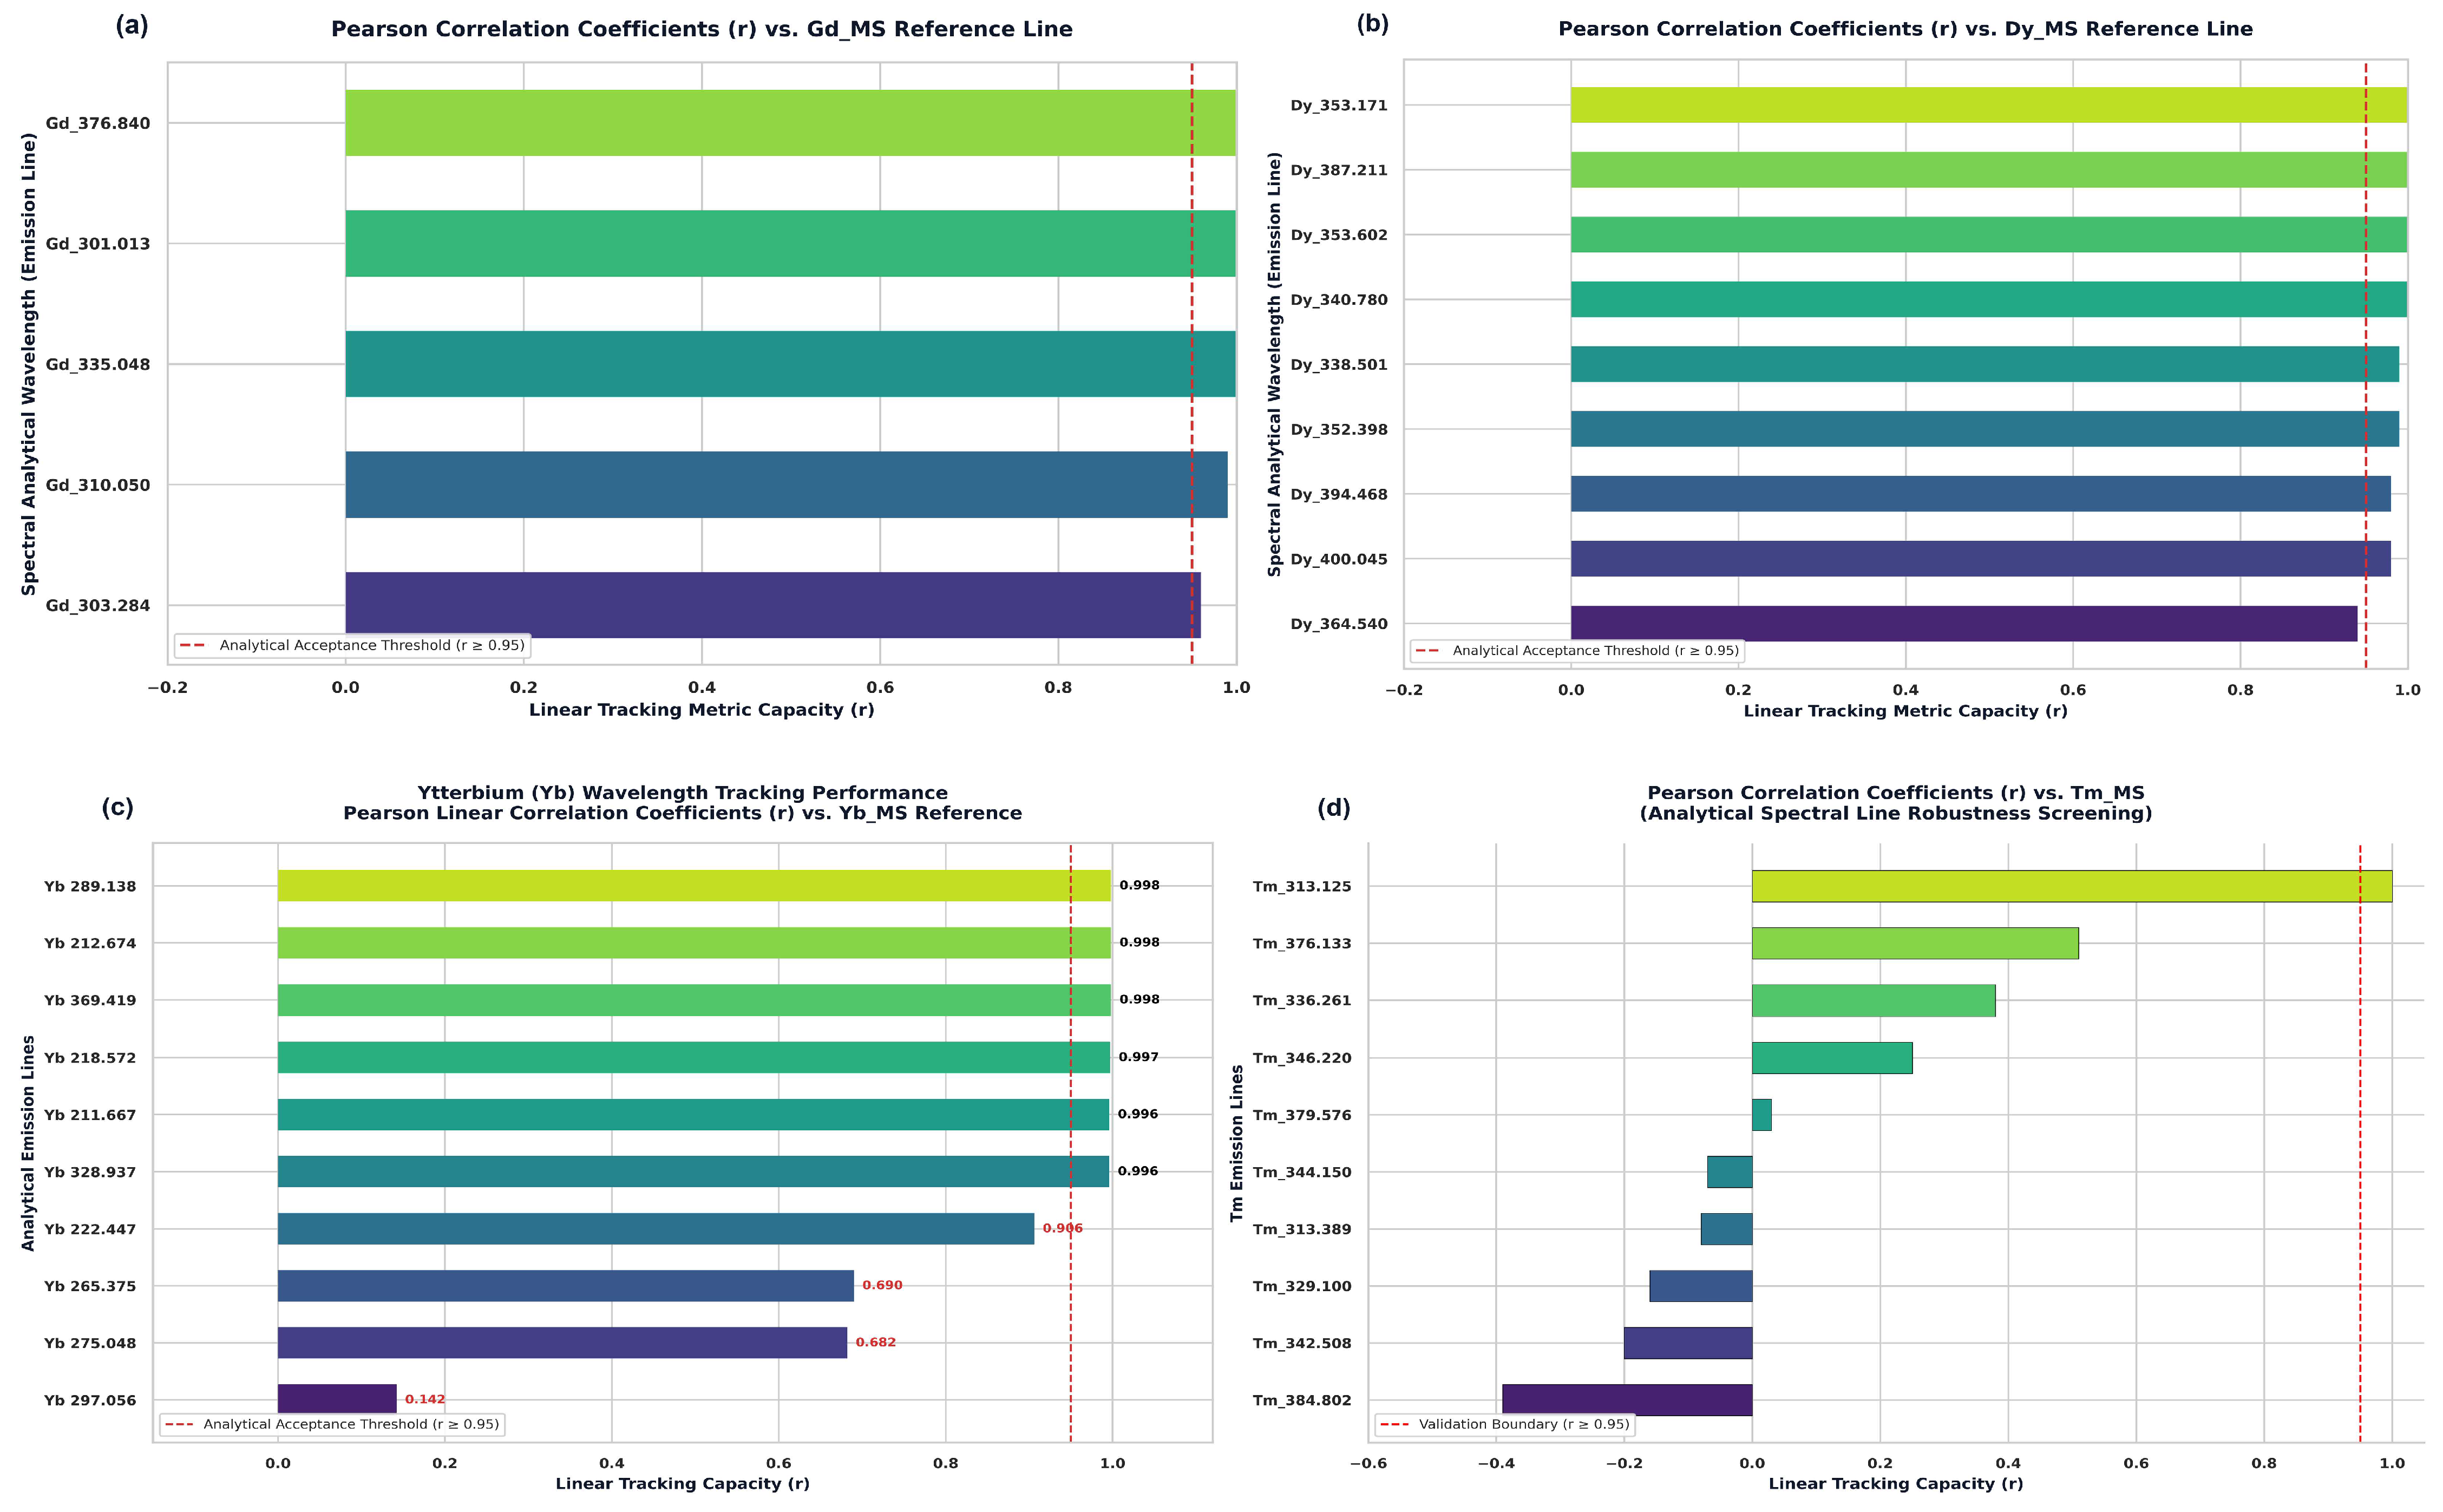
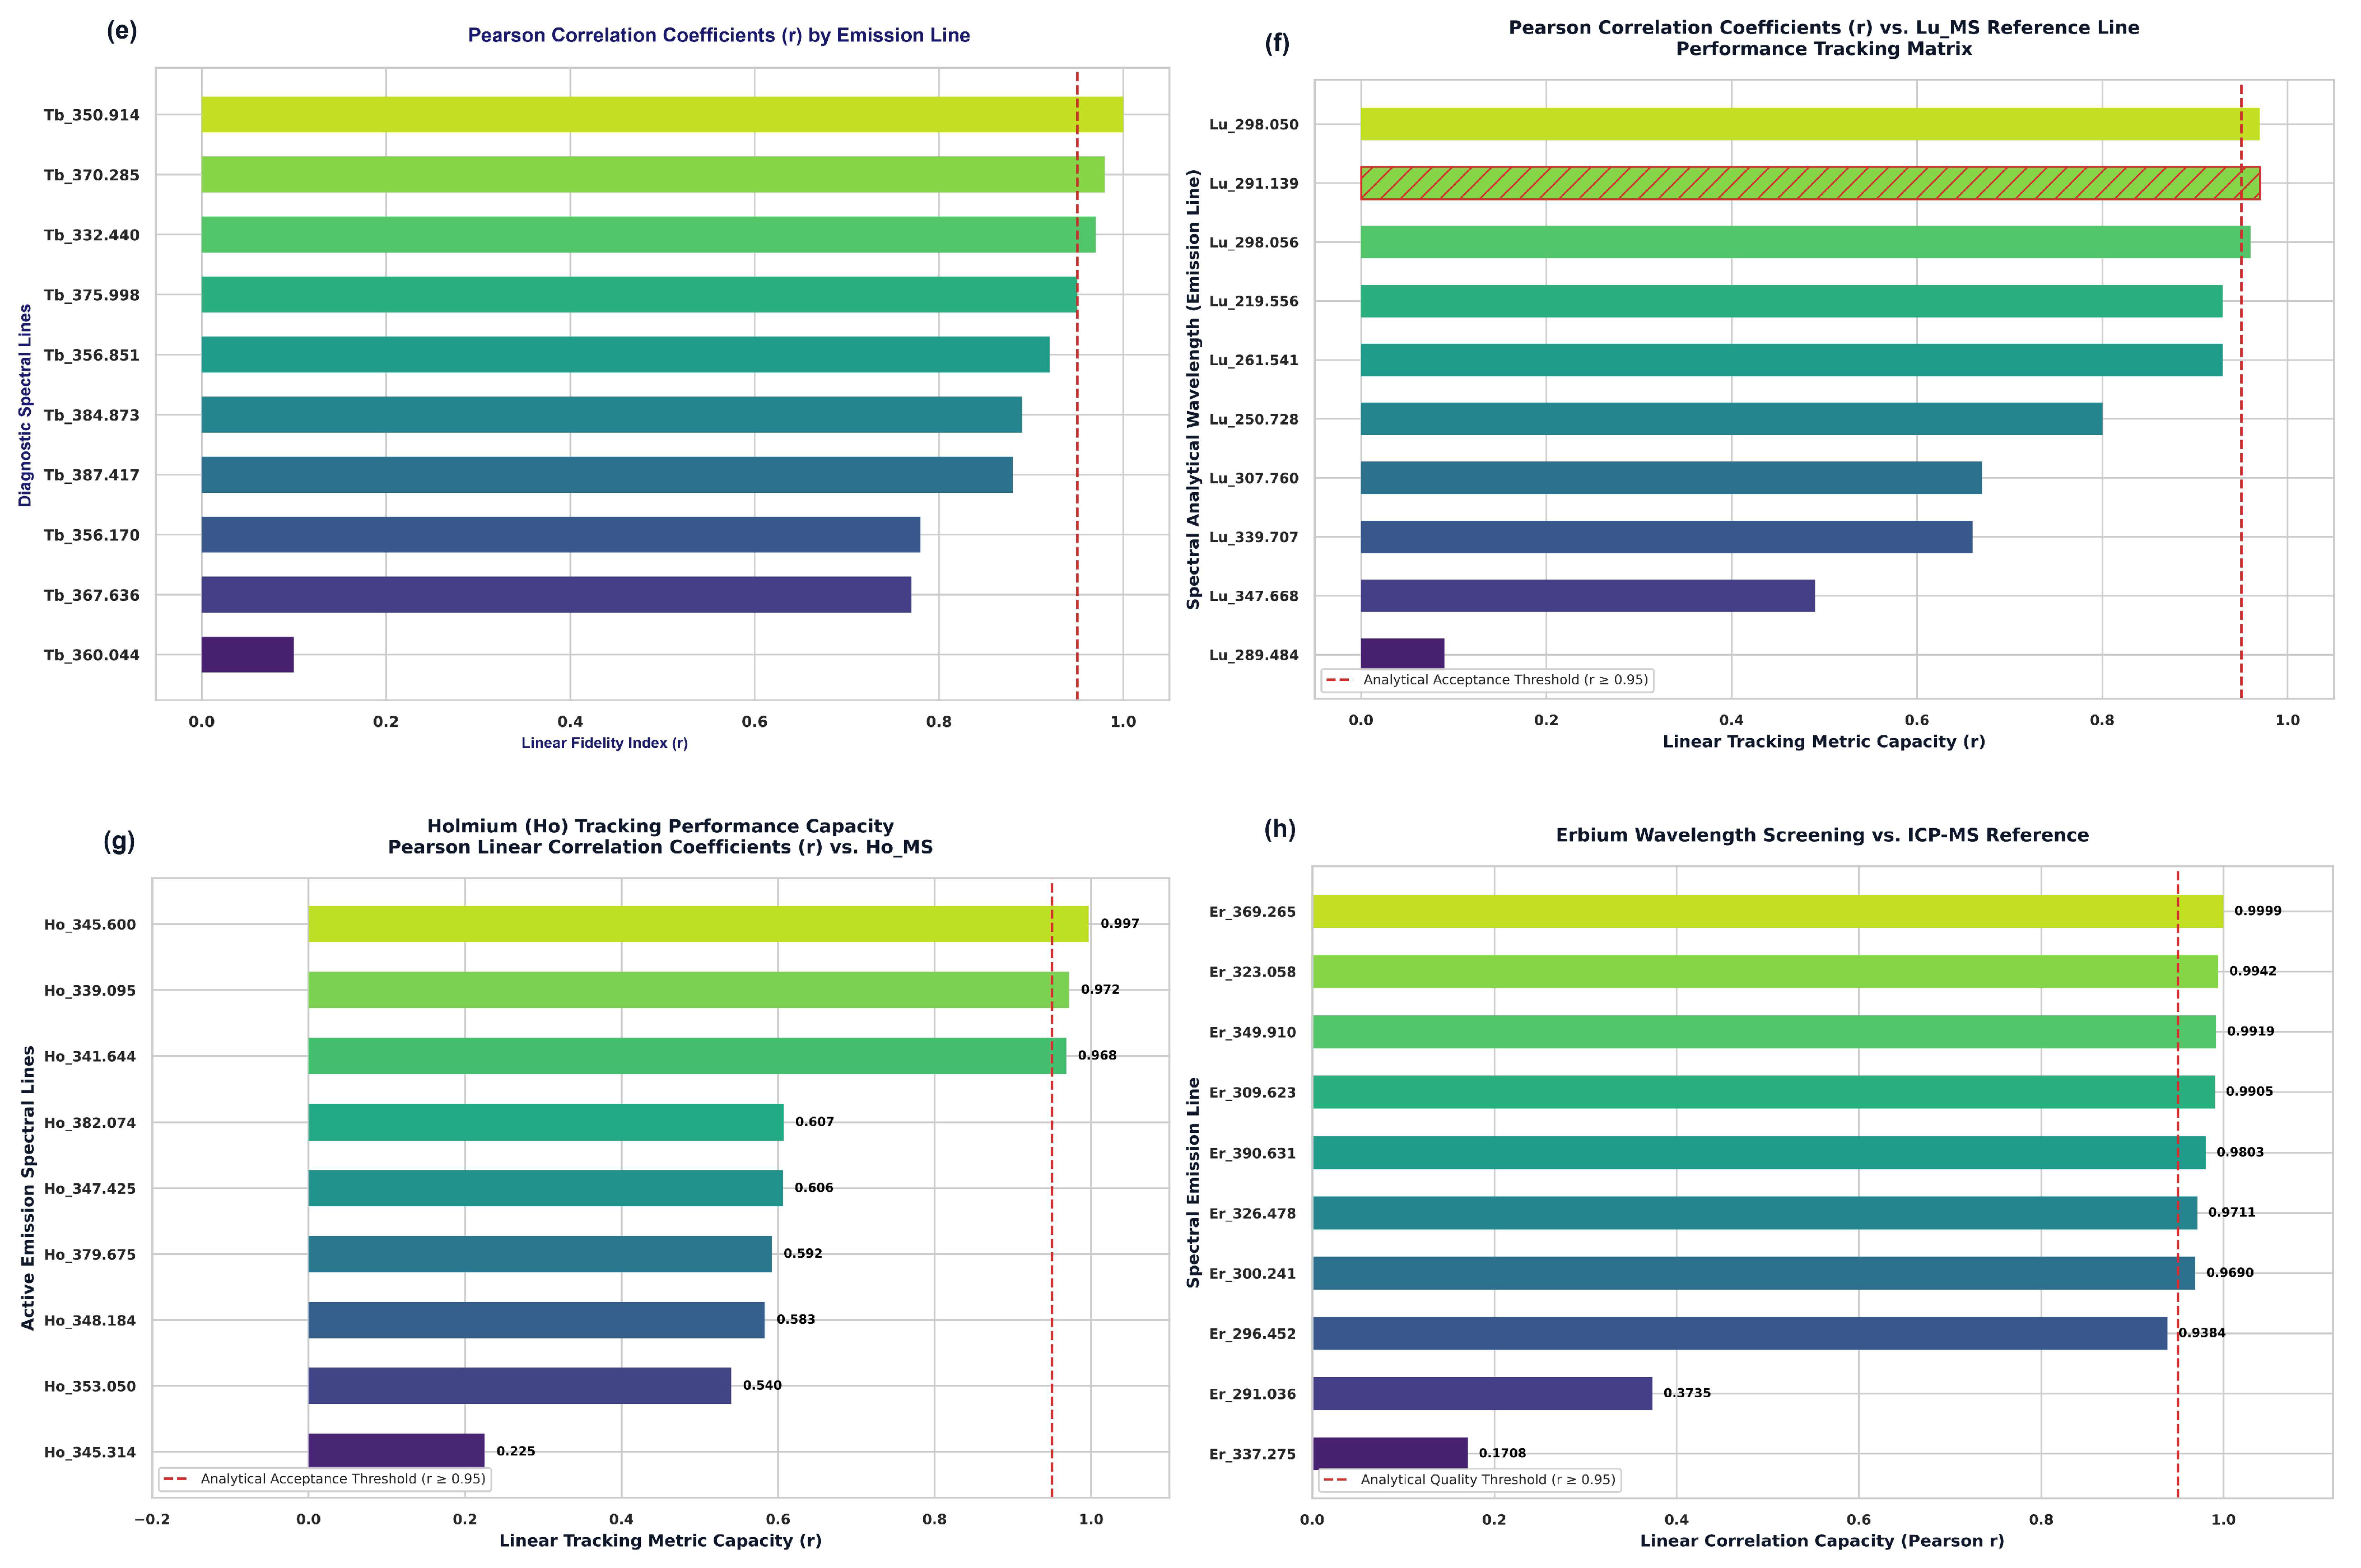
There were significant differences among the candidate emission lines tested via correlation analysis (Figure 2) relative to each other. Both the Gd and Dy lines that were tested met the specified screening criteria for r values > 0.95 in the data set of 24 samples. These results suggest that there is a linear relationship between the ICP-MS reference concentrations and the samples examined in these studies. Therefore, they do not represent any predictive capability regarding how well these lines would perform on unknown samples or completely eliminate potential plasma- or matrix-related influences [33].
Figure 2.
Pearson Correlation Coefficients (r) of Candidate ICP-OES Emission Lines vs. Corresponding Reference Concentration Values from ICP-MS for Each Investigated Heavy Rare Earth Element: (a) Gadolinium; (b) Dysprosium; (c) Ytterbium; (d) Thulium; (e) Terbium; (f) Lutetium; (g) Holmium; (h) Erbium. For each panel, Emission Lines were Ranked in Order of Highest to Lowest r. Bar Color Indicates Ranking. Red Dashed Vertical Line Indicates Acceptance Threshold (r = 0.95).
The strong wavelength dependence of the measured laser wavelengths for Yb, Er, Ho, Tb, Lu, and Tm is demonstrated by their significantly higher r-values. Of the three erbium values reported, two are strongly dependent upon concentration with an r-value of 0.1708, and one value does not meet the defined correlation as it has a poor r-value of 0.142. Two of the holmium values have very high r-values (0.997 and 0.998) and therefore correlate well to the reference concentrations. All three Lutetium values that are greater than 290 nm track reference concentrations very well, but one value at 289.484 nm tracks the reference concentrations very poorly (r ≈ 0.09). Only one Thulium value (at 313.125 nm) approaches the correlation threshold (r ≈ 0.98). However, another Thulium value (at 384.802 nm) shows a negative relationship (r ≈ −0.40) to reference concentrations. Since each element’s spectral line strength was determined from the same dataset, we could not use our results to determine if there is interference between different spectral lines. Therefore, poor correlation values (weakly or negatively correlated) can be due to either spectral interferences between elements, background contamination, unstable signals, or some form of geochemical covariance [34,35].
3.1.2. Geochemical Covariation and Candidate Matrix Effects
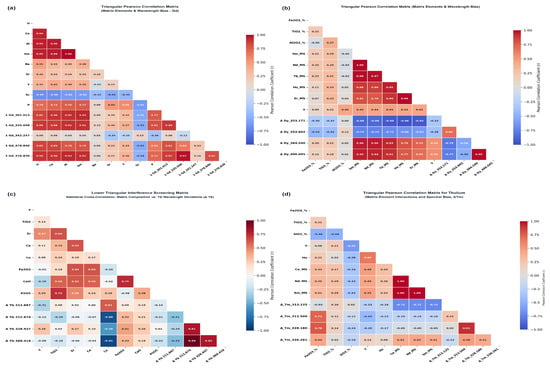
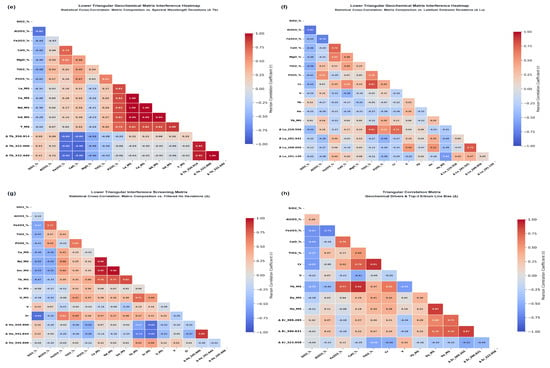
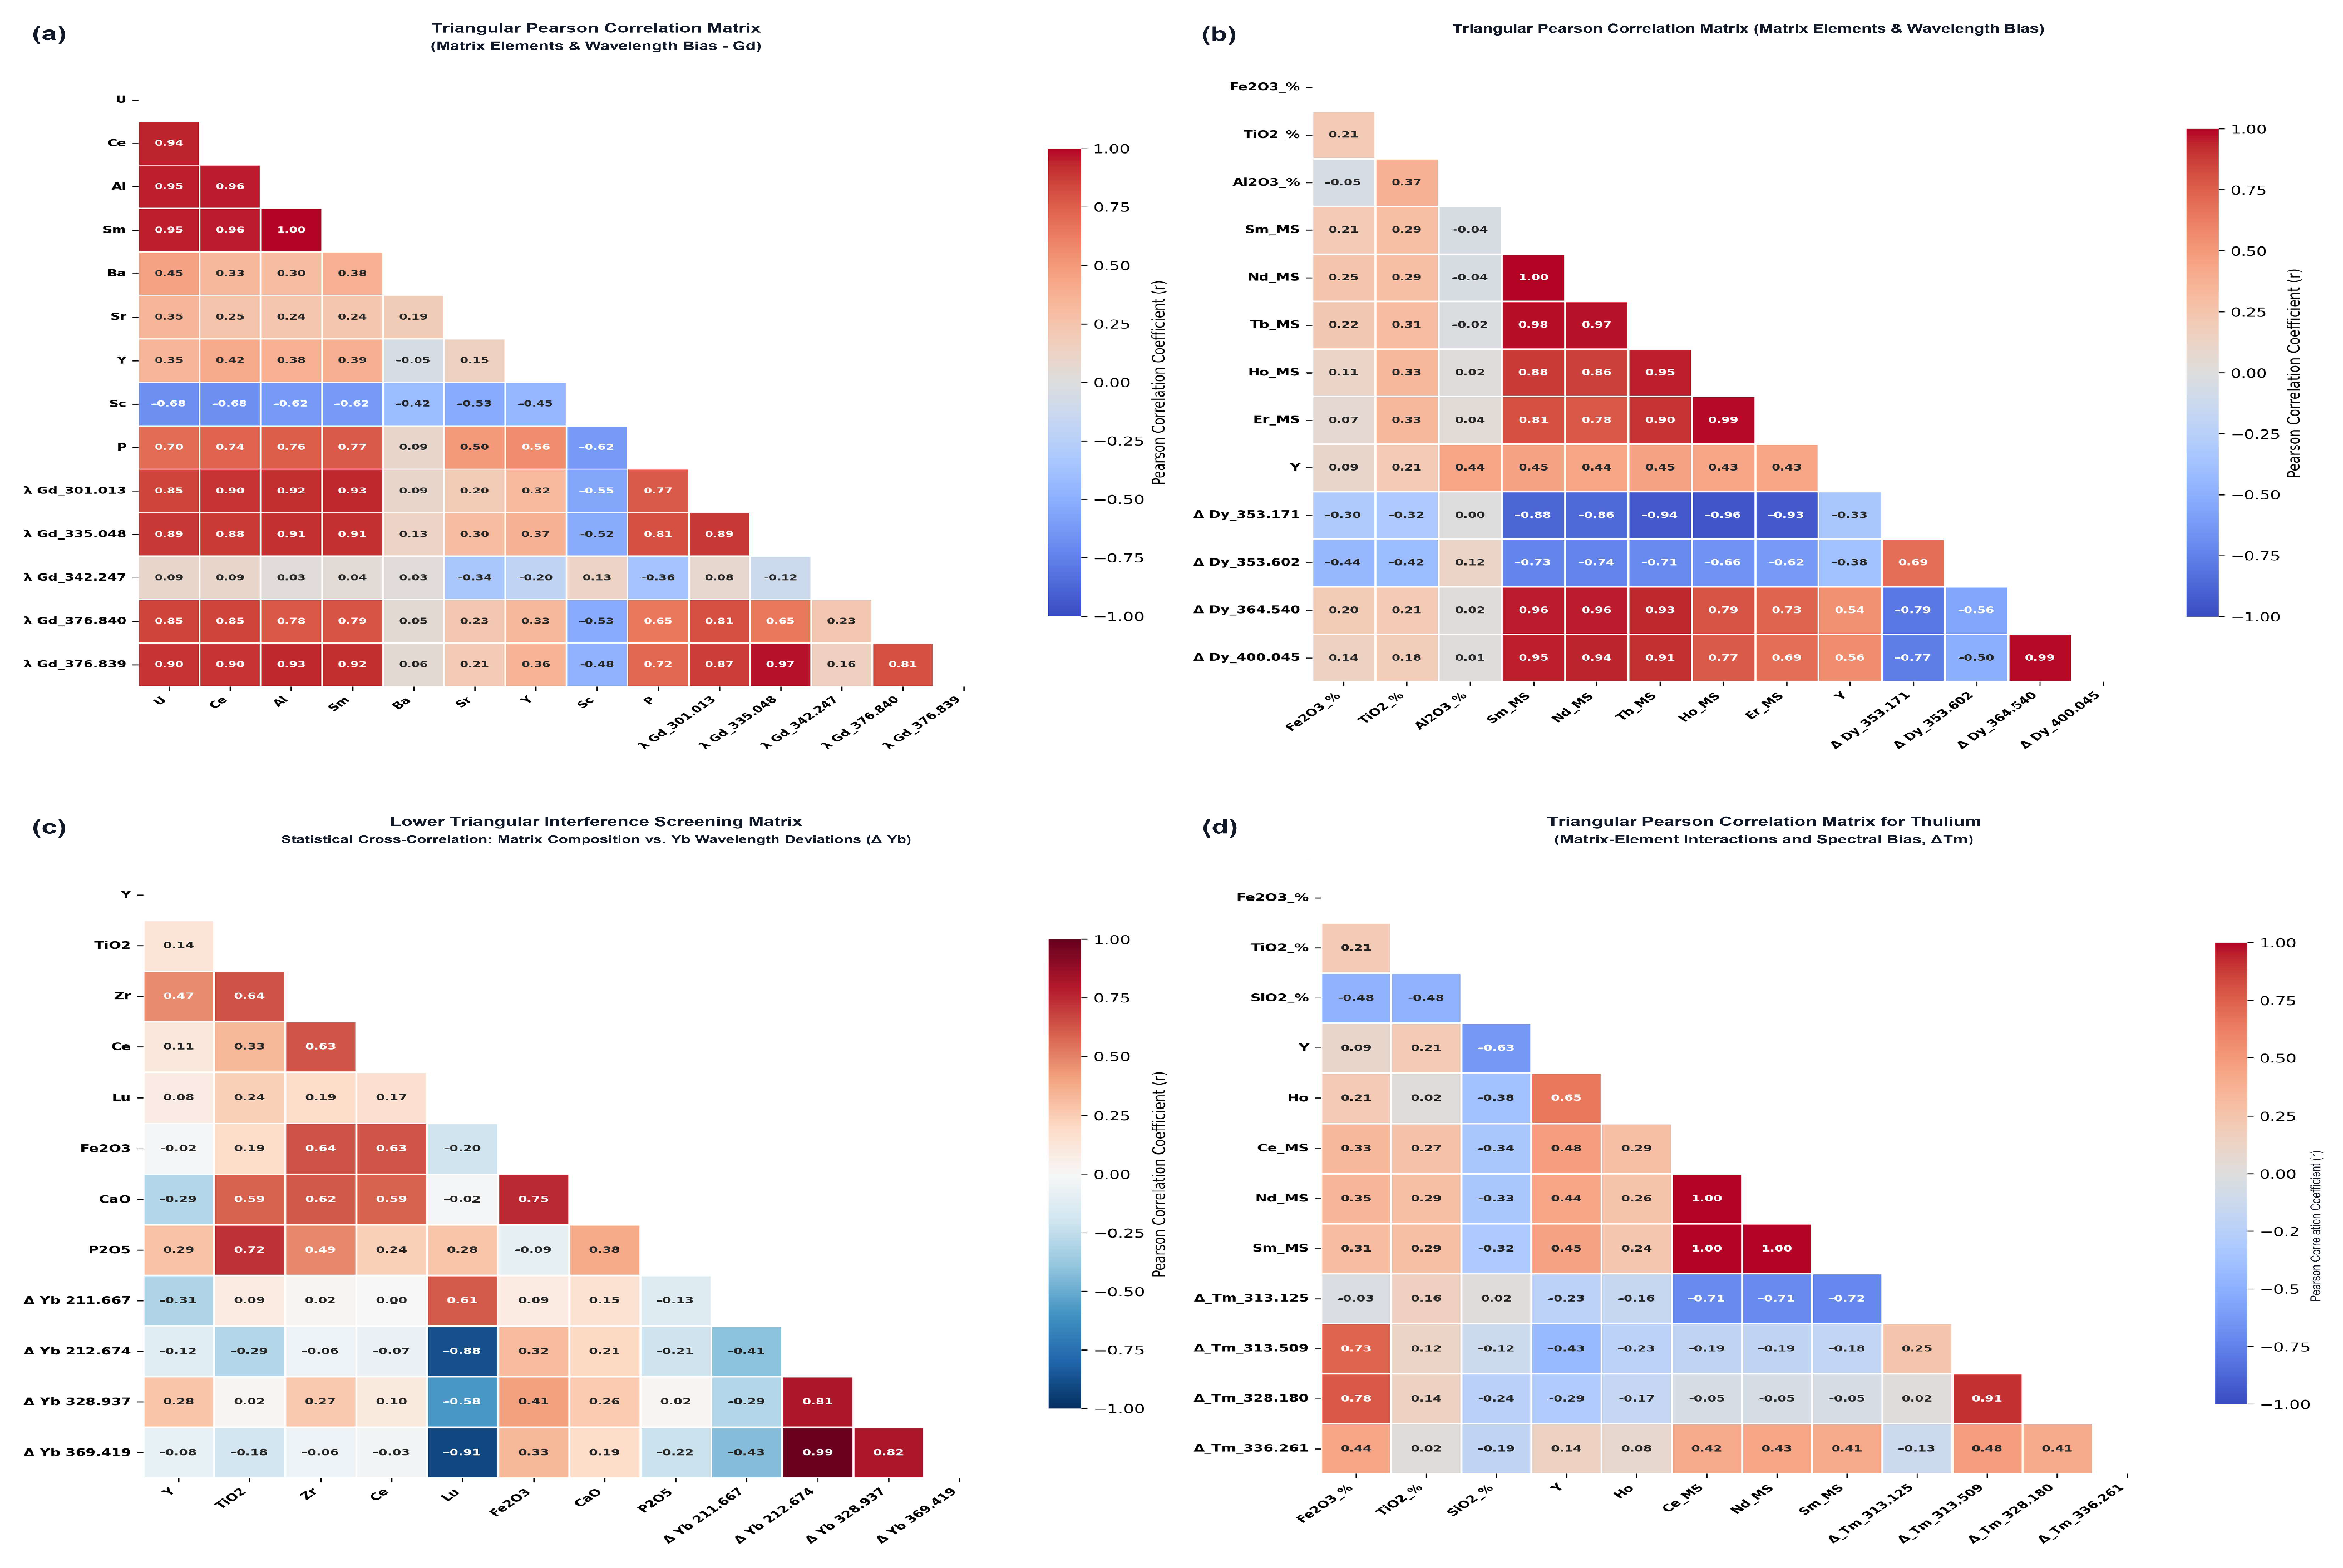
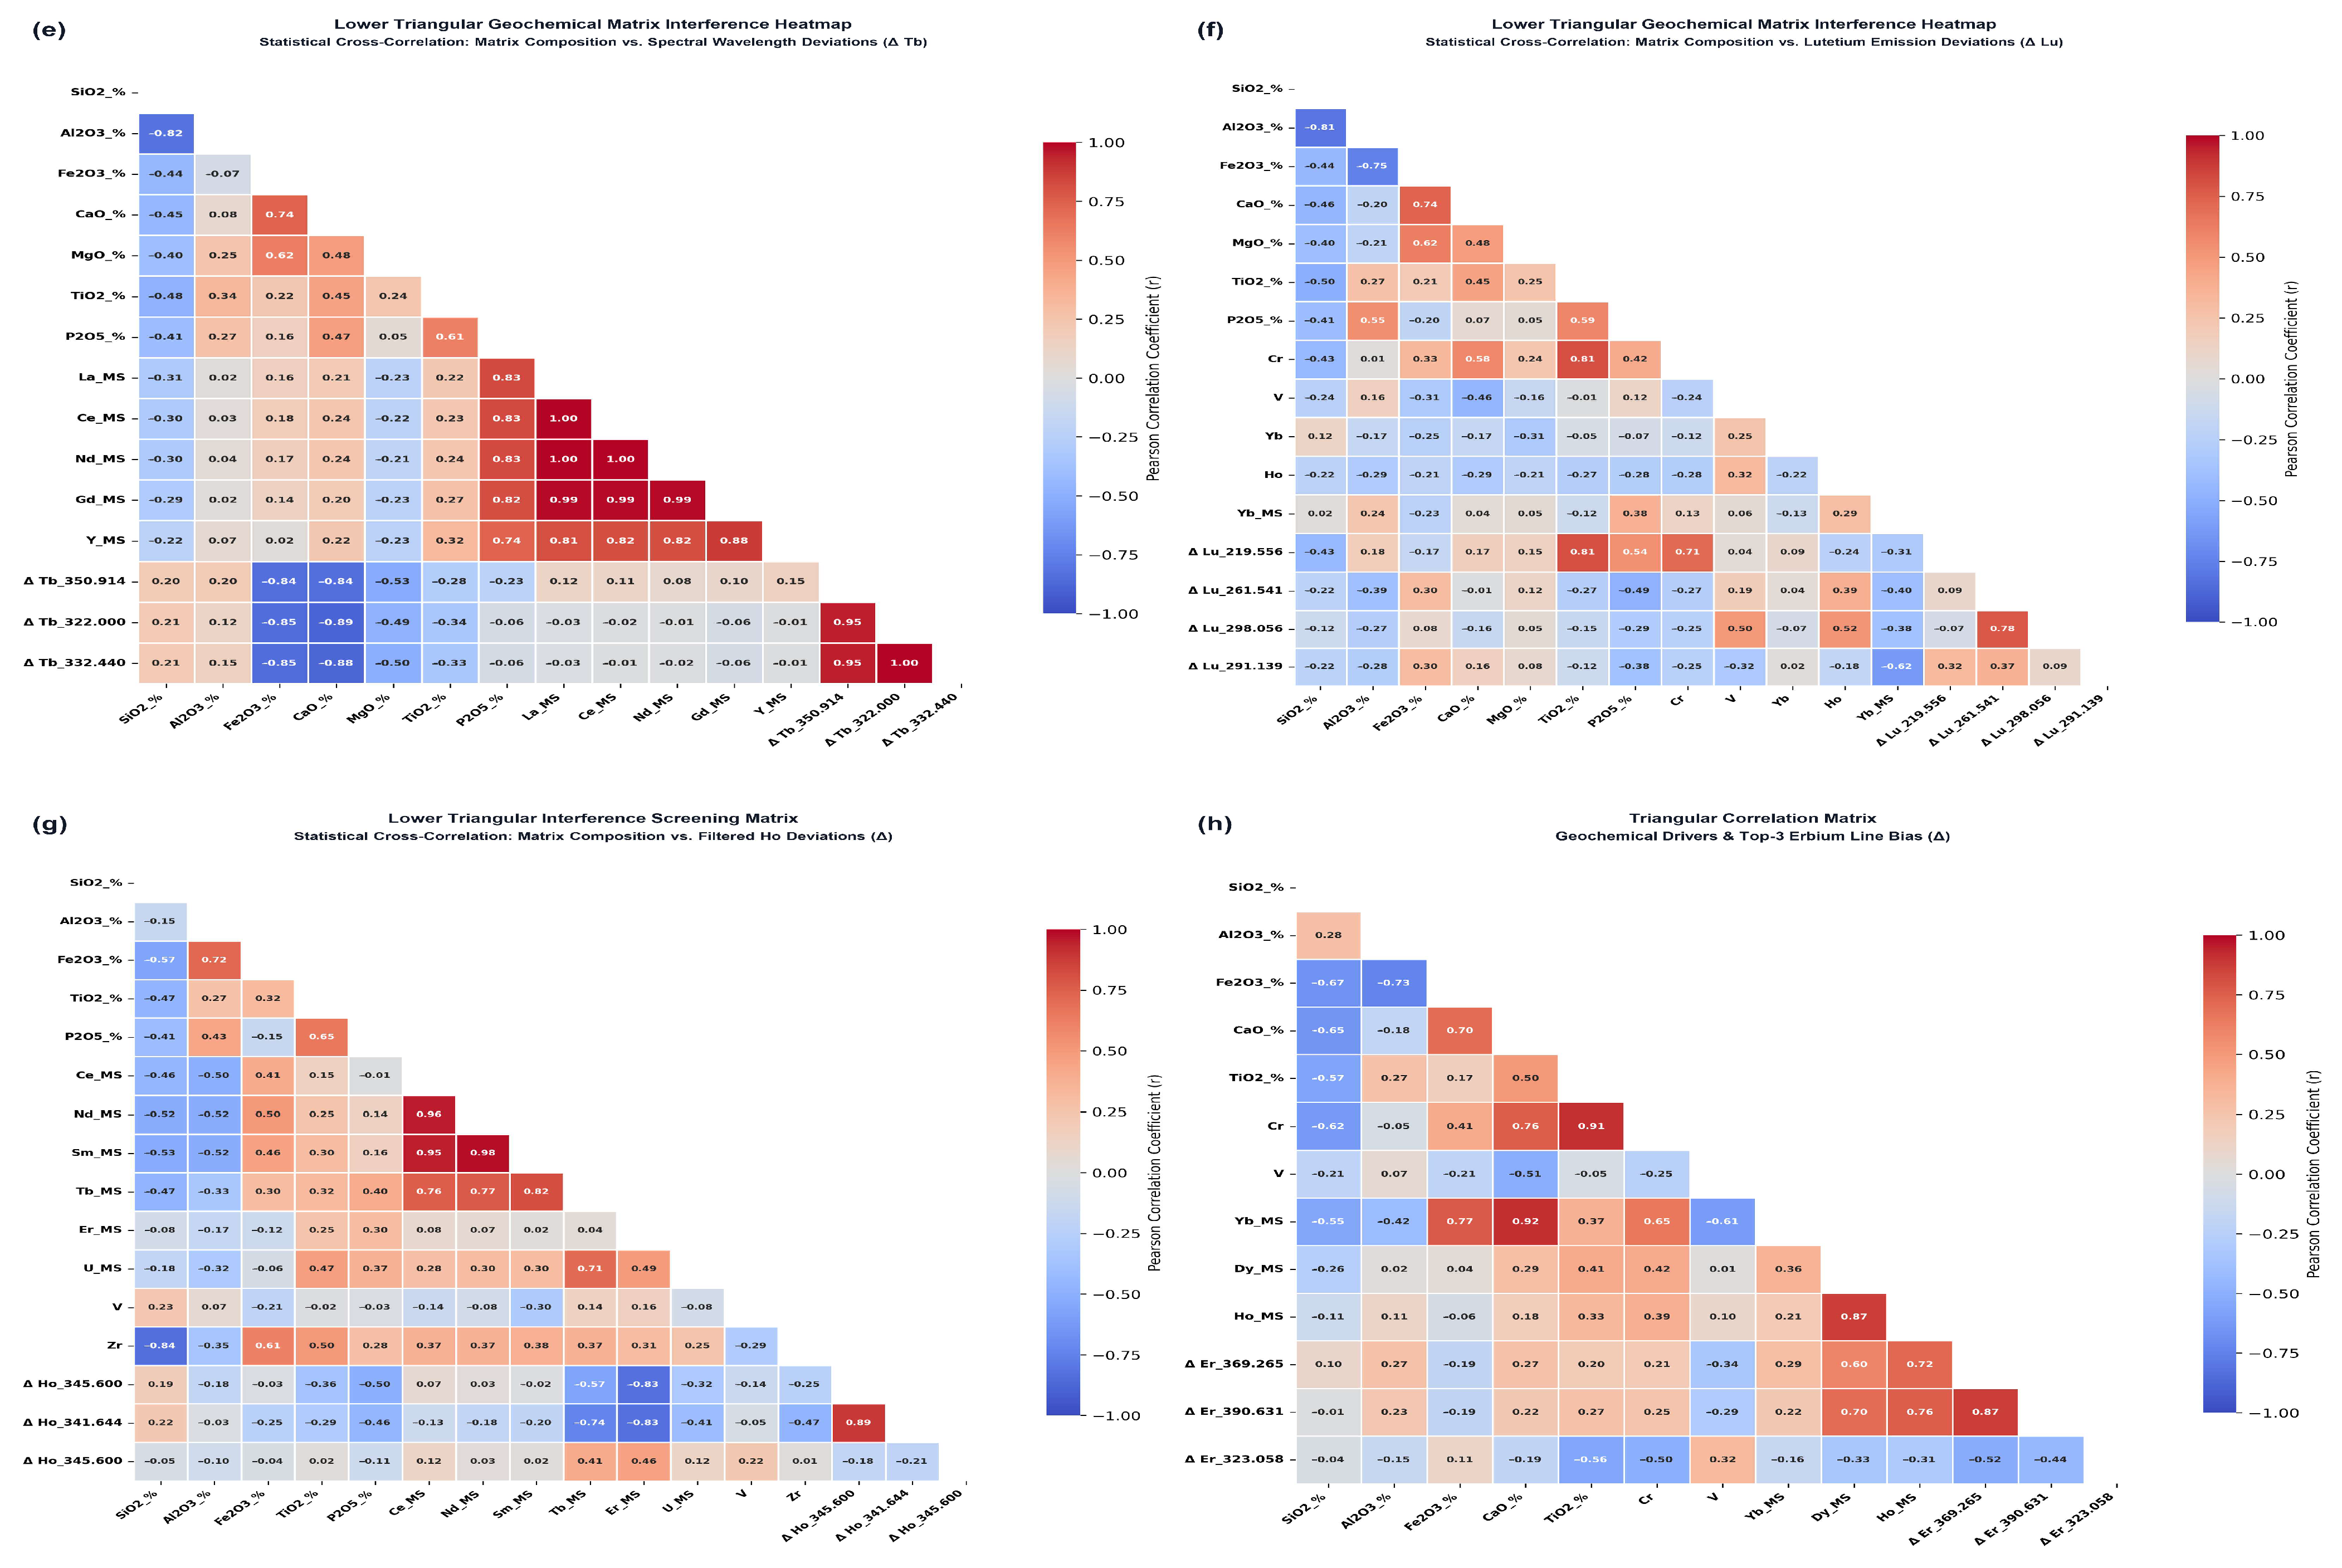
The correlation patterns identified in Figure 3 show which elemental combinations are worthy of investigation. However, these patterns do not provide a means to separate direct spectral interferences from covariation due to differences in mineralogy or geochemistry [36].
Figure 3.
Lower-triangular Pearson correlation matrices mapping the interactions between potential interfering elements and candidate HREE emission lines: (a) Gd; (b) Dy; (c) Yb; (d) Tm; (e) Tb; (f) Lu; (g) Ho; (h) Er. Red and blue color gradients represent positive and negative Pearson correlation coefficients, respectively.
In Figure 3, the patterns observed within the correlations are considered to be associations with respect to each element pair identified; therefore, these associations do not prove the existence of a particular mechanism responsible for an interaction. For example, a pattern may indicate that there is either spectral overlap occurring (due to atomic emission spectra being similar) or that continuum background effects are present due to overlapping absorption features of other minerals. Mineral host sharing, major phase dilution, or geochemical covariance may also explain the presence of certain patterns. Atomic-line proximity in combination with application of the recovery screen can provide a basis for identifying potential interference risk; however, independent variation of Fe, Ti, V, Al, and P was not performed while maintaining constant HREE concentrations. Therefore, the potential interference mechanisms outlined in Table 7 are offered as possible explanations that require verification through controlled single-interferent experiments and local spectral profile analysis [37].
Table 7.
Candidate spectral-interference assignments for the retained HREE lines and rejected Er 337.271 nm line).
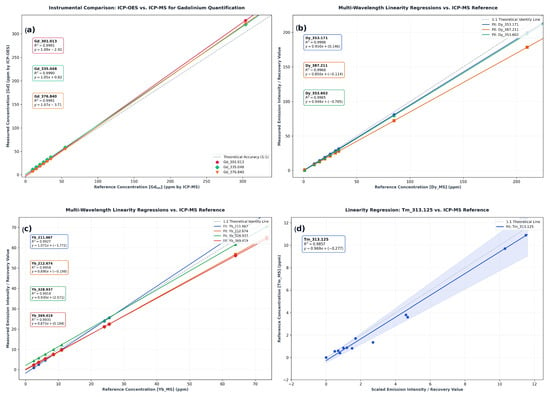
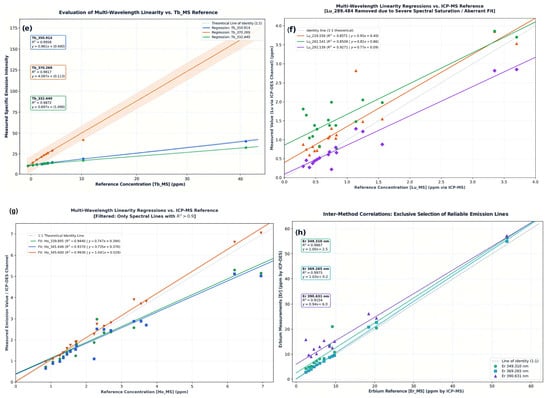
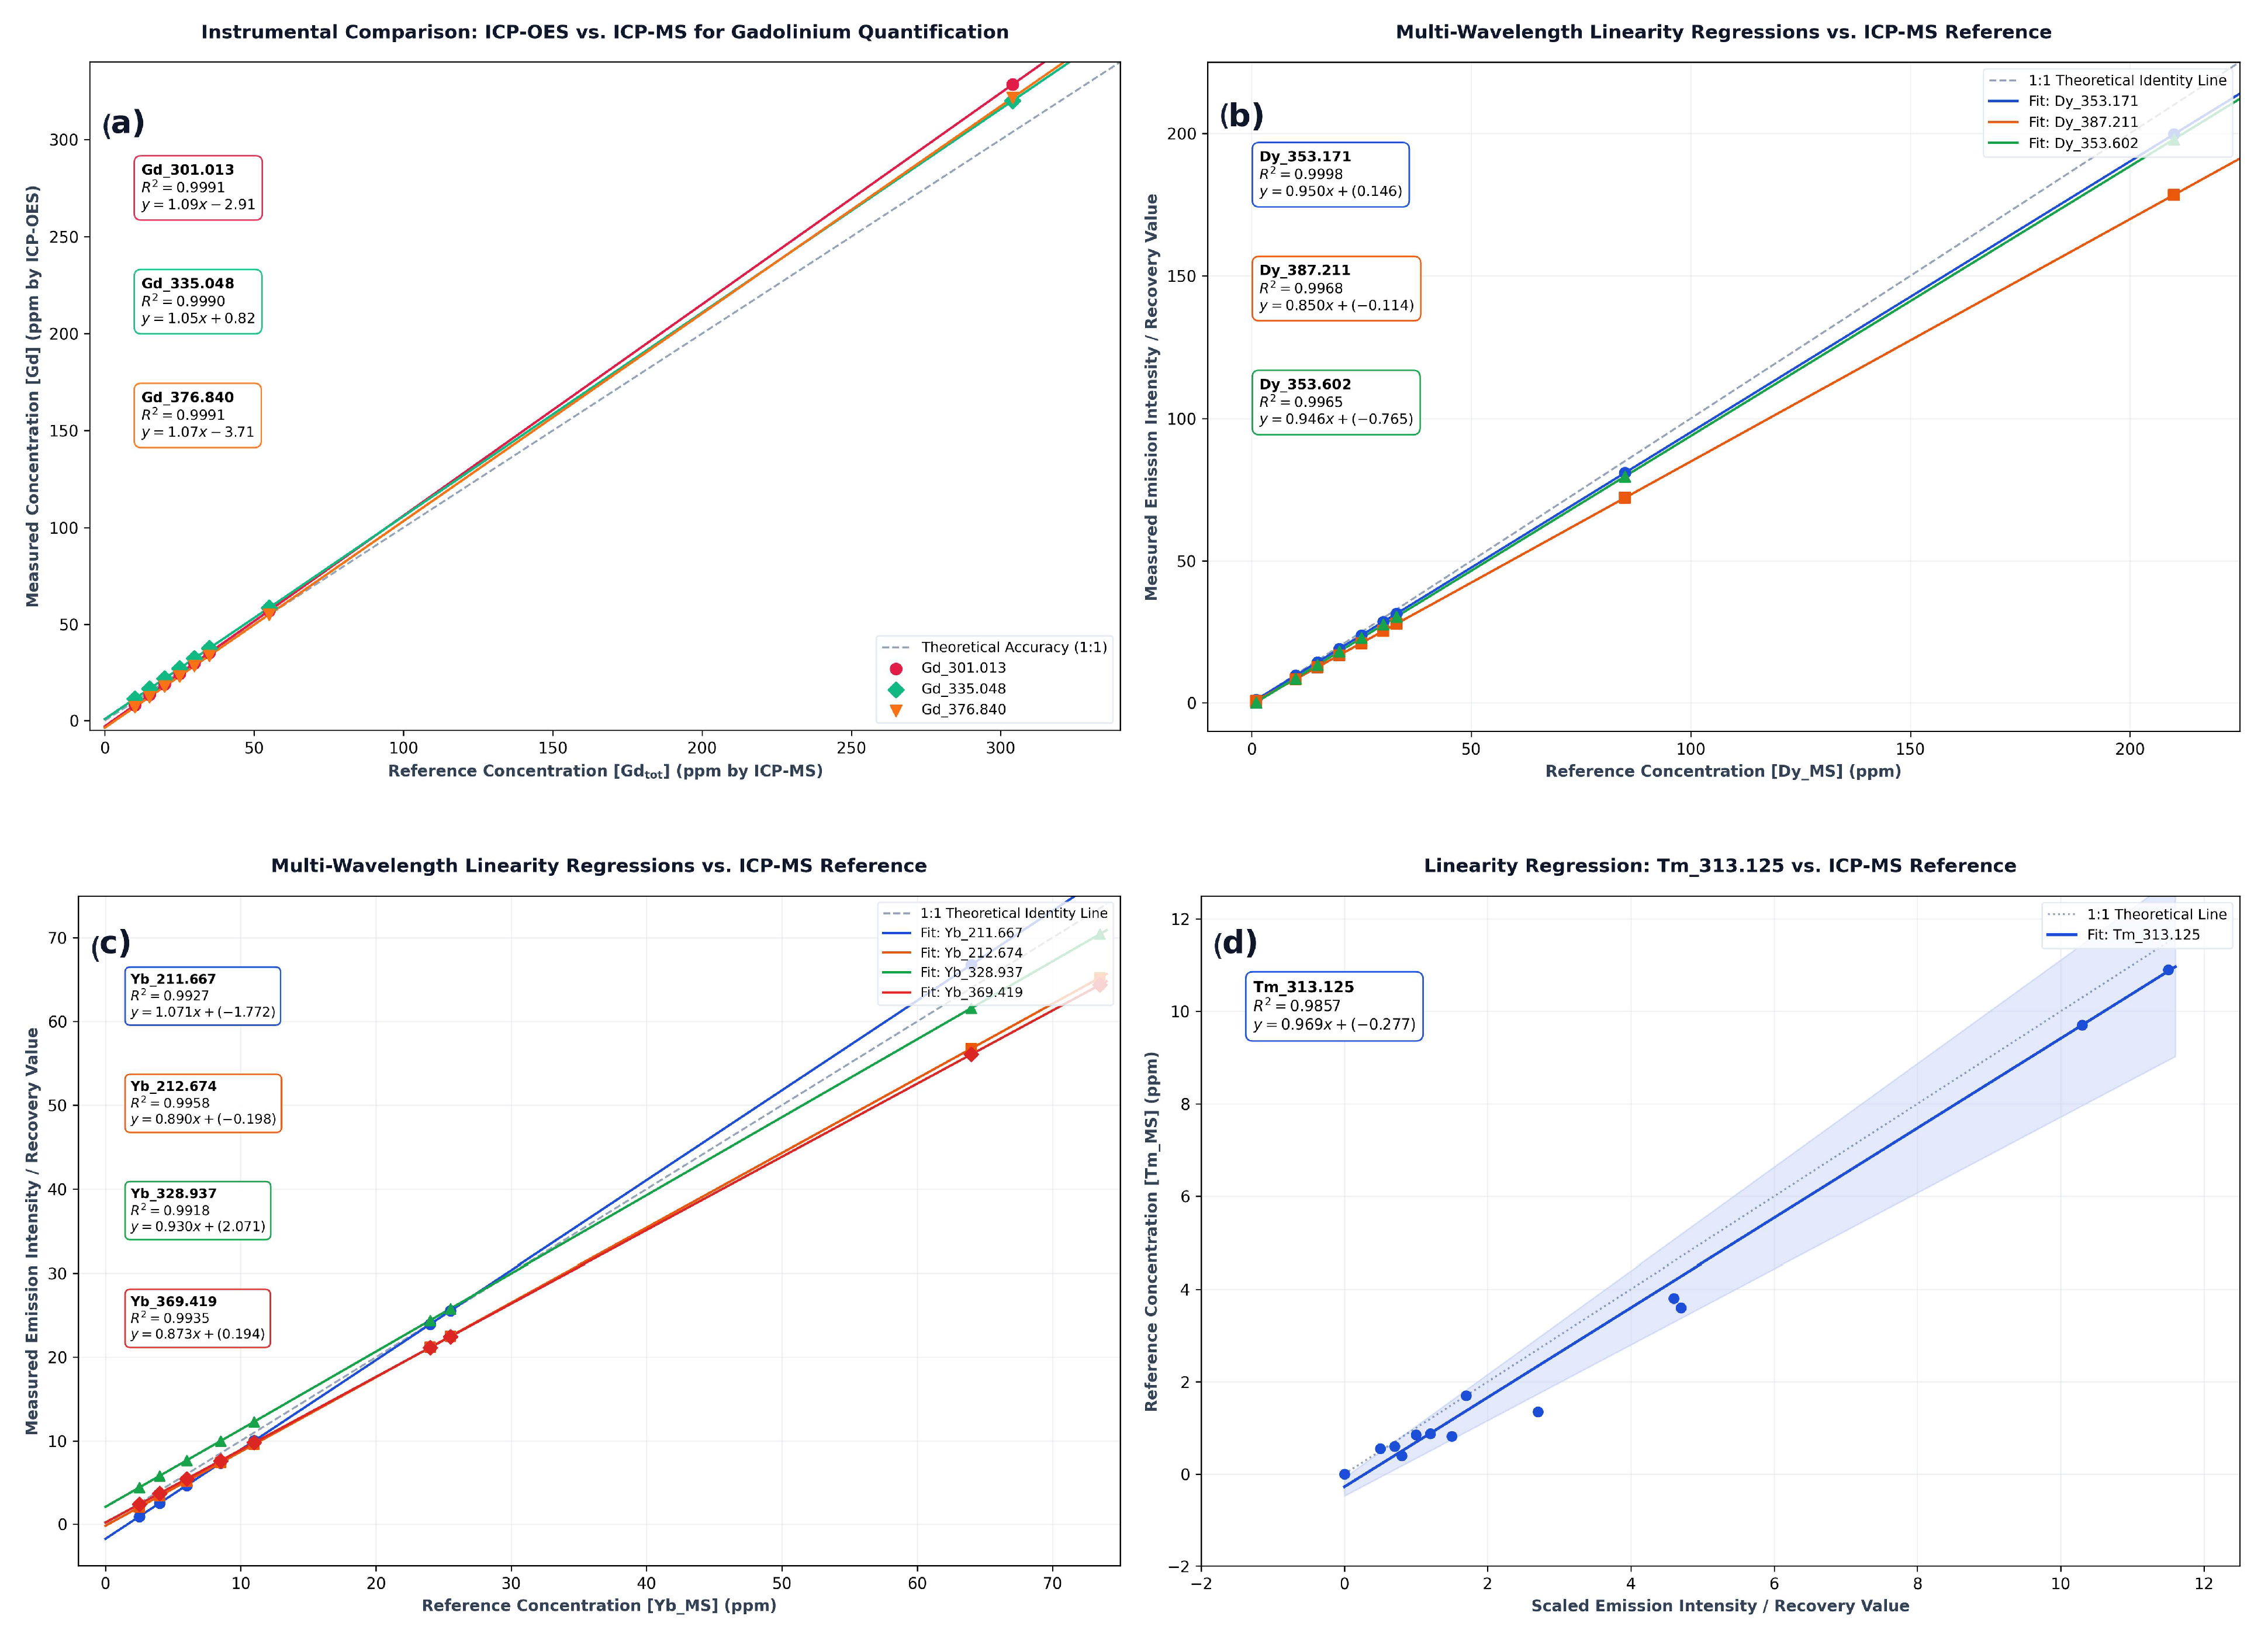
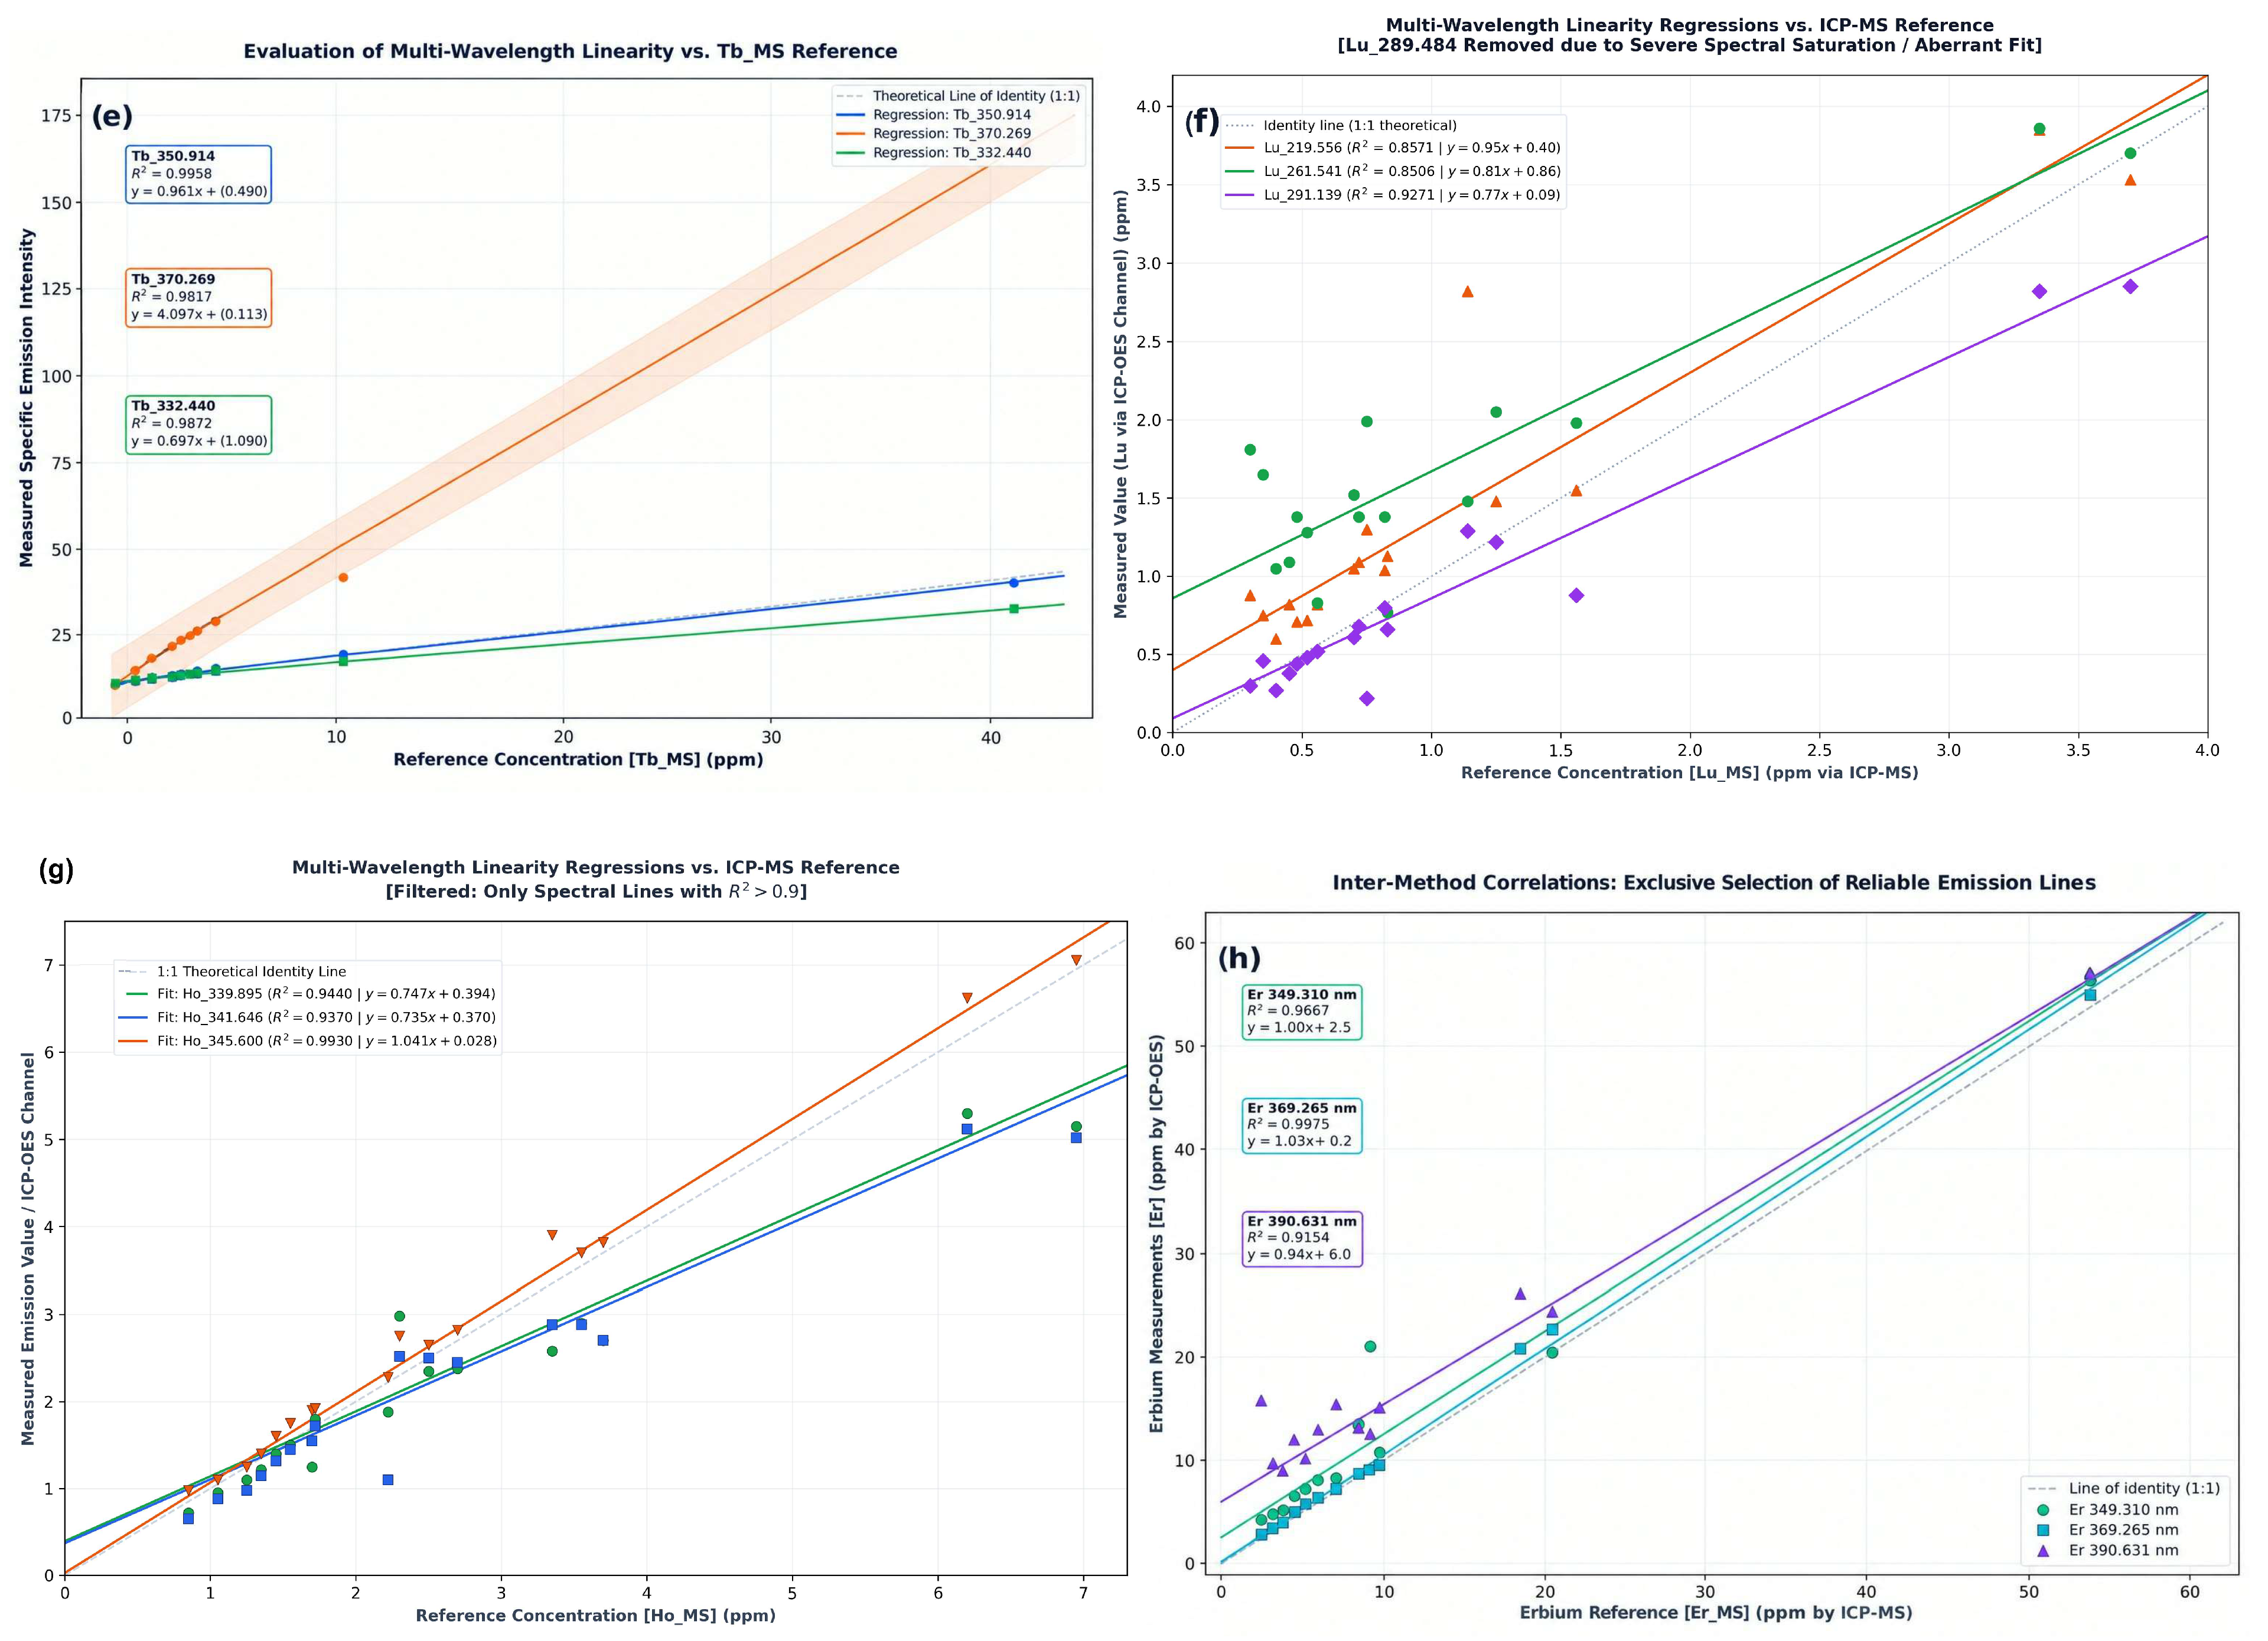
The comparison in Figure 4 is a consistency check with respect to the data (geological samples), as well as methods (wavelength screening and regression using ICP-OES/ICP-MS). As such, it is not a statistically independent test set since all 24 geological samples were used throughout both steps. Therefore, estimates of coefficient of determination (the determination) and regression error may also be overly optimistic for matrices that have never been seen prior to testing. Therefore, no claim of externally validated predictions on additional samples, nor of broad robustness and/or general applicability of these results can be made. These claims will only be possible when a group of independent samples has been collected, or alternatively through nested cross-validation techniques where spectral line selection occurs within each “fold” of the cross-validation process.
Figure 4.
Internal-consistency comparison of ICP-OES data obtained from retained emission lines using reference values for the same 24 geological samples that were compared in the screening by ICP-MS (a) Gd, (b) Dy, (c) Yb, (d) Tm, (e) Tb, (f) Lu, (g) Ho, and (h) Er. The colored points represent each individual measurement as a different wavelength. Solid lines through these points correspond to the best fit line of the individual wavelengths and the light-gray dashed line is the one-to-one equivalence line. The French labels in (e,h) denote multi-wavelengths linearity against the Tb reference and inter-method correlation for Er, respectively. However, these comparisons are not intended to be an independent validation.
Priori coefficients of determination and regression error may be overly optimistic when applied to previously unobserved matrices. No claims of externally validated predictions (beyond this study), wide-ranging robustness, or generalized application are being made using this benchmarking method. To estimate out-of-sample predictive performance, independent samples or nested resampling where the same spectral lines are randomly selected from the full set into each training fold will be required. The selected analytical lines and their internal performance assessment are summarized in Table 8.
Table 8.
Selected analytical emission lines and internal performance assessment for HREE determination by ICP-OES.
3.1.3. Spectral-Line Specificity and Matrix Response Evaluation by Standard Addition
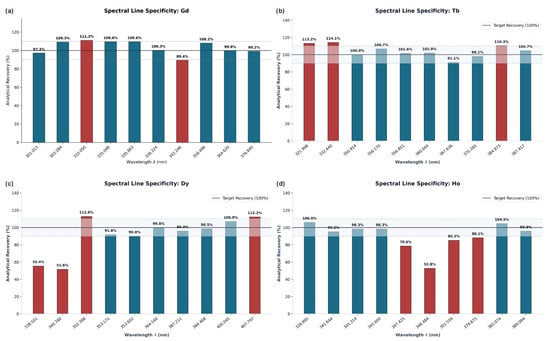
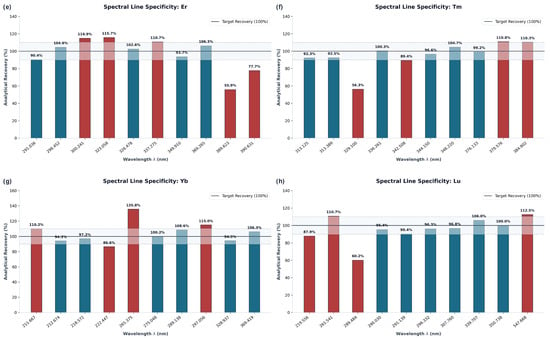
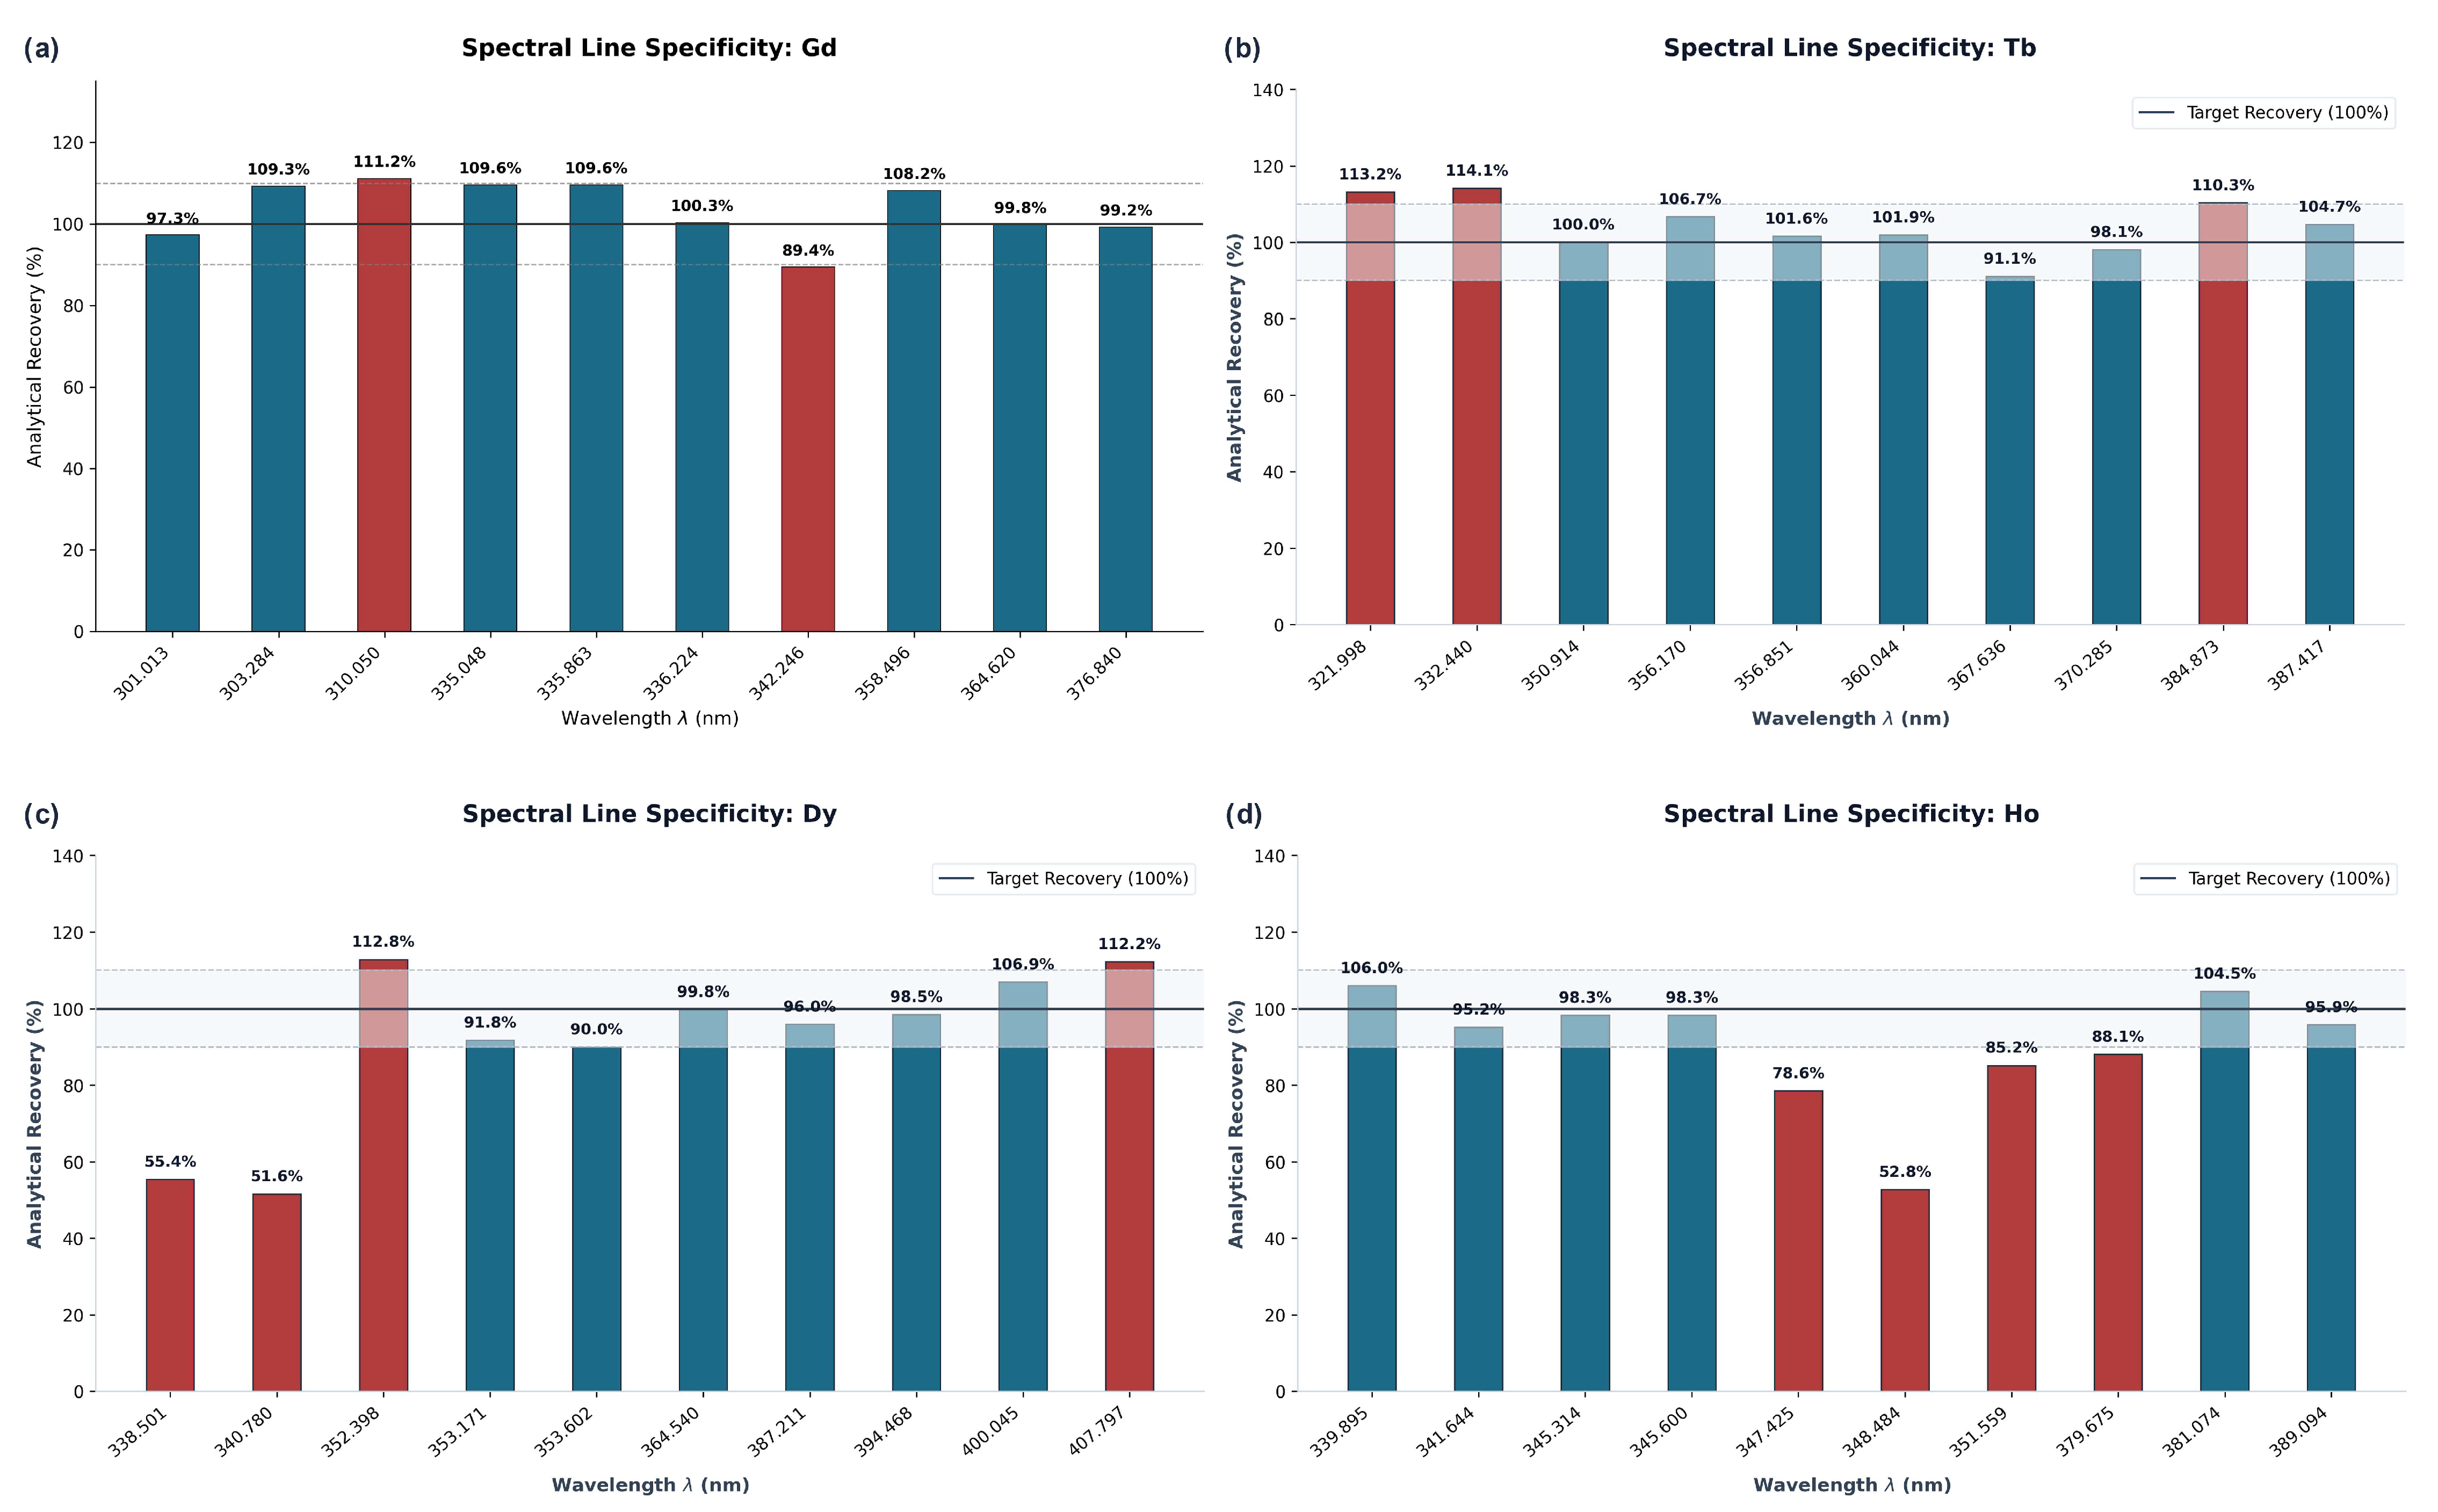
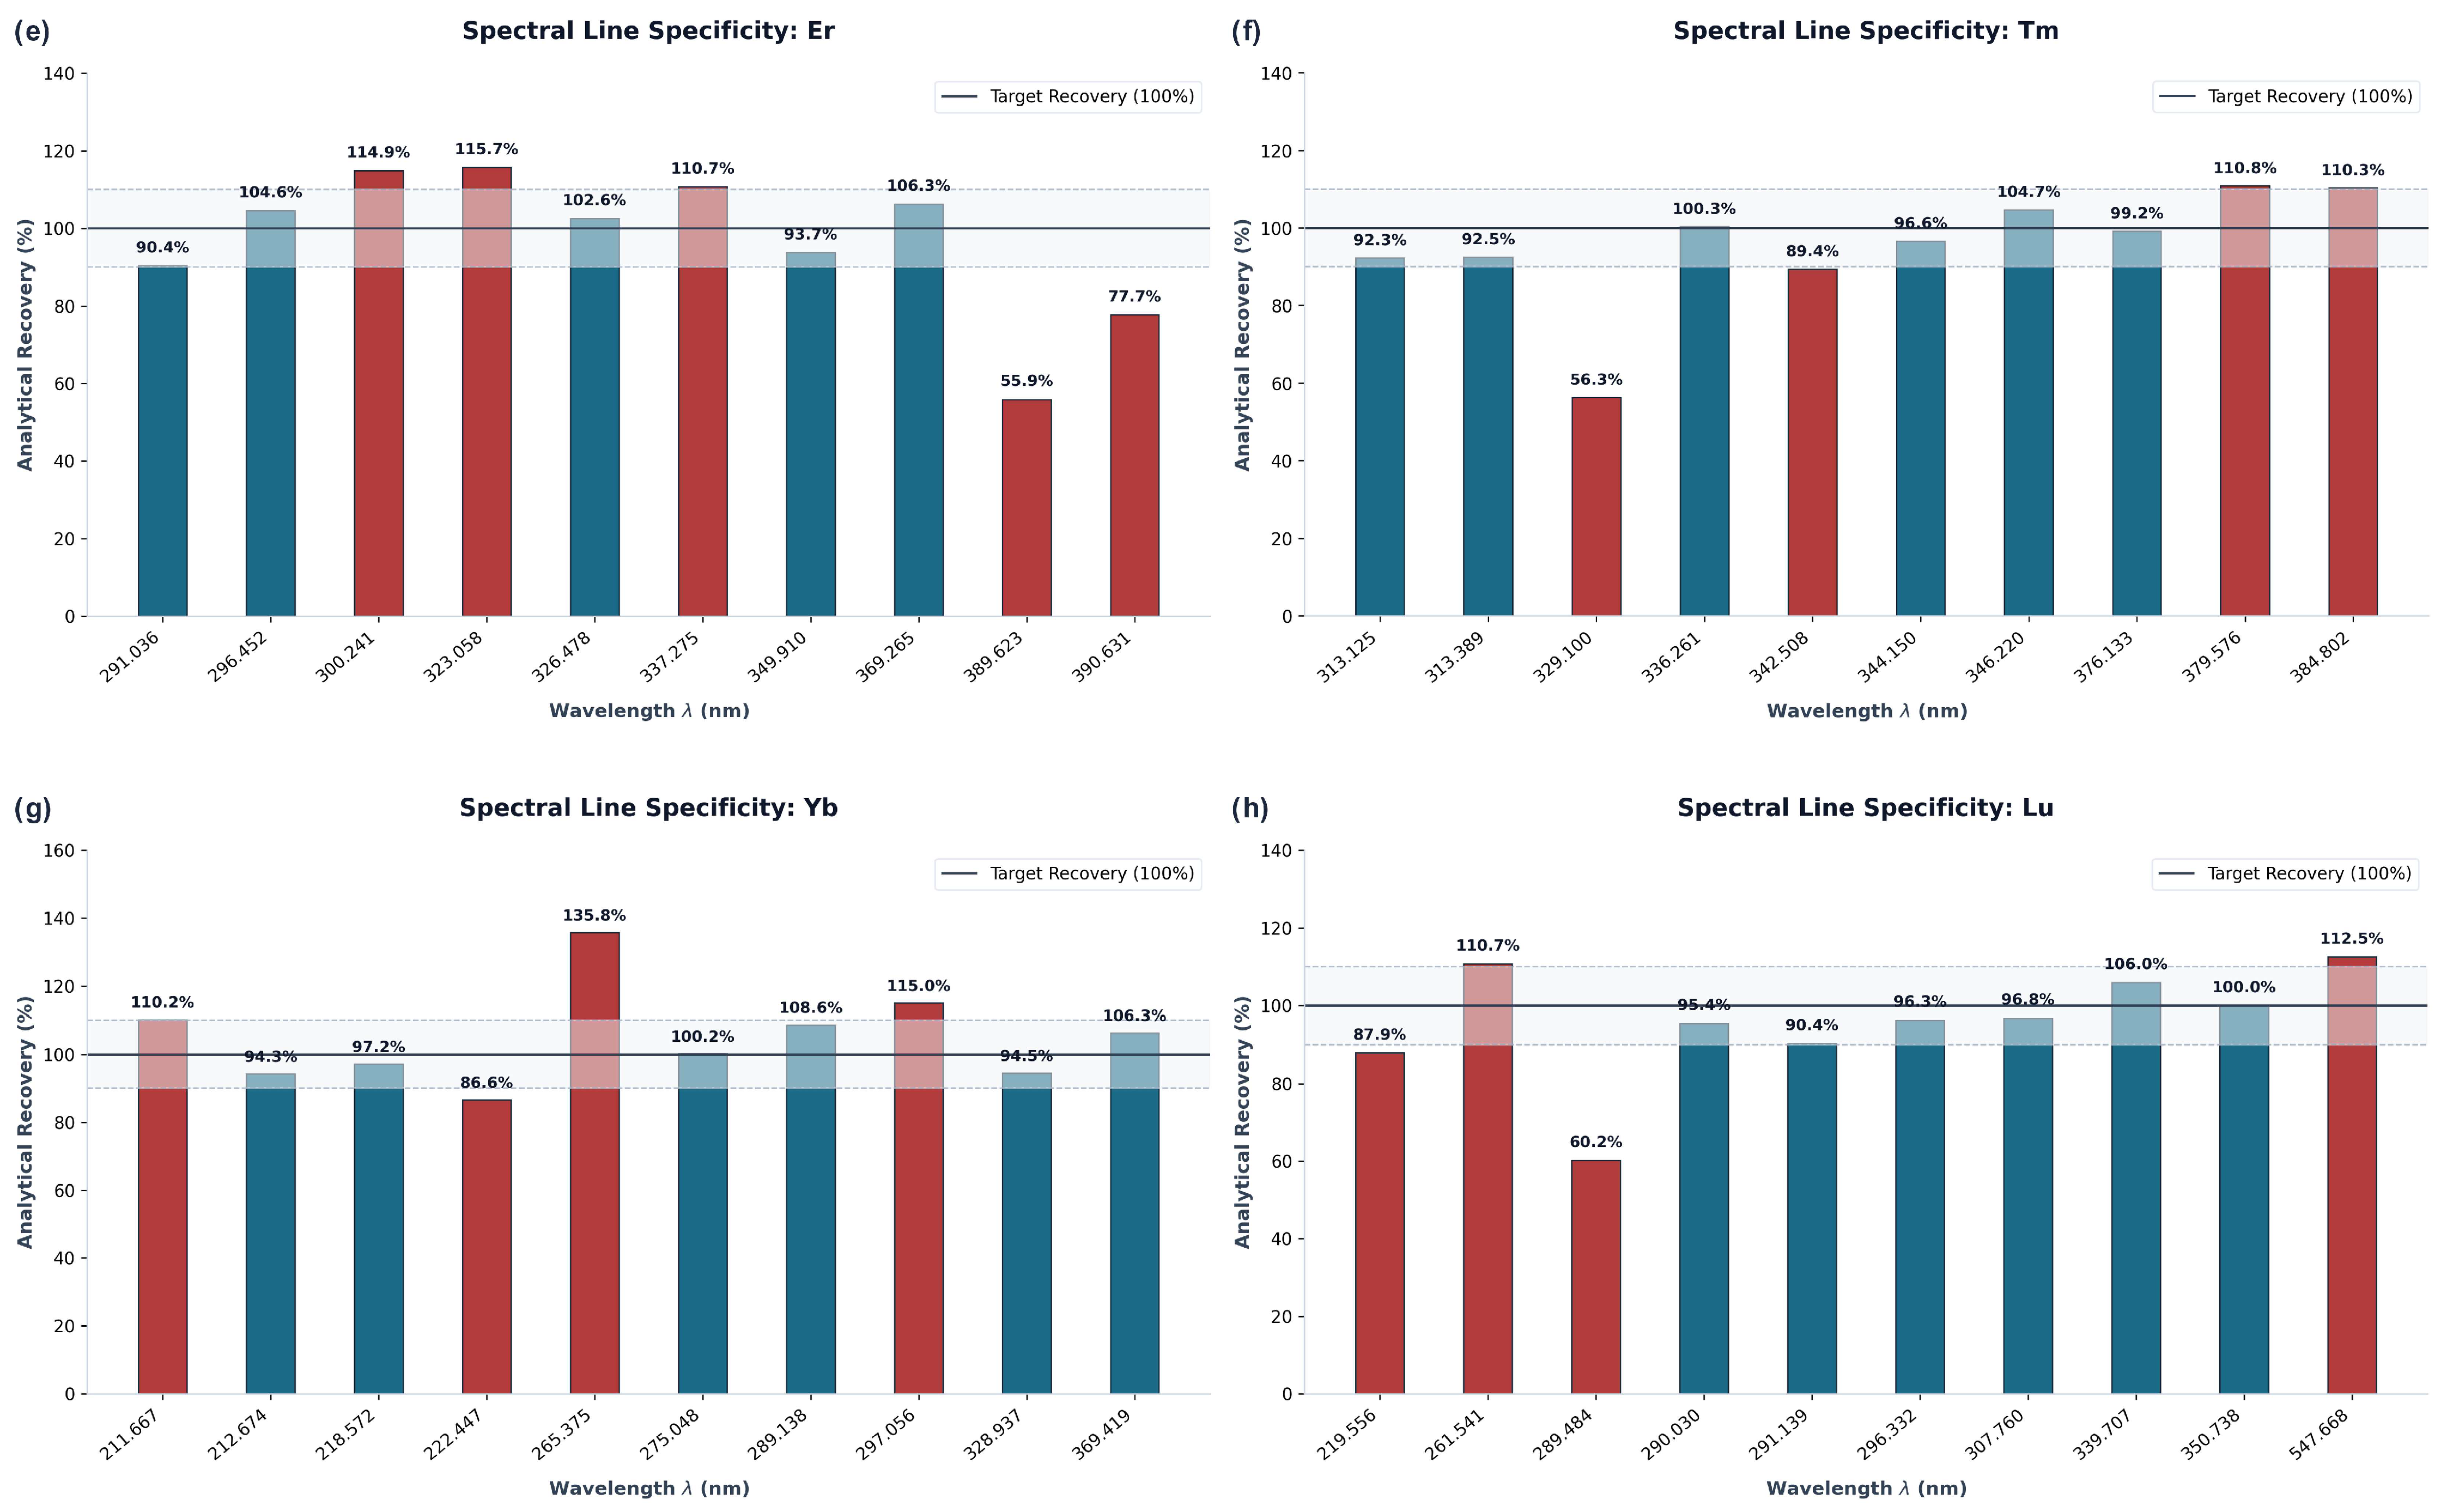
Standard-addition recovery was therefore applied as a second screening criterion to select among candidate lines presented in Figure 5 due to the high density of the emission spectra of lanthanides, making it impossible to determine the optimal candidate lines using absolute emission intensity alone.
Figure 5.
Recovery of candidate HREE emission lines using standard addition: (a) Gd, (b) Tb, (c) Dy, (d) Ho, (e) Er, (f) Tm, (g) Yb, and (h) Lu. Blue indicates that a measured value is within the defined acceptable range (90–110%); Red indicates that a measured value is outside this acceptable range. The Solid Line represents 100% recovery, and Dashed Lines represent the upper/lower acceptable range limits; The Shaded Area represents the total accepted range.
Recovery in standard addition experiments were variable among candidate lines. Only those lines whose recovery values fell within ±10% of 100% for the spike amounts examined were selected to compare against the correlations found during the screening phase. Values outside of the range of 90–110% could represent either interference due to overlapping signals, errors in placing background measurements, or simply changes in how the analyte responds based upon the matrix. Since each individual interference was not separately varied, it is not possible to attribute a specific mechanism to each excluded line [38,39].
The exclusion of lines that failed to meet the specified recovery criteria in the final comparison eliminated dependence upon the inter-element corrections used in testing these samples. However, it was not established that the remaining lines contained no interference.
3.1.4. Combined Dual-Gate Selection Framework for Final Line Constellation
Final line selection compared standard addition recoveries in Table 9 to within-dataset regression metrics from Table 9. Agreement of the two selections (not independent validation) was used to select lines for final qualification. For example, a line may have met the criteria for good recovery at the spiked level, but it failed to demonstrate consistent tracking over all concentrations tested [40,41]:
Table 9.
Standard-addition recovery, wavelength selection, and candidate spectral-interference assignments.
- Tb with 350.914 nm gave a slope of 1.000 and a recovery of 100.0%, whereas Tb at 370.285 nm had a slope of 4.097 and was eliminated as non-compliant. The Gd 335.048 nm and Tm 313.125 nm lines were also compliant due to meeting the pre-defined compliance standards for both slope and recovery; these data provide evidence that the selected wavelengths are appropriate within the test matrices. However, this does not establish resistance to quenching by the plasma or interference from an iron band mechanism.
- The compliant wavelengths used in independent geological samples include Gd 335.048 nm, Tb 350.914 nm, Dy 353.171 nm, Ho 345.600 nm, Er 369.265 nm, Tm 313.125 nm, Yb 369.419 nm, and Lu 291.139 nm.
The final retained emission lines and their within-study support status are summarized in Table 10.
Table 10.
Final retained emission lines for HREE determination by ICP-OES.
3.2. Internal Analytical Performance Evaluation
Instrumental background corrections had to be made prior to assessing instrument linearity, precision, and trueness. The instrumental background correction addresses two types of issues with baseline positioning and known local background effects. This does not represent complete removal of all spectral overlap or matrix effects; thus, the subsequent metrics reflect the performance that was achieved for the specific conditions and matrices that were tested in this study [42,43].
3.2.1. Linearity
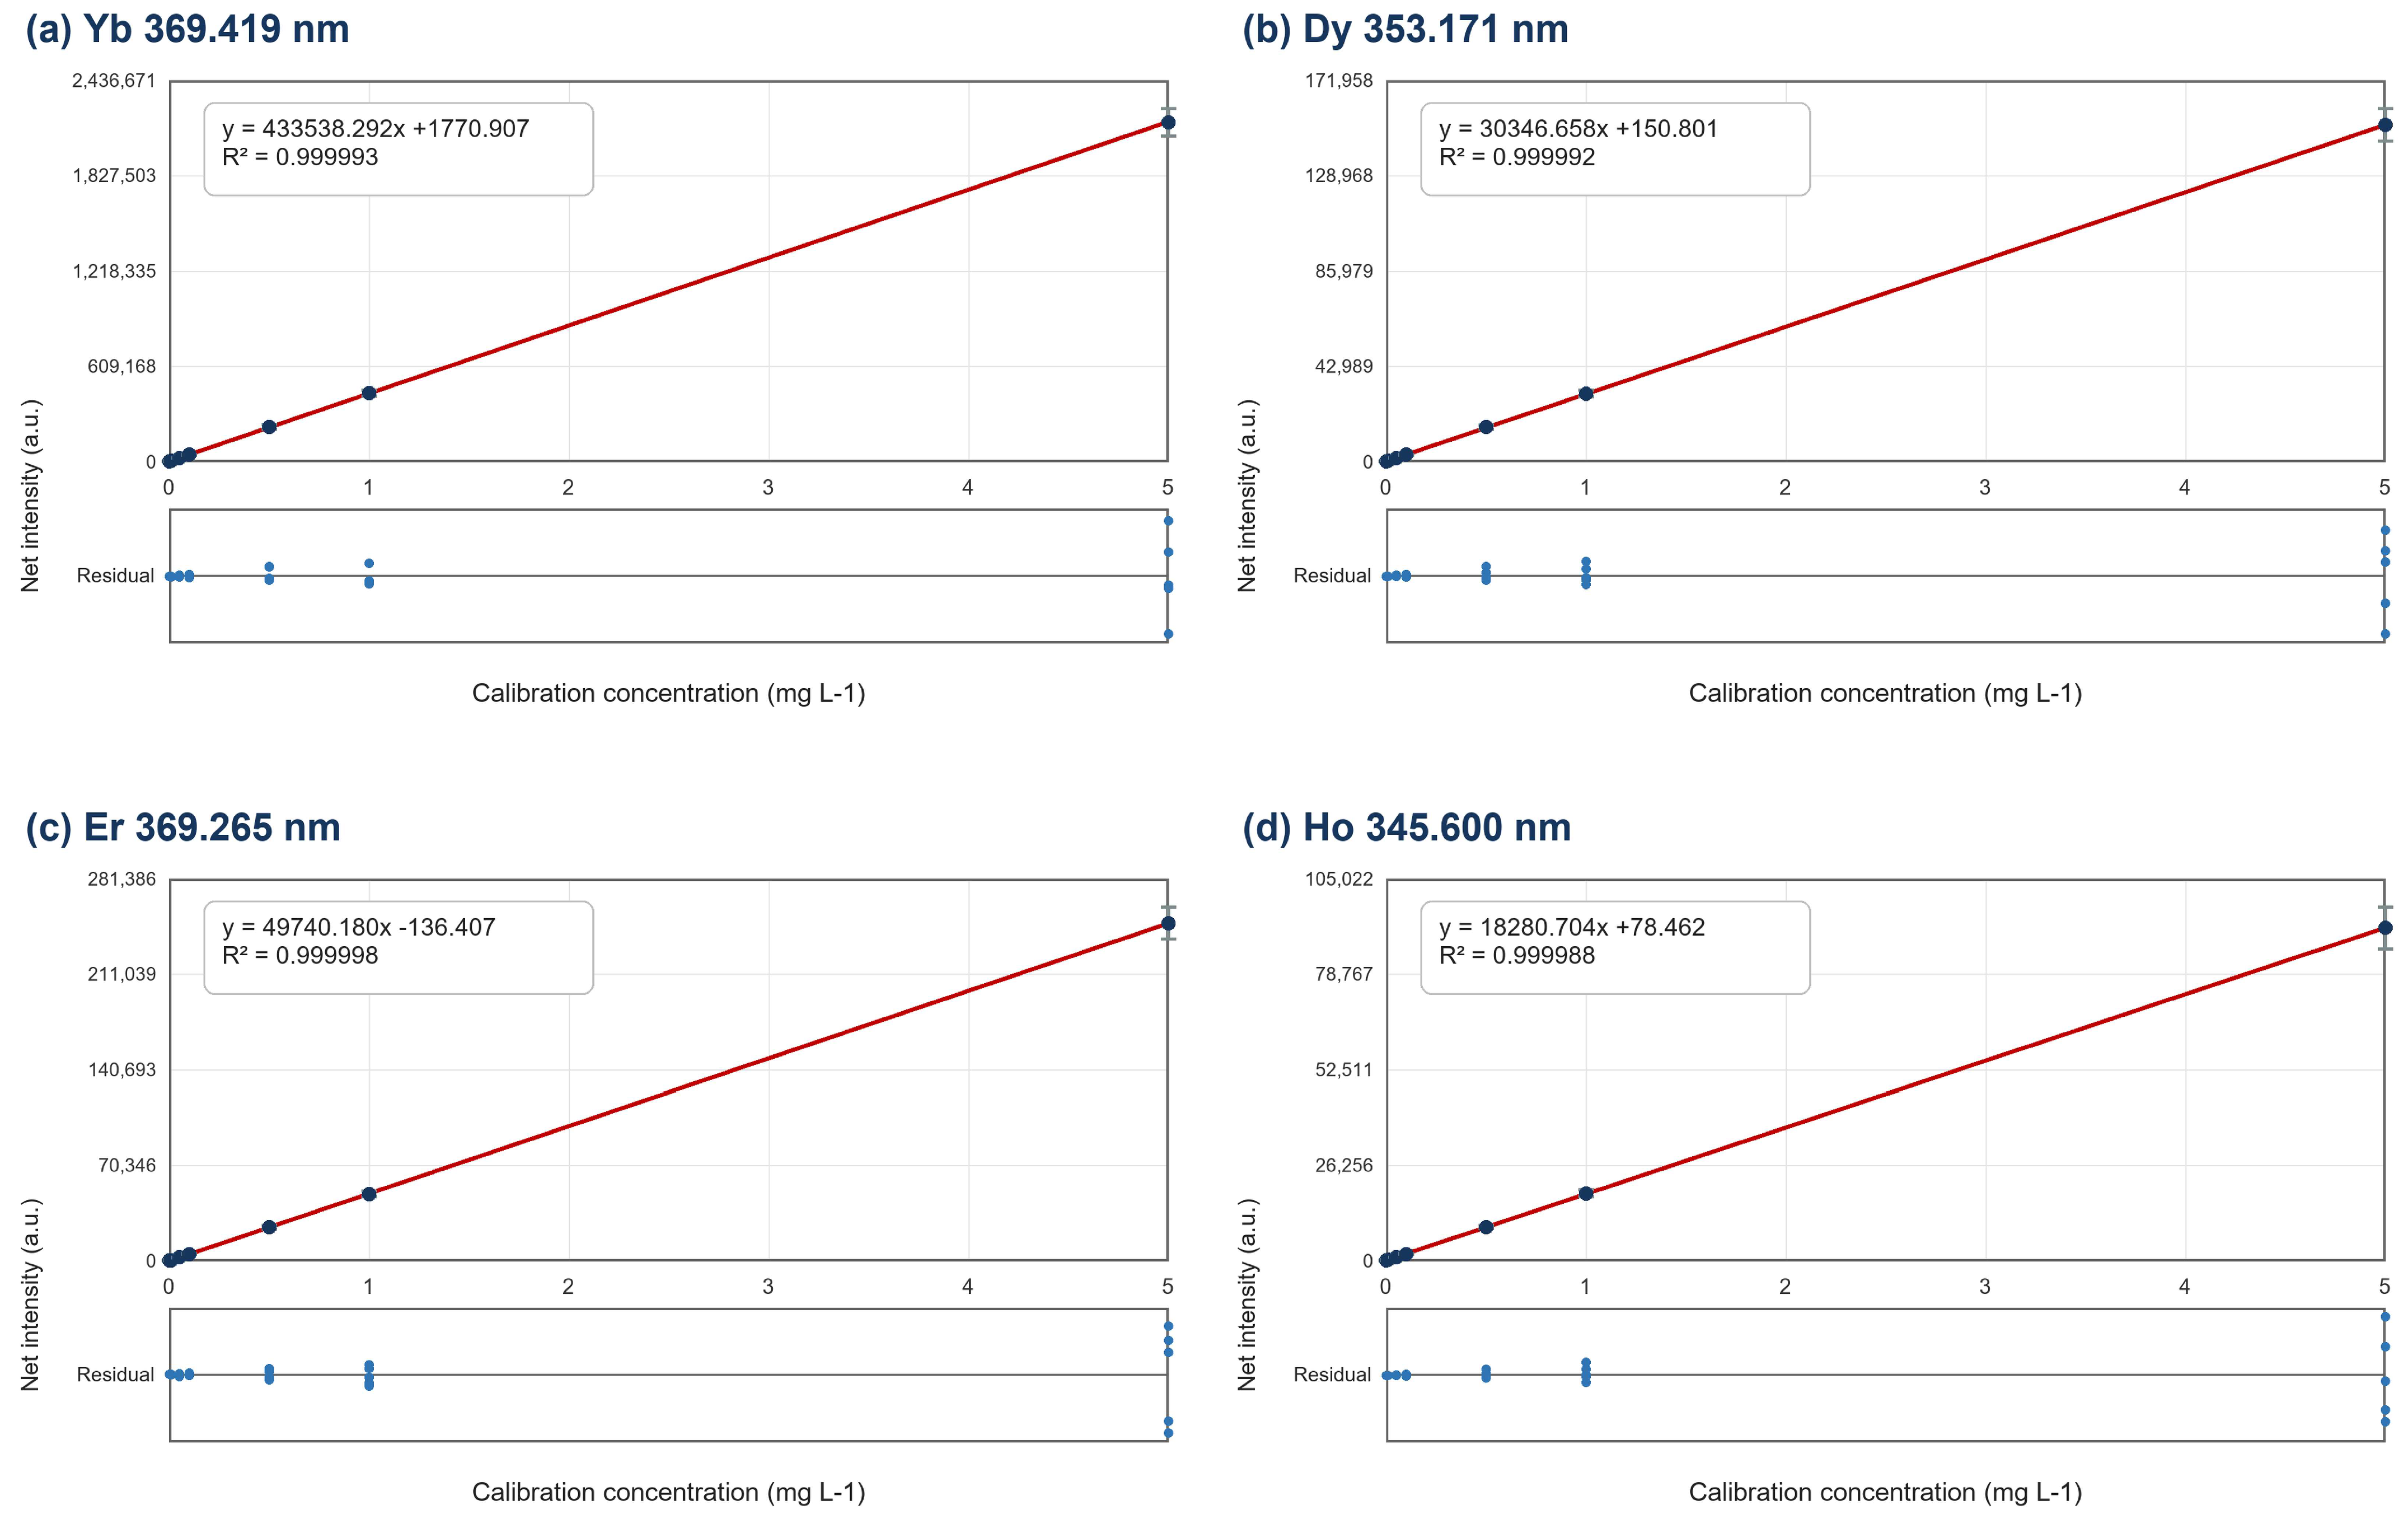
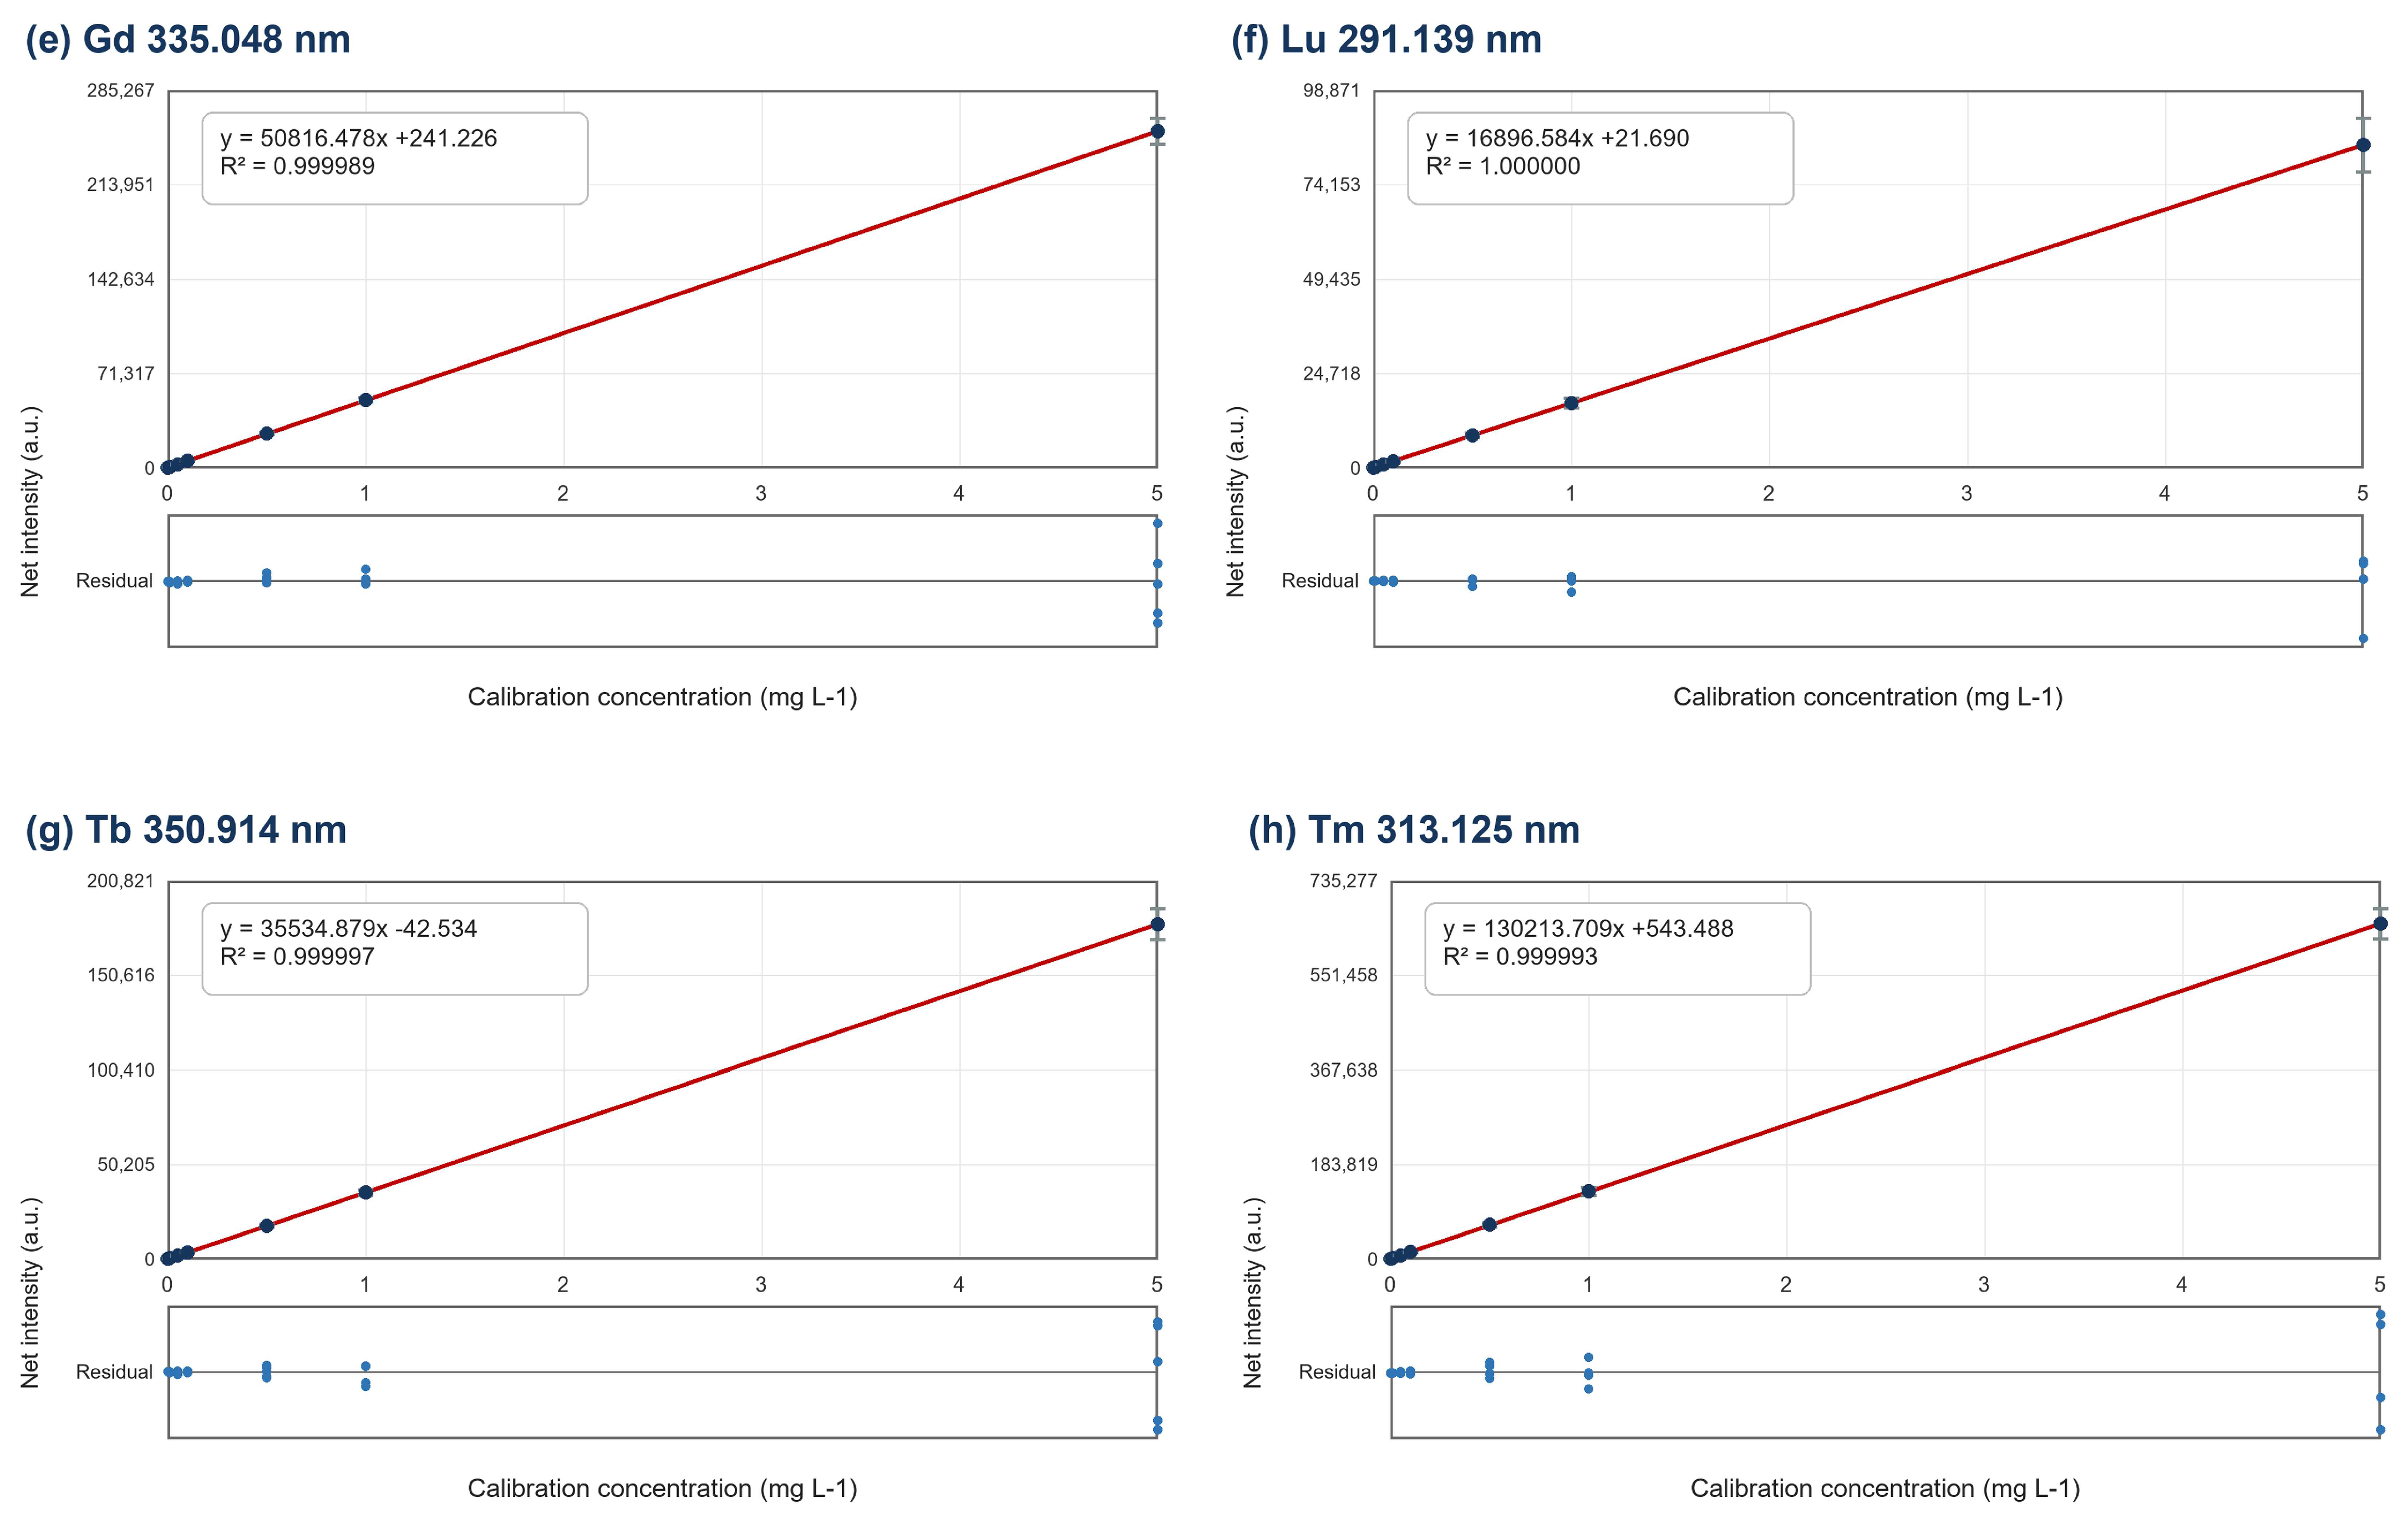
The calibration was assessed at seven levels, which included a calibration blank and five non-zero standards ranging from 0.01 to 5.00 mg L−1. There were five replicate responses for each level (total N = 35 per analyte), which were used to estimate the calibration equation, parameter confidence intervals, residual error, and lack of fit.
For each analyte, net emission intensity (y) was modeled as a linear function of calibration concentration (x): y = ax + b, where a is the slope and b is the intercept:
Calibration Equations and R2 Values are Summarized in Table 11. The R2 values were all greater than 0.99998. However, R2 is not sufficient to establish that there was no lack of fit. Therefore, a 95% confidence interval for the slope and y-intercept, as well as the residual root mean squared error (RMSE) and lack of fit tests, were calculated using the five replicates generated for each of the seven calibration levels reported in Table 12 [44].
Table 11.
Calibration ranges, equations, and coefficients of determination for the selected HREE lines.
Table 12.
Calibration-parameter uncertainty, residual error, and lack-of-fit tests based on five replicate responses at seven concentration levels.
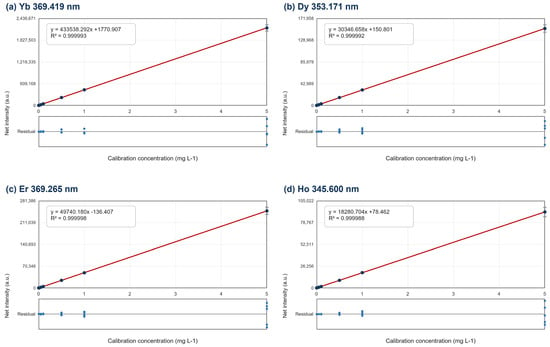
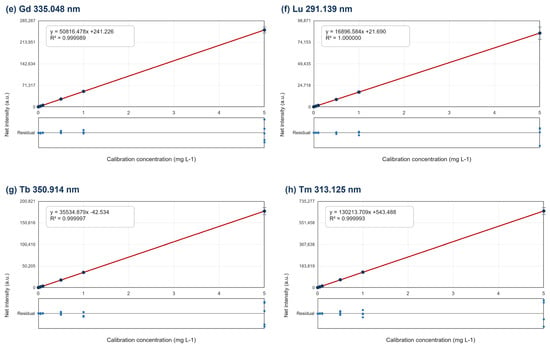
Inspecting residual Plots for concentration-dependent structure was completed (see Figure 6), calculating the parameter intervals and lack-of-fit results were based on replicate response values rather than rounded R2 values. Diagnostics for evaluating the nitric-acid standard fitted calibration functions do not address mismatches between the calibration standards and digest Matrix [45].
Figure 6.
Calibration and residual plots for the selected HREE emission lines: (a) Yb 369.419 nm, (b) Dy 353.171 nm, (c) Er 369.265 nm, (d) Ho 345.600 nm, (e) Gd 335.048 nm, (f) Lu 291.139 nm, (g) Tb 350.914 nm, and (h) Tm 313.125 nm. Points show mean ± SD for five replicate responses at each level; lines show ordinary least-squares fits. Residuals are displayed below each calibration plot.
- Calibration lack-of-fit and parameter uncertainty.
Pure Error was estimated as a result of the variability in the response to the five replicates at each of the seven calibration levels. Lack-of-fit was determined through comparison of deviations of the level means from the fitted line, using pure error (within levels), with this lack-of-fit being compared against (df1 = 5; df2 = 28). Confidence limits for slope and intercept parameters were constructed two-sided at α = 0.05 and with 33 residual degrees of freedom using the residual mean square.
The Lack of Fit statistics were found to be between 0.000 and 0.037, with corresponding p-values between 0.999 and 1.000. None of these results demonstrated a statistically significant lack of fit for α = 0.05. Therefore, these data are consistent with the assumption that there is a linear relationship among the calibration standards that have been tested. However, it also indicates no evidence to support an equivalency between the Nitric-acid standardization solution and multi-acid sample digestions.
3.2.2. Precision
Repeatability and Intermediate Precision for each of the tested analytes were evaluated via repeated analysis on OREAS 460, OREAS 461, and OREAS 465 over a period of three separate measurement days, with nine replicate analyses performed for each day (nine total replicates per analyte CRM pair). One-way ANOVA was used to evaluate variance components as described in ISO 5725-3:2023; (Accuracy (trueness and precision) of measurement methods and results—Part 3: Intermediate precision and alternative designs for collaborative studies [46]. International Organization for Standardization: Geneva, Switzerland, 2023). Concentration values ranged from approximately 0.33 mg kg−1 for Lu to 578.67 mg kg−1 for Gd. Therefore, these data represent an evaluation of precision of the CRM matrixes and the tested concentrations but are not representative of all other complex geologic materials [47]. The individual concentration measurements for each analyte–CRM pair across the three days are presented in Table 13.
Table 13.
Raw HREE concentrations measured in three certified reference materials over 3 days, with three replicate measurements per day (mg kg−1).
- Homogeneity of Intra-day Variances (Cochran’s Test).
Cochran’s C test was used to examine whether any daily variance was disproportionately large before the variance estimates were pooled. For p = 3 days and n = 3 replicates, the critical value was 0.871 at α = 0.05. The observed values in Table 14 ranged from 0.341 to 0.823; none exceeded the critical value. The test therefore did not identify a daily variance outlier among the analyte–CRM combinations evaluated [48].
Table 14.
Cochran’s C test for homogeneity of within-day variances (α = 0.05; Ccritical = 0.871).
- Assessment of Repeatability (Short-Term Precision)
Repeatability results were summarized in Table 15. Twelve of the 24 Analyte–CRM combinations had Cvr values below 1.5%, primarily at medium to high concentration levels. The largest Cvr values occurred for Tm and Lu at low concentration levels. They were 13.95% and 25.24%, respectively. This illustrates that relative imprecision increased as one approached the lower end of the concentration range [49].
Table 15.
Repeatability standard deviations (Sr) and coefficients of variation (CVr) for the HREE–CRM combinations.
- Evaluation of Inter-day Variance Contributions (Fisher’s F-Test)
A single-way ANOVA was performed to compare both the between-day variation and within-day variations of the same dataset for 3 days that were each replicated three times (df1 = 2; df2 = 6). For a given alpha level of 0.05, the critical value of F at this degree of freedom was 5.14. None of the 24 values of Fobs shown in Table 16 had a Fobs greater than 5.14. Therefore, there was no evidence based on the statistical test of whether or not the means differed by day [50].
Table 16.
One-way ANOVA evaluation of between-day effects (α = 0.05; Fcritical = 5.14).
- Intermediate precision
Intermediate precision combined the pooled within-day variance with the estimated between-day variance component (Table 17). Negative between-day variance estimates, which arise when the between-day mean square is smaller than the within-day mean square, were set to zero for variance-component reporting. The largest CVR occurred for Lu in OREAS 461 (27.17%), consistent with its low concentration. The remaining values describe the CRM matrices and concentration levels tested and should not be extrapolated to all ore matrices [51].
Table 17.
Intermediate-precision standard deviations (SR) and coefficients of variation (CVR) for HREE analysis.
3.2.3. Assessment of Method Trueness (Bias, Recovery, and Student’s t-Test)
Trueness of results was determined through comparison to the certified values using a t-test. A t-test (Table 18) is conducted when evaluating whether there is a statistically significant difference between the mean of nine replicate measurements for each analyte–CRM pair compared to the certified value. Relative bias and recovery are also considered in this process. Only two pairs were found to exceed the alpha level of 0.05, which represents a critical t-value of 2.31. These included Tb in OREAS 465 (t-obtained = 2.41) and Er in OREAS 461 (t-obtained = 2.51) [32]. CRM recovery, relative bias, and Student’s t-test results are summarized in Table 17.
Table 18.
CRM recovery, relative bias, and Student’s t-test results for HREE determination (α = 0.05; tcritical = 2.31).
The analysis of the nine replicates in Table 12 (Section 3.2.2) supported that 22 out of 24 of the analyte CRM comparisons yielded an absolute tobs value equal to or less than 2.31. Only two comparisons were outside the critical values for both sides of the t-test: Tb in OREAS 465 (tobs = 2.41) and Er in OREAS 461 (tobs = 2.51); these two indicated detectably biased results based on this test and therefore cannot be classified as compliant. The En evaluation(Table 19) provides an answer to a completely different question since it evaluates the magnitude of the observed differences relative to the combined expanded uncertainty; thus, |En| ≤ 1 may exist even when there is a statistically significant t test [52].
Table 19.
Uncertainty-aware trueness cross-check using En values and method-specific certified values from the four-acid digestion sections of the OREAS 460, 461, and 465 certificates. |En| ≤ 1 indicates compatibility within the combined expanded uncertainties (k = 2).
3.2.4. Detection and Quantification Limits (LOD and LOQ)
Ten procedural blanks that were treated with the identical multi-acid treatments as the samples and analyzed by ICP-OES were used to provide an estimation of the instrumental detection limit (LOD) and quantification limit (LOQ) for the selected emission lines. The instrument’s LOD and LOQ values based on blank variability (Equation (3)) and instrumental LOD and LOQ values were determined from Equation (4) [53].
Instrumental LOD and LOQ values are derived from blank-derived values via the use of sample mass (0.250 g) and final sample solution volume (50.0 mL). Thus, they provided a dilution factor of 200 mL g−1. Therefore, these blank-derived LOD and LOQ values do not define quantitative accuracy or precision between the LOQ and the lowest calibration concentration that provided experimental data (i.e., 2.00 mg kg−1) [54]:
The results of this determination are presented in Table 20.
Table 20.
Blank-derived limits of detection and quantification for the selected HREE emission lines (n = 10 procedural blanks).
3.2.5. Quantified HREE Concentrations by ICP-OES
HREE concentrations in the 24 geological samples are reported in Table 21. Gd ranged from 1.54 to 389.83 mg kg−1, and Dy reached 217.74 mg kg−1 in TWH_22. Values below 2.00 mg kg−1 are reported as extrapolated estimates because they fall below the experimentally demonstrated calibration range. The observed concentration range de-scribes the samples analyzed in this study and does not establish negligible spectral interference or general robustness across other geological matrices.
Table 21.
HREE concentrations in the 24 geological samples determined using the retained ICP-OES emission lines (mg kg−1).
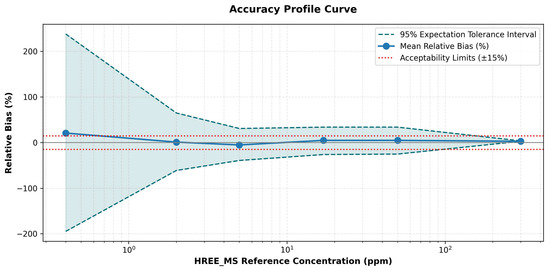
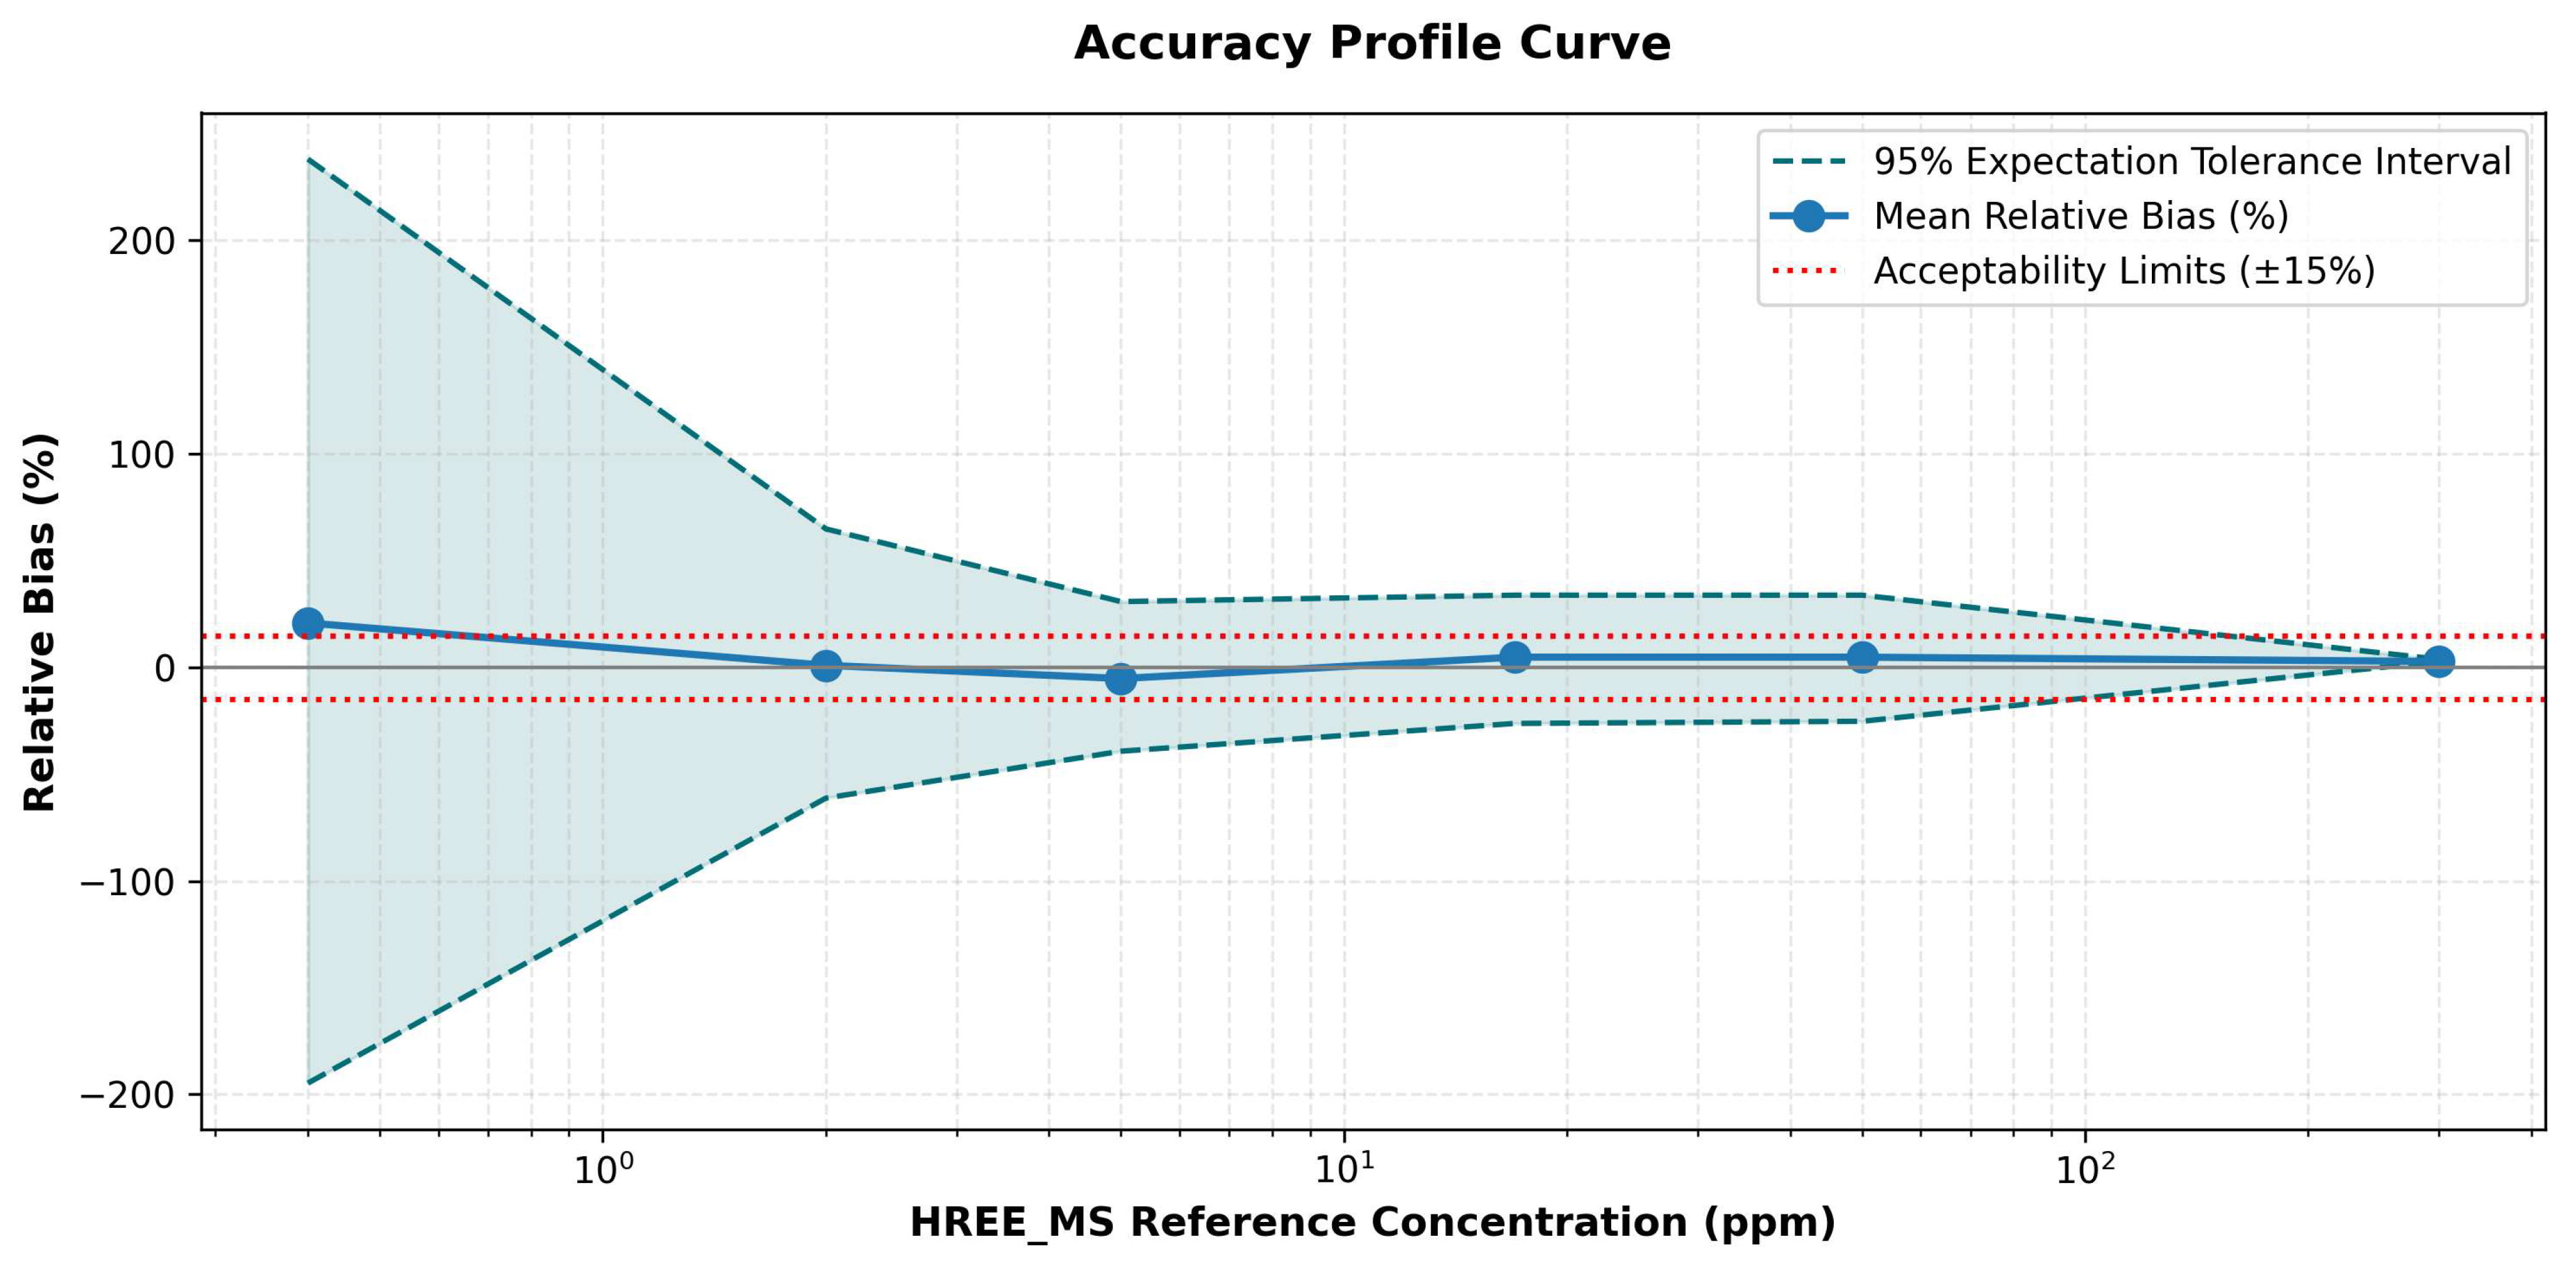
The summary in Figure 7 is a measure of consistency for all concentrations measured in the study. The experimental calibration curve for ICP-OES ranges from 2.00 mg kg−1 in solids. Therefore, any concentrations lower than 2.00 mg kg−1 should be treated as an estimate based on the data collected, and no conclusions can be made that these estimated low concentrations are accurate. As the concentration in samples increases, dispersion also increases, with the highest number of results found to be within ±15% of the acceptance limits found near 5 mg kg−1.
Figure 7.
Agreement profile for HREE measurements by ICP-OES across the observed concentration range. Blue Line is Mean Relative Bias of all values. Shaded Region between Dashed Teal Lines are ±95% Expectation Tolerance Interval. Red Dotted Lines are ±15% Acceptable Limits for All Values.
4. Limitations and Future Work
There are several factors that define the boundaries of this study. (1) The same 24 geological samples were analyzed using both the spectral-line screening procedure and as part of the ICP-OES/ICP-MS comparison. Therefore, this comparison evaluates the internal consistency of the ICP-OES/ICP-MS comparison results, which can result in overly optimistic regression statistics for previously untested samples. An evaluation based on new sampling must perform the line selection process again for each data subset and, most importantly, evaluate external validation against geologically different samples. (2) Calibration standards were made by dissolving certified reference materials in nitric acid and did not contain an internal standard or were matrix-matched to the multi-acid digested samples. The sample-equivalent amount of digestion material prior to additional dilution was approximately 5.0 g L−1. However, the final composition of acids and the total dissolved solids were not determined, and potential matrix-dependent biases could exist. (3) The lowest non-zero calibration standard corresponds to 2.00 mg kg−1 HREE in the solid phase. All values less than this value are estimated values using extrapolation and are also above the lower limit of detection (LOD), which is calculated from blanks. (4) Although there are correlations between HREE and Fe, Ti, V, Al, and P, it does not indicate what mechanism(s) cause the interferences among these elements since these elements have been evaluated at varying concentrations relative to one another while keeping the concentration of HREE constant. As such, the assignments shown in Table 20 represent a possible explanation for the interference patterns observed and will require independent variable control studies along with local spectra to validate.
Within-dataset regression parameters and calibration status for the candidate HREE emission lines are summarized in Table 22.
Table 22.
Candidate HREE emission lines and within-dataset regression parameters.
5. Conclusions
This research investigated a double-gate workflow to select suitable ICP-OES emission lines for determination of Gd, Tb, Dy, Ho, Er, Tm, Yb, and Lu in ore samples digested by multiple acids. The lines chosen for use were: Gd 335.048 nm; Tb 350.914 nm; Dy 353.171 nm; Ho 345.600 nm; Er 369.265 nm; Tm 313.125 nm; Yb 369.419 nm; and Lu 291.139 nm. Blank-derived limits of detection (LOD) and quantification (LOQ) were found to be between 0.02–0.10 and 0.07–0.32 mg/kg, respectively. However, it is important to note that although the experimental results demonstrate the lowest calibration range limit of quantification to be approximately 2.00 mg/kg. Values below this level are considered to be an extrapolation based on the original calibration curve. A second statistical evaluation using the CRM (Certified Reference Materials) data also revealed two instances where the TB—OREAS 465 sample and the ER—OREAS 461 sample exceeded their respective TB and ER t-tests. All 24 inter-day analysis of variance (ANOVA) F-values were less than the critical value of F-critical = 5.14. Because the ICP-OES/ICP-MS comparison utilized the same set of 24 samples from the initial line selection experiment, it can be concluded that there is internal validation within this group of samples. It should, however, be noted that correlation-based interference assessments are still tentative due to the fact that each individual matrix element could not be changed with a constant concentration of each respective analyte, and therefore it is possible that uncontrolled residual matrix effects may have existed during ICP-OES calibrations since calibration standards did not contain matching matrices and no internal standard was employed.
Author Contributions
A.E.-B., conducted the experiments, analyzed the data, and prepared the original draft. H.L. and A.A., contributed to the methodology and experimental work. K.Z., F.B., E.H.E.F. and I.B. (Imane Bousdig); contributed to data interpretation and validation. D.B., B.A. (Brahim Achiou), M.O. and S.A.Y., ensured critical review and manuscript improvements. A.M., Y.A. and M.I., ensured critical review and manuscript improvements. B.A. (Badr Aznag), K.N. and I.B. (Intissar Benzakour); provided resources and technical support. M.Z.; supervised the study, contributed to the conceptualization, and finalized the manuscript. All authors have read and agreed to the published version of the manuscript.
Funding
The study was funded by KAU Endowment (WAQF) at King Abdulaziz University, Jeddah, Saudi Arabia.
Data Availability Statement
All datasets generated or analyzed during this study are included in the manuscript.
Acknowledgments
The authors, acknowledge with thanks WAQF and the Deanship of Scientific Research (King Abdulaziz University, Jeddah, Saudi Arabia) for technical and financial support. The authors also thank the Reminex research center (Mining Project Research and Engineering Center, Managem Group, Marrakech, Morocco) for technical support. During the preparation of this work, the authors did not use generative AI and AI-assisted technologies, and the authors take full responsibility for the content of the publication.
Conflicts of Interest
Badr Aznag, Khalid Naji and Intissar Benzakour are employees of Reminex. This company had no role in the design of the study; in the collection, analyses, or interpretation of data; in the writing of the manuscript, or in the decision to publish the results. The remaining authors declare that the research was conducted in the absence of any commercial or financial relationships that could be construed as a potential conflict of interest.
References
- Chakhmouradian, A.R.; Wall, F. Rare Earth Elements: Minerals, Mines, Magnets (and More). Elements 2012, 8, 333–340. [Google Scholar] [CrossRef] [Scilit]
- Ghorbani, Y.; Ilankoon, I.M.S.K.; Dushyantha, N.; Nwaila, G.T. Rare earth permanent magnets for the green energy transition: Bottlenecks, current developments and cleaner production solutions. Resour. Conserv. Recycl. 2025, 212, 107966. [Google Scholar] [CrossRef] [Scilit]
- Dorenbos, P. The 4fn↔4fn−1 5d transitions of the trivalent lanthanides in halogenides and chalcogenides. J. Lumin. 2000, 91, 91–106. [Google Scholar] [CrossRef] [Scilit]
- Lundaev, V.; Solomon, A.A.; Le, T.; Lohrmann, A.; Breyer, C. Review of critical materials for the energy transition, an analysis of global resources and production databases and the state of material circularity. Miner. Eng. 2023, 203, 108282. [Google Scholar] [CrossRef] [Scilit]
- Malainine, C.E.; Ouabid, M.; Parat, F.; Raji, O.; Bodinier, J.-L.; Youbi, N.; Boumehdi, M.A.; Dautria, J.-M.; Garrido, C.J.; Messbahi, H.E. The Twihinate–Lamlaga Carbonatite Complex: A Potential Source of REE, Nb, and Phosphates at the NW Margin of the West African Craton (Dakhla Province, Morocco). In Selected Studies in Geomorphology, Sedimentology, and Geochemistry; Advances in Science, Technology & Innovation; Springer Nature: Cham, Switzerland, 2023; pp. 7–10. [Google Scholar]
- Balaram, V. Advances in Analytical Techniques and Applications in Exploration, Mining, Extraction, and Metallurgical Studies of Rare Earth Elements. Minerals 2023, 13, 1031. [Google Scholar] [CrossRef] [Scilit]
- Malainine, C.-E.; Ouabid, M.; Raji, O.; Bodinier, J.-L.; Parat, F.; Sadki, O.; Essaadaoui, M.; Garrido, C.J.; Benzaazoua, M. New annular carbonatite-derived Fe-REE-Nb ore structure in southern Morocco: Unveiling a large alkaline province in NW Africa. Ore Geol. Rev. 2025, 186, 106848. [Google Scholar] [CrossRef] [Scilit]
- Imai, N.; Terashima, S.; Itoh, S.; Ando, A. 1994 Compilation of Analytical Data for Minor and Trace Elements in Seventeen Gsj Geochemical Reference Samples, “Igneous Rock Series”. Geostand. Newsl. 1995, 19, 135–213. [Google Scholar] [CrossRef] [Scilit]
- Balaram, V. Rare earth elements: A review of applications, occurrence, exploration, analysis, recycling, and environmental impact. Geosci. Front. 2019, 10, 1285–1303. [Google Scholar] [CrossRef] [Scilit]
- Patil, A.B.; Tarik, M.; Schuler, A.J.; Torrent, L.; Struis, R.P.W.J.; Ludwig, C. Insights about inductively coupled plasma optical emission spectroscopy interferences of major rare earth elements in complex e-waste feeds. Spectrochim. Acta Part B At. Spectrosc. 2022, 191, 106399. [Google Scholar] [CrossRef] [Scilit]
- Zivkovic, Z.; Danyushevsky, L.; Halley, S.; Barker, S.; Baker, M. Comparison of lithium borate fusion and four-acid digestions for the determination of whole-rock chemistry—Implications for lithogeochemistry and mineral exploration. Geochem. Explor. Environ. Anal. 2023, 23, geochem2022–054. [Google Scholar] [CrossRef] [Scilit]
- Aramendía, M.; García-Mesa, J.C.; Alonso, E.V.; Garde, R.; Bazo, A.; Resano, J.; Resano, M. A novel approach for adapting the standard addition method to single particle-ICP-MS for the accurate determination of NP size and number concentration in complex matrices. Anal. Chim. Acta 2022, 1205, 339738. [Google Scholar] [CrossRef] [Scilit]
- International Council for Harmonisation (ICH). Q2(R1) Validation of Analytical Procedures: Text and Methodology; ICH: Geneva, Switzerland, 1995. [Google Scholar]
- NF T90-210; Qualité de l’Eau—Protocole d’Évaluation Initiale des Performances d’une Méthode dans un Laboratoire. AFNOR: La Plaine Saint-Denis, France, 2018. Available online: https://www.boutique.afnor.org/fr-fr/norme/nf-t90210/qualite-de-leau-protocole-devaluation-initiale-des-performances-dune-method/fa190833/81632 (accessed on 3 October 2026).
- Ismail, S.A.; Afify, A.S. Validation and measurement uncertainty of rapid and simultaneous determination of 19 elements in drinking water using ICP-MS. Accredit. Qual. Assur. 2022, 27, 299–311. [Google Scholar] [CrossRef] [Scilit]
- Balaram, V.; Subramanyam, K.S.V. Sample preparation for geochemical analysis: Strategies and significance. Adv. Sample Prep. 2022, 1, 100010. [Google Scholar] [CrossRef] [Scilit]
- Bhukya, V.N.; Beda, D.P. Implementation of green analytical principles to develop and validate the HPLC method for the separation and identification of degradation products of Panobinostat, and its characterization by using LC-QTOF-MS/MS and its in-silico toxicity prediction using ADMET software. Green Anal. Chem. 2024, 8, 100090. [Google Scholar] [CrossRef] [Scilit]
- Chen, K.; Mou, P.; Zhu, A.; Chen, P.; Chen, J.; Gao, G.; Wang, X.; Feng, X.; Yu, C. A comparative study of different methods for the determination of cadmium in various tissues of ramie (Boehmeria nivea L.). Environ. Monit. Assess. 2023, 195, 1009. [Google Scholar] [CrossRef] [Scilit]
- Cherviakouski, K.; Pandey, O.P.; Liu, J.; van der Zwan, F.M. Application of microwave digestion for complete dissolution of igneous silicate rock samples: A simple and quick sample preparation procedure. Talanta 2024, 277, 126377. [Google Scholar] [CrossRef] [Scilit]
- Wang, C.; Zhang, S. An Improved Ferrozine-Based Protocol for Safe, Reproducible, and Accurate Quantification of Iron in Biological and Chemical Samples. Methods Protoc. 2026, 9, 9. [Google Scholar] [CrossRef] [Scilit]
- Binde, D.R.; De Moraes, M.F.; Haefele, S.M.; Broadley, M.R. Trace element distribution in soils and food in intensively cultivated tropical areas of Mato Grosso, Brazil. Sci. Rep. 2026, 16, 16678. [Google Scholar] [CrossRef] [Scilit]
- Lee, H.; Sim, J.H.; Kim, J.Y.; Park, S.-R.; Jang, G.-H.; Eom, M. Improvement of simultaneous multi-residue analysis of 5 β-agonists in livestock and fishery products using LC-MS/MS. Anal. Sci. Technol. 2025, 38, 157–168. [Google Scholar] [CrossRef]
- Xie, X.; Li, W.; Guo, L.; Zhang, X.; Le, Q.; Hu, W.; Hu, C.; Chen, W. Hydrothermal synthesis of Na2SiF6 crystals from low-temperature activated fluorite ore: The effect of acid additives and characterization. J. Solid State Chem. 2026, 362, 126200. [Google Scholar] [CrossRef] [Scilit]
- Bell, K.; Kjarsgaard, B.A.; Simonetti, A. Carbonatites—Into the Twenty-First Century. J. Petrol. 1998, 39, 1839–1845. [Google Scholar] [CrossRef]
- Simandl, G.J.; Paradis, S. Carbonatites: Related ore deposits, resources, footprint, and exploration methods. Appl. Earth Sci. 2018, 127, 123–152. [Google Scholar] [CrossRef] [Scilit]
- Thangavel, S.; Venkateswarlu, G.; Durgaprasad, A.; Sunilkumar, B.; Khuntia, A.; Dash, K.; Durani, S. Determination of rare earth elements in ferrocarbonatite using ICP-AES and ICP-MS. J. Radioanal. Nucl. Chem. 2024, 334, 4251–4255. [Google Scholar] [CrossRef] [Scilit]
- ISO/IEC 17025:2017; General Requirements for the Competence of Testing and Calibration Laboratories. ISO: Geneva, Switzerland, 2017. Available online: https://www.iso.org/standard/66912.html (accessed on 3 October 2026).
- Corzo-Remigio, A.; Nkrumah, P.N.; Erskine, P.D.; van der Ent, A. Rare Earth Elements in Plants of the Peak Range Volcanics (Queensland), Australia Exploration Target: A Biogeochemical Prospecting Tool. Ecol. Res. 2026, 41, e70018. [Google Scholar] [CrossRef] [Scilit]
- Gong, C.; Lu, H.; Zhang, K.; Ding, Y.; Wang, L. Simultaneous Determination of 50 Elements in Geological Samples by ICP-MS Combined with ICP-OES|Spectroscopy Online. Available online: https://www.spectroscopyonline.com/view/simultaneous-determination-of-50-elements-in-geological-samples-by-icp-ms-combined-with-icp-oes (accessed on 16 August 2026).
- Beauchemin, D. Effect Of Sample Injection Volume On Non-Spectroscopic And Spectroscopic Interferences In Inductively Coupled Plasma Mass Spectrometry. At. Spectrosc. 2023, 44, 8–13. [Google Scholar] [CrossRef] [Scilit]
- Alonso-Perez, R.; Day, J.M.D.; Pearson, D.G.; Luo, Y.; Palacios, M.A.; Sudhakar, R.; Palke, A. Exploring emerald global geochemical provenance through fingerprinting and machine learning methods. Artif. Intell. Geosci. 2024, 5, 100085. [Google Scholar] [CrossRef] [Scilit]
- Pradhan, S.K.; Ambade, B. Extractive separation of rare earth elements and their determination by inductively coupled plasma optical emission spectrometry in geological samples. J. Anal. At. Spectrom. 2020, 35, 1395–1404. [Google Scholar] [CrossRef] [Scilit]
- Han, H.J.; Gysi, A.P.; Frey, B. An ICP-OES method for the precise and accurate quantification of rare earth elements in natural water: A comparative study from mine waste sites in New Mexico, USA. Spectrochim. Acta Part B At. Spectrosc. 2026, 237, 107451. [Google Scholar] [CrossRef] [Scilit]
- Patil, A.B.; Thalmann, N.; Torrent, L.; Tarik, M.; Struis, R.P.W.J.; Ludwig, C. Surfactant-Based Enrichment of Rare Earth Elements from NdFeB Magnet E-Waste: Optimisation of Cloud Formation and Rare Earths Extraction|Lib4RI. Available online: https://www.dora.lib4ri.ch/psi/item/psi:52516 (accessed on 14 August 2026).
- Zybinskii, A.; Kolotov, V.; Karandashev, V.; Kordyukov, S. Determination of Rare-Earth and Accompanying Elements in Niobium−Rare-Earth Ores by Inductively Coupled Plasma Atomic Emission Spectrometry Using Model Calibration and a Mathematical Approach for Resolving Spectral Interferences. J. Anal. Chem. 2019, 74, 213–225. [Google Scholar] [CrossRef] [Scilit]
- Grotti, M.; Magi, E.; Leardi, R. Selection of internal standards in inductively coupled plasma atomic emission spectrometry by principal component analysis. J. Anal. At. Spectrom. 2003, 18, 274–281. [Google Scholar] [CrossRef] [Scilit]
- Djeddi, A.; Parat, F.; Bodinier, J.-L.; Ouzegane, K.; Dautria, J.-M. The Syenite–Carbonatite Complex of Ihouhaouene (Western Hoggar, Algeria): Interplay Between Alkaline Magma Differentiation and Hybridization of Cumulus Crystal Mushes. Front. Earth Sci. 2021, 8, 605116. [Google Scholar] [CrossRef] [Scilit]
- Fariñas, J.C.; Rucandio, I.; Pomares-Alfonso, M.S.; Villanueva-Tagle, M.E.; Larrea, M.T. Determination of rare earth and concomitant elements in magnesium alloys by inductively coupled plasma optical emission spectrometry. Talanta 2016, 154, 53–62. [Google Scholar] [CrossRef] [Scilit]
- Yakushev, E.; Berezina, A.; Yakubov, S.; Novikov, M.; Ghaffari, P.; Dzhurova, B.; Hristova, O.; Vogt, R.; Ranneklev, S. Model-based analysis of seasonal hypoxia: The Varna Lake–Bay case study. Ecol. Model. 2026, 515, 111535. [Google Scholar] [CrossRef] [Scilit]
- Ardini, F.; Soggia, F.; Rugi, F.; Udisti, R.; Grotti, M. Comparison of inductively coupled plasma spectrometry techniques for the direct determination of rare earth elements in digests from geological samples. Anal. Chim. Acta 2010, 678, 18–25. [Google Scholar] [CrossRef] [Scilit]
- Elia, R.; Johnston, T.J.; Figueroa, A.D.; Curbow, E.M.; Gonzalez Guzman, M.S.; Rodriguez Cabrera, L.C.; Morcom, M.M.; Jones, W.B. Multi-wavelength internal standardization using inductively coupled plasma optical emission spectrometry. Anal. Chim. Acta 2025, 1370, 344386. [Google Scholar] [CrossRef] [Scilit]
- Rietig, A.; Acker, J. Development and validation of a new method for the precise and accurate determination of trace elements in silicon by ICP-OES in high silicon matrices. J. Anal. At. Spectrom. 2017, 32, 322–333. [Google Scholar] [CrossRef] [Scilit]
- International Council for Harmonisation (ICH); FDA. Q2(R2) Validation of Analytical Procedures—Text and Methodology; ICH: Geneva, Switzerland, 2024. [Google Scholar]
- Mnculwane, H.T. Rare Earth Elements Determination by Inductively Coupled Plasma Mass Spectrometry after Alkaline Fusion Preparation. Analytica 2022, 3, 135–143. [Google Scholar] [CrossRef] [Scilit]
- ZhangZhou, J.; He, C.; Sun, J.; Zhao, J.; Lyu, Y.; Wang, S.; Zhao, W.; Li, A.; Ji, X.; Agarwal, A. Geochemistry π: Automated Machine Learning Python Framework for Tabular Data. Geochem. Geophys. Geosystems 2024, 25, e2023GC011324. [Google Scholar] [CrossRef] [Scilit]
- ISO 5725-3; 2023; Accuracy (trueness and precision) of measurement methods and results—Part 3: Intermediate precision and alternative designs for collaborative studies. ISO: Geneva, Switzerland, 2023. Available online: https://www.iso.org/standard/69420.html (accessed on 3 October 2026).
- Lee, S.-G.; Ko, K.-S. Development of an analytical method for accurate and precise determination of rare earth element concentrations in geological materials using an MC-ICP-MS and group separation. Front. Chem. 2023, 10, 906160. [Google Scholar] [CrossRef] [Scilit]
- ’t Lam, R.U.E. Scrutiny of variance results for outliers: Cochran’s test optimized. Anal. Chim. Acta 2010, 659, 68–84. [Google Scholar] [CrossRef] [Scilit]
- Horwitz, W.; Albert, R. The Horwitz ratio (HorRat): A useful index of method performance with respect to precision. J. AOAC Int. 2006, 89, 1095–1109. [Google Scholar] [CrossRef] [Scilit]
- Walsh, S.J.; Macsik, Z.; Wegrzynek, D.; Krieger, T.; Boulyga, S. Model diagnostics for detecting and identifying method repeatability outliers in precision studies: Application to a homogeneity study under a two-stage nested ANOVA. J. Anal. At. Spectrom. 2016, 31, 686–699. [Google Scholar] [CrossRef] [Scilit]
- Senila, M. Recent Advances in the Determination of Major and Trace Elements in Plants Using Inductively Coupled Plasma Optical Emission Spectrometry. Molecules 2024, 29, 3169. [Google Scholar] [CrossRef] [Scilit]
- Senila, M.; Drolc, A.; Pintar, A.; Senila, L.; Levei, E. Validation and measurement uncertainty evaluation of the ICP-OES method for the multi-elemental determination of essential and nonessential elements from medicinal plants and their aqueous extracts. J. Anal. Sci. Technol. 2014, 5, 37. [Google Scholar] [CrossRef] [Scilit]
- Universidade Federal de Minas Gerais; Caldeira, G.; Evangelista, P.; Pereira, B.; Bernhard, N.; Lage, M.; Sampaio, G.; Egreja Filho, F.; Windmöller, C. Enhanced Microwave-Assisted Digestion Method for Accurate Trace-Level Analysis of Rare Earth Elements in Environmental Matrices. Braz. J. Anal. Chem. 2025, 13, 80–99. [Google Scholar] [CrossRef] [Scilit]
- Kadam, P.; Bhalerao, S. Sample size calculation. Int. J. Ayurveda Res. 2010, 1, 55–57. [Google Scholar] [CrossRef] [Scilit]

Disclaimer/Publisher’s Note: The statements, opinions and data contained in all publications are solely those of the individual author(s) and contributor(s) and not of MDPI and/or the editor(s). MDPI and/or the editor(s) disclaim responsibility for any injury to people or property resulting from any ideas, methods, instructions or products referred to in the content. |
© 2026 by the authors. Licensee MDPI, Basel, Switzerland. This article is an open access article distributed under the terms and conditions of the Creative Commons Attribution (CC BY) license.