


Abstract
Lipid metabolites in maize kernels determine grain quality by influencing nutritional value, oxidative stability, and post-harvest deterioration, making their profiling essential for quality improvement and breeding. This study applies hyperspectral imaging (HSI) with a spectral range of 900–1700 nm to detect maize lipid metabolites. Six lipid metabolites—9-Octadecynoic acid (stearolic acid), pinolenic acid (Δ5,9,12 18:3), N-Acylethanolamine (16:0), N-Acylethanolamine (18:0), N-Acylethanolamine (18:1), and propionic acid—were selected due to their strong relevance to maize kernel quality and favorable spectral response. First, two-trace two-dimensional (2T2D) correlation spectroscopy with heterogeneous preprocessing is employed to capture both synchronous and asynchronous correlations across different preprocessing spectra. A convolutional autoencoder (CAE) was subsequently used to extract low-dimensional latent features from heterogeneous 2T2D-COS representations, followed by regression modeling using random forest (RF), support vector regression (SVR), gradient boosting (GB), and partial least squares regression (PLSR). A total of 82 maize seed varieties were employed for experimental validation. Compared with one-dimensional spectral, homogeneous preprocessing, and PCA-based feature extraction, the proposed approach provided improved predictive performance across the six lipid metabolites, with the optimal CAE-based models achieving RP2 values of 0.629–0.887, RMSEP values of 0.241–0.565, and RPD values of 1.656–2.069. Overall, this approach provides a rough screening solution for metabolite prediction in maize crop.
1. Introduction
Maize is a globally significant cereal crop essential for food security, livestock feed, and industrial applications [1]. With advances in agricultural modernization and increasing demand from the food industry, maize improvement has shifted from a sole focus on yield to include nutritional composition and metabolic characteristics. Lipid metabolites in maize kernels are key determinants of grain quality, influencing nutritional value, flavor, and storage stability [2]. In particular, unsaturated fatty acids play important roles in determining oil quality by influencing oxidative stability, flavor formation, and nutritional value. Fatty acid ethanolamides function as bioactive signaling molecules involved in membrane homeostasis, stress responses, and kernel development. Additionally, short-chain fatty acids are associated with intermediary carbon metabolism and may reflect metabolic adjustments related to post-harvest storage and grain quality. Collectively, these lipid metabolites reflect key biochemical processes underlying maize kernel quality [3,4,5,6]. Therefore, profiling of lipid metabolites is critical for maize quality improvement and high-value germplasm breeding.
Currently, lipid metabolite profiling in maize primarily relies on widely used targeted and untargeted metabolomics techniques using GC-MS and HPLC-MS [7]. While highly sensitive and accurate, these methods are costly, labor-intensive, time-consuming, and unsuitable for rapid large-scale screening, highlighting the need for efficient, reagent-free, and low-cost alternatives for lipid metabolite detection in maize.
Hyperspectral imaging (HSI) has emerged as a promising analytical technique due to its reagent-free nature, rapid data acquisition, and high-throughput capability [8]. In maize, HSI has been primarily applied to predict major components such as starch and total oil content [9]. Previous studies have demonstrated its potential for predicting fatty acid-related parameters in oilseed crops and the food system [10]. However, accurate prediction of complex metabolites remains challenging [11]. Many lipid metabolites exhibit weak spectral responses, overlapping absorption features, and nonlinear spectral behavior, which cannot be sufficiently captured by conventional one-dimensional spectral features, resulting in limited prediction accuracy.
Two-dimensional correlation spectroscopy (2D-COS) improves spectroscopic analysis by generating synchronous and asynchronous spectra from a series of dynamic spectra, enabling the detection of subtle variations and weak but chemically meaningful features often obscured in one-dimensional spectra [12]. Its two-trace variant (2T2D-COS) extends this concept to pairs of spectra, capturing correlational information without requiring a dynamic series. Conventionally, 2T2D-COS applies identical preprocessing to both the reference and sample spectra to maintain consistency and reduce noise. However, hyperspectral data exhibit multi-scale characteristics, weak absorption signals, and nonlinear responses. Under such conditions, a single preprocessing method may enhance certain spectral features while suppressing others, thereby limiting the diversity of information that can be extracted by 2T2D-COS.
To further enrich spectral information, this study extends 2T2D correlation spectroscopy (2T2D-COS) by introducing a heterogeneous preprocessing strategy. In this strategy, different preprocessing methods are independently applied to the reference and sample spectra. Consequently, the resulting synchronous and asynchronous spectra integrate information from multiple preprocessing steps, enabling better extraction of complex metabolic features. Additionally, convolutional autoencoders (CAEs), as unsupervised deep learning models, facilitate end-to-end feature extraction, dimensionality reduction, and redundancy suppression. Compared with linear methods such as principal component analysis (PCA), CAEs more effectively model nonlinear structures in hyperspectral data, enhancing predictive performance [13]. Integrating CAEs with heterogeneous 2T2D spectra is expected to enhance both accuracy and stability in lipid metabolite prediction.
Building on the above, an integrated approach combining 2T2D-COS, heterogeneous spectral preprocessing, and deep feature learning is proposed. To evaluate the feasibility of the proposed approach for maize lipid metabolite prediction, six representative metabolites were selected, encompassing diverse structural classes: unsaturated fatty acids (9-Octadecynoic acid (stearolic acid) and pinolenic acid (Δ5,9,12 18:3)), fatty acid ethanolamides (N-Acylethanolamine (16:0), N-Acylethanolamine (18:0), and N-Acylethanolamine (18:1)), and the short-chain fatty acid (propionic acid). These metabolites differ substantially in carbon chain length, molecular backbone, degree of unsaturation, and functional groups. Such structural diversity enables an initial evaluation of the proposed framework across metabolites with varying physicochemical properties [14,15]. The main innovations are:
(1) 2T2D-COS is employed for hyperspectral prediction of lipid metabolites in maize, where synchronous and asynchronous spectra are constructed from reference and sample spectra to resolve spectral overlaps and reveal latent correlations that are not observable in one-dimensional spectra.
(2) A heterogeneous preprocessing strategy is proposed, in which multiple preprocessing methods are applied in parallel to the raw spectra, and 2T2D-COS is then used to fuse different preprocessing spectral features, thereby enhancing the representation of metabolite-related information.
(3) A CAE-based deep feature extraction model is constructed for data derived from heterogeneous 2T2D-COS. Compared with PCA, the proposed model demonstrates superior capability in capturing nonlinear relationships and improving prediction performance.
2. Materials and Methods
2.1. Materials
A total of 82 maize seed varieties were provided by the Maize Research Center of the Jiangsu Academy of Agricultural Sciences. All maize varieties were cultivated at the Liuhe experimental base of the Jiangsu Academy of Agricultural Sciences. Mature maize kernels were collected and stored at low temperature.
2.2. Hyperspectral Data Acquisition
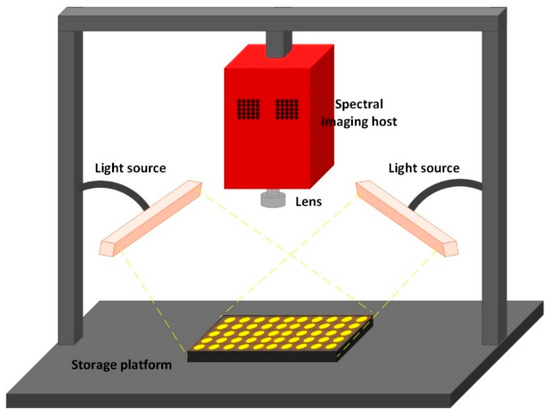
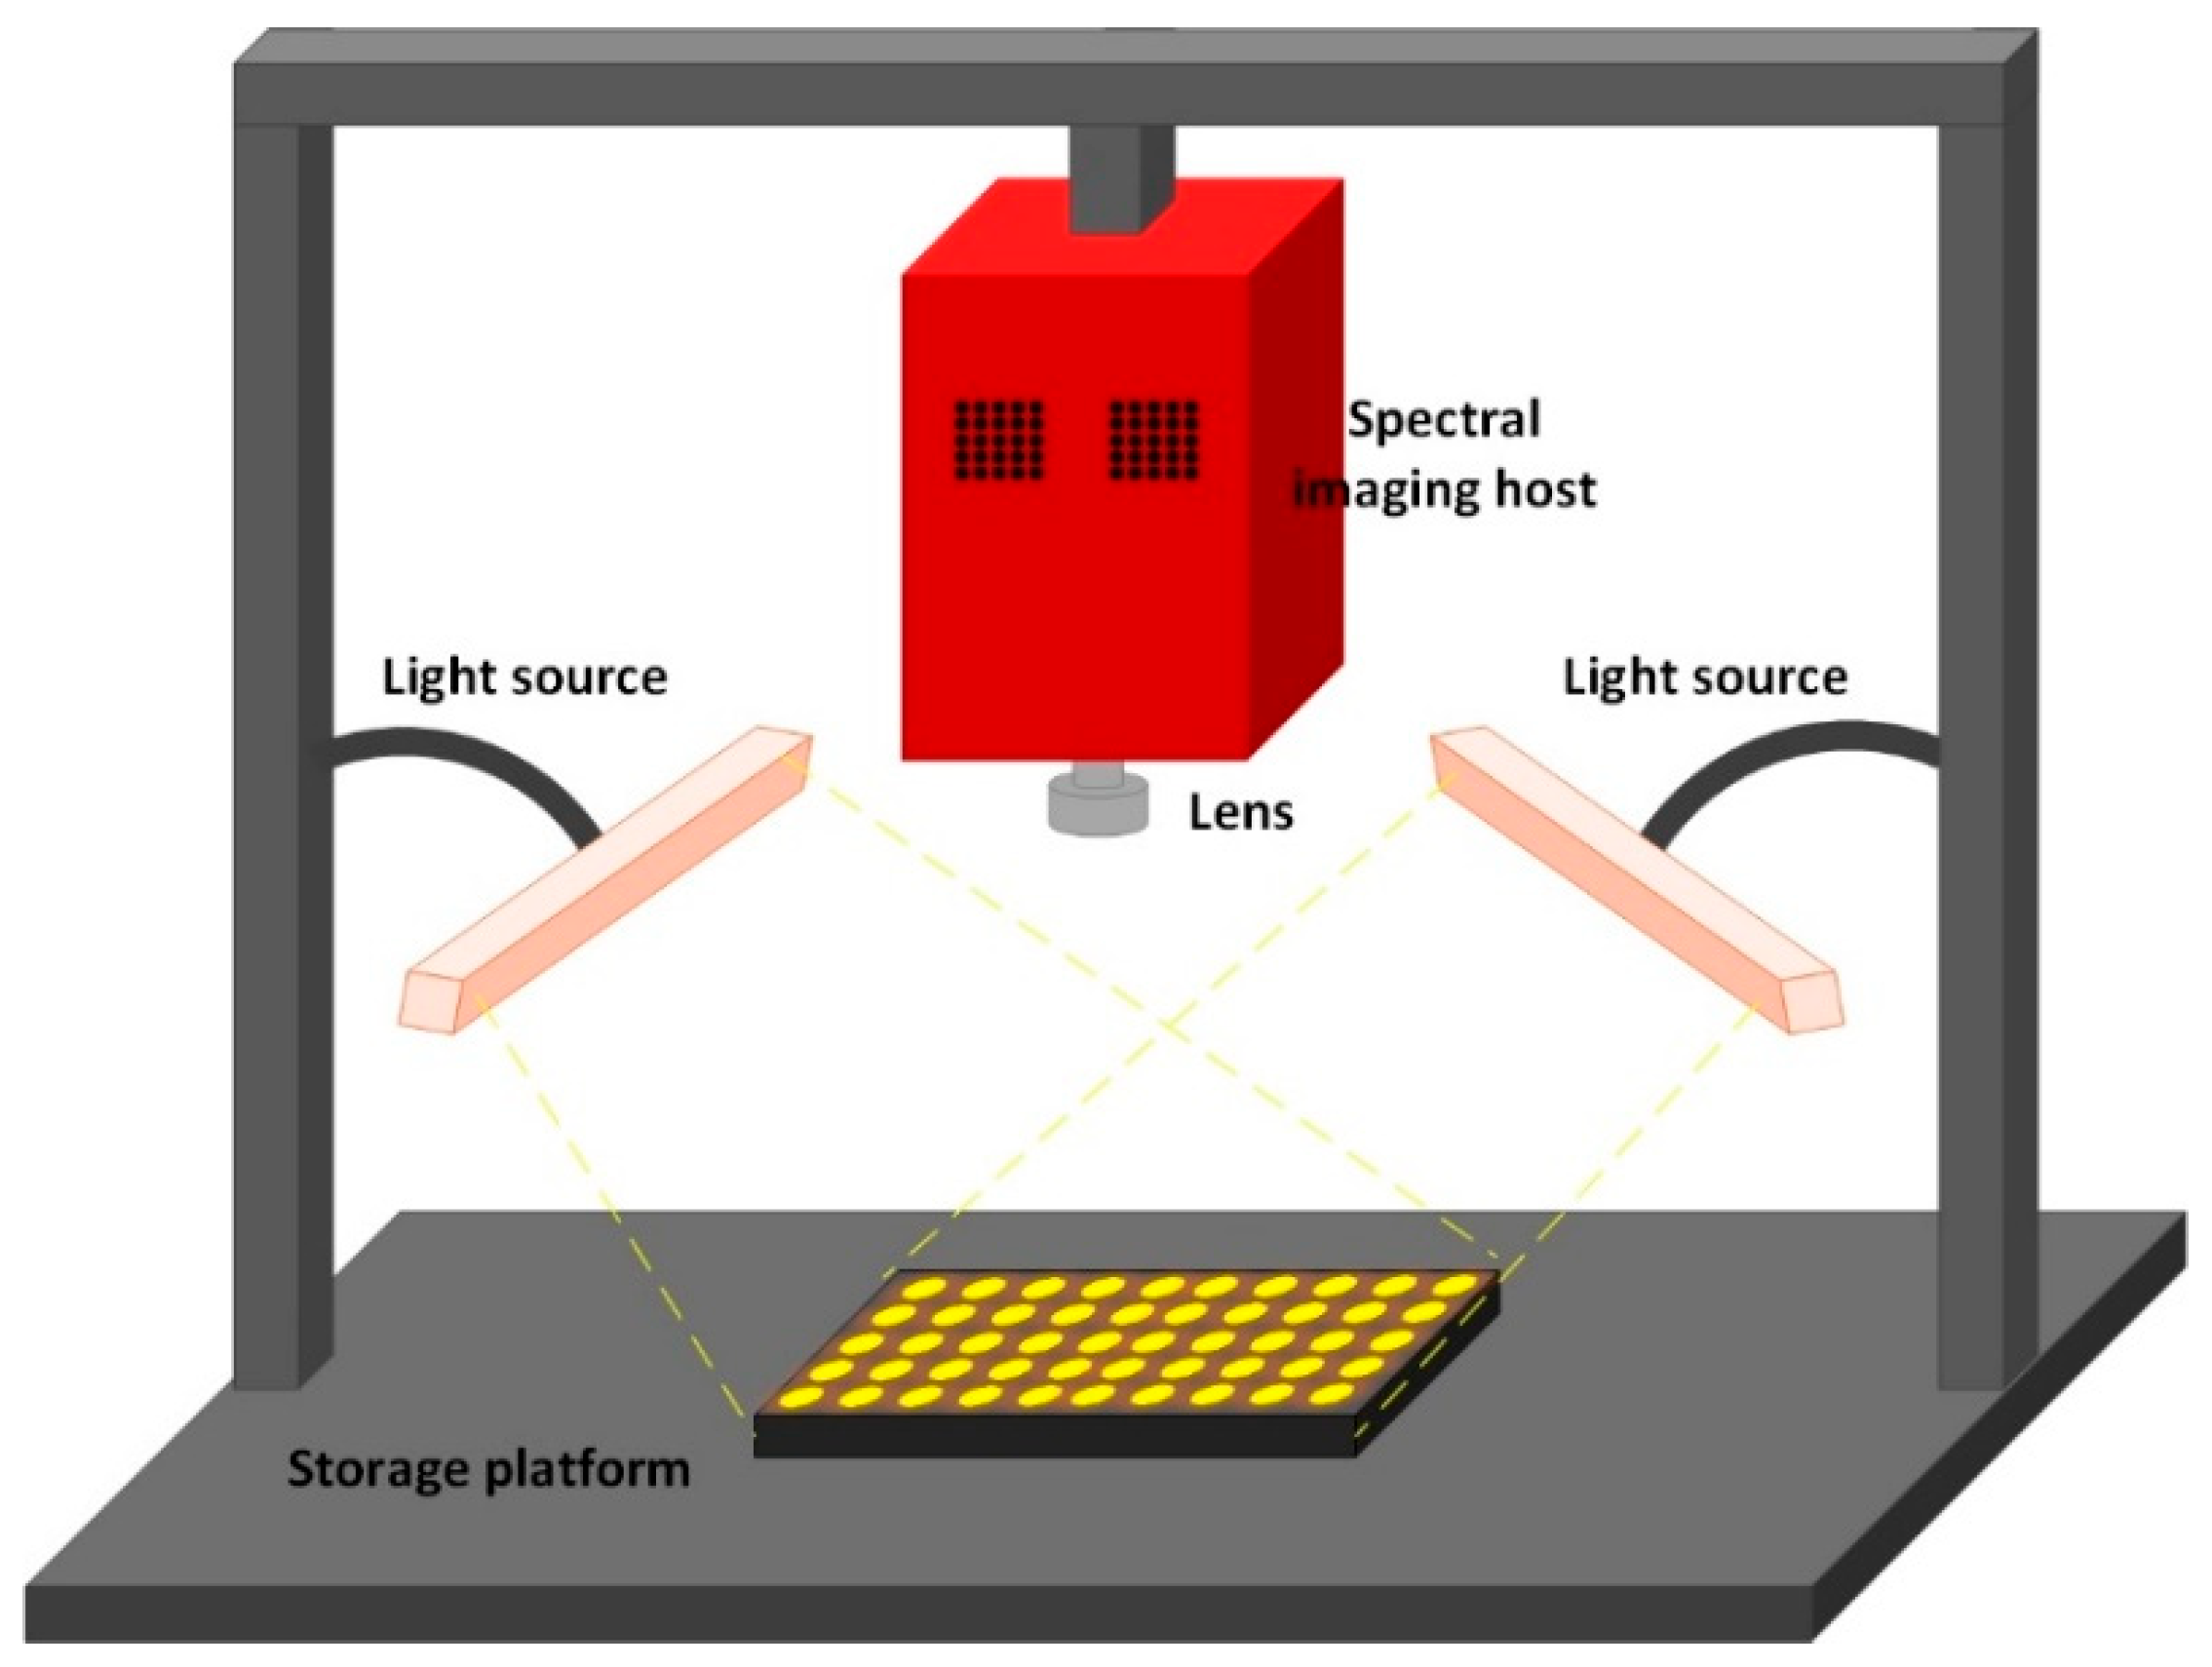
The digital correlation spectroscopic imaging system used in this research was produced by Wuling Optical Co., Ltd. (Shanghai, China). The hyperspectral imaging system is shown in Figure 1.
Figure 1.
Hyperspectral imaging system.
The system is based on transmission grating spectroscopy technology, with a spectral response range of 900–1700 nm and a spectral sampling interval of 1.56 nm. The detector uses an InGaAs camera chip with a pixel size of 15 μm × 15 μm, a pixel count of 640 × 512, and features a high dynamic range and low readout noise. The system incorporates two precision motor-driven mechanisms: a stepper motor drives the scanning stage, providing an electrically controlled movement range of ≥10 mm with a resolution better than 5 μm to ensure accurate spectral positioning, while the other motor controls the autofocus module, enabling automatic adjustment of the focal plane for high-resolution imaging under varying sample conditions. The autofocus camera uses a CMOS chip with a resolution of 2.2 MP (2048 × 1088) for color imaging. The infrared lens has a focal length of 30.7 mm, an F/2.0 aperture, and a working wavelength range of 900–2500 nm. Hyperspectral images were acquired using a hyperspectral imaging system equipped with two 50 W halogen lamps symmetrically positioned on both sides of the sample. Before image acquisition, the illumination system was warmed up to ensure stable light output. White and dark reference images were collected at the beginning of each imaging experiment for reflectance calibration. All samples were measured under identical illumination conditions, and the calibrated reflectance spectra were subsequently extracted for analysis.
Before spectral extraction, all hyperspectral images were corrected using standard white and dark reference calibration according to:
where R is the calibrated reflectance image, I is the raw hyperspectral image, W is the white reference image obtained from a calibrated white standard, and D is the dark reference image acquired with the camera lens covered. This correction procedure effectively compensated for illumination non-uniformity and detector response variation.
For each variety, 20 kernels with similar size and shape were selected and pooled, then cryogenically ground using a tissue grinder (Tissuelyser, QIAGEN, Hilden, Germany, 60 Hz, 30 s). The resulting powder was evenly transferred into a single seed plate well with identical dimensions and depth, then flattened and compacted to ensure a uniform sample surface for hyperspectral image acquisition. Thus, the 20 kernels per variety constituted a composite sample, and the biological experimental unit is the maize variety (n = 82).
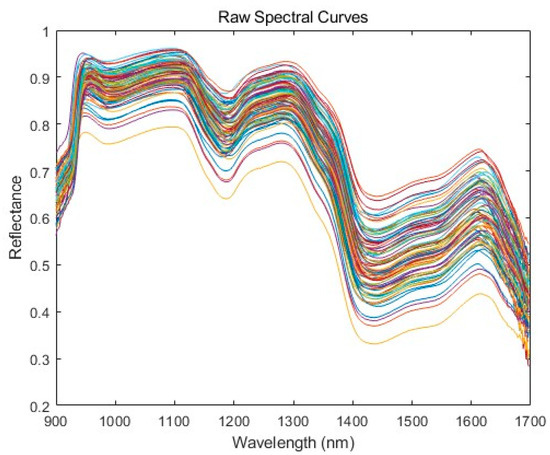
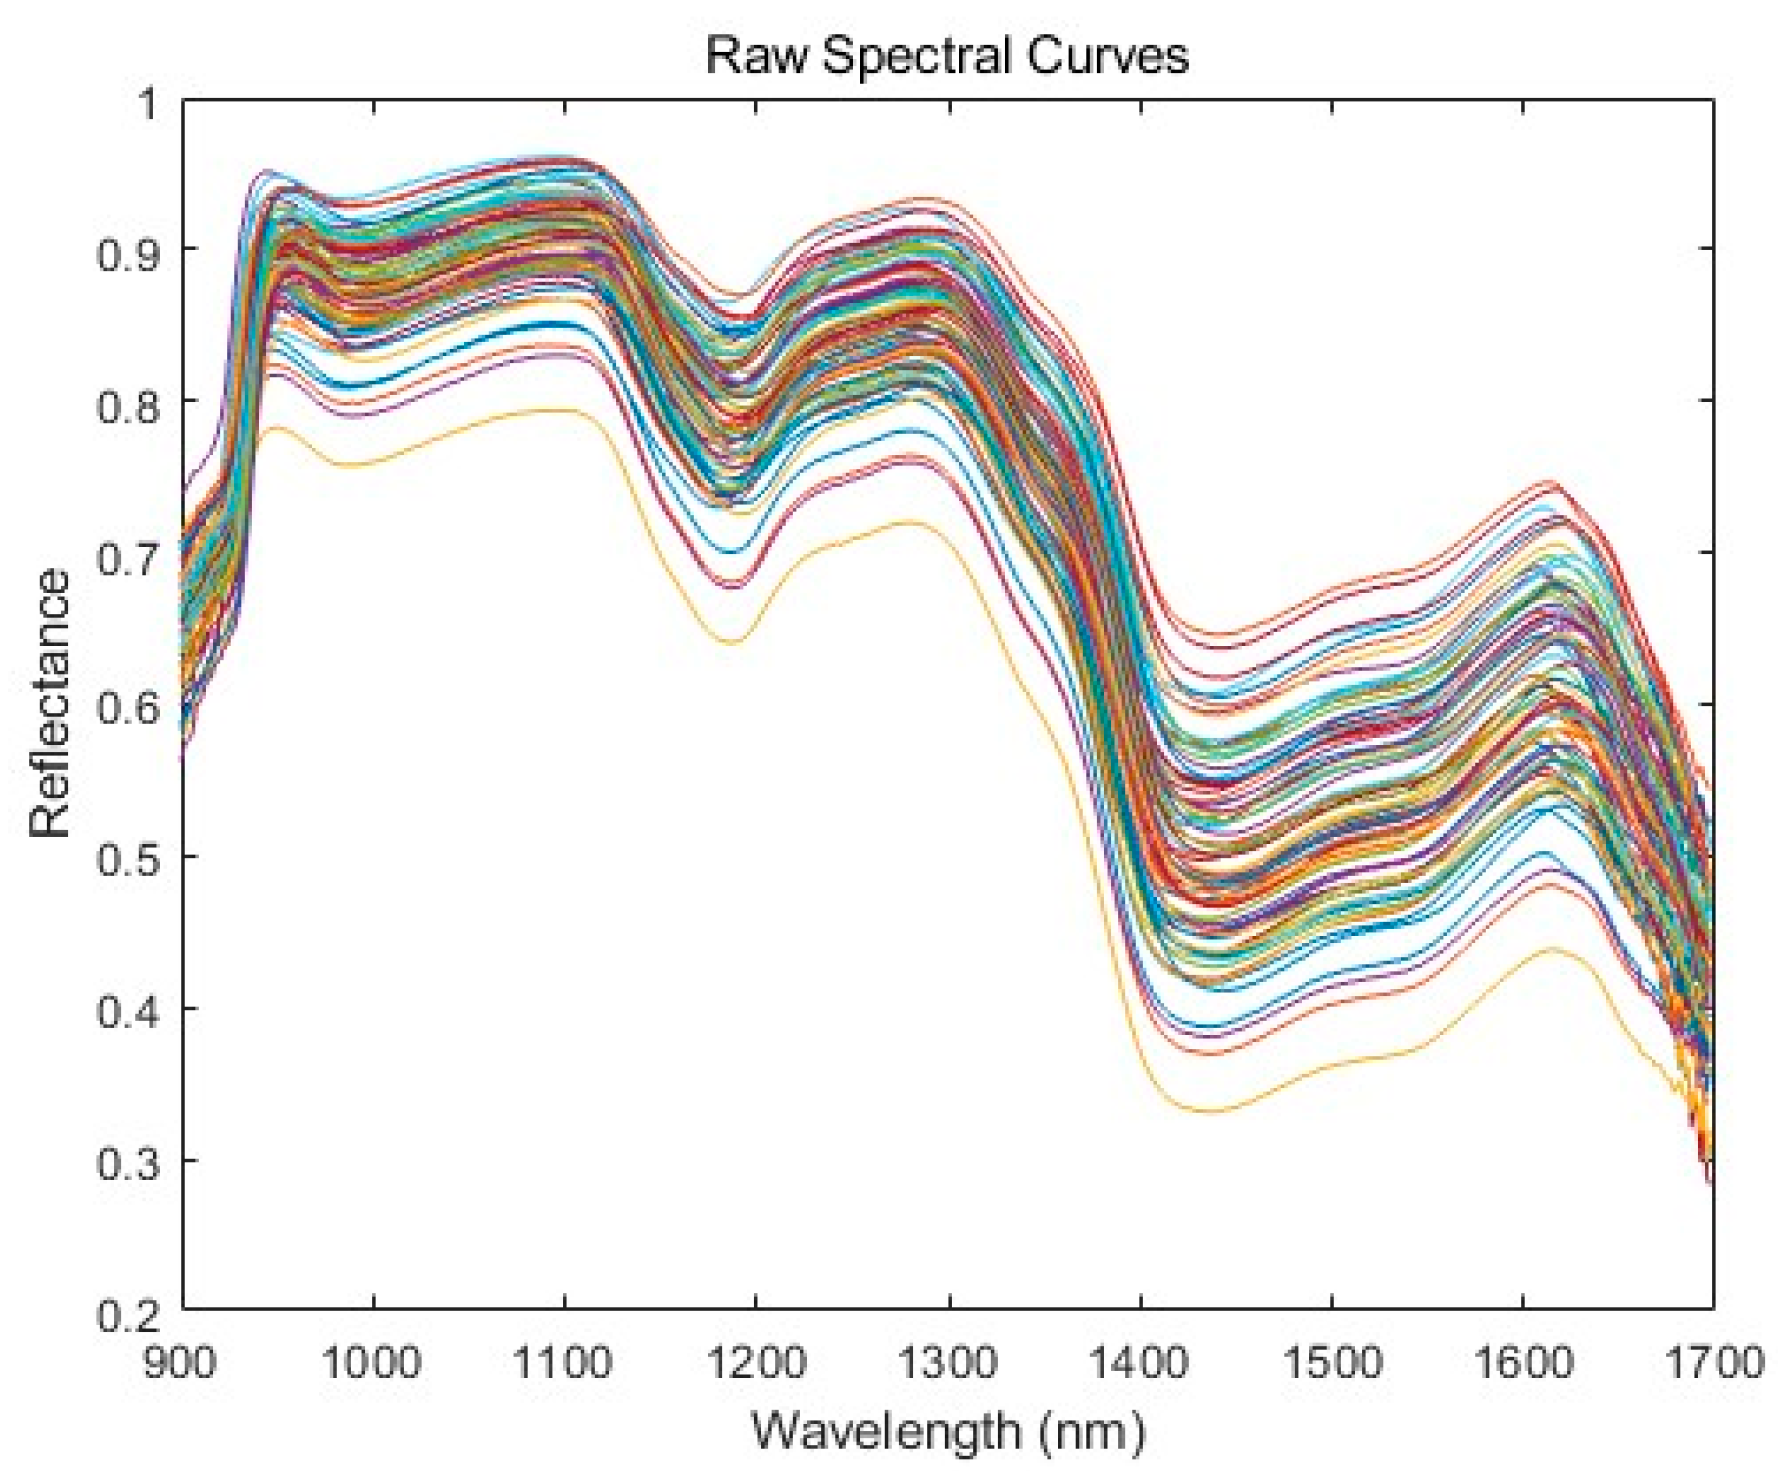
A grayscale transformation followed by threshold-based segmentation was used to isolate the powder region from the background. For each well, the entire powder region was defined as the full-well ROI. The average spectrum of all pixels within this ROI was calculated as the representative spectral curve of that variety, yielding one mean reflectance spectrum per variety-level sample. The original mean spectral curves of the 82 varieties are shown in Figure 2.
Figure 2.
Raw spectral curves.
To mitigate data scarcity without introducing pseudoreplication, a sub-ROI-based spatial augmentation strategy was adopted. Specifically, for each well image, ten spatially non-overlapping sub-ROIs (smaller patches within the powder region) were randomly extracted. The average spectrum of each sub-ROI was treated as a training instance; however, these sub-ROIs are technical replicates derived from the same variety, not independent biological samples. The training dataset was thus expanded tenfold at the spectral-instance level, while the number of independent biological units remained 82. During testing, the ten sub-ROIs from each test variety were likewise processed individually by the trained model, and their corresponding predictions were averaged to obtain a single final prediction for that variety. Therefore, model performance was ultimately evaluated at the variety level, with each variety contributing only one final predicted value, thereby avoiding pseudoreplication and preventing sub-ROIs from the same variety from being treated as independent biological replicates.
2.3. Lipid Metabolite Data
After hyperspectral imaging, the same powder samples were subjected to metabolite extraction. Powder aliquots (25 mg) were extracted with 1 mL methanol:acetonitrile:water (2:2:1, v/v/v) containing internal standards. The mixture was homogenized (35 Hz, 4 min), ultrasonicated on ice (3 × 5 min), and incubated at −40 °C for 1 h to precipitate proteins. After centrifugation (12,000 rpm, 15 min, 4 °C), 300 μL of the supernatant was pressure-filtered (6 psi, 3 min) through a 96-well plate. Pooled quality-control (QC) samples were prepared by mixing equal aliquots from all 82 variety extracts; 10 QC injections were distributed evenly throughout the run sequence (approximately every 7–8 samples) to monitor system stability. Solvent blanks were injected at the beginning and end of each batch. Sample injection order was randomized. The relative standard deviations (RSDs) of the internal-standard responses calculated from the QC samples were <5%, demonstrating good analytical reproducibility. The complete list of internal standards and their RSDs in QC samples is provided in Supplementary Table S1.
Analyses were performed on a Vanquish UHPLC system coupled to an Orbitrap Exploris 120 mass spectrometer (Thermo Fisher Scientific, Waltham, MA, USA), controlled by Xcalibur software (version 4.4). Separation was achieved on a Kinetex C18 column (2.1 × 50 mm, 2.6 μm) maintained at 40 °C, using 0.01% aqueous acetic acid (A) and isopropanol/acetonitrile (1:1, v/v) (B) as mobile phases. The autosampler temperature was 4 °C, and the injection volume was 2 μL. MS data were acquired in positive (3.8 kV) and negative (−3.4 kV) modes. Key parameters were capillary temperature 320 °C, sheath/auxiliary gas 50/15 Arb, full MS/MS resolution 60,000/15,000, and stepped normalized collision energy (SNCE) 20/30/40.
Raw data were converted to mzXML (ProteoWizard v3.0.24054) and processed using in-house R packages for peak detection, alignment, and extraction. Metabolites were annotated (MSI Level 1 or 2) using exact mass and MS/MS spectra matched against an in-house standard library and the BT-Plant database (v1.1).
Data were filtered to retain features with an RSD ≤ 30% in quality-control (QC) samples and a missing rate ≤ 50% across the 82 maize-variety samples. Remaining missing values were imputed via the half-minimum method, and feature intensities were total ion current (TIC)-normalized to correct intra-batch variations. It should be noted that the UHPLC-Orbitrap MS platform used in this study provides relative rather than absolute quantification of metabolite abundances. Accordingly, all quantitative analyses presented in this study refer to relative metabolite levels.
From an analytical perspective, lipid metabolites with clear structural features and stable ionization behavior tend to exhibit more reliable spectral characteristics. In this study, all detected lipid features were first evaluated based on LC-MS data quality (signal-to-noise ratio, peak shape, and reproducibility). From this LC-MS–filtered set, six representative metabolites were predefined as targets before any HSI data were accessed, based solely on analytical quality and structural diversity. Detailed identification parameters for the six target metabolites are provided in Supplementary Table S2.
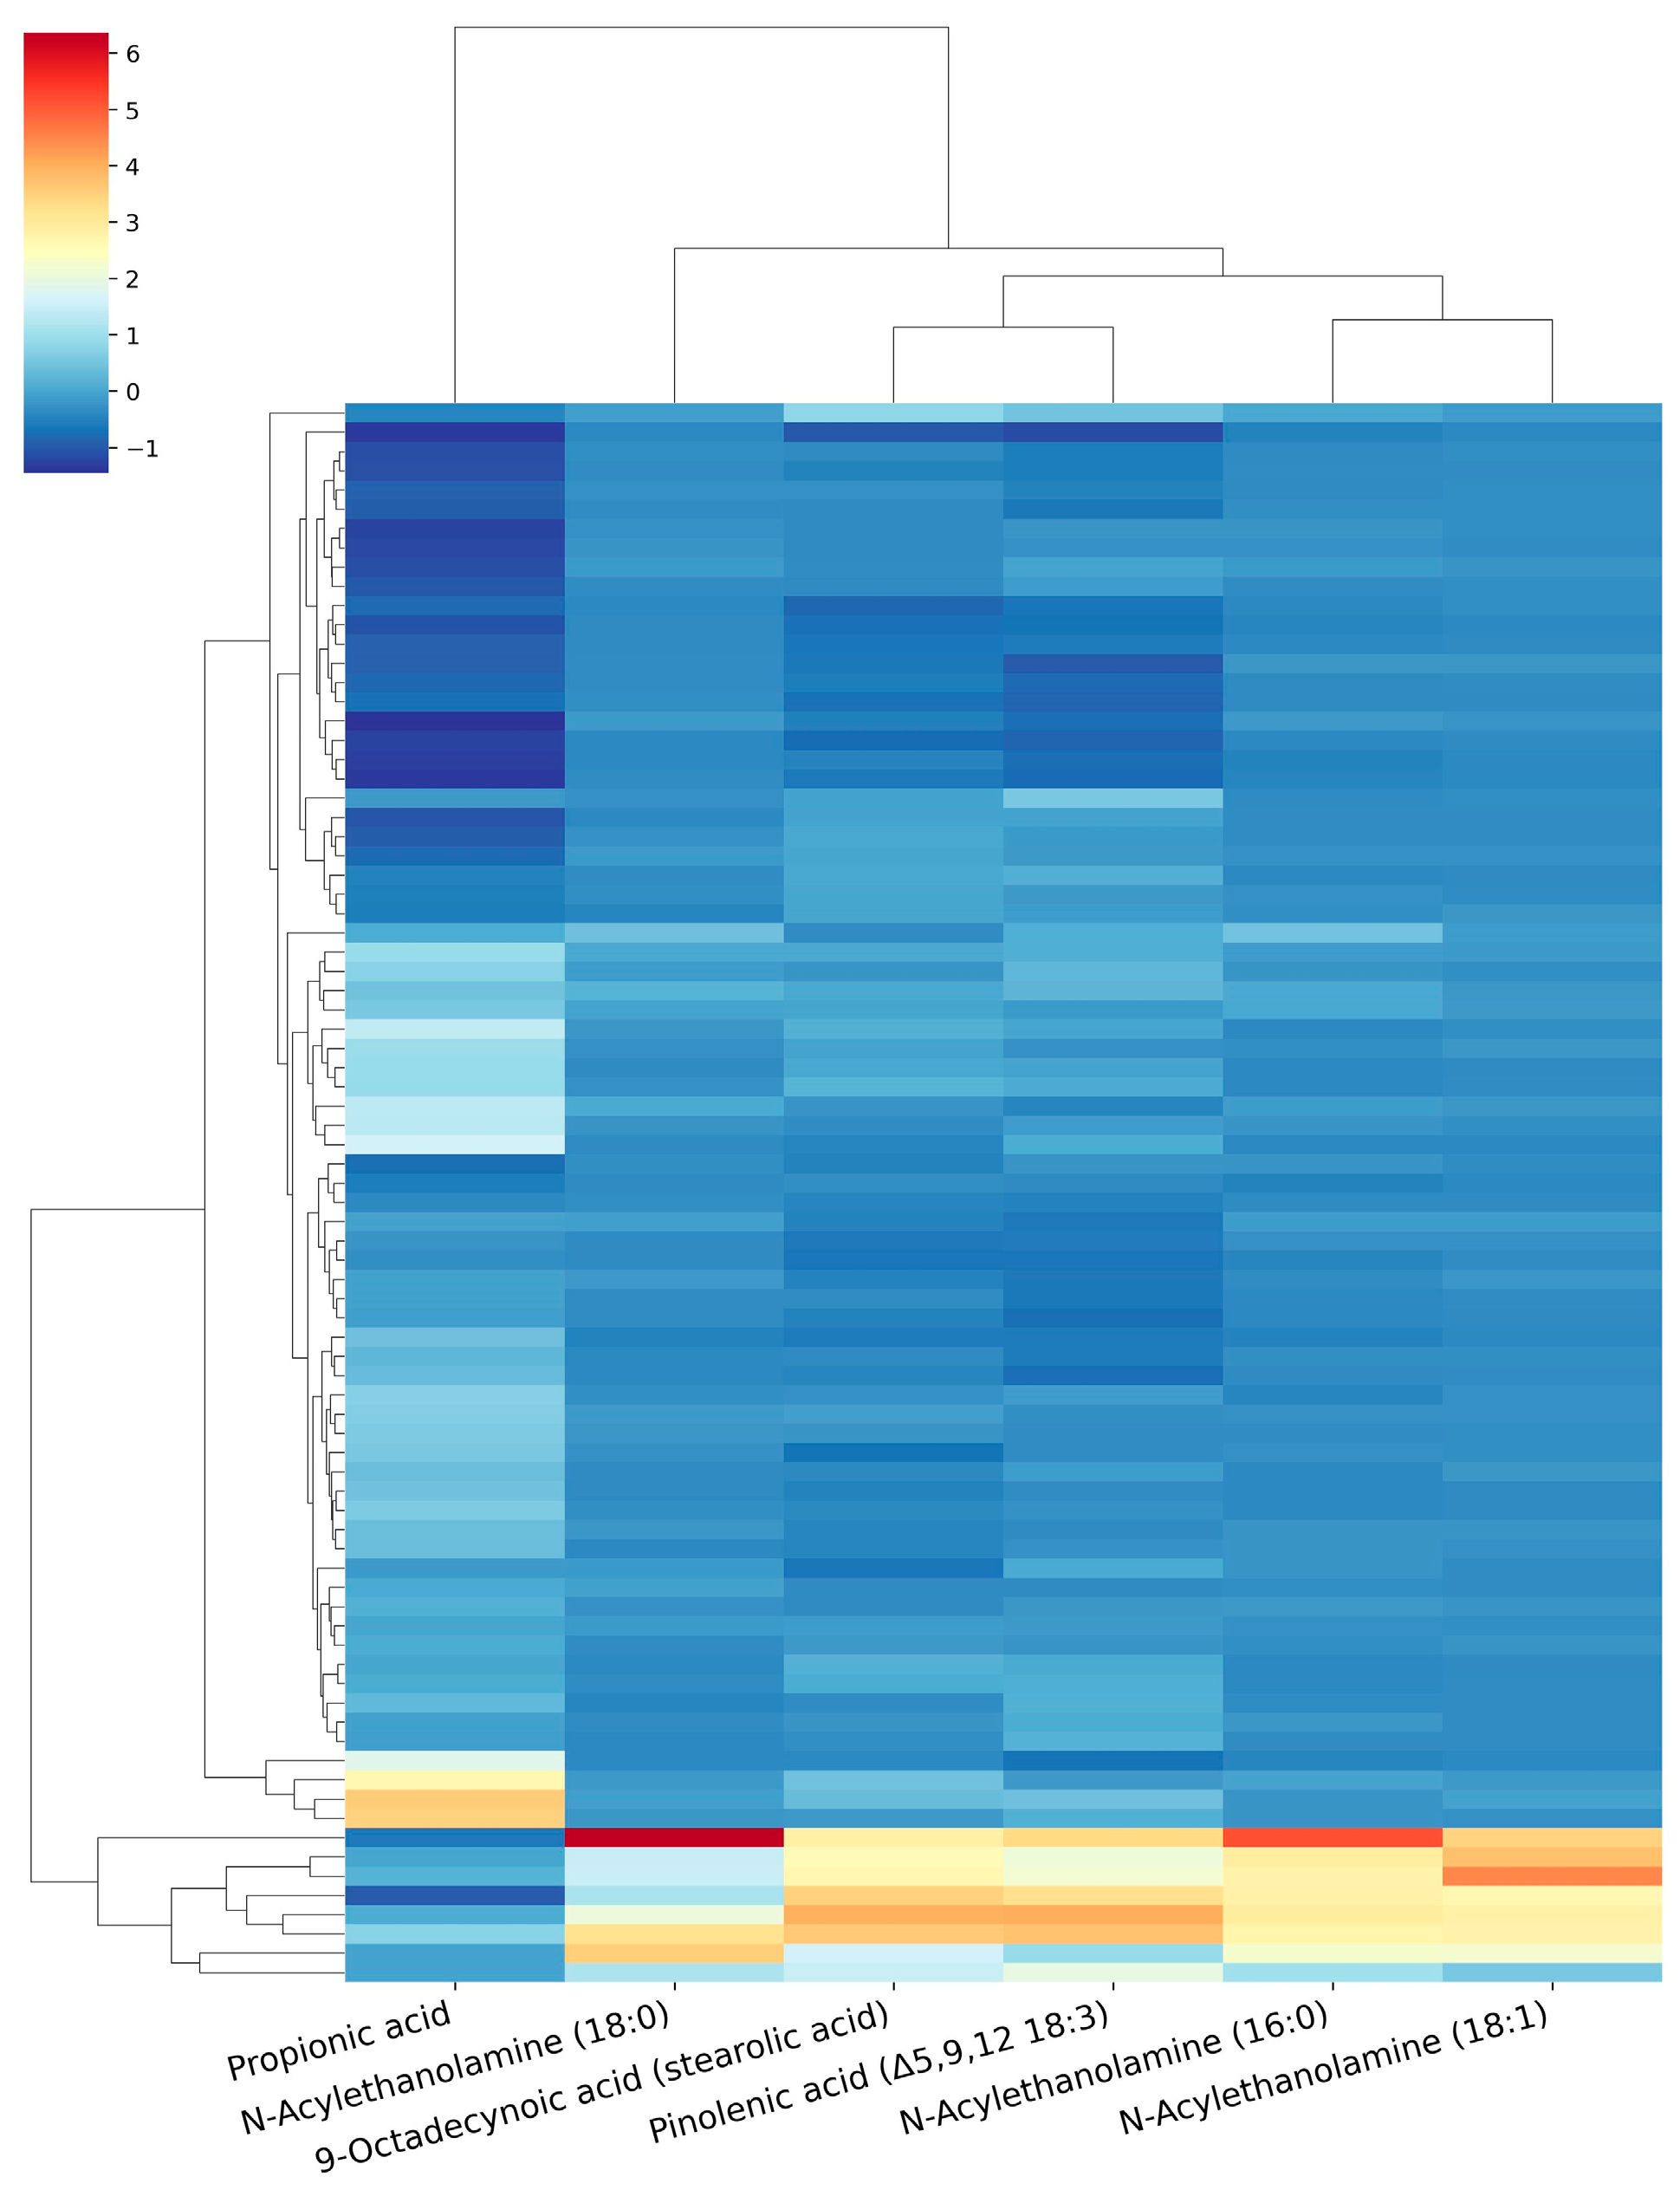
The distribution patterns are illustrated in Figure 3, where the x-axis represents the six metabolites and the y-axis corresponds to the 82 maize samples. Before clustering, metabolite abundances were row-wise z-score normalized to account for differences in relative abundance magnitude among compounds. The color scale indicates the z-score (number of standard deviations from the metabolite-specific mean).
Figure 3.
Heatmap of six representative lipid metabolites.
2.4. Spectral Preprocessing
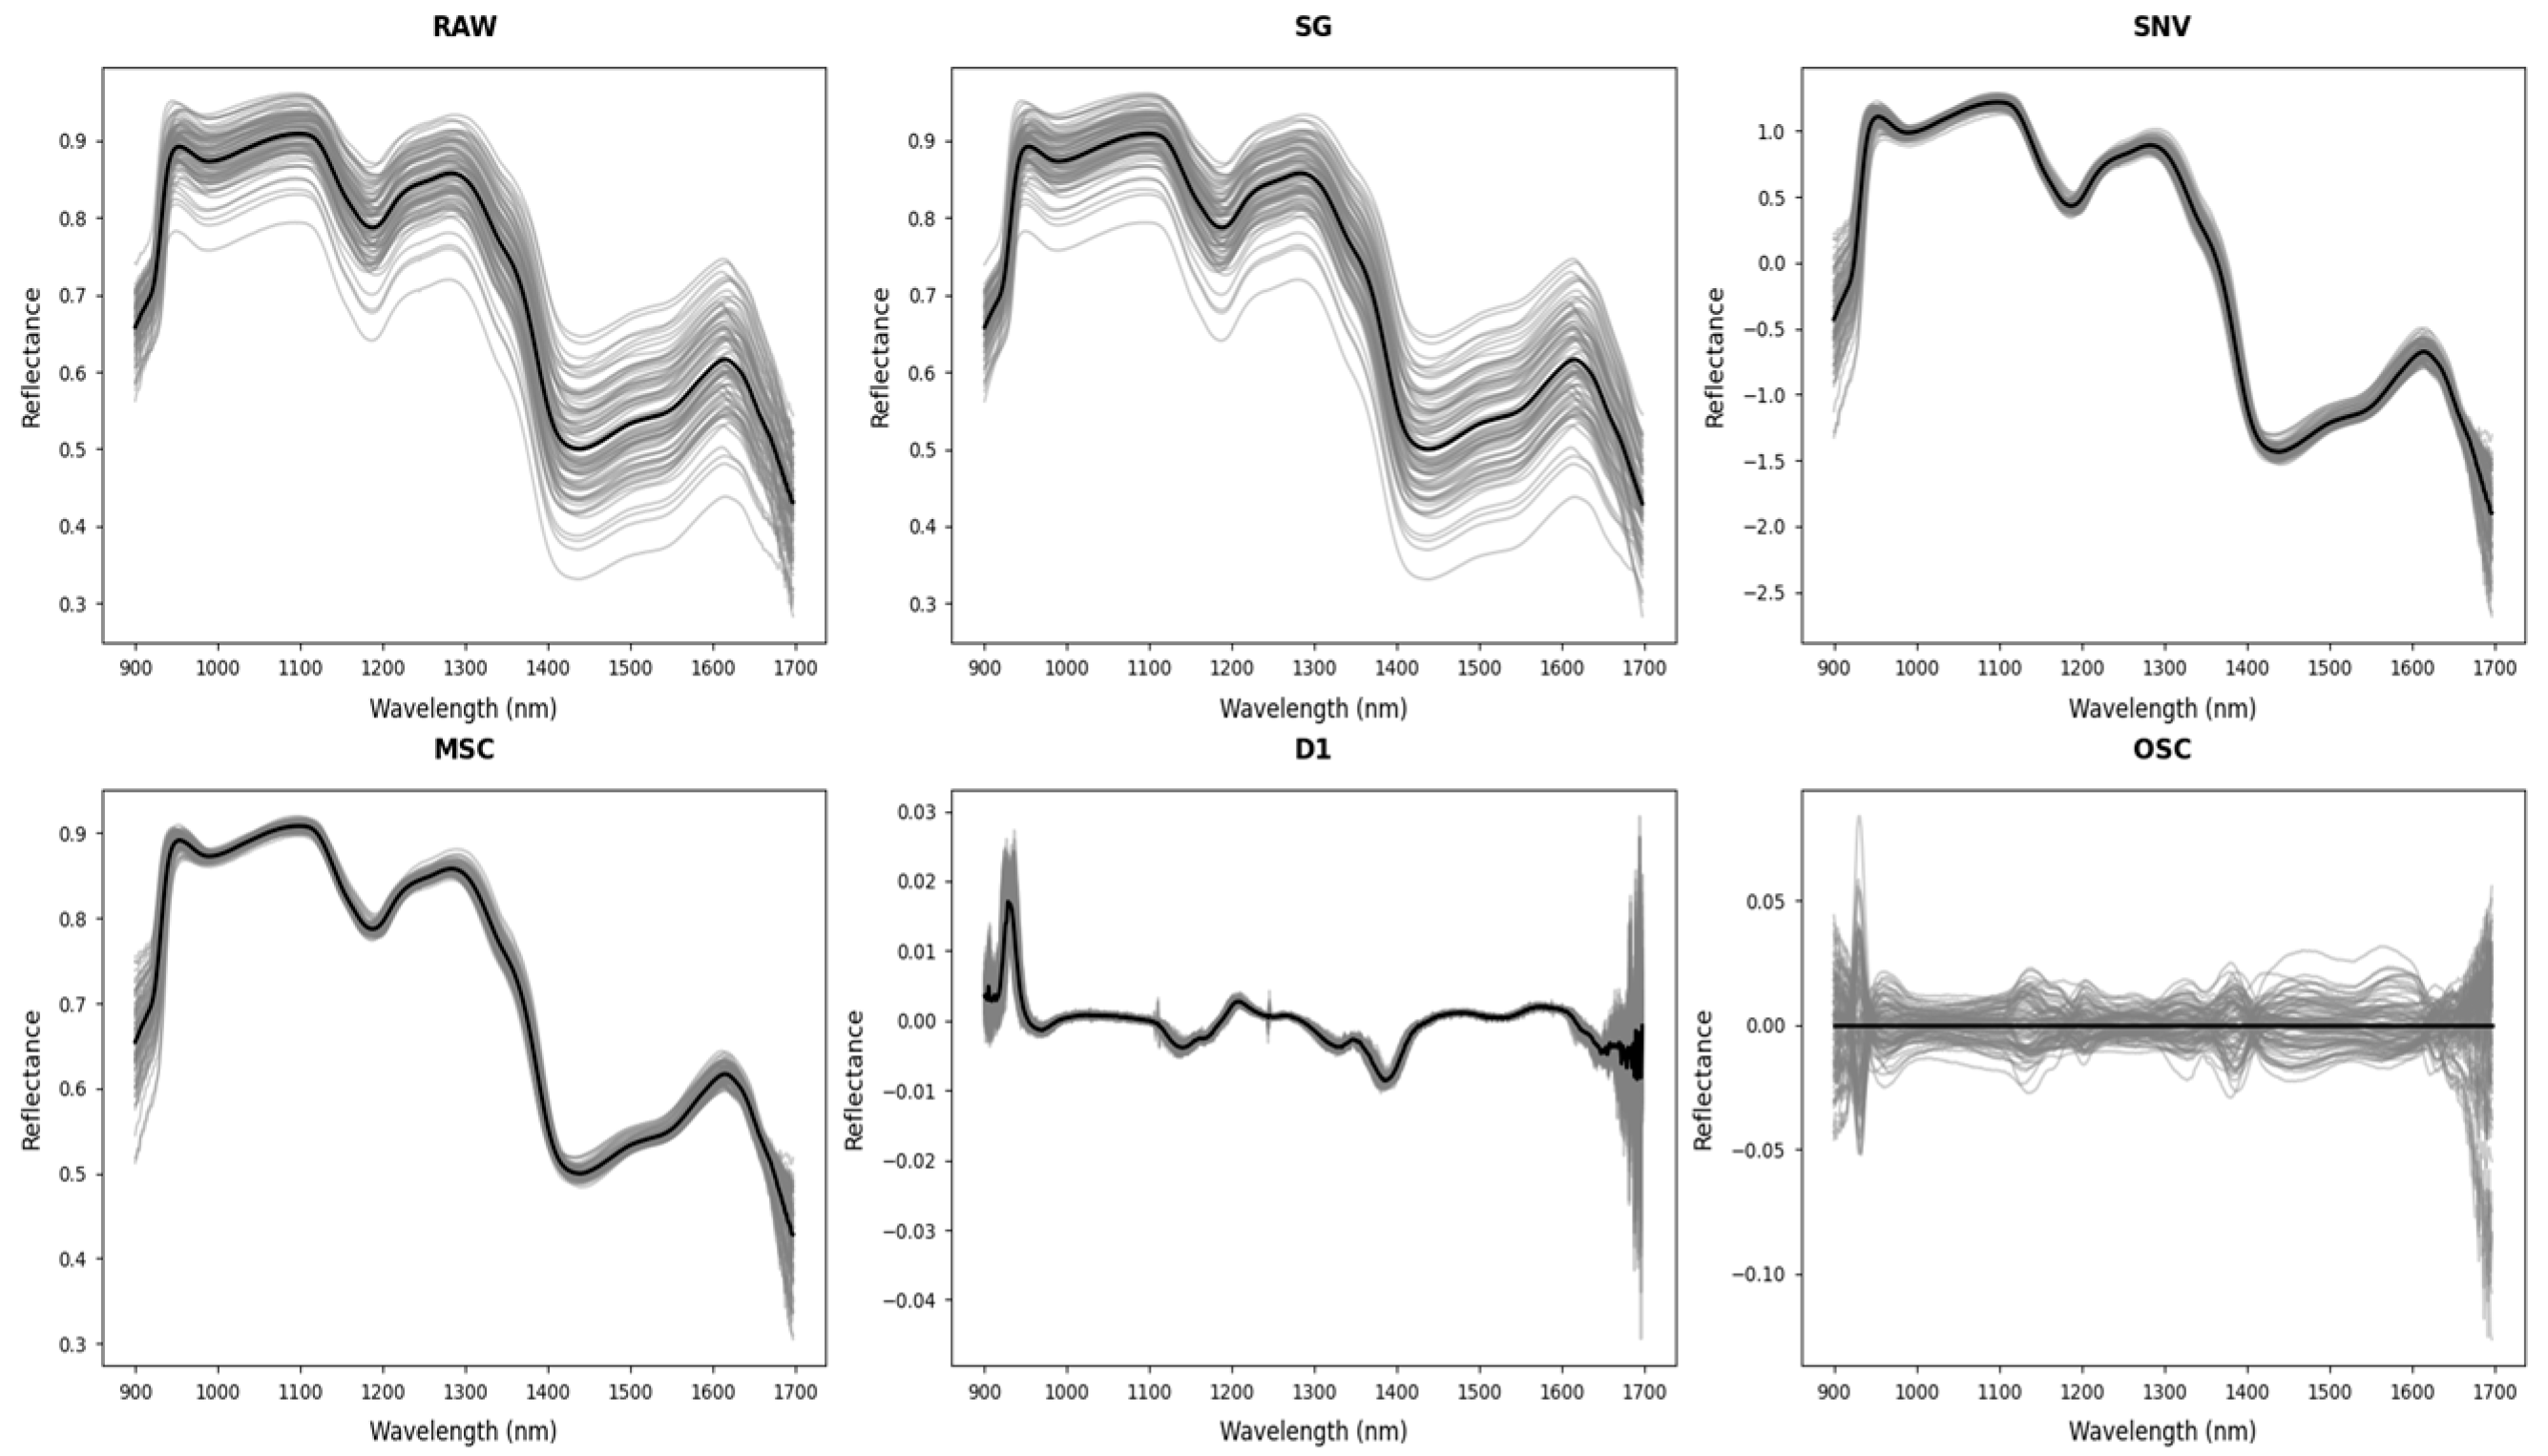
To capture spectral variability from multiple perspectives and enhance information diversity for lipid metabolite prediction, several preprocessing methods were applied to raw reflectance spectra, including Savitzky–Golay (SG) smoothing, standard normal variate (SNV), multiplicative scatter correction (MSC), and first-derivative transformation (D1). SG smoothing (window length = 15 points, equivalent to 22.5 nm at the 1.5 nm sampling interval; polynomial order = 3) reduces high-frequency noise while preserving peak shapes; SNV minimizes scattering effects through mean centering and variance scaling; MSC corrects multiplicative scattering and baseline offsets via regression to a reference spectrum; and D1 (computed by numerical gradient with a spacing of 1.5 nm per point) enhances subtle absorption features while mitigating baseline drift t; and OSC removes spectral variations that are orthogonal to the target variables, effectively filtering out non-informative noise and improving the signal-to-noise ratio for multivariate calibration [16,17]. As shown in Figure 4, these methods yield distinct spectral representations with respect to noise level, baseline behavior, and feature emphasis, providing diverse information for analysis.
Figure 4.
Spectral curves after preprocessing.
In each panel, gray lines denote individual sample spectra, while the black line indicates the mean spectrum across all 82 maize varieties. Subsequently, individual methods were employed as heterogeneous preprocessing strategies to improve lipid metabolite prediction.
2.5. 2T2D-COS with Heterogeneous Preprocessing
2T2D-COS is an advanced extension of conventional 2D-COS proposed by Noda [18]. This framework is particularly effective for enhancing the detection and interpretation of subtle spectral features that may not be evident when using a single spectral trajectory. In conventional 2T2D-COS, both spectral traces are processed identically to maintain consistency. However, different preprocessing methods emphasize distinct features, including scattering, baseline shifts, noise reduction, or weak absorption bands. Motivated by this, this study employs a heterogeneous preprocessing strategy, applying different methods to capture diverse spectral information while preserving 2T2D interpretability.
When the preprocessing strategy is applied to the spectral data, the resulting sample spectrum is denoted as and the corresponding reference spectrum is obtained by averaging all training sample spectra processed with the same strategy. Similarly, applying the preprocessing strategy yields and its reference spectrum . The strategies and may be no preprocessing (RAW), any single preprocessing method introduced in Section 2.3, or any combination of two methods from Section 2.3.
Accordingly, and share the same preprocessing method, as do and . This design ensures internal preprocessing consistency within each spectral trace, while allowing spectral information emphasized by different preprocessing strategies to be integrated within a unified 2T2D analysis.
Based on Noda’s generalized two-dimensional correlation formalism, the synchronous and asynchronous correlation functions between two spectral variables and are calculated as:
where n = 2 denotes the two spectral traces in the 2T2D pair, and the superscript T represents the transpose operation. For the retained 510 wavelength points, the resulting synchronous and asynchronous correlation maps are both 510 × 510 matrices. The N is the Hilbert-Noda transformation matrix defined as:
Here, and correspond to spectral variables (wavelengths) in the NIR region, and denotes the element in the j-th row and k-th column of the transformation matrix.
Using the above formulations, the synchronous correlation matrix and the asynchronous correlation matrix can be calculated. The synchronous correlation spectrum characterizes the degree of covarying intensity changes between spectral signals at different wavelengths. In contrast, the asynchronous correlation spectrum captures relative phase relationships between spectral variables across the two preprocessing representations, thereby revealing complementary covariance patterns that are not directly observable in one-dimensional spectra.
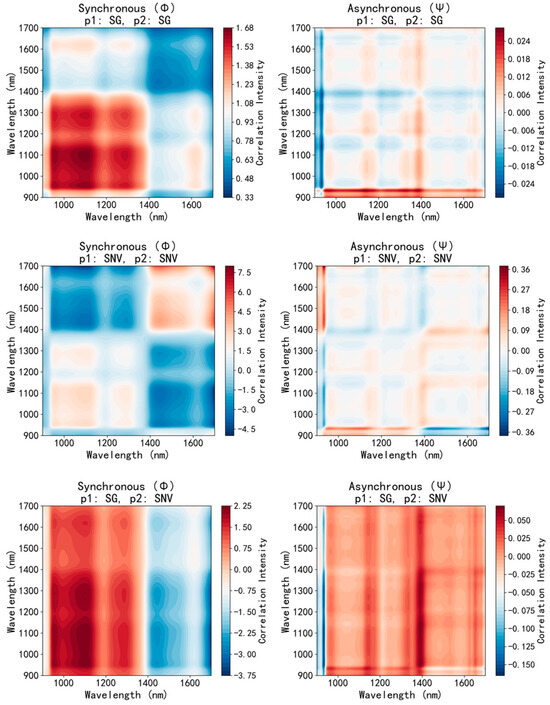
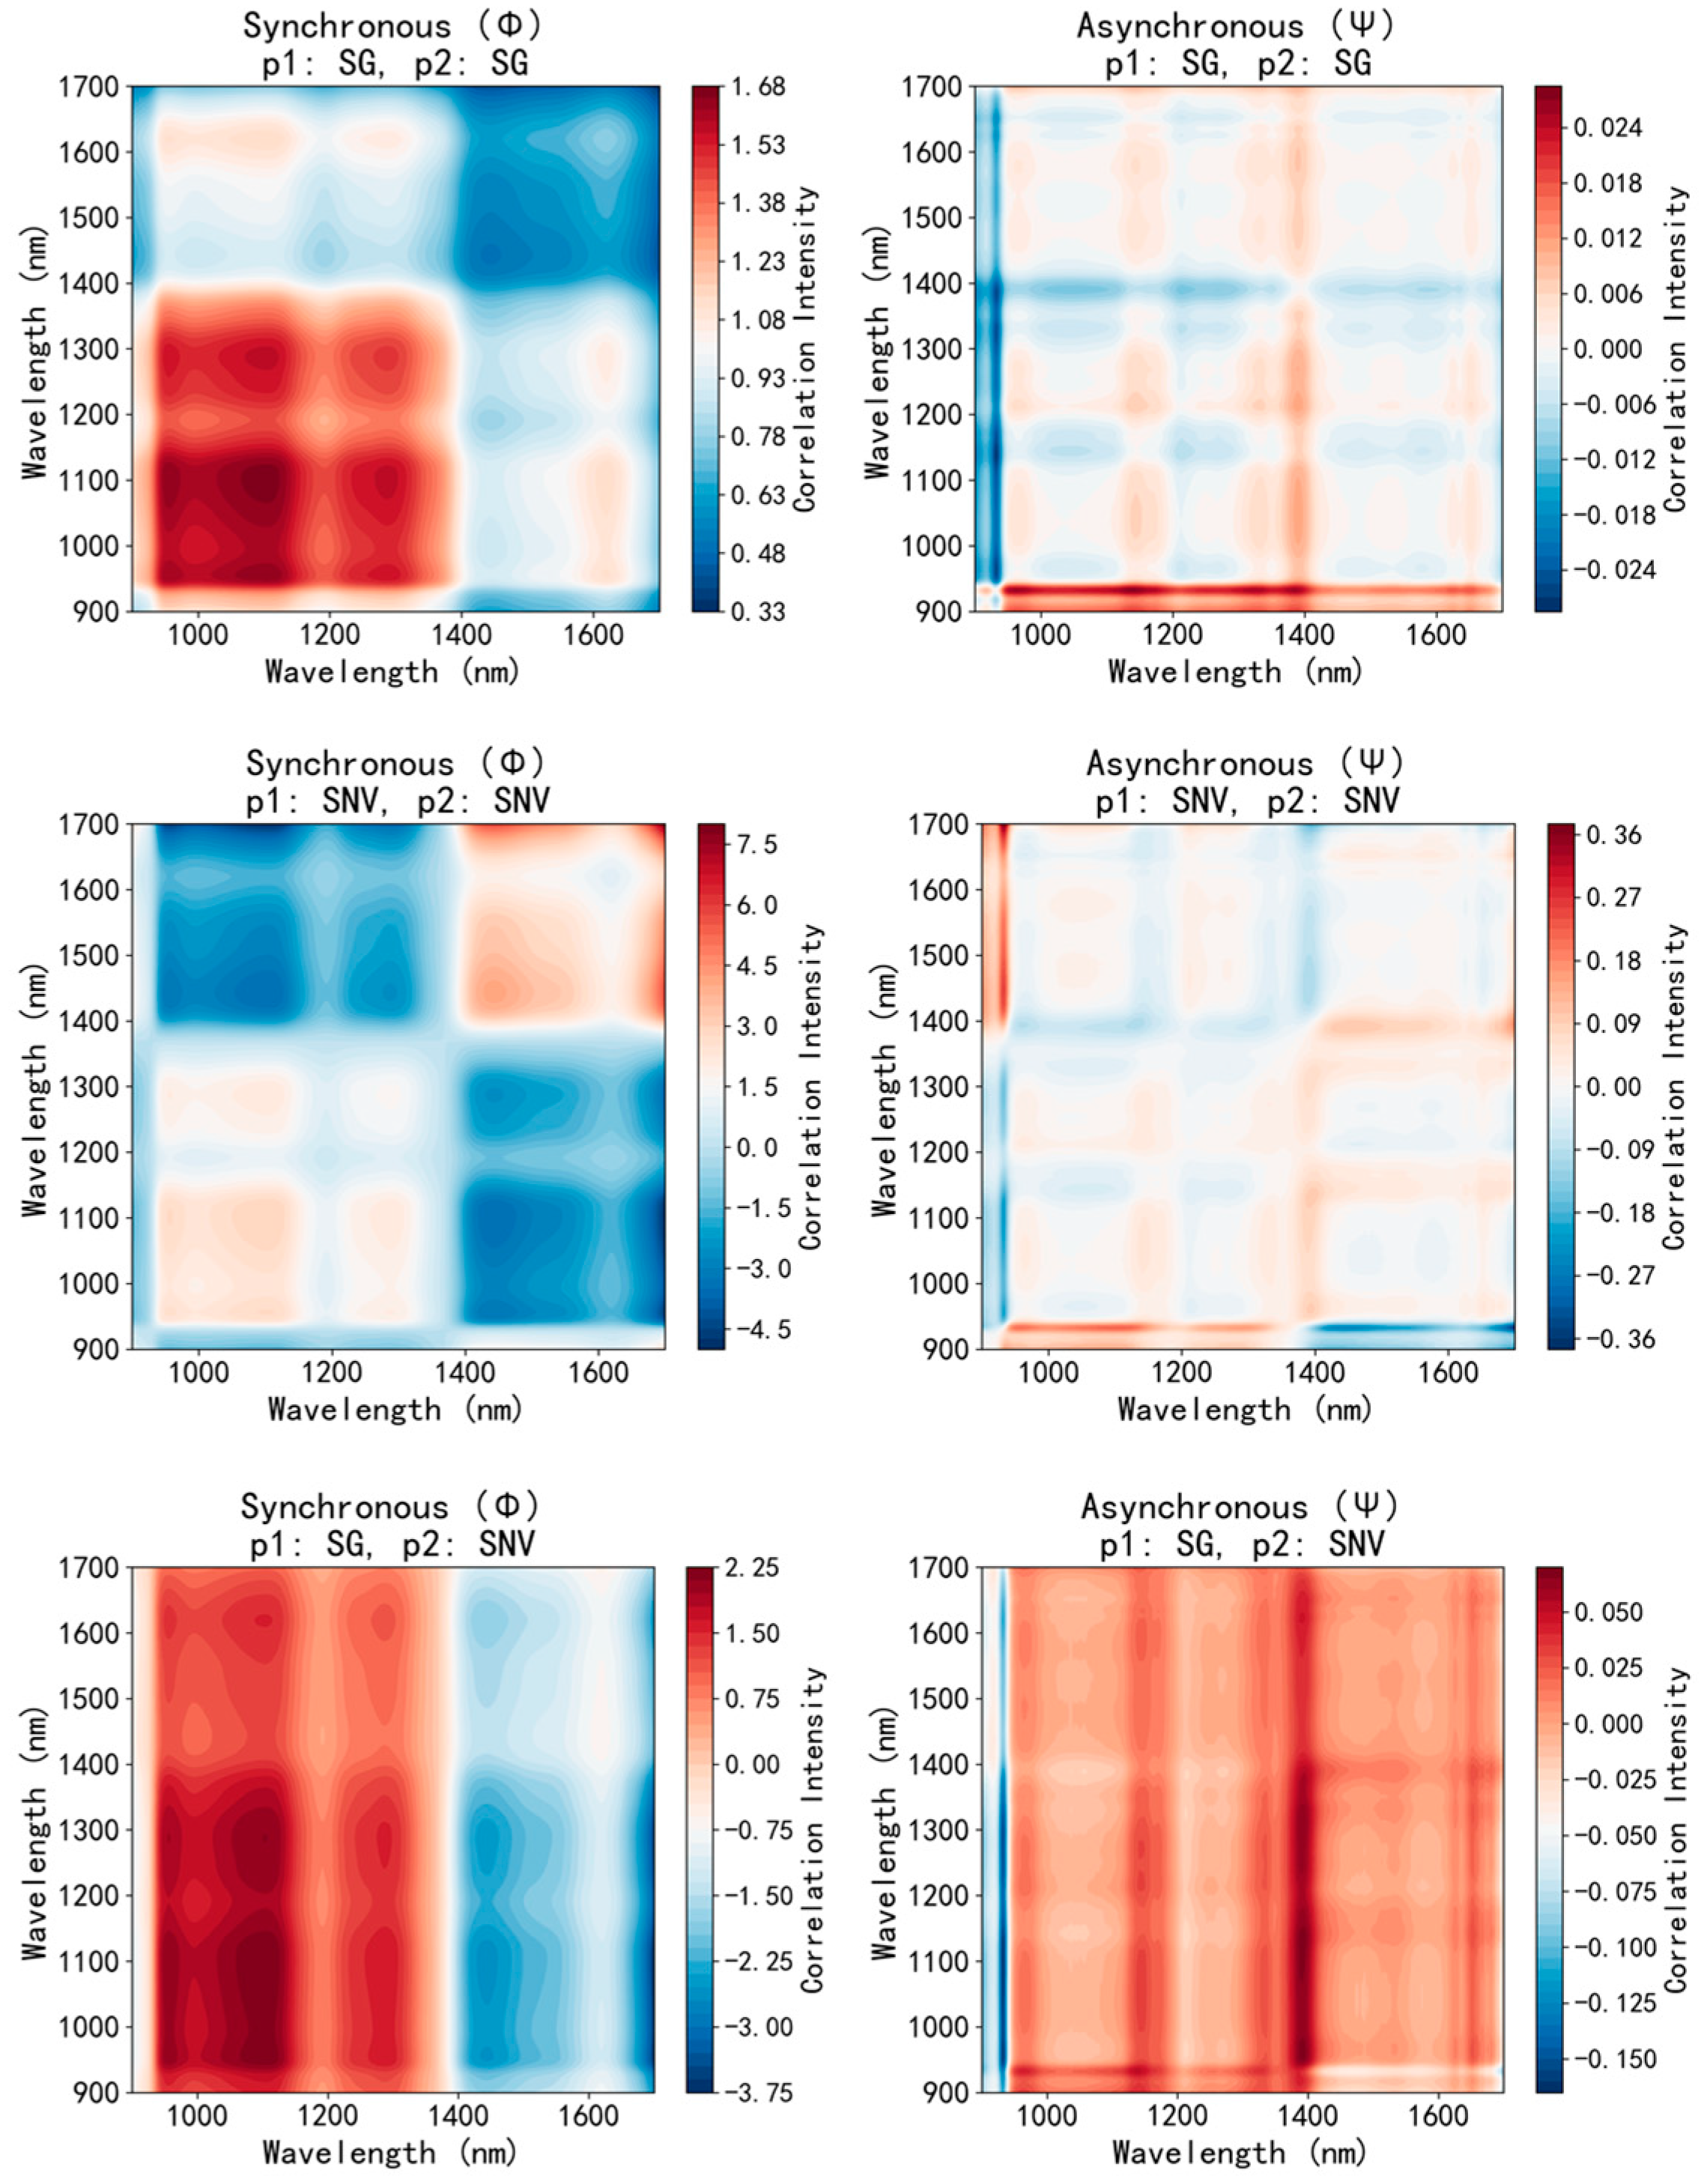
For visualization, the correlation matrices are displayed as 2D correlation maps (Figure 5). Homogeneous preprocessing produces primarily diagonal-symmetric, localized patterns, whereas heterogeneous preprocessing generates non-diagonal-symmetric maps with enhanced cross-spectral information and more global correlation structures.
Figure 5.
Visualization of 2T2D-COS.
2.6. Convolutional Autoencoder
Traditional dimensionality reduction methods, such as principal component analysis (PCA), have been widely adopted for hyperspectral analysis because of their simplicity and computational efficiency. However, PCA performs linear projections that primarily preserve global variance and may not adequately capture the nonlinear spectral relationships and complex local structures associated with biochemical variations in hyperspectral data [19]. To overcome these limitations, deep learning–based feature extraction methods, particularly convolutional autoencoders (CAEs), have been increasingly applied to learn compact and informative nonlinear feature representations.
In this study, PCA was applied as a baseline dimensionality reduction method. The number of principal components was selected by grid search over {5, 10, 15, 20} within the inner loop of 5 × 5 nested cross-validation (random seed = 123), optimizing outer-loop validation R2 for each metabolite. The selected component count therefore varied across metabolites and folds; the CAE latent dimension (20) was not constrained to match the PCA dimension.
An autoencoder (AE) is an unsupervised learning model consisting of an encoder and a decoder. By minimizing reconstruction error between input and output, AEs reduce data dimensionality while preserving essential information, enabling feature extraction, denoising, and compression [20]. A CAE improves upon traditional AEs by replacing fully connected layers with convolutional layers, making it well-suited for two-dimensional or multidimensional data such as images, 2D-COS, or time-frequency spectrograms [21]. The encoder compresses feature maps through convolution and downsampling, capturing high-level features, while the decoder gradually restores the spatial dimensions using transposed convolutions or upsampling to reconstruct the input [22].
Raw reflectance spectra covered 900–1700 nm at 1.56 nm intervals, yielding 512 wavelength points. The two rightmost edge points were excluded due to elevated noise, retaining 510 wavelength points. No interpolation or resampling was applied. For each sample, synchronous and asynchronous 2T2D correlation maps were computed using the global mean spectrum as reference, each of size 510 × 510. Both maps were z-score normalized per sample and per channel, then stacked as two channels to form the CAE input tensor of shape 510 × 510 × 2.
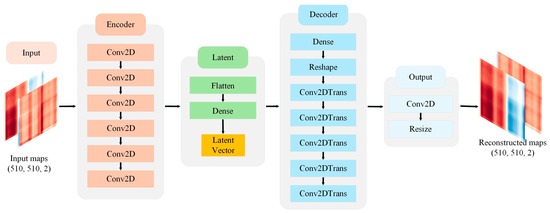
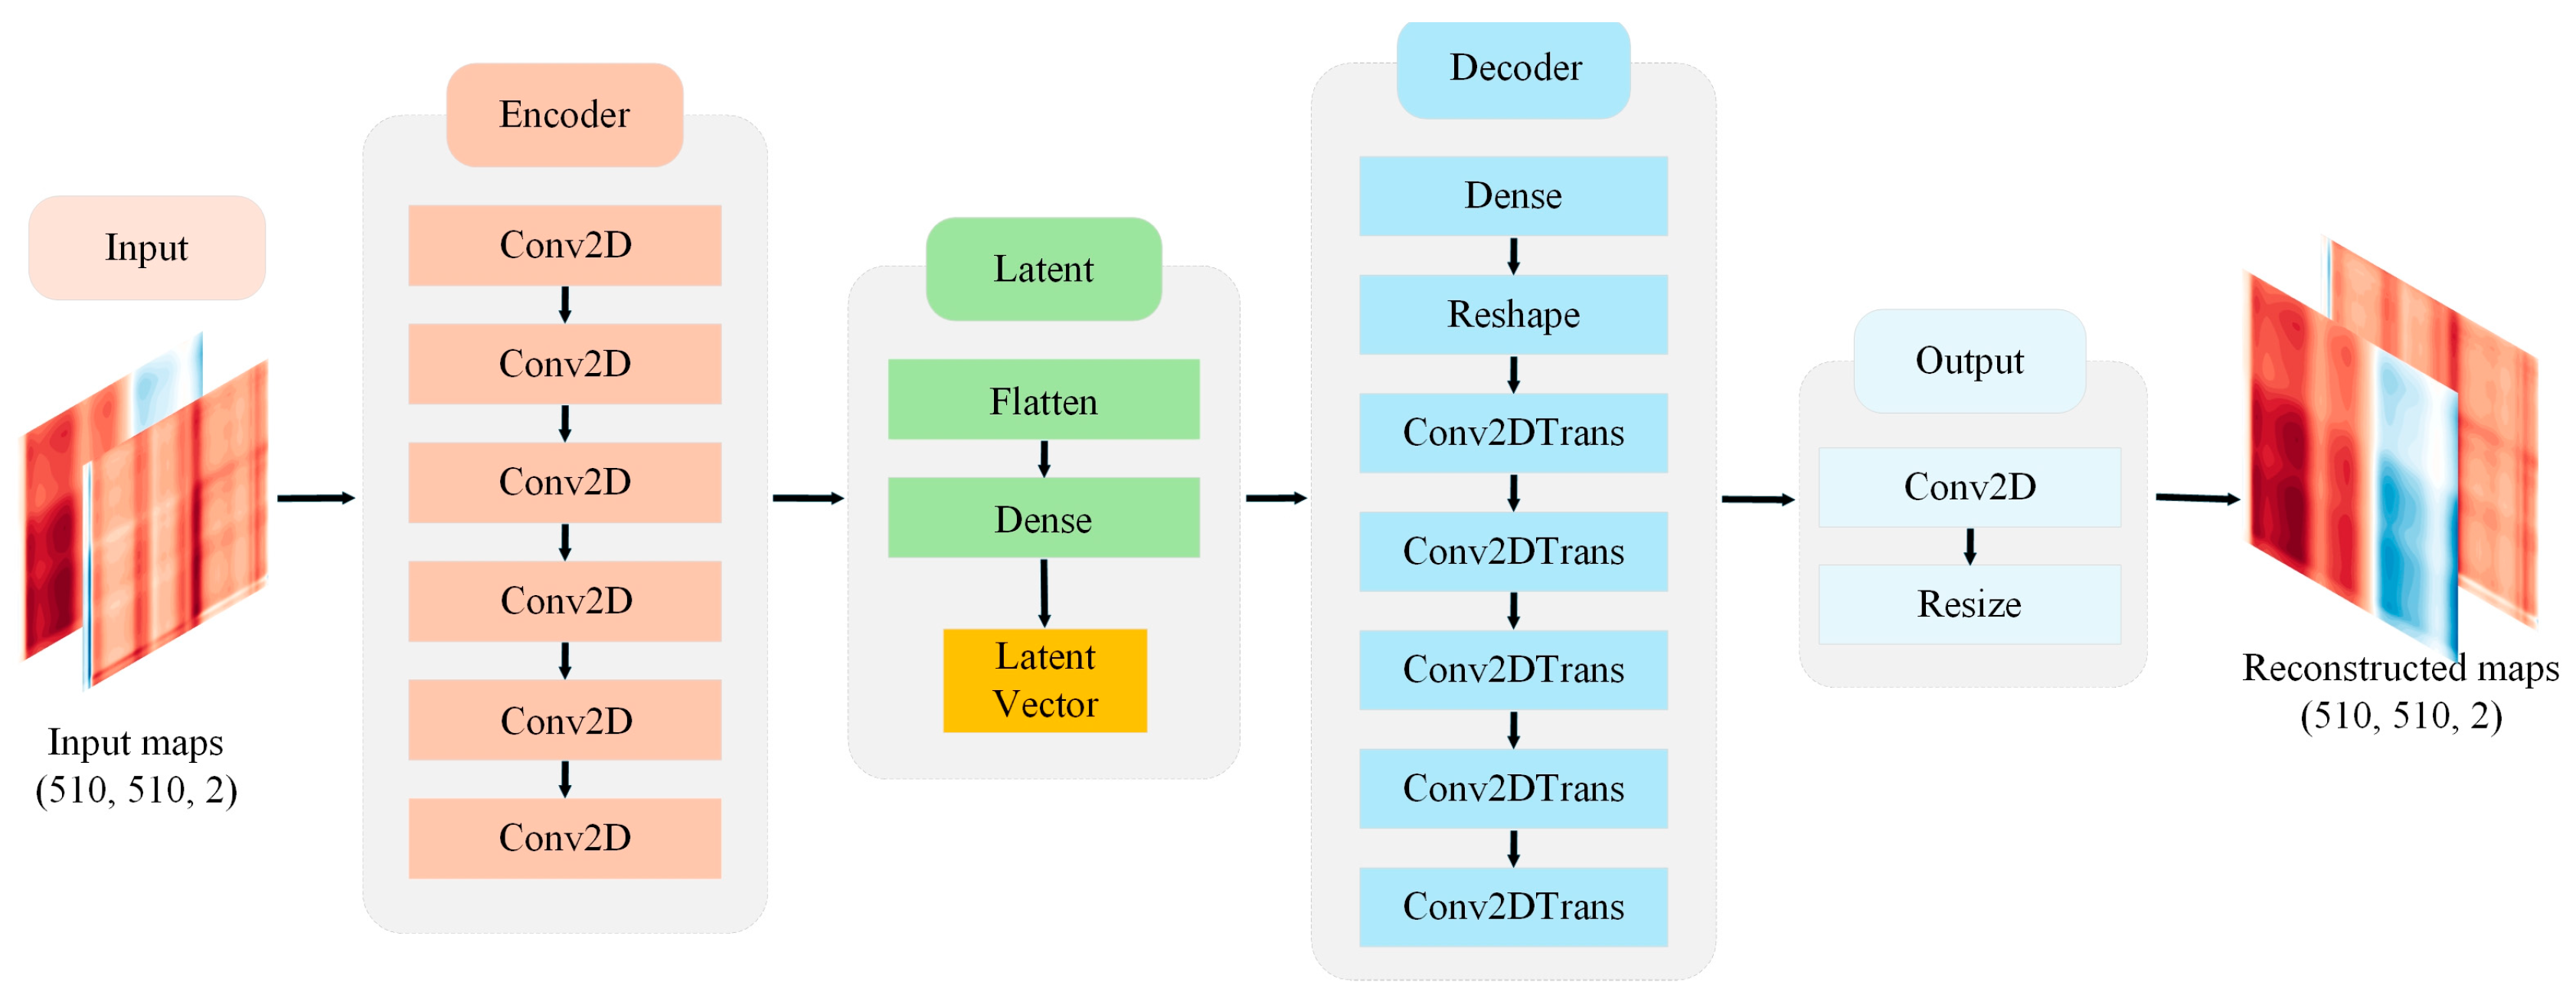
The structure of the convolutional autoencoder (2D-CAE) used in this study is shown in Figure 6. The encoder begins with a 1 × 1 convolutional layer, followed by five 3 × 3 convolutional layers with a stride of 2, enabling progressive spatial downsampling and channel expansion to generate a high-dimensional feature tensor (16 × 16 × 256). All layers use the SELU activation function to improve training stability and nonlinear representation. The feature tensor is then flattened and mapped to a low-dimensional latent vector via a fully connected layer, providing a compact representation of the input 2T2D correlation map for subsequent regression tasks.
Figure 6.
Architecture of the convolutional autoencoder (CAE).
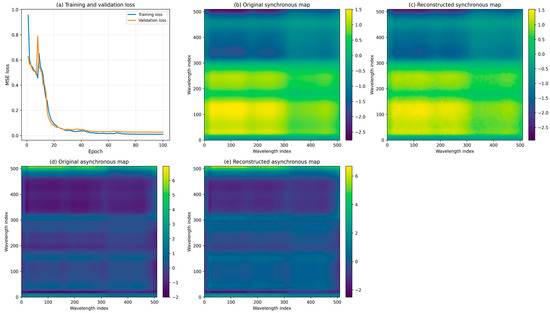
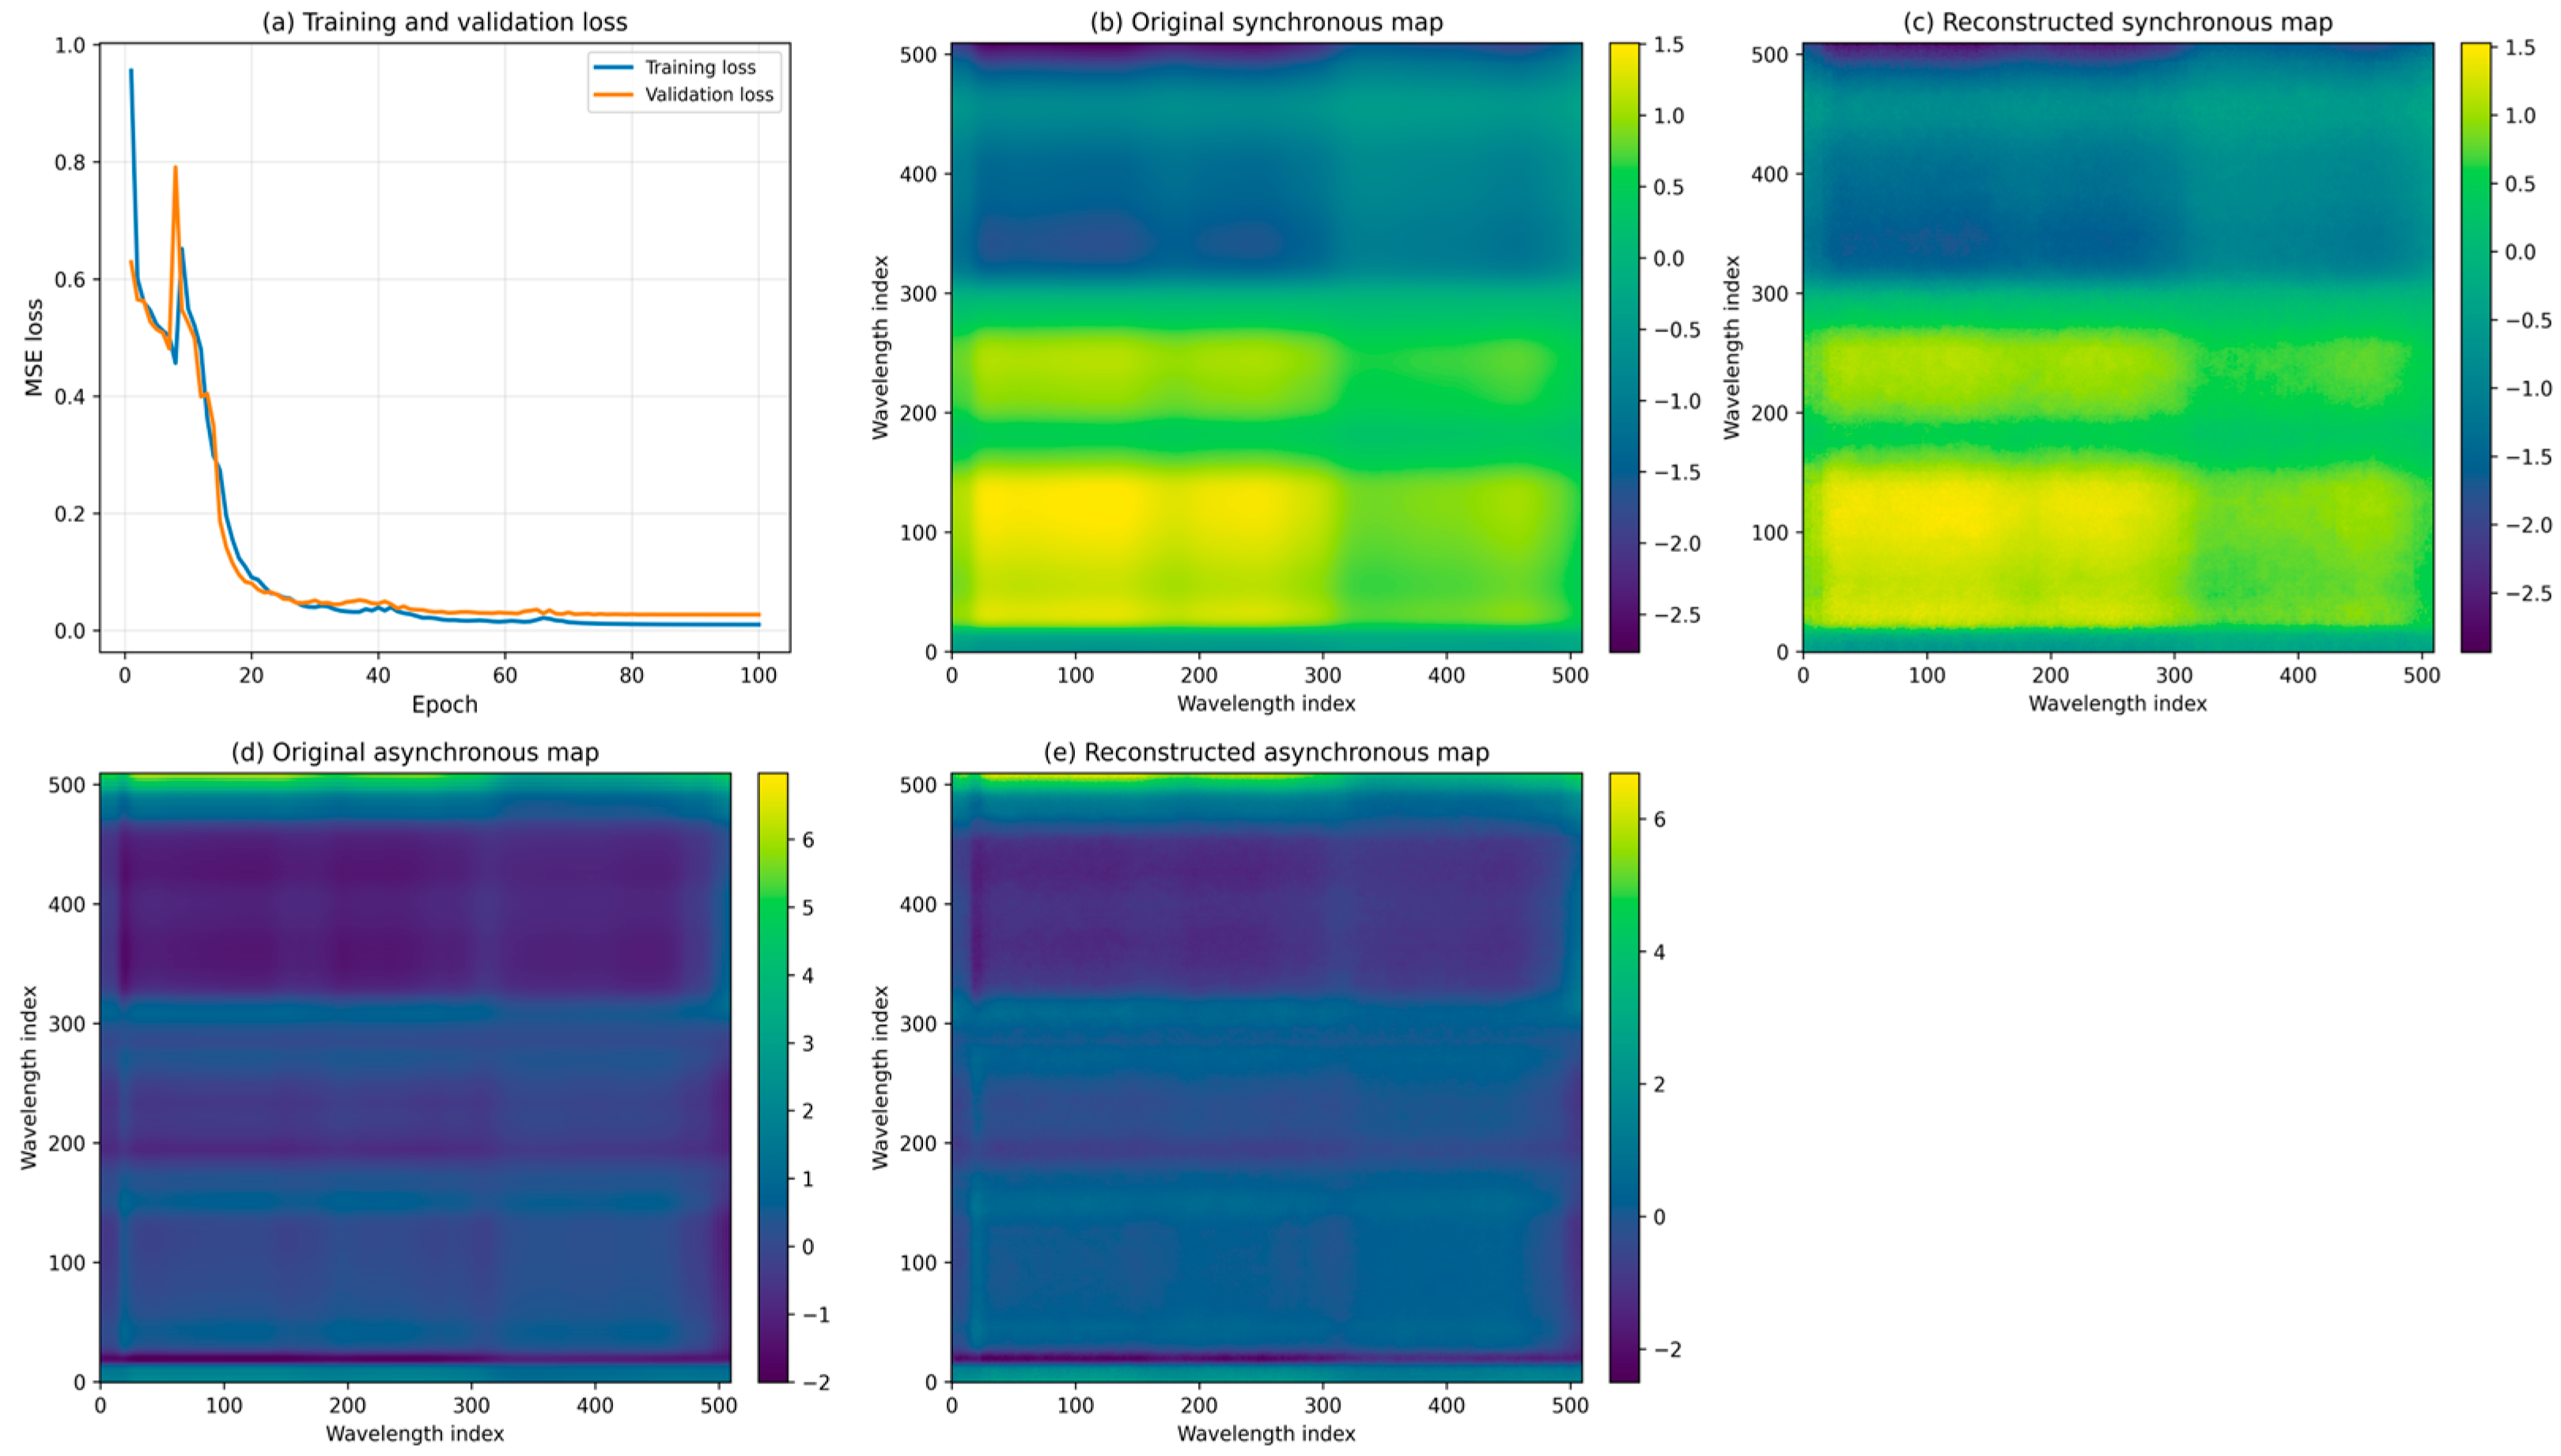
The decoder mirrors the encoder structure. The latent vector is first projected back to a 16 × 16 × 256 tensor via a fully connected layer and a reshaping operation, followed by five transposed convolutional layers for progressive upsampling and channel reduction. A final 1 × 1 convolution and resizing operation ensures that the reconstructed output matches the original input dimensions. A complete layer-by-layer specification of the CAE architecture, including input/output dimensions, kernel sizes, strides, padding, filters, and activation functions, is provided in Supplementary Table S3. During training, model parameters were optimized using the Adam optimizer (learning rate = 1 × 10⁻³) with a mean squared error (MSE) loss function, a batch size of 8, and a maximum of 200 epochs. Early stopping was applied (monitor = validation MSE, patience = 10, restore_best_weights = True); the selected epoch was the one minimizing validation loss. Learning rate was reduced by a factor of 0.5 if validation loss did not improve for 5 consecutive epochs. Weight initialization followed Keras defaults (Glorot Uniform); no regularization or dropout was applied. Total trainable parameters: 4,351,814. Random seed was fixed at 123. All experiments were conducted in a Python 3.10.10 environment, with model implementation based on TensorFlow 2.18.0 and its Keras API. Data preprocessing and auxiliary analyses were performed using standard Python libraries, including NumPy, Scikit-learn, and Matplotlib. Training/validation loss curves and example reconstructed maps are provided in Figure 7.
Figure 7.
Training/validation loss curves and example reconstructed maps.
2.7. Regression Modeling and Performance Evaluation
Random forest (RF) was used for quantitative modeling. By building multiple decision trees from bootstrap samples and averaging their predictions, RF reduces variance and enhances generalization. Its robustness to noise and capacity to capture nonlinear relationships make it well-suited for complex, high-dimensional spectral data [23]. The RF hyperparameters were tuned via GridSearchCV within the same inner loop over n_estimators ∈ {300, 500} and max_depth ∈ {None, 5, 10}; remaining parameters used scikit-learn defaults (bootstrap = True, max_features = 1/3, min_samples_split = 2, min_samples_leaf = 1). The random seed was fixed at 123. A separate RF model was trained for each of the six metabolites. To comprehensively assess the generalization performance of the proposed framework, three additional regression algorithms—Gradient Boosting (GB), Support Vector Regression (SVR), and Partial Least Squares Regression (PLSR)—were implemented as benchmark models under the same nested cross-validation strategy, enabling a consistent comparison of predictive performance across different regression methods.
To ensure an unbiased evaluation, model performance was assessed using a 5-fold outer cross-validation at the variety level (n = 82). Specifically, the 82 varieties were randomly partitioned into five folds, containing 16, 16, 16, 17, and 17 varieties, respectively. In each iteration, four folds were used as the training set, while the remaining fold served as the independent test set.
To avoid information leakage, all processing steps, including spectral preprocessing, reference spectrum generation, feature learning, and model optimization, were performed within the training dataset. Moreover, sub-ROIs derived from the same maize kernel were not allowed to appear in both training and test sets simultaneously. The independent test set was kept fully isolated throughout the workflow for unbiased performance assessment. Crucially, group 5-fold cross-validation was used in the inner loop with maize variety identity as the grouping variable, ensuring that all sub-ROI spectra from the same variety remained in the same inner fold. GridSearchCV was employed for hyperparameter optimization and robustness assessment.
To comprehensively assess the predictive performance and robustness of the regression models, multiple complementary evaluation metrics were calculated for the calibration, cross-validation, and independent prediction stages. For model calibration, the coefficient of determination (RC2) and root mean square error of calibration (RMSEC) were calculated. Cross-validation performance was evaluated using the coefficient of determination (RCV2) and root mean square error of cross-validation (RMSECV). For the independent prediction set, the coefficient of determination (RP2), root mean square error of prediction (RMSEP), bias, mean absolute error (MAE), residual predictive deviation (RPD), and ratio of performance to interquartile range (RPIQ) were calculated. These metrics jointly characterize the goodness of fit, prediction error, systematic bias, and predictive discrimination of the regression models.
3. Results
3.1. Analysis of Metabolite Relative Abundance and Benchmark Model
To characterize the response variable distributions, the minimum, maximum, mean, and standard deviation of each lipid metabolite were calculated after base-10 logarithmic transformation across all samples, with results summarized in Table 1.
Table 1.
Descriptive statistics of six lipid metabolites in log space based on 82 maize samples.
To establish a conventional spectral modeling benchmark, the original one-dimensional (1D) spectra were subjected to six preprocessing strategies, including RAW, SG, SNV, MSC, D1, and OSC. The preprocessed spectra were subsequently reduced using principal component analysis (PCA) and modeled with partial least squares regression (PLSR) to predict lipid metabolites. For each metabolite, the preprocessing strategy yielding the best predictive performance was selected as the representative 1D-PCA-PLSR benchmark, and the corresponding results are summarized in Table 2. The complete prediction results obtained from all six preprocessing strategies are provided in Supplementary Table S4. The prediction outcomes were highly metabolite-dependent, with N-Acylethanolamine (18:1) demonstrating the strongest linear correlation (RP2 = 0.753). Furthermore, SNV and MSC were identified as the most effective preprocessing techniques for mitigating scattering effects in this dataset. However, the modest RPD and RPIQ metrics across most metabolites imply that the current linear models are better suited for qualitative screening rather than fine-grained quantification.
Table 2.
Predictive performance of Optimal preprocessing based on 1D-PCA-PLSR.
3.2. Prediction Performance of 1D and 2T2D Spectral Representations
To evaluate the feasibility of 2T2D-COS for predicting maize lipid metabolites, one-dimensional (1D) spectral data and two-dimensional (2D) 2T2D-COS data were compared under the same preprocessing strategies and modeling framework. For each preprocessing strategy, the corresponding 1D and 2T2D-COS data were independently evaluated using four regression algorithms, including random forest (RF), support vector regression (SVR), gradient boosting (GB), and partial least squares regression (PLSR). The optimal model for each metabolite and spectral representation was determined based on predictive performance. The resulting optimal prediction performances of the 1D and 2T2D-COS approaches are summarized in Table 3, while the detailed results obtained from different preprocessing strategies and regression models are provided in the Supplementary Material.
Table 3.
Predictive performance of Optimal models based on 1D-PCA and 2T2D-PCA features.
As shown in Table 3, the optimal 1D-PCA models showed moderate prediction performance across the six lipid metabolites, with RP values ranging from 0.660 to 0.757 and RPD values ranging from 1.332 to 1.538. Among the six metabolites, Propionic acid exhibited the highest RP (0.757 ± 0.021) and RPD (1.538 ± 0.072), whereas N-Acylethanolamine (18:0) showed the highest RP2 (0.765 ± 0.022) but a relatively low RPD (1.332 ± 0.076). The optimal 1D-PCA models varied among the metabolites, including GB, SVR, and RF, with SVR selected for four metabolites.
In comparison, the optimal homogeneous 2T2D-PCA models generally achieved improved prediction performance relative to their corresponding 1D-PCA models. Across the six metabolites, RP values increased from 0.660–0.757 for 1D-PCA to 0.695–0.790 for homogeneous 2T2D-PCA, while RPD values increased from 1.332–1.538 to 1.417–1.652. The improvements were observed consistently across all six metabolites. For example, the RP of 9-Octadecynoic acid (stearolic acid) increased from 0.660 ± 0.024 to 0.695 ± 0.021, accompanied by an increase in RPD from 1.377 ± 0.085 to 1.501 ± 0.082. Similarly, for N-Acylethanolamine (18:0), RP increased from 0.875 ± 0.013 to 0.897 ± 0.011, while RPD increased from 1.332 ± 0.076 to 1.485 ± 0.071.
3.3. Prediction Results Under Different Spectral Preprocessing Strategies
To investigate the influence of spectral preprocessing on the 2T2D-COS-based prediction framework, both homogeneous and heterogeneous preprocessing strategies were evaluated. In the homogeneous strategy, the same preprocessing method was applied to the two input spectra used to construct the 2T2D-COS representation, whereas different preprocessing methods were combined in the heterogeneous strategy. The prediction performances obtained under homogeneous preprocessing are summarized in Table 3, and the best prediction results obtained under heterogeneous preprocessing are presented in Table 4. The complete results for all preprocessing combinations and regression models are provided in Table S5.
Table 4.
Best 2T2D-PCA prediction results under heterogeneous preprocessing.
As shown in Table 4, the optimal heterogeneous preprocessing strategy varied among the six lipid metabolites. SG-MSC yielded the best performance for 9-Octadecynoic acid (stearolic acid), with an RP of 0.766 ± 0.016 and an RPD of 1.748 ± 0.077. For Pinolenic acid (Δ5,9,12 18:3) and Propionic acid, the optimal strategy was RAW-SNV, with RPD values of 1.552 ± 0.067 and 1.767 ± 0.067, respectively. RAW-SG provided the best performance for N-Acylethanolamine (16:0), yielding an RPD of 1.500 ± 0.052. For N-Acylethanolamine (18:0) and N-Acylethanolamine (18:1), SG-SNV produced the highest prediction performance, with RPD values of 1.637 ± 0.066 and 1.739 ± 0.063, respectively.
Compared with the optimal homogeneous 2T2D-PCA models shown in Table 3, heterogeneous preprocessing consistently improved prediction performance for all six lipid metabolites. The RP values increased from 0.695–0.790 under homogeneous preprocessing to 0.738–0.824 under heterogeneous preprocessing, corresponding to relative improvements of approximately 2.5–10.2%. The RPD values similarly increased from 1.417–1.652 to 1.500–1.767, with relative improvements ranging from approximately 5.9% to 16.5%. The largest improvement in RPD was observed for 9-Octadecynoic acid, for which RPD increased from 1.501 ± 0.082 under homogeneous preprocessing to 1.748 ± 0.077 under heterogeneous preprocessing. N-Acylethanolamine (18:0) also showed a notable improvement, with RPD increasing from 1.485 ± 0.071 to 1.637 ± 0.066.
The optimal heterogeneous preprocessing combinations mainly involved either raw or SG-smoothed spectra combined with scatter-correction or related preprocessing methods, including SG-MSC, RAW-SNV, RAW-SG, and SG-SNV.
3.4. Learning Capability of the CAE for Heterogeneous 2T2D Spectral Features
To evaluate the capability of the CAE to learn informative representations from heterogeneous 2T2D spectral features, CAE-derived latent features were further used for downstream prediction of the six lipid metabolites. For each metabolite, the optimal combination of heterogeneous preprocessing strategy and regression model was selected from the evaluated alternatives based on predictive performance. The resulting best prediction performance for each metabolite is summarized in Table 5, while the complete results obtained from different preprocessing strategies and regression models are provided in Table S5.
Table 5.
Optimal prediction performance for the six lipid metabolites.
As shown in Table 5, the optimal heterogeneous preprocessing strategy varied among the six lipid metabolites. SG-MSC was selected for 9-Octadecynoic acid (stearolic acid), Pinolenic acid (Δ5,9,12 18:3), N-Acylethanolamine (16:0), and N-Acylethanolamine (18:0), whereas SG-SNV was selected for N-Acylethanolamine (18:1) and Propionic acid. The optimal regression model also varied among the metabolites, with GB selected for 9-Octadecynoic acid (stearolic acid) and RF selected for the remaining five metabolites.
Among the six metabolites, N-Acylethanolamine (18:0) showed the highest correlation-based prediction performance, with an RP of 0.942 ± 0.010 and an RP2 of 0.887 ± 0.018. The lowest RMSEP was obtained for Pinolenic acid (0.241 ± 0.011), whereas the highest RPD was observed for N-Acylethanolamine (18:1) (2.069 ± 0.066). Propionic acid exhibited the highest RPIQ (1.941 ± 0.052). Overall, the optimal CAE-based models yielded RP values ranging from 0.793 to 0.942, RP2 values from 0.629 to 0.887, RMSEP values from 0.241 to 0.565, RPD values from 1.656 to 2.069, and RPIQ values from 1.333 to 1.941.
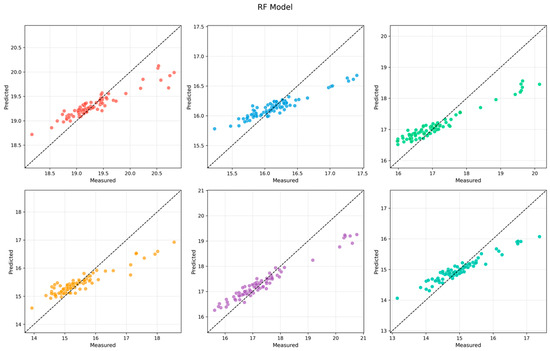
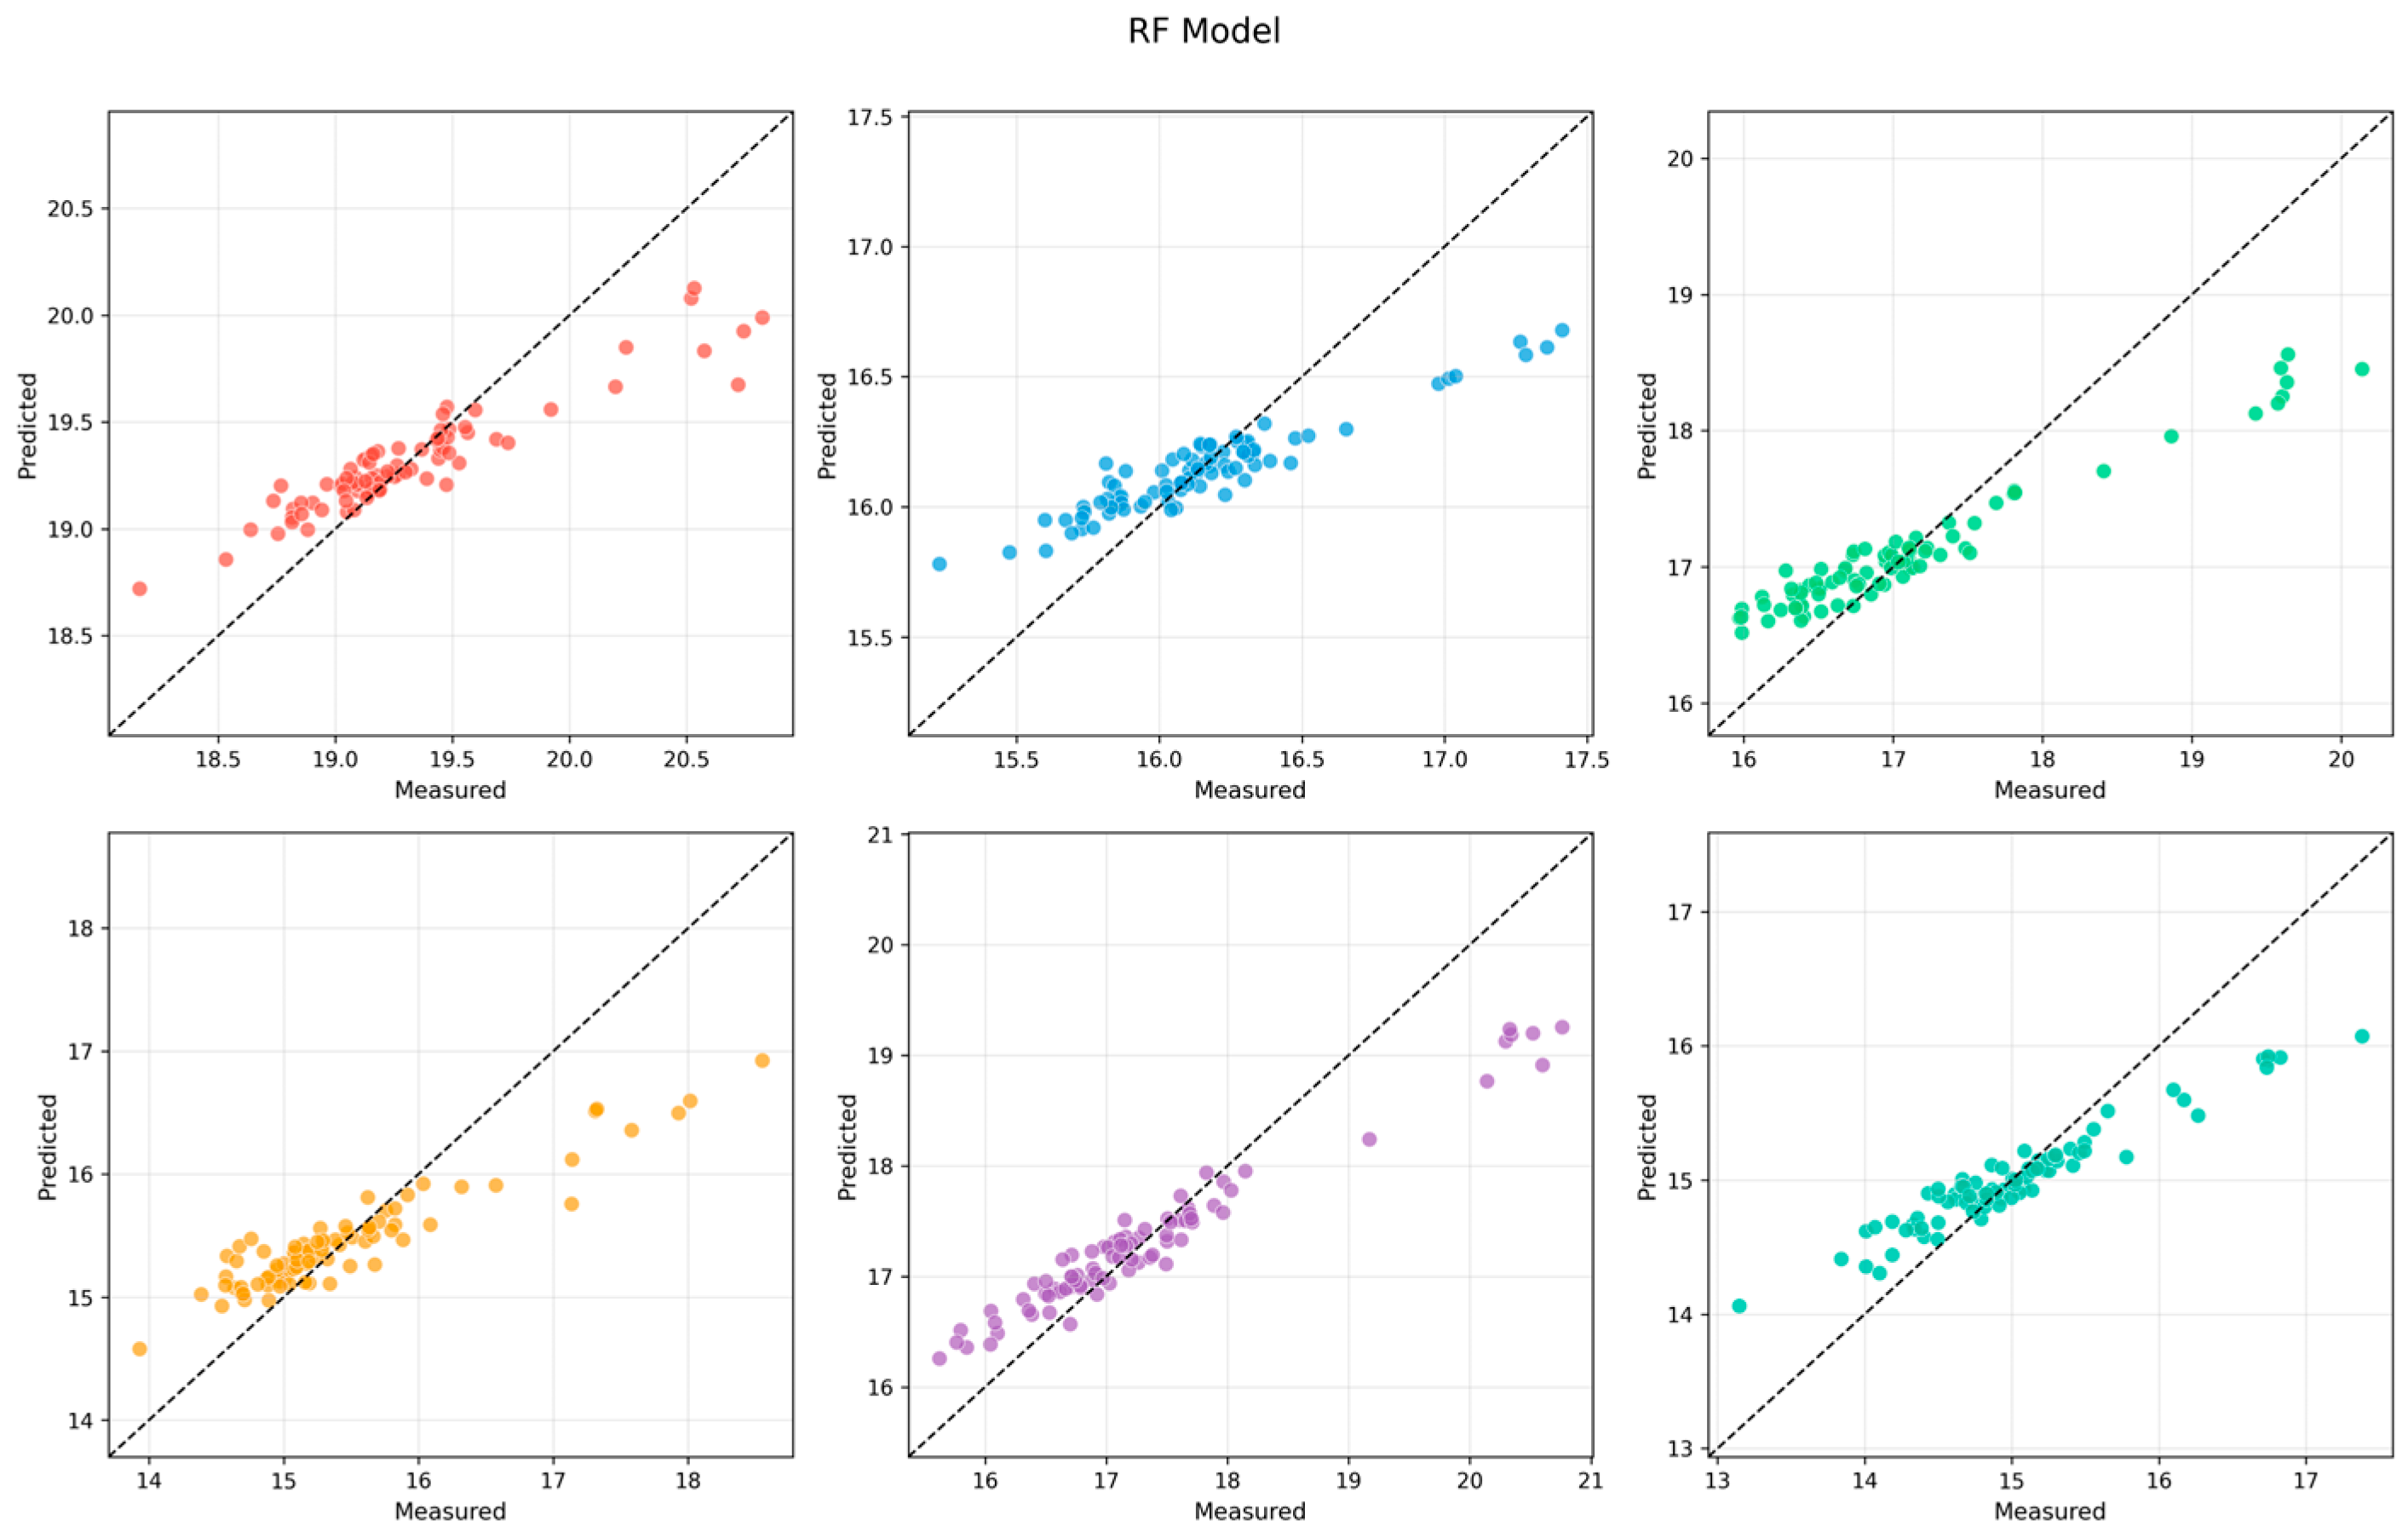
Measured-versus-predicted scatter plots were generated for all six target metabolites. The RF results are presented in the main text (Figure 8), while the corresponding results for SVR, GB, and PLSR are provided in the Supplementary Materials (Figures S1–S3). Given the relatively large number of trainable parameters in the CAE, additional robustness analyses were conducted. The selected CAE model was repeatedly trained using different random seeds under the same experimental settings, and the resulting prediction performance was summarized using boxplots (Supplementary Materials Figure S4). The relatively small variation in model performance across different random seeds indicates that the proposed CAE-based framework is reasonably stable and is not strongly dependent on a specific random initialization.
Figure 8.
Measured-versus-predicted scatter plots for the six target metabolites based on the RF model.
4. Discussion
4.1. Discussion of Metabolite Relative Abundance Measurements
As shown in Table 1, the logarithmic transformation effectively reduced the relative abundance range while preserving the variability of the six lipid metabolites. The resulting distributions exhibited moderate dispersion, which is beneficial for improving model stability and reducing the influence of extreme relative abundance values during hyperspectral quantitative modeling. These statistical characteristics provide a suitable basis for subsequent model development and performance evaluation.
4.2. Feasibility of 2T2D for Lipid Metabolite Prediction
As shown in Table 3, the relatively favorable prediction performance observed for N-Acylethanolamine (18:0), N-Acylethanolamine (18:1), and Propionic acid may be related to differences in their chemical structures, abundance variability, and the extent to which metabolite-associated information is reflected in the NIR spectral response. Lipid-related molecules contain abundant aliphatic –CH2– and –CH3 moieties, whose C–H vibrational overtones and combination bands contribute to absorption features within the NIR region. These structural characteristics may provide indirect spectral information related to lipid composition [24]. However, the prediction of individual metabolites should not be interpreted as direct detection of metabolite-specific absorption bands, because the observed spectral responses may also reflect indirect associations with lipid-related structures and contributions from other coexisting kernel constituents.
In addition, differences in metabolite variability may affect the apparent prediction performance. For example, N-Acylethanolamine (18:1) exhibited the largest standard deviation among the six metabolites (SD = 1.127), providing a relatively broad response range for model calibration, whereas 9-Octadecynoic acid (stearolic acid) showed a lower variability (SD = 0.494) but still exhibited a consistent improvement after conversion to the 2T2D representation.
The advantage of 2T2D-COS can be attributed to its ability to characterize correlation patterns among spectral variables. Whereas one-dimensional spectra primarily represent spectral intensity as a function of wavelength, 2T2D-COS incorporates synchronous and asynchronous relationships between spectral responses, providing a correlation-based representation of spectral variation. Such representations may help reveal coordinated changes among spectral regions associated with lipid-related molecular structures, including the C–H-related responses of aliphatic –CH2– and –CH3 groups. This may be particularly useful when metabolite-related information is distributed across multiple wavelength regions or partially overlapped with signals from other constituents [25]. Nevertheless, the varying magnitude of improvement among metabolites indicates that the effectiveness of 2T2D-COS depends on both the availability of metabolite-related spectral information and its distinguishability from background and overlapping spectral responses.
Despite the consistent improvement over 1D-PCA, the RPD values of the homogeneous 2T2D-PCA models remained within the range of 1.417–1.652, indicating that the resulting models provided moderate predictive capability but were not yet sufficient for highly accurate quantitative determination. This suggests that 2T2D-COS alone cannot fully exploit the complex spectral information associated with lipid metabolite variation. Further improvement therefore requires optimization of the spectral representations used for 2T2D-COS construction. In the following section, heterogeneous preprocessing is investigated to determine whether applying different preprocessing strategies to the two spectral traces can provide more complementary spectral information and further improve prediction performance.
4.3. Influence of Different Spectral Preprocessing on 2T2D Construction
The results in Table 3 and Table 4 demonstrate that spectral preprocessing substantially influenced the predictive performance of the 2T2D-COS models. Under homogeneous preprocessing, the optimal configurations varied among metabolites, whereas heterogeneous preprocessing further expanded the available combinations and consistently improved prediction performance. Across the complete preprocessing results, scatter-correction methods such as SNV and MSC frequently contributed to the optimal configurations, while derivative-based preprocessing was less frequently selected as the best strategy. Although derivative transformations can enhance subtle spectral variations in one-dimensional NIR analysis, their amplification of high-frequency noise and alteration of spectral continuity may be less favorable for constructing stable two-dimensional correlation patterns.
Compared with homogeneous preprocessing, heterogeneous preprocessing allows different spectral transformations to be applied to the two input traces before 2T2D-COS construction. As shown in Table 4, the optimal heterogeneous configurations included SG-MSC, RAW-SNV, RAW-SG, and SG-SNV. Notably, three of these four configurations combined either raw or SG-smoothed spectra with a scatter-corrected spectrum, whereas RAW-SG was optimal for N-Acylethanolamine (16:0). This pattern suggests that retaining complementary characteristics between the two input traces may be beneficial for constructing informative correlation representations. Raw or SG-smoothed spectra preserve relatively broad spectral intensity and structural information, while SNV or MSC can reduce scattering-related effects and emphasize relative spectral variation. Combining these different representations may therefore generate correlation patterns that contain complementary information compared with applying the same preprocessing operation to both traces.
The improvement observed under heterogeneous preprocessing was consistent across all six metabolites. Relative to the optimal homogeneous 2T2D-PCA models, RP increased from 0.695–0.790 to 0.738–0.824, while RPD increased from 1.417–1.652 to 1.500–1.767. The largest improvement in RPD was observed for 9-Octadecynoic acid (stearolic acid), increasing from 1.501 ± 0.082 to 1.748 ± 0.077. N-Acylethanolamine (18:0) also showed an improvement in RPD from 1.485 ± 0.071 to 1.637 ± 0.066. These results indicate that the benefit of heterogeneous preprocessing was not restricted to a particular metabolite, but the magnitude of improvement varied according to the spectral characteristics of each target.
The metabolite-dependent selection of preprocessing combinations further suggests that no single preprocessing strategy was universally optimal for all lipid metabolites. For example, SG-MSC was selected for 9-Octadecynoic acid (stearolic acid), RAW-SNV was optimal for Pinolenic acid (Δ5,9,12 18:3) and Propionic acid, RAW-SG was optimal for N-Acylethanolamine (16:0), and SG-SNV was selected for both N-Acylethanolamine (18:0) and N-Acylethanolamine (18:1). This variation may reflect differences in the strength, distribution, and background interference of metabolite-associated spectral information. Heterogeneous preprocessing therefore provides greater flexibility than homogeneous preprocessing by allowing complementary spectral characteristics to be incorporated into the two-dimensional correlation analysis.
Nevertheless, the improvements obtained through heterogeneous preprocessing remained moderate, and the resulting RPD values were still below 2.0 for most metabolites. This indicates that preprocessing primarily improves the representation and quality of the spectral inputs but does not explicitly learn the complex nonlinear relationships between 2T2D-COS patterns and metabolite abundance. Therefore, further feature learning is required to extract higher-level latent representations from the heterogeneous 2T2D-COS maps. In the following section, a convolutional autoencoder (CAE) was introduced to learn nonlinear latent features from these high-dimensional correlation representations.
4.4. Discussion on the Learning Capability of the CAE for Heterogeneous 2T2D Spectral Features
The results presented in Table 5 demonstrate that replacing PCA with a convolutional autoencoder (CAE) improved the prediction performance of the six lipid metabolites when heterogeneous 2T2D-COS features were used. The optimal CAE-based models achieved RP values ranging from 0.793 to 0.942 and RPD values from 1.656 to 2.069, with the highest RP and RP2 obtained for N-Acylethanolamine (18:0) (RP = 0.942 ± 0.010; RP2 = 0.887 ± 0.018). These results indicate that nonlinear feature learning can provide a more informative representation of heterogeneous 2T2D-COS features than conventional PCA-based dimensionality reduction. Although heterogeneous preprocessing enriches the spectral information available for modeling, the resulting two-dimensional correlation spectra remain highly dimensional and contain substantial redundant information and complex feature interactions, making effective feature extraction a critical step for subsequent regression modeling [26]. In addition, the combination of high-dimensional spectral features and a relatively limited number of samples increases the risk of overfitting and the curse of dimensionality, further emphasizing the importance of appropriate feature learning and dimensionality reduction [27].
Compared with PCA, which projects data onto orthogonal components by maximizing global variance, CAE can learn nonlinear and hierarchical feature representations directly from heterogeneous 2T2D-COS maps. The convolutional architecture can exploit local spatial structures and correlation patterns embedded in two-dimensional spectral representations, thereby facilitating the extraction of informative features that may not be fully preserved by linear projections. Consequently, subtle spectral variations and cooperative inter-band relationships introduced by heterogeneous preprocessing can be represented more effectively in the latent feature space. This observation is consistent with previous studies indicating that conventional linear dimensionality reduction methods may be insufficient to fully characterize nonlinear structural information in complex hyperspectral datasets [28].
Notably, the CAE-based models achieved RPD values above 2.0 for 9-Octadecynoic acid (stearolic acid), N-Acylethanolamine (18:1), and Propionic acid, with values of 2.031 ± 0.068, 2.069 ± 0.066, and 2.012 ± 0.063, respectively. In contrast, Pinolenic acid (Δ5,9,12 18:3) and N-Acylethanolamine (16:0) showed relatively lower RPD values of 1.656 ± 0.060 and 1.669 ± 0.051, respectively. This variation suggests that the effectiveness of deep feature learning remains dependent on the spectral distinguishability and inherent variability of individual metabolites. Nevertheless, the consistently improved representation obtained using CAE indicates that nonlinear feature extraction can help exploit subtle spectral information that is difficult to capture using PCA alone.
In addition, heterogeneous preprocessing and CAE appear to play complementary roles in the proposed framework. Heterogeneous preprocessing introduces diverse spectral representations before 2T2D-COS construction, allowing different aspects of spectral variation to be retained in the correlation maps. CAE subsequently integrates these complex two-dimensional patterns into compact latent representations, thereby reducing redundancy while retaining informative nonlinear structures. The combination therefore provides a more flexible representation of the spectral information than using PCA-based features alone.
The improvement achieved by CAE was particularly evident for metabolites that exhibited relatively poor prediction performance in the PCA-based models, including Pinolenic acid (Δ5,9,12 18:3), N-Acylethanolamine (16:0), and N-Acylethanolamine (18:0). These metabolites are characterized by relatively weak spectral specificity or substantial spectral overlap, making them more difficult to discriminate using linear features alone. The hierarchical feature learning capability of CAE appears to enhance subtle spectral characteristics associated with these metabolites, thereby improving their predictive performance and reducing the performance gap among different lipid classes.
Overall, these findings demonstrate that CAE provides an effective nonlinear feature-learning strategy for heterogeneous 2T2D-COS data. Rather than simply increasing the dimensionality of the spectral representation, CAE facilitates the extraction of compact latent features from complex inter-band correlation patterns, thereby improving the subsequent prediction of lipid metabolites. The results support the integration of heterogeneous preprocessing, 2T2D-COS, and nonlinear deep feature learning as a feasible framework for enhancing hyperspectral-based prediction of maize lipid metabolites.
It should be noted that the UHPLC-Orbitrap-MS analysis used in this study provides relative rather than absolute quantification. This distinction has implications for the analytical application. Predicting relative metabolite signals implies that the current HSI models cannot be directly applied to scenarios requiring strict regulatory thresholds, which would necessitate absolute quantification via standard calibration curves. However, for the proposed applications—such as rapid sorting and high-throughput screening in breeding (e.g., monitoring the relative increase or decrease of specific metabolites across different samples)—relative quantification is highly effective and sufficient.
In addition, the present study was conducted under controlled conditions using samples from a single harvest and location, and model evaluation was performed using the same 82 maize varieties. Although nested cross-validation with variety-level data splitting was used to reduce potential optimism in performance estimates, internal cross-validation cannot fully establish model generalizability to independent populations. Therefore, the reported performance should be interpreted within the investigated population and experimental conditions rather than as evidence of broad transferability. Future studies should evaluate the framework using independent maize varieties from different environments, harvest years, experimental batches, and instrumental platforms, together with externally validated quantitative metabolomics data.
5. Conclusions
To improve the predictive accuracy of hyperspectral models for maize lipid metabolites, this study proposed an integrated framework combining heterogeneous 2T2D-COS with deep feature learning. The results demonstrate that 2T2D-COS enhances weak spectral features that are difficult to capture in one-dimensional spectra, leading to improved prediction accuracy and stability across multiple lipid metabolites. By applying different preprocessing methods to the same original spectra, heterogeneous 2T2D representations effectively exploit diverse spectral information and outperform homogeneous preprocessing strategies. Furthermore, CAE exhibits superior capability in compressing high-dimensional heterogeneous spectral features while preserving discriminative information, consistently outperforming PCA in capturing complex spectral structures and improving predictive performance.
Overall, this framework offers an effective solution for hyperspectral-based prediction of lipid metabolites. Future efforts will focus on validating its robustness across larger, multi-environmental datasets and extending the methodology to diverse crops and metabolite types. From a food science perspective, integrating metabolomics-guided target selection with hyperspectral imaging holds significant promise for the rapid, reagent-free assessment of lipid quality in cereal grains, facilitating high-throughput screening in breeding and cost-effective quality control in food processing chains.
Supplementary Materials
The following supporting information can be downloaded at: https://www.mdpi.com/article/10.3390/analytica7030065/s1. Table S1. Stability of the internal standard response in the QC samples, Table S2. Detailed identification parameters for the six target metabolites, Table S3. A complete layer-by-layer specification of the CAE architecture, Table S4. Predictive performance of different preprocessing strategies based on the 1D-PCA-PLSR benchmark for six lipid metabolites, Table S5. Predictive performance of four models of the optimal preprocessing strategies for six lipid metabolites, Figure S1. Measured-versus-predicted scatter plots for the six target metabolites based on the GB model, Figure S2. Measured-versus-predicted scatter plots for the six target metabolites based on the SVR model, Figure S3. Measured-versus-predicted scatter plots for the six target metabolites based on the PLSR model, Figure S4. Robustness of the 2T2D-CAE-based prediction performance across ten independent random seeds.
Author Contributions
Conceptualization, X.Z.; methodology, M.L.; software, M.L.; validation, M.H. and Q.Z.; formal analysis, M.L.; investigation, M.L.; resources, M.L.; data curation, X.Z.; writing—original draft preparation, M.L.; writing—review and editing, X.Z. and Q.Z.; visualization, M.L.; supervision, M.H. and Q.Z.; project administration, M.H.; funding acquisition, X.Z. and M.H. All authors have read and agreed to the published version of the manuscript.
Funding
This research was funded by the National Natural Science Foundation of China under Grant Nos. 62273166 and 62205128.
Data Availability Statement
The data and code of this study are available upon request from xinzhao@jiangnan.edu.cn. (The data are not publicly available because they were obtained from a third party under a data use agreement that prohibits redistribution).
Acknowledgments
Thanks to the Maize Research Center of the Jiangsu Academy of Agricultural Sciences for providing the samples for this research.
Conflicts of Interest
The authors declare no conflicts of interest.
References
- Lane, H.M.; Murray, S.C.; Montesinos-López, O.A.; Montesinos-López, A.; Crossa, J.; Rooney, D.K.; Barrero-Farfan, I.D.; De La Fuente, G.N.; Morgan, C.L.S. Phenomic selection and prediction of maize grain yield from near-infrared reflectance spectroscopy of kernels. Plant Phenome J. 2020, 3, e20002. [Google Scholar] [CrossRef] [Scilit]
- Gao, L.; Jiang, H.; Li, M.; Wang, D.; Xiang, H.; Zeng, R.; Chen, L.; Zhang, X.; Zuo, J.; Yang, S.; et al. Genetic and lipidomic analyses reveal the key role of lipid metabolism for cold tolerance in maize. J. Genet. Genom. 2024, 51, 326–337. [Google Scholar] [CrossRef] [Scilit] [PubMed]
- Baker, E.J.; Miles, E.A.; Calder, P.C. A review of the functional effects of pine nut oil, pinolenic acid and its derivative eicosatrienoic acid and their potential health benefits. Prog. Lipid Res. 2021, 82, 101097. [Google Scholar] [CrossRef] [Scilit] [PubMed]
- Mock, E.D.; Gagestein, B.; van der Stelt, M. Anandamide and other N-acylethanolamines: A class of signaling lipids with therapeutic opportunities. Prog. Lipid Res. 2023, 89, 101194. [Google Scholar] [CrossRef] [Scilit] [PubMed]
- Lykhmus, O.; Uspenska, K.; Koval, L.; Lytovchenko, D.; Voytenko, L.; Horid’Ko, T.; Kosiakova, H.; Gula, N.; Komisarenko, S.; Skok, M. N-Stearoylethanolamine protects the brain and improves memory of mice treated with lipopolysaccharide or immunized with the extracellular domain of α7 nicotinic acetylcholine receptor. Int. Immunopharmacol. 2017, 52, 290–296. [Google Scholar] [CrossRef] [Scilit] [PubMed]
- Thabuis, C.; Tissot-Favre, D.; Bezelgues, J.; Martin, J.; Cruz-Hernandez, C.; Dionisi, F.; Destaillats, F. Biological functions and metabolism of oleoylethanolamide. Lipids 2008, 43, 887–894. [Google Scholar] [CrossRef] [Scilit] [PubMed]
- Zhu, Y.; Zhou, J.; Guo, S.; Zhang, Z.; Wang, W.; Zhao, C.; Wang, J.; Zhou, H.; Ren, G. Selection of oat varieties with unique nutritional qualities based on near-infrared spectroscopy and HS-SPME-GC-MS. J. Cereal Sci. 2025, 124, 104217. [Google Scholar] [CrossRef] [Scilit]
- Ran, J.; Dong, G.; Xiao, W.; Yi, F.; Li, L.; Wu, Y. Explainable AI-driven hyperspectral imaging for non-destructive geographical discrimination of small-fruited sea buckthorn: Metabolic correlations and feature optimization. J. Food Compos. Anal. 2026, 151, e108985. [Google Scholar] [CrossRef] [Scilit]
- Xue, H.; Xu, X.; Meng, X. Estimation model for maize multi-components based on hyperspectral data. Sensors 2024, 24, 6111. [Google Scholar] [CrossRef] [Scilit] [PubMed]
- Gama, T.; Farrar, M.B.; Tootoonchy, M.; Wallace, H.M.; Trueman, S.J.; Tahmasbian, I.; Bai, S.H. Hyperspectral imaging predicts free fatty acid levels, peroxide values, and linoleic acid and oleic acid concentrations in tree nut kernels. LWT-Food Sci. Technol. 2024, 199, 116068. [Google Scholar] [CrossRef] [Scilit]
- Shi, T.; Gao, Y.; Song, J.; Ao, M.; Hu, X.; Yang, W.; Chen, W.; Liu, Y.; Feng, H. Using VIS–NIR hyperspectral imaging and deep learning for non-destructive high-throughput quantification and visualization of nutrients in wheat grains. Food Chem. 2024, 461, 140651. [Google Scholar] [CrossRef] [Scilit] [PubMed]
- Noda, I. Two-dimensional correlation analysis of unevenly spaced spectral data. Appl. Spectrosc. 2003, 57, 1049–1054. [Google Scholar] [CrossRef] [Scilit] [PubMed]
- Asmat, B.N.; Bilal, H.S.M.; Irfan Uddin, M.; Karim, F.K.; Mostafa, S.M.; Varela-Aldás, J. Enhancing feature learning of hyperspectral imaging using shallow autoencoder by adding parallel paths encoding. Sci. Rep. 2025, 15, 17363. [Google Scholar] [CrossRef] [Scilit] [PubMed]
- Niu, X.; Shao, L.; Zhao, Z.; Jiao, S.; Li, X.; Dong, F. Optimization of methods for quantitative analysis of unsaturated fatty acid in fresh meat based on NIR. Spectrosc. Spectr. Anal. 2019, 39, 443–447. [Google Scholar] [CrossRef]
- Dreissig, I.; Machill, S.; Salzer, R.; Krafft, C. Quantification of brain lipids by FTIR spectroscopy and partial least squares regression. Spectrochim. Acta Part A 2009, 71, 2069–2075. [Google Scholar] [CrossRef] [Scilit] [PubMed]
- Savitzky, A.; Golay, M.J.E. Smoothing and Differentiation of Data by Simplified Least Squares Procedures. Anal. Chem. 1964, 36, 1627–1639. [Google Scholar] [CrossRef] [Scilit]
- Wu, X.; Wang, J.; Zhao, X.; Wang, S.; Zhang, Y. Optimization of convenient infrared spectroscopy detection methods and infrared-Raman fusion spectroscopic detection for milk powder adulteration. J. Food Compos. Anal. 2025, 148, 108195. [Google Scholar] [CrossRef] [Scilit]
- Noda, I. Closer examination of two-trace two-dimensional (2T2D) correlation spectroscopy. J. Mol. Struct. 2020, 1213, 128194. [Google Scholar] [CrossRef] [Scilit]
- Chaukhande, P.; Luthra, S.K.; Patel, R.N.; Padhi, S.R.; Mankar, P.; Mangal, M.; Ranjan, J.K.; Solanke, A.U.; Mishra, G.P.; Mishra, D.C.; et al. Development and validation of near-infrared reflectance spectroscopy prediction modeling for the rapid estimation of biochemical traits in potato. Foods 2024, 13, 1655. [Google Scholar] [CrossRef] [Scilit] [PubMed]
- Berahmand, K.; Daneshfar, F.; Salehi, E.S.; Li, Y.; Xu, Y. Autoencoders and their applications in machine learning: A survey. Artif. Intell. Rev. 2024, 57, 28. [Google Scholar] [CrossRef] [Scilit]
- Qin, Y.; Li, Z.; Xie, S.; Zhao, H.; Wang, Q. An efficient convolutional denoising autoencoder-based BDS NLOS detection method in urban forest environments. Sensors 2024, 24, 1959. [Google Scholar] [CrossRef] [Scilit] [PubMed]
- Li, P.; Pei, Y.; Li, J. A comprehensive survey on design and application of autoencoder in deep learning. Appl. Soft Comput. 2023, 138, 110176. [Google Scholar] [CrossRef] [Scilit]
- Breiman, L. Random Forests. Mach. Learn. 2001, 45, 5–32. [Google Scholar] [CrossRef] [Scilit]
- Ozaki, Y. Near-infrared spectroscopy—Its versatility in analytical chemistry. Anal. Sci. 2012, 28, 545–563. [Google Scholar] [CrossRef] [Scilit] [PubMed]
- Blanco, M.; Castillo, M.; Peinado, A.; Beneyto, R. Determination of low analyte concentrations by near-infrared spectroscopy: Effect of spectral pretreatments and estimation of multivariate detection limits. Anal. Chim. Acta 2007, 581, 318–323. [Google Scholar] [CrossRef] [Scilit] [PubMed]
- Jeong, S.; Chung, H. Combining two-trace two-dimensional correlation analysis and convolutional autoencoder-based feature extraction from an entire correlation map to enhance vibrational spectroscopic discrimination of geographical origins of agricultural products. Talanta 2025, 285, 127385. [Google Scholar] [CrossRef] [Scilit] [PubMed]
- Ong, P.; Tung, I.-C.; Chiu, C.-F.; Tsai, I.-L.; Shih, H.-C.; Chen, S.; Chuang, Y.-K. Determination of aflatoxin B1 level in rice (Oryza sativa L.) through near-infrared spectroscopy and an improved simulated annealing variable selection method. Food Control 2022, 136, 108886. [Google Scholar] [CrossRef] [Scilit]
- Kramer, M.A. Nonlinear principal component analysis using autoassociative neural networks. AIChE J. 1991, 37, 233–243. [Google Scholar] [CrossRef] [Scilit]

Disclaimer/Publisher’s Note: The statements, opinions and data contained in all publications are solely those of the individual author(s) and contributor(s) and not of MDPI and/or the editor(s). MDPI and/or the editor(s) disclaim responsibility for any injury to people or property resulting from any ideas, methods, instructions or products referred to in the content. |
© 2026 by the authors. Licensee MDPI, Basel, Switzerland. This article is an open access article distributed under the terms and conditions of the Creative Commons Attribution (CC BY) license.