


Abstract
Spectrophotometry offers the advantage of low cost and less time consumption, making it still attractive as a method of analysis, especially when coupled with multivariate calibration models. This enhancement solves the majority of the drawbacks of UV–VIS spectrophotometry, which have to do with the entangled spectra of complex mixtures. In this study, a multivariate model was developed and validated for the determination of perindopril erbumine, amlodipine besylate and indapamide, addressing previously unresolved challenges by systematically covering three fixed-dose combinations with differing component ratios and by achieving accuracy suitable for the assay determination. The experimental plan involved a Taguchi orthogonal array design with three factors at five levels. In order to create multivariate calibration models, principal component regression, partial least squares and concentration residual augmented least squares regression algorithms were tested. Principal component regression combined with a genetic algorithm for feature selection was chosen as the optimal model based on prediction performance estimated by nested cross-validation with cluster-based sample splitting. The developed method was also evaluated for its environmentally friendly potential while the analytical method validation procedure confirmed its applicability for the assay testing of the fixed-dose drug combination.
1. Introduction
UV/VIS spectrophotometric methods offer clear advantages over high-performance liquid chromatography (HPLC) regarding solvent consumption, waste generation, cost, analysis time, and overall environmental sustainability [1]. However, pharmaceutical products are complex mixtures of one or more active pharmaceutical ingredients (APIs), related substances and excipients, making spectral overlap unavoidable. The lack of inherent separation therefore limits the standalone applicability of spectrophotometry and therefore HPLC remains the gold standard in pharmaceutical quality control. Advances in computer science and statistics have significantly expanded the scope of spectrophotometric analysis through chemometric approaches, particularly multivariate calibration (MVC). As emphasized by Wold and Josefson [2], unlike traditional univariate calibration (UVC), MVC uses combinations of absorbance values at multiple wavelengths to reduce interferences and enable direct analysis of complex mixtures without prior separation. Regulatory authorities now recognize the application of such multivariate analytical procedures and outline key considerations for their development. According to ICH Q14 recommendations [3], method development requires careful selection of calibration and validation samples, signal preprocessing techniques, appropriate modeling algorithms and robustness measures to ensure reliable routine performance.
Multivariate calibration models for UV/VIS spectrophotometry can be developed using various algorithms, including classical least squares (CLS), inverse least squares (ILS), partial least squares (PLS) regression, principal component regression (PCR), artificial neural networks (ANNs), support vector machine (SVM) regression, concentration residual augmented least squares regression (CRACLS) [4,5,6], etc. Signal preprocessing can be used to remove signal components not attributable to the analytes of interest, such as instrumental noise, variable optical path, stray light, scattering effects, and other physical effects [4,7]. Common preprocessing methods include mean centering, Savitzky–Golay smoothing [7], wavelet denoising [8], calculation of derivative spectra, orthogonal signal correction (OSC) [9], standard normal variate (SNV), and multiplicative scatter correction (MSC) [10]. However, signal preprocessing should be applied carefully and only to the extent necessary to avoid removing relevant information from the spectra or introducing artifacts [3], and it is not widely used for UV/VIS spectra [11]. Variable selection, which in spectrophotometric methods refers to choosing informative wavelengths, is important because multivariate calibration procedures typically involve a limited number of samples with numerous input variables for model building, resulting in a significant risk of overfitting. Although latent variable approaches such as PLS can perform well with full spectra, studies have shown that predictive ability improves when variable selection is applied [4]. The wavelength range for recording spectra is chosen to include only the region where the mixture absorbs light, exclude noisy regions (e.g., below 230 nm in [12]), and eliminate wavelengths with low absorbance variance if they fall below an empirically defined threshold [13]. More sophisticated variable selection methods are summarized in the literature [4,14]. Another important step, which is often overlooked and frequently performed randomly, is splitting the data into calibration and validation sets. Random splitting does not ensure that the validation set is representative of the input space, which some authors have addressed by using more structured test set selection methods, such as Latin hypercube sampling (LHS) [13]. Nested cross-validation (CV) strategies may also provide a more reliable approach, as they reduce the sensitivity of reported performance metrics to the specific data split. A detailed discussion of their advantages is provided by Cawley and Talbot [15]. There are also specific challenges in the application of multivariate analytical procedures for drug mixtures that are not particularly emphasized in the literature. Drug mixtures analyzed within pharmaceutical quality control may have a fairly high ratio of component amount, which with the low absorbance of a minor component, makes accurate quantification impossible. When choosing the appropriate dilution to reach the concentration where all components have a sufficiently high signal, it is important to avoid excessively high absorbances since this means that the intensity of transmitted light in that case is low, which brings significant measurement uncertainty. The absorption maximum can also be in the range of where many solvents and buffers absorb UV light (e.g., below 210 nm) for some analytes such as perindopril erbumine. Furthermore, the accuracy of the multivariate calibration model may be jeopardized if the spectra of analytes are highly overlapped.
The objective of this study was to evaluate the potential of a chemometrically assisted UV/VIS spectrophotometric method for the simultaneous determination of perindopril erbumine (PER), amlodipine besylate (AML), and indapamide (IND) in fixed-dose combinations, and to evaluate its quantitative performance, ecological acceptability, and sustainability. This drug combination was selected as a representative and challenging model system, characterized by large differences in component concentrations and absorptivities (high-concentration, strongly absorbing AML versus low-concentration, weakly absorbing PER in the low-wavelength region), as well as pronounced spectral overlap. Unlike earlier work on multivariate spectrophotometric analysis of the same drug mixture [16], the present study addresses previously unresolved challenges by systematically covering three fixed-dose combinations with differing component ratios and by achieving accuracy suitable for assay determination. Furthermore, a structured strategy for concentration range selection and calibration/validation (testing) data splitting is proposed, offering an improved framework for multivariate calibration development. The optimal model, based on genetic algorithm (GA) feature selection and PCR, demonstrated the required accuracy on independent test samples, while the method showed substantial advantages in terms of greenness and sustainability. Since the presented approach does not include external validation on independent test samples, predictive performance was additionally assessed for spiked placebo samples. The recovery values obtained were within the acceptable range of 98–102%, indicating satisfactory predictive performance in a realistic matrix. However, future work should focus on the comprehensive method validation, adjustment of sample preparation to optimize the method’s precision and the establishment of control strategies for the proposed multivariate method to ensure stable performance throughout its analytical life cycle, as well as on a more rigorous evaluation of its overall sustainability using a life cycle assessment approach.
2. Materials and Methods
2.1. Chemicals and Reagents
PER, AML and IND USP reference standards were used and provided from Sigma Aldrich (Taufkirchen, Germany). Water prepared by an Adrona CB-1905 purification system (Adrona SIA, Riga, Latvia) was used as diluent. HPLC-grade absolute ethanol was purchased from Fischer Scientific (Meadow Road, Loughborough, Leicestershire, UK). Absolute ethanol p.a. was purchased from Sigma Aldrich (Taufkirchen, Germany). Co-Amlessa tablets containing 8 mg of PER, 10 mg of amlodipine base (corresponding to 13.87 mg AML) and 2.5 mg of IND per one tablet (Krka-Farma, Belgrade, Serbia) were purchased from a local drug store.
2.2. Experimental Design and Solution Preparation
Stock standard solutions of PER, AML, and IND reference standards were prepared at a concentration of 0.5 mg mL−1, followed by dilution to obtain intermediate solutions of PER and IND at concentrations of 0.25 and 0.1 mg mL−1, respectively. Appropriate aliquots of these solutions were further diluted to prepare working solutions. A mixture of ethanol and water (50/50, v/v) was used as the solvent. The experimental plan for multivariate calibration (Table 1) was developed using a Taguchi L25 orthogonal array design with three factors at five levels.
Table 1.
Experimental plan.
The stock sample solution was prepared with the appropriate amount of a powdered tablet mass containing 8 mg of PER, 10 mg of amlodipine base (corresponding to 13.87 mg AML) and 2.5 mg of IND and transferring it to a 50 mL volumetric flask to attain concentrations of 160 μg mL−1, 277.4 μg mL−1 and 50 μg mL−1 for PER, AML and IND, respectively. The extraction from the tablet mass was performed five times by adding a mixture of ethanol and water (50/50, v/v) and sonicating for 5, 10, 15, 20 and 30 min. The volumetric flask was filled to the mark with the same solvent, and the suspension was filtered through a 0.45 µm nylon filter to obtain a clear stock solution. A sonication time of 20 min was selected because it enabled complete extraction of all three analytes, as shown in Figure S1. The working sample solution was prepared from this stock sample solution by dilution to attain concentrations of 6.4 μg mL−1, 11.1 μg mL−1 and 2.0 μg mL−1 for PER, AML and IND, respectively. This solution was used within method repeatability (6 sample solutions’ repetitive analysis) and intermediate method precision test (6 working solutions’ repetitive analysis performed on three separate days by different analysts). The similar procedure was applied for the preparation of the test sample solutions for the accuracy test with the difference being that respective volumes of stock standard solutions were mixed with the placebo mass corresponding to a single tablet, sonicated, filtered afterwards and diluted with the solvent to attain test solutions in concentrations equal to 80%, 100% and 120% in relation to the concentrations of PER, AML and IND in the sample solution. These test solutions were prepared in triplicate. The solution of the placebo was prepared the same way in order to confirm the specificity of the method.
Robustness testing was conducted to assess how small variations in instrumental and sample preparation parameters affect the quantitative performance of the proposed multivariate analytical method. The following factors were considered: ethanol content in the sample solvent, ethanol and water purity, duration of extraction by ultrasonication, filter type (nylon and PTFE), and variations in wavelengths. Factor levels were selected to encompass slightly exaggerated variations compared to those expected during routine use of the method. A Plackett–Burman design with 12 experiments, allowing assessment of up to 11 factors, was selected for this study. As only five factors were included, the remaining six were specified as dummy factors. The experimental plan is shown in Table S1. Concentrations of PER, AML, and IND were selected as responses. Robustness testing was performed on the tablet samples with theoretical concentrations corresponding to the center of the calibration range.
2.3. Acquisition of Spectra
UV/VIS spectra of the working solutions were recorded on a Thermo Scientific™ Evolution 300 spectrophotometer (Thermo Scientific, Cambridge, UK) with the following scan parameter setup: bandwidth 1.5 nm, scan speed 240 nm min−1 and data interval of 1 nm. Samples were subjected to the recording of spectra in random order.
2.4. Data Analysis
Several commonly used algorithms were tested in this work, including PLS regression, CRACLS [17], and PCR. The algorithms were tested on raw data without any preprocessing except for the exclusion of input wavelengths with relative standard deviation of absorbance lower than 10% in the training set. Additionally, commonly used preprocessing algorithms including mean centering, standardization, Savitzky–Golay smoothing, derivatives, wavelet denoising, multiplicative scatter correction (MSC), standard normal variate (SNV) and orthogonal signal correction (OSC) [4] were tested with the best-performing algorithm. The most successful machine learning algorithm was further combined with a genetic algorithm (GA) for feature selection to achieve additional improvement in prediction accuracy. The GA was configured with a population size of 150 chromosomes and set to evolve over 40 generations unless the early stopping criterion was met (no significant change in fitness value for 7 consecutive generations). In each generation, 30 parents were selected for the mating pool using tournament selection with a tournament size of 5. Offspring were generated using single-point crossover and an adaptive mutation rate [18], with the top 10 elite individuals preserved from the previous generation.
To ensure representative coverage of the feature space in the test sets and robust prediction accuracy estimates with reduced selection bias (as discussed by Cawley & Talbot [15]), a cluster-based nested cross-validation strategy was used. Samples were partitioned using K-means clustering applied only to the input variables. Because K-means initialization is stochastic, the clustering procedure was repeated five times with different random seeds, resulting in five independent outer train–test splits. In each split, the test set comprised samples closest to the respective cluster centroids, ensuring that the test samples were representative of the input space [19]. Within each outer training set, hyperparameters were optimized using three times repeated 10-fold cross-validation. The resulting model was then evaluated on the held-out outer test set. Test root mean squared error (RMSE) values from the outer loop were used exclusively for unbiased performance estimation and comparison of calibration models. After performance evaluation, the same hyperparameter optimization procedure was applied to the full dataset to configure the final model, which was then trained using all the available data.
2.5. Greenness and Sustainability Evaluation
The AGREE Metric for the calculation of greenness was used to evaluate the level of greenness the outstanding method holds. According to green analytical chemistry (GAC) rules, points were assigned to each aspect of the experimental procedure from the type and quantity of solvents used, position of analytical instrument, number of samples analyzed and power use.
2.6. Software
Design Expert v.13.0.5.0 software (Stat-Ease Inc., Minneapolis, MN, USA) was used to obtain the plan of the experiments. VISIONpro v.4.20 was used for the acquisition of spectra. Data analysis was performed in Python v. 3.13.5. The following libraries were used for data preprocessing, modeling and visualization: numpy 2.1.3, pandas 2.2.3, matplotlib 3.10.0, scipy 1.15.3, pywavelets 1.8.0, scikit-learn 1.6.1, and pygad 3.5.0.
3. Results and Discussion
3.1. Solvent Considerations
The increasing emphasis on green and sustainable analytical chemistry has extended solvent selection criteria beyond physicochemical suitability toward a comprehensive assessment of environmental impact. In UV/VIS spectrophotometry, solvents with low UV cut-off values are generally preferred. However, such solvents may not simultaneously satisfy analyte solubility requirements or sustainability considerations. For PER, AML, and IND, water, despite its low UV cut-off (190 nm) and favorable environmental profile, was unsuitable due to the poor solubility of IND. Acetonitrile, although spectrally suitable, was excluded because of its unfavorable environmental and safety profile. The focus was thus shifted to selecting a mixture of water and more environmentally acceptable organic solvents.
To support sustainability-driven organic solvent selection, the GreenSOL support tool was employed. Candidate organic solvents were first screened based on compatibility with the lipophilicity of the analytes (logP range 0.54–2.52 [20]), using a filter of −1 to 4, and further constrained to solvents with composite scores exceeding six for production, use, and waste. This multilevel screening yielded nine candidates from the alcohol and ester classes (Table S2 in Supplementary Materials). Esters were subsequently excluded due to their higher UV cut-off values, which limit spectrophotometric applicability. Among the remaining alcohols, ethanol showed favorable production and use scores, with a comparatively lower waste score attributable mainly to recycling and incineration metrics and aquatic impact. However, as laboratory waste typically consists of solvent mixtures rather than pure solvents [21], these differences are less critical in practical waste management. Considering this, together with established solubility data for PER, AML, and IND [16], ethanol was selected as the optimal organic solvent.
PER and AML were fully soluble in water, whereas IND required a 50:50 (v/v) ethanol/water mixture. Initial calibration using mixed solvent systems and dilution with pure water to obtain working solutions resulted in low but inconsistent ethanol content across samples, leading to poor predictive performance (70–130% accuracy on the test set). These results highlight the need for a consistent solvent composition throughout sample preparation and support the inclusion of solvent composition variability in robustness assessment. Accordingly, all stock and working solutions were prepared using a 50:50 (v/v) ethanol/water mixture.
3.2. Selection of Concentration Ranges
The definition of the concentration ranges for multivariate calibration required careful balancing of several interdependent and often competing constraints. From a modeling perspective, the most commonly applied chemometric algorithms, such as PLS, assume an approximately linear relationship between the absorbance and concentration for all analytes [22]. As emphasized by Wold and Josefson [2], a reproducible and concentration-dependent signal response is a prerequisite for robust and predictive calibration models. At the same time, concentration ranges must be selected to avoid conditions in which one or more analytes produce signals close to the noise level, while preventing excessively high absorbance of the multicomponent mixtures that may compromise measurement reliability and violate the Beer–Lambert law.
An additional practical constraint arises from the fixed-dose ratios present in commercially available formulations, which impose stringent requirements on the relative concentration levels of the individual components. For the investigated combinations, AML/IND ratios of 2.7:1, 5.5:1, and 11.1:1, as well as a PER/IND ratio of 3.2:1, had to be accommodated within a single calibration framework. Nominal concentration levels of 2 µg mL−1 for IND, 5.5 µg mL−1, 11.1 µg mL−1, and 22.2 µg mL−1 for AML, and 6.4 µg mL−1 for PER were selected to represent these ratios. The corresponding concentration ranges were defined to span at least 75–125% of the nominal values, ensuring adequate coverage of expected variability while preserving spectral linearity.
Although nominal levels can, in principle, be adjusted, for example, by lowering the IND concentration in formulations with high AML/IND ratios to avoid excessive absorbance, such modifications introduce new limitations. Reducing the IND concentration to mitigate the high absorbance of AML may render the PER signal insufficiently intense, thereby adversely affecting model accuracy. Consequently, the interplay between the analyte ratios, signal magnitude, and spectral overlap leaves limited flexibility in defining the concentration ranges.
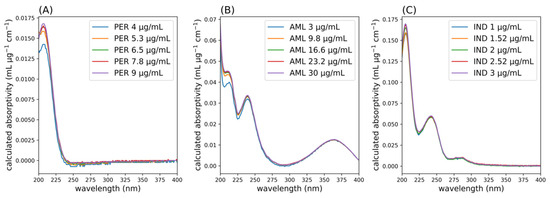
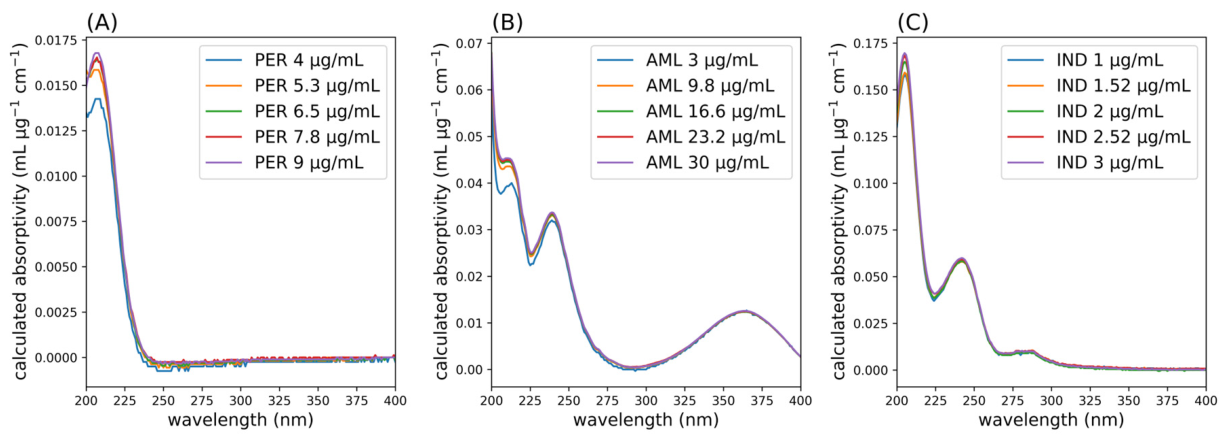
To address these constraints systematically, a structured strategy was applied. Single-analyte spectra (Figure S2) were first recorded across the proposed concentration ranges to determine the linear dynamic region. Linearity was assessed by normalizing the absorbance values by concentration and evaluating the congruence of the normalized spectra across wavelengths. This analysis revealed slight deviations from linearity at the lower concentration limits for PER and AML (Figure 1). Nominal concentrations were therefore finalized within the confirmed linear region. Finally, the total absorbance of mixtures containing all analytes at their highest concentrations was verified to remain below the empirically established threshold of 2.0, except for minor, acceptable deviations at the lower wavelength boundary.
Figure 1.
Concentration-normalized spectra of: (A) PER, (B) AML and (C) IND.
3.3. Data Splitting Strategy for the Model Performance Evaluation
While random test set selection is standard in the literature, it carries the risk of selecting non-representative test samples when datasets are small, as in the context of MVC. Therefore, selecting test samples nearest to K-means centroids is proposed to ensure a more reliable evaluation. However, the inherent randomness of K-means initialization presents a challenge: preliminary tests showed that different random seeds can affect the results as much as the choice of algorithm. To address this, we adopted nested cross-validation. Repeated 10-fold cross-validation was used to provide a more stable estimate of model performance, reducing the risk that hyperparameter optimization was biased by a single random split of the small dataset in the inner loop. The recent literature [23,24,25,26,27,28] shows that a complete dataset typically contains up to 35 samples, and test samples are usually randomly selected. Compared to random train–validation–test splits, the presented framework includes steps to minimize bias in model performance estimation, providing an improved methodology for MVC development, which typically involves limited data.
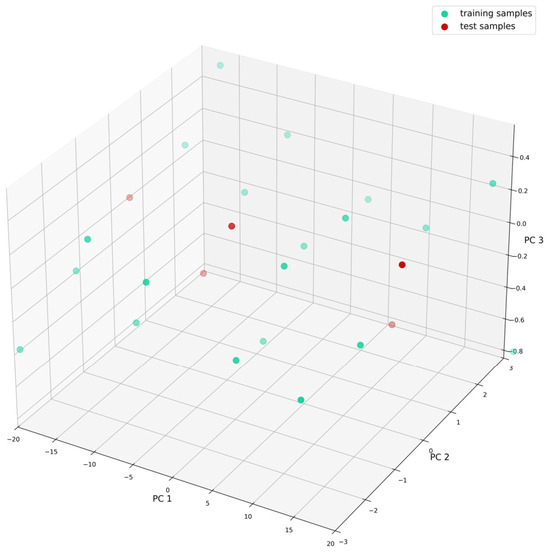
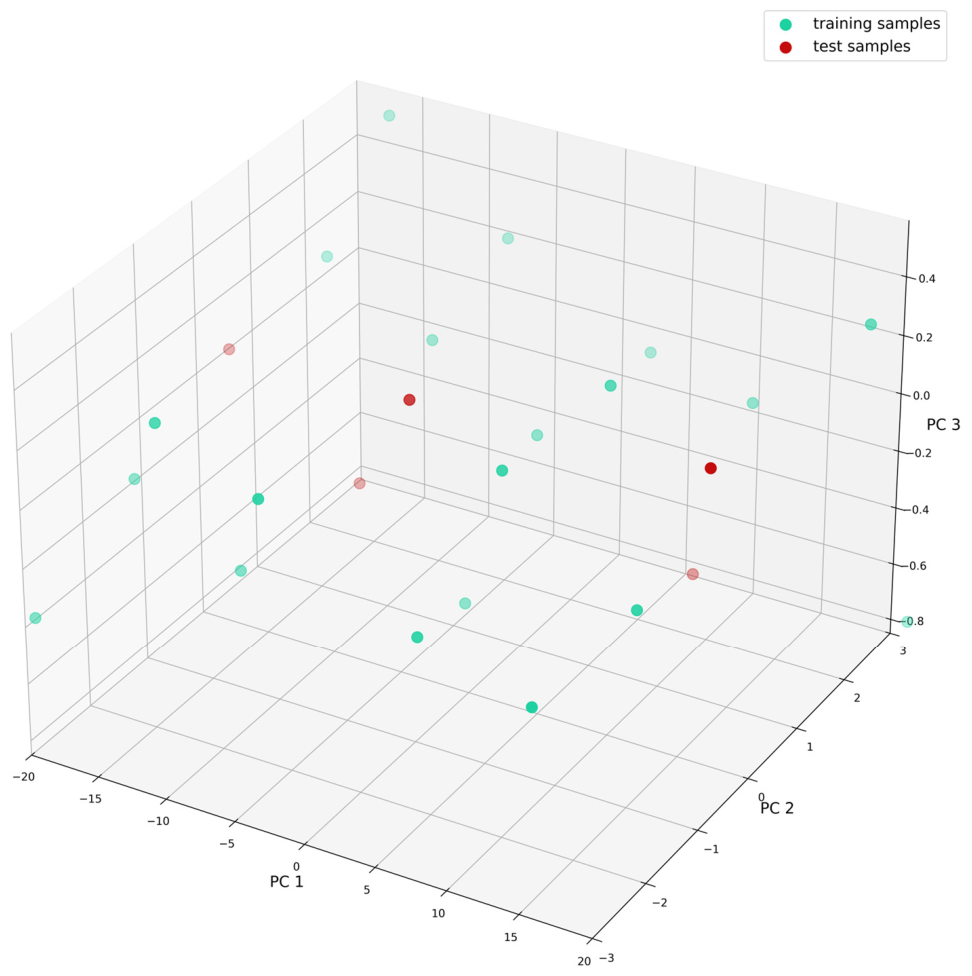
PCA was used to visualize the distribution of data points within the feature space. The 3D score plot in Figure 2 shows that the training samples provide comprehensive and uniform coverage of the domain, while the test samples are distributed across the entire coordinate system. This broad distribution ensures that the test set is highly representative of the total variance in the data, validating both the experimental design and the data splitting strategy.
Figure 2.
PCA score plot of training and test samples.
While approaches that include additional independent test samples selected to provide uniform coverage of the calibration space, such as those based on the Kennard–Stone algorithm [29] or Latin hypercube sampling (LHS) [13], are expected to provide more reliable estimates of model performance, they also require additional experimental effort. Future research should therefore focus on comparing model selection outcomes obtained using different advanced validation frameworks to identify the optimal balance between experimental workload and bias in model selection, and ultimately to establish generally applicable recommendations for model evaluation.
3.4. Development of a Calibration Model
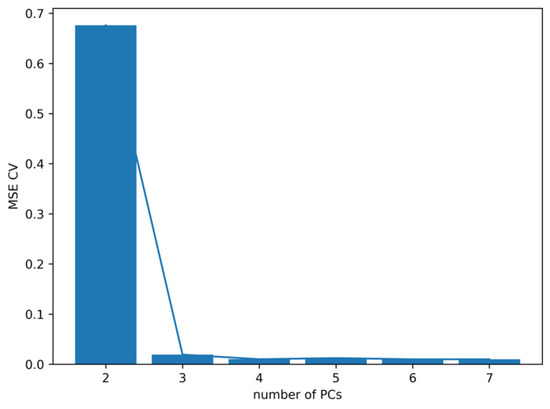
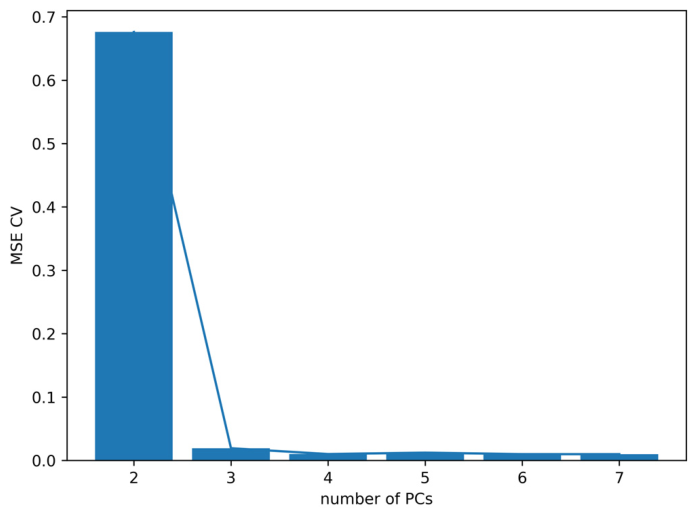
Among the three algorithms tested, PCR demonstrated the best generalization ability based on the test set results. Training, cross-validation, and test model errors, expressed as RMSE values, are shown in Table 2. The pronounced gap between the training RMSE and test RMSE values for PLS and CRACLS suggests that these algorithms tend to overfit the training samples. The CRACLS algorithm was able to recover the exact spectral shapes of the analytes, as evidenced by Figure S3 in the Supplementary Materials, and may be an interesting option since it enables augmentation during prediction and may thus circumvent the need for recalibration in the case of changes in drug formulation [30]. However, PCR was notably superior in this case and was therefore selected as the optimal algorithm. From the bar plot in Figure 3, it can be visually determined that at least the first three principal components are significant, while cross-validation indicated that seven PCs should be selected for model building, as the RMSE reached a plateau with PC 7. The number of PCs selected (seven PCs) exceeds the number of analytes in the system, which, as suggested by Wold and Josefson [2], indicates a sufficient number of detectable components from the spectral data and thus its adequacy. Although the system contains three analytes, the optimal number of latent variables in multivariate calibration models does not necessarily correspond to the number of analytes present. Additional components may account for other sources of variance, such as instrumental noise, slight deviations from ideal linear concentration–response behavior at low concentrations, and small experimental variations (e.g., solvent composition or temperature). In previous work on this mixture by Ragaa et al. [16], five components resulted in the minimum cross-validation error for both the PCR and PLS models. Since the present study included wider concentration ranges, the requirement for additional latent variables may be attributed to the increased spectral variability within the calibration set, particularly in the low-concentration region of the analytes. Other studies also demonstrated improvement in calibration models when the number of latent variables exceeded the number of analytes present in the samples [23,25,26,27].
Table 2.
Performance of different models on training, cross-validation and test samples.
Figure 3.
The influence of number of principal components (PCs) on cross-validation MSE.
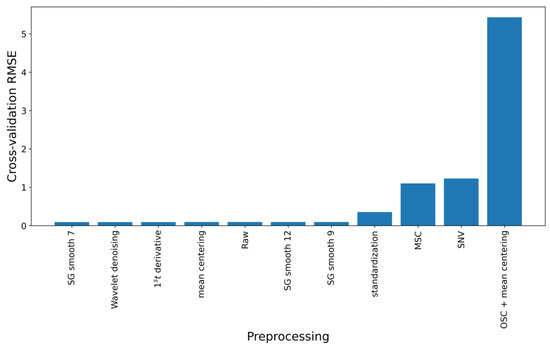
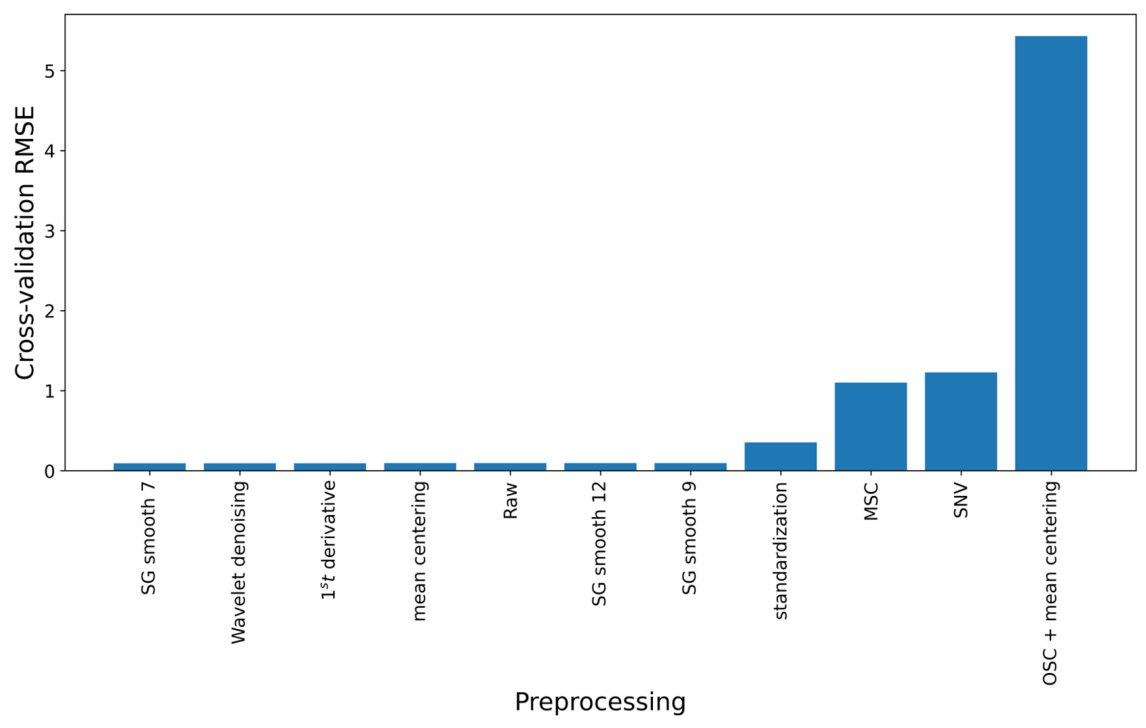
Regarding the application of multivariate calibration applied with UV–VIS spectrophotometry, extensive signal preprocessing is usually not required [11]. As shown by the cross-validation RMSE values (Figure 4), scatter correction algorithms (SNV and MSC) and OSC (using a single component) significantly degraded model performance. Standardization of spectra resulted in a slight increase in the cross-validation RMSE. In contrast, mean centering, first-order derivative, wavelet denoising (two-level decomposition with soft-thresholding), and Savitzky–Golay smoothing (window size 7) provided only marginal improvements over the raw data. The application of Savitzky–Golay smoothing resulted in the lowest RMSE and was thus selected as optimal. The signal preprocessing–PCR model resulted in a slightly improved performance on the test set (Table 2). Therefore, the signal preprocessing–PCR algorithm was subsequently combined with a GA to further explore potential model improvement.
Figure 4.
Cross-validation RMSE values for different spectral preprocessing approaches.
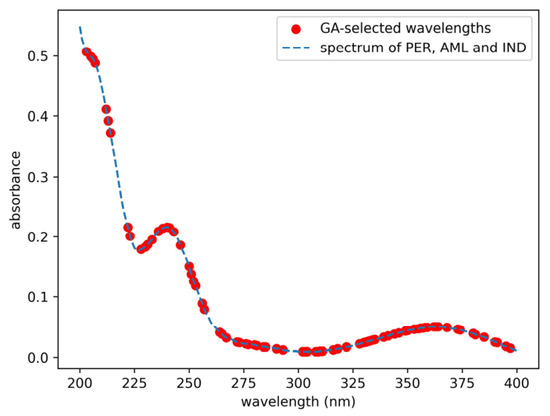
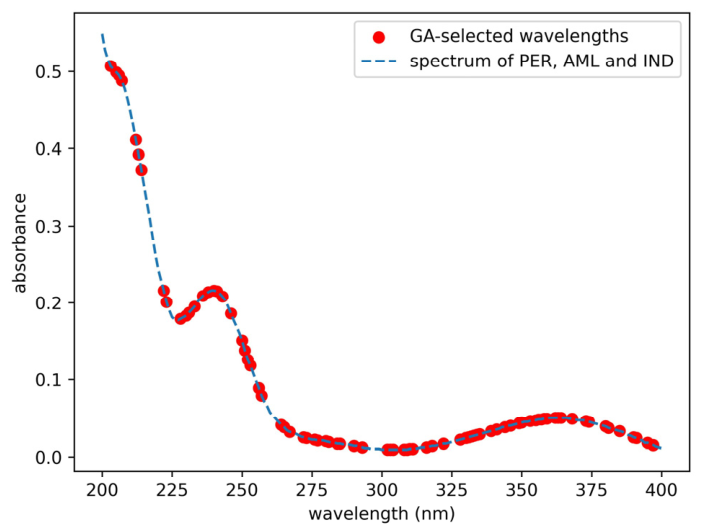
Feature selection based on the GA provided a further slight improvement in multivariate calibration model predictive ability, as evidenced by the test RMSE values presented in Table 2. Based on GA-PCR fitting on the full data, 80 wavelengths and seven principal components were selected, as shown in Figure 5. The set of GA-selected wavelengths corresponds to regions with relatively orthogonal spectral characteristics for the individual components of the drug mixture (see Figure 1). For example, the first selected wavelength is 203 nm, which is close to the first absorption maximum of IND. At this wavelength, the absorption band of PER is still increasing, while its maximum occurs at 207 nm, corresponding to the longer-wavelength side of the IND band, which is also selected as the input. Many selected wavelengths correspond to the characteristic absorption band of IND in the 270–290 nm wavelength region, as well as the characteristic absorption band of AML in the 310–390 nm wavelength region. This confirms the appropriateness of the GA settings used, as well as the general applicability and effectiveness of this approach for feature selection. A similar improvement in model performance was observed in other studies when GA was combined with PLS regression, which can be attributed to the selection of relevant input wavelengths [24,29].
Figure 5.
Input wavelengths for PCR selected by genetic algorithm.
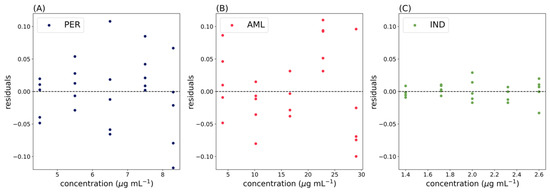
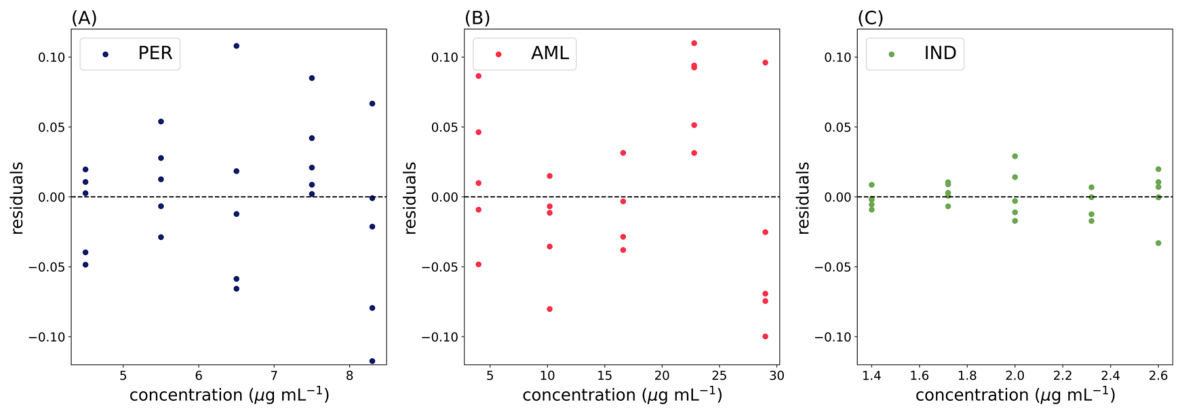
Additional diagnostics of the multivariate calibration model was performed by plotting model residual dependence on the concentrations of analytes as recommended by ICH Q2 [31]. Plots shown in Figure 6 demonstrate the absence of significant trends and heteroscedasticity in the residuals and thus further confirm the appropriateness of the developed calibration model. The absence of patterns in the residuals as well as the good compliance of the predicted and actual concentrations is also evidenced from the plots shown in Figure S4 in the Supplementary Materials.
Figure 6.
Variation in model residuals with analyte concentration for: (A) PER; (B) AML and (C) IND.
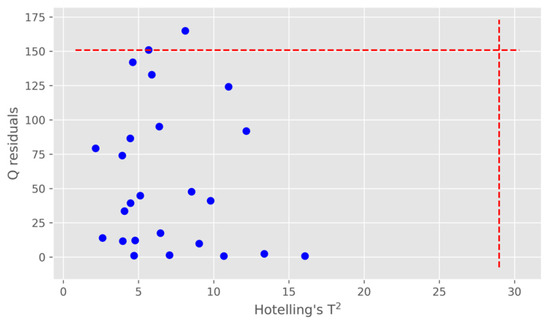
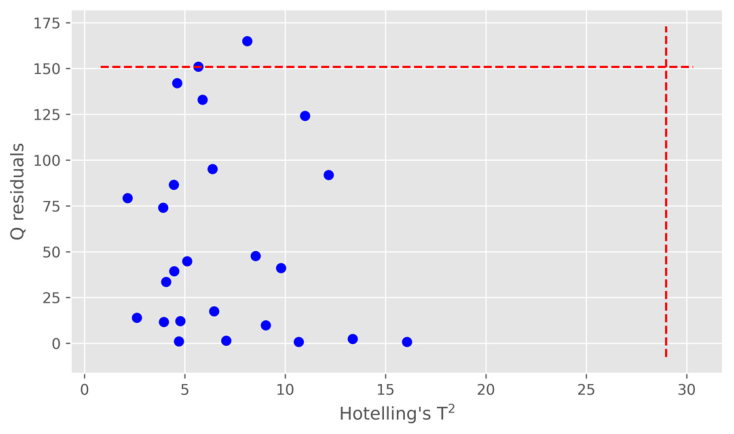
To identify potential outliers that could negatively affect the quality of the calibration model, Hotelling’s T2 values and Q residuals were calculated for all samples and plotted, as shown in Figure 7. Only one point slightly exceeded the critical value for the Q residuals (95% confidence limit). This point corresponds to the spectrum of the calibration sample with the lowest concentration of all three analytes, so a slightly poorer model performance is not unexpected. Therefore, no samples were excluded from the calibration. During routine application of the method, the plot can be updated with new samples to check whether they fall within the model applicability domain.
Figure 7.
The plot of Q residuals vs. Hotelling’s T2 values for outlier diagnostics (values corresponding to the 95% confidence limit are represented by the dashed lines).
3.5. Method Validation
Development of the multivariate calibration model implied the consideration of concentration ranges where method linearity was met as well as the proper concern on method selectivity (see Section 3.2 and Section 3.4 as well as Figures S4 and S5 in Supplementary Materials). A further analytical method validation procedure following the ICH Q2 requirements was carried out to evaluate the remaining validation parameters [31]. Selectivity of the method was confirmed by recording the spectra of a placebo sample treated the same as the spiked placebo samples. The spectrum shown in Figure S5 shows negligible absorption at the selected input wavelengths, confirming the absence of interferences from excipients. The method accuracy was tested at three levels corresponding to 80%, 100% and 120% of the nominal level for drug products with AML/IND mass ratios of 2.7:1, 5.5:1 and 11.1:1, respectively. Such a selection of concentration levels enabled thorough coverage of the concentration ranges included in the calibration with minimal experimental labor. It was important to include the lower part of the concentration range, where analyte absorbance is low and more likely to be affected by interferences from excipients. Table 3 shows that at all three levels, the mean recovery values were within 98–102%. The relative standard deviation (RSD) values were below 1.0%, except for PER at the lowest level tested, where one individual value was at the upper edge of the acceptable window. This may indicate the need to replicate the analysis of samples with such low analyte concentrations, but avoiding small volumes and intermediate dilutions during sample preparation should ensure low variability and reliable estimation. A more detailed study with additional replicated samples is required to reliably establish confidence intervals and draw definite conclusions. More importantly, the mean recovery values confirm the absence of interferences or detrimental effects from the sample preparation steps. This confirms the proposed method selection procedure did not produce overly optimistic estimates of model predictive performance. Since PER shows generally low absorbance when the concentration is near the lower edge of the investigated range, the LOQ values were determined as follows:
where SF is the standard deviation of the model calibration residuals [2]. The calculated values were 0.89 µg mL−1, 1.14 µg mL−1 and 0.22 µg mL−1 for PER, AML and IND, respectively. All values from Table 1 are well above the LOQ, which, together with good model performance on the spiked placebo, confirms sufficient accuracy despite low absorbance values. Thereafter, excellent method repeatability was confirmed for the commercially available drug product sample, with RSD values of 0.62%, 0.14% and 0.48% for PER, AML and IND, respectively. Finally, acceptable intermediate precision, which included variation in laboratory glassware, analysts, and days, was proven by the RSD values of 1.50%, 1.20% and 0.58% for PER, AML and IND, respectively.
Table 3.
The results of method accuracy testing.
The main goal of the method validation procedure was to confirm the adequacy of the applied model selection process, as it does not include performance estimation on an external independent test set. However, for the widespread application of the developed method, evaluating robustness is an essential step. How to conduct robustness testing for multivariate analytical procedures remains an open question, with numerous possible approaches and few examples in the literature. ICH Q14 [3] emphasizes the importance of determining the number of latent variables and avoiding overfitting, both of which were considered in this work. It also mentions the possibility of building robustness into the model by including influential experimental factors during the calibration phase, but this is also rarely addressed in the literature. In this study, robustness was assessed by evaluating the effects of small variations in the method’s parameters on the predicted concentrations of analytes in authentic samples of a fixed-dose drug combination. As a first step in robustness testing, the complete experimental procedure was evaluated to identify all factors likely to vary during routine use of the method. The ethanol content was selected because previous studies showed that variations in the ethanol content significantly deteriorate method performance when the ethanol content in calibration solutions is generally low. Lower and upper levels were established based on the calibration uncertainty of measuring the cylinder volume, following the approach presented by Vander Heyden et al. [32]. Additionally, the purity grade of the solvent was included to determine if less expensive, lower-purity solvents could be used instead of HPLC solvents. Sonication time variation in the range of 17–23 min was investigated to confirm the appropriateness of the selected condition through a more statistically rigorous evaluation enabled by the experimental design. As tablets contain mainly insoluble excipients, filtration is required to obtain clear solutions. Nylon and PTFE filters were assessed, as they are commonly used in laboratories. It was also important to consider potential changes in the ionization states of analytes, as these changes may result in shifts in their spectra. Perindopril is an amphoteric analyte containing a carboxylic group (acidic) with pKa 2.20 and a secondary aliphatic amino group (basic) with pKa 6.02. Amlodipine is a basic analyte containing a primary aliphatic amino group with pKa 9.30. Indapamide is an amphoteric analyte containing a weakly acidic sulfonamide group with pKa 9.35 and a weakly basic nitrogen in the dihydroindole heterocycle with pKa 3.3 [20]. Laboratory mixtures of the reference standards, spiked placebo, and drug products dissolved in the selected solvent all exhibited pH around 7.8. Considering the pKa values of the analytes and the high purity of the solvents, slight variations in pH around 7.8 are not expected to significantly affect the ionization of the analytes and were thus not taken into account. Among the instrumental parameters, variation in the wavelength of incident light was selected, as it is expected to affect the spectra, particularly in spectral regions with large slopes. All spectra were recorded with the wavelength shifted by −1 when examining the lower level of the factor and by +1 when examining the higher level of the factor.
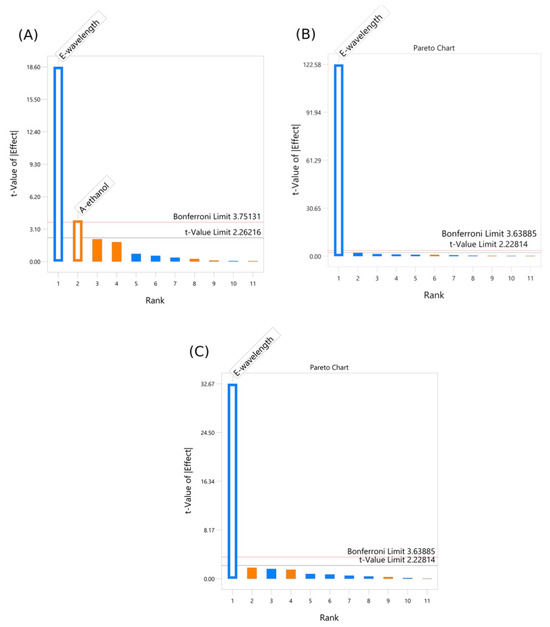
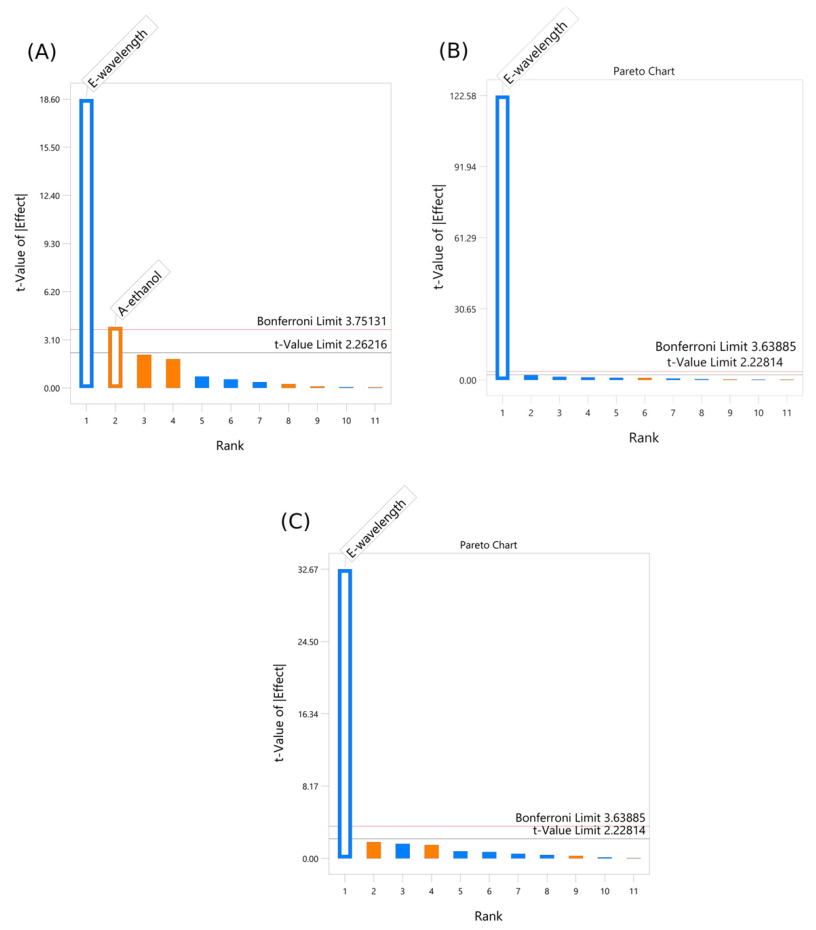
From the Pareto charts in Figure 8, it is evident that wavelength shifts had the most significant effect for all three analytes. The PER content was also sensitive to small variations in the ethanol content. Other factors were not statistically significant, indicating that the tested filters, solvent purity grades, and selected sonication time are adequate. For the method to retain its performance during routine use, instrument qualification—particularly the demonstration of wavelength accuracy and repeatability—is an important prerequisite. Furthermore, solvent preparation steps should minimize variation in solvent composition, as this affects the accuracy of PER content determination.
Figure 8.
Pareto charts showing the estimated effects of investigated factors on the predicted concentrations of the three analytes: (A) PER; (B) AML, and (C) IND. The vertical reference line indicates the critical effect value; factors with bars exceeding this threshold are considered statistically significant.
Regarding the reliability and widespread application of multivariate analytical procedures, future work should focus on minimizing uncertainty from sample preparation, extensive method validation, establishing control strategies, and developing suitable user-friendly software.
3.6. Greenness Assessment
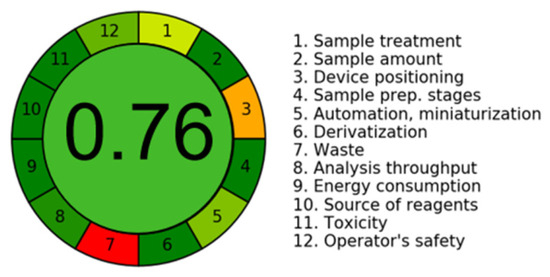
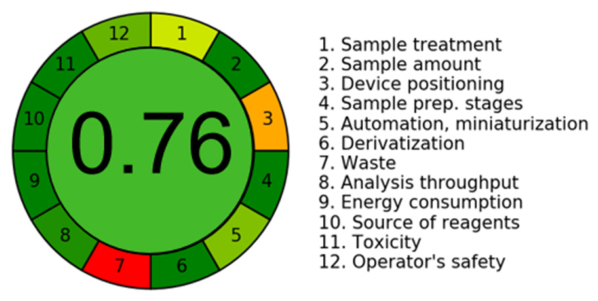
The greenness of the proposed method was evaluated using the AGREE methodology, which assigns penalty points to each step of the analytical procedure [33,34]. The results are presented as a circular pictogram with 12 segments corresponding to the principles of green analytical chemistry (Figure 9). Segments related to the sample treatment, device positioning, and waste generation showed higher penalty points, mainly due to the off-line nature of the procedure. However, no extraction or derivatization was required, and the use of ethanol and water, along with low solvent volumes (below 20 mL), reduced the overall impact. Although UV–VIS spectroscopy is inherently environmentally friendly, off-line analysis contributed to some penalties. Overall, the AGREE score of 0.76 indicates the good environmental performance of the method.
Figure 9.
AGREE greenness assessment score.
4. Conclusions
In the context of the increasing global emphasis on green and sustainable practices, it is essential that analytical science actively contributes to these efforts. In this study, an environmentally sustainable UV–VIS spectrophotometric method was successfully developed and validated for the determination of a fixed-dose combination of perindopril erbumine, amlodipine besylate, and indapamide using eco-friendly solvents. The method demonstrated an excellent greenness profile, achieving an AGREE score of 0.76. Integration of genetic algorithm-based feature selection with signal-preprocessed principal component regression resulted in superior predictive performance, yielding a low RMSE value of 0.0725 and outperforming the alternative models evaluated. Furthermore, the proposed modeling and validation framework effectively addresses challenges associated with small datasets, which are commonly encountered in multivariate calibration problems. Future work should focus on robustness testing and the implementation of more comprehensive sustainability assessment approaches in order to facilitate the wider adoption of the presented analytical strategy in pharmaceutical quality control. Future work should prioritize reducing uncertainty in sample preparation, rigorous method validation, robust control strategies, and the development of user-friendly analytical software, and comprehensive sustainability assessment. It is necessary to identify an optimal trade-off between experimental workload and bias in order to formulate robust and generally applicable guidelines for model evaluation.
Supplementary Materials
The following supporting information can be downloaded at: https://www.mdpi.com/article/10.3390/analytica7020042/s1, Figure S1. Effect of ultrasonic bath extraction time on the determined concentrations of analytes; Figure S2: UV spectra of individual analytes in different concentrations; Figure S3: comparison of spectral shapes obtained by CRACLS algorithm and experimental spectral shapes; Figure S4: predicted vs. actual concentrations of analytes; Figure S5: UV spectra of placebo sample; Table S1: experimental plan for robustness testing; Table S2: solvent list obtained from GreenSOL platform after applying the following criteria: logP −1 to 4, production, use and waste scores above 6.
Author Contributions
J.S.: conceptualization, methodology, investigation, formal analysis, software, visualization, writing—original draft; H.O.: investigation, formal analysis, writing—review and editing; A.P., A.M., M.Z. and N.A.: writing—review and editing; visualization, supervision; B.O.: conceptualization, validation, resources, writing—review and editing, supervision, project administration, funding acquisition. All authors have read and agreed to the published version of the manuscript.
Funding
This research was funded by the Ministry of Science, Technological Development and Innovation, Republic of Serbia through two Grant Agreements with the University of Belgrade-Faculty of Pharmacy No. 451-03-33/2026-03/200161 and 451-03-34/2026-03/200161 and one Grant Agreement with the University of Belgrade–Faculty of Medicine No. 451-03-34/2026-03/200110.
Data Availability Statement
The raw data supporting the conclusions of this article will be made available by the authors on request.
Conflicts of Interest
The authors declare no conflicts of interest. The funders had no role in the design of the study; in the collection, analyses, or interpretation of data; in the writing of the manuscript; or in the decision to publish the results.
Abbreviations
The following abbreviations are used in this manuscript:
| HPLC | High-performance liquid chromatography |
| APIs | Active pharmaceutical ingredients |
| MVC | Multivariate calibration |
| UVC | Univariate calibration |
| CLS | Classical least squares |
| ILS | Inverse least squares |
| PLS | Partial least squares |
| PCR | Principal component regression |
| ANN | Artificial neural networks |
| SVM | Support vector machine |
| CRACLS | Concentration residual augmented least squares |
| OSC | Orthogonal signal correction |
| SNV | Standard normal variate |
| MSC | Multiplicative scatter correction |
| LHS | Latin hypercube sampling |
| CV | Cross-validation |
| PER | Perindopril erbumine |
| AML | Amlodipine besylate |
| IND | Indapamide |
| GA | Genetic algorithm |
| RMSE | Root mean squared error |
| RSD | Relative standard deviation |
| GAC | Green analytical chemistry |
| ICH | International Council for Harmonisation of Technical Requirements for Pharmaceuticals for Human Use |
References
- Khani, R.; Rahmanian, R.; Motlagh, N. UV–Visible Spectrometry and multivariate calibration as a rapid and reliable tool for simultaneous quantification of ternary mixture of phenolic acids in fruit juice samples. Food Anal. Methods 2016, 9, 1112–1119. [Google Scholar] [CrossRef]
- Wold, S.; Josefson, M. Multivariate calibration of analytical data. In Encyclopedia of Analytical Chemistry; Meyers, R.A., Brown, S.D., Eds.; Wiley Online Library: Hoboken, NJ, USA, 2006. [Google Scholar] [CrossRef]
- European Medicinal Agency. ICH Q14 Guideline on Analytical Procedure Development. 2023. Available online: https://www.ema.europa.eu/en/ich-q14-analytical-procedure-development-scientific-guideline (accessed on 20 April 2026).
- Wilbert, D.; Voigt, M.; Jaeger, M. A process analyzer assembly for real-time automated near-infrared, Raman, and proton nuclear magnetic resonance spectroscopic monitoring enhanced by heterocovariance spectroscopy and chemometry applied to a Schiff base formation. Anal. Bioanal. Chem. 2025, 417, 5703–5713. [Google Scholar] [CrossRef] [PubMed]
- Albayrak, M.; Demirkaya, F.; Senol, O.; Polatdemir, E. Design, optimization, and validation of chemometrics-assisted spectrophotometric methods for simultaneous determination of etodolac and thiocolchicoside in pharmaceuticals. J. Anal. Sci. Technol. 2019, 10, e16. [Google Scholar] [CrossRef]
- Rathod, S.; Patel, P.; Patel, N. Chemometrics Assisted Spectrophotometric Method Development and Validation for Simultaneous Estimation of Abacavir, Lamivudine and Dolutegravir in Dosage Form. Ind. J. Pharm. Edu. Res. 2023, 57, 570–582. [Google Scholar] [CrossRef]
- Olivieri, A.C. Mathematical Pre-processing. In Introduction to Multivariate Calibration; Springer: Cham, Switzerland, 2018. [Google Scholar] [CrossRef]
- Ehrentreich, F. Wavelet transform applications in analytical chemistry. Anal. Bioanal. Chem. 2002, 372, 115–121. [Google Scholar] [CrossRef] [PubMed]
- Wold, S.; Antti, H.; Lindgren, F.; Öhman, J. Orthogonal signal correction of near-infrared spectra. Chemom. Intell. Lab. Syst. 1998, 44, 175–185. [Google Scholar] [CrossRef]
- Rinnan, A.; van den Berg, F.; Engelsen, S.B. Review of the most common pre-processing techniques for near-infrared spectra. TrAC Trends Anal. Chem. 2009, 28, 1201–1222. [Google Scholar] [CrossRef]
- Ríos-Reina, R.; Azcarate, S.M. How Chemometrics Revives the UV-Vis Spectroscopy Applications as an Analytical Sensor for Spectralprint (Nontargeted) Analysis. Chemosensors 2023, 11, 8. [Google Scholar] [CrossRef]
- Moustafa, A.A.; Hegazy, M.A.; Mohamed, D.; Ali, O. Evaluation of multivariate calibration models with different pre-processing and processing algorithms for a novel resolution and quantitation of spectrally overlapped quaternary mixture in syrup. Spectrochim. Acta Part A 2016, 154, 76–83. [Google Scholar] [CrossRef] [PubMed]
- Eraqi, M.M.; Algohary, A.M.; Al-Ghamdi, Y.O.; Ibrahim, A.M. Simultaneous spectrophotometric determination of paracetamol, tramadol, and aceclofenac in pharmaceuticals: A green method with an adaptive plateau-based successive projections algorithm with automated tuning of support vector regression. Sustain. Chem. Pharm. 2025, 46, e102056. [Google Scholar] [CrossRef]
- Yun, Y.H.; Li, H.D.; Deng, B.C.; Cao, D.S. An overview of variable selection methods in multivariate analysis of near-infrared spectra. TrAC Trends Anal. Chem. 2019, 113, 102–115. [Google Scholar] [CrossRef]
- Cawley, G.; Talbot, N. On over-fitting in model selection and subsequent selection bias in performance evaluation. J. Mach. Learn. Res. 2010, 11, 2079–2107. [Google Scholar]
- Ragaa, M.; Hemdan, A.; Farouk, M.; Fares, N.V. In vitro dissolution profile of antihypertensive mixture: Comparison between multivariate methods and statistical and graphical representation of different univariate spectrophotometric data. J. AOAC Int. 2023, 106, 624–635. [Google Scholar] [CrossRef]
- Melgaard, D.K.; Haaland, D.M.; Wehlburg, C.M. Concentration residual augmented classical least squares (CRACLS): A multivariate calibration method with advantages over partial least squares. Appl. Spectrosc. 2002, 56, 615–624. [Google Scholar] [CrossRef]
- Marsili Libelli, S.; Alba, P. Adaptive mutation in genetic algorithms. Soft Comput. 2000, 4, 76–80. [Google Scholar] [CrossRef]
- Čolović, J.; Kalinić, M.; Vemić, A.; Erić, S.; Malenović, A. Influence of the mobile phase and molecular structure parameters on the retention behavior of protonated basic solutes in chaotropic chromatography. J. Chromatogr. A 2017, 1511, 68–76. [Google Scholar] [CrossRef]
- Wishart, D.S.; Feunang, Y.D.; Guo, A.C.; Lo, E.J.; Marcu, A.C.; Grant, J.R.; Sajed, T.; Johnson, D.; Li, C.; Sayeeda, Z.; et al. DrugBank 5.0: A major update to the DrugBank database for 2018. Nucleic Acids Res. 2018, 46, D1074–D1082. [Google Scholar] [CrossRef] [PubMed]
- Stampolaki, E.; Mondello, A.; Alladio, E.; Oliveri, P.; Mazzoleni, A.; Pena-Pereira, F.; Psillakis, E. GreenSOL: Green solvent guide for analytical chemistry based on production-to-end-of-life assessment. TrAC Trends Anal. Chem. 2026, 194, e118531. [Google Scholar] [CrossRef]
- Olivieri, A.C. The partial least-squares model. In Introduction to Multivariate Calibration; Springer: Cham, Switzerland, 2018. [Google Scholar] [CrossRef]
- Arabzadeh, V.; Sohrabi, M.R. Artificial Neural Network and Multivariate Calibration Methods Assisted UV Spectrophotometric Technique for the Simultaneous Determination of Metformin and Pioglitazone in Anti-Diabetic Tablet Dosage Form. Chemom. Intell. Lab. Syst. 2022, 221, 104475. [Google Scholar] [CrossRef]
- Elsonbaty, A.; Serag, A.; Abdulwahab, S.; Hassan, W.S.; Eissa, M.S. Analysis of Quinary Therapy Targeting Multiple Cardiovascular Diseases Using UV Spectrophotometry and Chemometric Tools. Spectrochim. Acta A Mol. Biomol. Spectrosc. 2020, 238, 118415. [Google Scholar] [CrossRef]
- Mostafa, A.; Shaaban, H. Chemometric Assisted UV-Spectrophotometric Methods Using Multivariate Curve Resolution Alternating Least Squares and Partial Least Squares Regression for Determination of Beta-Antagonists in Formulated Products: Evaluation of the Ecological Impact. Molecules 2023, 28, 328. [Google Scholar] [CrossRef] [PubMed]
- Abd El-Hadi, H.R.; Eissa, M.S.; Zaazaa, H.E.; Eltanany, B.M. Univariate versus Multivariate Spectrophotometric Data Analysis of Triamterene and Xipamide; a Quantitative and Qualitative Greenly Profiled Comparative Study. BMC Chem. 2023, 17, 47. [Google Scholar] [CrossRef] [PubMed]
- Rahman, M.A.A.; Elghobashy, M.R.; Zaazaa, H.E.; El-Mosallamy, S.S. Novel Analytical Method Based on Chemometric Models Applied to UV–Vis Spectrophotometric Data for Simultaneous Determination of Etoricoxib and Paracetamol in Presence of Paracetamol Impurities. BMC Chem. 2023, 17, 176. [Google Scholar] [CrossRef] [PubMed]
- Algmaal, S.E.; Boltia, S.A.; El Saharty, Y.S.; Ghoniem, N.S. Chemometric and Learning-Based Multivariate Models for Quantifying a Challenging Quaternary Mixture of Bupropion, Dextromethorphan, and Their Related Impurities by UV-Vis Spectrophotometry. BMC Chem. 2026, 20, 87. [Google Scholar] [CrossRef] [PubMed]
- Abbas, A.E.F.; Gamal, M.; Naguib, I.A.; Halim, M.K.; Said, B.A.M.; Ghoneim, M.M.; Mansour, M.M.A.; Salem, Y.A. Application of Machine Learning Assisted Multi-Variate UV Spectrophotometric Models Augmented by Kennard Stone Clustering Algorithm for Quantifying Recently Approved Nasal Spray Combination of Mometasone and Olopatadine along with Two Genotoxic Impurities: Comprehensive Sustainability Assessment. BMC Chem. 2025, 19, 98. [Google Scholar] [CrossRef]
- Haaland, D.M.; Melgaard, D.K. New prediction-augmented classical least-squares (PACLS) methods: Application to unmodeled interferents. Appl. Spectrosc. 2000, 54, 1303–1312. [Google Scholar] [CrossRef]
- European Medicines Agency. ICH Q2(R2) Validation of Analytical Procedures—Scientific Guideline. 2024. Available online: https://www.ema.europa.eu/en/ich-q2r2-validation-analytical-procedures-scientific-guideline (accessed on 20 April 2026).
- Vander Heyden, Y.; Nijhuis, A.; Smeyers-Verbeke, J.; Vandeginste, B.G.M.; Massart, D.L. Guidance for Robustness/Ruggedness Tests in Method Validation. J. Pharm. Biomed. Anal. 2001, 24, 723–753. [Google Scholar] [CrossRef] [PubMed]
- Yahya, L.A.; Vakh, C.; Dushna, O.; Kalisz, O.; Bocian, S.; Tobiszewski, M. Guidelines on the proper selection of greenness and related metric tools in analytical chemistry—A tutorial. Anal. Chim. Acta. 2025, 1357, e344052. [Google Scholar] [CrossRef]
- Pena-Pereira, F.; Wojnowski, W.; Tobiszewski, M. AGREE—Analytical GREEnness Metric Approach and Software. Anal. Chem. 2020, 92, 10076–10082. [Google Scholar] [CrossRef] [PubMed]

Disclaimer/Publisher’s Note: The statements, opinions and data contained in all publications are solely those of the individual author(s) and contributor(s) and not of MDPI and/or the editor(s). MDPI and/or the editor(s) disclaim responsibility for any injury to people or property resulting from any ideas, methods, instructions or products referred to in the content. |
© 2026 by the authors. Licensee MDPI, Basel, Switzerland. This article is an open access article distributed under the terms and conditions of the Creative Commons Attribution (CC BY) license.