


Abstract
Comparative interpretation of antioxidant activity across complex natural-product extracts and multi-component formulations is often limited by heterogeneous endpoints, assay-specific reporting, and incompatible units. In this study, we establish a dimensionless Effect Factor (EF) framework as a standardized comparative indexing system for matched-condition comparison of antioxidant-related readouts. EF maps four widely used antioxidant-related readouts—ABTS, DPPH, total phenolic content (TPC), and total flavonoid content (TFC)—into a common dimensionless index space while preserving endpoint meaning through two complementary tracks: potency-type EF and content-type EF. Using a standardized extraction and assay pipeline, we generated EF indices for 586 extracts prepared under water and 30% ethanol conditions and organized them into EF-indexed databases. EF is not intended as a predictive or biologically validated efficacy metric, but as a standardized comparative indexing framework that enables reproducible benchmarking, database-level referencing, and structured interpretation of heterogeneous antioxidant-related data under harmonized experimental conditions. These results establish the EF-indexed resource as a scalable and expandable comparative infrastructure for natural-product research.
1. Introduction
Herbal medicines and plant-derived botanical preparations are widely used as therapeutic resources and functional ingredients, and their antioxidant properties are frequently investigated as practical indicators of bioactivity. Because oxidative stress and radical-mediated processes are implicated in diverse physiological dysfunctions, antioxidant-related assays are widely used as practical entry points for comparative evaluation of complex botanical matrices [1,2]. In vitro antioxidant profiling is particularly attractive for this purpose because it can be implemented in a high-throughput manner across large material panels. However, despite the large volume of published antioxidant data, direct comparison across materials and studies remains limited because extraction conditions, assay procedures, concentration settings, data-processing strategies, and reporting units are often heterogeneous [2,3,4].
Conventional approaches for antioxidant comparison, including single-point inhibition measurements and IC50-derived metrics, are often insufficient for complex extracts due to instability under non-monotonic responses and incompatibility across heterogeneous endpoints. Dimensionless representations have been widely applied across scientific disciplines to enable standardized comparison across heterogeneous measurement scales. In this context, the EF framework does not introduce a new antioxidant assay, but instead establishes an endpoint-aware comparative indexing system that converts heterogeneous readouts into a structured, unitless space while preserving the distinction between potency-type and content-type measurements. This approach enables comparison across heterogeneous endpoints without requiring direct unit conversion or assuming equivalence between fundamentally different measurement types. Accordingly, EF is designed as a standardized comparative framework for matched-condition comparison rather than as a universal measure of antioxidant efficacy or biological effectiveness.
This comparability problem is especially relevant for development-oriented applications involving diverse herbal materials and multi-herb prescriptions, where fair benchmarking requires matched experimental conditions and interpretable rank-based comparison. Even within materials assigned to the same pharmacognostic label, differences in botanical origin, plant part, processing history, and batch quality can substantially affect extract composition and yield. International guidance has therefore emphasized the importance of standardization and quality-control principles for botanical resources, including authentication, purity assessment, and consistency management [5]. In practice, these sources of variability can amplify inconsistency before extraction and assay steps are even considered [5].
A further challenge is that commonly used antioxidant-related readouts do not represent the same measurement meaning. ABTS and DPPH radical-scavenging assays quantify concentration-dependent functional responses, whereas total phenolic content (TPC) and total flavonoid content (TFC) assays are compositional abundance proxies associated with antioxidant potential [2,6,7,8,9,10]. Established methods are available for the ABTS decolorization assay [6], the DPPH radical method [7], Folin–Ciocalteu-based phenolic quantification [8], and aluminum chloride colorimetric estimation of flavonoid content [9]. Nevertheless, these outputs are not directly commensurate. ABTS and DPPH reflect potency-like behavior under assay-specific conditions, whereas TPC and TFC reflect abundance-like measures in mass-normalized units and do not directly represent functional radical-scavenging activity at a given concentration [2,8,9,10]. As a result, antioxidant rankings can vary depending on the selected assay, concentration setting, and analytical strategy [3,4].
Extraction and handling conditions add another layer of fragmentation. Solvent composition strongly influences the recovery of antioxidant-related constituents, particularly phenolic and flavonoid fractions, and the same material can therefore yield different readouts under aqueous and hydroalcoholic extraction systems [11]. In addition, preprocessing and post-extraction handling, such as filtration, concentration, drying, and reconstitution, can alter apparent antioxidant values and relative rankings [2,4,11]. Botanical extracts may also introduce matrix-specific interference, including color, turbidity, viscosity, and redox-active background components, which can distort absorbance-based measurements and further reduce cross-sample comparability [2,4]. Inter-laboratory and operator-dependent factors, such as reaction timing, mixing consistency, and plate-reader settings, can introduce additional systematic drift [2,4].
These challenges indicate that the field requires not only protocol-level standardization but also a quantitative representation that enables comparison across heterogeneous readouts without directly mixing incompatible raw units. In this study, we establish an Effect Factor (EF) framework as a unitless comparative index layer for antioxidant referencing under matched experimental conditions. EF is organized into two complementary tracks: potency-type EF and content-type EF. This framework provides a structured basis for organizing large-scale antioxidant datasets under comparable conditions. In contrast to conventional approaches, EF avoids direct unit integration and instead establishes an endpoint-aware comparative structure that preserves functional distinctions while enabling reproducible cross-material benchmarking.
Using a standardized extraction and assay pipeline, we generated EF indices for 586 extracts prepared under water and 30% ethanol conditions and organized them into EF-indexed databases for cross-material comparison and solvent-conditioned profiling. These datasets provide a structured resource for comparative analysis and database expansion under harmonized experimental conditions. Accordingly, this study focuses on establishing an EF-based comparative indexing framework rather than on biological validation or predictive modeling of antioxidant efficacy.
2. Materials and Methods
2.1. Study Design and Workflow Overview
This study was designed to establish a standardized comparative workflow for antioxidant referencing and to develop a unitless Effect Factor (EF) framework that enables cross-material comparison of natural-product extracts and multi-component formulations. A panel of individual herbal medicines (HMs) and representative herbal medicine prescriptions (HMPs) was prepared, and all samples were extracted in parallel under two solvent conditions—water and 30% (v/v) ethanol—to assess solvent-dependent extractability within a unified experimental structure.
To avoid direct mixing of heterogeneous raw assay units, antioxidant-related outputs were organized into two complementary endpoint categories: functional potency-type endpoints and compositional content-type endpoints. Throughout this manuscript, “assay” refers to the experimental procedure (ABTS, DPPH, TPC, and TFC assays), whereas “endpoint” refers to the corresponding assay-derived readout represented in EF space (ABTS EF, DPPH EF, TPC EF, and TFC EF). Potency-type endpoints were measured as concentration-dependent radical-scavenging responses using ABTS and DPPH assays, whereas content-type endpoints were quantified using total phenolic content (TPC) and total flavonoid content (TFC) assays. Because antioxidant-related measurements are assay-dependent and often difficult to compare directly across samples, endpoint-aware interpretation was applied throughout the workflow. Based on this structure, EF values were computed separately as (i) potency-type EF derived from ABTS and DPPH activity profiles and (ii) content-type EF derived from TPC and TFC readouts.
All experimental outputs were then curated into an EF database indexed by sample × solvent × endpoint, enabling standardized ranking, solvent-dependent profiling, and evidence-informed rank-based comparison of candidate materials and formulations. The overall study design and EF workflow are summarized in Figure 1.
Figure 1.
Overview of the EF framework, EF database construction, and applications for standardized antioxidant comparison. Colored modules, circular markers, arrows, and icons are schematic visual aids used to distinguish workflow components and do not indicate additional quantitative categories.
2.2. Herbal Materials and Herbal Medicine Prescriptions
A panel of individual herbal medicines (HMs) and representative herbal medicine prescriptions (HMPs) commonly used in Korean medicine was included in this study. The HM panel comprised 271 individual herbal materials, and the HMP panel comprised 22 representative multi-herb prescriptions. Each HM and HMP was assigned a unique internal sample code to maintain traceability across extraction conditions and antioxidant-related endpoints. The full lists of HMs and HMPs, including sample codes, botanical information, medicinal parts, and prescription composition details, are provided in Supplementary Tables S1 and S2, respectively.
2.2.1. Herbal Medicines (HMs)
All HMs were obtained as dried crude herbal materials from certified suppliers. The materials were authenticated based on standard pharmacognostic criteria [5], and each HM sample was assigned a unique internal sample code to enable consistent tracking throughout extraction and subsequent antioxidant-related assays.
2.2.2. Herbal Medicine Prescriptions (HMPs)
The HMPs consisted of representative multi-herb prescriptions commonly used in Korean medicine. Each prescription was prepared according to predefined composition ratios (Supplementary Table S2). For each HMP, the constituent HMs were weighed according to the specified proportions and mixed prior to extraction to ensure formulation consistency across experimental replicates.
2.3. Standardized Extraction and Sample Preparation
All HM materials and HMPs were extracted using a standardized reflux protocol at a fixed solid-to-solvent ratio of 1:10 (w/v). Extractions were performed in parallel using water or 30% (v/v) ethanol, which are commonly used solvent systems for natural-product extraction and are relevant to regulatory-aligned quality assessment of herbal (crude drug) preparations [11,12]. The 30% (v/v) ethanol condition was included as a representative aqueous ethanol system of intermediate polarity to complement water extraction and to improve recovery of constituents with limited water solubility.
Dried crude materials (or the total mixed crude weight for each prescription) were combined with the extraction solvent and refluxed for 3 h in a single extraction cycle at 100 °C for water or 90 °C for 30% (v/v) ethanol. The extraction time and number of cycles were identical for both solvent conditions. After extraction, samples were cooled to room temperature, filtered to remove insoluble residues, and freeze-dried. The resulting powders were stored in sealed containers until analysis.
For antioxidant assays, each freeze-dried extract (and reference antioxidant, where applicable) was dissolved in dimethyl sulfoxide (DMSO) and diluted with water to prepare stock solutions in a constant vehicle of DMSO:water = 1:1 (v/v). This vehicle was used solely to ensure complete dissolution of crude extracts across the panel and to minimize precipitation during serial dilution while maintaining an identical solvent composition across all samples [13,14,15,16,17]. A sample-free vehicle control (vehicle only; no extract and no reference antioxidant) was prepared in parallel and used as the blank/control solution for baseline correction as appropriate for each assay.
2.4. ABTS Radical Scavenging Assay
ABTS radical-scavenging activity was measured using the ABTS radical cation decolorization method [6]. The ABTS working solution was adjusted to an absorbance of approximately 0.70 at 734 nm. In 96-well plates, 20 µL of each extract dilution was mixed with 180 µL of ABTS working solution and incubated for 30 min at room temperature in the dark. Absorbance was then measured at 734 nm using a microplate reader. Trolox and ascorbic acid were included as reference antioxidants throughout the radical-scavenging assays (Supplementary Table S3).
Vehicle-only wells (containing no extract and no reference antioxidant) were processed in parallel and used as the blank for baseline correction and as the sample-free reference for activity- and potency-related calculations, including RSA and EF-derived metrics, as defined in Supplementary Table S3. Detailed assay conditions and calculation equations are provided in Supplementary Table S3 and Figures S1 and S5.
2.5. DPPH Radical Scavenging Assay
DPPH radical-scavenging activity was determined using the DPPH radical decolorization assay with minor modifications [7]. The DPPH working solution was adjusted to an absorbance of approximately 0.70 at 517 nm. In 96-well plates, 50 µL of each extract dilution was mixed with 200 µL of DPPH working solution and incubated for 30 min at room temperature in the dark. Absorbance was then measured at 517 nm using a microplate reader.
To correct for intrinsic sample absorbance, including sample color or turbidity, matched DPPH-free background wells were prepared by mixing 50 µL of the same extract dilution with 200 µL ethanol in place of the DPPH working solution. Background-corrected values were then used for subsequent calculations. Vehicle-only wells were processed in parallel and used as the blank for baseline correction and as the sample-free reference for activity- and potency-related calculations (Supplementary Table S3). Detailed assay conditions, workflow schematics, and calculation equations are provided in Supplementary Table S3 and Figures S2 and S6.
2.6. Total Phenolic Content (TPC) Assay
Total phenolic content (TPC) was quantified using the Folin–Ciocalteu colorimetric method [8]. Reactions were prepared in 2.0 mL microcentrifuge tubes, and an aliquot of the final reaction mixture was transferred to a 96-well plate for absorbance measurement. Briefly, 100 µL of each extract dilution (or gallic acid standard) was mixed with 300 µL of Folin–Ciocalteu reagent (2 N) and 100 µL water and incubated for 5 min at room temperature in the dark. Next, 500 µL of 8% (w/v) Na2CO3 and 500 µL water were added, followed by incubation for 2 h at room temperature in the dark. Subsequently, 200 µL of the reaction mixture was transferred to a 96-well plate, and absorbance was measured at 765 nm using a microplate reader.
Results were expressed as gallic acid equivalents (GAE, mg/g dry extract) based on a gallic acid calibration curve. A vehicle-only reaction (containing no extract and no standard) processed through the full reagent workflow was used as the reagent blank and as the sample-free reference reaction for content-based and derived indices, including EF-related metrics, as defined in Supplementary Table S3. Detailed assay conditions and calculation equations are provided in Supplementary Table S3 and Figures S3 and S7.
2.7. Total Flavonoid Content (TFC) Assay
Total flavonoid content (TFC) was measured using an aluminum chloride-based colorimetric assay [9]. Reactions were prepared in 2.0 mL microcentrifuge tubes, and an aliquot of the final reaction mixture was transferred to a 96-well plate for absorbance measurement. Briefly, 100 µL of each extract dilution (or quercetin standard) was mixed with 400 µL water and incubated for 5 min at room temperature in the dark. Then, 30 µL of 5% (w/v) NaNO2 and 30 µL of 10% (w/v) AlCl3 were added, followed by incubation for 6 min. Next, 200 µL of 1 N NaOH and 1000 µL water were added, and the mixture was incubated for 30 min at room temperature in the dark. Subsequently, 200 µL of the reaction mixture was transferred to a 96-well plate, and absorbance was measured at 510 nm using a microplate reader.
Results were expressed as quercetin equivalents (QE, mg/g dry extract) based on a quercetin calibration curve. A vehicle-only reaction (containing no extract and no standard) processed through the full reagent workflow was used as the reagent blank and as the sample-free reference reaction for content-based and derived indices, including EF-related metrics, as defined in Supplementary Table S3. Detailed assay conditions and calculation equations are provided in Supplementary Table S3 and Figures S4 and S8.
2.8. Effect Factor (EF): Definition and Step-Score Rules
2.8.1. Effect Factor (EF): Concept and Need for Standardization
Effect Factor (EF) was developed as a dimensionless comparative index for organizing heterogeneous antioxidant-related readouts under matched experimental conditions. Within this framework, potency-type endpoints (ABTS and DPPH) are converted from concentration-dependent functional responses into weighted unitless scores across a predefined dilution ladder, whereas content-type endpoints (TPC and TFC) are converted from mass-normalized compositional measurements into scaled unitless indices using an explicit mapping rule described in Section 2.8.4. Accordingly, EF is not a new antioxidant assay and should not be interpreted as a universal measure of biological effectiveness; rather, it functions as a standardized index layer for endpoint-aware comparison of complex extracts [1,2,3,4,5,11,12,17,18,19,20,21,22,23].
Herbal medicines and complex botanical extracts often exhibit matrix-driven variability, including solubility limits, turbidity or color background, and solvent-dependent behavior, all of which can distort apparent antioxidant readouts and complicate direct comparison across samples and assays [2,3,4,5,17,20,21]. In practice, concentration dependence, assay-specific pitfalls, and non-uniform reporting formats have repeatedly limited inter-sample and inter-study comparability in antioxidant evaluation [2,3,4]. EF was therefore designed to map heterogeneous assay outputs into a common unitless comparison space without directly mixing incompatible raw units, while preserving the distinct analytical meaning of each endpoint [2,3,22,23].
A central principle of the EF framework is that antioxidant-related endpoints do not all represent the same type of information. ABTS and DPPH reflect concentration-dependent functional potency under assay-defined conditions, whereas TPC and TFC represent abundance-oriented compositional proxies rather than direct inhibition-type potency [2,8,9,10]. For this reason, EF adopts a two-track structure consisting of potency-type EF and content-type EF, rather than collapsing heterogeneous outputs into a single undifferentiated antioxidant score. This design enables standardized comparison while preserving endpoint meaning and reducing the interpretive ambiguity that can arise when fundamentally different readouts are treated as directly interchangeable [2,3,4,17,20,21,22,23].
EF was also designed to remain transparent, reproducible, and scalable for database-level organization of large extract panels under harmonized conditions. In the present study, EF supports standardized, comparative analysis, rank-based interpretation, and structured database construction for both single-herb extracts and multi-herb prescriptions. More broadly, this index framework may support future comparative reuse and database expansion when endpoint definitions and experimental conditions are explicitly matched or harmonized [5,12,22,23].
The notation used in Equations (1)–(5) is defined as follows. Let c denote a tested concentration (ppm) within a two-fold dilution ladder between Cmax and Cmin. For inhibition-type endpoints (ABTS and DPPH), let %Effectc denote the background- and blank-corrected percent effect measured at concentration c under the assay-specific procedures described in Section 2.1, Section 2.2, Section 2.3, Section 2.4, Section 2.5, Section 2.6 and Section 2.7. Negative or artifactual corrected effect values were not interpreted as true activity and were floored to zero before EF conversion, as defined below. For content-type endpoints, TPC and TFC denote mass-normalized values expressed as mg gallic acid equivalents (GAE)·g−1 dry extract and mg quercetin equivalents (QE)·g−1 dry extract, respectively. Their mapping into unitless EF space is defined separately in Section 2.8.4.
2.8.2. Upper-Bound Concentration Cmax and Practical Rationale (500 ppm)
For both HM and HMP extracts, the upper-bound test concentration was set to 500 ppm (Cmax = 500 ppm). This concentration was selected as a pragmatic upper bound and a uniform initial concentration for activity evaluation, rather than as a universally optimal concentration for all extract types. Under the present assay conditions, 500 ppm provided a practically workable upper bound that (i) promoted broad solubility and assay compatibility across chemically diverse extracts, (ii) limited solvent burden, particularly from DMSO, and (iii) reduced turbidity- or color-driven absorbance interference in microplate spectrophotometry, all of which are recognized sources of bias in antioxidant measurements and cross-sample comparability [13,14,15,16,17,20,21]. In addition, because DMSO is not always an inert background component and can influence biological or chemical behavior depending on concentration, EF was constructed under an explicit principle of minimizing and matching solvent contribution across samples and solvent blanks, as detailed in Section 2.1, Section 2.2, Section 2.3, Section 2.4, Section 2.5, Section 2.6 and Section 2.7 [15,16,17]. This concentration also functioned as a practical upper bound in the present assay framework, such that extracts showing <40% effect at 500 ppm were not pursued at higher concentrations, thereby supporting efficient and standardized initial comparative evaluation across the full panel.
2.8.3. EF for ABTS and DPPH (Potency-Type Scoring Across a Concentration Ladder)
- (i)
- Fractional effect conversion.
For ABTS and DPPH assays (radical scavenging-type readouts), the corrected percent effect at each concentration was converted into a fractional response, fc, as follows:
Here, max(0,⋯) prevents negative or artifactual corrected effect values from being interpreted as genuine activity. Thus, if the corrected percent effect at a given concentration was negative, it was floored to zero before EF conversion, and the corresponding intermediate EF value at that concentration became 0. This step is aligned with the broader caution that antioxidant readouts can be sensitive to assay conditions, optical interferences, and concentration setting [2,3,4,17,20,21]. ABTS and DPPH assay principles follow the established radical decolorization methods [6,7].
- (ii)
- Step-score (two-fold ladder weighting).
A two-fold concentration ladder was used:
c ∈ {500, 250, 125, 62.5, 31.25, 15.625} ppm
To reflect potency, that is, to reward meaningful effects that persist at lower concentrations, a step-score Sc was assigned such that each two-fold decrease in concentration doubled the score:
This yields Sc = {1, 2, 4, 8, 16, 32} for the concentration set above. This weighting operationalizes the comparative principle that, under matched assay conditions, achieving the same effect at a lower concentration indicates stronger apparent potency and should therefore carry greater weight in EF space [2,3,4,17,20,21].
- (iii)
- Intermediate EF at each concentration.
For each concentration c, an intermediate EF value was computed as:
This construction integrates effect magnitude (“how much”) and dilution-dependent persistence (“how low”) while remaining transparent and unitless [17,20,21].
- (iv)
- Operational stop-rule and final EF selection (40% cutoff; operational and literature-based rationale).
Because antioxidant assays are susceptible to noise amplification, optical or matrix-related artifacts, and concentration-dependent instability, especially near baseline response levels, EF employs an operational cutoff to reduce over-interpretation of weak or unstable signals [17,20,21]. In the present workflow, all extracts were initially evaluated at 500 ppm. Extracts showing a corrected effect of 40% or higher at 500 ppm were then serially evaluated at lower concentrations using the predefined two-fold dilution ladder. Dilution testing was continued until the effect dropped below 40% or the assay-specific lower concentration limit was reached.
Accordingly, a 40% effect cutoff at Cmax was used as the entry criterion for potency-sensitive serial evaluation:
- If the extract showed <40% effect at 500 ppm, the sample was treated as a low-activity regime and the final EF was assigned as EF500, that is, the EF value calculated at the upper-bound evaluation concentration.
- If the extract showed ≥40% effect at 500 ppm, intermediate EF values were calculated across the evaluated dilution range, and the final EF was defined as the maximum EFc obtained among those evaluated concentrations.
Operationally, this rule can be written as:
Here, C denotes the set of concentrations actually evaluated for EF determination under the assay-specific policy described below. This hybrid logic preserves graded information for weakly active samples while enabling potency-sensitive discrimination when meaningful activity is sustained across serial dilution [17,20,21].
- (v)
- Assay-specific Cmin policy for database (DB) EF calculation (ABTS vs. DPPH).
For database-level EF construction, assay-specific minimum concentration limits were applied to the concentration set used for final EF determination. Under this policy, the evaluated concentration set C differed by assay as follows:
- ABTS DB policy: Cmin = 31.25 ppm, corresponding to C = {500, 250, 125, 62.5, 31.25} ppm (with Sc up to 16).
- DPPH DB policy: Cmin = 15.625 ppm, corresponding to C = {500, 250, 125, 62.5, 31.25, 15.625} ppm (with Sc up to 32).
This DB policy was adopted to maintain conservative comparability across the full extract panel and to avoid an analysis tail dominated by near-baseline instability at the lowest concentration step for ABTS under complex extract matrices, while still retaining usable potency discrimination for DPPH at 15.625 ppm [17,20,21]. Accordingly, conditional serial evaluation proceeded along the predefined two-fold dilution ladder described above, but the final EF values stored in the DB were assigned using the assay-specific Cmin policy defined here. Thus, in Equation (4), C denotes the assay-specific concentration set used for final EF determination in each assay. The workflow for determining the final potency-type EF from ABTS and DPPH is summarized in Figure 2.
Figure 2.
Workflow for determining the final potency-type Effect Factor (EF) from ABTS and DPPH assays. Extracts showing <40% effect at 500 ppm were assigned EF500, whereas those showing ≥40% effect were evaluated across the dilution series and assigned the maximum EFc.
2.8.4. EF for TPC and TFC (Content-Type; Unitless Mapping)
Total phenolic content (TPC) and total flavonoid content (TFC) represent compositional abundance rather than inhibition-type potency. Accordingly, content-type EF was defined using a linear unitless mapping of mass-normalized content values, rather than the potency-sensitive dilution-weighting scheme used for ABTS and DPPH. This distinction was adopted to preserve endpoint meaning while allowing TPC- and TFC-derived values to be organized within the same EF framework.
The content-type EF values were calculated as follows:
Under this mapping, 1 EF unit corresponds to 10 mg equivalent·g−1 extract, and 100 EF units correspond to 1000 mg equivalent·g−1. Values greater than 100 were permitted when measured contents exceeded this reference level. This scaling rule was introduced to generate a harmonized unitless index for content-type endpoints and should not be interpreted as percentage inhibition or direct biological effect.
TPC and TFC quantification was based on established colorimetric principles and widely used protocols for total phenolics and flavonoids [8,9,10]. Because content assays may require adaptive dilution or concentration adjustment to remain within calibration and quantification ranges, only values meeting assay linearity criteria, as described in Section 2.1, Section 2.2, Section 2.3, Section 2.4, Section 2.5, Section 2.6 and Section 2.7 and related supplementary assay-condition documentation, were used for EF mapping [8,9,10,17,20,21]. The EF mapping workflow and exclusion criteria for TPC and TFC are summarized in Figure 3.
Figure 3.
Workflow for content-type Effect Factor (EF) calculation and exclusion criteria in TPC and TFC assays. TPC and TFC values were converted into unitless EF values using a linear mapping rule (EFTPC = TPC/10, EFTFC = TFC/10), and only values meeting assay linearity and quantification criteria were retained for EF mapping.
2.8.5. EF as a Standardized Indicator for Data Integration and Modeling
EF was constructed to be transparent, reproducible, and scalable for large panels of herbal ingredients and prescriptions under harmonized assay conditions. Rather than serving as a predictive metric or an efficacy-ranking tool, EF provides standardized, endpoint-aware reference inputs that support comparative interpretation of complex extracts within a matched experimental framework. In the present study, EF functions primarily as a standardized indexing layer for database construction, rank-based comparison, and concordance-oriented interpretation across heterogeneous antioxidant-related endpoints.
Because the EF framework preserves endpoint definitions while converting assay outputs into a common unitless comparison space, these indexed values may also be incorporated into future integrative analytical workflows, provided that endpoint meaning, variability sources, and response comparability are explicitly maintained [18,19]. Such downstream use, however, should be understood as an extension of the present comparative framework rather than as evidence that EF itself constitutes a predictive or biologically validated performance metric.
Accordingly, EF functions in the present study as a practical standardized indicator for comparative antioxidant referencing across complex natural-product matrices, aligning with broader aims of natural-product research, quality control, and evidence organization [1,5,11,12]. Predictive model development, external validation, or biological efficacy validation is not presented in this manuscript and remains a subject for future work.
2.9. EF Database Construction and Organization
EF values were calculated according to the definition, scoring rules, and assay-specific database (DB) policies described in Section 2.8 and were compiled into an EF database for standardized comparative referencing across the full extract panel. Outputs generated from the experimental workflow described in Section 2.1, Section 2.2, Section 2.3, Section 2.4, Section 2.5, Section 2.6 and Section 2.7 were curated under a unified indexing scheme of sample × solvent × endpoint to preserve traceability across extraction conditions and assay-derived readouts. The resulting EF database was organized as a dimensionless indexed dataset that enables standardized ranking and cross-sample comparison without relying on heterogeneous raw assay units [22,23].
Each entry was tracked by its internal sample code and extraction solvent condition (water or 30% (v/v) ethanol), and four EF indices were recorded for downstream analysis: DPPH EF, ABTS EF, TPC EF, and TFC EF. All assays were performed in triplicate using the same extract (technical replicates), and triplicate measurements were summarized as mean values prior to EF calculation and database entry to ensure consistency across the full dataset. The finalized EF database comprised 586 extract entries and served as the unified dataset for the subsequent comparative and concordance analyses described below.
2.10. Statistical Analysis
Statistical analyses were performed using the EF database to summarize concordance among EF indices derived from distinct antioxidant-related endpoints. Pearson’s correlation coefficients (r) were calculated across all extracts (n = 586) for each pair of EF indices (DPPH EF, ABTS EF, TPC EF, and TFC EF) as an internal consistency check within the EF-mapped space. Two-tailed p-values were computed for reference (six pairs; df = n − 2) and are reported as p < 0.001 when highly significant; however, these statistics were not used for hypothesis-driven inference. No missing EF values were present; therefore, n = 586 for all pairwise calculations. Descriptive statistical analyses were performed using Microsoft Excel LTSC MSO, version 16.0.14334.20624, 64-bit (Microsoft Corporation, Redmond, WA, USA).
3. Results
3.1. Study Scope and EF-Indexed Antioxidant Database Overview
Using a standardized extraction and assay workflow, EF indices were generated for a large panel of herbal materials (HMs) and multi-component herbal medicine prescriptions (HMPs) under two solvent conditions (water and 30% ethanol). A unified extraction–assay pipeline, aligned with commonly referenced quality-control and standardization principles for herbal materials and crude drug formulations, was applied to ensure comparability across the full dataset [5,12]. The HM cohort comprised 271 individual herbal materials extracted in parallel under water and 30% ethanol conditions, yielding 542 HM extracts, while the HMP cohort comprised 22 prescriptions extracted under the same two solvent conditions, yielding 44 HMP extracts. Across the combined cohort, EF indices were curated for a total of 586 extracts with no missing EF values.
For each extract, four EF indices corresponding to commonly used antioxidant-related readouts (ABTS, DPPH, total phenolic content (TPC), and total flavonoid content (TFC)) were compiled into reusable EF-indexed databases for cross-material benchmarking. The HM and HMP EF databases are summarized in Table 1 and Table 2, respectively. Raw endpoint outputs underlying EF computation are provided in Supplementary Table S5, enabling traceable reuse, cross-material benchmarking, and iterative database growth under a unified experimental structure [2,3,17].
Table 1.
Effect factor (EF) database for 542 herbal medicine extracts prepared in water and 30% ethanol.
Table 2.
Effect factor (EF) database for 44 herbal medicine prescription extracts prepared in water and 30% ethanol.
3.2. Two-Track EF Indices for Endpoint-Aware Reporting: Potency-Type vs. Content-Type
EF indices were organized into two complementary tracks to avoid mixing heterogeneous endpoint meanings and units. The potency-type track summarizes concentration-dependent radical scavenging activity captured by ABTS EF and DPPH EF, whereas the content-type track summarizes compositional abundance proxies captured by TPC EF and TFC EF [2,3,17].
Because conventional antioxidant comparisons often suffer from endpoint heterogeneity and unit incompatibility, direct aggregation across functional and compositional endpoints was not performed [20,21]. Instead, each endpoint was mapped into a dimensionless EF space and interpreted within its appropriate track, enabling standardized cross-material comparison while avoiding heterogeneous unit mixing [22,23].
This two-track organization supports structured comparison across heterogeneous antioxidant-related endpoints while preserving endpoint-specific interpretability. Definitions and calculation procedures are described in Section 2.8.
3.3. EF-Based Cross-Endpoint Consistency Check Among Four Antioxidant Endpoints
As an internal consistency check for the EF-mapped dataset, pairwise concordance among the four EF indices was summarized across all extracts (n = 586) (Table 3). Overall, all pairwise correlations were positive, indicating that the unitless EF layer preserved broad cross-endpoint comparability while retaining endpoint-specific differences. Within-track concordance was strongest for ABTS EF versus DPPH EF (r = 0.91) and for TPC EF versus TFC EF (r = 0.85), consistent with the two-track organization of the EF framework. Cross-track concordance was also positive but varied by endpoint pair. Notably, TPC EF showed stronger concordance with the potency-type indices (r = 0.87 with DPPH EF; r = 0.93 with ABTS EF) than TFC EF (r = 0.69 with DPPH EF; r = 0.75 with ABTS EF).
Table 3.
Pairwise concordance (Pearson’s r) among the four EF indices across all extracts (n = 586). Internal consistency check within the EF-mapped space; not intended for hypothesis-driven association analysis.
This pattern may partly reflect that TPC captures a broader phenolic-associated compositional dimension across the present extract panel, whereas TFC represents a more specific flavonoid-associated content proxy that does not necessarily parallel concentration-dependent radical-scavenging behavior to the same extent across complex extract matrices.
Rather than collapsing heterogeneous readouts into a single total score, the EF framework preserves the endpoint-specific structure while enabling comparative interpretation within a common unitless indexing space. These concordance patterns therefore support the internal coherence of the EF framework as a comparative indexing system rather than a direct aggregation metric. Collectively, the results indicate that EF retains meaningful differences between endpoint types while enabling structured cross-material comparison within a unified framework.
3.4. Solvent-Dependent Changes in EF Values: DW vs. 30% EtOH
Across the EF-indexed database, paired extracts prepared under water and 30% ethanol conditions showed solvent-dependent shifts in both tracks, indicating that extraction solvent modulated potency-type EF readouts (ABTS EF and DPPH EF) as well as content-type EF readouts (TPC EF and TFC EF) under a matched experimental structure. Importantly, solvent effects were reflected not only in EF magnitude but also in solvent-conditioned rank reordering, which directly affected track-specific candidate ranking and is summarized in the subsequent top-ranked results for HMs and HMPs (Section 3.5 and Section 3.6).
These solvent-dependent shifts indicate that extraction conditions substantially influence comparative antioxidant profiles and should therefore be explicitly considered in EF-based benchmarking analyses.
In many cases, content-type EF values were higher under 30% ethanol extraction than under water extraction, consistent with enhanced recovery of antioxidant-related constituents under hydroalcoholic conditions [11].
3.5. Top-Ranked Herbal Materials (HMs) by Track-Averaged EF Values
To summarize top-performing single-herb materials, HM extracts were ranked by solvent condition (water vs. 30% ethanol) and by track (potency-type vs. content-type) using track-averaged EF values, defined as the mean of the two EF indices within each track. Track-averaged potency-type EF was calculated as the mean of ABTS EF and DPPH EF, whereas track-averaged content-type EF was calculated as the mean of TPC EF and TFC EF. The top five materials under each solvent condition and track are summarized in Table 4.
Table 4.
Top five herbal materials ranked by track-averaged EF values under each solvent condition and track (potency-type: mean of ABTS EF and DPPH EF; content-type: mean of TPC EF and TFC EF). (a) Potency-type EF (dimensionless index). (b) Content-type EF (unitless content-type index used in this study).
In the potency-type track, the top two materials were consistent across solvents (water: Jiyu, 11.08; Gyehyeoldeung, 5.87; 30% ethanol: Jiyu, 11.85; Gyehyeoldeung, 6.54), whereas ranks 3–5 differed between conditions, indicating solvent-conditioned rank shifts within the same EF-based scheme (Table 4a). In the content-type track, Gyehyeoldeung ranked highest under both solvent conditions (water: 38.06; 30% ethanol: 49.61), whereas the remaining top-ranked set differed by extraction condition (Table 4b), reflecting solvent-dependent shifts in composition-linked EF readouts under a fixed experimental structure.
Materials exhibiting high EF values may reflect enrichment of phenolic and other redox-active constituents, consistent with previously reported antioxidant-associated phytochemical profiles.
To visualize within-material solvent shifts without altering the track definitions, Figure 4 presents paired track-averaged EF values for selected high-ranking materials, shown separately for the potency-type (Figure 4a) and content-type (Figure 4b) tracks. The 12 materials were selected from the top-ranked sets across solvent conditions and tracks to enable direct paired comparison within the same material. Accordingly, Figure 4 is intended to illustrate representative solvent-conditioned shifts among high-ranking candidates rather than to provide an exhaustive summary of all ranked materials.
Figure 4.
Paired comparison of track-averaged EF values between water and 30% ethanol for selected high-ranking herbal materials (n = 12), shown separately for the potency-type (a) and the content-type (b) tracks. Materials were selected from the top-ranked sets across solvent conditions and tracks to enable direct within-material comparison of paired values.
3.6. Top-Ranked Herbal Medicine Prescriptions (HMPs) by Track-Averaged EF Values
Using the same ranking scheme applied to single-herb materials, HMP extracts were ranked by solvent condition (water vs. 30% ethanol) and by track (potency-type vs. content-type) using track-averaged EF values, ensuring a fully parallel summary structure between HMs and HMPs. Track-averaged potency-type EF was calculated as the mean of ABTS EF and DPPH EF, whereas track-averaged content-type EF was calculated as the mean of TPC EF and TFC EF. The top five prescriptions under each solvent condition and track are summarized in Table 5.
Table 5.
Top five herbal medicine prescriptions ranked by track-averaged EF values under each solvent condition and track (potency-type: mean of ABTS EF and DPPH EF; content-type: mean of TPC EF and TFC EF). (a) Potency-type EF (dimensionless index). (b) Content-type EF (unitless content-type index used in this study).
In the potency-type track, Hwangryeonhaedoktang ranked highest under both solvent conditions (water: 1.54; 30% ethanol: 1.85). The remaining rank order differed between solvents (water: Jakyakgamchotang, 1.52; Galgeuntang, 1.36; Yukmijihwangtang, 0.98; Socheongryongtang, 0.73; 30% ethanol: Galgeuntang, 1.67; Socheongryongtang, 1.57; Jakyakgamchotang, 1.54; Yukmijihwangtang, 1.05), indicating solvent-conditioned rank shifts within the same EF-based scheme (Table 5a).
In the content-type track, Hwangryeonhaedoktang also ranked highest under both solvent conditions (water: 8.75; 30% ethanol: 10.43), whereas Galgeuntang consistently ranked second (water: 6.03; 30% ethanol: 8.55). The remaining top-ranked prescriptions differed by extraction condition (water: Samsoeum, 4.20; Yukmijihwangtang, 3.95; Jakyakgamchotang, 3.68; 30% ethanol: Socheongryongtang, 5.84; Samsoeum, 5.58; Jakyakgamchotang, 5.56), reflecting solvent-dependent shifts in composition-linked EF readouts under a fixed experimental structure (Table 5b).
In multi-component prescription settings, EF indexing provides a standardized, track-resolved basis for cross-formula comparison under the same experimental structure [17]. This supports consistent interpretation of formulation-level antioxidant profiles within a unified comparative framework.
3.7. Expanded Candidate Landscape Beyond the Tested Dataset: Candidate Materials Shortlisted for Future EF-Based Evaluation
To extend the practical scope of the EF framework beyond the currently tested dataset, supplementary candidate resources were compiled for follow-up EF-based evaluation using literature-informed relevance and practical availability as preliminary selection criteria. These supplementary resources were assembled to support future database expansion and candidate prioritization and should not be interpreted as experimentally confirmed EF rankings in the present study.
Supplementary Table S6 summarizes candidate materials derived from the currently tested dataset under the present EF framework, including higher-ranked materials identified through the current EF-based comparative results. Thus, Supplementary Table S6 reflects candidates emerging from the experimentally evaluated panel and serves as a structured shortlist within the present EF-indexed dataset.
By contrast, Supplementary Table S7 summarizes a separate set of medicinal materials that have not yet been experimentally evaluated in the current EF database but were selectively compiled for future inclusion. Because the range of potentially relevant materials is broader than can be practically tested within a single study, Supplementary Table S7 represents a curated follow-up inventory assembled with essential reference information, including representative scientific names, medicinal parts, origins, and related prescription usage. Accordingly, the materials listed in Supplementary Table S7 should not be interpreted as low-ranking, excluded, or undetected entries within the current dataset, but rather as candidates for future EF-based evaluation.
Together, these supplementary resources distinguish between currently ranked candidates derived from the tested panel (Supplementary Table S6) and curated future-evaluation candidates not yet experimentally assessed (Supplementary Table S7). In this way, they support iterative expansion and practical reuse of the EF database framework as a structured comparative resource for antioxidant evaluation.
4. Discussion
4.1. Key Findings Summary
This study established an Effect Factor (EF) framework and constructed EF-indexed antioxidant databases that enable standardized comparison across a large panel of herbal medicine (HM) extracts and herbal medicine prescription (HMP) extracts under two solvent conditions (water and 30% ethanol) (Table 1 and Table 2). EF indices were organized into a two-track structure, separating potency-type indices derived from ABTS and DPPH assays from content-type indices derived from TPC and TFC assays. Within the EF-mapped space, cross-endpoint concordance among the four EF indices was summarized as an internal consistency check for EF mapping (Table 3). Solvent-dependent profiling further showed condition-specific value shifts and rank reordering, and EF-based comparison enabled structured identification of top-ranked candidates among both single-herb materials and multi-component prescriptions (Figure 4; Table 4 and Table 5). Together, these results provide an EF-indexed dataset and associated summary outputs that can serve as a practical standardization layer for comparative analysis and database expansion under harmonized experimental conditions. Importantly, EF should not be interpreted as a predictive or biological efficacy metric, but rather as a standardized comparative indexing framework for organizing heterogeneous antioxidant-related outputs.
4.2. Why EF Can Serve as a Standard Index Across Heterogeneous Antioxidant Assays
A persistent limitation in antioxidant evaluation of herbal materials is that results are difficult to compare across studies and across endpoints because assays differ in units, reporting scales, and experimental conditions, including concentration-dependent functional readouts and composition-proxy outputs influenced by extraction and assay settings [20,21]. Under such heterogeneity, directly juxtaposing raw values, or aggregating them into a single “total antioxidant” score, can introduce heterogeneous unit mixing and logically ambiguous interpretation because the endpoints quantify different properties rather than interchangeable measurements [20,21]. To address this comparability problem, the EF framework standardizes comparison by mapping endpoint-specific outputs into a common EF index layer, thereby enabling cross-material benchmarking without requiring raw-unit equivalence across assays [2,3,22,23].
Critically, EF was designed as a unitless comparative index layer that harmonizes how results are compared while preserving what each assay means [2,3,22,23]. For this reason, EF explicitly adopts a two-track structure, separating potency-type EF indices (ABTS and DPPH) from content-type EF indices (TPC and TFC), rather than collapsing heterogeneous outputs into a single composite score. This separation is not merely stylistic, but a methodological requirement to avoid merging fundamentally different endpoint meanings within one summary value [2,3,17]. The same logic is particularly relevant for multi-component prescriptions, in which standardized comparison across heterogeneous endpoint outputs is essential for comparative referencing and rank-based comparison within a unified framework [17,22,23].
Collectively, EF provides a practical standardization layer that improves comparability across heterogeneous antioxidant-related endpoints while maintaining endpoint-aware interpretability. In this way, it supports structured database construction, comparative referencing, and scalable reuse under harmonized experimental conditions rather than functioning as a universal antioxidant score or biological efficacy metric [2,3,17,20,21,22,23].
4.3. EF Summarizes Cross-Endpoint Concordance and Supports Practical Validity of the Index Layer
A recurring challenge in antioxidant studies is that endpoint-wise results are difficult to compare and summarize consistently at scale because assays report heterogeneous units and reflect different measurement meanings. By mapping endpoint-specific outputs into a unitless EF layer, the present framework enables cross-endpoint concordance to be examined within a common index space without requiring raw-unit equivalence. In this context, Table 3 provides an EF-space concordance summary across the four EF indices as an internal consistency check for EF mapping rather than as a hypothesis-driven association analysis [24,25]. Unlike IC50-based approaches, which may become unstable under non-monotonic responses frequently observed in complex extracts, EF provides a comparative representation that integrates effect magnitude and dilution-dependent persistence within a standardized index structure.
Importantly, concordance was strongest within each EF track, with the highest agreement observed between ABTS EF and DPPH EF and between TPC EF and TFC EF, consistent with the two-track structure of the framework. Cross-track concordance was also positive but clearly pair-dependent. Notably, TPC EF showed relatively stronger concordance with the potency-type indices than TFC EF, whereas TFC EF remained comparatively less aligned with ABTS EF and DPPH EF. This pattern suggests that, within the present extract panel, TPC captures a broader phenolic-associated compositional dimension that more closely parallels overall radical-scavenging trends, whereas TFC reflects a narrower flavonoid-associated content proxy that does not necessarily track concentration-dependent functional responses to the same extent across complex extract matrices [10,11,17,20,21].
These findings are important because they indicate that EF mapping does not erase endpoint-specific behavior or render all antioxidant-related readouts interchangeable after standardization. Rather, EF preserves meaningful differences among endpoints while placing them in a harmonized comparative space. From a practical perspective, this highlights a key strength of the EF framework: it enables transparent comparison of concordance and divergence among heterogeneous antioxidant-related endpoints without collapsing them into a single undifferentiated “total antioxidant” score. Accordingly, EF-based rankings should be interpreted as comparative outputs within a standardized in vitro framework, not as direct measures of intrinsic antioxidant potency or predictors of biological efficacy. These concordance patterns further support the structural and practical validity of the EF framework as a comparative indexing system, rather than a simple aggregation metric.
4.4. Interpretation of Potency-Type vs. Content-Type Indices
The two-track EF structure reflects that antioxidant-related readouts do not represent a single interchangeable property, but instead capture different dimensions of extract behavior. In the present framework, potency-type EF indices (ABTS EF and DPPH EF) summarize concentration-dependent radical-scavenging responses under assay-defined conditions, whereas content-type EF indices (TPC EF and TFC EF) summarize abundance-oriented compositional proxies associated with phenolic- and flavonoid-related constituents [10,11,17,20,21]. Distinguishing these two tracks is therefore essential for preserving endpoint meaning during standardization.
Importantly, the relationship between the two tracks is expected to be related but not identical. Extracts enriched in phenolic- or flavonoid-associated constituents may show stronger radical-scavenging responses, but functional potency can also be influenced by constituent composition, relative reactivity among compound classes, matrix effects, solubility behavior, and contributions from non-phenolic antioxidants [10,11,17,20,21]. Conversely, high content-type values do not necessarily guarantee proportionally high potency-type performance under a given assay condition, because abundance-oriented indices do not directly measure concentration-dependent functional response. For this reason, EF does not treat potency-type and content-type outputs as redundant alternatives, but rather as complementary dimensions within a standardized comparison framework.
This distinction is particularly important for endpoint-aware interpretation. Potency-type EF is useful for identifying extracts that show stronger operational radical-scavenging responses within the present dilution-based assay system, whereas content-type EF is useful for identifying extracts enriched in phenolic- or flavonoid-associated compositional features. Considered together, the two tracks provide a more informative comparative profile than either track alone while still avoiding inappropriate aggregation of heterogeneous endpoint meanings into a single composite score. In this sense, the two-track design is not merely a reporting format, but a core interpretive principle of the EF framework.
4.5. Solvent Effects: Value Shifts and Rank Reordering as Condition-Specific Ranking
The EF-indexed results show that the extraction solvent functions as a condition-defining factor rather than a neutral preprocessing variable. Across both HM and HMP datasets, shifting from water to 30% ethanol altered EF values in both potency-type and content-type tracks, and these value shifts were accompanied by rank reordering among candidate materials and prescriptions (Figure 4; Table 4 and Table 5). This indicates that EF-based ranking is condition-specific within the present framework rather than fixed independently of the extraction context.
In many cases, 30% ethanol extraction yielded higher content-type EF values than water extraction, consistent with enhanced recovery of phenolic- and flavonoid-associated constituents in hydroalcoholic systems [11]. However, the implications of solvent effects are not limited to absolute EF magnitude. More practically, solvent-dependent changes also influenced relative candidate positions within the ranked outputs. Thus, solvent choice affected not only how strongly a given extract scored, but also how that extract compared with others under the same standardized EF framework.
This point is illustrated by the paired comparisons in Figure 4 and by the top-ranked summaries in Table 4 and Table 5. Some candidates remained highly ranked across both solvent conditions, suggesting relatively robust performance within the present assay structure, whereas others changed substantially in rank depending on the extraction solvent. These patterns should not be interpreted as an inconsistency of the EF framework; rather, they reflect the fact that extraction conditions shape the compositional and functional profiles being compared. Within EF space, such solvent-conditioned differences remain interpretable because both conditions were evaluated under matched workflows and represented within the same standardized index system.
Accordingly, EF-based outputs should be understood as solvent-aware reference results. In practical application contexts, this is an advantage rather than a limitation, because downstream applications often differ in whether aqueous or hydroalcoholic extraction is more relevant. The EF framework therefore supports condition-specific candidate selection by allowing ranked comparison to remain standardized while preserving the influence of the extraction context.
4.6. Practical Utility of EF Databases for Comparative Analysis and Reuse
A central contribution of this study is that the EF-indexed outputs are presented not only as descriptive results, but also as reusable resources for standardized comparative analysis and referencing. The HM and HMP EF databases (Table 1 and Table 2), together with the supplementary candidate resources (Supplementary Tables S6 and S7), provide structured EF profiles across two solvent conditions (water and 30% ethanol) and two complementary tracks (potency-type and content-type). This organization allows users to retrieve endpoint-aware EF values, compare materials under matched conditions, and reproduce rank-based prioritization without directly combining heterogeneous raw assay units [1,17].
From a practical perspective, the EF databases support several application-oriented use cases. First, users can prioritize candidates according to functional response (potency-type EF) or compositional enrichment (content-type EF), depending on the intended application. Second, single-herb materials and multi-component prescriptions can be compared within the same standardized EF space while still preserving endpoint meaning. Third, solvent-conditioned ranking can be applied according to downstream relevance, such as whether aqueous or hydroalcoholic extraction is more appropriate for the intended application or development context (Figure 4; Table 4 and Table 5) [17]. In this sense, the EF framework provides a structured reference layer for candidate selection rather than a one-dimensional ranking scheme.
An additional strength is scalability. Because EF values are indexed under a harmonized sample × solvent × endpoint structure, the database can be expanded by appending additional materials, prescriptions, or replicate lots generated under comparable workflows. This makes the EF framework suitable for iterative database growth rather than one-time reporting. As coverage expands, incorporation of structured metadata, such as origin, processing status, harvest season, or batch information, may further improve interpretability and allow more refined benchmarking while preserving the core principle of endpoint-aware comparison within a common index space [5,12].
Taken together, these features support the practical value of EF indexing as a reusable standardization layer for comparative analysis across complex botanical extracts. The utility of the database lies not in replacing assay-specific interpretation, but in organizing heterogeneous antioxidant-related outputs into a transparent framework that can be queried, compared, and expanded under harmonized experimental settings. Importantly, the EF framework should be interpreted not as a predictive or biological efficacy metric, but as a standardized comparative indexing system that enables reproducible benchmarking and database-level referencing. The EF framework is therefore inherently scalable, provided that additional data are generated under explicitly harmonized experimental conditions and endpoint-specific definitions are preserved. Overall, this design positions EF as a practical and extensible framework for organizing and comparing heterogeneous antioxidant-related data within a unified, endpoint-aware indexing space.
4.7. Limitations and Considerations for External Reproducibility
While EF indexing improves comparability across heterogeneous antioxidant-related endpoints within a harmonized workflow, the present framework should be interpreted within the scope of the current endpoint set and experimental conditions. In this study, EF mapping and database construction were implemented for four representative antioxidant-related readouts—ABTS, DPPH, TPC, and TFC—under two extraction conditions (water and 30% ethanol). Although these endpoints cover widely used functional and compositional measures, they do not exhaust the broader landscape of antioxidant evaluation. Accordingly, the present EF-indexed databases should be understood as a standardized comparative resource within this defined assay and extraction space, rather than as a comprehensive or universally transferable representation of antioxidant behavior across all possible methods and contexts [17,20,21].
A second consideration concerns reproducibility and transferability beyond the present study. The practical strength of EF lies in its ability to organize heterogeneous readouts into a common comparative framework under matched experimental conditions. However, broader cross-study or cross-laboratory comparability still depends on adequate alignment of assay procedures, concentration schemes, solvent handling, and data-processing rules [17,20,21]. For this reason, the current work provides both raw endpoint outputs (Supplementary Table S5) and EF-indexed datasets (Table 1 and Table 2; Supplementary Table S6) to support transparency and reproducible reuse within the scope of the present workflow. Nevertheless, independent replication under comparable protocols and, ideally, inter-laboratory evaluation would further strengthen confidence in the broader transferability of EF-based comparison.
An additional limitation is that herbal materials are intrinsically variable with respect to botanical origin, cultivation environment, harvest season, processing status, and batch quality. Such variability can alter extract composition and consequently influence EF-ranked profiles even when the indexing framework itself remains constant [5,12]. This issue does not negate the value of EF, but it does mean that database entries should be interpreted as condition-bound reference profiles rather than immutable properties of a material. As EF databases expand, incorporation of structured metadata alongside EF values may help address this issue by enabling more stratified benchmarking and more precise comparison across related but non-identical material sources [5,12].
Finally, EF-based rankings should not be interpreted as direct indicators of intrinsic antioxidant efficacy in biological systems. The present framework is designed to support standardized comparison of in vitro antioxidant-related readouts at the extract level, not to replace biological validation or to infer clinical or physiological effectiveness. In this sense, the main limitation of the current work is also a deliberate boundary of the study design: EF is intended to improve comparability and interpretability within a standardized comparative framework, whereas questions of biological translation remain outside the scope of the present manuscript.
4.8. Future Directions: Expanding EF to Additional Endpoints and Broader Application Contexts
Future development of the EF framework can proceed along three practical directions: endpoint expansion, database growth, and broader comparative application contexts. First, EF indexing may be extended to additional antioxidant-related endpoints and assay families, provided that endpoint meaning remains explicit and heterogeneous raw units are not inappropriately merged. In this context, incorporation of complementary redox-oriented or orthogonal antioxidant-relevant readouts may broaden the interpretive range of EF-based comparison while preserving the core principle of endpoint-aware standardization.
Second, the EF databases established in this study are designed to support iterative growth. Additional herbal materials, prescriptions, and replicate lots can be incorporated under harmonized workflows, allowing the database to evolve from a fixed dataset into an expandable comparative resource. As coverage increases, inclusion of structured metadata, such as origin, processing status, harvest season, and batch information, may further improve interpretability and support stratified benchmarking in quality-oriented or comparative application contexts [5,12].
Third, the EF concept may be adaptable to other extract-level bioactivity domains beyond antioxidant-related readouts when assays are conducted under sufficiently comparable conditions and the mapped endpoint meaning is clearly defined. In such cases, EF may provide a useful indexing logic for standardized comparative analysis across heterogeneous extract panels. However, such extensions should be regarded as future applications rather than as conclusions established by the present study.
Accordingly, the most immediate value of the current framework lies in providing a reusable, standardized comparison layer for antioxidant evaluation under matched experimental conditions. Future expansion should therefore focus on broadening endpoint coverage and database scope while maintaining the interpretive discipline that gives EF its practical value. Overall, the EF framework provides a structured approach to the comparability problem in antioxidant evaluation by enabling standardized benchmarking while preserving endpoint-specific interpretation.
5. Conclusions
5.1. Main Conclusions
This study established a unitless Effect Factor (EF) framework for standardized antioxidant referencing across complex natural-product extracts and multi-component formulations. By organizing four widely used antioxidant-related readouts—ABTS, DPPH, total phenolic content (TPC), and total flavonoid content (TFC)—into two complementary tracks (potency-type EF and content-type EF), EF enabled endpoint-aware comparison without direct mixing of heterogeneous raw assay units.
Using a standardized extraction and assay pipeline, we generated EF indices for 586 extracts prepared under water and 30% ethanol conditions and organized them into EF-indexed databases for cross-material comparison and solvent-conditioned profiling. Within these matched experimental conditions, EF supported endpoint-aware concordance analysis, condition-specific rank-based comparison, and standardized organization of heterogeneous antioxidant-related readouts within a common index space.
Importantly, EF should be interpreted not as a predictive or biological efficacy metric, but as a standardized comparative indexing framework that enables reproducible benchmarking while preserving endpoint-specific interpretation.
Taken together, these findings indicate that EF provides a practical comparative framework for antioxidant evaluation by enabling consistent cross-material comparison without compromising analytical meaning.
5.2. Closing Perspective
The EF-indexed database should be viewed as an extensible resource for standardized comparative analysis and database-level referencing under harmonized experimental conditions. Future work may expand EF indexing to additional antioxidant-related endpoints, broader extraction settings, and other bioactivity domains, provided that endpoint meaning remains explicit and heterogeneous unit mixing is avoided.
The EF framework is inherently scalable, provided that additional datasets are generated under explicitly harmonized experimental conditions and consistent endpoint definitions are maintained. At the current stage, EF is intended to support condition-aware comparative analysis and database expansion rather than to predict intrinsic antioxidant efficacy or biological effectiveness in complex biological systems.
Overall, the EF framework provides a reproducible and extensible indexing strategy for organizing heterogeneous antioxidant-related data and may serve as a practical standardization layer for comparative research in natural-product studies.
EF provides a structured solution to the comparability problem in antioxidant evaluation by enabling standardized benchmarking while preserving endpoint-specific interpretation.
Supplementary Materials
The following supporting information can be downloaded at: https://www.mdpi.com/article/10.3390/analytica7020035/s1, Figures S1–S10 provide assay workflows and calculation schemes for ABTS, DPPH, TPC, and TFC, together with database coverage, EF-related workflow summaries, and a translational application roadmap. Tables S1–S5 provide registry and identifier mapping for 271 herbal materials and 22 herbal medicine prescriptions, extraction and assay conditions (reagents, solvents, and key parameters), laboratory consumables, and raw antioxidant assay data supporting EF derivation. Table S6 summarizes EF-ranked candidate outputs and additional candidates derived from the experimentally evaluated dataset. Table S7 lists selected medicinal materials not yet evaluated in the EF database, together with essential reference information for future experimental inclusion.
Author Contributions
Conceptualization, D.-S.K. and Y.R.J.; methodology, Y.R.J. and H.J.Y.; validation, Y.R.J.; formal analysis, Y.R.J.; investigation, Y.R.J.; resources, D.-S.K. and H.J.Y.; data curation, Y.R.J. and H.J.Y.; writing—original draft preparation, Y.R.J.; writing—review and editing, D.-S.K., H.J.Y. and Y.R.J.; visualization, Y.R.J.; supervision, D.-S.K.; project administration, D.-S.K.; funding acquisition, D.-S.K. All authors have read and agreed to the published version of the manuscript.
Funding
This research was supported by the Bio & Medical Technology Development Program of the National Research Foundation of Korea, funded by the Ministry of Science and ICT (grant number 2022M3A9E4084134), and by the Korea Institute of Oriental Medicine (grant number KSN1823312).
Institutional Review Board Statement
Not applicable. This study did not involve human participants or vertebrate animals.
Informed Consent Statement
Not applicable.
Data Availability Statement
All data supporting the findings of this study are provided in the article and its Supplementary Materials. Raw antioxidant assay data used for EF derivation are available in Supplementary Table S5. Material lists, identifier mapping, and experimental and assay conditions are provided in Supplementary Tables S1–S4. EF-ranked candidate outputs derived from the experimentally evaluated dataset are provided in Supplementary Table S6, and selected medicinal materials for future evaluation are summarized in Supplementary Table S7.
Acknowledgments
The authors thank colleagues at the Korea Institute of Oriental Medicine (KIOM) for administrative assistance and technical support during this study.
Conflicts of Interest
The authors declare no conflicts of interest. The funders had no role in the design of the study; in the collection, analyses, or interpretation of data; in the writing of the manuscript; or in the decision to publish the results.
Abbreviations
| ABTS | 2,2′-Azinobis(3-ethylbenzothiazoline-6-sulfonic acid) |
| Cmax | Maximum test concentration |
| Cmin | Minimum test concentration |
| DB | Database |
| DMSO | Dimethyl sulfoxide |
| DPPH | 2,2-diphenyl-1-picrylhydrazyl |
| DW | Distilled water |
| EF | Effect Factor |
| EF500 | Effect Factor at 500 ppm (upper-bound assignment) |
| EtOH | Ethanol |
| FRAP | Ferric reducing antioxidant power |
| GAE | Gallic acid equivalents |
| HM | Herbal medicine |
| HMP | Herbal medicine prescription |
| QE | Quercetin equivalents |
| RSA | Radical scavenging activity |
| TFC | Total flavonoid content |
| TPC | Total phenolic content |
| ppm | Parts per million |
| v/v | Volume/volume |
| df | Degrees of freedom |
References
- Atanasov, A.G.; Zotchev, S.B.; Dirsch, V.M.; Orhan, I.E.; Banach, M.; Rollinger, J.M.; Barreca, D.; Weckwerth, W.; Bauer, R.; Bayer, E.A.; et al. Natural Products in Drug Discovery: Advances and Opportunities. Nat. Rev. Drug Discov. 2021, 20, 200–216. [Google Scholar] [CrossRef]
- Munteanu, I.G.; Apetrei, C. Analytical Methods Used in Determining Antioxidant Activity: A Review. Int. J. Mol. Sci. 2021, 22, 3380. [Google Scholar] [CrossRef]
- Apak, R.; Özyürek, M.; Güçlü, K.; Çapanoğlu, E. Antioxidant Activity/Capacity Measurement. 1. Classification, Physicochemical Principles, Mechanisms, and Electron Transfer (ET)-Based Assays. J. Agric. Food Chem. 2016, 64, 997–1027. [Google Scholar] [CrossRef]
- Floegel, A.; Kim, D.-O.; Chung, S.-J.; Koo, S.I.; Chun, O.K. Comparison of ABTS/DPPH Assays to Measure Antioxidant Capacity in Popular Antioxidant-Rich US Foods. J. Food Compos. Anal. 2011, 24, 1043–1048. [Google Scholar] [CrossRef]
- World Health Organization. Quality Control Methods for Herbal Materials; WHO Press: Geneva, Switzerland, 2011. [Google Scholar]
- Re, R.; Pellegrini, N.; Proteggente, A.; Pannala, A.; Yang, M.; Rice-Evans, C. Antioxidant Activity Applying an Improved ABTS Radical Cation Decolorization Assay. Free Radic. Biol. Med. 1999, 26, 1231–1237. [Google Scholar] [CrossRef]
- Brand-Williams, W.; Cuvelier, M.E.; Berset, C. Use of a Free Radical Method to Evaluate Antioxidant Activity. LWT Food Sci. Technol. 1995, 28, 25–30. [Google Scholar] [CrossRef]
- Singleton, V.L.; Orthofer, R.; Lamuela-Raventós, R.M. Analysis of Total Phenols and Other Oxidation Substrates and Antioxidants by Means of Folin–Ciocalteu Reagent. Methods Enzymol. 1999, 299, 152–178. [Google Scholar] [CrossRef]
- Chang, C.-C.; Yang, M.-H.; Wen, H.-M.; Chern, J.-C. Estimation of Total Flavonoid Content in Propolis by Two Complementary Colorimetric Methods. J. Food Drug Anal. 2002, 10, 178–182. [Google Scholar] [CrossRef]
- Prior, R.L.; Wu, X.; Schaich, K. Standardized Methods for the Determination of Antioxidant Capacity and Phenolics in Foods and Dietary Supplements. J. Agric. Food Chem. 2005, 53, 4290–4302. [Google Scholar] [CrossRef] [PubMed]
- Dai, J.; Mumper, R.J. Plant Phenolics: Extraction, Analysis and Their Antioxidant and Anticancer Properties. Molecules 2010, 15, 7313–7352. [Google Scholar] [CrossRef] [PubMed]
- Korea Ministry of Food and Drug Safety (MFDS). Guidance for Applicants: Questions and Answers on Herbal (Crude Drug) Formulations; MFDS: Osong, Republic of Korea, 2023. (In Korean)
- Balakin, K.V.; Ivanenkov, Y.A.; Skorenko, A.V.; Nikolsky, Y.V.; Savchuk, N.P.; Ivashchenko, A.A. In Silico Estimation of DMSO Solubility of Organic Compounds for Bioscreening. J. Biomol. Screen. 2004, 9, 22–31. [Google Scholar] [CrossRef]
- Tetko, I.V.; Novotarskyi, S.; Sushko, I.; Ivanov, V.; Petrenko, A.E.; Dieden, R.; Lebon, F.; Mathieu, B. Development of Dimethyl Sulfoxide Solubility Models Using 163,000 Molecules: Using a Domain Applicability Metric to Select More Reliable Predictions. J. Chem. Inf. Model. 2013, 53, 1990–2000. [Google Scholar] [CrossRef]
- Fedorka-Cray, P.J.; Cray, W.C., Jr.; Anderson, G.A.; Nickerson, K.W. Bacterial Tolerance of 100% Dimethyl Sulfoxide. Can. J. Microbiol. 1988, 34, 688–689. [Google Scholar] [CrossRef] [PubMed]
- Santos, N.C.; Figueira-Coelho, J.; Martins-Silva, J.; Saldanha, C. Multidisciplinary Utilization of Dimethyl Sulfoxide: Pharmacological, Cellular, and Molecular Aspects. Biochem. Pharmacol. 2003, 65, 1035–1041. [Google Scholar] [CrossRef]
- Apak, R.; Gorinstein, S.; Böhm, V.; Schaich, K.M.; Özyürek, M.; Güçlü, K. Methods of measurement and evaluation of natural antioxidant capacity/activity (IUPAC Technical Report). Pure Appl. Chem. 2013, 85, 957–998. [Google Scholar] [CrossRef]
- Schaich, K.M.; Tian, X.; Xie, J. Hurdles and pitfalls in measuring antioxidant efficacy: A critical evaluation of methods for determining antioxidant activity. J. Funct. Foods 2015, 14, 111–125. [Google Scholar] [CrossRef]
- Dawidowicz, A.L.; Wianowska, D.; Olszowy, M. On Practical Problems in Estimation of Antioxidant Activity of Compounds by DPPH Method (Problems in Estimation of Antioxidant Activity). Food Chem. 2012, 131, 1037–1043. [Google Scholar] [CrossRef]
- Ruzicka, M.C. On dimensionless numbers. Chem. Eng. Res. Des. 2008, 86, 835–868. [Google Scholar] [CrossRef]
- Bezuglyi, B.A.; Ivanova, N.; Sizova, L.V. Transport phenomena and dimensionless numbers: Towards a new methodological approach. Eur. J. Phys. 2017, 38, 033001. [Google Scholar] [CrossRef]
- Tropsha, A. Best Practices for QSAR Model Development, Validation, and Exploitation. Mol. Inform. 2010, 29, 476–488. [Google Scholar] [CrossRef]
- Cherkasov, A.; Muratov, E.N.; Fourches, D.; Varnek, A.; Baskin, I.I.; Cronin, M.; Dearden, J.; Gramatica, P.; Martin, Y.C.; Todeschini, R.; et al. QSAR Modeling: Where Have You Been? Where Are You Going To? J. Med. Chem. 2014, 57, 4977–5010. [Google Scholar] [CrossRef] [PubMed]
- Schober, P.; Boer, C.; Schwarte, L.A. Correlation Coefficients: Appropriate Use and Interpretation. Anesth. Analg. 2018, 126, 1763–1768. [Google Scholar] [CrossRef] [PubMed]
- Taylor, R. Interpretation of the Correlation Coefficient: A Basic Review. J. Diagn. Med. Sonogr. 1990, 6, 35–39. [Google Scholar] [CrossRef]
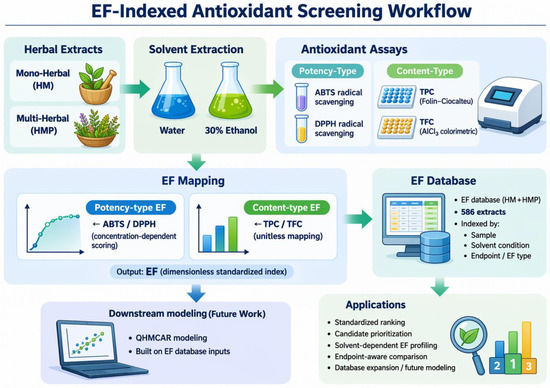
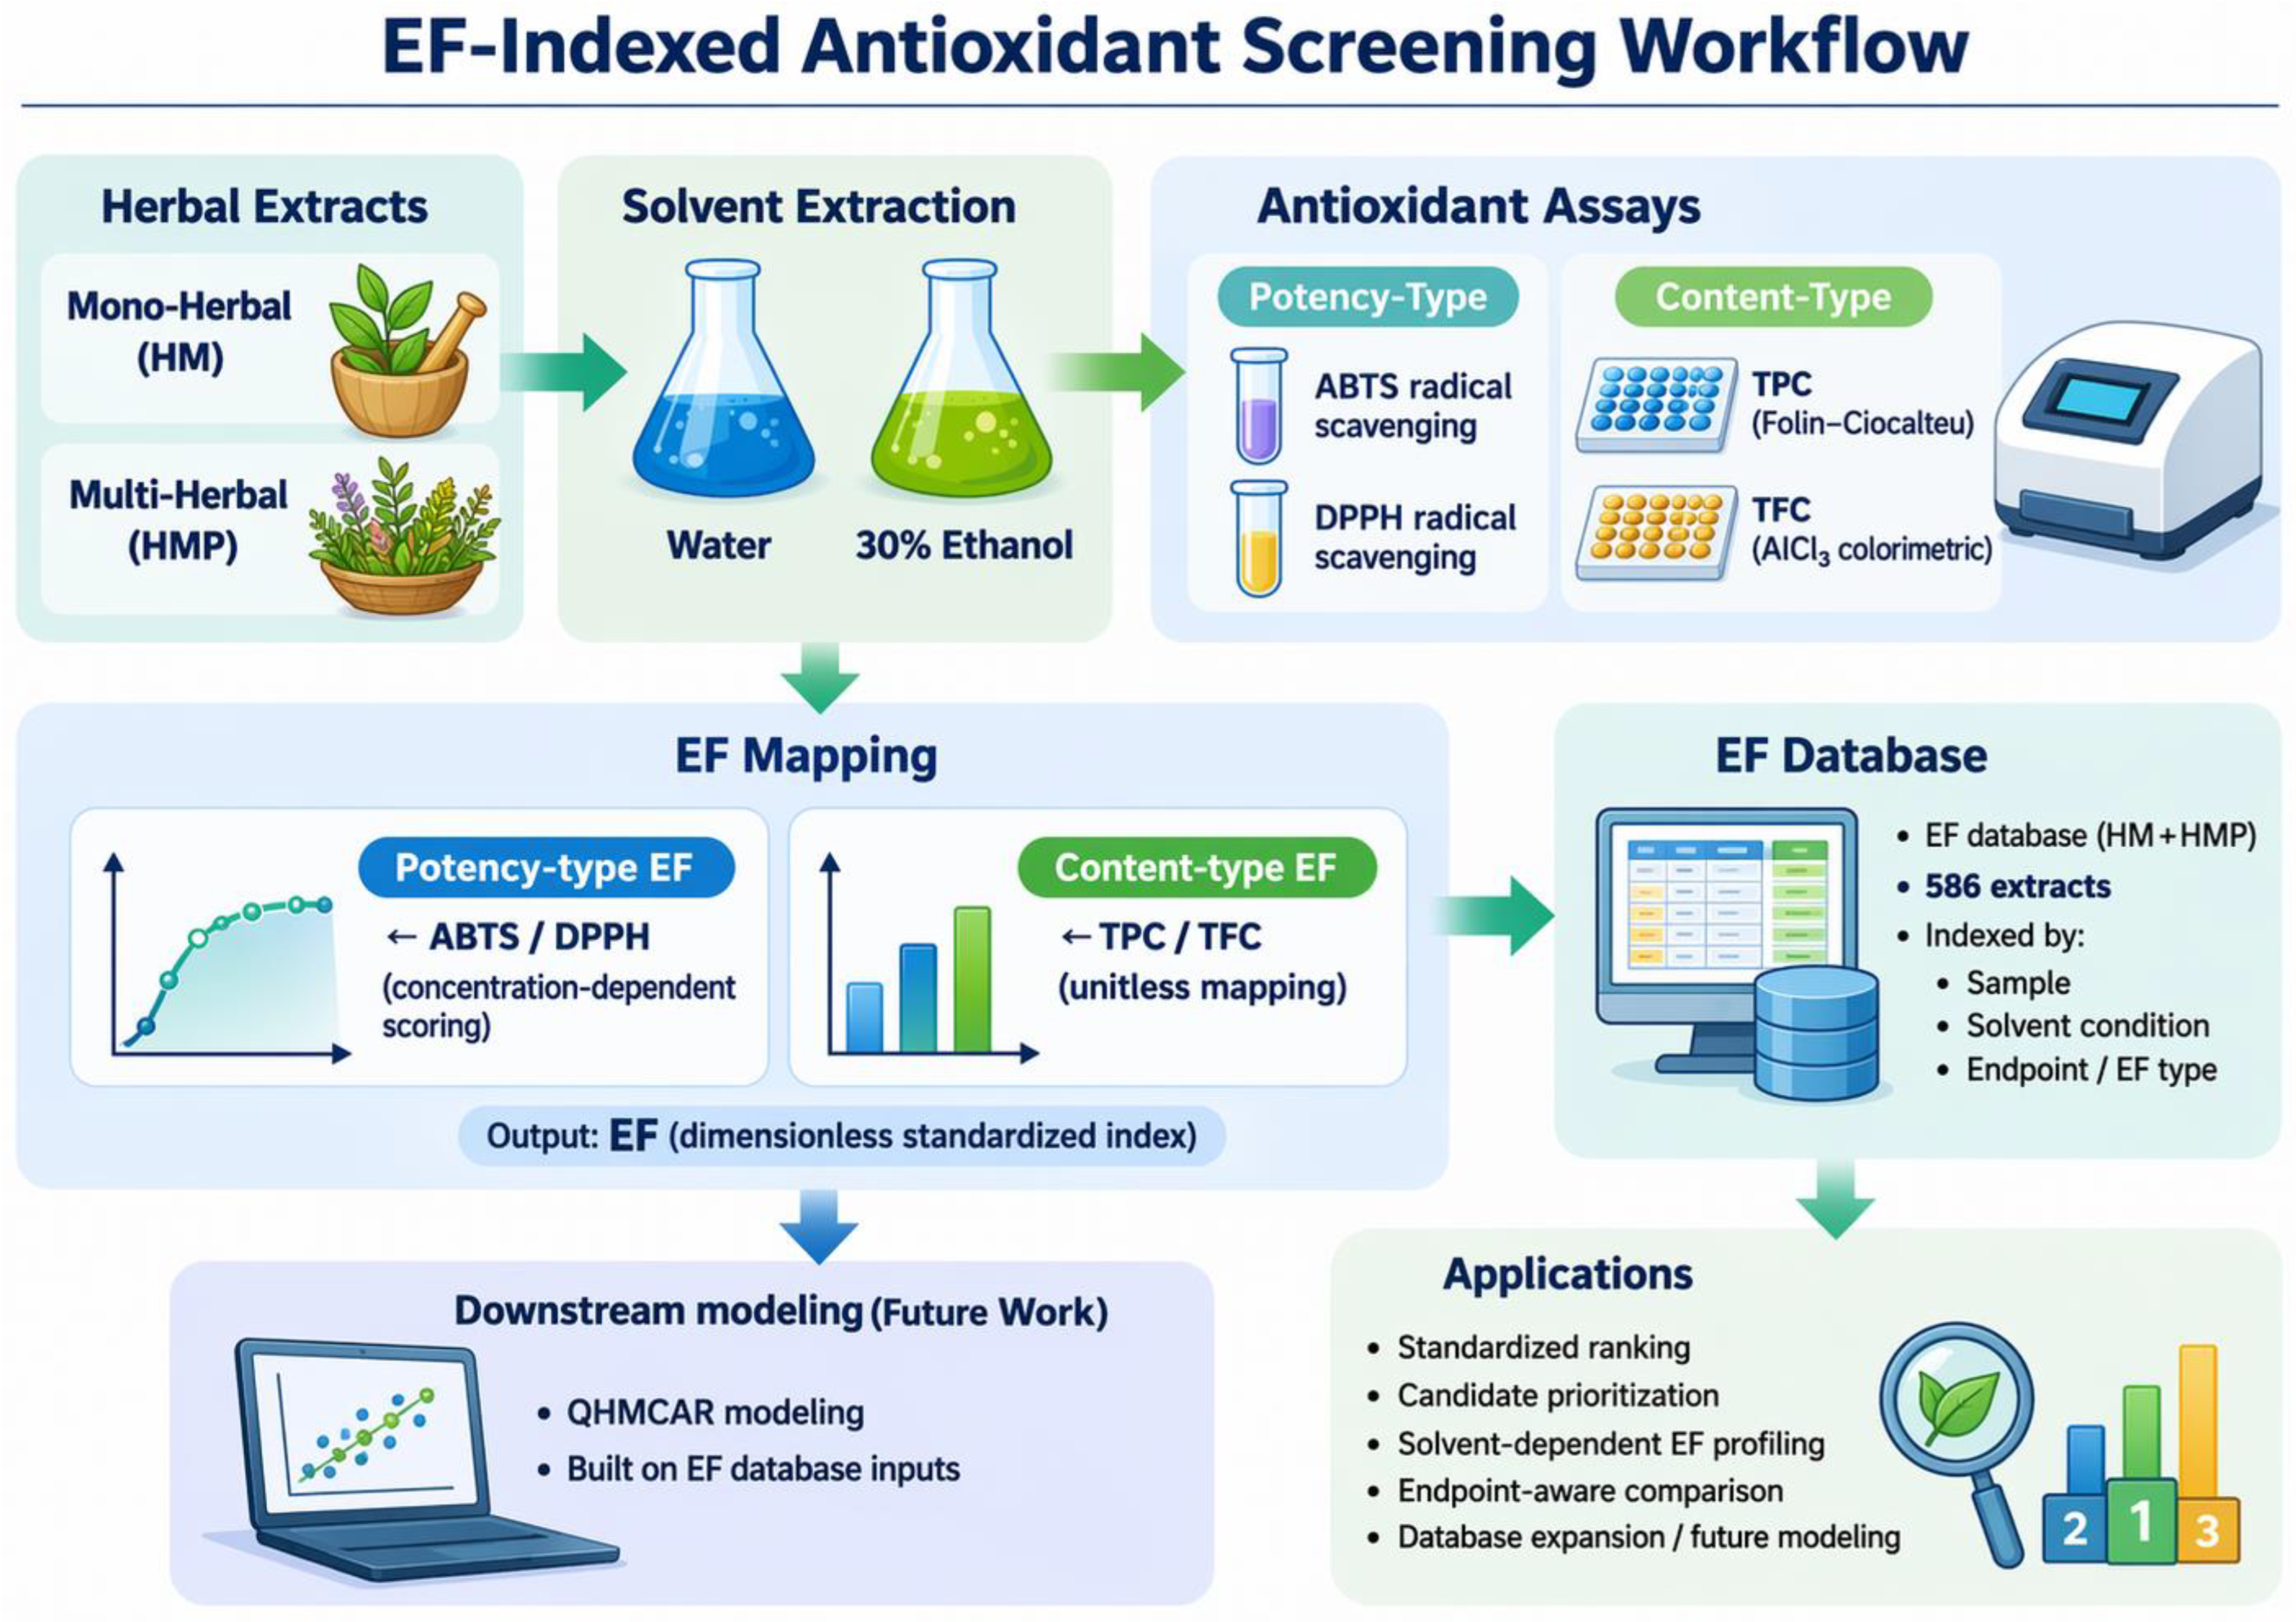
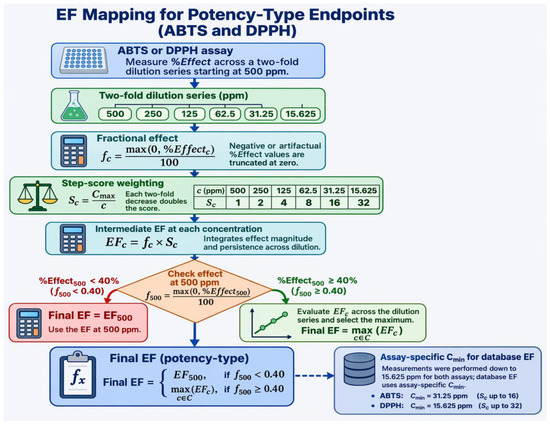
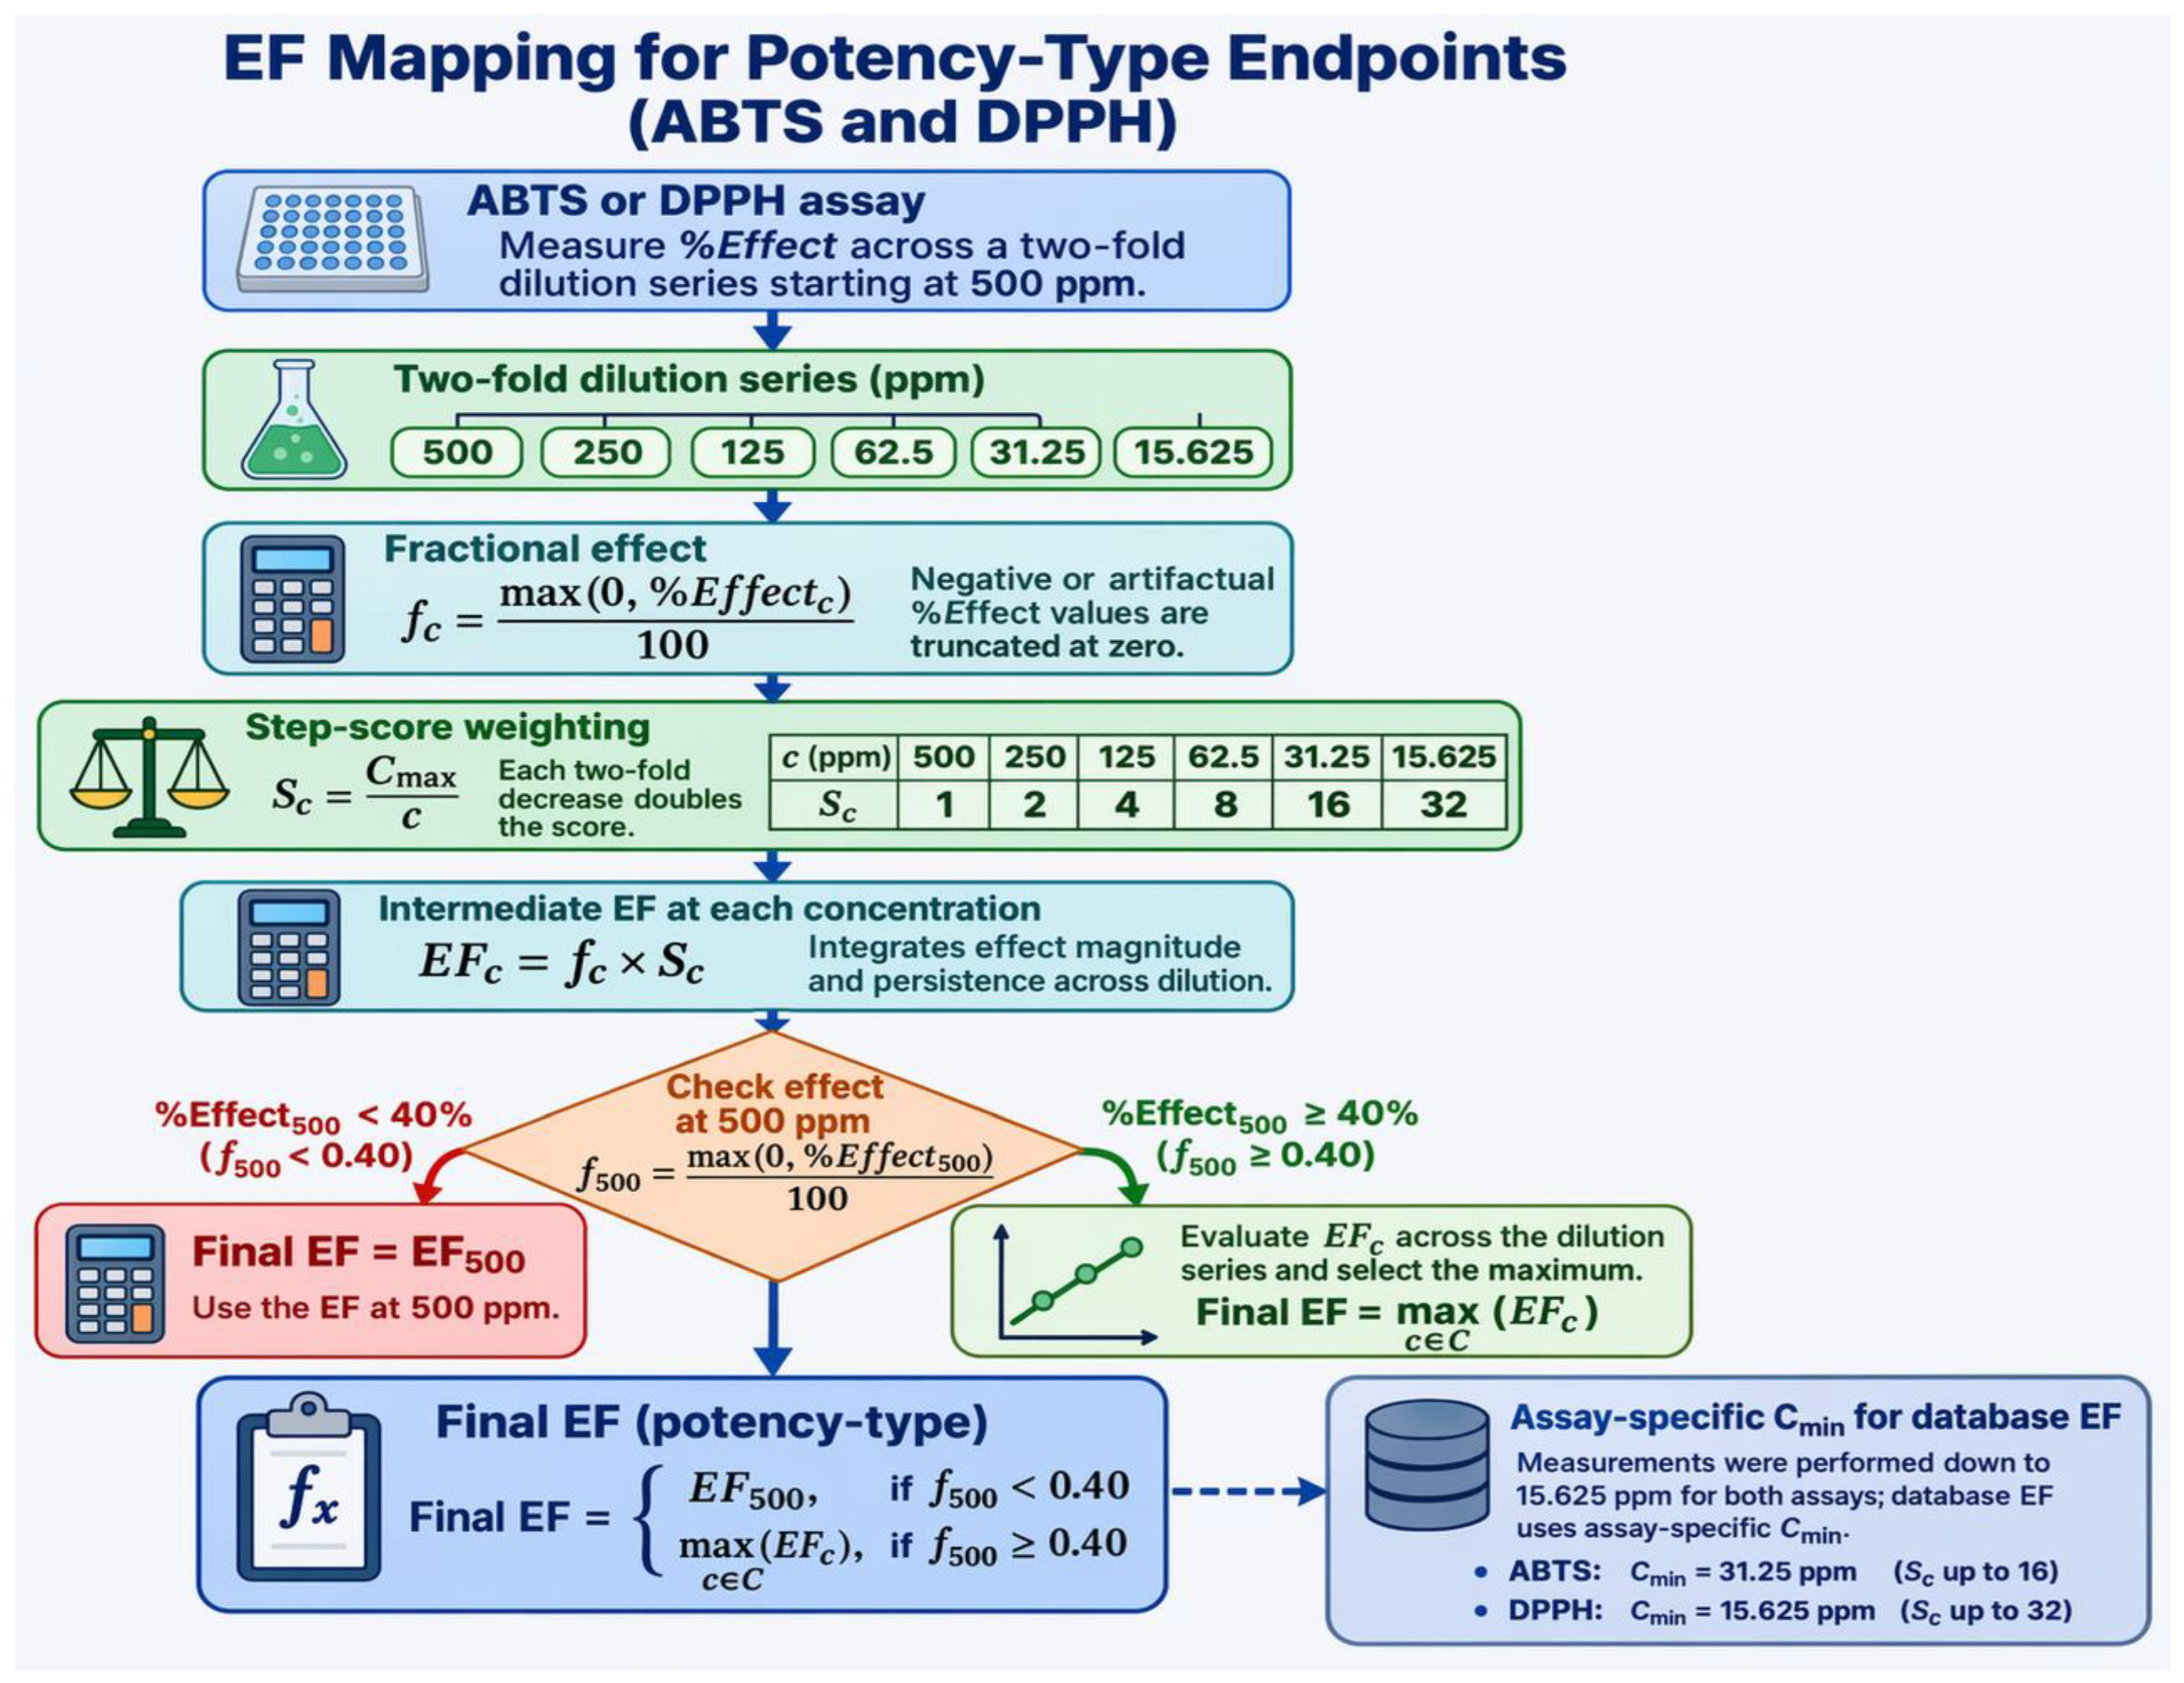
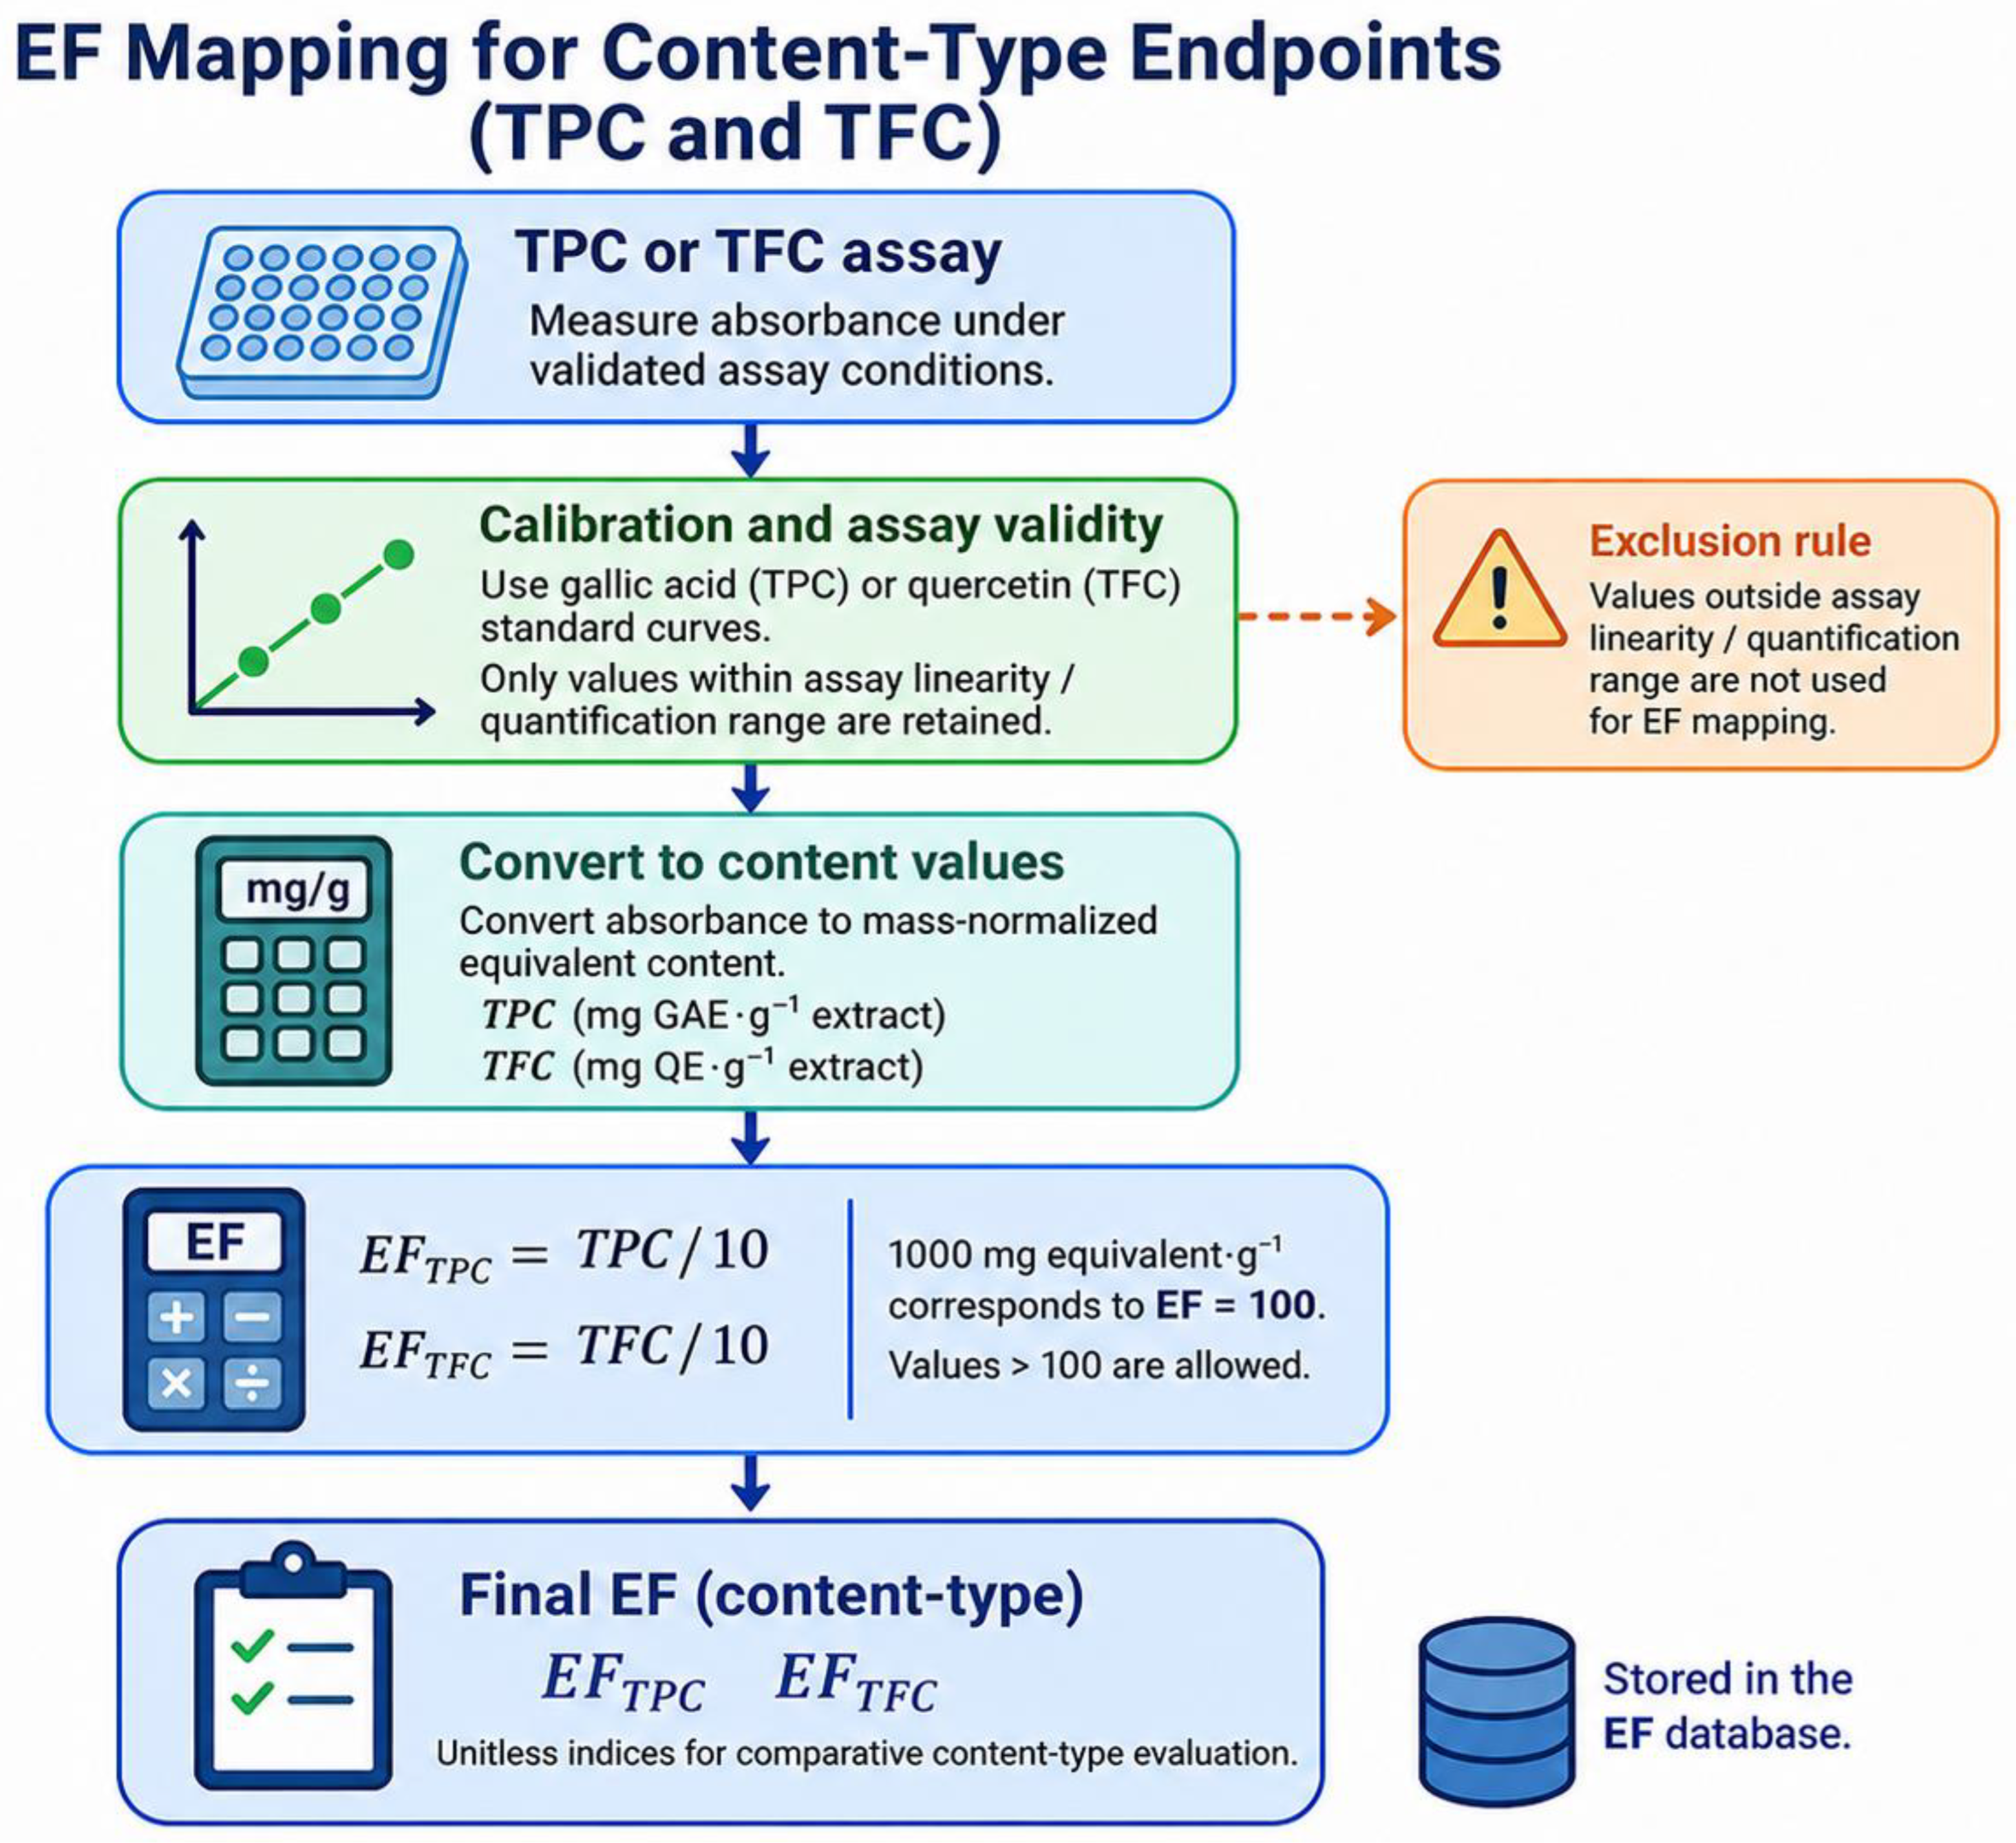
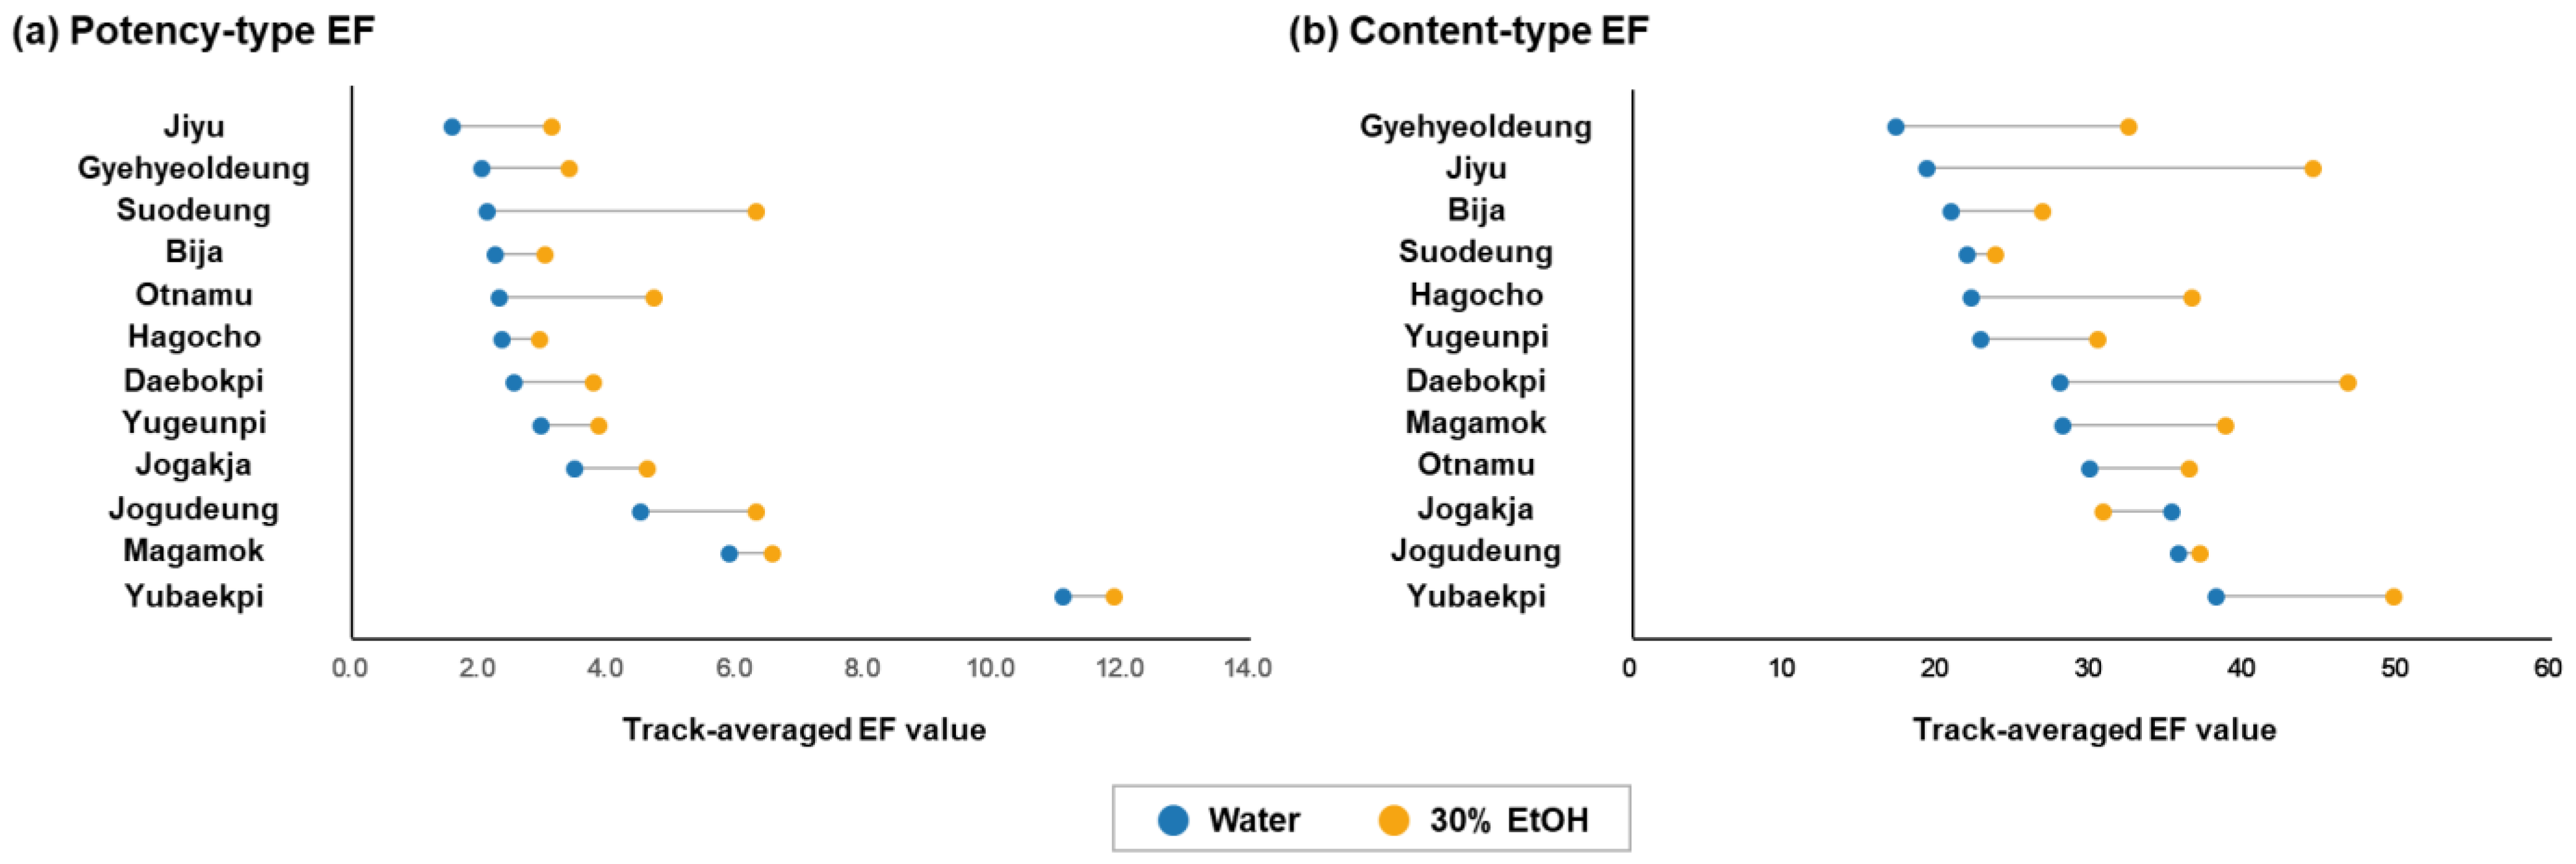

Disclaimer/Publisher’s Note: The statements, opinions and data contained in all publications are solely those of the individual author(s) and contributor(s) and not of MDPI and/or the editor(s). MDPI and/or the editor(s) disclaim responsibility for any injury to people or property resulting from any ideas, methods, instructions or products referred to in the content. |
© 2026 by the authors. Licensee MDPI, Basel, Switzerland. This article is an open access article distributed under the terms and conditions of the Creative Commons Attribution (CC BY) license.