


Abstract
Due to advantages such as larger heat transfer area, higher heat transfer efficiency, and greater thermal expansion stress, helical coiled tubes (HCTs) have been widely adopted in heat exchangers in industry, especially for nuclear power plants. The nucleate boiling heat transfer characteristics within an HCT are investigated using a multi-phase CFD boiling framework implemented and evaluated in this study. Based on the requirement of BPG (Best Practice Guideline) for the CFD applied in the nuclear safety analysis, mesh-independent calculations are performed, including of the heat transfer coefficient and wall temperature along the HCT and the void fraction and secondary flow on the cross-section of the HCT. The effects of various bubble dynamic correlations in the boiling model on the predicted results are also considered. Several previous experiments are adopted to assess the present boiling models, showing the feasibility of the present boiling CFD methodology in predicting the average nucleate boiling heat transfer coefficient along the HCT. Compared with the predicted results from the various heat transfer correlations in the subcooled and saturated nucleate boiling regions, this CFD boiling model can assess these correlations applied in HCT as well as assist in the safety analysis of system codes in selecting the appropriate boiling heat transfer correlations.
1. Introduction
Helical coiled tubes (HCTs) have a larger heat transfer area per unit volume compared with straight tubes and higher efficiency heat transfer capability due to the stronger secondary flow, and can withstand greater thermal expansion stress, among other advantages. As a result, they have been widely adopted in heat exchangers in various industries, including nuclear power plants, solar energy collector systems, heat recovery systems, etc. In nuclear power plants (NPPs), the HCT heat exchanger (HCTHX) is included in the Residual Heat Removal System (RHRS) and the Steam Generator (SG) for Small Modular Reactors (SMRs) such as IRIS [1], CAREM-25 [2], HTR-PM [3], and NuScale [4] etc. Due to the centrifugal/gravitation forces and secondary flow disturbance, the boiling heat transfer characteristics inside the HCT are more complicated than those in the straight tube. Therefore, a boiling heat transfer CFD methodology is developed in this work to investigate the nucleate boiling heat transfer characteristics in HCT. It is crucial to investigate the localized boiling heat transfer characteristics in HCT, which is an essential advantage of CFD work.
Experimental research related to the boiling heat transfer characteristics in HCT was first reviewed. Santini et al. [5] experimentally studied forced boiling in a long full-scale helically coiled tube. The effects of pressure, mass flux, and heat flux on the boiling heat transfer characteristics were considered, and their data revealed that the heat transfer coefficient strongly depended on the mass flux and the heat flux. In addition, based on the comparison of results measured from the experiments and obtained from the seven correlations for straight tubes, they concluded that the curvature effects of HCT on flow boiling are small and negligible. Xiao et al. [6] performed experiments to investigate the boiling heat transfer characteristics within HCTs at high pressure. The effects of heat flux, mass flux and system pressure on boiling heat transfer behavior were discussed in detail. They reported that the heat flux would increase the subcooled/saturated nucleate boiling heat transfer coefficient and had no influence on the saturated convective boiling heat transfer coefficient. According to the assessment of correlations, the results showed that Baburajan’s correlation [7] gave the best prediction in the subcooled boiling region and that Gungor and Winterton’s correlation [8] was suitable for application in the saturated boiling region.
Chang et al. [9] experimentally studied the flow boiling heat transfer (FBHT) in an HCT. The effects of pressures, mass velocities, and heat fluxes on the circumferential wall temperature inhomogeneity (CWTI) were also considered. Their results showed that the wall temperature on the inner side is higher and gradually decreases when moving to the outer side along the circumferential direction. This CWTI varies greatly in the single-phase region, while it is relatively uniform in the boiling region. Su et al. [10] experimentally investigated the onset of nucleate boiling (ONB) and the subcooled boiling heat transfer coefficient in helically coiled tubes. Effects of system pressures, mass fluxes, and heat fluxes were considered. The experimental results indicated that the subcooled boiling heat transfer coefficient would improve upon increasing both heat flux and mass flux. Based on the experimental data and dimensionless analysis, new correlations were proposed for ONB and subcooled boiling heat transfer coefficient within helically coiled tubes.
Su et al. [11] experimentally investigated the saturated flow boiling in HCTs with a large curvature ratio and various operating conditions. Their measured results revealed that the saturated flow boiling heat transfer coefficient (BHTC) increased with the increasing heat flux and the inlet mass flux at a higher quality. However, it was insignificantly affected by the mass flux at a lower quality. Six correlations for the saturated flow boiling were also evaluated, showing that the Gungor–Winterton correlation [8] predicted more effectively for BHCT in the HCT compared to others. Wu et al. [12] experimentally investigated the boiling heat transfer characteristics in helical coils with various values of coil diameter, system pressure, inlet mass flux, and wall heat flux. The measured results revealed that the ONB (onset of nucleate boiling) occurred earlier at higher heat fluxes or lower mass fluxes. The heat transfer was dominated by nucleate boiling with a quality range of 0 < x < 0.6 and by forced convection as x > 0.6.
With regard to the simulation works, Wu et al. [13] developed a separated phase flow model for gas–liquid two-phase boiling heat transfer in a helically coiled tube. This model considered the influence of centrifugal force, gravity, and viscous forces. The calculated results of BHTC were compared with experimental ones. The comparison showed that the error between predictions and measurements was in the range of 32% and 41%. A VOF (Volume of Fraction) model was adopted by Wu et al. [14] to study the two-phase secondary flow characteristics and the heat transfer mechanism in a helically coiled tube (HCT). Their numerical results revealed that the two-phase secondary flows cause a rapid decrease in heat transfer coefficient in the nucleate boiling section, and stabilize the heat transfer coefficient in the convective boiling section. The secondary flow patterns of the subcooled boiling and dry-out section are predicted to be similar.
Wu et al. [15] performed numerical simulation and performance comparison for a helically coiled tube with various tube diameters/pitches and helical radii. Water and water vapor were considered as the heat transfer fluids. The multiphase flow model is a VOF model based on the Euler calculation method, and the phase transfer process model is developed using user-defined function (UDF). The simulation results showed that the maximum value of wall temperature appears in the circumference angle of 120°~180° under the conditions of different heat fluxes. Chen et al. [16] developed a time-domain model for analyzing flow instability in parallel helical coiled tubes. This model had been validated against the experimental data of Shen et al. [17]. Their study showed that thermally perturbed, stably heated tubes exhibit flow oscillations induced by delayed feedback between flow rate and pressure drop. This delayed feedback triggered divergent oscillations in inlet flow as it interacted with sufficiently high heating power. Their findings provide a valuable reference for conducting safety analyses of OTSG (Once Through Steam Generator) in small modular reactors (SMRs).
According to the aforementioned literature review, most CFD simulations for boiling heat transfer in an HCT adopt the VOF model. Although the VOF model excels at tracking explicit bubble interfaces, its extremely high computational cost limits its application to small-scale domains [18]. However, a two-fluid CFD boiling model with the wall heat flux partitioning model (RPI model) [19] and the appropriate correlations of bubble dynamics are used herein to perform full-scale and macro-level thermal–hydraulic assessments efficiently. Simulations with various grid sizes are conducted to verify that the simulation results are mesh-independent, based on the requirements of CFD BPGs (Best Practice Guidelines) [20]. Several previous experimental works [5,6,9] related to the boiling heat transfer in an HCT are adopted to validate the present CFD nucleate boiling methodology. The effects of various bubble dynamic correlations on the predicted results are systematically evaluated. The present validated CFD nucleate boiling methodology can be used to investigate the applicability of various correlations in predicting the boiling heat transfer coefficient in an HCT, providing a systematic evaluation framework since no single correlation for an HCT is universally valid for a wide range of operating conditions. This represents one of the primary contributions of the present simulation work.
2. Mathematical Models and Numerical Treatment
The mathematical models used to investigate the nucleate boiling characteristics in an HCT include the governing equations for each phase, turbulence model, interfacial transfer models, wall boiling heat flux model, and appropriate boundary conditions. These models are described as follows.
2.1. Governing Equations
Continuity equation
where phase density and is the interfacial mass transfer for k phase and can be estimated as
Momentum equation:
where is the interfacial force for k phase and includes the drag force (MD), the lift force (ML), the wall lubrication force (MWL), the turbulent dispersion force (MTD), and the virtual mass force (MVM). That is,
Mk = MD + ML + MWL + MTD + MVM
In this work, the correlations for these interfacial forces are listed in Table 1.
Table 1.
Correlations for the interfacial forces.
Energy equation:
where
can be determined by the turbulence models.
2.2. Turbulence Model
The SST K-omega (SST-Kω) turbulence model [26] is selected since this model is suitable for flow characteristics with adverse pressure gradients and secondary flow, which are essentially the flow characteristics in an HCT.
2.3. Wall Boiling Heat Flux Model
The RPI model [18] is adopted in the present simulations since one of the priorities of this work is to investigate the applicability of this model in low-quality nucleate boiling characteristics within an HCT. The RPI model essentially assumes that the total wall boiling heat flux () consists of the evaporation heat flux () caused by the latent heat of bubble evaporation, the quenching heat flux () caused by the heat removal from the bubble departure, and the convection heat flux () caused by the convection heat transfer to the liquid phase. That is,
where
Here, K is defined based on the formulation by Del Valle and Kenning [27].
= convective heat transfer for the single phase, which can be estimated as
= wall temperature.
= near-wall liquid temperature.
In addition, two sets of correlations are adopted for bubble dynamics, including the bubble departure diameter (Dd), the active nucleate site density (nA), and the bubble departure frequency (fd), listed in Table 2. These two sets of correlations are commonly used for boiling heat transfer simulation by CFD. As described in the Introduction, sensitivity calculations using various bubble dynamic correlations are considered herein.
Table 2.
Bubble dynamic correlations.
2.4. Boundary Conditions
Three experimental works [5,6,9] measuring the boiling heat transfer characteristics for an HCT with constant heat flux are adopted to validate the present CFD nucleate boiling methodology. All dimensions of HCTs in these experiments and their test conditions are listed in Table 3 and Table 4, respectively. As revealed in Table 4, the constant heat flux is set at the tube wall; the inlet mass flux and temperature are set at the tube inlet; and the pressure is set at the tube outlet.
Table 3.
Dimensions for all the simulation cases.
Table 4.
Test conditions for all the simulation cases.
2.5. Numerical Treatments
The above equations for describing the boiling heat transfer characteristics in an HCT are essentially non-linear partial differential equations (PDEs), and should be discretized into the discrete forms using the finite-difference (or finite-volume) method for numerical calculations. The second-order upwind scheme is adopted to treat the convection terms in these PDEs and the least-squares cell-based scheme is used for the diffusion terms. The two-phase COUPLE scheme [18] is adopted herein to solve the finite difference equations for velocities coupled with pressure. The Algebraic MultiGrid (AMG) linear solver is adopted for all finite differencing equations.
All of the simulations presented in this paper were performed using FLUENT [18] on a PC with an Intel® Core i9-12900 K cpu (Intel Corporation, Santa Clara, CA, USA). The numerical calculation for the typical case needs approximately 3 h of computing time. The convergence criteria for all of the governing equations were set such that the summation of the relative residual in every control volume is less than . The decay trend in the residual plot for each equation is also considered as an alternative criterion. Both of these criteria should be met to ensure the convergence of the numerical simulations.
3. Results and Discussion
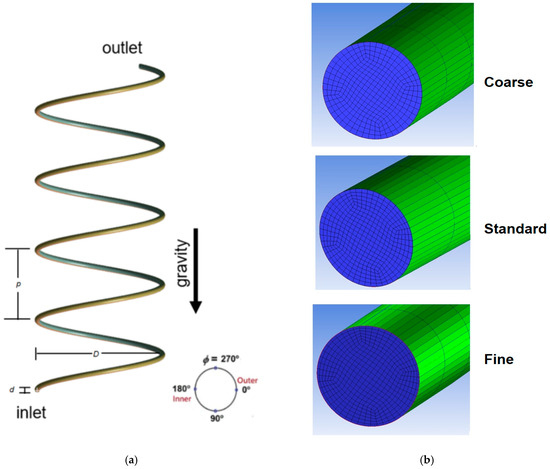
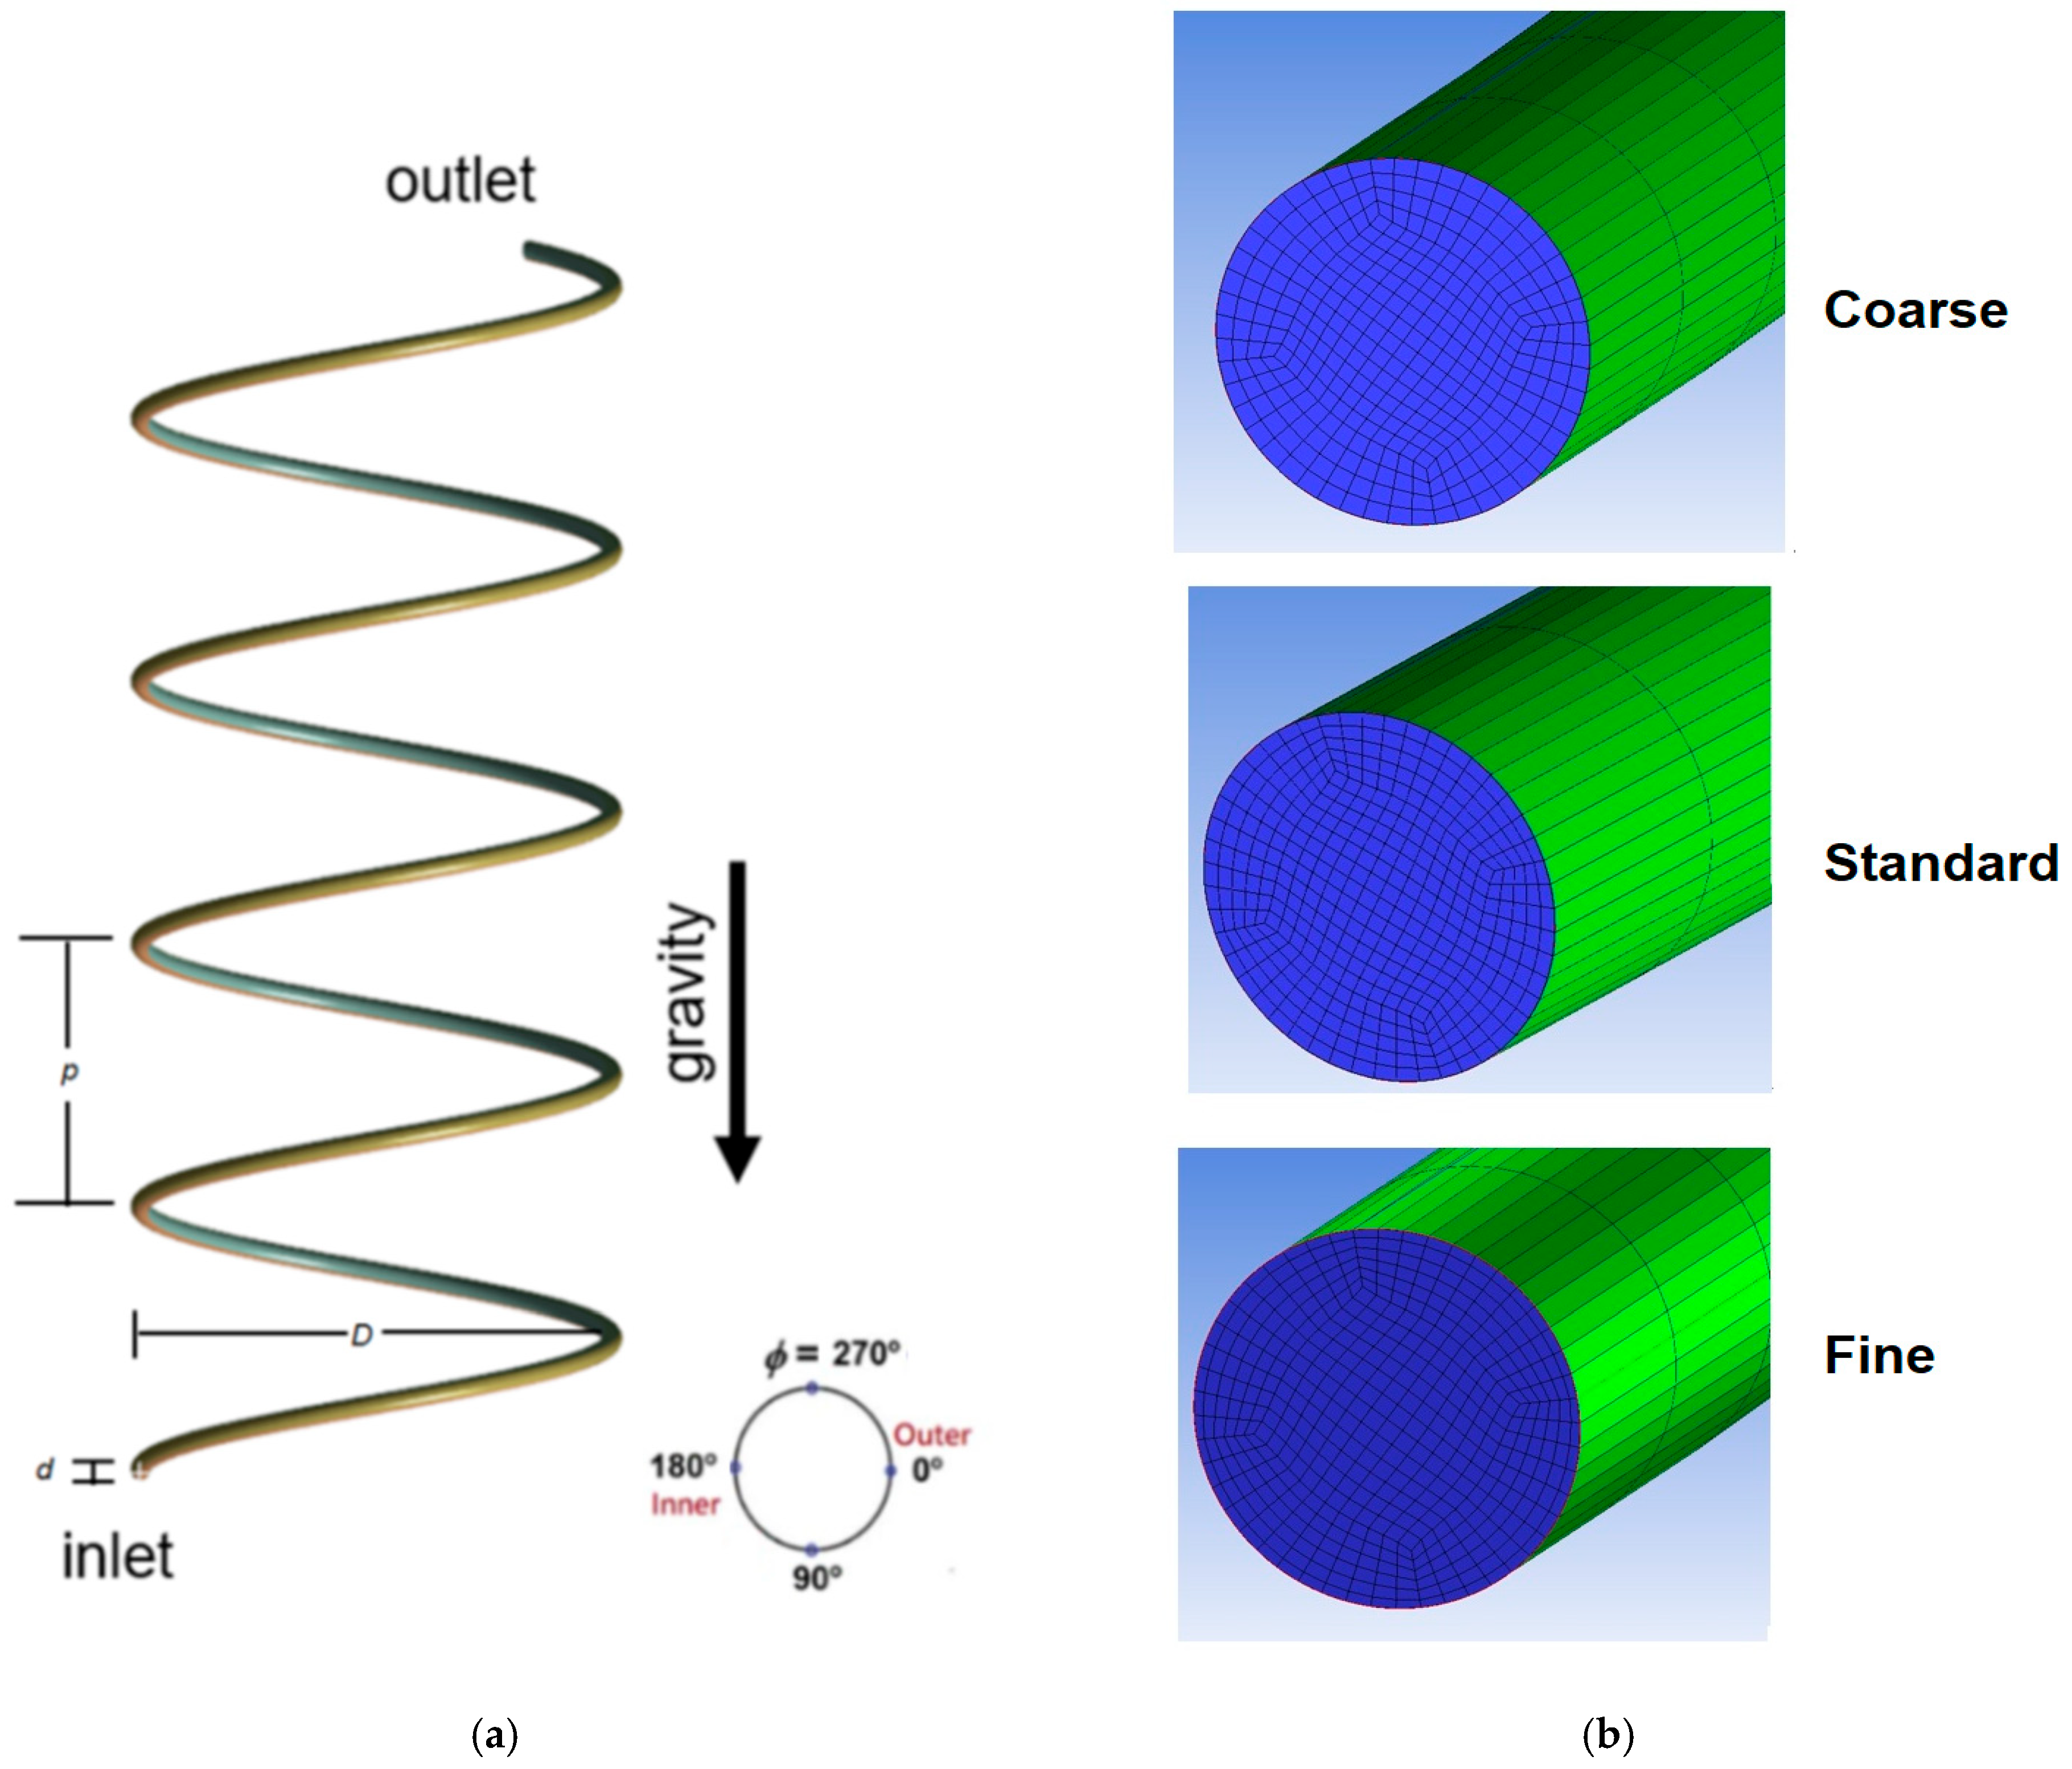
As outlined in the aforementioned descriptions, the boiling heat transfer characteristics for an HCT from three experimental works [5,6,9] were used for the model benchmark. The layout of the HCT for the test work by Xiao et al. [6] is schematically shown in Figure 1a. The corresponding mesh models with coarse, standard, and fine grids on the cross-section of HCT are, respectively, indicated in Figure 1b. Detailed observation of Figure 1b shows that the structured grids are set near the tube wall based on the requirement of the CFD BPGs [19] for the nuclear safety analysis. In addition, mesh-independent calculations also need to be conducted. These mesh models with the grid numbers are set on the cross-section of HCT and those for the total numbers of solution domain and the y+ range near the wall are illustrated in Table 5. Specifically, a y+ range of 30 to 50 is selected to comply with the two-phase logarithmic wall function requirements within the RPI framework [33].
Figure 1.
(a) Layout of HCT for the test work by Xiao et al. [6]; (b) corresponding grid models with coarse, standard, and fine grids on the cross-section of HCT.
Table 5.
Mesh models.
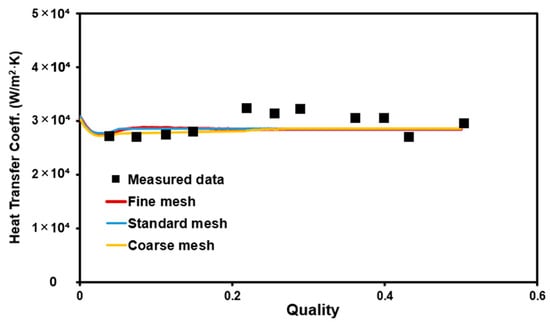
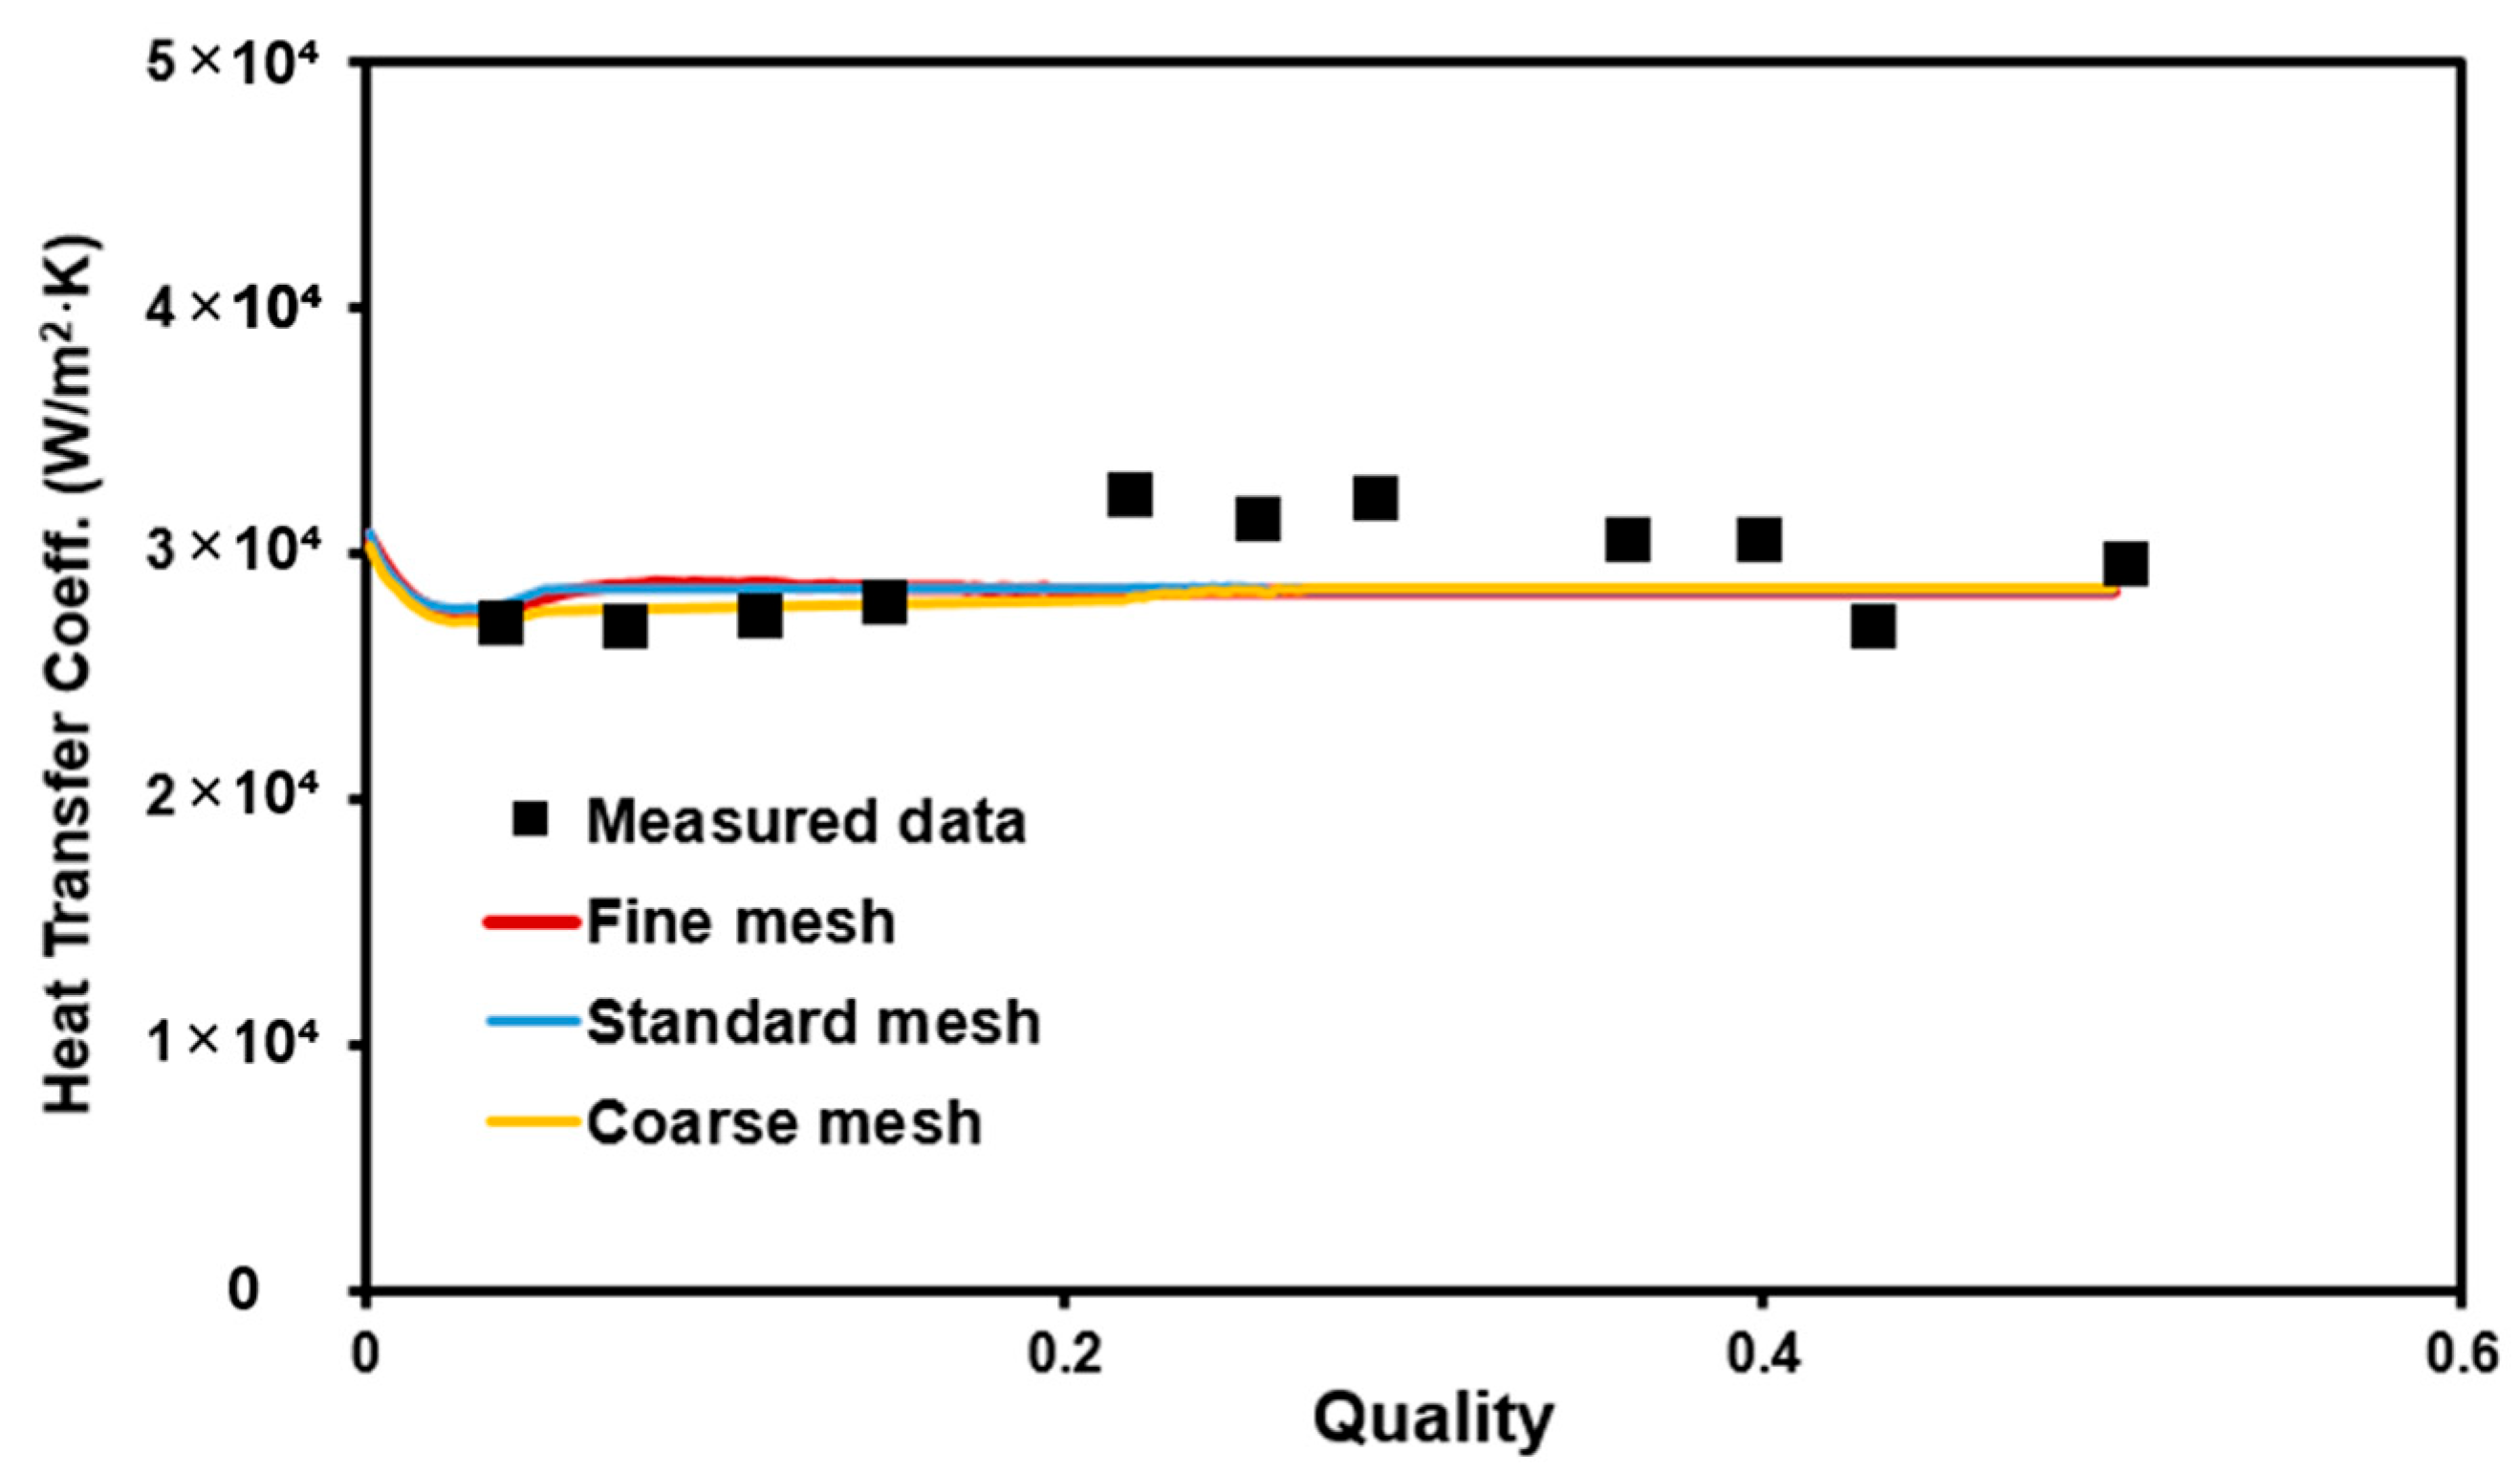
Uniform grids were applied along the HCT at an interval of 12.5° per helical coil. Figure 2 shows the nucleate boiling heat transfer coefficient (hTP) versus quality (x) predicted using the present CFD models at various mesh sizes (see Supplementary Materials for the detailed comparison data). The dots are the measured data of hTP under the saturated boiling region from the work by Xiao et al. [6]. This Figure clearly reveals that the predicted results from the standard and fine mesh models are almost the same and that the results using the standard mesh can be considered to be mesh-independent, with a Mean Absolute Percentage Error (MAPE) of 6.422% for the standard mesh configuration.
Figure 2.
Comparison of predicted nucleate boiling heat transfer coefficient vs. quality using various mesh sizes.
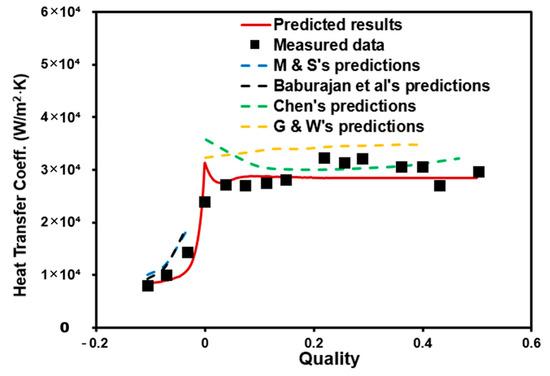
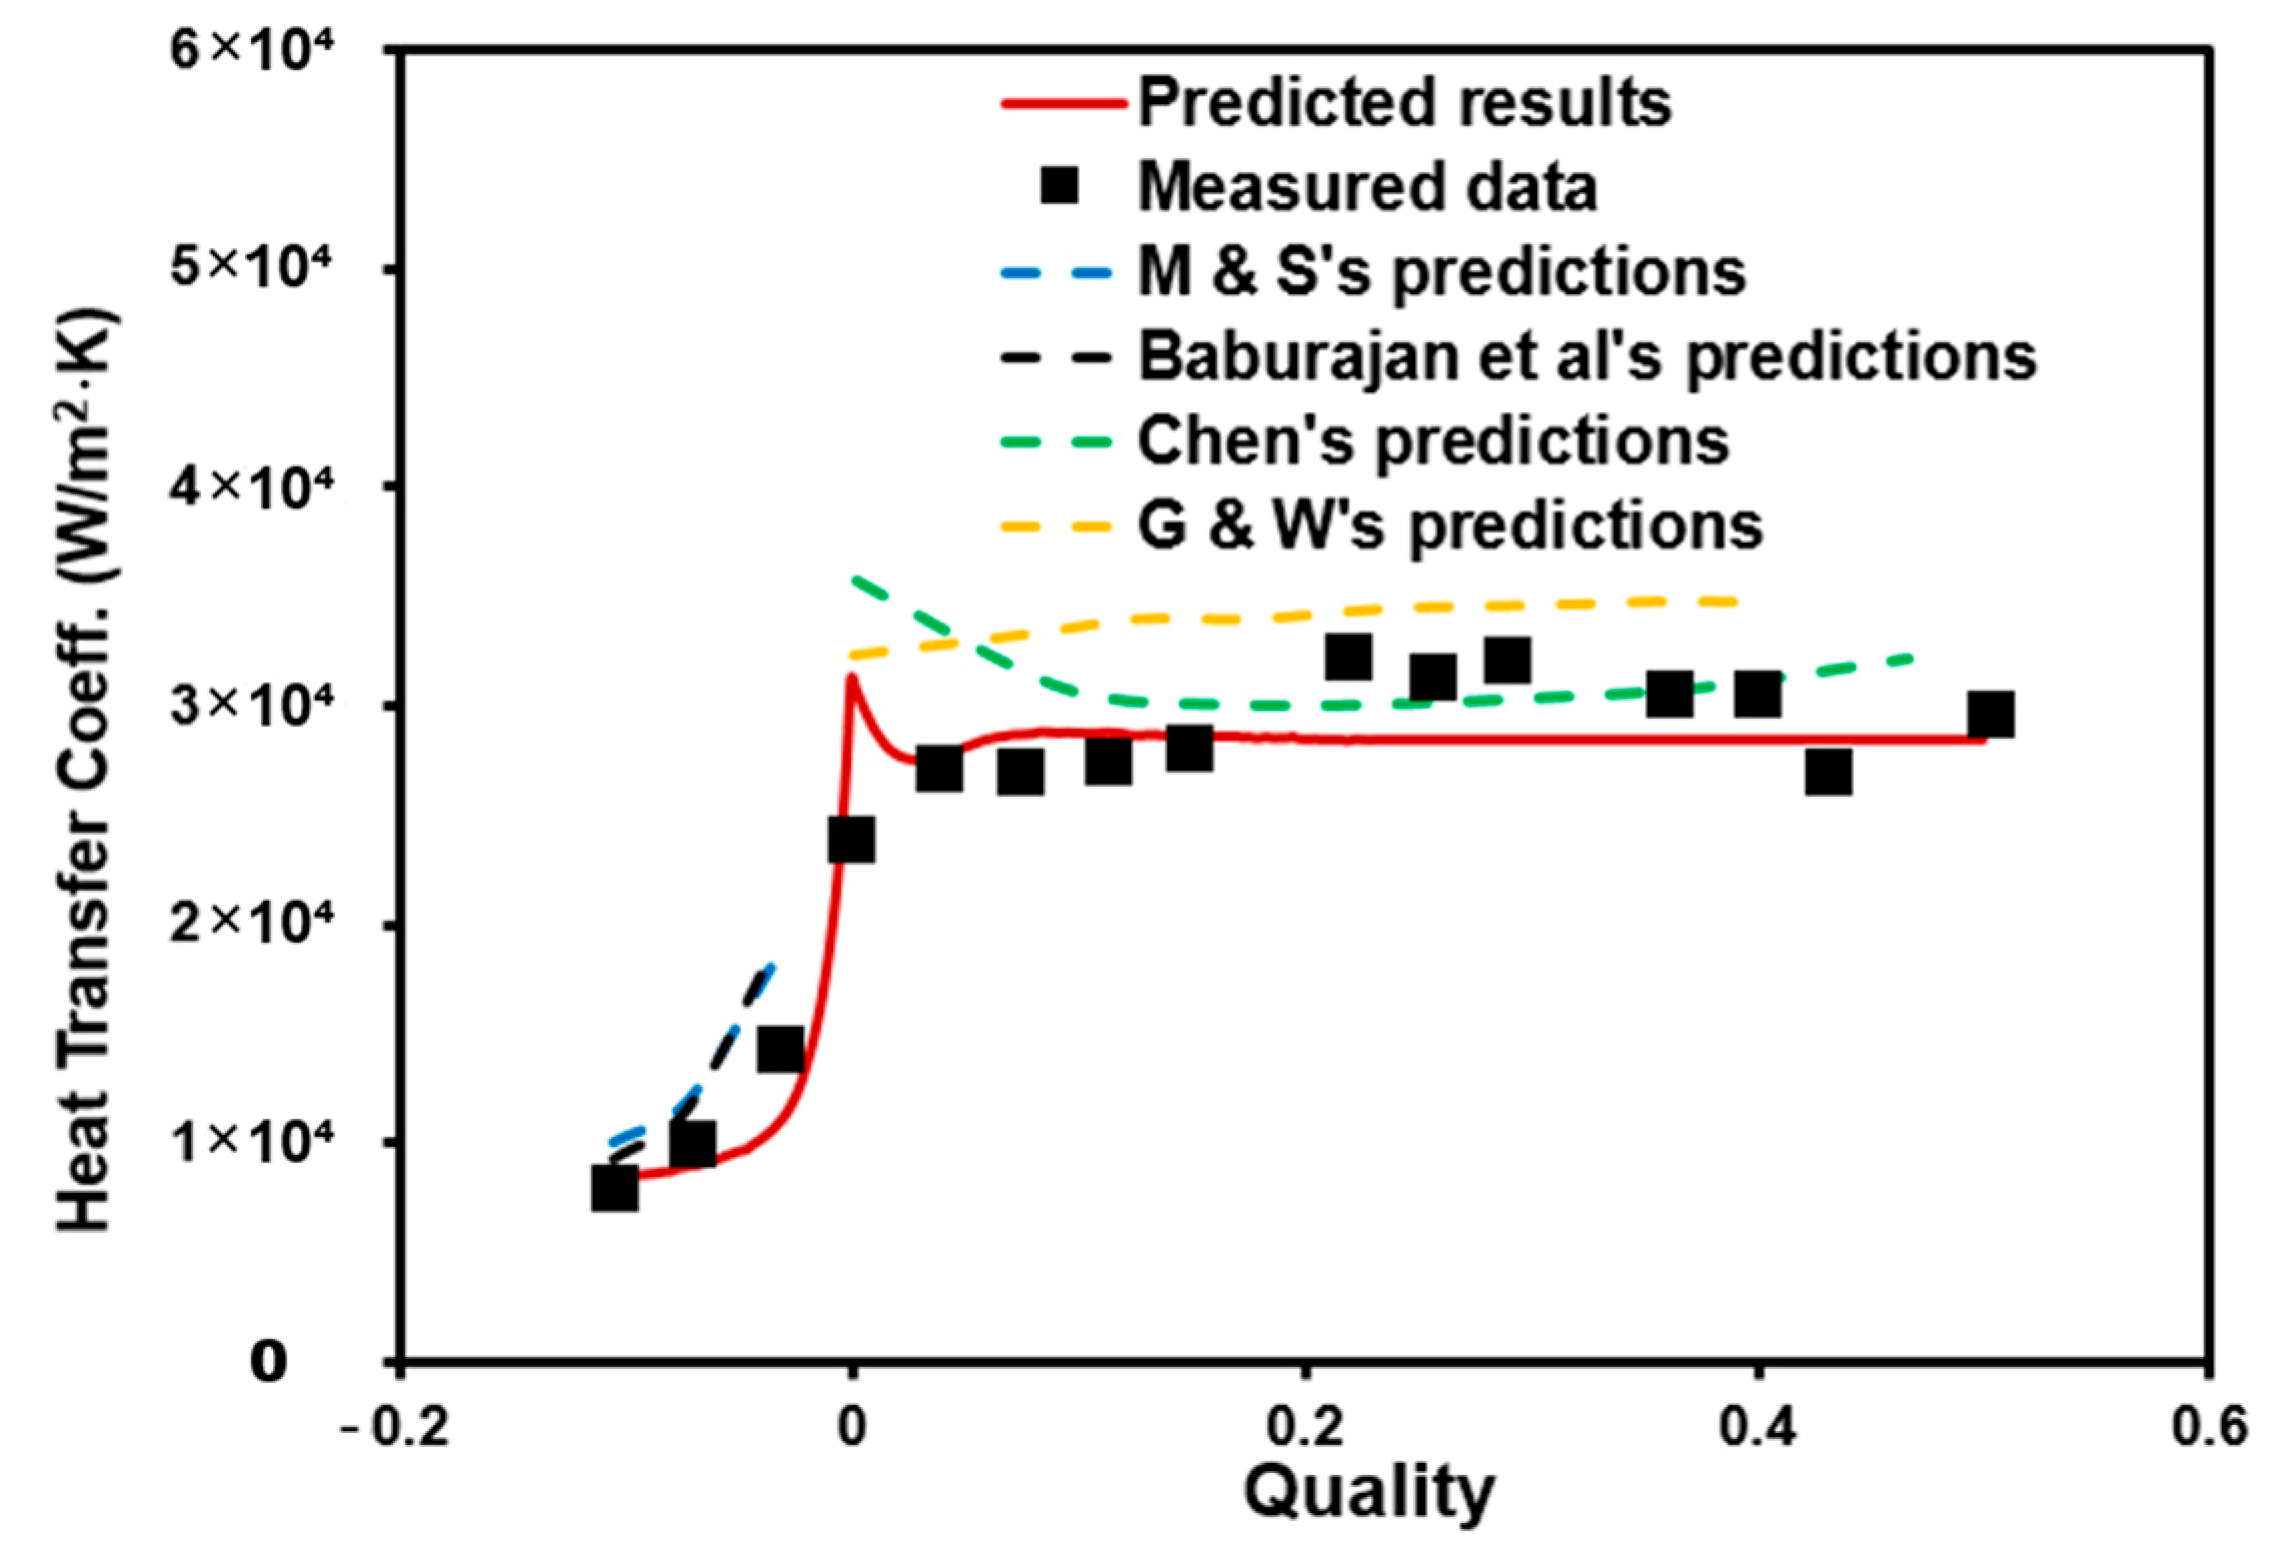
Combined with the calculated results of hTP (dash lines) from the various correlations, Figure 3 compares the measured hTP (dots) in both the subcooled and saturated boiling regions from the work by Xiao et al. [6] and the predicted results. The test conditions for the work by Xiao et al. [6] are listed in the first row of Table 3. In the present CFD boiling methodology, the first set of correlations of bubble dynamics (as indicted in Table 2) are adopted. Similar to the definition of Xiao et al. [6], the boiling heat transfer coefficient is determined using the wall heat flux divided by the difference between the average wall temperature and bulk temperature. The heat-transfer regime changes from the subcooled nucleate boiling region to the saturated nucleate boiling one. The zero quality is the dividing point for these two regions. In the subcooled boiling region, hTP increases sharply with quality, as clearly demonstrated in the results of test measurements and CFD predictions. In the saturated nucleate boiling region, the measured and predicted hTP approach constant. In general, Figure 3 clearly shows that the predicted trend of hTP versus quality using the present boiling model agrees well with the measured results.
Figure 3.
Comparison of measured and predicted hTP vs. quality in subcooled and saturated boiling regions.
As indicated in Table 6, the correlations selected in Figure 3 include Moles and Shaw [34], Baburajan et al. [7] for the subcooled boiling region, and Chen [35], Zhao et al. [36] for the saturated boiling region. Detailed observation of Figure 3 reveals that Chen’s correlation [35] is more suitably applied in predicting hTP in the saturated boiling region of an HCT, and the correlations of both Moles and Shaw [34] and Baburajan et al. [7] are appropriately used in the subcooled boiling region for an HCT. In addition, the suitability of Chen’s correlation for the boiling heat transfer in an HCT is also reported in the previous works of Chung et al. [37] and Fsadni and Whitty [38].
Table 6.
Correlations for the subcooled and saturated boiling regions.
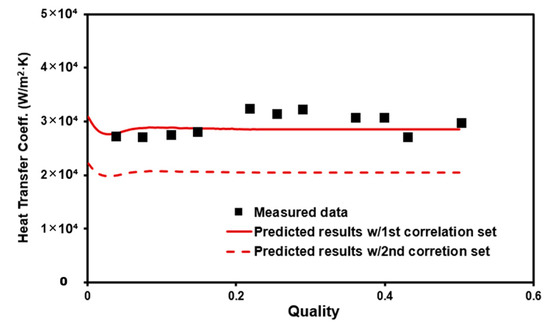
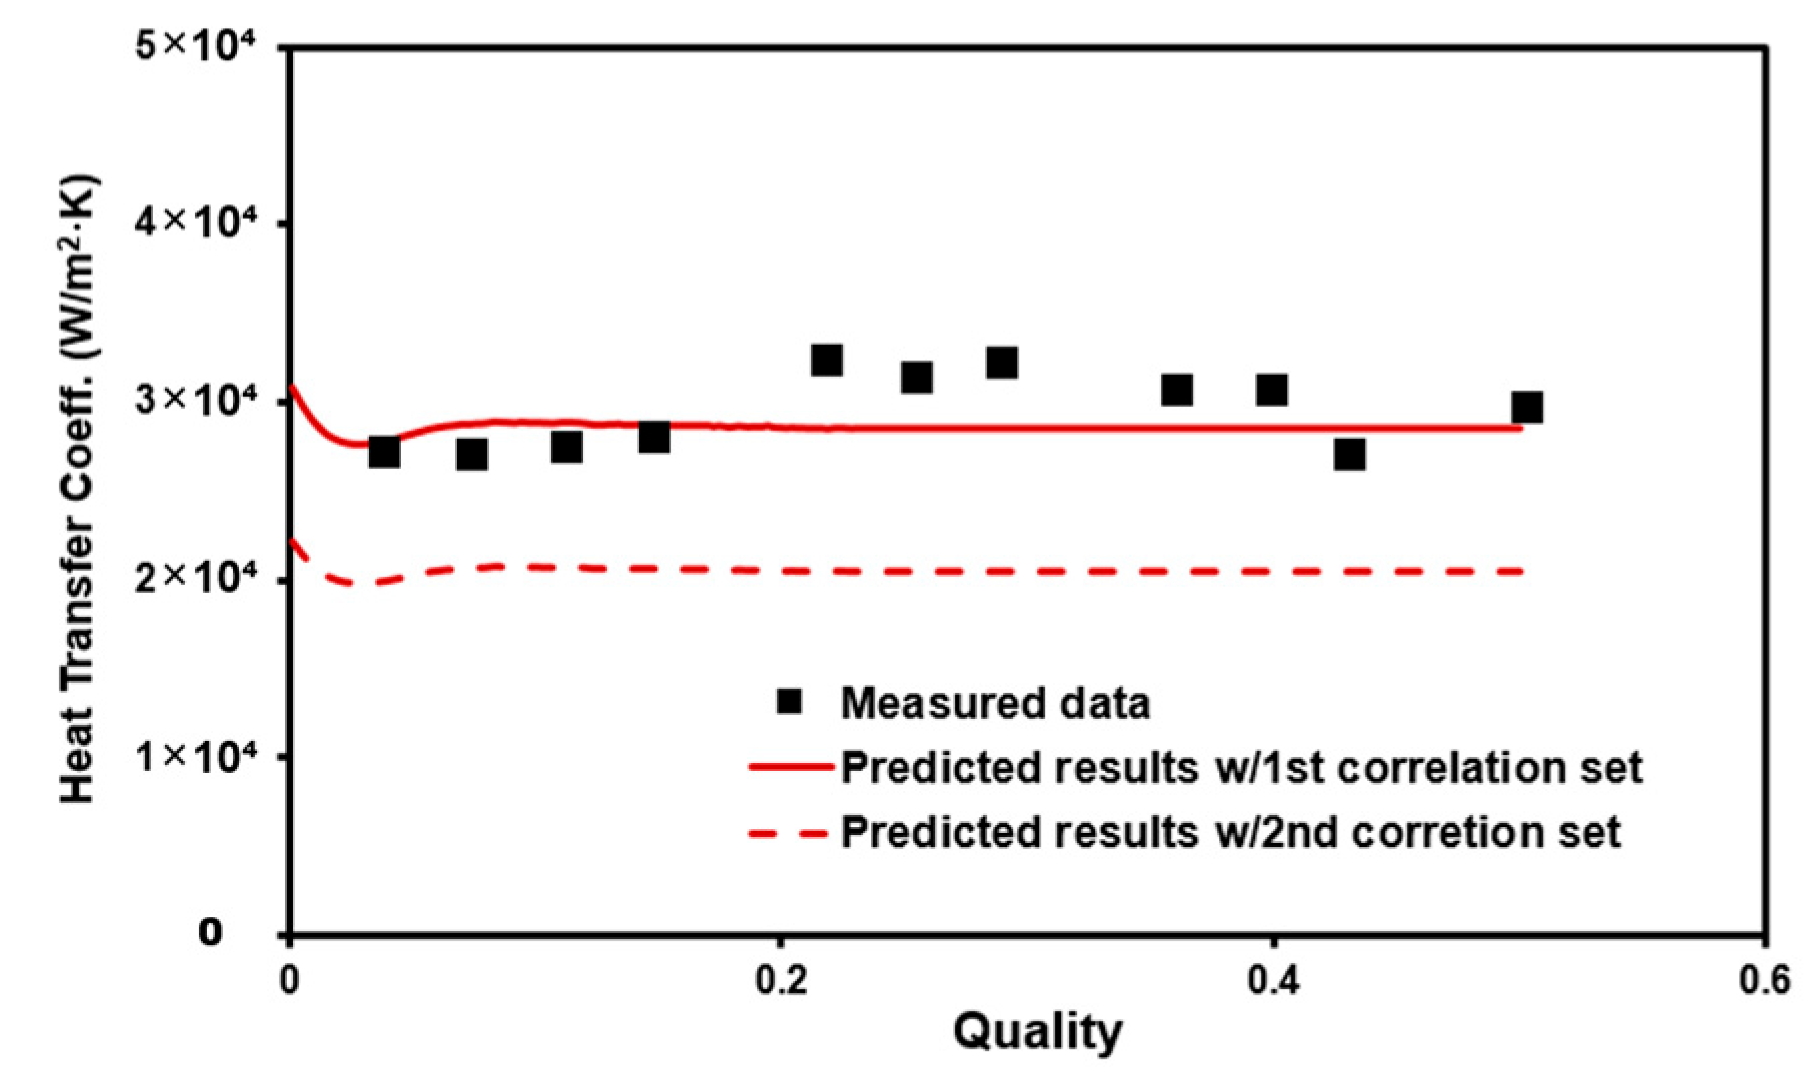
As per the aforementioned description, the effects of bubble dynamic correlations on the predicted boiling heat transfer in an HCT are considered in this work. Table 2 displays two sets of bubble dynamic correlations that are often adopted in CFD codes. Figure 4 shows the comparison of measured hTP (dots) versus quality from the work of Xiao et al. [6] and predicted results with the present CFD model with the first (solid line) and second (dash line) sets of bubble dynamic correlations (Table 2). It can be clearly seen in this Figure that the first correlation set for bubble dynamics is more suitably applied in predicting the nucleate boiling heat transfer characteristics for an HCT based on the present CFD simulation results.
Figure 4.
Effects of various sets of bubble dynamic correlations on predicted htp.
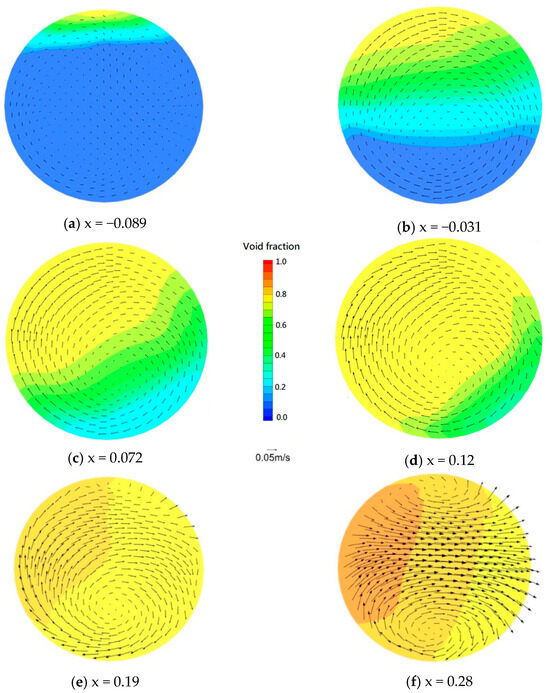
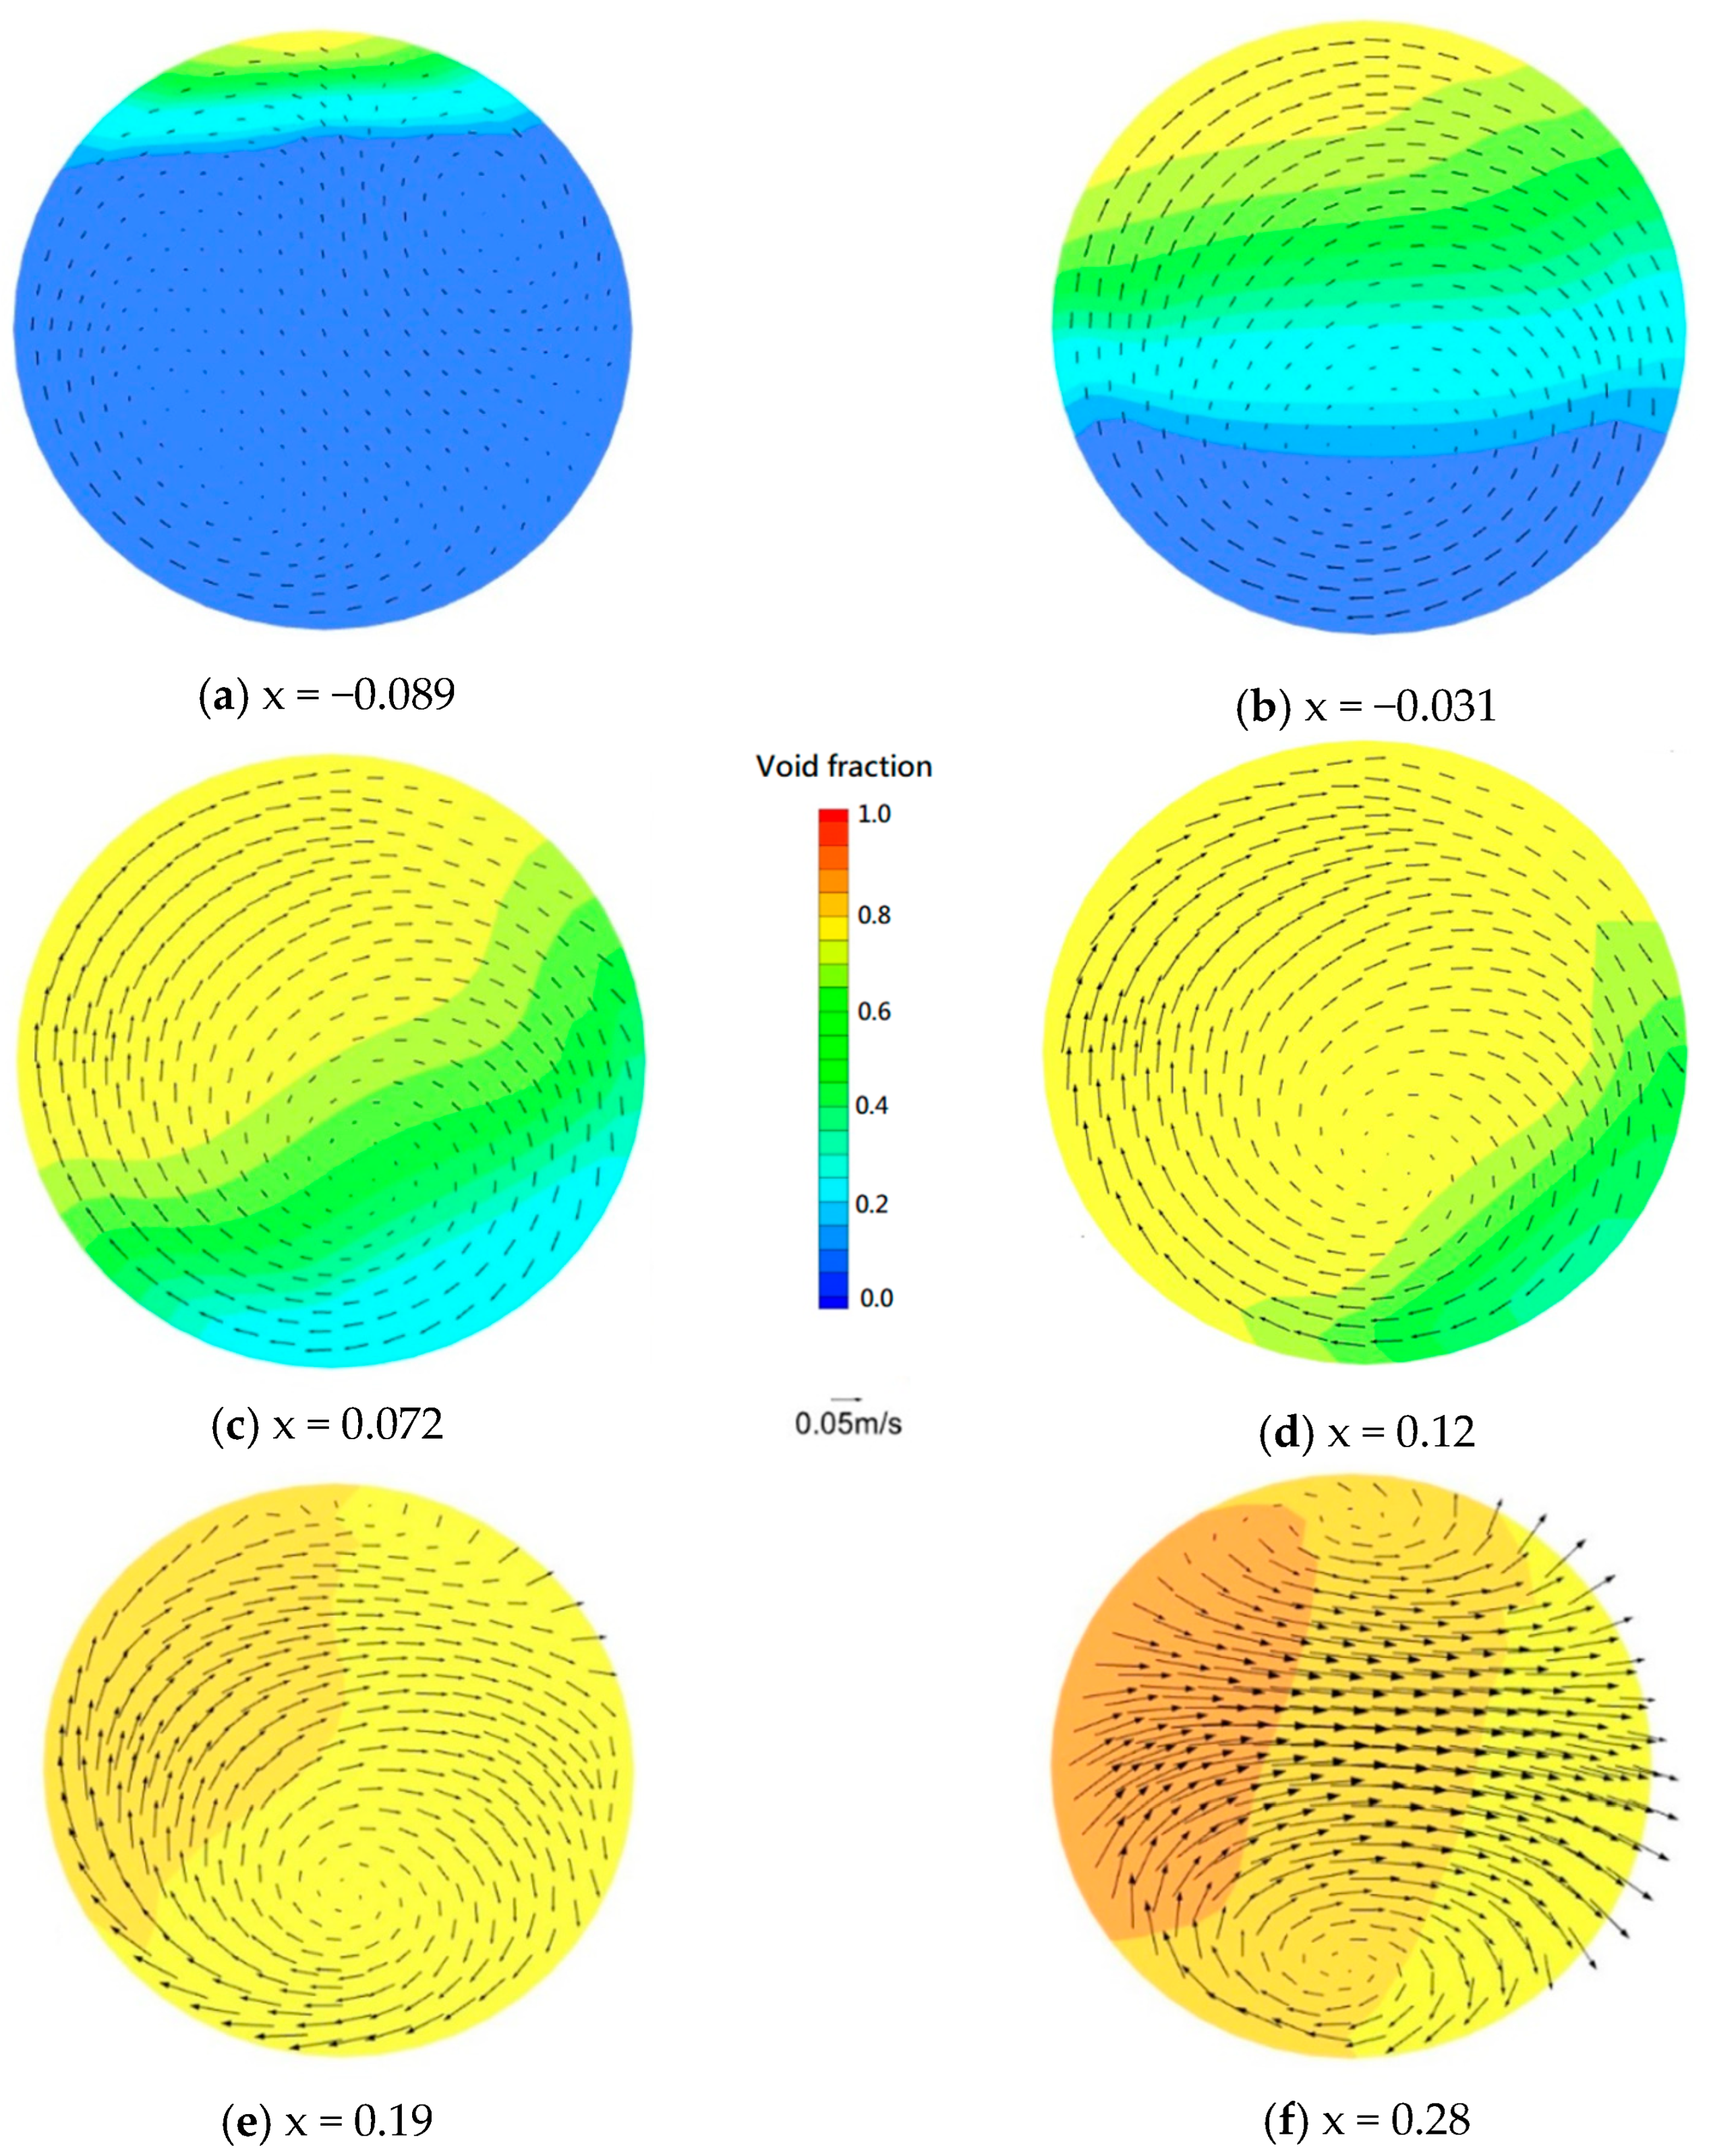
Figure 5 illustrates the spatial distribution patterns of the void fraction contours and the corresponding velocity vectors of the secondary flow across successive cross-sections along the axial direction of the HCT. These cross-sections naturally track the thermodynamic evolution of the fluid temperature and vapor quality, covering the subcooled boiling region ((x) = −0.089, −0.031) and the saturated boiling region (x = 0.072, 0.12, 0.19, 0.28). The localized scale of the void fraction and the absolute magnitude of the velocity vectors are quantitatively indicated in the central portion of the Figure.
Figure 5.
Distribution patterns of void fraction contour and velocity vectors of secondary flow on the different cross-sections of HCT: (a) x = −0.089; (b) x = −0.031; (c) x = 0.072; (d) x = 0.12; (e) x = 0.19; (f) x = 0.28.
As established previously, the boiling heat transfer characteristics inside the HCT are essentially governed by a dynamic competition between centrifugal and gravitational forces. In the subcooled region (Plots 5(a) and 5(b)), the velocity vectors indicate a relatively mild cross-flow and the higher-density water predominantly accumulates near the HCT bottom (ϕ ~ 180°). This spatial distribution reveals that gravitational forces overcome centrifugal effects under the specific operating conditions of Xiao et al.’s benchmark [6].
As saturated boiling develops (Plots 5(c) to 5(f)), rapid vapor generation causes a significant rise in the local void fraction. The resulting reduction in bulk fluid density diminishes the net gravitational effect relative to the centrifugal force. Consequently, the velocity vectors resolve a noticeable shift in the flow structure: the region containing the higher-density liquid phase migrates toward the bottom-right sector of the HCT cross-section (i.e., ϕ located between 90° and 180°). This hydrodynamics characteristic confirms a shifting force balance where centrifugal forces become comparable to gravity, aligning well with the circumferential patterns reported by Wang et al. [39] and Tsai et al. [40] for high-density HCT configurations.
Furthermore, a direct comparison of the velocity vector fields across all plots in Figure 5 demonstrates that the secondary flow circulation intensity within the saturated boiling region is substantially stronger and more coherent than that in the subcooled region. This intensified secondary vortex motion induces severe liquid film shearing and enhances convective mixing near the wall boundary layer, serving as the primary mechanical driver for the elevated HTC values observed in the saturated regime.
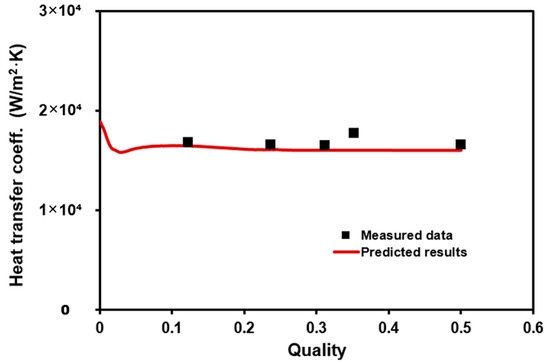
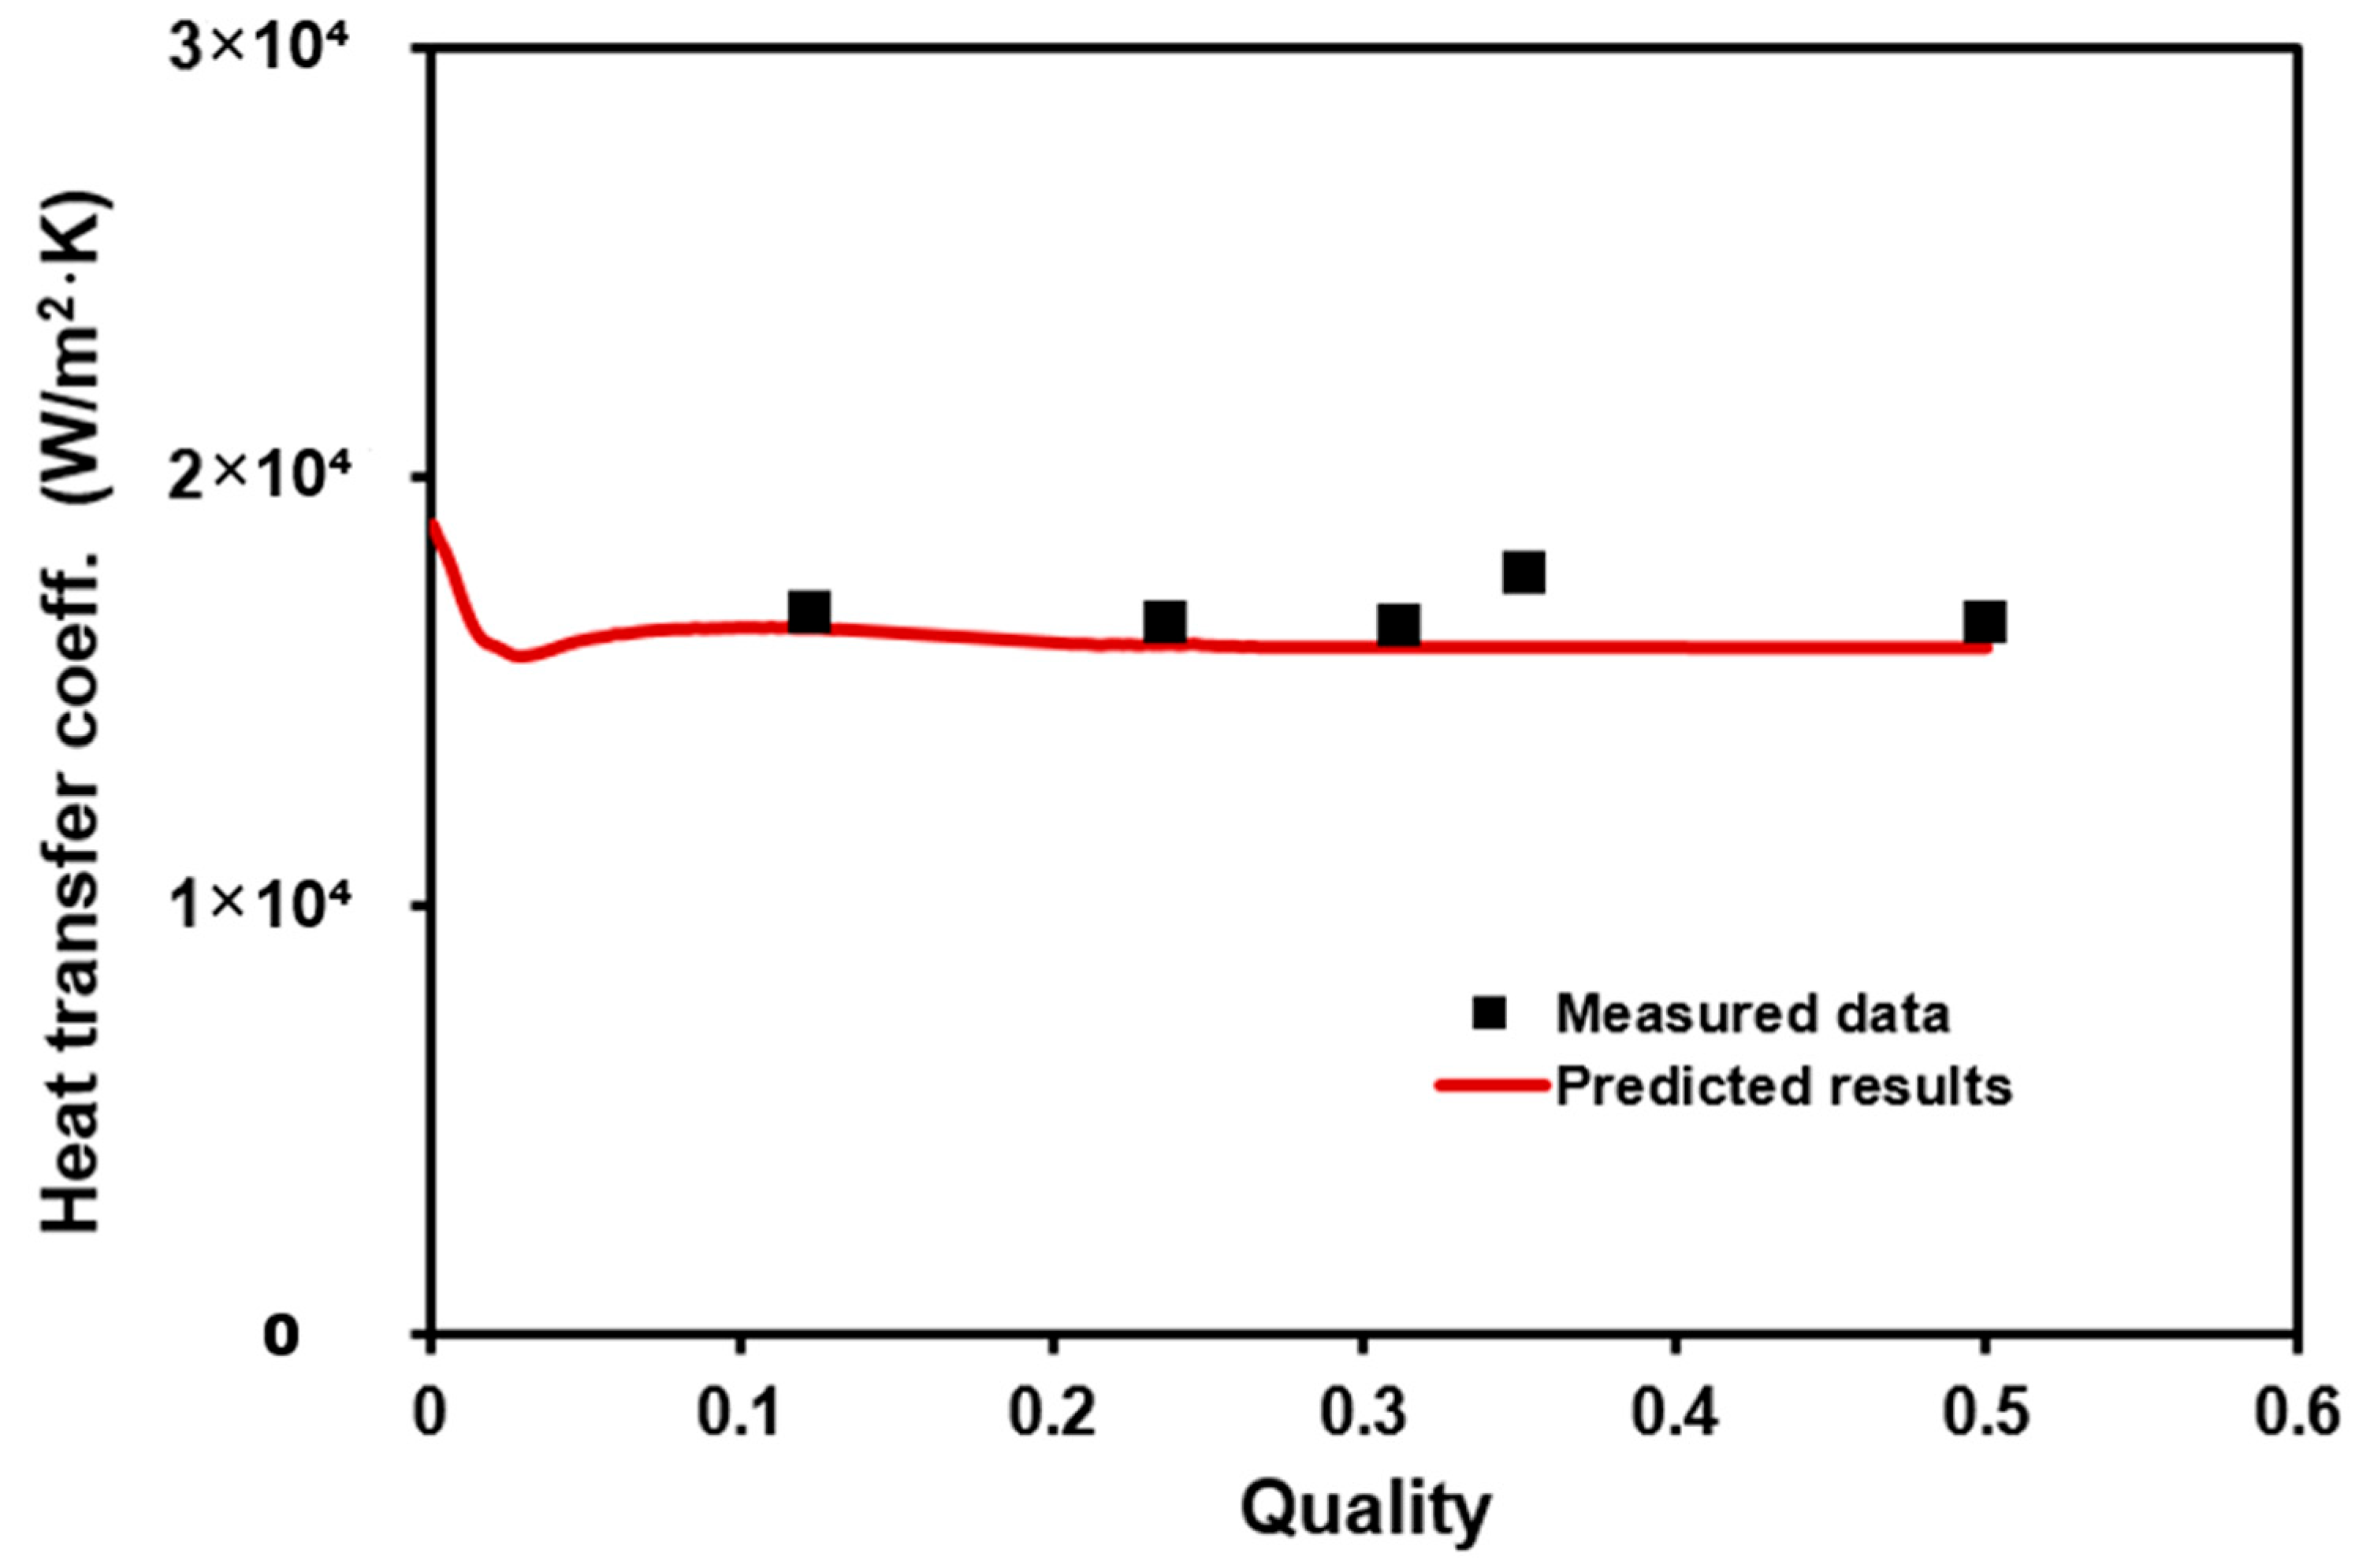
Based on previous match results between the experimental data and model predictions, the present CFD boiling model with the RPI wall boiling model and the first set of bubble dynamic correlations can be applied to simulate the nucleate boiling heat transfer within an HCT. In order to confirm the feasibility of this CFD boiling methodology, another experimental work from Santini et al. [5] is also selected as the second validation case. The test dimensions and the simulation conditions are listed in the second rows of Table 3 and Table 4, respectively. The mesh distribution is similar to that of a previous case. Figure 6 compares the predicted hTP versus quality with the measured data. Good agreement is also shown in this Figure, with a MAPE of 4.61%, confirming the applicability of the present CFD boiling methodology in simulating the nucleate boiling heat transfer characteristics in an HCT.
Figure 6.
Comparison of measured and predicted hTP vs. quality in saturated boiling regions.
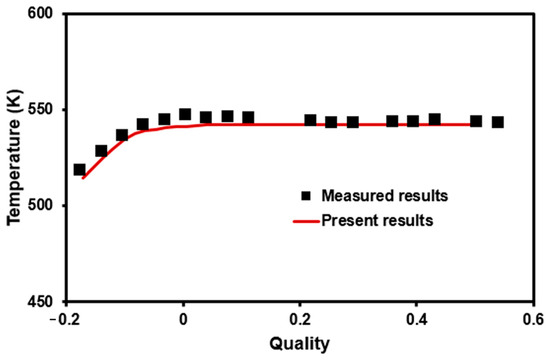
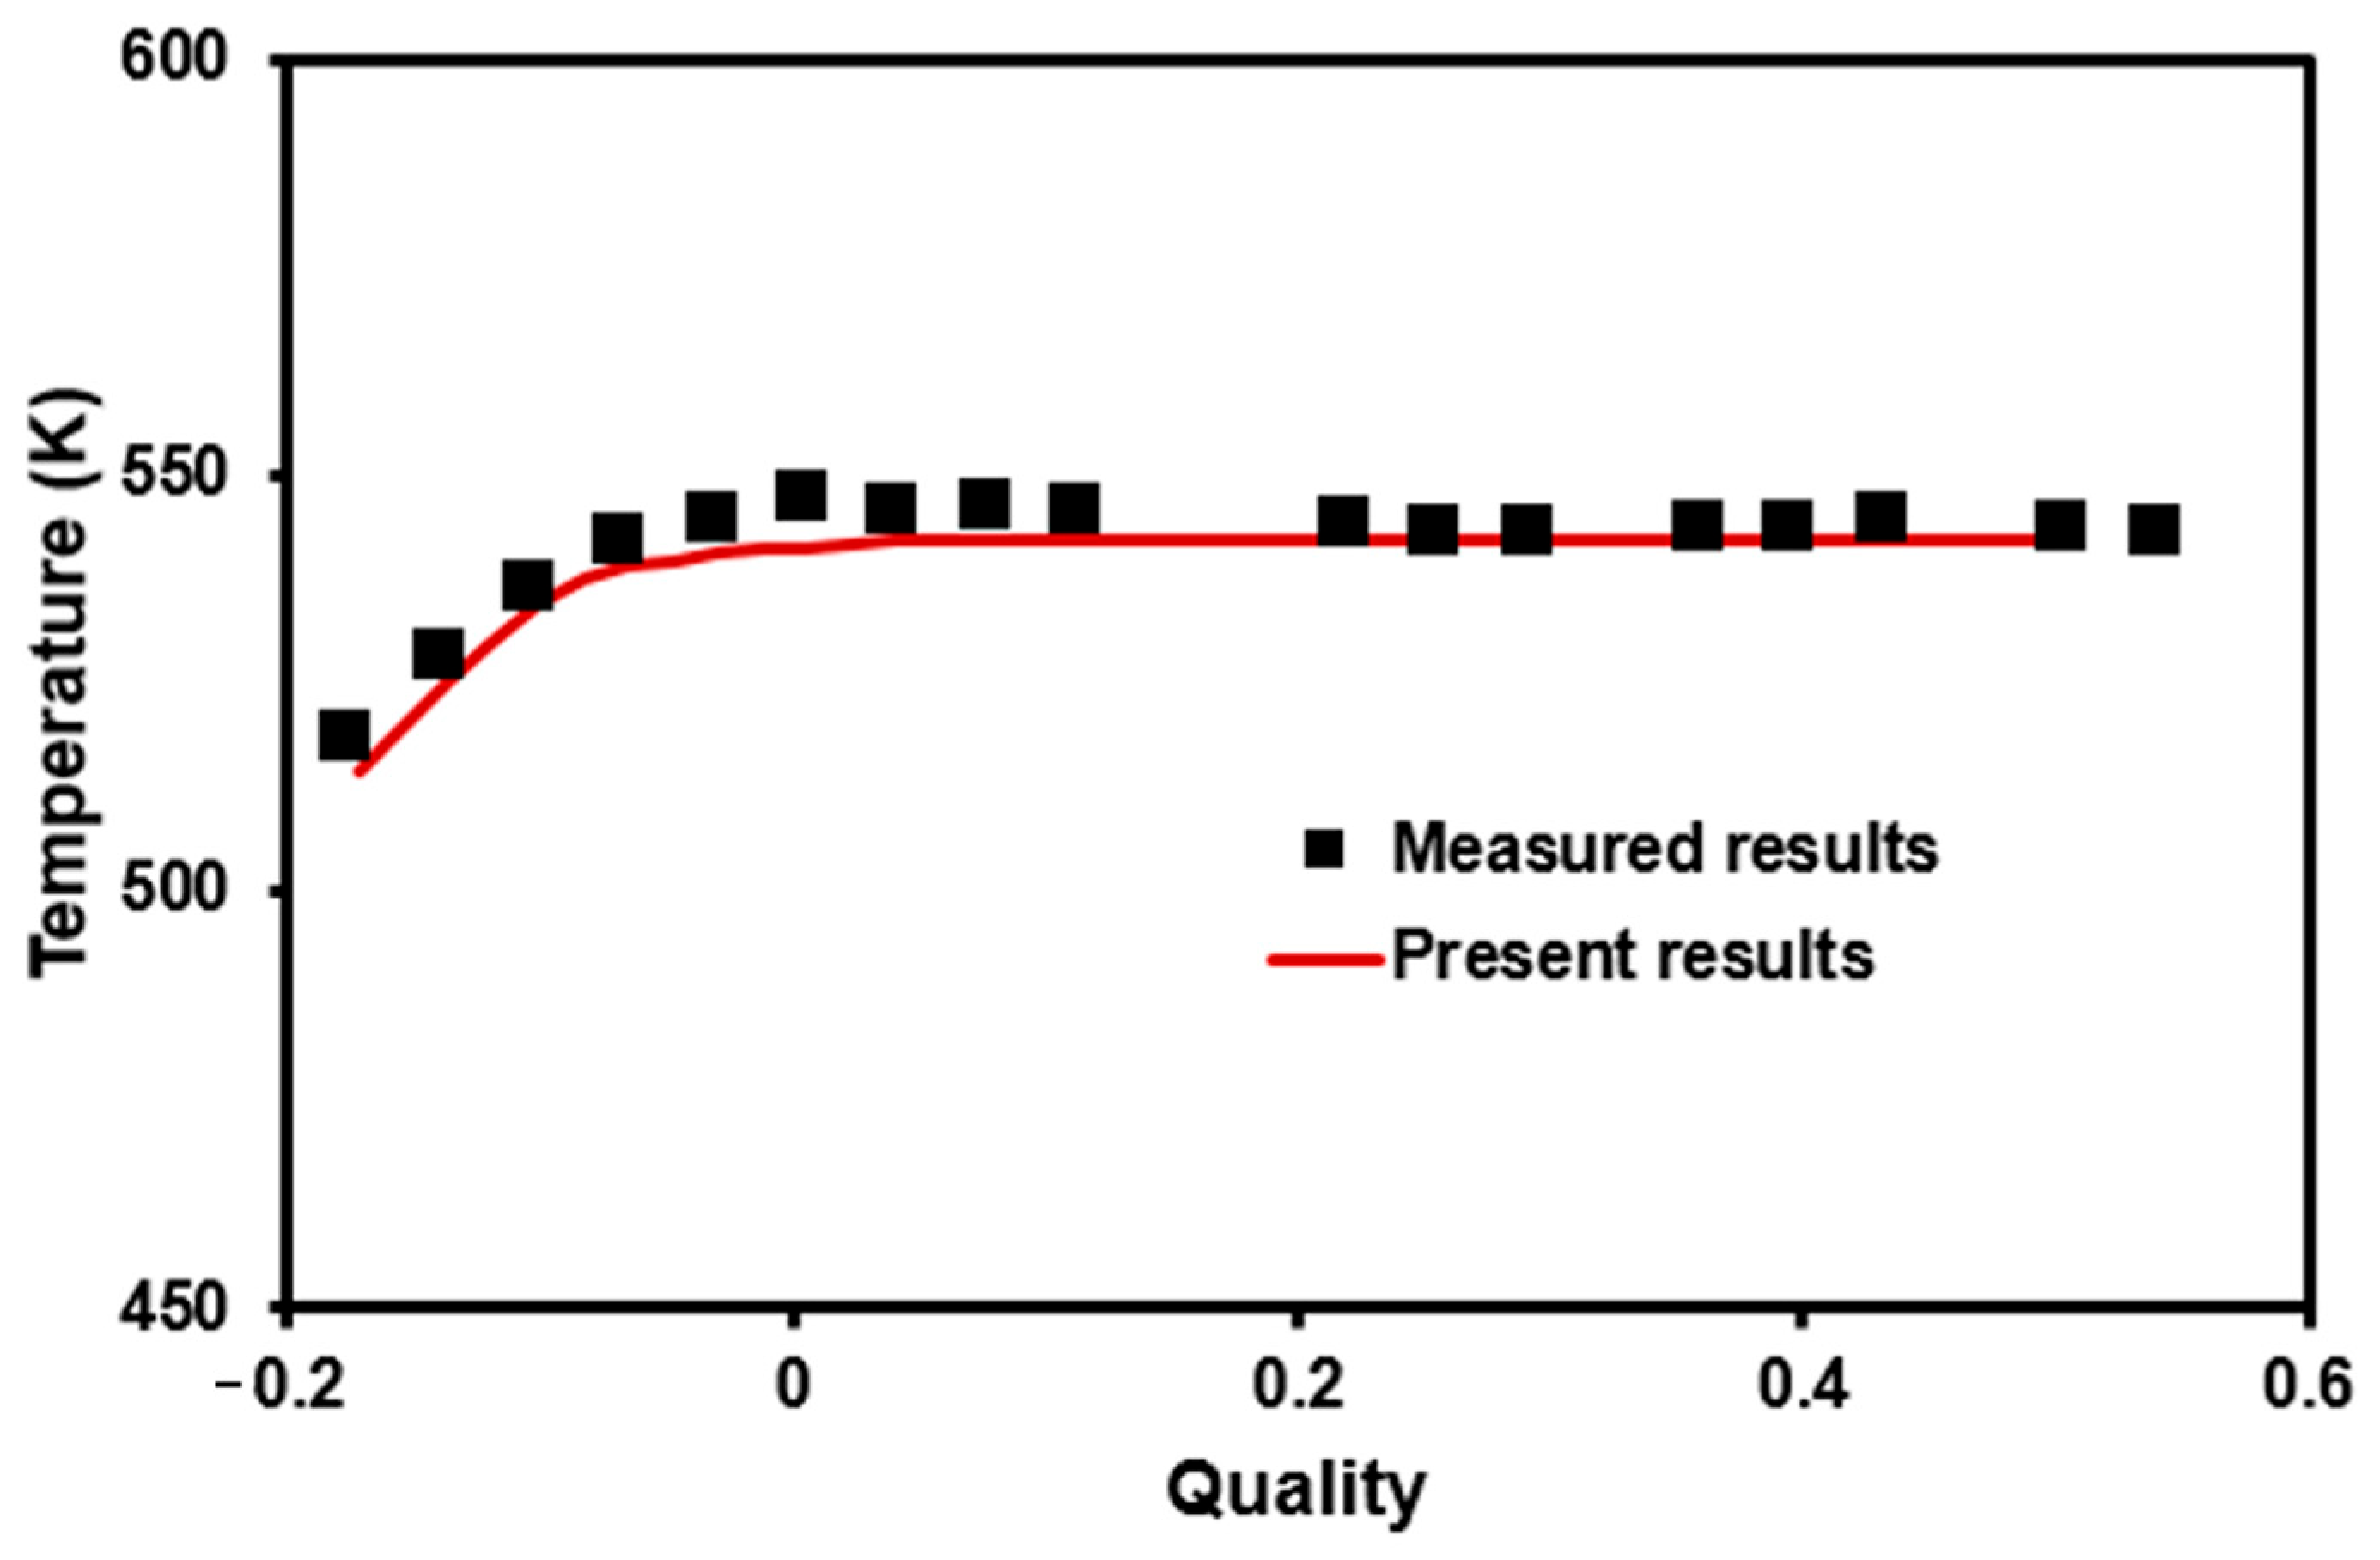
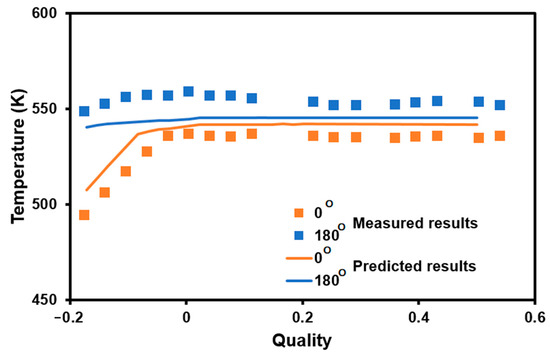
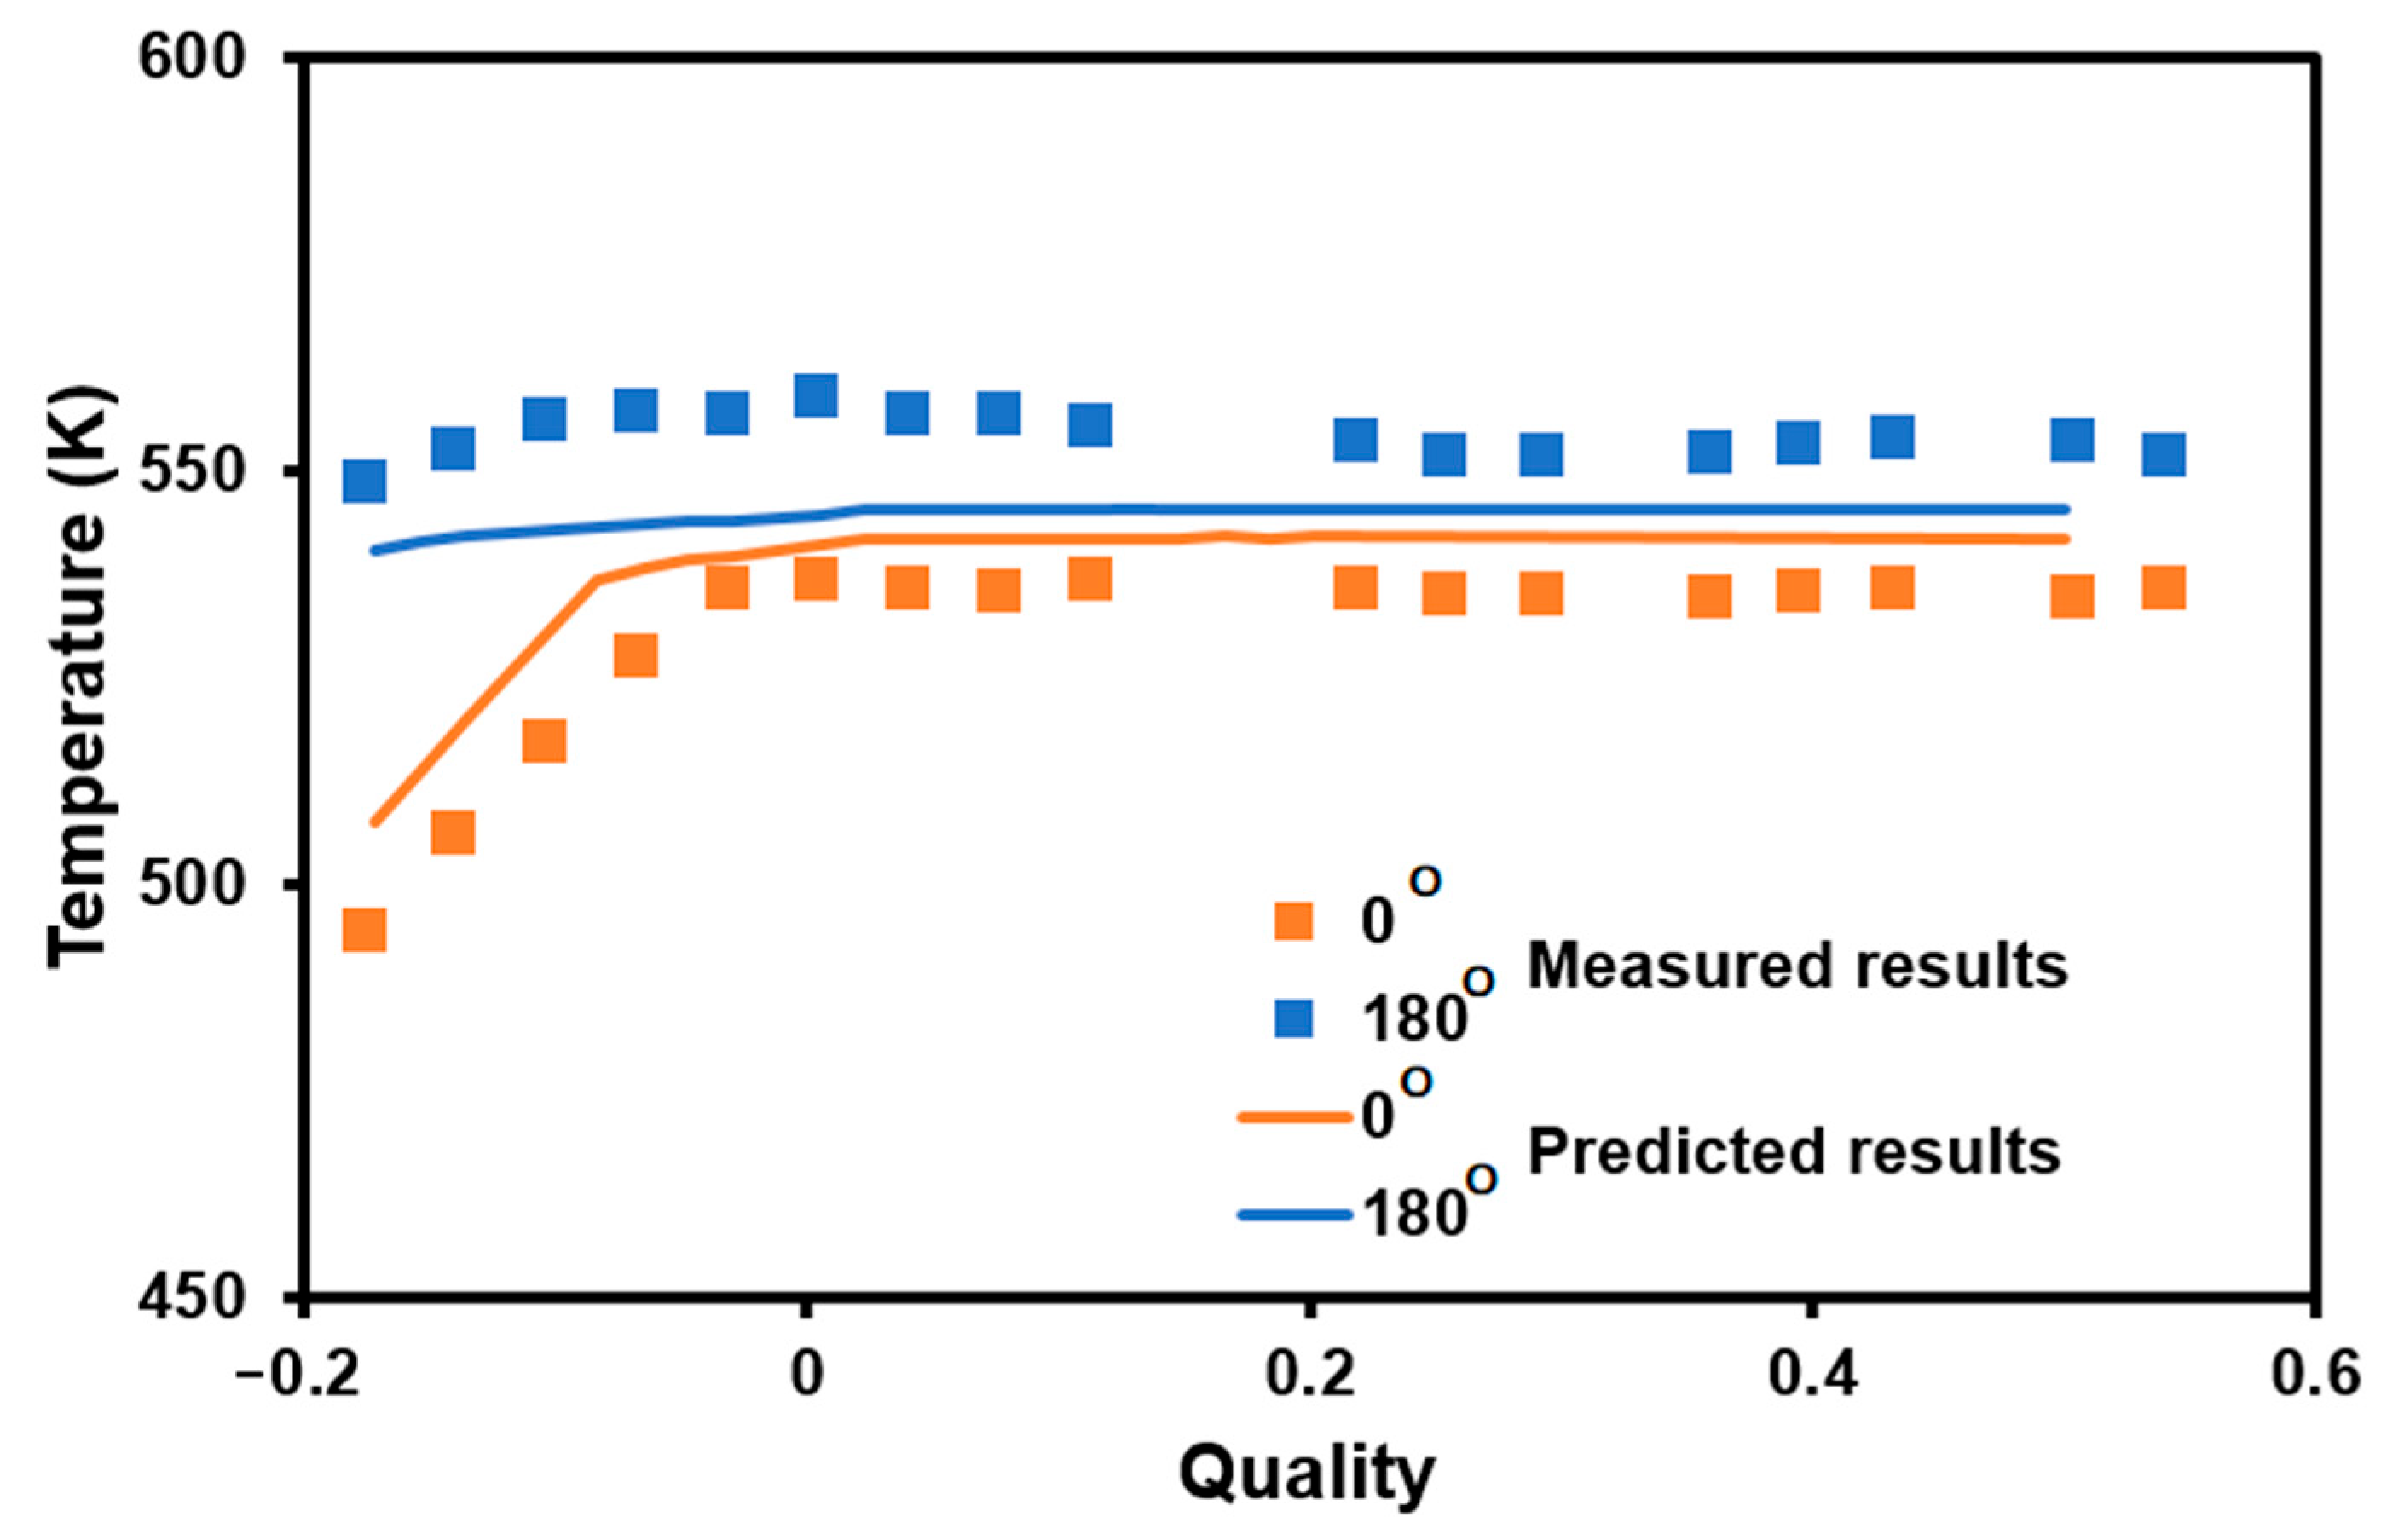
Figure 7 shows the comparison of average wall temperature versus quality in both the subcooled and saturated boiling regions between the measured data (dots) from the work of Xiao et al. [6] and the present predicted results (solid line). An exceptional agreement between the data and predictions is demonstrated, yielding a MAPE of only 0.591%. The correspondence between data and predictions is clearly revealed in this Figure. However, due to the combined effects of gravitational and centrifugal forces, the two-phase fluid with the higher density and the lower void fraction prefers to accumulate near the outer and bottom wall within an HCT. This non-uniform distribution characteristic of vapor near the wall would result in the inhomogeneity of boiling heat transfer capability and the corresponding circumferential wall temperature under the constant heat flux condition. The non-uniform distribution of circumferential wall temperature is measured by the work of Xiao et al. [6] and shown in dots in Figure 8. In this Figure, the ordinate indicates the wall temperature and the abscissa is the quality. Orange and blue represent the wall temperature at circumferential angles of 0° (outer side) and 180° (inner side). Dots represent the measured data and lines are the predicted results. As discussed above, the two-phase fluid with the lower void fraction and the higher density would be pushed onto the outer side (~0°) of HCT, enhancing the local boiling heat transfer capability and lowering the corresponding wall temperature. On the other hand, a higher wall temperature occurs near the inner side (~180°) of HCT. Both the measured and predicted results qualitatively demonstrate this trend.
Figure 7.
Comparison of average wall temperature versus quality in both the subcooled and saturated boiling regions.
Figure 8.
Comparison of wall temperature versus quality at different circumferential angles.
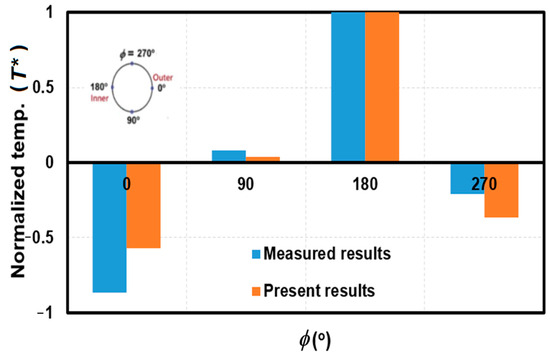
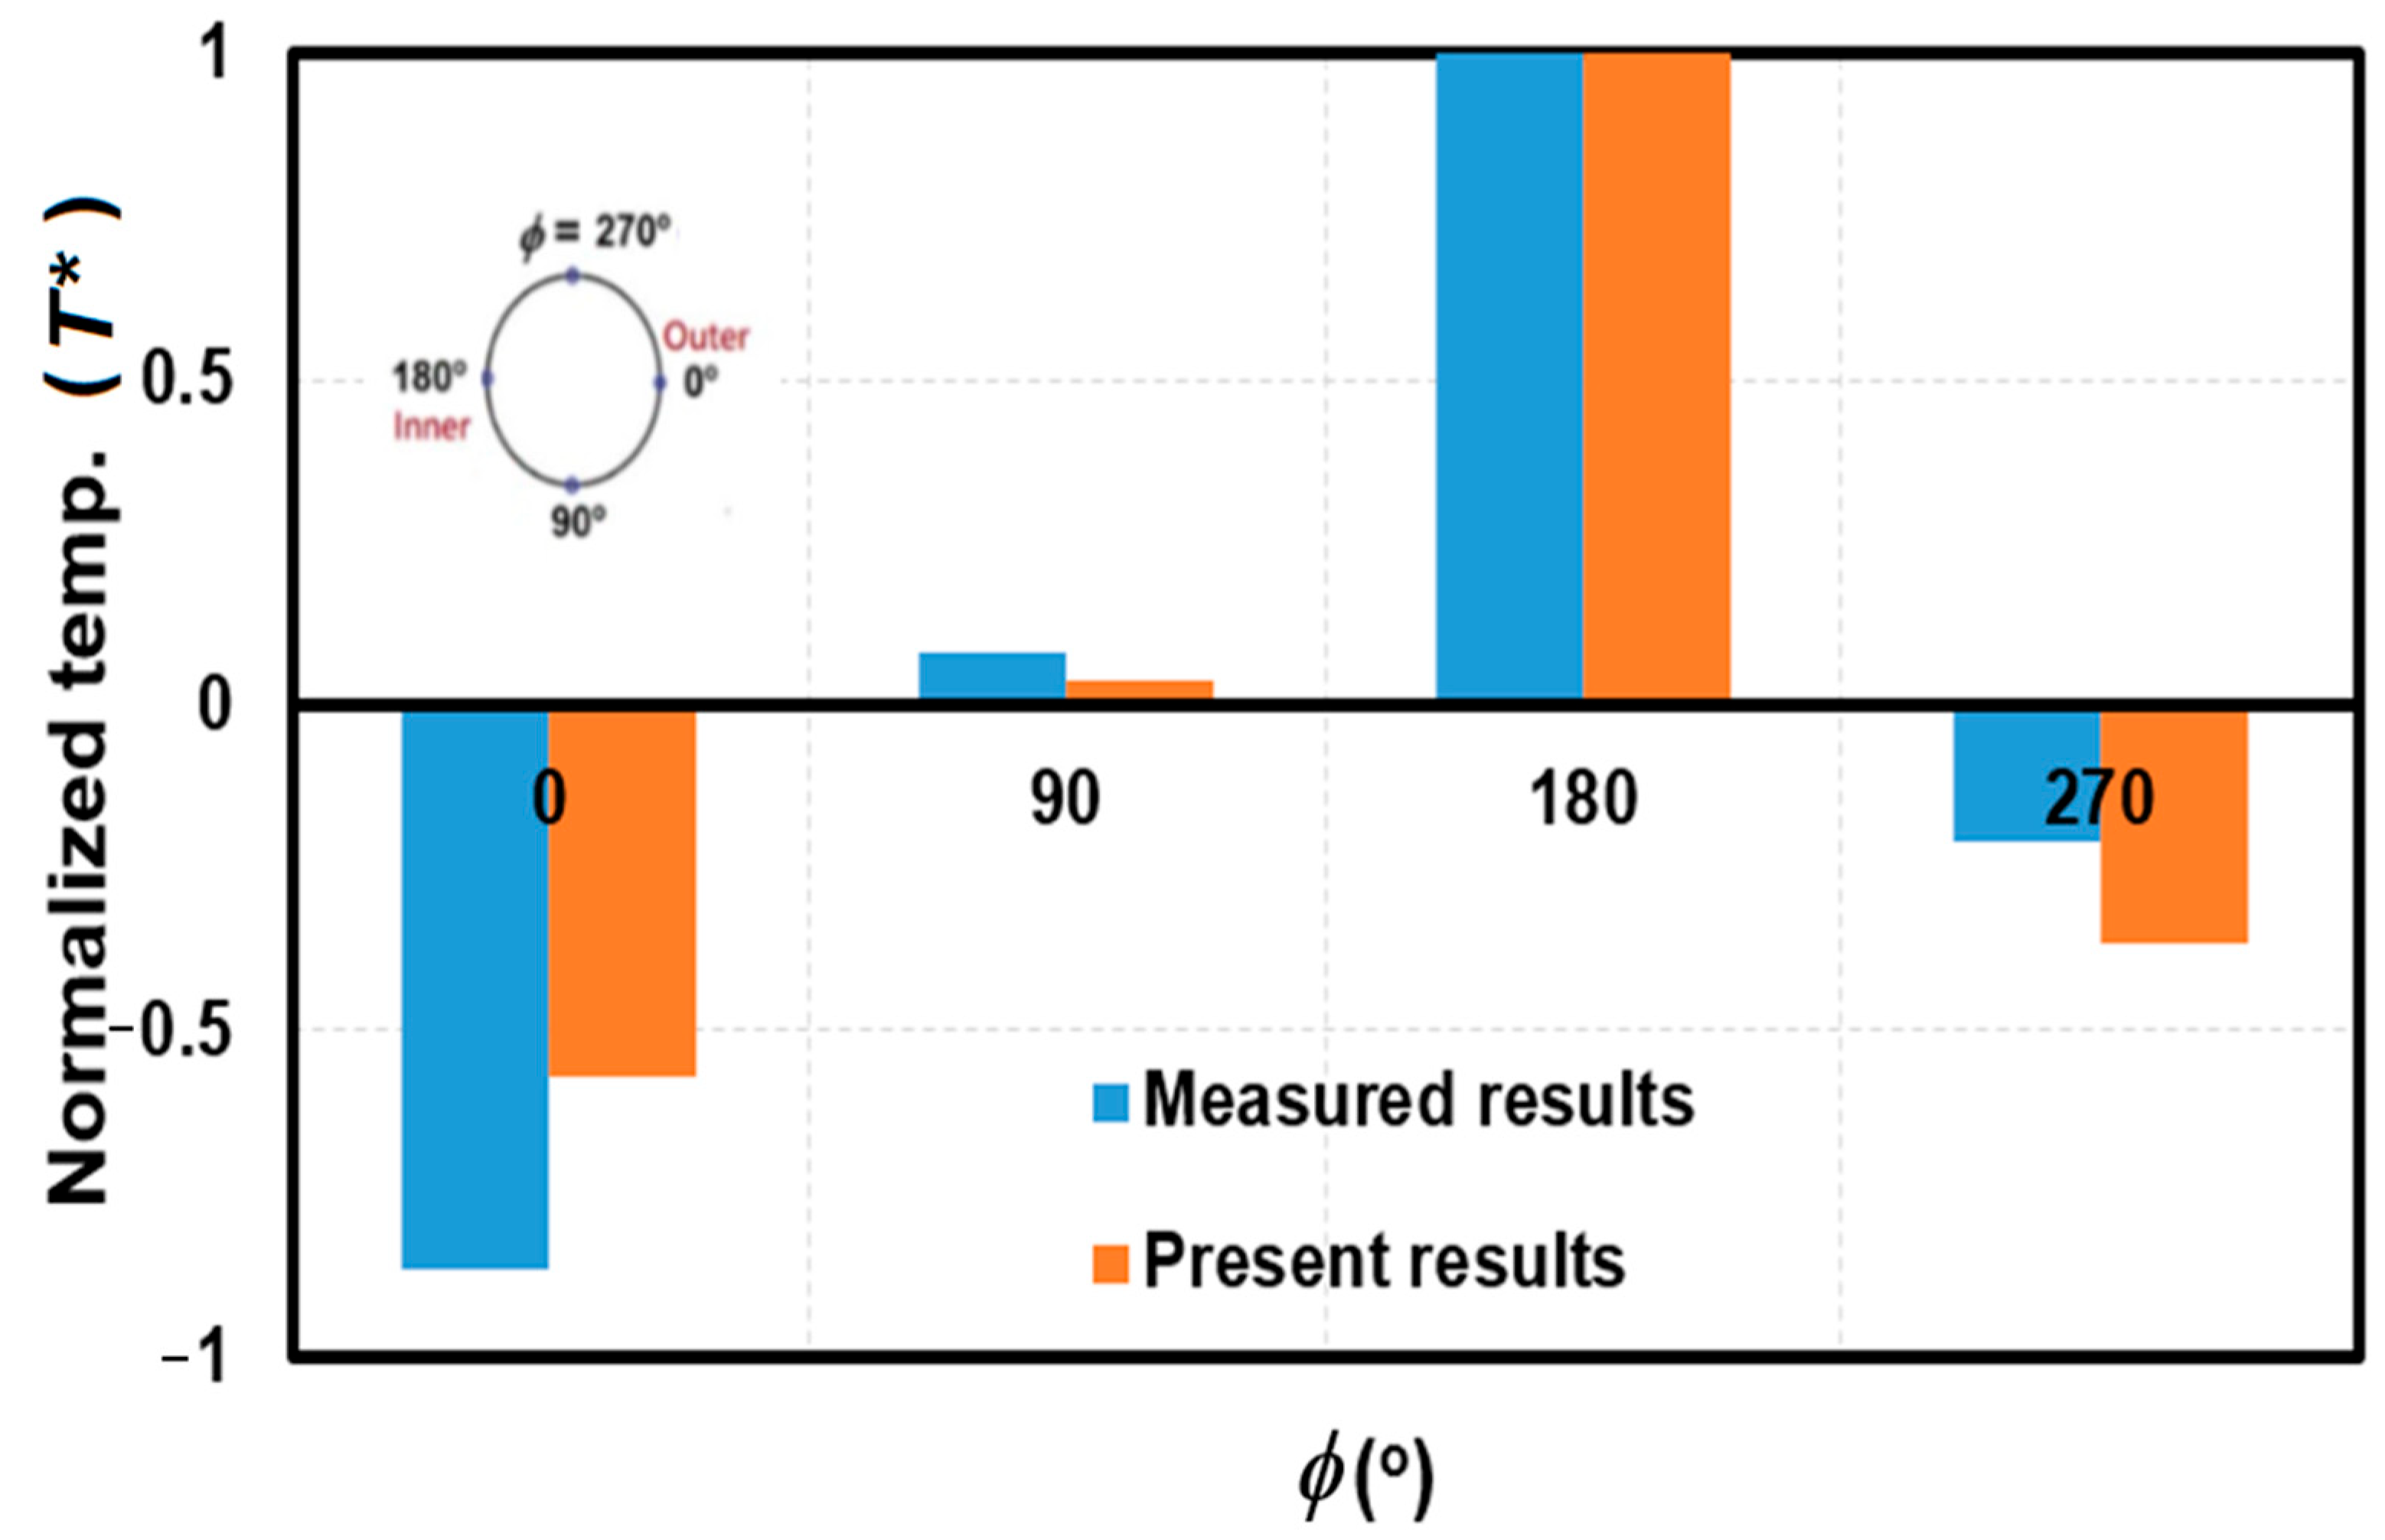
However, from the quantitative perspective, the average difference in wall temperature at ϕ = 0° and 180° is predicted by the present CFD boiling model to be approximately 5.2 °C, much lower than the 18.7 °C from the measured results. More vapor is pushed near the HCT inner side, causing larger elongated bubbles to accumulate in that region. This underestimation reveals that the present boiling model with the RPI model may not be suitable for the two-phase region with oval bubbles near the inner side, even under the nucleate boiling region with average lower quality on the cross-section of HCT. Due to the larger quantitative discrepancy in the circumferential wall temperature, the qualitative comparison is selected and shown in Figure 9. The abscissa is the circumferential angle (ϕ) and the ordinate indicates the normalized wall temperature, defined as T* = [T(ϕ) − Tavg]/[ T(ϕ = 180°) − Tavg]. T(ϕ) is the local wall temperature at the circumferential angle of ϕ and Tavg is the average wall temperature over all the circumferential angles. This comparison clearly reveals that the predicted variance of wall temperature with the circumferential angle is qualitatively similar to the measured one. As explained above, the highest and lowest wall temperatures are near the locations of ϕ = 180° and ϕ = 0°, respectively. Figure 9 also shows that the wall temperature near the bottom side (ϕ = 90°) is slightly higher than the average temperature and that near the top side (ϕ = 0°) is slightly lower than the average temperature. Both the measured and predicted results show these trends.
Figure 9.
Comparison of normalized wall temperature at different circumferential angles.
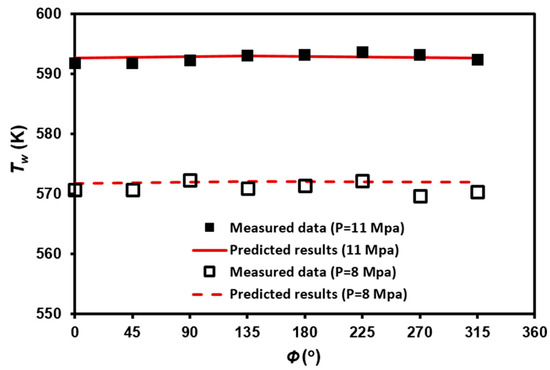
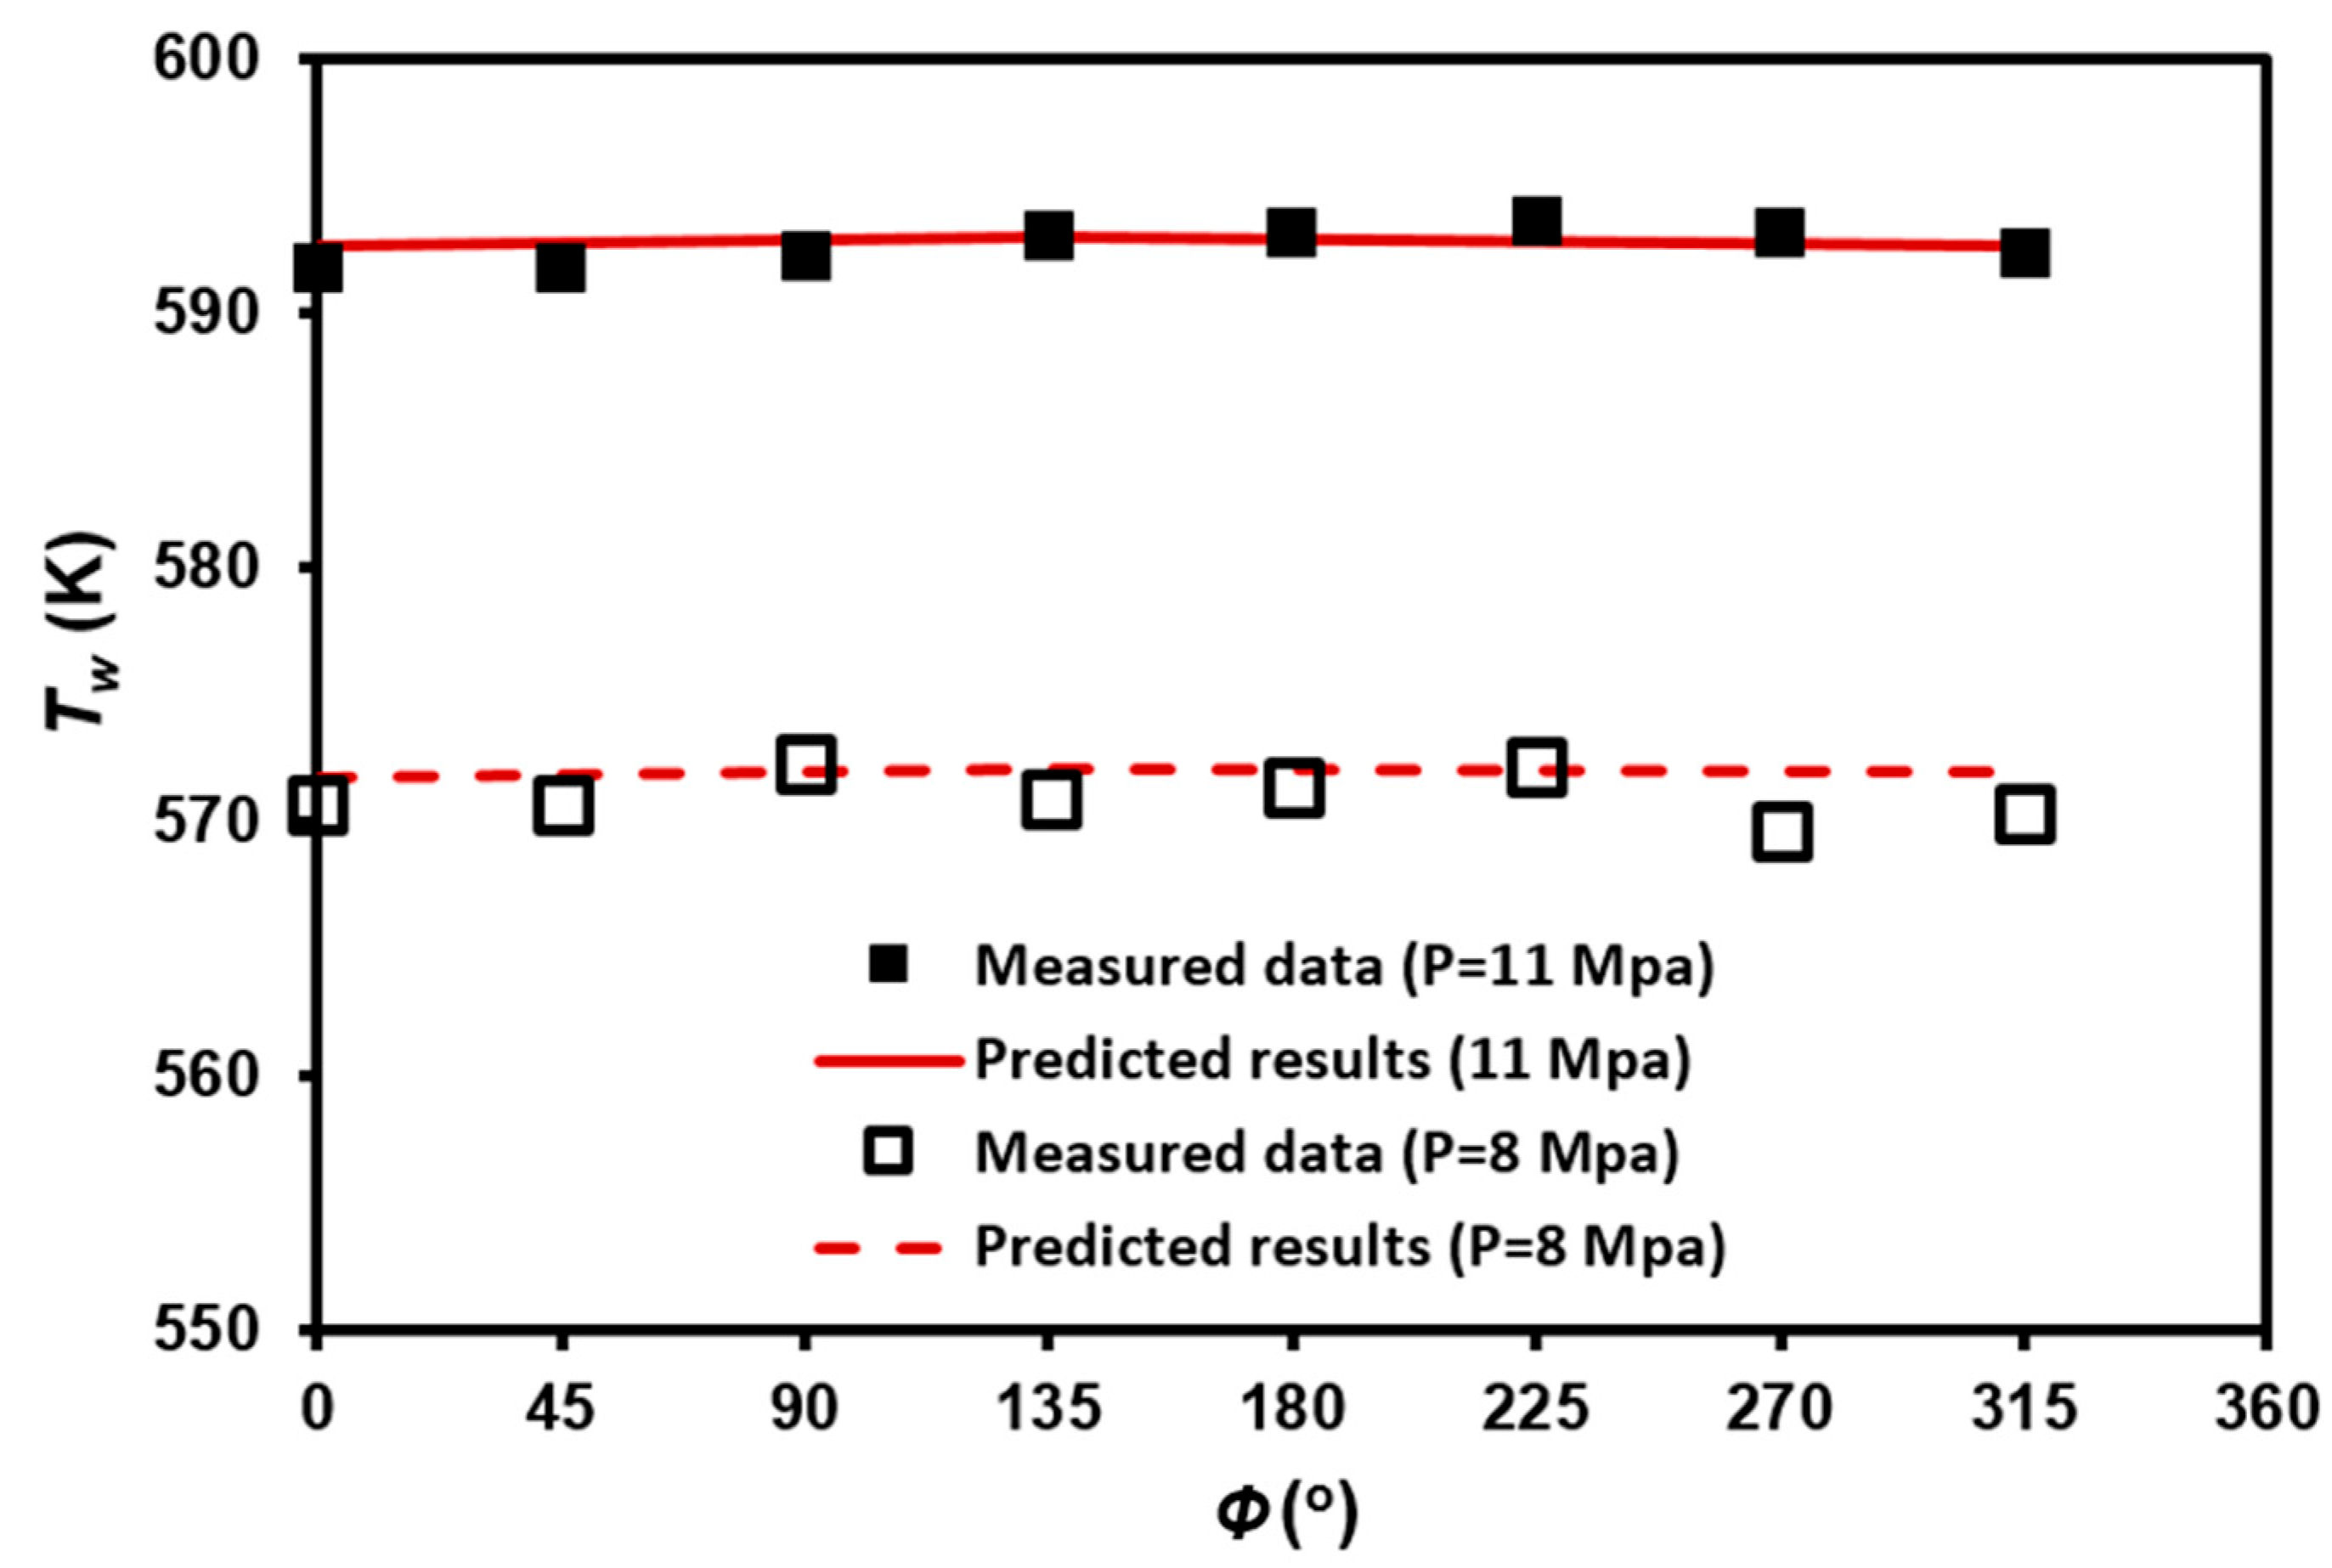
Another experimental work from Chang et al. [9] is also selected to validate the feasibility of the present CFD boiling methodology in capturing the inhomogeneity of the circumferential wall temperature. The dimensions for Chang et al.’s work [9] are also illustrated in Table 3. Figure 10 compares the measured data [9] and the predicted results for the wall temperature versus the circumferential angle at x = 0.1 under various operations conditions indicated in Table 4. More uniform distributions of circumferential wall temperature are revealed in the measured data from Chang et al. [9], compared with those in the data from Xiao et al. [6]. It can be clearly seen that the results predicted by the present CFD boiling models agree well with the measured ones, yielding remarkably low MAPEs of 0.110% and 0.170% under the 11 MPa and 8 MPa operating conditions, respectively. The wall temperature varies slightly along the circumferential angle. The maximum difference in wall temperature on the same cross-section is measured to be 1.5 °C at 8 MPa and 2.0 °C at 11 MPa, respectively. The corresponding predicted results are 0.6 °C at 8 MPa and 0.9 °C at 11 MPa, which is slightly lower than the data.
Figure 10.
Comparison of wall temperature versus circumferential angle.
A comparison of Figure 8 and Figure 10 reveals that the present boiling model under-predicts the inhomogeneity of circumferential wall temperature, with a larger discrepancy as compared with the data of Xiao et al. [6] and a slighter difference as compared with those of Chang et al. [9]. As mentioned in the Introduction, the boiling characteristics in an HCT investigated in this work were limited to nucleate boiling parameters (i.e., in the low-quality region) since the present boiling methodology adopts the RPI wall boiling model [18] as it is widely applied in the nuclear safety analysis field when using CFD. Due to the effects of gravitational and centrifugal forces in HCT, higher-density water would be pushed to the outer side and then more vapor will accumulate near the inner side. Therefore, an elongated slug or oval bubble would develop near the HCT wall even under the lower-quality conditions. This localized boiling characteristic departs from the nucleate boiling one, causing the inaccuracy of the RPI wall model in predicting the boiling heat transfer and the corresponding wall temperature there. The underestimation of wall temperature inhomogeneity is then shown in comparison with the test data. Several modifications are present in the RPI model to improve its capability in this boiling condition, including Lavieville et al. [41], Amidu and Kim [42], and Shi et al. [43]. The latter two modified models extend the capability of the RPI model from isolated bubbly flow to a slug flow. Their models would enhance the boiling heat transfer originally predicted by the RPI model, which cannot solve the underestimation of wall temperature inhomogeneity. Based on the RPI model, Lavieville et al. [41] proposed the non-equilibrium wall boiling model to consider another term for the convective heat flux of vapor phase () in the total wall boiling heat flux () as
where near-wall liquid fraction and = 0.2.
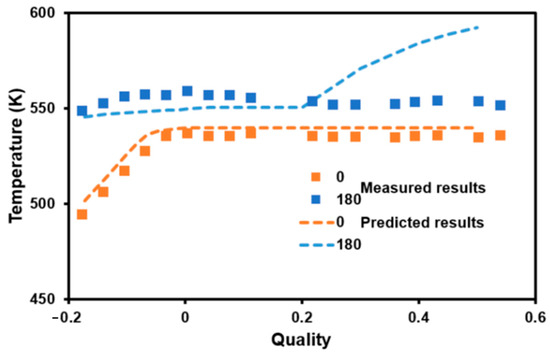
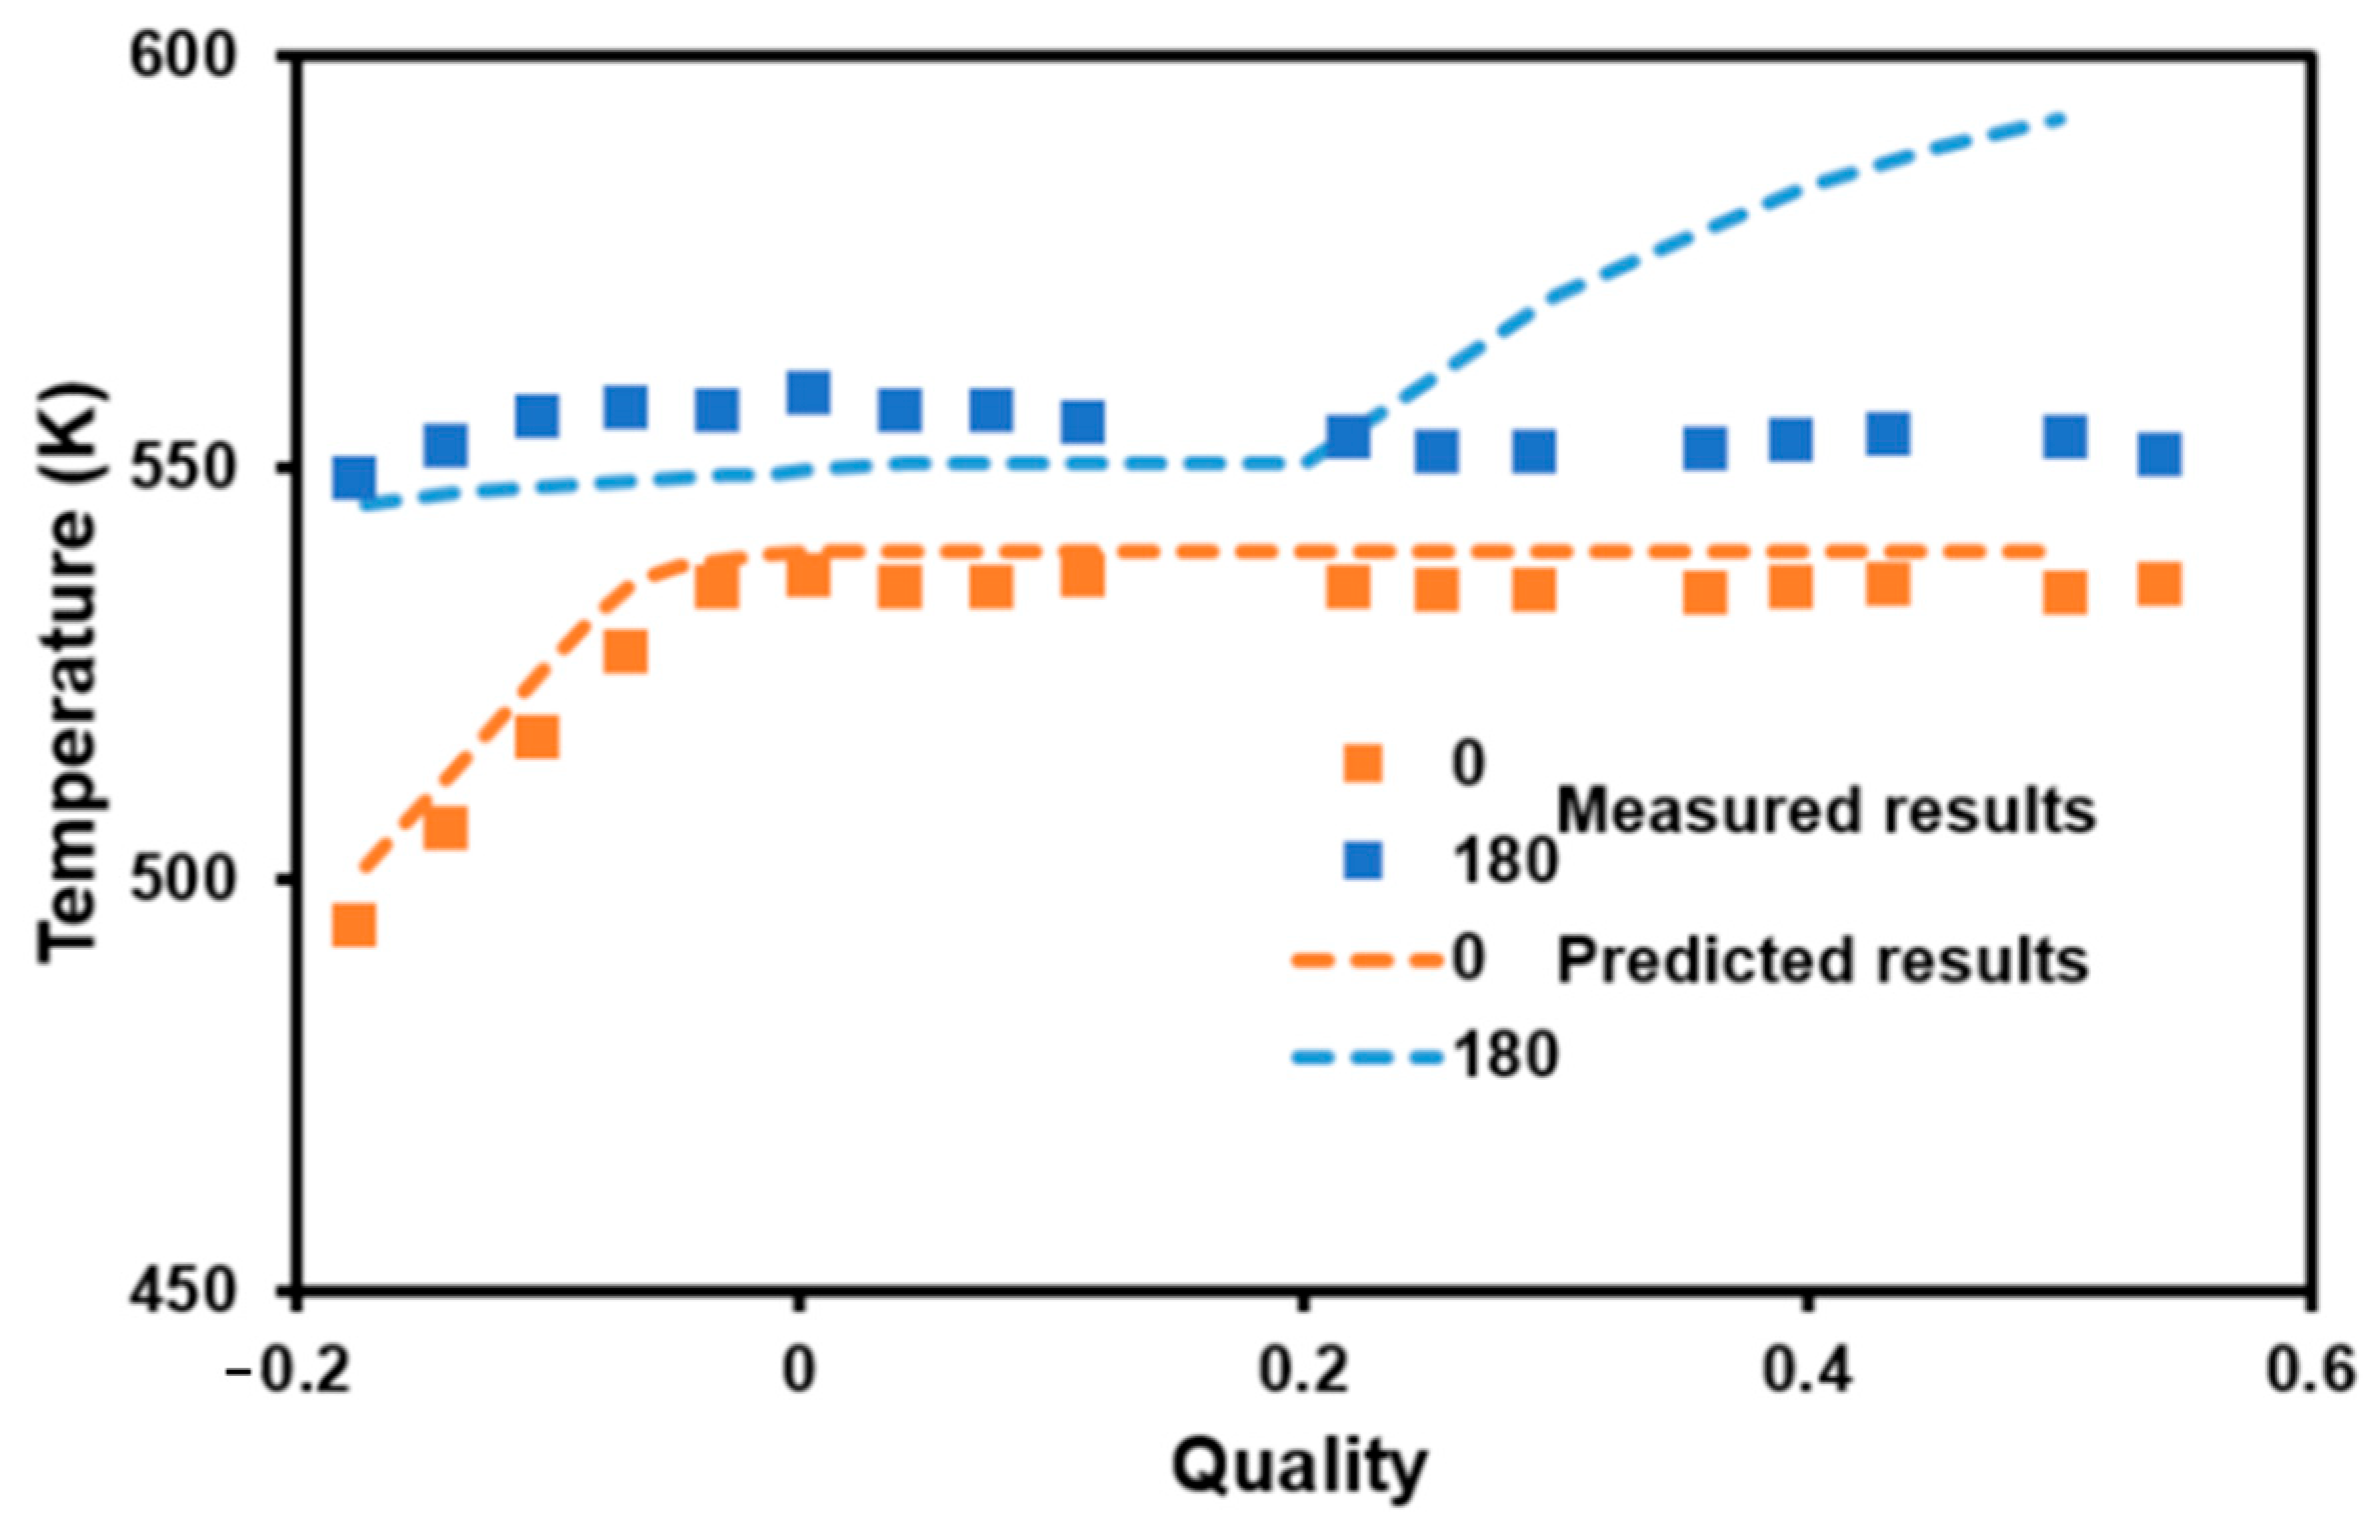
The non-equilibrium wall boiling model is adopted in NEPTUNE_CFD, that is, the multiphase-flow solver, which is the next-generation simulation tool for nuclear thermal-hydraulics. It is used in the French nuclear industry and was built in ANSYS Fluent 2022 R1. This non-equilibrium wall boiling model can extend the application of the original RPI model to the boiling pattern (slug or annular flow) near the CHF, similarly to the boiling characteristics that occurred near the inner side of the HCT. Therefore, this work would investigate the feasibility of the non-equilibrium wall boiling model in simulating the inhomogeneity of circumferential wall temperature in the boiling region of HCT. Figure 11 shows the comparison of wall temperature versus quality at the circumferential angles of 0° (outer side) and 180° (inner side). Dots represent the measured data of Xiao et al. [6] and dashed lines are the present predictions using the non-equilibrium wall boiling model. The sizes and test conditions are listed in the first rows of Table 3 and Table 4, respectively. This Figure clearly reveals that the wall temperature difference between ϕ = 0° and 180°, predicted using the non-equilibrium wall boiling model, are about 13.5 °C when the average quality on the cross-section of HCT is <0.2. This predicted maximum temperature difference of 13.5 °C on the cross-section is closer to the 18.7 °C from the measured data [6], and better than the 5.2 °C obtained using the RPI model. The non-equilibrium wall boiling model was mainly developed to capture the sudden increase in wall temperature near the CHF. The wall temperature at ϕ = 180° shows the suddenly increasing trend when quality is larger than 0.2, in a departure from the test trend. Therefore, the non-equilibrium wall boiling model may be modified so that it can be suitably applied to capture the boiling heat transfer characteristics within an HCT. Based on the present simulation work, the model improvement may focus on modifying the model of the weighting factor (Equation (24)) and the appropriate correlations of bubble dynamics for the oval bubbles near the inner side of HCT, etc.
Figure 11.
Comparison of wall temperature versus quality at the circumferential angles of 0° (outer side) and 180° (inner side).
4. Conclusions
This work investigates the feasibility and fidelity of present CFD boiling methodologies for predicting nucleate boiling heat transfer characteristics in a helically coiled tube, validated against three distinct experimental benchmarks [5,6,9]. The present model exhibits excellent agreement with the test data regarding the average boiling heat transfer coefficients and axial wall temperature profiles, confirming its capability to evaluate overall thermal performance and inform system-code correlations. Unlike previous Eulerian boiling studies that relied on isolated simulations or case-by-case parameter tuning, the principal methodological novelty of this work lies in establishing a physics-driven transferable evaluation framework anchored in localized flow regime evolutions.
However, the standard RPI wall boiling model under-predicts the circumferential wall temperature inhomogeneity due to its inability to capture asymmetric bubble accumulation along the inner curve. To address this gap, a systematic, mechanism-based model selection framework is formulated. Under flow conditions where symmetric Dean-like secondary flows dominate (typically characterized by low-to-moderate vapor quality and moderate heat-to-mass flux ratios), the standard RPI model serves as a robust baseline framework. When secondary-flow distortions and centrifugal-buoyancy competitions trigger severe phase segregation and localized CWTI, deploying the non-equilibrium wall boiling model significantly improves predictions. Nevertheless, its applicability remains bounded in regions with extreme phase separation due to sub-model limitations in current Eulerian frameworks.
To overcome these constraints across general HCT configurations without empirical parameter tuning, this study demonstrates that bubble dynamic sub-models must be governed by locally adaptive factors directly linked to the localized velocity gradients and secondary flow distortions along the tube circumference (). Furthermore, incorporating conjugate heat transfer (CHT) within the solid wall alongside global uncertainty quantification (UQ) frameworks represents a vital future extension. This holistic approach eliminates arbitrary parameter fitting and institutionalizes a reproducible, transferable numerical methodology for international small modular reactor safety licensing assessments.
Supplementary Materials
The following supporting information can be downloaded at: https://www.mdpi.com/article/10.3390/jne7030054/s1.
Author Contributions
Conceptualization, Y.S. and H.-T.T.; methodology, Y.-M.F.; software, Y.S. and H.-T.T.; validation, Y.S. and H.-T.T.; formal analysis, Y.S., H.-T.T., and Y.-M.F.; investigation, Y.S., H.-T.T., and Y.-M.F.; data curation, Y.S., H.-T.T., and Y.-M.F.; writing—Y.S. and Y.-M.F.; writing—review and editing, Y.S. and Y.-M.F.; supervision, Y.-M.F.; project administration, Y.-M.F. All authors have read and agreed to the published version of the manuscript.
Funding
This research was funded by the National Science and Technology Council of Taiwan, grant number NSTC 113-2221-E-007-123.
Data Availability Statement
The original contributions presented in this study are included in the article. Further inquiries can be directed to the corresponding author.
Conflicts of Interest
The authors declare no conflicts of interest.
Nomenclature
| Bo | boiling number |
| Cp | specific heat capacity, J/kg-K |
| h | enthalpy, J/kg |
| average enthalpy on the cross-section of HCT, J/kg | |
| hTP | boiling heat transfer coefficient, W/m2-K |
| hf | saturated liquid enthalpy, J/kg |
| hfg | latent heat, J/kg |
| p | pressure, N/m2 |
| heat flux, W/m2 | |
| Retp | two-phase Reynolds number |
| T | temperature, K |
| u | velocity, m/s |
| x | quality = |
| Xtt | Martinelli parameter |
| y+ | non-dimensional wall distance |
| Greek symbols | |
| α | void fraction |
| σ | surface tension, N/m |
| thermal conductivity, W/m-K | |
| density, kg/m3 | |
| μ | viscosity, N-s/m2 |
| τ | shear shress, N/m2 |
| ϕ | circumferential angle, ° |
| Subscripts | |
| liquid phase | |
| i,j | tensor index |
| k | phase |
| sat | saturated property |
| v | vapor phase |
| w | wall |
References
- Carelli, M.D.; Conway, L.; Oriani, L.; Petrović, B.; Lombardi, C.; Ricotti, M.; Barroso, A.; Collado, J.; Cinotti, L.; Todreas, N.; et al. The design and safety features of the IRIS reactor. Nucl. Eng. Des. 2004, 230, 151–167. [Google Scholar] [CrossRef] [Scilit]
- Marcel, C.P.; Delmastro, D.F.; Magni, M.C.; Calzetta, O. Innovative SMR from Argentina breaks ground. Nucl. Eng. Int. 2014, 59, 30. [Google Scholar]
- Chen, F.B.; Han, Z.H. Steady-state thermal fluids analysis for the HTR-PM equilibrium core. Int. J. Adv. Nucl. React. Des. Technol. 2021, 3, 11–17. [Google Scholar] [CrossRef] [Scilit]
- NuScale to Power Historic 6-GW SMR Project. Available online: https://www.nuscalepower.com/ (accessed on 19 July 2025).
- Santini, L.; Cioncolini, A.; Butel, M.T.; Ricotti, M.E. Flow boiling heat transfer in a helically coiled steam generator for nuclear power applications. Int. J. Heat Mass Transf. 2016, 92, 91–99. [Google Scholar] [CrossRef] [Scilit]
- Xiao, Y.; Hu, Z.X.; Chen, S.; Gu, H.Y. Experimental investigation of boiling heat transfer in helically coiled tubes at high pressure. Ann. Nucl. Energy 2018, 113, 409–419. [Google Scholar] [CrossRef] [Scilit]
- Baburajan, P.K.; Bisht, G.S.; Gupta, S.K.; Prabhu, S.V. Measurement of subcooled boiling pressure drop and local heat transfer coefficient in horizontal tube under LPLF conditions. Nucl. Eng. Des. 2013, 255, 169–179. [Google Scholar] [CrossRef] [Scilit]
- Gungor, K.E.; Winterton, R. A general correlation for flow boiling in tubes and annuli. Int. J. Heat Mass Transf. 1986, 29, 351–358. [Google Scholar] [CrossRef] [Scilit]
- Chang, F.C.; Liu, Y.M.; Lou, J.C.; Shang, Y.H.; Hu, H.; Li, H.X. Experimental investigation on flow boiling heat transfer characteristics of water and circumferential wall temperature inhomogeneity in a helically coiled tube. Chem. Eng. Sci. 2023, 272, 118592. [Google Scholar] [CrossRef] [Scilit]
- Su, Y.Q.; Li, X.W.; Wu, X.X. Experimental investigation of subcooled flow boiling characteristics of water in vertical helically coiled tubes. Nucl. Eng. Des. 2024, 430, 113716. [Google Scholar] [CrossRef] [Scilit]
- Su, Y.Q.; Li, X.W.; Wu, X.X. Experimental investigation of saturated flow boiling of water in vertical helically coiled tubes. Ann. Nucl. Energy 2025, 219, 111464. [Google Scholar] [CrossRef] [Scilit]
- Wu, Z.Y.; Shi, Y.G.; Li, K.P.; Zhang, K.; Tian, W.X.; Qiu, S.Z. Experimental study on boiling heat transfer characteristics in helical coils with large coiled diameters. Ann. Nucl. Energy 2026, 225, 111793. [Google Scholar] [CrossRef] [Scilit]
- Wu, J.X.; Li, X.; Liu, H.D.; Zhao, K.L.; Liu, S.L. Calculation method of gas–liquid two-phase boiling heat transfer in helically-coiled tube based on separated phase flow model. Int. J. Heat Mass Transf. 2020, 161, 120242. [Google Scholar] [CrossRef] [Scilit]
- Wu, J.X.; Tang, Z.; Zhu, Y.D.; Li, X.; Wang, H.X.; Shi, Q. Two-phase secondary flow characteristics and heat transfer mechanism during boiling in a vertical helically coiled tube. Int. Commun. Heat Mass Transf. 2022, 138, 106398. [Google Scholar] [CrossRef] [Scilit]
- Wu, J.X.; Li, Z.; Li, S.G.; Chen, Y.B.; Liu, S.L.; Xia, C.J.; Chen, Y.D. Numerical simulation research on two-phase flow boiling heat transfer in helically coiled tube. Nucl. Eng. Des. 2022, 395, 111827. [Google Scholar] [CrossRef] [Scilit]
- Chen, F.; Liu, S.H.; Wu, J.F.; Meng, S.M.; Jin, D.S.; Zhu, X.L. Influences of coil diameter and pitch of helical-coiled tubes on flow instability in OTSG of small modular pressurized water reactor. Nucl. Eng. Des. 2025, 442, 114263. [Google Scholar] [CrossRef] [Scilit]
- Shen, C.; Liu, M.; Xu, Z.; Cheng, K.; Liu, L.; Gu, H. Study on two-phase flow instability of parallel helical tubes in steam generator of small modular reactors. Int. Commun. Heat Mass Transf. 2023, 148, 107023. [Google Scholar] [CrossRef] [Scilit]
- Kurul, N.; Podowski, M.Z. Multi-dimensional effects in forced convection subcooled boiling. In Proceedings of the 9th Heat Transfer Conference; Hemisphere Publishing Corporation: Jerusalem, Israel, 1990. [Google Scholar]
- NEA. Best Practice Guidelines for the Use of CFD in Nuclear Reactor Safety Applications—Revision; NEA/CSNI/R; NEA: Boulogne-Billancourt, France, 2022. [Google Scholar]
- Ranz, W.E.; Marshall, W.R., Jr. Vaporation from drops, Part I. Chem. Eng. Prog. 1952, 48, 141–146. [Google Scholar]
- Ishii, M.; Zuber, N. Drag coefficient and relative velocity in bubbly, droplet or particulate flows. AIChE J. 1979, 25, 843–855. [Google Scholar] [CrossRef] [Scilit]
- Tomiyama, A.; Kataoka, I.; Zun, I.; Sakaguchi, T. Drag coefficients of single bubbles under normal and micro gravity conditions. JSME Int. J. Ser. B Fluids Therm. Eng. 1998, 41, 472. [Google Scholar] [CrossRef] [Scilit]
- Antal, S.P.; Lahey, R.T.; Flaherty, J.E. Analysis of phase distribution in fully developed laminar bubbly two-phase flow. Int. J. Multiph. Flow 1991, 17, 635. [Google Scholar] [CrossRef] [Scilit]
- Lopez de Bertodano, M.; Sun, X.; Ishii, M.; Ulke, A. Phase distribution in the cap bubble regime in a duct. J. Fluids Eng. 2006, 128, 811. [Google Scholar] [CrossRef] [Scilit]
- Bournaski, E. Numerical simulation of unsteady multiphase pipeline flow with virtual mass effect. Int. J. Numer. Methods Eng. 1992, 34, 727–740. [Google Scholar] [CrossRef] [Scilit]
- Menter, F.R. Two-equation eddy-viscosity turbulence models for engineering applications. AIAA J. 1994, 32, 1598–1605. [Google Scholar] [CrossRef] [Scilit] [PubMed]
- Del Valle, V.H.; Kenning, D.B.R. Subcooled flow boiling at high heat flux. Int. J. Heat Mass Transf. 1985, 28, 1907. [Google Scholar] [CrossRef] [Scilit]
- Tolubinski, V.I.; Kostanchuk, D.M. Vapor bubbles growth rate and heat transfer intensity at subcooled water boiling. In Proceedings of the 4th International Heat Transfer Conference, Paris, France, 31 August–5 September 1970. [Google Scholar]
- Lemmert, M.; Chawla, L.M. Influence of Flow Velocity on Surface Boiling Heat Transfer Coefficient in Heat Transfer in Boiling; Academic Press & Hemisphere: New York, NY, USA, 1977. [Google Scholar]
- Cole, R. A Photographic study of pool boiling in the region of the critical heat flux. AIChE J. 1960, 6, 533–542. [Google Scholar] [CrossRef] [Scilit]
- Kocamustafaogullari, G. Pressure dependence of bubble departure diameter for water. Int. Comm. Heat Mass Transf. 1983, 10, 501–509. [Google Scholar] [CrossRef] [Scilit]
- Kocamustafaogullari, G.; Ishii, M. Foundation of the interfacial area transport equation and its closure relations. Int. J. Heat Mass Transf. 1995, 38, 481–493. [Google Scholar] [CrossRef] [Scilit]
- ANSYS. Fluent User’s Guide. 2022. Available online: https://ansyshelp.ansys.com/public/account/secured?returnurl=/Views/Secured/corp/v252/en/flu_ug/flu_ug.html (accessed on 19 July 2025).
- Moles, F.D.; Shaw, J.F.G. Boiling heat-transfer to sub-cooled liquids under conditions of forced convection. Chem. Eng. Sci. 1972, 50, 76. [Google Scholar]
- Chen, J.C. Correlation for boiling heat transfer to saturated fluids in convective flow. Ind. Eng. Chem. Process Des. Dev. 1966, 5, 322–329. [Google Scholar] [CrossRef] [Scilit]
- Zhao, L.; Guo, L.; Bai, B.; Hou, Y.; Zhang, X. Convective boiling heat transfer and two-phase flow characteristics inside a small horizontal helically coiled tubing once-through steam generator. Int. J. Heat Mass Transf. 2003, 46, 4779–4788. [Google Scholar] [CrossRef] [Scilit]
- Chung, Y.J.; Bae, K.H.; Kim, K.K.; Lee, W.J. Boiling heat transfer and dryout in helically coiled tubes under different pressure conditions. Ann. Nucl. Energy 2014, 71, 298–303. [Google Scholar] [CrossRef] [Scilit]
- Fsadni, A.M.; Whitty, J.P.M. A review on the two-phase heat transfer characteristics in helically coiled tube heat exchangers. Int. J. Heat Mass Transf. 2016, 95, 551–565. [Google Scholar] [CrossRef] [Scilit]
- Wang, M.L.; Zheng, M.G.; Wang, R.; Tian, L.; Ye, C.; Chen, Y.; Gu, H.Y. Experimental studies on local and average heat transfer characteristics in helical pipes with single phase flow. Ann. Nucl. Energy 2019, 123, 78–85. [Google Scholar] [CrossRef] [Scilit]
- Tsai, H.-T.; Lu, B.-J.; Ferng, Y.-M.; Sun, Y. Using CFD Modeling to Investigate the Non-Uniform Circumferential Distribution of Heat Transfer Characteristics in a Single-Phase Helical Coiled Tube. J. Nucl. Eng. 2025, 6, 41. [Google Scholar] [CrossRef] [Scilit]
- Lavieville, J.; Quemarais, E.; Boucker, M.A.M.L. Neptune-CFD User Guide; Électricité de France (EDF): Chatou, France, 2010. [Google Scholar]
- Amidu, M.A.; Kim, H. Modeling and simulation of flow boiling heat transfer on a downward-facing heating wall in the presence of vapor slugs. Nucl. Eng. Des. 2019, 351, 175–188. [Google Scholar] [CrossRef] [Scilit]
- Shi, J.W.; Zhang, R.I.; Zhu, Z.Q.; Ren, T.T.; Yan, C.Q. A modified wall boiling model considering sliding bubbles based on the RPI wall boiling model. Int. J. Heat Mass Transf. 2020, 154, 119776. [Google Scholar] [CrossRef] [Scilit]

Disclaimer/Publisher’s Note: The statements, opinions and data contained in all publications are solely those of the individual author(s) and contributor(s) and not of MDPI and/or the editor(s). MDPI and/or the editor(s) disclaim responsibility for any injury to people or property resulting from any ideas, methods, instructions or products referred to in the content. |
© 2026 by the authors. Licensee MDPI, Basel, Switzerland. This article is an open access article distributed under the terms and conditions of the Creative Commons Attribution (CC BY) license.