


Abstract
Endocrine disturbance and impaired physical reserve coexist in cirrhosis, but female-specific associations between circulating sex hormones and frailty remain insufficiently characterized. We examined hormone–frailty associations across menopausal categories in a clinical database of women with cirrhosis. This exploratory, single-centre, record-based cross-sectional analysis used retrospectively reviewed clinical records of 94 women with cirrhosis treated at “Sf. Apostol Andrei” Emergency County Hospital, Constanța, Romania, during January 2021–March 2025. The continuous Liver Frailty Index (LFI) was the principal outcome; handgrip strength and L3 skeletal muscle index were complementary phenotypes. Six separate linear models evaluated estradiol, follicle-stimulating hormone (FSH), luteinizing hormone, progesterone, total testosterone, and sex hormone-binding globulin, adjusting for age, recorded MELD-Na, and body mass index. HC3 heteroscedasticity-robust confidence intervals and Benjamini–Hochberg false-discovery-rate correction were used. Sensitivity analyses addressed menopausal status, exogenous hormones, inflammation, disease severity, sampling context, and severe hepatic encephalopathy (HE). There were 10 premenopausal, 11 perimenopausal, and 73 postmenopausal women. Median LFI was 3.76 (interquartile range, 3.14–4.48); 25 women (26.6%) had LFI ≥ 4.4. Estradiol was not clearly associated with LFI after adjustment: coefficient −0.022 per doubling (95% confidence interval, −0.257 to 0.214; p = 0.855). FSH was associated with higher LFI: 0.125 per 10 mIU/mL (0.042–0.208; p = 0.004; adjusted q = 0.022). The FSH estimate remained positive in postmenopausal women, but its interval crossed zero after excluding records labelled with severe HE. No hormone–muscle correlation survived correction across 18 exploratory comparisons. FSH, but not estradiol, showed an adjusted cross-sectional association with frailty. These findings do not establish causality, prognostic utility, or an indication for hormone treatment. Unresolved sampling-context and physical-assessment timing require source-record verification before clinical interpretation.
1. Introduction
Frailty captures diminished physiological reserve that is not adequately described by a liver-disease severity score alone. In cirrhosis, it is clinically important because impaired physical function can coexist with biochemical stability, while acute decompensation can also produce substantial functional deterioration. A recent systematic review estimated a pooled frailty prevalence of 27%, although heterogeneity was considerable and the estimate should not be treated as a universal benchmark [1]. Meta-analyses have also linked frailty to worse transplant-free survival and other adverse outcomes [2,3]. These associations support systematic functional assessment, but they do not establish that every correlate of frailty is a causal therapeutic target.
Frailty and sarcopenia describe related but non-identical phenotypes. Physical performance integrates muscle function, balance, coordination, cognition, and the capacity to execute a task, whereas an imaging-derived muscle index principally measures muscle quantity. The contemporary cirrhosis literature emphasizes that these domains may diverge and that their relationships depend on assessment method and clinical setting [4]. This distinction is particularly important when interpreting an endocrine biomarker: a hormone may track physical performance without corresponding to a lower cross-sectional muscle area or may reflect illness severity rather than a primary muscle process.
Women warrant specific study rather than extrapolation from male cohorts. Cirrhosis can disturb gonadal signalling, hepatic hormone handling, and circulating binding proteins, potentially changing the relation between measured concentrations and biological activity [5]. At the same time, reproductive ageing alters ovarian and pituitary hormone profiles. Experimental and clinical reviews describe plausible links between estrogen signalling, mitochondrial function, muscle protein turnover, and muscle maintenance [6]. Nevertheless, recent human evidence remains heterogeneous, and comparisons between premenopausal and postmenopausal women are often strongly confounded by age, activity, body composition, and associated illness [7].
The liver–reproductive relationship is also bidirectional in the wider literature. Reviews of metabolic dysfunction-associated steatotic liver disease describe changes across the reproductive lifespan, while endocrine reviews examine how estrogen deficiency may influence hepatic metabolism [8,9]. These findings provide biological context, not direct evidence that low circulating estradiol causes frailty in women with established cirrhosis. A concentration measured during illness represents the combined effects of production, distribution, binding, and clearance. Its association with a functional score cannot, by itself, identify which component is responsible.
Moreover, the exclusions applied to recent decompensating events in that cohort limit straightforward comparison with a database containing substantial recorded hepatic encephalopathy (HE) [10]. Its female findings involved the growth hormone/insulin-like growth factor axis rather than establishing a reproducible FSH–frailty relationship. Moreover, the exclusions applied to recent decompensating events in that cohort limit straightforward comparison with a database containing substantial recorded HE.
The present study therefore examines a clinically relevant but deliberately bounded question: are circulating reproductive hormones associated with recorded physical frailty in women with cirrhosis after accounting for age, liver-disease severity, and body mass index? Estradiol was the focal biological exposure, while five additional hormonal measures were evaluated as exploratory comparators. Continuous LFI was prioritized to preserve information; grip strength and L3 muscle index were retained as complementary measures rather than interchangeable definitions of the same condition. The analysis was designed to distinguish a measurable association from an inferred mechanism, and to make data limitations visible rather than resolve them through undocumented assumptions.
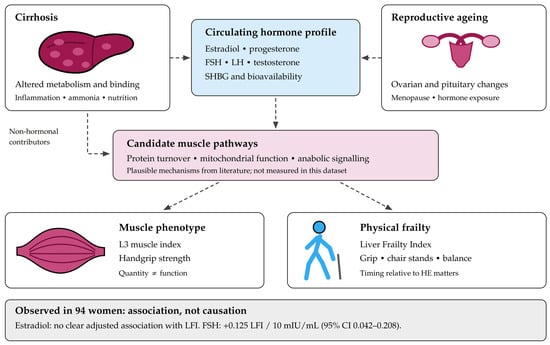
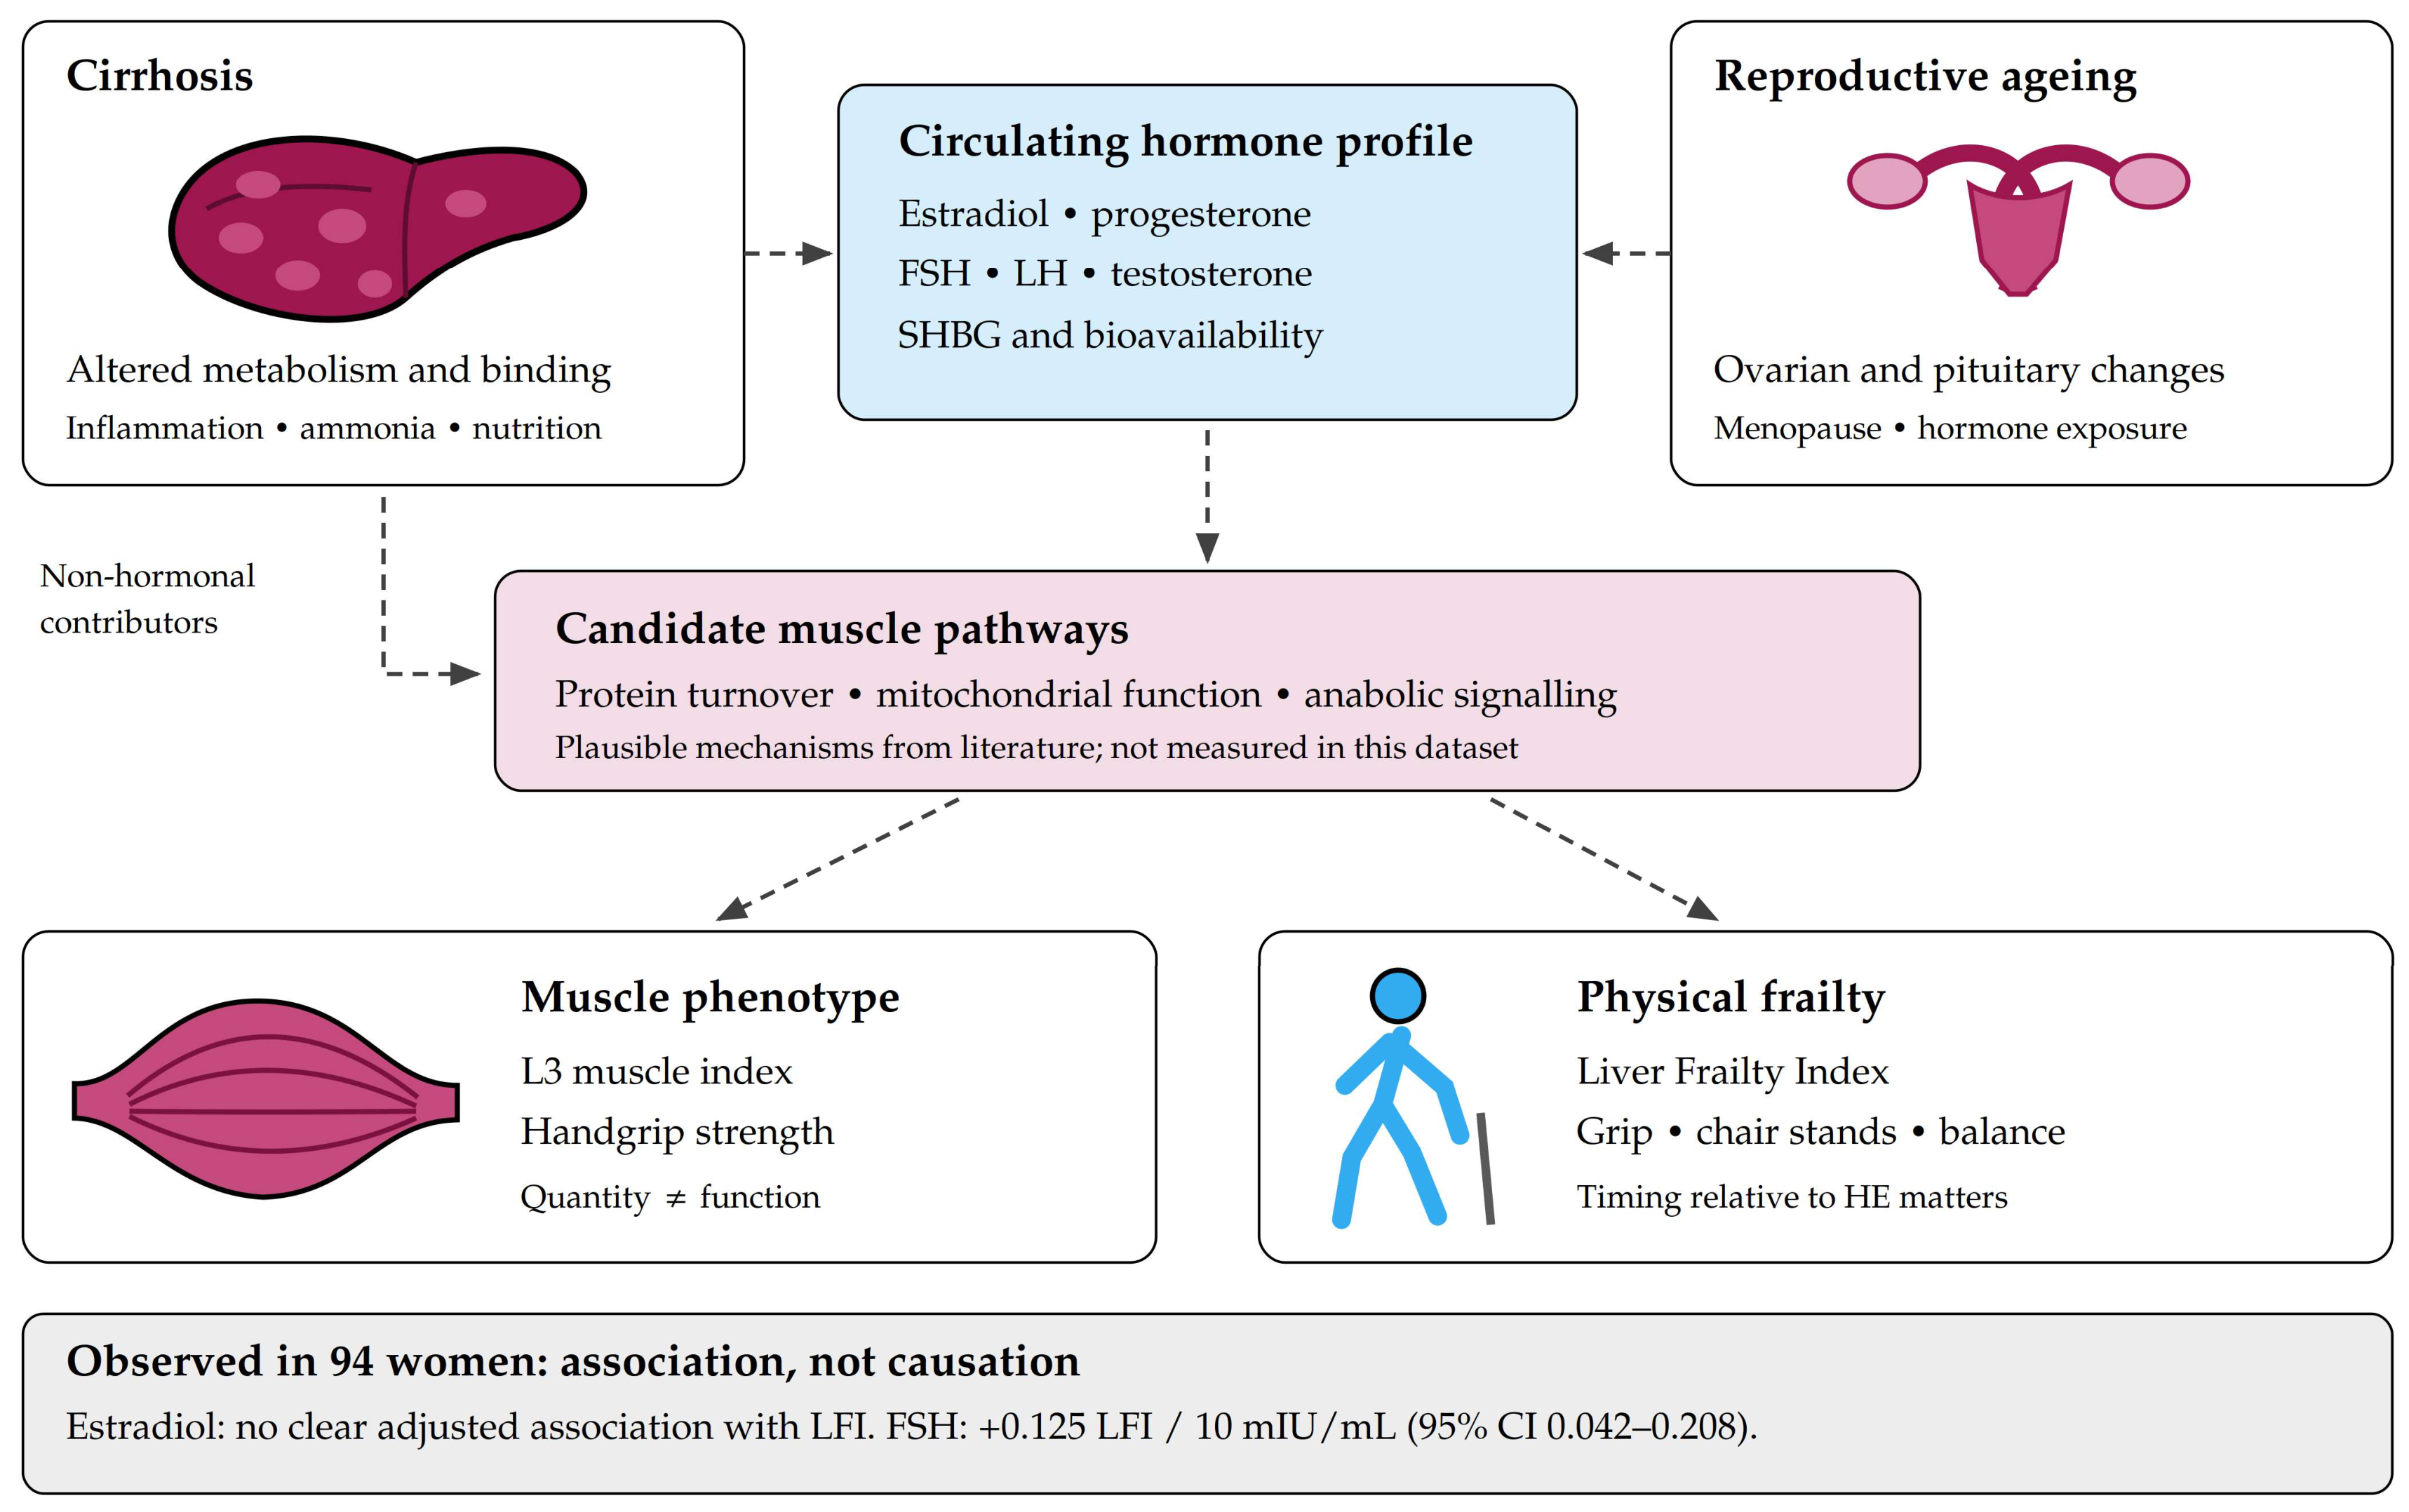
The proposed sex hormone–frailty framework is shown in Figure 1. It separates the biological pathways suggested by the literature from the associations actually estimable in this database. Reproductive ageing and cirrhosis may both influence circulating hormone profiles, while inflammation, nutritional impairment, hyperammonaemia, and deconditioning can affect muscle and physical performance through non-hormonal routes [4,5,6,7]. None of the molecular mechanisms displayed in the figure was directly measured or experimentally tested in this study.
Figure 1.
Sex hormone–frailty axis in women with cirrhosis. Created in BioRender. Nelson Twakor, A. (2026) https://BioRender.com/q4qs4v4.
The principal objective was to estimate the association between estradiol and continuous LFI with adjustment for selected clinical covariates. Secondary objectives were to evaluate the remaining hormonal measures, describe menopausal-group differences, and examine whether the pattern differed between muscle quantity and function. Sensitivity analyses assessed the stability of the estradiol and FSH estimates under alternative restrictions and covariate sets. The study was not designed to establish a causal endocrine pathway, define an FSH diagnostic threshold, predict individual outcomes, or evaluate the efficacy of menopausal hormone therapy.
Novelty and Contribution of the Study
The contribution of this study is its women-only evaluation of six circulating reproductive-hormone measures alongside continuous physical frailty, grip strength, and imaging-derived muscle quantity. Unlike the cited mixed-sex cirrhosis cohort, in which all female participants were postmenopausal [10], the present database includes women recorded as premenopausal, perimenopausal, and postmenopausal, although the groups are unbalanced and their classification was not independently adjudicated. The analysis distinguishes the focal estradiol question from exploratory associations involving FSH and the other hormones, reports multiplicity-adjusted results, and examines whether the FSH–LFI association persists within the recorded postmenopausal subgroup. The resulting contribution is a female-specific, hypothesis-generating association pattern, not proof of a causal hormone–frailty pathway or the first demonstration of endocrine involvement in cirrhosis-related frailty.
2. Results
2.1. Clinical Characteristics
All 94 supplied records contributed to the principal analyses. There were 10 premenopausal women (10.6%), 11 perimenopausal women (11.7%), and 73 postmenopausal women (77.7%). Mean age was 61.6 ± 10.6 years. The database therefore predominantly represents postmenopausal women rather than balanced samples across the reproductive lifespan. Baseline characteristics are shown in Table 1.
Table 1.
Clinical characteristics by recorded menopausal status.
Median age was 41.05 years in the premenopausal group, 50.90 years in the perimenopausal group, and 65.30 years in the postmenopausal group. These values are reported descriptively, without a between-group significance test. The observed distributions of BMI, MELD-Na, Child–Pugh points, albumin, and CRP did not show clear between-group separation in the exploratory tests. Non-significant results should not be interpreted as proof of clinical equivalence, particularly given the small premenopausal and perimenopausal groups.
The principal recorded cirrhosis etiologies were metabolic dysfunction-associated steatotic liver disease in 32 women, alcohol-related disease in 19, hepatitis C in 12, autoimmune hepatitis in 10, hepatitis B in eight, primary biliary cholangitis in seven, and other etiologies in six. Ascites was recorded in 45 women (47.9%), overt HE in 62 (66.0%), and severe HE in 43 (45.7%). Three women used hormone therapy and three used hormonal contraception. This clinical context is important because hormone measurement and physical testing may have occurred under different degrees of acute illness.
2.2. Hormone Profiles and Physical Phenotypes
Hormone concentrations, physical measures, and derived categorical indicators are presented in Table 2. Estradiol, FSH, LH, and progesterone differed across recorded menopausal categories, whereas total testosterone did not. The SHBG comparison was borderline at the unadjusted descriptive level (p = 0.055) and was not interpreted as evidence of an established group difference.
Table 2.
Hormonal and physical characteristics by menopausal status.
Median LFI was 3.76 [3.14, 4.48]. Using the descriptive thresholds, 26 women were classified as robust, 43 as prefrail, and 25 as frail. Raising the frailty threshold from 4.4 to 4.5 reduced the count from 25 to 24.
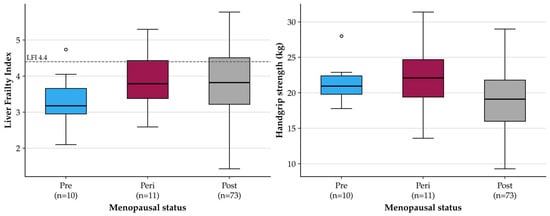
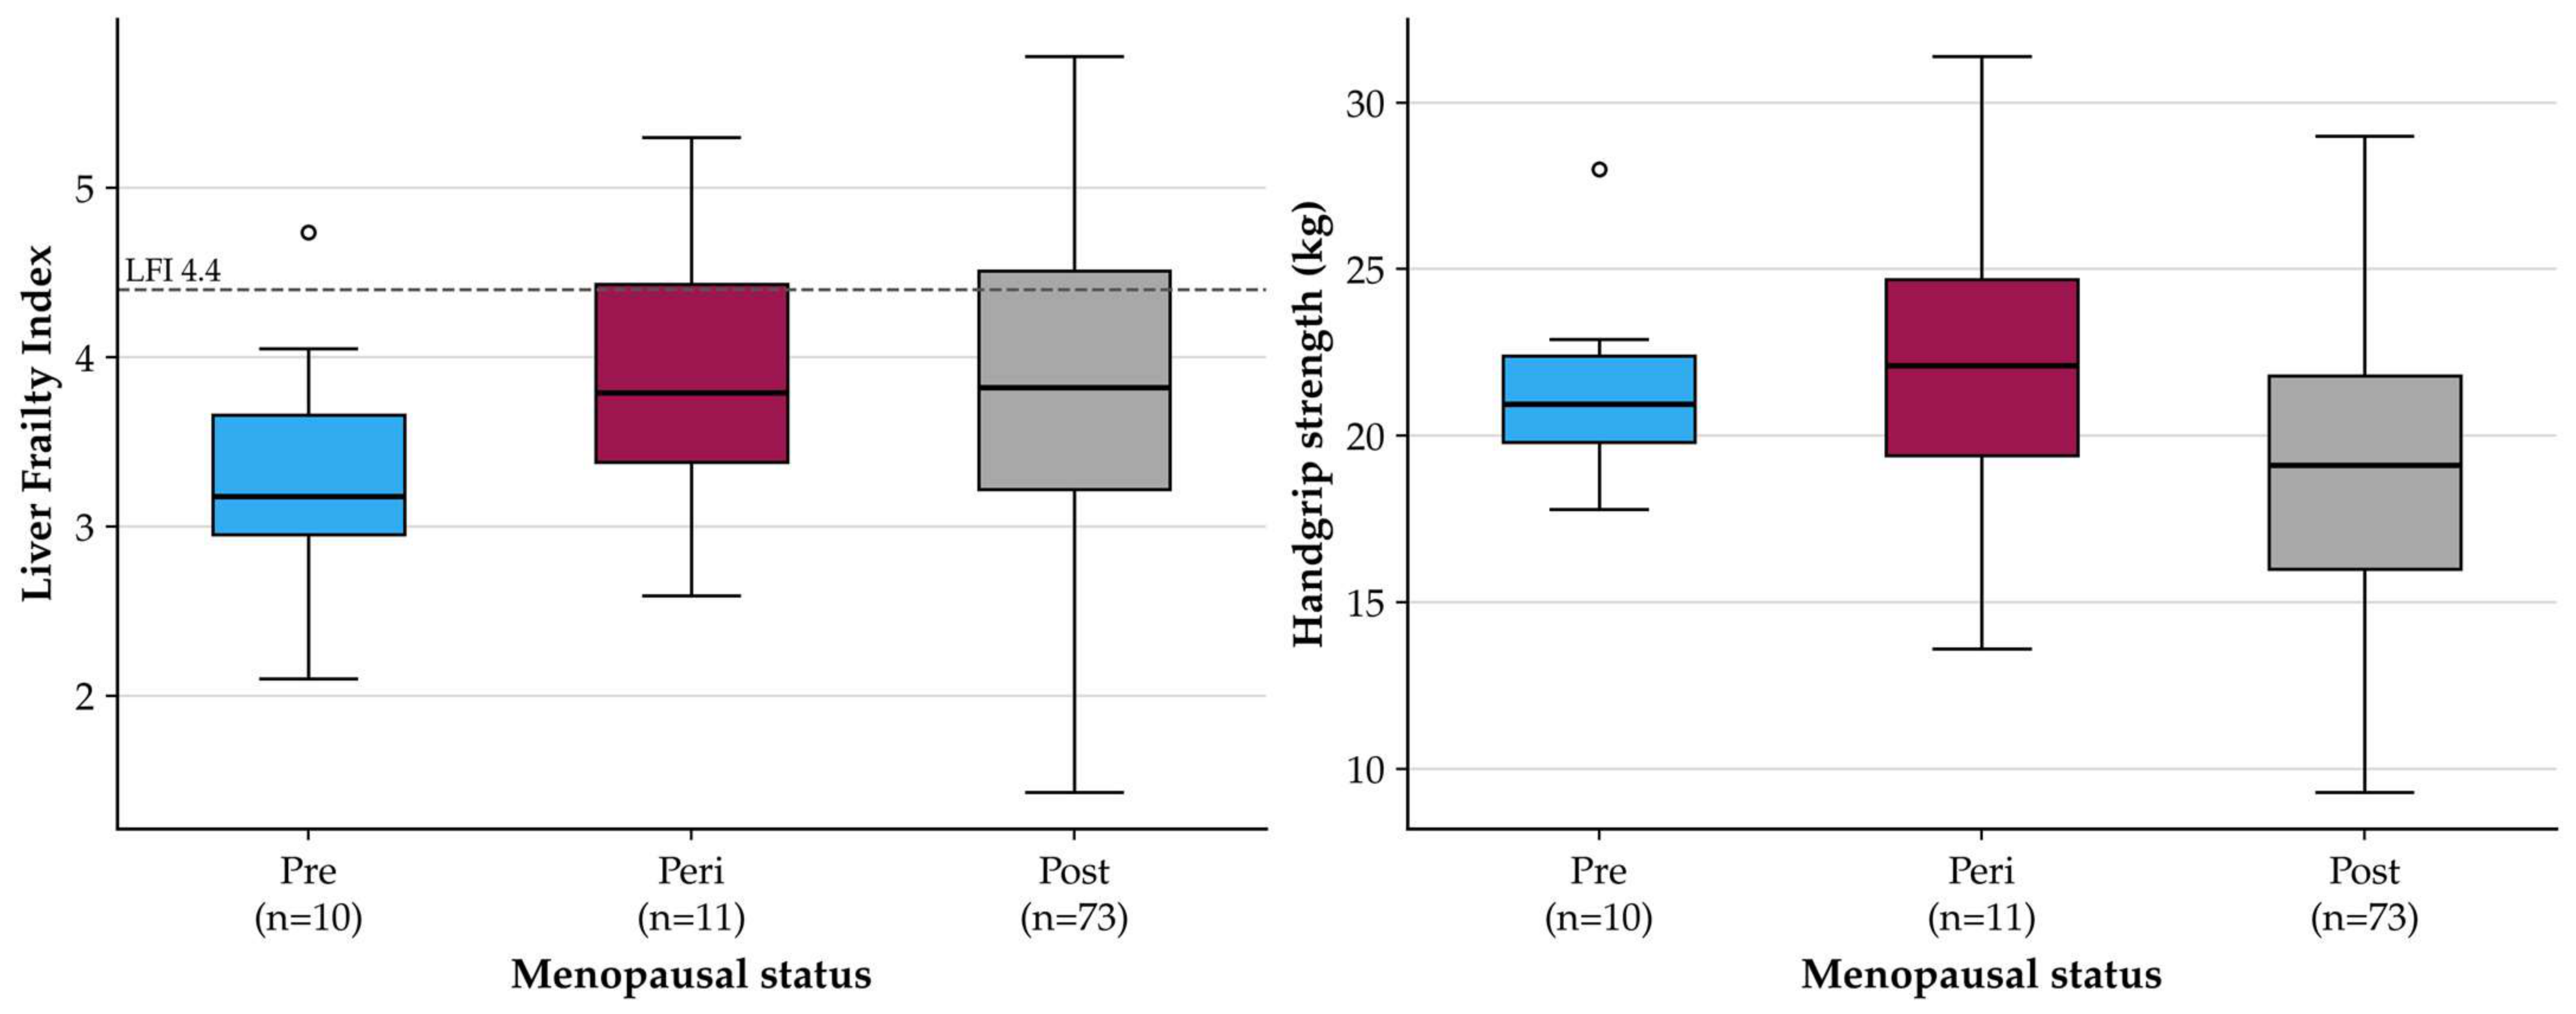
LFI distributions overlapped across menopausal groups, with an unadjusted Kruskal–Wallis p value of 0.165. Grip strength differed at the nominal level (p = 0.041), whereas L3 muscle index did not (p = 0.661). The grip finding is descriptive and should not be interpreted as an age-independent menopausal effect. Twenty women had a grip strength <16 kg, and 39 had an L3 index < 39 cm2/m2. The recorded sarcopenia diagnosis was present in 45 women (47.9%), whereas the analyst-derived low-muscle-mass indicator, defined as L3 skeletal muscle index < 39 cm2/m2, was present in 39 women (41.5%). The recorded sarcopenia diagnosis and the low-L3-index indicator disagreed in 46 records and were therefore reported separately rather than treated as equivalent classifications; low muscle quantity alone does not establish an interchangeable sarcopenia diagnosis.
2.3. Distributions and Unadjusted Hormone–Muscle Relationships
Figure 2 displays LFI and grip-strength distributions by menopausal category. These plots retain the marked imbalance in group sizes and show the spread within each group rather than implying that group averages describe every participant. Correlations between the six hormonal measures and the three continuous physical outcomes are summarized in Table 3.
Figure 2.
Physical phenotype distributions by menopausal status. Boxes show the interquartile range, with a median line; whiskers extend to observations within 1.5 interquartile ranges, and points beyond the whiskers are shown individually. The dashed line denotes the analytic LFI threshold of 4.4, not a validated decision rule for this cohort. Pre, premenopausal; Peri, perimenopausal; Post, postmenopausal.
Table 3.
Exploratory Spearman correlations between hormones and physical measures.
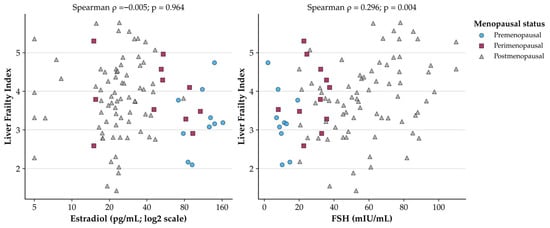
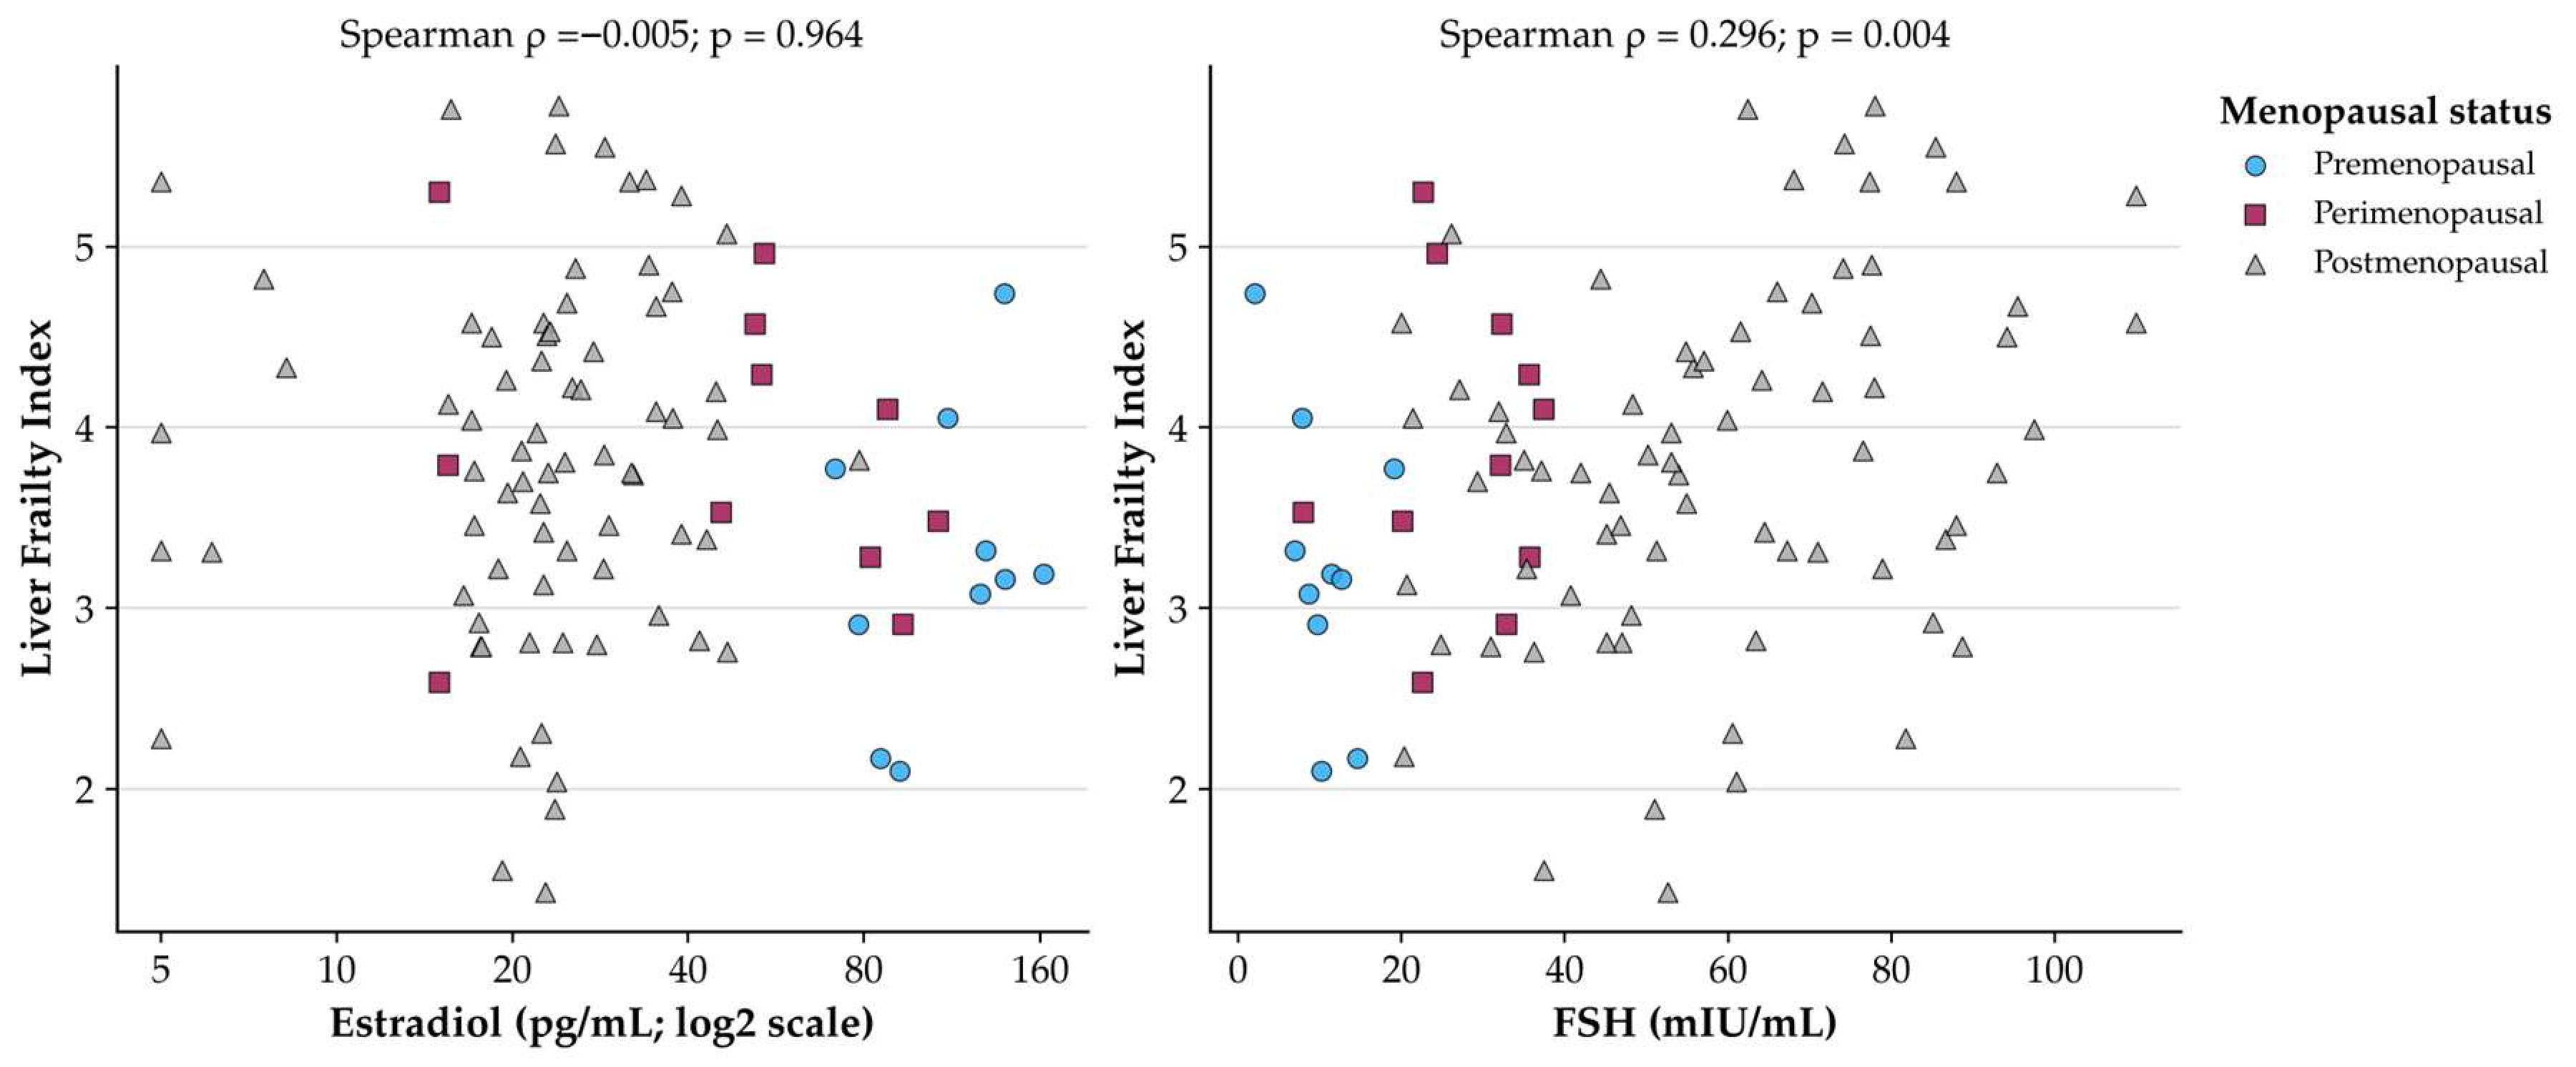
FSH correlated positively with LFI (ρ = 0.296; raw p = 0.004) and inversely with grip strength (ρ = −0.256; raw p = 0.013). Progesterone correlated positively with grip strength (ρ = 0.245; raw p = 0.017). However, none of these relationships survived correction across the 18-test correlation family. Estradiol showed essentially no monotonic relationship with LFI (ρ = −0.005; p = 0.964), and no hormone demonstrated a clearly supported relationship with L3 muscle index.
2.4. Adjusted Associations with Continuous Frailty
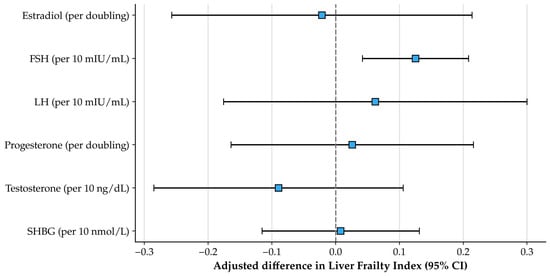
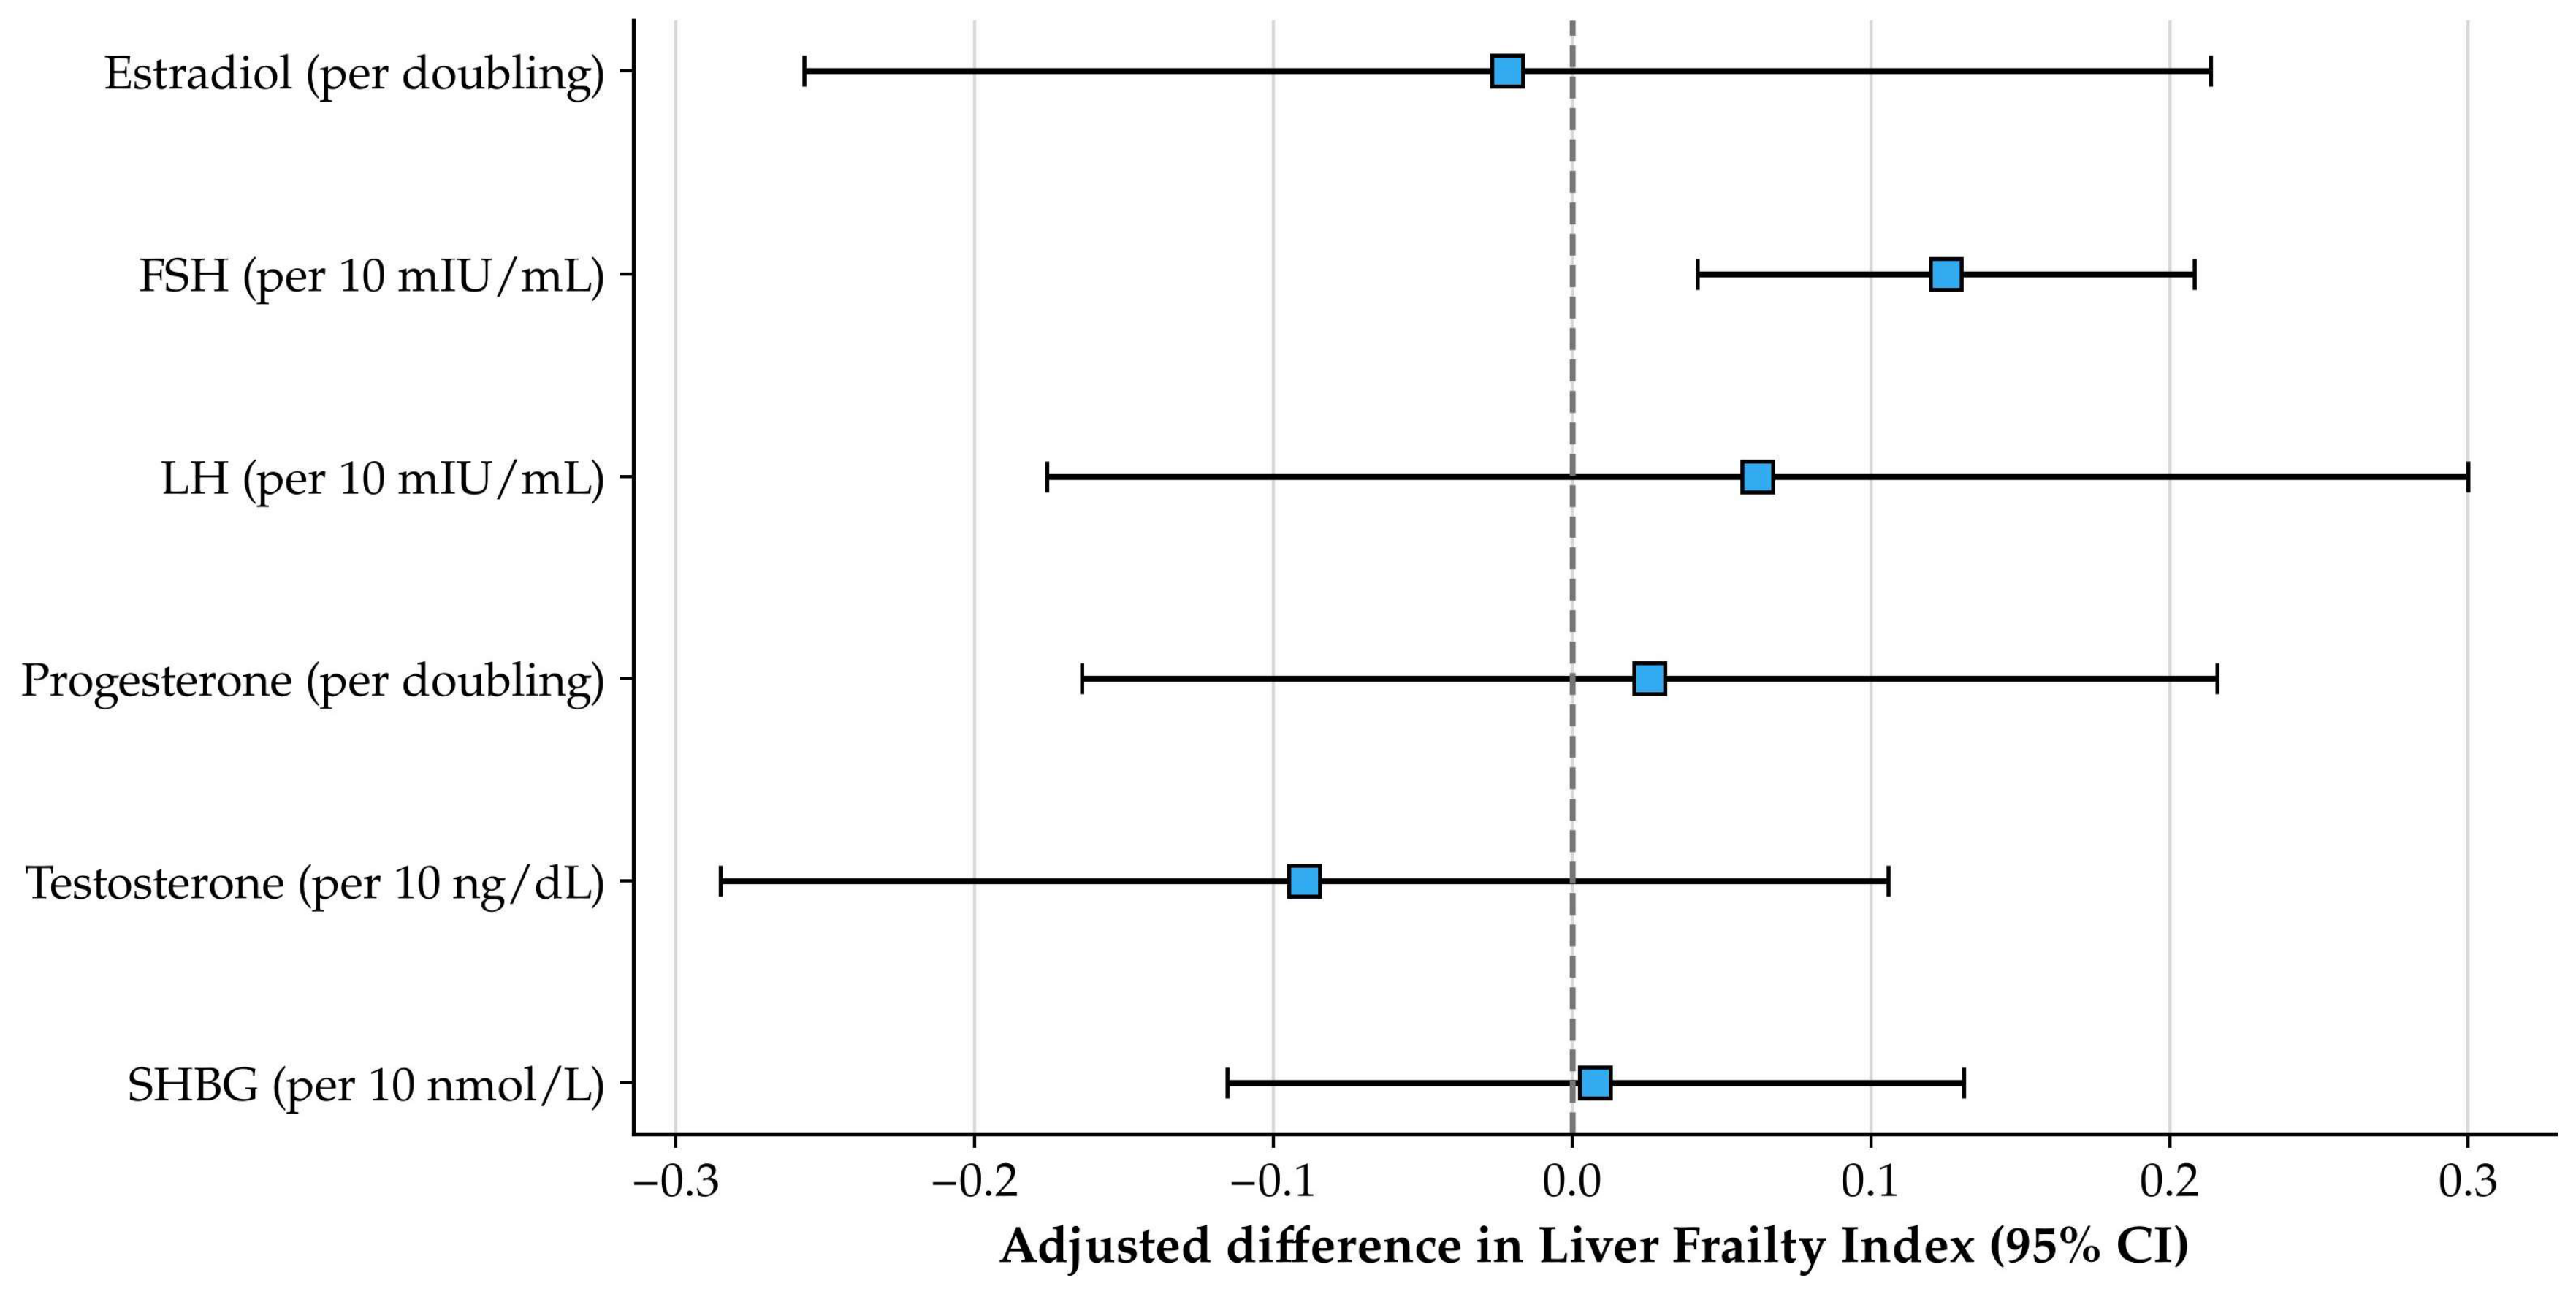
Table 4 and Figure 3 present the six separate adjusted models. Estradiol was not clearly associated with LFI after adjustment for age, MELD-Na, and BMI. Its coefficient was −0.022 per doubling, with a confidence interval extending from −0.257 to 0.214. This interval does not demonstrate equivalence or exclude modest effects; it indicates that this dataset did not identify a precise directional association.
Table 4.
Hormone-specific adjusted models for continuous Liver Frailty Index.
Figure 3.
Adjusted hormone coefficients for continuous LFI. Squares denote unstandardized coefficients and bars their HC3 95% confidence intervals. The vertical dashed line indicates no association. Exposure units differ by hormone, so the horizontal magnitudes must not be interpreted as a ranking of biological potency. Adjustment variables were age, MELD-Na, and BMI.
FSH was associated with higher LFI: B = 0.125 per 10 mIU/mL (95% CI, 0.042–0.208; p = 0.004; q = 0.022). The full FSH model explained 11.1% of the observed LFI variance, compared with 2.2% for the estradiol model; these are in-sample explanatory statistics, not measures of externally validated prediction. The remaining adjusted hormone coefficients had confidence intervals crossing zero and q values above 0.05.
2.5. Sensitivity and Influence Analyses
The estradiol estimate remained imprecise and close to zero across all examined sensitivity analyses (Table 5). The FSH estimate remained positive in each analysis, including the restriction to postmenopausal women. After excluding the 43 records carrying the severe-HE indicator, the FSH coefficient was 0.107 per 10 mIU/mL (95% CI, −0.029 to 0.243; p = 0.119; n = 51). This restriction was based on the recorded HE status, not verified absence of active HE during physical testing. The wider confidence interval may reflect reduced precision and a different case mix; it cannot establish whether acute encephalopathy explained the association (Table 5).
Table 5.
Sensitivity analyses for estradiol and FSH associations with LFI.
Among the 73 postmenopausal women, the adjusted FSH coefficient was 0.147 (95% CI, 0.049–0.246; p = 0.004). Excluding six exogenous-hormone users yielded a coefficient of 0.140 (0.058–0.223; p = 0.001). Restriction to the 84 admission-labelled records gave a coefficient of 0.126 (0.039–0.212; p = 0.005). The latter analysis cannot separate clinical setting from menopausal composition because it excludes every premenopausal woman.
Adding CRP or menopausal status and replacing MELD-Na with Child–Pugh points did not reverse the FSH association. These models address selected measured alternatives, but they cannot resolve confounding by unrecorded physical activity, nutritional intake, treatment exposure, assay characteristics, or assessment timing. Menopausal adjustment is also constrained by the limited representation of younger women and substantial age differences between categories.
Influence diagnostics did not suggest that one record alone accounted for the FSH coefficient. Leave-one-out estimates ranged from 0.110 to 0.141 per 10 mIU/mL; corresponding estradiol coefficients ranged from −0.064 to 0.026 per doubling. Maximum variance inflation factors were 1.33 for the principal FSH model and 1.56 for the estradiol model. Five and six records, respectively, exceeded the conventional Cook’s-distance screening value of 4/n, but none was removed on that basis. Diagnostic tests and plots were treated as screening tools, not proof that all model assumptions held.
2.6. Graphical Patterns and Recorded Clinical Events
The raw hormone–LFI scatterplots are shown in Figure 4. Estradiol was displayed on a log2 scale to make its broad concentration range interpretable. Menopausal groups occupy different portions of the hormonal distributions, illustrating why crude group comparisons cannot substitute for covariate adjustment. The figures are descriptive; no fitted causal trajectory or treatment response is implied.
Figure 4.
Recorded estradiol and FSH concentrations in relation to LFI. Each point represents one record; shapes and colours identify menopausal status. Estradiol concentrations are plotted on a log2 axis with labels in pg/mL. The displayed Spearman p values are unadjusted; their corresponding 18-test q values are 0.964 for estradiol and 0.068 for FSH. No regression line is imposed because these panels show the raw distributions, not the adjusted model.
Eleven records indicated 90-day mortality (11.7%), 14 intensive care admission (14.9%), and 25 HE recurrence (26.6%). Among women with LFI ≥ 4.4, mortality was recorded in 3/25 (12.0%), intensive care admission in 5/25 (20.0%), and recurrence in 8/25 (32.0%). Corresponding proportions below that LFI threshold were 8/69 (11.6%), 9/69 (13.0%), and 17/69 (24.6%). These counts are provided for transparency, not as evidence for or against established prognostic relationships.
The extract did not establish index dates, event dates, censoring, completeness of follow-up, or the temporal ordering of frailty and events. In particular, the small number of deaths does not support a stable multivariable mortality model in this dataset. No hazard ratio, prognostic receiver-operating-characteristic curve, or hormone-based risk threshold was therefore calculated.
3. Discussions
The central finding is an exploratory association between higher FSH and higher recorded LFI after adjustment for age, liver-disease severity, and BMI, accompanied by no clearly supported estradiol–LFI relationship. This pattern is more restrained than a general claim that estrogen deficiency explains frailty in women with cirrhosis. It also shows why a biologically framework should be distinguished from the specific relationships supported by a clinical dataset.
3.1. What the Hormonal Pattern Does and Does Not Mean
A lack of a clear estradiol association does not invalidate endocrine contributions to physical vulnerability. A single circulating value may be an imperfect measure of cumulative exposure or tissue-level signalling, particularly when binding proteins and hepatic metabolism are altered [5,6,9]. The present confidence interval is also sufficiently broad that modest associations remain possible. Conversely, it would be inappropriate to interpret the FSH result as evidence that the FSH itself drives muscle deterioration. FSH may represent reproductive ageing, altered endocrine feedback, or an incompletely measured clinical context.
The postmenopausal-only result argues against explaining the entire FSH association solely by differences between the three recorded menopausal categories. It does not eliminate residual confounding within postmenopause, establish a temporal relationship, or validate a concentration threshold. The pattern should therefore be described as a hypothesis-generating signal requiring replication rather than a clinically actionable biomarker. Its persistence after selected covariate changes is useful information, but repeated analyses of the same 94 records do not provide independent confirmation.
The contrast between the correlation and regression multiplicity results is also important. The FSH–LFI correlation did not survive correction across 18 comparisons, whereas the adjusted FSH coefficient survived correction across six hormone models. These findings arise from different estimands, adjustment structures, and hypothesis families. They are not mutually contradictory, but together they discourage an interpretation based only on the smallest p value. The full set of coefficients, confidence intervals, and corrected values is more informative than a binary significant/non-significant label.
3.2. Frailty, Muscle Quantity, and the Clinical Setting
The absence of a comparable FSH relationship with L3 muscle index suggests that the observed signal is not simply a surrogate for lower measured muscle quantity. Frailty and sarcopenia share determinants but are not interchangeable [4,11]. This distinction is reflected in the source-data disagreement between the recorded sarcopenia label and a low-L3-index indicator. The discrepancy should prompt clinical-record reconciliation rather than automatic substitution of one definition for the other [12].
Clinical setting may materially affect functional measurements [13]. A recent inpatient–outpatient comparison found substantial differences in frailty burden across care settings [14]. Reviews likewise emphasize heterogeneity in frailty tools, populations, and ascertainment [15]. An LFI obtained during an episode of marked impairment may capture an acute state differently from an assessment after stabilization. The exclusion analysis cannot resolve this timing problem because a binary HE indicator does not identify when grip, chair stands, or balance were tested.
3.3. Clinical Interpretation and Treatment Boundaries
Longitudinal research has linked improvement in LFI to better waitlist outcomes [16]. Such within-person change cannot be equated with the cross-sectional coefficient reported here. In particular, a 0.125-point difference per 10 mIU/mL FSH does not imply that lowering FSH would improve LFI by that amount, nor does it establish a clinically important treatment effect.
The present results provide no basis for prescribing estrogen, testosterone, or an FSH-directed intervention for frailty. A recent systematic review found no consistent benefit of menopausal hormone therapy across sarcopenia-related outcomes, with important evidence limitations [17]. International Menopause Society recommendations similarly do not support hormone therapy specifically to treat sarcopenia [18]. Therapeutic decisions in women with liver disease require indication-specific clinical assessment and cannot be inferred from these associations.
More directly relevant intervention research has examined multimodal strategies. A small randomized cirrhosis trial found improved frailty with a combined home-exercise, branched-chain-amino-acid, and probiotic programme, although its components could not be disentangled [19]. Contemporary reviews place nutrition and physical rehabilitation within broader individualized care [20]. Our study does not compare treatments; it identifies questions for better-timed, female-specific observational and intervention research.
3.4. Strengths and Limitations
A strength of this analysis is its exclusive focus on women and its inclusion of reproductive-stage information, multiple hormonal measures, and distinct functional and muscle-quantity outcomes. Continuous LFI modelling avoided unnecessary loss of information from dichotomization. Robust uncertainty estimates, explicit multiplicity families, sensitivity analyses, and full numerical outputs make the analytical choices auditable.
The sample is small, single-centre, and predominantly postmenopausal. Although all 94 available database records were analyzed, the absence of a reconstructable screening log and original eligibility documentation prevents confirmation of consecutive recruitment or assessment of selection among all potentially eligible patients. Cirrhosis was ascertained from the documented hospital diagnosis rather than an independently adjudicated diagnostic algorithm. The small premenopausal and perimenopausal groups further limit the informativeness of between-group comparisons.
Menopausal status was retained as recorded and was not independently adjudicated. Incomplete clinical documentation of menstrual history and the cause of amenorrhoea prevented reliable separation of natural menopause from cirrhosis-related amenorrhoea in every participant; surgical-menopause labels were also not independently verifiable in all cases. Reproductive-stage misclassification may therefore affect both group comparisons and the postmenopausal-only sensitivity analysis. In addition, the 10 outpatient-labelled hormone records conflict with the clinical account of hospitalization sampling, and all 10 belong to the premenopausal group. The admission-labelled restriction cannot separate a sampling-context effect from menopausal composition.
The exploratory design, several related hypotheses, and sensitivity-model selection increase the possibility of chance findings. No internal predictive validation or external validation was performed, and the reported R2 values should not be used to support clinical deployment.
The timing of hormone collection, HE assessment, and physical testing was not consistently synchronized. Recorded severe HE could reflect active disease at assessment or an earlier episode, and the available component-level documentation did not establish cognitive readiness or completion of each LFI task at a specified HE grade. Consequently, the study cannot confirm that the hormonal and physical measurements represent a common stable clinical state. Excluding records labelled with severe HE does not resolve this measurement-validity limitation.
3.5. Future Perspectives
Future studies should begin with a documented screening framework and an auditable definition of the study population. Cirrhosis ascertainment, reproductive-stage classification, and the distinction between natural menopause, surgical menopause, and illness-related amenorrhoea should be verified from source records before analysis. Multicentre recruitment with adequate representation across reproductive stages would improve generalizability and permit more precise assessment of whether hormone–frailty associations differ by menopausal status.
Prospective evaluation should synchronize hormone sampling with clinical assessment and LFI component testing, document active versus historical HE, and repeat physical assessments after clinical stabilization. Assay methodology, sampling time, menstrual history, exogenous hormone use, nutritional exposure, physical activity, and major treatment changes should be recorded systematically. Independent replication should then test the FSH association and its relationship to longitudinal frailty change before considering prognostic applications. Even a replicated association would not establish that modifying FSH or prescribing menopausal hormone therapy improves frailty; such therapeutic questions would require appropriately designed interventional research.
4. Materials and Methods
4.1. Study Setting, Design, and Source Records
This single-centre, record-based cross-sectional study was based on a retrospective review of clinical records of women with cirrhosis treated at “Sf. Apostol Andrei” Emergency County Hospital, Constanța, Romania, during January 2021–March 2025. Cirrhosis was identified from the diagnosis documented in the hospital medical records; the diagnosis and recorded clinical characteristics were reviewed retrospectively. MELD-Na and Child–Pugh scores were used to characterize disease severity and were not treated as independent diagnostic criteria for cirrhosis. The study was approved by the Ethics Committee of “Sf. Apostol Andrei” Emergency County Hospital, Constanța, Romania (approval no. 113/21.04.2020), before the study period, and was conducted in accordance with the Declaration of Helsinki. Written informed consent for participation in the study was obtained from all participants and was distinct from consent obtained for routine clinical care.
The present analysis included all 94 records in the available study database, without additional exclusions from that database. The available extract did not include a screening log allowing reconstruction of the total number of eligible patients, reasons for non-inclusion, or the original eligibility and exclusion criteria. Consecutive recruitment could therefore not be verified. These limitations concern selection into the original database and should be distinguished from the inclusion of all available records in the present analysis. Hormonal measurements were extracted from the clinical records. Although the clinical account described hormone sampling during hospitalization, the database field describing sampling context classified 84 records as “Index admission” and 10 as “Routine outpatient assessment.” All 10 outpatient-labelled records were premenopausal. The available records did not resolve this discrepancy; these labels were therefore retained without reclassification. The admission-labelled sensitivity analysis was restricted to the 84 records with that label and should not be interpreted as an independently verified comparison of inpatient and outpatient sampling. Because the restriction also excludes every premenopausal record, sampling context and menopausal composition cannot be disentangled in that analysis.
4.2. Hormonal and Reproductive Variables
The hormonal exposures were estradiol (pg/mL), follicle-stimulating hormone (FSH; mIU/mL), luteinizing hormone (LH; mIU/mL), progesterone (ng/mL), total testosterone (ng/dL), and sex hormone-binding globulin (SHBG; nmol/L). Current hormone therapy and hormonal contraception were retained as binary recorded variables. No calculated free-hormone measure was derived.
Menopausal status was extracted from the existing clinical records and analyzed as documented: premenopausal (n = 10), perimenopausal (n = 11), or postmenopausal (n = 73). The recorded classifications were retained without independent adjudication and were not reassigned using the hormone concentrations analyzed in this study. Within the postmenopausal category, 66 records were labelled as natural menopause and seven as surgical menopause; these labels describe the database entries rather than independently verified diagnoses.
Because menstrual history, amenorrhoea duration, and the underlying cause of amenorrhoea were not consistently documented in the clinical records, natural menopause could not reliably be distinguished from cirrhosis-related amenorrhoea in all participants. Surgical menopause was likewise based on the available clinical documentation and could not be independently verified in every case. Accordingly, the menopausal categories were treated as recorded clinical descriptors, with potential misclassification acknowledged in the interpretation of group comparisons and subgroup analyses.
4.3. Physical Frailty, Muscle Measures, and Clinical Covariates
The principal outcome was the recorded continuous LFI. Its component domains are grip strength, chair stands, and balance; the recorded composite was analyzed without recalculation because the full component measurements were unavailable [4,11]. For descriptive presentation, analyst-derived categories were LFI < 3.2, 3.2 to <4.4, and ≥4.4, labelled robust, prefrail, and frail. A ≥4.5 threshold was also examined descriptively because operational thresholds vary across publications [4,10].
Recorded handgrip strength and L3 skeletal muscle index were analyzed as continuous complementary outcomes. Low grip strength was operationalized as <16 kg, and low L3 index as <39 cm2/m2, consistent with thresholds used in the recent cirrhosis literature [11]. Age, body mass index, recorded MELD-Na, Child–Pugh points, albumin, C-reactive protein (CRP), ascites, and recorded HE variables described clinical status. MELD-Na was used as supplied, not recalculated. The database also contained mortality, intensive care admission, and HE recurrence indicators, which were summarized descriptively rather than treated as independently adjudicated time-to-event outcomes.
Overt HE corresponded to recorded West Haven grades II–IV, consistent with the severity framework described in the EASL guidance [12]. In this database, the severe-HE indicator corresponded to recorded West Haven grades III–IV: 38 records had grade III and five had grade IV. These mappings describe the encoded clinical variables; they do not establish the participant’s HE grade at the time of physical testing.
The retrospective dataset did not consistently establish whether recorded HE was active at the time of frailty assessment or represented a previous episode during the clinical course. Synchronized clinical and physical-assessment timestamps and the complete LFI component records were unavailable. Consequently, the analysis could not independently verify alertness, ability to follow instructions, or completion of grip, chair-stand, and balance testing at a specified HE grade. Recorded LFI values were analyzed without assuming that they had been obtained during active severe HE or after documented recovery. The severe-HE sensitivity analysis is therefore a restriction based on the recorded HE variable, not a verified comparison of participants with and without active encephalopathy during testing.
4.4. Statistical Analysis
Continuous variables are summarized as medians with the first and third quartiles, presented as median [Q1, Q3], where Q1 and Q3 are the 25th and 75th percentiles. Quartiles were calculated using linear interpolation. Categorical variables are reported as counts and percentages. The premenopausal, perimenopausal, and postmenopausal groups are recorded clinical categories, not statistical tertiles; similarly, the descriptive frailty categories follow the LFI thresholds specified in Section 2.3 rather than quantile-based grouping. Age is reported descriptively, without a between-group hypothesis test. Kruskal–Wallis tests compared the other continuous variables across menopausal categories; these exploratory p values were not multiplicity-adjusted and were not used to select covariates. Categorical comparisons were presented without hypothesis tests because several cells were sparse. Age remained an adjustment covariate in the regression models.
Spearman correlations evaluated each of six hormones against LFI, grip strength, and L3 muscle index. Benjamini–Hochberg correction was applied across these exploratory tests. Six separate ordinary least-squares models then regressed continuous LFI on one hormone plus age, recorded MELD-Na, and body mass index. Estradiol and progesterone were log2-transformed, giving coefficients per doubling; FSH, LH, testosterone, and SHBG were scaled per 10 units. Age, MELD-Na, and body mass index were scaled per 10 years, 5 points, and 5 kg/m2, respectively.
HC3 heteroscedasticity-robust standard errors were used, with t-based 95% confidence intervals and residual degrees of freedom. A second Benjamini–Hochberg correction covered the six adjusted hormone coefficients. These two correction families address different questions and must not be conflated. All tests were two-sided. Estimates and uncertainty were emphasized over isolated threshold-based declarations.
4.5. Sensitivity Analyses and Reproducibility
Estradiol and FSH models were repeated in postmenopausal women, after excluding exogenous-hormone users, in the 84 records labelled “Index admission,” with additional log2(CRP + 1), with menopausal-category indicators, with Child–Pugh points replacing MELD-Na, and in the 51 records without the recorded severe-HE indicator. The sampling-context restriction was based on the database label, not independent confirmation of the sampling setting. The severe-HE restriction was based on recorded status and did not establish the absence of active HE during physical testing.
Sensitivity p values were unadjusted. Residual plots, variance inflation factors, Breusch–Pagan tests, Cook’s distances, and leave-one-out coefficients were examined; observations were not removed solely for influence. Analyses used SPSS vs. 30.0. Supplementary Material provides the analysis dataset and full numerical outputs.
5. Conclusions
In this cohort of women with cirrhosis, estradiol was not clearly associated with continuous LFI after covariate adjustment. Higher FSH showed an exploratory adjusted association with greater frailty, including within the postmenopausal subgroup, but its interpretation is limited by clinical-context uncertainty and imprecision after excluding records labelled with severe HE. The results support further investigation of a female-specific endocrine–functional relationship, not causal attribution, prognostic deployment, or hormone treatment.
Supplementary Materials
The following supporting information can be downloaded at: https://www.mdpi.com/article/10.3390/women6040076/s1, Table S1: Clinical and descriptive characteristics of the study population according to frailty status; Table S2: Correlations between circulating hormone levels and clinical outcomes; Table S3: Multivariable regression models examining the associations between estradiol and FSH levels and frailty-related outcomes; Table S4: Full multivariable regression model for estradiol; Table S5: Full multivariable regression model for follicle-stimulating hormone; Table S6: Sensitivity analyses of the associations between hormone levels and frailty-related outcomes.
Author Contributions
Conceptualization, L.A., D.M.A., L.M.C., D.E.T., I.T.T., E.R., I.L.S., A.N.T., C.A., C.T., A.N., S.A.D., E.D., and L.S.; methodology, L.A., D.M.A., L.M.C., D.E.T., I.T.T., E.R., I.L.S., A.N.T., C.A., C.T., A.N., S.A.D., E.D., and L.S.; software, L.A., D.M.A., L.M.C., D.E.T., I.T.T., E.R., I.L.S., A.N.T., C.A., C.T., A.N., S.A.D., E.D., and L.S.; validation, L.A., D.M.A., L.M.C., D.E.T., I.T.T., E.R., I.L.S., A.N.T., C.A., C.T., A.N., S.A.D., E.D., and L.S.; formal analysis, L.A., D.M.A., E.R., I.L.S., A.N.T., C.A., C.T., A.N., S.A.D., E.D., and L.S.; investigation, L.A., D.M.A., L.M.C., D.E.T., I.T.T., E.R., I.L.S., A.N.T., C.A., C.T., A.N., S.A.D., E.D., and L.S.; resources, L.A., D.M.A., L.M.C., D.E.T., I.T.T., E.R., I.L.S., A.N.T., C.A., C.T., A.N., S.A.D., E.D., and L.S.; data curation, L.A., D.M.A., L.M.C., E.R., I.L.S., A.N.T., C.A., C.T., A.N., S.A.D., E.D., and L.S.; writing—original draft preparation, L.A., D.M.A., L.M.C., D.E.T., I.T.T., I.L.S., A.N.T., C.A., C.T., A.N., S.A.D., E.D., and L.S.; writing—review and editing, L.A., D.M.A., L.M.C., D.E.T., I.T.T., E.R., I.L.S., A.N.T., C.A., C.T., A.N., S.A.D., E.D., and L.S.; visualization, A.N.T., I.L.S., E.R., C.A., C.T., A.N., S.A.D., E.D., and L.S.; supervision, L.A., D.M.A., L.M.C., D.E.T., I.T.T., E.R., I.L.S., A.N.T., C.A., C.T., A.N., S.A.D., E.D., and L.S.; project administration, L.A., D.M.A., L.M.C., D.E.T., I.T.T., I.L.S., A.N.T., C.A., C.T., A.N., S.A.D., E.D., and L.S.; funding acquisition, L.A., D.M.A., L.M.C., D.E.T., I.T.T., E.R., I.L.S., A.N.T., C.A., C.T., A.N., S.A.D., E.D., and L.S. All authors have read and agreed to the published version of the manuscript.
Funding
This research received no external funding.
Institutional Review Board Statement
The study was conducted in accordance with the Declaration of Helsinki and was approved by the Ethics Committee of “Sf. Apostol Andrei” Emergency County Hospital, Constanța, Romania (approval no. 113/21.04.2020). The approval preceded the January 2021–March 2025 study period.
Informed Consent Statement
Written informed consent for participation in the study was obtained from all participants. This consent was distinct from consent obtained for routine clinical care.
Data Availability Statement
The data presented in this study are available upon request from the corresponding authors. The data are not publicly available due to ethical and privacy reasons.
Acknowledgments
The authors used Grammarly (Grammarly Inc., San Francisco, CA, USA; online editor, accessed November 2026), an AI-powered writing assistance tool developed by Grammarly (San Francisco, CA, USA), exclusively to improve the manuscript’s language, grammar, clarity, and readability. Grammarly was not used to generate or develop the scientific content, methodology, analysis, interpretation, or conclusions of the manuscript. All scientific content, interpretations, and conclusions are the original work of the authors. The authors carefully reviewed and edited all language suggestions and take full responsibility for the content and accuracy of the final publication.
Conflicts of Interest
The authors declare no conflicts of interest.
References
- Xie, R.; Jing, X.; Yang, C. The prevalence and characteristics of frailty in cirrhosis patients: A meta-analysis and systematic review. Front. Med. 2024, 11, 1353406. [Google Scholar] [CrossRef] [Scilit] [PubMed]
- Yuan, C.; Li, W.; Liu, J.; Li, J. Frailty and transplant-free survival of patients with liver cirrhosis: A meta-analysis. PLoS ONE 2024, 19, e0302836. [Google Scholar] [CrossRef] [Scilit] [PubMed]
- Tang, W.Z.; Zhu, S.R.; Mo, S.T.; Xie, Y.X.; Tan, Z.K.K.; Teng, Y.J.; Jia, K. Predictive Value of Frailty on Outcomes of Patients with Cirrhosis: Systematic Review and Meta-Analysis. JMIR Med. Inform. 2025, 13, e60683. [Google Scholar] [CrossRef] [Scilit] [PubMed]
- D’Arcangelo, F.; Zanetto, A. Frailty and Sarcopenia in Cirrhosis: Current Knowledge and Future Directions. Curr. Hepatol. Rep. 2025, 24, 10. [Google Scholar] [CrossRef] [Scilit]
- Quiroz-Aldave, J.E.; Gamarra-Osorio, E.R.; Durand-Vásquez, M.D.C.; Rafael-Robles, L.D.P.; Gonzáles-Yovera, J.G.; Quispe-Flores, M.A.; Concepción-Urteaga, L.A.; Román-González, A.; Paz-Ibarra, J.; Concepción-Zavaleta, M.J. From liver to hormones: The endocrine consequences of cirrhosis. World J. Gastroenterol. 2024, 30, 1073–1095. [Google Scholar] [CrossRef] [Scilit] [PubMed]
- Zhang, C.; Feng, X.; Zhang, X.; Chen, Y.; Kong, J.; Lou, Y. Research progress on the correlation between estrogen and estrogen receptor on postmenopausal sarcopenia. Front. Endocrinol. 2024, 15, 1494972. [Google Scholar] [CrossRef] [Scilit] [PubMed]
- Menzies, C.; Bowtell, R.; Shur, N.; Brook, M.S. Menopause, Female Sex Hormones, Skeletal Muscle Mass and Muscle Protein Turnover in Humans. J. Cachexia Sarcopenia Muscle 2026, 17, e70232. [Google Scholar] [CrossRef] [Scilit] [PubMed]
- Meda, C.; Dolce, A.; Della Torre, S. Metabolic dysfunction-associated steatotic liver disease across women’s reproductive lifespan and issues. Clin. Mol. Hepatol. 2025, 31, 327–332. [Google Scholar] [CrossRef] [Scilit] [PubMed]
- Dong, J.; Dennis, K.M.J.H.; Venkatakrishnan, R.; Hodson, L.; Tomlinson, J.W. The Impact of Estrogen Deficiency on Liver Metabolism: Implications for Hormone Replacement Therapy. Endocr. Rev. 2025, 46, 790–809. [Google Scholar] [CrossRef] [Scilit] [PubMed]
- Adamantou, M.; Pergantina, E.; Kamiliou, A.; Rachiotis, N.; Lekakis, V.; Chrysavgis, L.; Papatheodoridis, G.; Angelousi, A.; Cholongitas, E. Association of Hormonal Status With Sarcopenia, Frailty and Outcome in Patients With Decompensated Cirrhosis. Liver Int. 2025, 45, e70384. [Google Scholar] [CrossRef] [Scilit] [PubMed]
- Warner, E.R., II; Satapathy, S.K. Sarcopenia in the Cirrhotic Patient: Current Knowledge and Future Directions. J. Clin. Exp. Hepatol. 2023, 13, 162–177. [Google Scholar] [CrossRef] [Scilit] [PubMed]
- European Association for the Study of the Liver. EASL Clinical Practice Guidelines on the management of hepatic encephalopathy. J. Hepatol. 2022, 77, 807–824. [Google Scholar] [CrossRef] [Scilit] [PubMed]
- Filip, P.V.; Cuciureanu, D.; Pop, C.S.; Marinescu, A.N.; Furtunescu, F.; Diaconu, L.S. Frailty and Sarcopenia Assessment in Patients with Advanced Chronic Liver Disease in a Tertiary Center in Romania. Diagnostics 2025, 15, 16. [Google Scholar] [CrossRef] [Scilit] [PubMed]
- Khan, S.; Sansoni, S.; Di Cola, S.; Lapenna, L.; Merli, M. A Comparative Study of Dietary Intake, Nutritional Status, and Frailty in Outpatients and Inpatients with Liver Cirrhosis. Nutrients 2025, 17, 580. [Google Scholar] [CrossRef] [Scilit] [PubMed]
- Bowers, S.P.; Brennan, P.N.; Dillon, J.F. Systematic review: The role of frailty in advanced chronic liver disease. Aliment. Pharmacol. Ther. 2023, 57, 280–289. [Google Scholar] [CrossRef] [Scilit] [PubMed]
- Wang, M.; Shui, A.M.; Ruck, J.; Huang, C.Y.; Verna, E.C.; King, E.A.; Ladner, D.P.; Ganger, D.; Kappus, M.; Rahimi, R.; et al. Clinically relevant cut-points for changes in the Liver Frailty Index are associated with waitlist mortality in patients with cirrhosis. Liver Transpl. 2024, 30, 991–1001. [Google Scholar] [CrossRef] [Scilit] [PubMed]
- Österdahl, M.F.; Ni Lochlainn, M.; Welch, C.; Rymer, J.; Ashworth, M.; Whitney, J.; Duncan, E.L.; Steves, C.J. Systematic review on the relationship between menopausal hormone replacement therapy, sarcopenia, and sarcopenia-related parameters. Maturitas 2025, 199, 108609. [Google Scholar] [CrossRef] [Scilit] [PubMed]
- Panay, N.; Fenton, A.; Hamoda, H.; Hillard, T.; Islam, R.; Pedder, H.; Romero, L.; Vincent, A.J.; IMS Recommendations Writing Group. International Menopause Society (IMS) recommendations and key messages on women’s midlife health and menopause. Climacteric 2025, 28, 634–656. [Google Scholar] [CrossRef] [Scilit] [PubMed]
- Román, E.; Kaür, N.; Sánchez, E.; Poca, M.; Padrós, J.; Nadal, M.J.; Cuyàs, B.; Alvarado, E.; Vidal, S.; Ortiz, M.À.; et al. Home exercise, branched-chain amino acids, and probiotics improve frailty in cirrhosis: A randomized clinical trial. Hepatol. Commun. 2024, 8, e0443. [Google Scholar] [CrossRef] [Scilit] [PubMed]
- Goyal, M.K.; Chowdhary, R.; Vohra, C.; Patel, M.; Kalra, S.; Mehta, M.; McNulty, R.; Goyal, K.; Vuthaluru, A.R.; Goyal, O. Current management strategies for sarcopenia and frailty in cirrhosis: Missing link in transplant candidacy. World J. Hepatol. 2026, 18, 115048. [Google Scholar] [CrossRef] [Scilit] [PubMed]

Disclaimer/Publisher’s Note: The statements, opinions and data contained in all publications are solely those of the individual author(s) and contributor(s) and not of MDPI and/or the editor(s). MDPI and/or the editor(s) disclaim responsibility for any injury to people or property resulting from any ideas, methods, instructions or products referred to in the content. |
© 2026 by the authors. Licensee MDPI, Basel, Switzerland. This article is an open access article distributed under the terms and conditions of the Creative Commons Attribution (CC BY) license.