


Abstract
Mung bean (Vigna radiata (L.) Wilczek) seed coat (MBSC) is an underutilized by-product rich in vitexin and isovitexin, but its potential as a source of spray-dried functional powders has not been systematically evaluated. This study investigated the spray drying of MBSC extract using three structurally distinct polysaccharide-based carriers—maltodextrin, trehalose, and inulin—to compare their effects on process yield, powder quality, and the content of phenolic compounds, flavonoids, and antioxidant activity. Response surface methodology (RSM) with a Box–Behnken design was employed to examine the influence of inlet temperature (130–160 °C) and carrier concentration. Maltodextrin provided the highest process yield (84.85%), while trehalose and inulin formulations exhibited stronger antioxidant activity, with the lowest DPPH IC50 values of 0.096 mg/mL and 0.100 mg/mL, respectively (expressed per mg of spray-dried powder). Trehalose yielded the highest total phenolic content (TPC = 28.12 mg GAE/g extract) and acceptable flowability (Carr’s index = 20.72%). Inulin gave the highest total flavonoid content (TFC = 126.8 mg QE/g extract) but showed greater variability, attributed to its polymeric network and higher hygroscopicity. The RSM models showed high predictive accuracy for TPC (R2 > 0.98) and DPPH antioxidant activity (R2 ≈ 1.00). These findings offer a multi-objective optimization framework that links carrier structure to powder performance, providing practical guidance for selecting polysaccharide carriers in the development of spray-dried nutraceutical and functional food ingredients. However, direct measurement of encapsulation efficiency, particle morphology, and storage stability was beyond the scope of this study and warrants further investigation.
1. Introduction
The increasing consumer demand for natural bioactive ingredients in functional foods, nutraceuticals, and cosmetics has intensified interest in converting agricultural by-products into value-added sources of phytochemicals [1]. Vigna radiata (L.) Wilczek (mung bean) seed coat (MBSC), a major residue from milling, is an abundant and inexpensive candidate. Far from being simple waste, the seed coat concentrates bioactive phenolic compounds, notably the flavone C-glycosides vitexin and isovitexin [2]. These molecules exhibit potent antioxidant, anti-inflammatory, anti-diabetic, and cardioprotective activities, largely mediated through free-radical scavenging and the modulation of cellular signaling pathways [3,4,5]. Exploiting this waste stream would therefore simultaneously reduce environmental burden and create functional ingredients for health-promoting products. However, direct application of crude plant extracts is hindered by the inherent instability of polyphenols. Vitexin and isovitexin are readily degraded by light, oxygen, heat, and pH changes, leading to a rapid loss of bioactivity and short shelf-life [6]. Additionally, the extracts often possess unpleasant sensory attributes (e.g., astringency, bitterness) and poor handling properties (high hygroscopicity, low flowability), which complicate their incorporation into acceptable formulations [7]. An effective stabilization and delivery technology is therefore essential to convert these promising bioactives into robust commercial ingredients.
Spray drying is the most industrially scalable technique for overcoming such limitations [8]. The process transforms a liquid feed into a dry powder by atomizing it into a hot convective medium; the carrier material simultaneously isolates the sensitive core from environmental stressors, masks off-flavors, and improves powder flow and dosage precision. The quality of the resulting powder—process yield, stability, and bioactive content—depends critically on the interplay between formulation variables (carrier type and concentration) and process parameters (inlet temperature, feed solid content) [9]. The selection of an appropriate carrier material is therefore paramount. Three polysaccharide-based carriers with distinct physico-chemical profiles were investigated. Maltodextrin (MD) is an economical, widely used starch-hydrolysis product that provides high solubility and good oxygen-barrier properties, but its relatively low glass transition temperature (Tg) can lead to stickiness during drying and caking upon storage [10]. Trehalose (TH) is a non-reducing disaccharide with an exceptionally high anhydrous Tg (~110 °C) and a unique ability to replace water molecules via hydrogen bonding, thereby preserving the native structure of biomolecules during thermal and oxidative stress [11,12,13]. Inulin (IN) is a prebiotic dietary fiber that forms a highly rigid, amorphous glassy matrix upon rapid drying; this drastically reduces molecular mobility and affords superior oxidative protection, while also adding functional value as a prebiotic [14,15,16,17]. Despite the recognized potential of MBSC extract, systematic comparisons of these carriers for spray-dried MBSC extract have not been reported and the simultaneous optimization of drying temperature and carrier concentration to balance yield, powder flowability, and bioactive content remains unexplored.
Although the individual attributes of maltodextrin, trehalose, and inulin as encapsulating agents are well documented, their comparative performance in the spray drying of polyphenol-rich plant extracts has received limited critical attention. Prior spray-drying studies involving botanical extracts have predominantly relied on maltodextrin or gum arabic as single-carrier systems—for example, in the processing of grape pomace phenolics [18], pomegranate peel extract [19] and various berry by-products [20]. Tolun et al. (2016) compared maltodextrin and gum arabic for grape polyphenol microencapsulation and reported carrier-dependent differences in phenolic retention and antioxidant activity; however, the study did not extend to disaccharide- or fructan-based carriers that may have offered distinct stabilization mechanisms [18]. Kuck and Noreña (2015) evaluated gum arabic, polydextrose, and partially hydrolyzed guar gum for grape skin phenolics, yet trehalose and inulin—both of which possess fundamentally different physico-chemical properties—were outside the scope of their comparison [21]. Trehalose, with its exceptionally high anhydrous glass transition temperature (~110 °C) and capacity to replace water through hydrogen bonding [12,13], has been investigated principally as a protein stabilizer and cryoprotectant rather than as a primary wall material for polyphenol-rich plant extracts. Inulin, despite its demonstrated efficacy in probiotic and lipid encapsulation [14,15,17], has only sporadically been applied to plant polyphenol systems, and its performance relative to conventional polysaccharide carriers in a head-to-head comparison remains largely uncharacterized. Importantly, no previous study has systematically compared a starch hydrolysate (maltodextrin), a non-reducing disaccharide (trehalose), and a polydisperse fructan (inulin) within a single experimental framework for any legume by-product extract. Furthermore, the combined use of such a comparative carrier evaluation with response surface methodology to simultaneously optimize process parameters and multiple powder quality responses—including yield, flowability, phenolic content, flavonoid content, and antioxidant activity—has not been reported for MBSC or related systems. This integrated approach is particularly warranted for MBSC, as its predominant flavonoids, vitexin and isovitexin [2,3], are flavone C-glycosides that differ markedly in structure and stability from the anthocyanins, catechins, and ellagitannins that have been the primary focus of most plant extract encapsulation research [6,7].
Therefore, the objective of the present study was to investigate the spray drying of MBSC extract using maltodextrin, trehalose, and inulin as carrier materials and to apply response surface methodology (RSM) with a Box–Behnken design to examine the effects of inlet air temperature and carrier concentration on process yield, moisture content, flowability (Carr’s index), total phenolic content (TPC), total flavonoid content (TFC), and DPPH radical scavenging activity. The work focuses on immediate post-drying powder properties and bioactive compound content, and does not include the measurement of encapsulation efficiency, surface phenolic content, particle size distribution, powder morphology, water activity, hygroscopicity, solubility, reconstitution behavior, or storage stability. Consequently, the findings should be viewed as an initial screening and process optimization study, providing a basis for carrier selection and further in-depth characterization in future work.
2. Materials and Methods
2.1. Materials and Reagents
Maltodextrin (MD, DE−10 Neo-Maldex NM−10, Neotech Food Co., Ltd., Ratchaburi, Thailand), trehalose (TH, Chemipan Corporation Co., Ltd., Bangkok, Thailand), inulin (IN, Chemipan Corporation Co., Ltd., Bangkok, Thailand). Acetonitrile (HPLC grade) was obtained from Thermo Fisher Scientific (Waltham, MA, USA), while ethanol (analytical grade) and methanol (HPLC grade) were sourced from RCL (Labscan Ltd., Bangkok, Thailand). Vitexin and isovitexin were obtained from Sigma Aldrich, St. Louis, MO, USA. All other chemicals were of analytical grade and obtained from reputable suppliers.
2.2. Plant Material
The mung bean (Vigna radiata (L.) Wilczek) seed coat (MBSC) was kindly obtained from Thai Wah Public Company Limited (Bangkok, Thailand) in 2022 and transported to the Department of Pharmaceutical Chemistry, Khon Kaen University. The material was received as thin, greenish-white flakes with a characteristic odor, a moisture content of 1.74%, a bulk density of 0.315 g/mL, and a tapped density of 0.355 g/mL.
2.3. Preparation of MBSC Extract
The Soxhlet method was used for the extraction with 40% ethanol under the extraction time for 1 h. The obtained extract was stored in a tightly sealed, light-resistant container at 2–8 °C until further use.
2.4. Determination of Solid Content (%) of MBSC Extract
Following the extraction procedure, the MBSC extract was weighed, and the solvent was evaporated using a rotary evaporator (Hei-VAP Precision ML/G3 (Heidolph Instruments, Schwabach, Germany) at 45 °C. The concentrate was subsequently freeze-dried for 24 h (Gamma 2-16 LSCplus, Christ, Osterode am Harz, Germany) with chamber and ice condenser temperatures set at 20 °C and −85 °C, respectively. The percentage of solid content was calculated as follows:
Using this value, the required amount of liquid extract to obtain a desired weight of solid content can be determined. For instance, if the solid content is found to be 5%, and a weight of solid content of 2 g is needed for subsequent experiments, then 40 g of the liquid extract must be taken (i.e., 2 g/0.05 = 40 g).
2.5. Preparation of Spray-Dried MBSC Powders
MBSC extract was mixed with a carrier (MD, TH, IN) with the weight ratio between the carrier and the solid content of MBSC extract in the range of 1:3 to 3:1. Then, these solutions were dried by using a spray dryer with pressure type nozzle (Mini Spray Dryer B−290, BÜCHI Labortechnik, Flawil, Switzerland). The spray drying conditions were selected with an inlet temperature (Spray drying temperature) set at 130–160 °C, an outlet temperature between 65 and 85 °C, 100% aspirator efficiency, and a feed flow rate of 10 mL/min. The spray-dried MBSC powder was kept in an air-tight container at a controlled room temperature (25 ± 2 °C/50 ± 5% RH) and protected from light and moisture until use.
2.6. Determination of the Spray-Dried Yield (%)
The spray-dried yield was determined as the percentage ratio of the weight of the obtained dry powder to the total weight of solids in the feed solution, which comprised the extract solids and the added carrier.
2.7. Moisture Content Analysis
A total of 3.0 g of the sample was accurately weighed into an aluminum weighing pan and heated at 105 °C using a halogen moisture analyzer (Mettler Toledo HE53, Greifensee, Switzerland). Measurements were done in triplicate.
2.8. Powder Flowability
The flow properties of the spray-dried powder were determined using Carr’s index according to Equation (3) [22]. The bulk density and tapped density of the spray-dried powder were measured using a graduated cylinder in a tapped density tester (JV100i, Copley Scientific, Nottingham, UK). A known mass of spray-dried powder (2 ± 0.01 g) was placed in a 10 mL graduated cylinder to record the initial volume (V0). The cylinder was then subjected to 500 mechanical taps in the density tester to establish the new volume (V1). Using V0 and V1, Carr’s index was calculated according to Equation (3). Each measurement was performed in triplicate.
2.9. Total Phenolic Content (TPC) by Folin–Ciocalteu Assay
The TPC of the MBSC extract was determined according to a literature method with some modifications [23]. Briefly, 10 µL of 1 mg/mL of the sample solution was added into a 96-well plate. Then, deionized water was added to make 100 µL/well and 100 µL of Folin and Ciocalteu phenol reagent (Sigma-Aldrich, St. Louis, MO, USA) was added into each well. After that, 80 µL of 7% w/v of sodium carbonate (Na2CO3) was added into each well. Then, the sample was mixed for a while and kept for 30 min in the dark place. The absorbances were measured at 760 nm by a microplate reader (Ensight Multimode, Perkin Elmer, Waltham, MA, USA). A standard calibration curve was performed using gallic acid (Sigma-Aldrich, St. Louis, MO, USA), which was added into each well. After that, 80 µL of 7% w/v of sodium carbonate (Na2CO3, Sigma-Aldrich, St. Louis, MO, USA). Briefly, a stock solution of gallic acid (120 µg/mL) was prepared in methanol, and working standard solutions at concentrations of 0, 0.6, 1.2, 1.8, 2.4, and 3.0 µg/mL were prepared by appropriate dilution. The calibration curve was constructed by plotting absorbance against concentration, showing good linearity (R2 = 0.998). TPC values were expressed in milligrams of gallic acid equivalents per gram of extract (mg GAE/g extract).
2.10. Total Flavonoid Content (TFC)
The total flavonoid content was determined according to a literature method with some modifications [23]. Quercetin (Sigma-Aldrich, St. Louis, Missouri, USA), the standard control, was diluted to various concentrations (0.8, 1.6, 3.2, and 6.4 µg/mL). Each concentration of diluted quercetin (100 µL) was added into 96-well plate and then added with 50 µL of 2% w/v aluminum chloride and 50 µL of 95% ethanol. After incubation at room temperature for 10 min, the samples were measured at 425 nm using a microplate reader (Ensight Multimode, Perkin Elmer, Waltham, MA, USA). The results were plotted for a standard curve. The sample extracts were dissolved with 2-propanol, diluted to appropriate concentrations, and then added with 2% w/v aluminum chloride and 95% ethanol as described above. The results from sample extracts were compared with the standard curve using a linear equation. The results were expressed as mg quercetin equivalents per gram of extract (mg QE/g extract).
2.11. Antioxidant Activity by 2,2-Diphenyl−1-picrylhydrazyl (DPPH) Assay
The antioxidant activity of the MBSC extract was determined according to a literature method with some modifications [23]. Briefly, a 1 mg/mL solution of the sample in extraction solvent was prepared. Then, 10 µL of sample was added to a 96-well plate and methanol was added to make 100 µL/well. Distilled water was used instead of the sample as a control. After that, 100 µL of 0.2 mM DPPH (2,2-diphenyl−1-picrylhydrazyl) (Sigma-Aldrich, USA) in methanol was added and mixed for a while. The sample was kept for 30 min in the dark place. The absorbances were measured at 517 nm by a microplate reader (Ensight Multimode, Perkin Elmer, Waltham, MA, USA). If the sample possesses antioxidant activity, the color will change from purple to yellow. The percentage of free-radical scavenging activity was calculated according to the following equation:
where
Absctrl = Absorbance of control
Abssam = Absorbance of sample
The antioxidant activity was expressed as DPPH IC50, which defined the concentration of powder (mg powder/mL) providing 50% free-radical inhibition. Vitamin C (L-Ascorbic acid, Sigma-Aldrich, USA) was used as the standard.
2.12. Quantitative Analysis of Vitexin and Isovitexin
Twenty-five milligrams of sample was dissolved in 40% ethanol and ultrasonicated for 10 min. Then, it was diluted to the specified volume using a volumetric flask to be a concentration of 1 mg/mL. Finally, sample was filtered through a 0.45 μm syringe filter before using. Vitexin and isovitexin content were determined by using a high-performance liquid chromatography system (HPLC, Agilent 1260 infinity II, Waldbronn, Germany) fitted with a C18 stationary phase column (Phenomenex Luna 5µ PFP(2) 100 Å, 250 mm × 4.6 mm (Phenomenex, Torrance, CA, USA)) equipped with a photodiode array detector, quaternary pump, online degasser and auto sampler [24]. The determination of vitexin and isovitexin was achieved using a gradient mobile phase consisting of 1% v/v acetic acid in water and 1% v/v acetic acid in acetonitrile according to the mixing ratios and timetable as shown in Table 1. The HPLC operational parameters were as follows: the injection volume was 10 µL, column temperature was 30 °C, flow rate was 1.5 mL/min, run time was 40 min and detection wavelength was 360 nm. Identification and calibration of the samples were performed by comparing absorption peak and retention times with those of the standard reference.
Table 1.
The gradient chromatography conditions for determination of vitexin and isovitexin.
The HPLC condition was validated in accordance with the International Harmonization Conference (ICH) guidelines by evaluating linearity, accuracy, precision, limit of detection (LOD), and limit of quantification (LOQ). Standard deviation and slope from the calibration curve were used to compute LOD and LOQ, using formulas of 3.3σ/S and 10σ/S, respectively. This condition gave us LOD and LOQ as 0.72 and 2.17 μg/mL, respectively. Percentage of recovery range from 103.55 to 105.03% and % RSD of precision was less than 2%.
The concentrations of vitexin and isovitexin in the samples were estimated based on the regression lines of vitexin and isovitexin in the range of 1–30 μg/mL, which were Y = 21.139X − 5.7239 (R2 = 0.9989, n = 6) and Y = 17.76X − 4.4388 (R2 = 0.9989, n = 6), respectively, where Y was the peak area of the analyte and X was the concentration of the analyte (μg/mL).
2.13. Experimental Design
The experimental design was constructed using response surface methodology (RSM) to evaluate the effects of three independent variables, including carrier concentration (A), solid content (B), and spray drying temperature (C), on multiple responses, as shown in Table 2 and Table 3.
Table 2.
The independent variables and their corresponding levels applied in the response surface methodology (RSM) for the development of spray-dried MBSC powder with carrier formulations.
Table 3.
Experimental design for spray-dried MBSC powder with carrier formulations using Response Surface Methodology (RSM).
A Box–Behnken design was employed with three levels for each factor. The experimental runs are presented in Table 3. The responses analyzed included yield, moisture content, Carr’s index, total phenolic content (TPC), total flavonoid content (TFC), and antioxidant activity (DPPH IC50).
2.14. Statistical Analysis
The experimental data were analyzed using response surface methodology (RSM) to evaluate the effects of independent variables and their interactions on the responses. A second-order polynomial model was applied to describe the relationships between the variables and the responses. Analysis of variance (ANOVA) was performed using SPSS version 28.0 (KKU license software) to determine the statistical significance of the model and regression coefficients. The adequacy and predictive capability of the models were evaluated using the coefficient of determination (R2), adjusted R2, predicted R2, and lack-of-fit test. A model was considered statistically significant at p < 0.05.
2.15. Optimization and Validation
Multi-response optimization was performed using a desirability function approach to simultaneously optimize multiple responses, including yield, moisture content, Carr’s index, total phenolic content (TPC), total flavonoid content (TFC), and antioxidant activity (DPPH IC50). The optimal conditions were determined by maximizing yield, TPC, and TFC, while minimizing moisture content, Carr’s index, and DPPH IC50 values. The validity of the developed models was confirmed by conducting experiments under the predicted optimal conditions. The experimental results were in good agreement with the predicted values, indicating that the models were reliable and suitable for predicting and optimizing the spray-drying process.
All responses included in the optimization procedure were assigned equal importance (+++) in Design-Expert® software version 13 (Stat-Ease, Minneapolis, MN, USA). The optimum formulation was selected based on the highest overall desirability value. The validity of the developed models was confirmed by conducting experiments under the predicted optimal conditions. The predicted values obtained from numerical optimization were compared with the corresponding experimental values, and the percentage errors were calculated to evaluate the predictive performance of the optimization model. The experimental results showed good agreement with the predicted values, indicating that the optimization model was suitable for predicting and optimizing the spray-drying process.
3. Results and Discussion
3.1. Experimental Design and Response Overview
The optimization of spray-dried powder formulations was carried out using response surface methodology (RSM), considering three independent variables: weight of the carrier (A), weight of solid content (B), and spray drying temperature (C). Multiple responses, including yield, moisture content, Carr’s index, total phenolic content (TPC), total flavonoid content (TFC), antioxidant activity (DPPH IC50), and marker compounds (vitexin and isovitexin), were evaluated immediately after spray drying (Table 4, Table 5 and Table 6).
Table 4.
Response surface methodology (RSM)-based optimization of spray-dried powder formulated with maltodextrin (MD): effects of independent variables on yield, physico-chemical properties, phenolic and flavonoid contents, antioxidant activity, and marker compounds (vitexin and isovitexin).
Table 5.
Response surface methodology (RSM)-based optimization of spray-dried powder formulated with trehalose (TH): effects of independent variables on yield, physico-chemical properties, phenolic and flavonoid contents, antioxidant activity, and marker compounds (vitexin and isovitexin).
Table 6.
Response surface methodology (RSM)-based optimization of spray-dried powder formulated with inulin (IN): effects of independent variables on yield, physico-chemical properties, phenolic and flavonoid contents, antioxidant activity, and marker compounds (vitexin and isovitexin).
The three-dimensional response surface plots revealed complex interactions among variables, including both linear and quadratic effects. Among the studied parameters, spray drying temperature and carrier concentration were found to exert the most significant influence on both physico-chemical properties and the content of phenolic and flavonoid compounds measured after drying. These findings are consistent with previous reports demonstrating that drying conditions and carrier systems are key determinants in spray-dried functional powders [25].
3.2. Yield and Drying Efficiency: Role of Carrier and Spray Drying Temperature
As illustrated in Figure 1, the yield (%) increased significantly with increasing carrier concentration across all formulations. This trend is consistent with previous reports suggesting that carriers may increase the effective glass transition temperature of the feed, thereby reducing particle stickiness during drying [6]. In maltodextrin-based formulations (Figure 1A–C), the highest yield (84.85%) was observed at a high carrier and low solid content (Run 15). This suggests that an increased carrier-to-solid content ratio enhances drying efficiency by facilitating crust formation around droplets. Similar trends were observed for TH and IN systems (Figure 1D–I, although IN showed slightly greater variability due to its polymeric structure). The spray drying temperature also played a crucial role. Moderate to high temperatures improved yield by accelerating solvent evaporation and promoting rapid crust formation. However, excessively high temperatures may lead to particle rupture or the degradation of sensitive compounds. Moisture content (Figure 2) decreased with increasing temperature, reflecting enhanced drying kinetics. Nevertheless, higher carrier concentrations, particularly IN, resulted in slightly higher residual moisture, likely due to strong hydrogen bonding interactions between hydroxyl groups and water molecules [26].
Figure 1.
Three-dimensional response surface plots illustrating the effects of formulation variables on yield (%) of spray-dried powder formulations. The independent variables include A: weight of carrier (g), B: weight of solid content (g), and C: spray drying temperature (°C). Each plot represents the interaction between two variables while the third variable is kept constant at its central level. The color gradient indicates the magnitude of the response, and red points represent experimental design points. (A–C) Maltodextrin formulations; (D–F) trehalose formulations; and (G–I) inulin formulations. Within each carrier type, the plots represent the interactions between A and B, A and C, and B and C, respectively.
Figure 2.
Three-dimensional response surface plots illustrating the effects of formulation variables on moisture content (%) of spray-dried powder formulations. The independent variables include A: weight of carrier (g), B: weight of solid content (g), and C: spray drying temperature (°C). Each plot represents the interaction between two variables while the third variable is kept constant at its central level. The color gradient indicates the magnitude of the response, and red points represent experimental design points. (A–C) Maltodextrin formulations; (D–F) trehalose formulations; and (G–I) inulin formulations. Within each carrier type, the plots represent the interactions between A and B, A and C, and B and C, respectively.
3.3. Powder Flowability and Structural Properties
Carr’s index values (Figure 3) ranged from low to moderate, indicating acceptable flowability of the powders. The response surfaces exhibited a dome-shaped profile, suggesting the presence of an optimal region within the investigated experimental range. At optimal conditions, lower Carr’s index values (20–25%) were observed, indicating improved flowability. This behavior is associated with the formation of spherical particles with smooth surfaces, which reduce interparticle friction and cohesion [27]. Trehalose-based powders (Figure 3D–F) demonstrated superior flowability compared to MD and IN. Based on the literature, trehalose is known to form a stable amorphous glassy matrix and to interact with biomolecules via hydrogen bonding, which may contribute to the observed trends [28]. In contrast, inulin-based powders (Figure 3G–I) showed greater variability, with Carr’s index values ranging widely. This observation may be attributable to the complex molecular structure of inulin, which, as reported in the literature, can lead to irregular particle formation and increased hygroscopicity [29].
Figure 3.
Three-dimensional response surface plots showing the effects of A: weight of carrier, B: weight of solid content, and C: spray drying temperature on Carr’s index (%). Each plot represents the interaction between two variables while the third is fixed at its center level. (A–C) Maltodextrin formulations; (D–F) trehalose formulations; and (G–I) inulin formulations. Within each carrier type, the plots represent the interactions between A and B, A and C, and B and C, respectively.
3.4. Effects on Phenolic and Flavonoid Content After Spray Drying: Relationship with Response Surface Plots
The response surface plots for total phenolic content (TPC) and total flavonoid content (TFC) (Figure 4 and Figure 5) clearly demonstrate the combined effects of A: carrier concentration, B: weight of solid content, and C: spray drying temperature on the bioactive compound measured after spray drying. For maltodextrin-based formulations (Figure 4A–C and Figure 5A–C), TPC and TFC exhibited a decreasing trend with increasing carrier concentration, as indicated by the gradual shift from red/yellow to green/blue regions along the A-axis. This behavior confirms the dilution effect, where increasing the carrier reduces the relative concentration of phenolic and flavonoid compounds. However, at moderate levels of the carrier and a higher solid content, the surface plots show elevated regions, indicating higher measure values of these compounds. A similar trend was observed for TH systems (Figure 4D–F and Figure 5D–F), although the intensity of the red regions (high TPC/TFC) was more pronounced. This suggested that under the conditions tested, TH-based powders retained higher levels of phenolic and flavonoid compounds after drying. The relatively smooth and dome-shaped surfaces suggest the presence of an optimal region, with the highest values occurring at intermediate carrier levels and higher temperatures. This observation is consistent with the hypothesis, proposed in previous studies, that trehalose may stabilize phenolic compounds through hydrogen-bonding interactions and the formation of a glassy matrix during drying [6].
Figure 4.
Three-dimensional response surface plots showing the effects of A: weight of carrier, B: weight of solid content, and C: spray drying temperature on total phenolic content (TPC, mg GAE/g extract). Each plot represents the interaction between two variables while the third is fixed at its center level. (A–C) Maltodextrin formulations; (D–F) trehalose formulations; and (G–I) inulin formulations. Within each carrier type, the plots represent the interactions between A and B, A and C, and B and C, respectively.
Figure 5.
Three-dimensional response surface plots showing the effects of A: weight of carrier, B: weight of solid content, and C: spray drying temperature on total flavonoid content (TFC, mg QE/g extract). Each plot represents the interaction between two variables while the third is fixed at its center level. (A–C) Maltodextrin formulations; (D–F) trehalose formulations; and (G–I) inulin formulations. Within each carrier type, the plots represent the interactions between A and B, A and C, and B and C, respectively.
For inulin-based formulations (Figure 4G–I and Figure 5G–I), the response surfaces show a broader distribution of high-value regions, particularly along the solid content axis (B). The higher TFC values in Figure 5G–I suggest that inulin provided better retention of flavonoids during spray drying than the other carriers. This may be related to the complex molecular structure of inulin, which, according to the literature, can result in a heterogeneous polymeric matrix and variable particle morphology [29]. However, direct morphological characterization was not performed in this study. However, similar to other carriers, increasing the IN concentration beyond optimal levels resulted in a reduction in TPC and TFC, confirming the dominance of the dilution effect at high carrier levels. In addition, the curvature observed in all response surfaces suggests the presence of significant quadratic interactions (A2, B2, C2), indicating that neither extremely low nor high levels of variables are favorable for maintaining high phenolic and flavonoid content in the final powder. Instead, optimal conditions are achieved within a specific region where the beneficial effect of the carrier balances the dilution effect.
Overall, the graphical trends across Figure 4 and Figure 5 highlight that the content of phenolic and flavonoid compounds measured after spray drying is governed by a balance between carrier-induced dilution and the ability of the carrier to reduce losses during drying. These findings are consistent with previous studies reporting that appropriate carrier selection and processing conditions influence the levels of phenolic compounds retained after spray drying [6].
3.5. Antioxidant Activity (DPPH): Relationship with Response Surface Plots
DPPH IC50 values are reported per mass of spray-dried powder (mg powder/mL). Consequently, IC50 values reflect the combined contribution of the extract-derived bioactive compounds and any dilution effect introduced by the carrier. As an inverse measure of antioxidant activity, lower IC50 values indicate a stronger radical scavenging capacity per unit mass of powder. The response surface plots for antioxidant activity, expressed as DPPH (IC50), are presented in Figure 6. The graphical trends clearly illustrate the combined influence of A: carrier concentration, B: solid content, and C: spray drying temperature on antioxidant performance. For maltodextrin-based formulations (Figure 6A–C), the response surfaces exhibit a parabolic (quadratic) pattern, which is consistent with the ANOVA results presented in Table 7, where DPPH activity (Y6) was best described by a significant quadratic model (p < 0.0001). Lower IC50 values, corresponding to higher antioxidant activity, were obtained at intermediate carrier concentrations and higher spray-drying temperatures. This is evident from the blue–green regions located at moderate A and high C levels. In contrast, increasing the carrier concentration beyond this optimal range shifts the surface toward higher IC50 values (yellow–red regions), confirming a reduction in antioxidant activity due to dilution effects. Similarly, trehalose-based systems (Figure 6D–F) show a more pronounced curvature, with a distinct optimal region characterized by the lowest IC50 values. The response surfaces indicate that moderate carrier levels combined with higher solid content and temperature result in enhanced antioxidant activity. The sharper gradient observed in these plots suggests a stronger interaction between variables, likely due to the ability of TH to maintain higher levels of phenolic compounds through hydrogen bonding and glassy matrix formation [30]. For inulin-based formulations (Figure 6G), the response surface appears relatively flatter compared to MD and TH, indicating a more linear relationship between the variables and antioxidant activity. However, a clear trend is still observed, where increasing the IN concentration leads to higher IC50 values (lower antioxidant activity), while higher solid content and moderate temperature improve antioxidant performance. This behavior suggested that although inulin-based powders retained relatively high flavonoid content (as seen in TFC results), excessive carrier loading still resulted in the dilution of active compounds. The correlation between DPPH activity and TPC/TFC is evident across Figure 4, Figure 5 and Figure 6. Regions with higher phenolic and flavonoid contents correspond to lower IC50 values, confirming that antioxidant activity is primarily driven by the concentration of these compounds in the spray-dried powder.
Figure 6.
Three-dimensional response surface plots showing the effects of A: weight of carrier, B: weight of solid content, and C: spray drying temperature on DPPH, IC50 (mg/mL). Each plot illustrates the interaction between two variables while the third variable is kept constant at its center level. (A–C) Maltodextrin formulations; (D–F) trehalose formulations; and (G–I) inulin formulations. Within each carrier type, the plots represent the interactions between A and B, A and C, and B and C, respectively.
Table 7.
Results of regression analysis for responses yield, physico-chemical properties, phenolic and flavonoid contents, antioxidant activity, and marker compounds (vitexin and isovitexin) of spray-dried powder formulated with maltodextrin (MD).
The curvature of the response surfaces further indicates the presence of significant quadratic effects (A2, B2, C2), suggesting that optimal antioxidant activity is achieved within a specific region rather than at extreme conditions. This aligns with previous findings that excessive carrier concentration reduces antioxidant activity due to dilution, while insufficient carrier fails to adequately reduce compound losses during spray drying [29].
Overall, the graphical analysis demonstrates that antioxidant activity in the spray-dried powders is governed by a balance between carrier effects and dilution effects. Optimal conditions are achieved at intermediate carrier levels and elevated temperatures, where the content of bioactive compounds is maintained at relatively high levels.
3.6. Content of Marker Compounds (Vitexin and Isovitexin) After Spray Drying: Relationship with Response Surface Plots
The response surface plots for vitexin and isovitexin contents (Figure 7, Figure 8 and Figure 9) illustrate the effects of A: carrier concentration, B: solid content, and C: spray drying temperature on the levels of these marker flavonoids measured after spray drying. For maltodextrin-based formulations (Figure 7A–F), the response surfaces show that vitexin content remained relatively consistent across the studied range, as indicated by the relatively flat surface and minimal color variation. This suggests that vitexin is less sensitive to changes in formulation and processing conditions. In contrast, isovitexin exhibited a more pronounced response, with higher values observed at moderate carrier levels and elevated temperatures. The curved surfaces (Figure 7D–F) indicate a quadratic effect, suggesting the existence of an optimal region for isovitexin content. In trehalose-based systems (Figure 8), both vitexin and isovitexin showed higher measured contents compared to maltodextrin. The response surfaces display more distinct high-value regions (red/yellow zones), particularly at moderate carrier concentrations and higher temperatures. This indicates that trehalose-based formulations yield higher contents of these flavonoids after drying, likely due to its ability to form hydrogen bonds and maintain flavonoid structures within a glassy matrix during the process [31]. The sharper curvature of the surfaces further suggests stronger interaction effects among variables. For inulin-based formulations (Figure 9), the response surfaces exhibit a wider variation, particularly for isovitexin. High-value regions are observed at lower to moderate carrier levels combined with higher solid content, indicating higher measured contents under these conditions. However, increasing the IN concentration beyond the optimal range results in a decline in both vitexin and isovitexin contents, as reflected by the shift toward lower-value regions. This confirms that dilution effects dominate at high carrier levels.
Figure 7.
Three-dimensional response surface plots showing the effects of A: MD concentration, B: solid content, and C: spray drying temperature on (A–C) vitexin and (D–F) isovitexin contents (mg/g extract). Each plot represents the interaction between two variables while the third variable is fixed at its center level.
Figure 8.
Three-dimensional response surface plots showing the effects of TH concentration, B: solid content, and C: spray drying temperature on (A) vitexin and (B–D) isovitexin contents (mg/g extract). Each plot represents the interaction between two variables while the third variable is fixed at its center level.
Figure 9.
Three-dimensional response surface plots showing the effects of IN concentration, B: solid content, and C: spray drying temperature on (A) vitexin and (B–D) isovitexin contents (mg/g extract). Each plot represents the interaction between two variables while the third variable is fixed at its center level.
Across all carriers, spray-drying temperature showed a positive influence on the flavonoid contents measured after drying, as higher temperatures resulted in rapid moisture removal. This is evident from the upward trend of response surfaces along the C-axis in Figure 7, Figure 8 and Figure 9. The difference in sensitivity between vitexin and isovitexin can be attributed to their structural characteristics, where isovitexin appears more susceptible to processing conditions, leading to more pronounced variations in the response surfaces. Overall, the graphical analysis confirms that the content of marker compounds is governed by a balance between the carrier effect and dilution by the carrier matrix, with optimal conditions located at intermediate carrier levels and elevated drying temperatures. These findings are consistent with previous studies on flavonoid behavior during spray drying, where the carrier type and processing conditions play a crucial role in determining the levels of bioactive compounds [32].
3.7. Model Fitting, Statistical Adequacy, and Interpretation of Regression Models
The statistical adequacy and predictive capability of the developed RSM models were evaluated based on regression analysis parameters, including the coefficient of determination (R2), adjusted R2, predicted R2, standard deviation (SD), and p-values, as presented in Table 7, Table 8 and Table 9.
Table 8.
Results of regression analysis for responses yield, physico-chemical properties, phenolic and flavonoid contents, antioxidant activity, and marker compounds (vitexin and isovitexin) of spray-dried powder formulated with trehalose (TH).
Table 9.
Results of regression analysis for responses yield, physico-chemical properties, phenolic and flavonoid contents, antioxidant activity, and marker compounds (vitexin and isovitexin) of spray-dried powder formulated with inulin (IN).
Overall, most responses were best fitted by quadratic models, indicating the presence of nonlinear relationships and interaction effects among the independent variables (A, B, and C). This is in good agreement with the response surface plots (Figure 1, Figure 2, Figure 3, Figure 4, Figure 5, Figure 6, Figure 7, Figure 8 and Figure 9), where curved and dome-shaped patterns were observed.
For maltodextrin-based formulations (Table 7), high coefficients of determination were obtained for several responses, particularly TPC (Y4) (R2 = 0.9951) and DPPH IC50 (Y6) (R2 = 1.0000), indicating excellent agreement between experimental and predicted values. However, some responses such as yield (Y1) and Carr’s index (Y3) exhibited low or negative predicted R2 values, suggesting the limited predictive capability of the models outside the experimental region. In the trehalose-based formulations (Table 8), most responses showed consistently high R2 and predicted R2 values, reflecting better model robustness and predictability. Notably, TFC (Y5) exhibited strong model fitting (R2 = 0.9958) with high predictive accuracy, indicating that the selected variables adequately described the system behavior. For inulin-based formulations (Table 9), although some responses such as TFC (Y5) showed high R2 values (R2 = 0.9956), other responses, particularly vitexin (Y7) and isovitexin (Y8), exhibited low R2 values, non-significant p-values, and a limited predictive performance. Although negative predicted R2 values were observed for some responses, these models were retained to facilitate the visualization of factor–response relationships within the experimental design space. Therefore, the corresponding response surface models should be interpreted primarily as descriptive tools for understanding trends and interactions among variables rather than as highly predictive models for extrapolation beyond the investigated conditions. This suggests that the selected variables may not fully explain the variability of these compounds in the inulin system. Therefore, any observed trends for vitexin and isovitexin should be interpreted with caution and regarded as preliminary observations rather than definitive evidence of the effects of carrier type or spray-drying conditions on marker compound retention.
Overall, the statistical results indicate that the developed models were suitable for describing most responses, particularly in the MD and TH systems. The consistency between regression analysis (Table 7, Table 8 and Table 9) and graphical trends (Figure 1, Figure 2, Figure 3, Figure 4, Figure 5, Figure 6, Figure 7, Figure 8 and Figure 9) generally supports the applicability of the RSM approach for optimization. However, some responses, particularly vitexin and isovitexin, exhibit limited predictive reliability and should therefore be interpreted with caution. These findings are consistent with previous studies reporting that quadratic models are effective for describing nonlinear behavior in spray-drying processes [33].
3.8. Optimization and Validation of RSM Models
The optimal conditions for each carrier system were determined using the desirability function approach, and the predicted responses were validated experimentally, as presented in Table 10, Table 11 and Table 12. The optimization aimed to maximize yield, TPC, TFC, vitexin, and isovitexin, while minimizing moisture content and DPPH, IC50 values.
Table 10.
Optimized of spray-dried powder formulated with maltodextrin (MD) conditions and responses obtained from RSM data.
Table 11.
Optimized of spray-dried powder formulated with trehalose (TH) conditions and responses obtained from RSM data.
Table 12.
Optimized of spray-dried powder formulated with inulin (IN) conditions and responses obtained from RSM data.
For maltodextrin-based formulations (Table 10), the highest yield (84.85%) was obtained at Run 15; other responses reached their optimal values at different runs, including the lowest moisture content at Run 6 (4.21%), highest TPC and TFC at Run 7 (27.20 mg GAE/g extract and 102.35 mg QE/g extract, respectively), and strongest antioxidant activity at Run 12 (IC50 = 0.123 mg/mL). For the marker compounds, the highest concentrations of vitexin (30.95 mg/g extract) and isovitexin (54.46 mg/g extract) were observed at Run 6, indicating that this condition was particularly effective in maintaining high levels of these flavonoid constituents after drying. The experimental results presented in Table 10 indicate that each response variable reached its optimum under different experimental conditions. Specifically, Run 7 yielded the highest TPC, whereas Run 12 exhibited the strongest antioxidant activity, as reflected by the lowest IC50 value. This observation highlights the multi-response nature of the system, in which no single condition simultaneously optimizes all responses. Although Run 6 provided the highest experimental values of vitexin and isovitexin, these responses were associated with low or negative predicted R2 values, indicating limitations in the predictive capability of the models for these variables. Evaluation of model adequacy (Table 7) revealed that, despite several responses showing high R2 and adjusted R2 values, the predicted R2 values for certain variables, including TFC, vitexin, and isovitexin, were low or even negative. This suggests a poor predictive performance of the models for new observations and indicates discrepancies between the fitted models and the experimental data. Therefore, these variables were retained in the desirability function to provide a comprehensive assessment of powder quality and bioactive composition. However, the optimization results associated with these responses should be interpreted with caution because of their relatively low predictive reliability. Although these responses exhibited acceptable R2 values, their predicted R2 values were low or negative (Table 7), reflecting limited predictive reliability. When considered alongside the experimental results in Table 10, it was observed that although TFC reached its maximum at Run 7 and vitexin and isovitexin reached their highest values at Run 6, these results could not reliably confirm the optimal condition due to the limited predictive accuracy of their respective models, as indicated by relatively high residual values. In contrast, TPC and DPPH exhibited high predicted R2 values, with DPPH approaching unity, indicating excellent predictive performance. Furthermore, the experimental result for DPPH at Run 12 showed a very low residual, demonstrating strong agreement between predicted and observed values. The optimum formulation for the maltodextrin (MD) system was obtained at 2.04 g of carrier, 2.66 g of solid content, and a spray-drying temperature of 151.68 °C, corresponding to an overall desirability value of 1.000. Experimental validation demonstrated good agreement between predicted and experimental values, with percentage errors ranging from 0.67% to 14.97% (Table 10). Most responses, including yield, moisture content, TPC, TFC, DPPH IC50, and isovitexin, exhibited percentage errors below 10%, indicating acceptable predictive accuracy of the optimization model. A relatively higher error was observed for vitexin (14.97%), which was consistent with the lower predictive performance of its corresponding regression model.
Therefore, based on both model reliability and the consistency between the predicted and experimental data, responses with low or negative predicted R2 values were retained in the desirability function but were interpreted with caution due to their limited predictive performance. The optimal conditions were determined based on the overall desirability function while considering the predictive reliability of individual responses. The optimal condition was determined based on responses with high predictive accuracy, with DPPH identified as the most reliable response. Accordingly, Run 12 was selected as the optimal condition in accordance with RSM principles.
For trehalose-based formulations (Table 11), the highest yield (78.78%) was obtained at Run 15, while other responses reached their optimal values at different runs, including the lowest moisture content at Run 14 (3.18%), the lowest Carr’s index at Run 13 (20.72%), the highest TPC and TFC at Run 7 (28.12 mg GAE/g extract and 102.23 mg QE/g extract, respectively), and the strongest antioxidant activity at Run 14 (IC50 = 0.096 mg/mL). In terms of marker compounds, the highest concentrations of vitexin (34.73 mg/g extract) and isovitexin (49.89 mg/g extract) were observed at Run 9. Although Run 9 yielded the highest concentrations of vitexin and isovitexin, the consideration of model adequacy (Table 8) revealed that these responses were associated with low or negative predicted R2 values, indicating the limited predictive capability of the models. This suggests that, despite their high experimental values, these responses had limited predictive capability. Although these responses exhibited relatively low or negative Predicted R2 values, they were retained in the desirability function to provide a comprehensive evaluation of the bioactive composition. However, the optimization results associated with these responses should be interpreted with caution because of their limited predictive reliability. As shown in Table 8, most RSM models exhibited a satisfactory goodness-of-fit, with high R2 and adjusted R2 values and statistically significant p-values (p < 0.05) for several responses. However, the predicted R2 values for certain variables, particularly those related to marker compounds, were relatively low or negative. This indicates a limited predictive performance and suggests that the models may not adequately describe the variability of these responses when extrapolated beyond the experimental domain. Among the evaluated responses, TPC and TFC demonstrated comparatively higher predictive reliability, as evidenced by their acceptable predicted R2 values. Consequently, Run 7, which provided the highest values of both TPC and TFC, was considered a more appropriate condition when both experimental outcomes and model reliability were taken into account. In contrast, vitexin and isovitexin exhibited low or negative predicted R2 values, reflecting a poor predictive performance. This observation is consistent with the results presented in Table 11, where relatively high residual values were obtained for these responses, indicating substantial discrepancies between predicted and experimental values. Although the models were able to capture general trends, their quantitative predictive accuracy for these variables remained limited.
Similarly, physical properties such as yield, moisture content, and Carr’s index showed low or negative Predicted R2 values (Table 8), indicating limited predictive reliability for quantitative prediction. Nevertheless, these responses exhibited relatively low residual values in Table 11, suggesting acceptable agreement between predicted and experimental data within the studied range. Therefore, these responses were retained in the desirability function to provide a comprehensive assessment of powder quality. However, the optimization results associated with these responses should be interpreted with caution because of their limited predictive performance. Despite these limitations, the models remain useful for describing process performance and product characteristics, including drying efficiency, powder formation, and flowability.
The optimum formulation for the trehalose (TH) system was obtained at 2.36 g of trehalose, 3.00 g of solid content, and a spray-drying temperature of 141.01 °C, corresponding to an overall desirability value of 1.000. Experimental validation demonstrated acceptable agreement between predicted and experimental values, with percentage errors ranging from 0.51% to 31.95% (Table 11). Most responses, including yield, moisture content, Carr’s index, TPC, and TFC, exhibited percentage errors below 5%, indicating a satisfactory predictive accuracy of the optimization model. A relatively higher error was observed for DPPH IC50 (13.51%), while larger deviations were found for vitexin (31.95%) and isovitexin (16.87%). These results are consistent with the lower predictive performance of their corresponding regression models, as reflected by their low or negative predicted R2 values. Nevertheless, the overall validation results confirmed that the developed RSM model was suitable for describing the effects of formulation variables on the major physico-chemical properties and bioactive constituents of spray-dried MBSC powder.
Overall, these findings highlight that responses with high predictive reliability, such as TPC and TFC, are more appropriate as primary criteria for RSM-based optimization. In contrast, responses with limited predictive capability, including marker compounds and certain physical properties, should be used to support the interpretation of system behavior rather than as decisive factors in determining optimal conditions.
For inulin-based formulations (Table 12). The highest yield (81.81%) was obtained at Run 2, while other responses reached their optimal values at different runs, including the lowest moisture content at Run 13 (3.31%), the lowest Carr’s index at Run 12 (13.77%), the highest TPC at Run 7 (27.54 mg GAE/g extract), and the strongest antioxidant activity at Run 12 (IC50 = 0.100 mg/mL). In terms of flavonoid-related responses, the highest TFC was observed at Run 14 (126.79 mg QE/g extract). Similarly, the highest concentrations of vitexin (33.56 mg/g extract) and isovitexin (53.06 mg/g extract) were also obtained at Run 14, suggesting that this condition was particularly effective in maintaining high levels of these flavonoid constituents after drying. However, the optimization results for vitexin and isovitexin should be interpreted with caution because of the limited predictive performance of their corresponding regression models.
The model reliability assessment based on Table 9 indicated that TFC and DPPH exhibited acceptable predicted R2 values, with DPPH showing particularly high predictive accuracy. Notably, although DPPH was best described by a linear model, it still demonstrated excellent predictive performance, suggesting that model type did not necessarily determine model quality. In contrast, TFC, despite being fitted to a quadratic model and having an acceptable predicted R2 value, exhibited a relatively high residual (6.59) as shown in Table 12. This indicates a noticeable discrepancy between predicted and experimental values, particularly for marker compounds with relatively low predictive reliability, thereby reducing the reliability of the model under these conditions. When considered alongside the experimental results in Table 12, TFC reached its maximum value at Run 14 (126.79 mg QE/g extract), whereas DPPH exhibited the lowest IC50 value at Run 12 (0.100 mg/mL). These findings suggest that the optimal conditions for reliable responses do not coincide within the same experimental run. Although Run 14 provided the highest TFC value, the relatively high residual suggests reduced model reliability. In contrast, Run 12, which exhibited the strongest antioxidant activity, demonstrated excellent agreement between predicted and experimental values, as reflected by a very low residual. Other responses, including yield, moisture content, Carr’s index, TPC, as well as vitexin and isovitexin, showed low or negative predicted R2 values, indicating the limited predictive capability of the models. Therefore, these responses were retained in the desirability function to provide a comprehensive assessment of powder quality and bioactive composition; however, the associated optimization results should be interpreted with caution because of their limited predictive reliability. Based on both predictive performance and experimental validation, DPPH exhibited the strongest predictive capability among the evaluated responses. Nevertheless, the optimal formulation was selected using the overall desirability function, which simultaneously considered all responses included in the numerical optimization procedure, DPPH was identified as the most reliable response variable, and Run 12 was selected as the optimal condition according to RSM principles.
The optimum formulation for the inulin (IN) system was obtained at 2.35 g inulin, 1.67 g solid content, and a spray-drying temperature of 155.31 °C, corresponding to an overall desirability value of 1.000. Experimental validation demonstrated acceptable agreement between predicted and experimental values, with percentage errors ranging from 0.11% to 58.68% (Table 12). Low percentage errors were observed for yield (0.93%), moisture content (2.48%), TPC (0.11%), and TFC (5.48%), indicating satisfactory predictive accuracy of the optimization model for these responses. Moderate deviations were observed for Carr’s index (16.55%) and DPPH IC50 (9.01%), whereas substantially larger errors were found for vitexin (58.68%) and isovitexin (36.02%). These results are consistent with the lower predictive performance of their corresponding regression models, as reflected by their low or negative predicted R2 values. Therefore, the optimization results associated with vitexin and isovitexin should be interpreted with caution. Nevertheless, the overall validation results confirmed that the developed RSM model was useful for describing the effects of formulation variables on the major physico-chemical properties and bioactive constituents of spray-dried MBSC powder.
When considering both model adequacy (Table 7, Table 8 and Table 9) and experimental results (Table 10, Table 11 and Table 12), it was evident that each response variable reached its maximum under different experimental conditions, confirming the multi-response nature of the system. For example, Run 15 provided the highest yield in both MD and TH systems, whereas Run 7 yielded the highest TPC across all carriers, including MD (27.20 mg GAE/g extract), TH (28.12 mg GAE/g extract), and IN (27.54 mg GAE/g extract). However, when model reliability was taken into account, TPC exhibited high predicted R2 values in MD (0.9213) and TH (0.7551), but a relatively low value in IN, indicating limited predictive capability in that system. Therefore, Run 7 can be considered appropriate for RSM-based optimization only in specific carriers.
For the marker compounds vitexin and isovitexin, the highest values were observed at Run 6 (MD), Run 9 (TH), and Run 14 (IN). Although Run 14 also provided the highest TFC (126.79 mg QE/g extract) with acceptable predicted R2 and p-values, vitexin and isovitexin consistently exhibited low or negative predicted R2 values across systems, and in some cases, non-significant p-values (Table 7, Table 8 and Table 9). These findings indicate poor predictive performance and limit their suitability as primary criteria for optimization. In contrast, antioxidant activity (DPPH) demonstrated high model reliability, with predicted R2 values of 0.9993 and 0.7251 in MD and IN systems, respectively, along with statistically significant p-values (p < 0.05). Experimental results further supported this observation, as Run 12 yielded the lowest IC50 values in MD (0.123 mg/mL) and IN (0.100 mg/mL), with very low residuals (e.g., −0.009 in MD), indicating strong agreement between predicted and observed values.
According to RSM principles, responses with high predictive reliability and strong agreement between predicted and experimental values should be prioritized for optimization. Accordingly, Run 12 was identified as the optimal condition for MD and IN systems based on DPPH as the most reliable response. In contrast, for the TH system, Run 7 was considered the most appropriate condition, as TPC (and TFC to a supporting extent) exhibited acceptable model reliability and reached their maximum values under this condition. Other responses, including yield, moisture content, Carr’s index, TFC (in some systems), and specific marker compounds, although exhibiting high experimental values under certain conditions, showed low or negative predicted R2 values and/or relatively high residuals. These limitations indicate that such responses are unsuitable as primary criteria for optimization. Nevertheless, they remain valuable for interpreting system behavior, particularly in describing process efficiency, physical properties of the product (e.g., powder formation and handling characteristics), and the influence of different carriers on the content of bioactive compounds measured after spray drying. These findings demonstrate that optimal conditions in this system are carrier-dependent and should be determined based on responses with high predictive reliability, while other responses should be used to support the interpretation of system behavior rather than serve as decisive factors in RSM-based optimization.
The validation results confirmed that the developed RSM models were suitable for predicting optimal conditions, particularly for MD and TH systems. A strong agreement between predicted and experimental values was observed for the key responses with high predictive reliability, especially in antioxidant activity (DPPH), supporting the robustness of the models. These findings were consistent with the response surface trends (Figure 1, Figure 2, Figure 3, Figure 4, Figure 5, Figure 6, Figure 7, Figure 8 and Figure 9), demonstrating that RSM was an effective approach for optimizing spray-drying conditions for this system [29].
Importantly, the optimal conditions were found to be carrier-dependent when evaluated based on model reliability and multi-response considerations. For the MD and IN systems, Run 12 was identified as the optimal condition, as it provided the lowest IC50 values (highest antioxidant activity) with high predicted R2 and minimal residuals, indicating excellent agreement between predicted and experimental data. In contrast, for the TH system, Run 7 was considered the most appropriate condition, as it yielded the highest TPC with acceptable predictive performance of the model. The combined analysis of response surface plots (Figure 1, Figure 2, Figure 3, Figure 4, Figure 5, Figure 6, Figure 7, Figure 8 and Figure 9) and regression models (Table 7, Table 8 and Table 9) revealed that most responses were governed by quadratic effects and interactions among carrier concentration, solid content, and drying temperature. These interactions contributed to the differing optimal conditions across carriers, reinforcing the complexity of the system.
Distinct performance trends were observed among the carriers. MD provided a high yield and satisfactory physico-chemical properties, while TH exhibited relatively stable model behavior and high phenolic content after drying. In contrast, IN showed high flavonoid contents in certain conditions; however, the model exhibited lower predictive accuracy, limiting its use for optimization purposes. The optimization results (Table 10, Table 11 and Table 12) further confirmed that no single experimental condition could simultaneously maximize all responses. Instead, different responses reached their optimum under different conditions, reflecting the multi-response nature of the system. Therefore, responses with high predictive reliability, particularly DPPH and TPC, were prioritized in determining optimal conditions, while other responses were used to support the interpretation of system behavior.
Overall, these findings highlight that the selection of carrier type plays a critical role in determining the physico-chemical properties, content of bioactive compounds after spray drying, and functional performance of spray-dried powders. The RSM approach proved to be a powerful tool not only for identifying optimal conditions but also for elucidating the complex interactions among formulation and process variables.
3.9. Comparative Performance and Mechanistic Insights
The comparative analysis of the three carriers, based on the response surface plots (Figure 1, Figure 2, Figure 3, Figure 4, Figure 5, Figure 6, Figure 7, Figure 8 and Figure 9) and experimental data (Table 7, Table 8, Table 9, Table 10, Table 11 and Table 12), revealed distinct functional roles in determining powder characteristics and the content of bioactive compound after spray drying.
Maltodextrin-based formulations exhibited high process efficiency and favorable physico-chemical properties. Although the highest yield (84.85%) was observed at Run 15 (Table 10), this response was not used as the primary optimization criterion due to the low predictive ability of the model. Instead, Run 12 was identified as the optimal condition based on antioxidant activity (DPPH), which showed high model reliability and strong agreement between predicted and experimental values. The response surface plots (Figure 1, Figure 2, Figure 3, Figure 4, Figure 5, Figure 6 and Figure 7) demonstrated relatively smooth and stable trends, indicating predictable system behavior. These findings suggest that maltodextrin is effective in improving drying efficiency and reducing stickiness during spray drying, consistent with previous reports [34].
Trehalose exhibited higher phenolic content after drying and consistent model behavior. While the lowest DPPH IC50 value was observed at Run 14 (Table 11), this condition was not selected due to its optimization of a single response. Instead, Run 7 was considered the most appropriate condition based on TPC, which demonstrated acceptable predictive performance. The response surface plots (Figure 1, Figure 2, Figure 3, Figure 4, Figure 5, Figure 6 and Figure 8) showed more pronounced curvature and clear optimal regions, reflecting strong interactions among variables. This behavior supports the hypothesis, drawn from literature, that trehalose may help maintain higher phenolic compound levels through glassy matrix formation and hydrogen bonding interactions [35].
Inulin-based formulations demonstrated high flavonoid contents, particularly TFC at Run 14 (Table 12). However, due to the relatively low predictive accuracy of the model (Table 9), these responses were not suitable as the primary criteria for optimization. Instead, Run 12 was identified as the optimal condition based on antioxidant activity (DPPH), which showed higher predictive reliability. The response surface plots also indicated greater variability compared to other carriers, suggesting a more complex system. These findings indicate that inulin-based powders can exhibit high flavonoid contents, a finding that may be linked to the polymeric network formation suggested in earlier studies [36]. It should be noted that all DPPH IC50 values are expressed on a per-mass-of-powder basis. Therefore, differences among carriers reflect both the inherent protective effects of the carrier during drying and the diluting influence of the carrier matrix. In addition, the mechanistic interpretations discussed above—including those related to glass transition temperature elevation, hydrogen bonding, amorphous glassy matrix formation, and polymeric network entrapment—are based on findings reported in the literature. Direct characterization, such as differential scanning calorimetry (DSC), Fourier-transform infrared spectroscopy (FTIR), scanning electron microscopy (SEM), and water sorption analysis, was not performed in this study. These measurements are recommended for future investigations to confirm the proposed mechanisms.
From a mechanistic perspective, the experimental trends showed that increasing carrier concentration generally led to a reduction in TPC, TFC, and antioxidant activity (higher IC50 values), as observed in the response surfaces, due to a dilution effect [37]. Concurrently, at very low carrier concentrations, the measured values of these compounds also tended to be lower, likely due to insufficient crust formation during droplet drying, which may result in greater losses of labile compounds.
Increasing spray-drying temperature had a positive effect on drying efficiency within the studied range, as reflected by lower moisture content and improved antioxidant activity in the optimized runs. This can be attributed to rapid moisture removal, which reduces the exposure time of thermolabile compounds to elevated temperatures [38]. The balance between these two opposing effects—carrier-assisted reduction in compound losses during drying versus carrier-induced dilution—defines the optimal region identified by the response surface methodology.
It is important to clearly delineate the scope of the present investigation. This study focused on the content of phenolic compounds, flavonoids, and marker flavonoids (vitexin and isovitexin), as well as antioxidant activity, determined immediately after spray drying. These measurements reflect the quantity of extract-derived compounds present in the powder at the time of analysis and do not constitute direct evidence of encapsulation, protection, or prolonged retention of these compounds during storage. Moreover, the present study did not evaluate reconstitution solubility, in vitro release profiles under simulated food or gastrointestinal conditions, or the stability of bioactivity following simulated digestion; these are critical functional attributes for prospective food or nutraceutical delivery systems and remain to be explored. Parameters commonly used to support claims of encapsulation effectiveness—such as encapsulation efficiency, surface phenolic content, particle morphology (SEM), particle size distribution, water activity, hygroscopicity, solubility, reconstitution behavior, and storage stability under controlled conditions—were not within the scope of this investigation. Consequently, the results should be interpreted as an initial screening of carrier effects on spray-dried powder properties and the immediate post-drying content of bioactive compounds, rather than as a demonstration of microencapsulation or long-term protective functionality.
Overall, these mechanisms collectively explain the observed system behavior, where different carriers exhibit distinct functional advantages in terms of process yield, powder physical properties, and the content of phenolic and flavonoid compounds measured after drying. The results confirm that optimal performance is achieved under conditions that balance process efficiency with the content of bioactive compounds in the final powder. These findings are consistent with previous studies on spray-drying systems [32].
3.10. Potential Applications
The findings of this study provide a systematic framework for the early-stage development of spray-dried powders from mung bean seed coat extract, an agro-industrial by-product that is currently underutilized. By comparing three structurally distinct polysaccharide-based carriers and applying response surface methodology, this work identifies the key trade-offs between process yield, powder physical properties, and the content of phenolic and flavonoid compounds measured immediately after spray drying. These insights are directly relevant to researchers and product developers seeking to select appropriate carriers for polyphenol-rich extracts in the initial stages of powder formulation.
From a practical standpoint, the selection of an optimal carrier and processing condition depends on the specific product target. Trehalose-based formulations showed potential for applications where a higher content of phenolic compounds after drying was desired. Under the optimal condition (Run 7, Table 11), trehalose provided the highest TPC and TFC with acceptable predictive performance of the model. This suggests that trehalose may be suitable for applications such as functional foods and cosmetic formulations, where the content of phenolic and flavonoid compounds is a key quality attribute. The clear optimal regions observed in the response surface plots (Figure 1, Figure 2, Figure 3, Figure 4, Figure 5, Figure 6 and Figure 8) further support its consistent behavior under varying process conditions. Maltodextrin-based formulations demonstrated advantages in both process efficiency and functional performance. Although Run 15 provided the highest yield, this parameter was not considered a primary optimization criterion due to the low predictive accuracy of the model. Instead, Run 12 was identified as the optimal condition based on antioxidant activity (DPPH), which showed high predictive reliability and strong agreement between predicted and experimental values. These characteristics indicate that maltodextrin is suitable for applications requiring a balance between process efficiency, consistent powder quality, and functional performance, particularly in large-scale production systems. For inulin-based formulations, although a higher flavonoid content was observed under certain conditions (e.g., Run 14, Table 12), these responses were not used as the primary criteria due to the low predictive performance of the model (Table 9). Instead, Run 12 was considered the most appropriate condition based on antioxidant activity, which demonstrated higher model reliability. The greater variability observed in the response surface plots (Figure 1, Figure 2, Figure 3, Figure 4, Figure 5, Figure 6 and Figure 9) suggests a more complex system, indicating that inulin may be suitable for specialized applications where high flavonoid content is important, but further optimization is required to improve consistency and processability.
Overall, the results highlight that the selection of carrier type should be aligned with the specific functional requirements of the final product. Importantly, responses with a high predictive reliability, such as antioxidant activity (DPPH) and TPC, provide a more robust basis for application-driven optimization. The integration of experimental validation and RSM analysis offers a practical guideline for designing spray-dried powders with tailored properties for food, nutraceutical, and cosmetic applications. The systematic approach presented here can be extended to other polyphenol-rich agricultural by-products, contributing to the broader goal of valorizing underutilized resources for functional ingredient development.
4. Conclusions
This study applied response surface methodology with a Box–Behnken design to evaluate the effects of three structurally distinct polysaccharide carriers—maltodextrin, trehalose, and inulin—and spray-drying parameters on the properties of mung bean seed coat extract powders. Among the carriers, maltodextrin provided the highest process yield, trehalose-based formulations yielded the highest total phenolic content (TPC) after drying, and inulin-based powders resulted in the highest total flavonoid content (TFC). No single condition simultaneously optimized all measured responses, consistent with the inherent trade-offs in multi-response systems; DPPH radical scavenging activity and TPC were identified as the most statistically robust variables for multi-objective optimization. Overall, intermediate to high carrier concentrations combined with moderate to high inlet air temperatures offered a favorable balance between process efficiency, powder physical properties, and the content of bioactive compounds measured immediately after spray drying. This systematic framework provides practical guidance for carrier selection in the early-stage development of spray-dried functional ingredients from polyphenol-rich agricultural by-products. However, this study focused solely on immediate post-drying characteristics; future work should evaluate encapsulation efficiency, particle morphology, storage stability, and baseline characterization of the starting extract to enable direct quantification of compound retention.
Author Contributions
Conceptualization, J.A. and S.T.; methodology, J.A., C.S., N.K., and S.T.; software, N.K.; validation, N.K. and S.M.; formal analysis, J.A., C.S., and N.K.; investigation, J.A.; resources, S.T.; data curation, J.A. and N.K.; writing—original draft preparation, J.A. and N.K.; writing—review and editing, J.A.; visualization, J.A. and N.K.; supervision, S.T.; funding acquisition, S.T. All authors have read and agreed to the published version of the manuscript.
Funding
The research on “Spray-Dried Powder of Vigna radiata Sead Coat Extract: Response Surface Optimization of Carrier and Process Parameters for Powder Quality and Bioactive Content” has received funding support from the Fundamental Fund of Khon Kaen University from National Science, Research and Innovation Fund or NSRF, Thailand.
Institutional Review Board Statement
Not applicable.
Data Availability Statement
The original contributions presented in this study are included in the article. Further inquiries can be directed to the corresponding author.
Acknowledgments
The graphical abstract was generated using Google’s NotebookLM, an AI-powered re-search assistant. The only input (prompt) provided to the tool was the full abstract of our manuscript: “Mung bean (*Vigna radiata* (L.) Wilczek) seed coat (MBSC) is an underutilized by-product rich in vitexin and isovitexin, but its potential as a source of spray-dried functional powders has not been systematically evaluated. This study investigated the spray-drying of MBSC extract using three structurally distinct polysaccharide-based carriers—maltodextrin, trehalose, and inulin—to compare their effects on process yield, powder quality, and the content of phenolic compounds, flavonoids, and antioxidant activity. Response surface methodology (RSM) with a Box–Behnken design was employed to examine the influence of inlet temperature (130–160 °C) and carrier concentration. Maltodextrin provided the highest process yield (84.85%), while trehalose and inulin formulations exhibited stronger antioxidant activity, with the lowest DPPH IC50 values of 0.096 mg/mL and 0.100 mg/mL, respectively (expressed per mg of spray-dried powder). Trehalose yielded the highest total phenolic content (TPC = 28.12 mg GAE/g extract) and acceptable flowability (Carr’s index = 20.72%). Inulin gave the highest total flavonoid content (TFC = 126.8 mg QE/g extract) but showed greater variability, attributed to its polymeric network and higher hygroscopicity. The RSM models showed high predictive accuracy for TPC (R2 > 0.98) and DPPH antioxidant activity (R2 ≈ 1.00). These findings offer a multi-objective optimization frame-work that links carrier structure to powder performance, providing practical guidance for selecting polysaccharide carriers in the development of spray-dried nutraceutical and functional food ingredients. However, direct measurement of encapsulation efficiency, particle morphology, and storage stability was beyond the scope of this study and warrants further investigation.” NotebookLM then automatically generated an infographic-style visual summary from that abstract. After generation, we manually re-moved a few elements that were not factually accurate (for example, an incorrectly generated title) to ensure the final graphical abstract faithfully represented the study. No additional text prompts or modifications were applied before the AI output. The authors express gratitude to Glenn Borlace for assistance with English language editing through the Publication Clinic of Khon Kaen University.
Conflicts of Interest
The authors declare no conflicts of interest.
Abbreviations
The following abbreviations are used in this manuscript:
| RSM | response surface methodology |
| MBSC | mung bean seed coat |
| MD | maltodextrin |
| TH | trehalose |
| IN | inulin |
| TPC | total phenolic content |
| TFC | total flavonoid content |
| Tg | glass transition temperature |
| g | gram |
| mg | milligram |
| µg | microgram |
| mL | milliliter |
| µL | microliter |
| min | minute |
| RH | relative humidity |
| nm | nanometer |
| mm | millimeter |
| QE | quercetin |
| GAE | gallic acid |
| DPPH | 2,2-diphenyl−1-picrylhydrazyl |
| Abs | absorbance |
| ICH | International Harmonization Conference |
| LOD | limit of detection |
| LOQ | limit of quantification |
References
- Socaci, S.A.; Farcas, A.C.; Vodnar, D.C.; Tofana, M. Food Wastes as Valuable Sources of Bioactive Molecules. In Superfood and Functional Food—The Development of Superfoods and Their Roles as Medicine; IntechOpen: London, UK, 2017. [Google Scholar] [CrossRef] [Scilit] [PubMed]
- Yutharaksanukul, P.; Tangpromphan, P.; Tunsagool, P.; Sae-Tan, S.; Nitisinprasert, S.; Somnuk, S.; Nakphaichit, M.; Pusuntisumpun, N.; Wanikorn, B. Effects of Purified Vitexin and Iso-Vitexin from Mung Bean Seed Coat on Antihyperglycemic Activity and Gut Microbiota in Overweight Individuals’ Modulation. Nutrients 2024, 16, 3017. [Google Scholar] [CrossRef] [Scilit] [PubMed]
- Cao, D.; Li, H.; Yi, J.; Zhang, J.; Che, H.; Cao, J.; Yang, L.; Zhu, C.; Jiang, W. Antioxidant Properties of the Mung Bean Flavonoids on Alleviating Heat Stress. PLoS ONE 2011, 6, e21071. [Google Scholar] [CrossRef] [Scilit] [PubMed]
- Charoensiddhi, S.; Chanput, W.P.; Sae-Tan, S. Gut Microbiota Modulation, Anti-Diabetic and Anti-Inflammatory Properties of Polyphenol Extract from Mung Bean Seed Coat (Vigna radiata L.). Nutrients 2022, 14, 2275. [Google Scholar] [CrossRef] [Scilit] [PubMed]
- Sae-Tan, S.; Kumrungsee, T.; Yanaka, N. Mungbean Seed Coat Water Extract Inhibits Inflammation in LPS-Induced Acute Liver Injury Mice and LPS-Stimulated RAW 246.7 Macrophages via the Inhibition of TAK1/IκBα/NF-κB. J. Food Sci. Technol. 2020, 57, 2659–2668. [Google Scholar] [CrossRef] [Scilit] [PubMed]
- Fang, Z.; Bhandari, B. Encapsulation of Polyphenols—A Review. Trends Food Sci. Technol. 2010, 21, 510–523. [Google Scholar] [CrossRef] [Scilit]
- Munin, A.; Edwards-Lévy, F. Encapsulation of Natural Polyphenolic Compounds; a Review. Pharmaceutics 2011, 3, 793–829. [Google Scholar] [CrossRef] [Scilit] [PubMed]
- Paniwnyk, L. Application of Ultrasound. In Emerging Technologies for Food Processing; Academic Press: Cambridge, MA, USA, 2014; pp. 271–291. [Google Scholar] [CrossRef] [Scilit]
- Díaz-Montes, E. Wall Materials for Encapsulating Bioactive Compounds via Spray-Drying: A Review. Polymers 2023, 15, 2659. [Google Scholar] [CrossRef] [Scilit] [PubMed]
- Shrestha, A.K.; Ua-Arak, T.; Adhikari, B.P.; Howes, T.; Bhandari, B.R. Glass Transition Behavior of Spray Dried Orange Juice Powder Measured by Differential Scanning Calorimetry (DSC) and Thermal Mechanical Compression Test (TMCT). Int. J. Food Prop. 2007, 10, 661–673. [Google Scholar] [CrossRef] [Scilit]
- Nunes, G.L.; De Araújo Etchepare, M.; Cichoski, A.J.; Zepka, L.Q.; Lopes, E.J.; Barin, J.S.; De Moraes Flores, É.M.; De Bona Da Silva, C.; De Menezes, C.R. Inulin, Hi-Maize, and Trehalose as Thermal Protectants for Increasing Viability of Lactobacillus Acidophilus Encapsulated by Spray Drying. LWT 2017, 89, 128–133. [Google Scholar] [CrossRef] [Scilit]
- Jain, N.K.; Roy, I. Effect of Trehalose on Protein Structure. Protein Sci. 2008, 18, 24–36. [Google Scholar] [CrossRef] [Scilit] [PubMed]
- Colaço, C.a.L.S.; Roser, B. Trehalose-a Multifunctional Additive for Food Preservation. In Food Packaging and Preservation; Academic Press: Cambridge, MA, USA, 1994; pp. 123–140. [Google Scholar]
- De Barros Fernandes, R.V.; Borges, S.V.; Botrel, D.A. Gum Arabic/Starch/Maltodextrin/Inulin as Wall Materials on the Microencapsulation of Rosemary Essential Oil. Carbohydr. Polym. 2013, 101, 524–532. [Google Scholar] [CrossRef] [Scilit]
- Botrel, D.A.; De Barros Fernandes, R.V.; Borges, S.V.; Yoshida, M.I. Influence of Wall Matrix Systems on the Properties of Spray-Dried Microparticles Containing Fish Oil. Food Res. Int. 2014, 62, 344–352. [Google Scholar] [CrossRef] [Scilit]
- Mensink, M.A.; Frijlink, H.W.; Van Der Voort Maarschalk, K.; Hinrichs, W.L.J. Inulin, a Flexible Oligosaccharide I: Review of Its Physicochemical Characteristics. Carbohydr. Polym. 2015, 130, 405–419. [Google Scholar] [CrossRef] [Scilit] [PubMed]
- Rajam, R.; Subramanian, P. Encapsulation of Probiotics: Past, Present and Future. Beni-Suef Univ. J. Basic Appl. Sci. 2022, 11, 46. [Google Scholar] [CrossRef] [Scilit]
- Tolun, A.; Altintas, Z.; Artik, N. Microencapsulation of Grape Polyphenols Using Maltodextrin and Gum Arabic as Two Alternative Coating Materials: Development and Characterization. J. Biotechnol. 2016, 239, 23–33. [Google Scholar] [CrossRef] [Scilit] [PubMed]
- Kaderides, K.; Goula, A.M.; Adamopoulos, K.G. A Process for Turning Pomegranate Peels into a Valuable Food Ingredient Using Ultrasound-Assisted Extraction and Encapsulation. Innov. Food Sci. Emerg. Technol. 2015, 31, 204–215. [Google Scholar] [CrossRef] [Scilit]
- Saikia, S.; Mahnot, N.K.; Mahanta, C.L. Optimisation of Phenolic Extraction from Averrhoa carambola Pomace by Response Surface Methodology and Its Microencapsulation by Spray and Freeze Drying. Food Chem. 2014, 171, 144–152. [Google Scholar] [CrossRef] [Scilit] [PubMed]
- Kuck, L.S.; Noreña, C.P.Z. Microencapsulation of Grape (Vitis labrusca Var. Bordo) Skin Phenolic Extract Using Gum Arabic, Polydextrose, and Partially Hydrolyzed Guar Gum as Encapsulating Agents. Food Chem. 2015, 194, 569–576. [Google Scholar] [CrossRef] [Scilit] [PubMed]
- Kassaee, S.N.; Ayoko, G.A.; Richard, D.; Wang, T.; Islam, N. Inhaled Ivermectin-Loaded Lipid Polymer Hybrid Nanoparticles: Development and Characterization. Pharmaceutics 2024, 16, 1061. [Google Scholar] [CrossRef] [Scilit] [PubMed]
- Kohoude, M.J.; Gbaguidi, F.; Agbani, P.; Ayedoun, M.-A.; Cazaux, S.; Bouajila, J. Chemical Composition and Biological Activities of Extracts and Essential Oil of Boswellia dalzielii Leaves. Pharm. Biol. 2016, 55, 33–42. [Google Scholar] [CrossRef] [Scilit] [PubMed]
- Farsi, E.; Ahmad, M.; Hor, S.Y.; Ahamed, M.B.K.; Yam, M.F.; Asmawi, M.Z. Standardized Extract of Ficus Deltoidea Stimulates Insulin Secretion and Blocks Hepatic Glucose Production by Regulating the Expression of Glucose-Metabolic Genes in Streptozitocin-Induced Diabetic Rats. BMC Complement. Altern. Med. 2014, 14, 262. [Google Scholar] [CrossRef] [Scilit] [PubMed]
- Lorenzo, C.; Bordiga, M.; Pérez-Álvarez, E.P.; Travaglia, F.; Arlorio, M.; Salinas, M.R.; Coïsson, J.D.; Garde-Cerdán, T. The Impacts of Temperature, Alcoholic Degree and Amino Acids Content on Biogenic Amines and Their Precursor Amino Acids Content in Red Wine. Food Res. Int. 2017, 99, 328–335. [Google Scholar] [CrossRef] [Scilit] [PubMed]
- Lu, Y.; Lu, R. Structured-Illumination Reflectance Imaging Coupled with Phase Analysis Techniques for Surface Profiling of Apples. J. Food Eng. 2018, 232, 11–20. [Google Scholar] [CrossRef] [Scilit]
- Zhang, S.; Gong, G.; Wang, H.; Chen, S.; Wang, J.; Qi, J. Advances and Challenges of the Spray Drying Technology: Towards Accurately Constructing Inorganic Multi-Functional Materials and Related Applications. Sustain. Mater. Technol. 2025, 43, e01250. [Google Scholar] [CrossRef] [Scilit]
- Santipanichwong, R.; Suphantharika, M.; Weiss, J.; McClements, D.J. Adsorption of Protein-Coated Lipid Droplets onto Gellan Gum Hydrogel Surfaces. Food Res. Int. 2007, 41, 237–246. [Google Scholar] [CrossRef] [Scilit]
- Li, S.; Fu, X.; Wen, J.; Jiang, L.; Shao, L.; Du, Y.; Shan, C. Characterization of Physicochemical Properties, Bioactivities, and Sensory Attributes of Sea Buckthorn–Fava Bean Composite Instant Powder: Spray-Drying Versus Freeze-Drying Coupled with Carriers. Foods 2024, 13, 3944. [Google Scholar] [CrossRef] [Scilit] [PubMed]
- Li, L.; Wang, P.; Xu, Y.; Wu, X.; Liu, X. Effect of Trehalose on the Physicochemical Properties of Freeze-Dried Powder of Royal Jelly of Northeastern Black Bee. Coatings 2022, 12, 173. [Google Scholar] [CrossRef] [Scilit]
- Zhang, L.; Wei, Y.; Liao, W.; Tong, Z.; Wang, Y.; Liu, J.; Gao, Y. Impact of Trehalose on Physicochemical Stability of β-Carotene High Loaded Microcapsules Fabricated by Wet-Milling Coupled with Spray Drying. Food Hydrocoll. 2021, 121, 106977. [Google Scholar] [CrossRef] [Scilit]
- Sansone, F.; Picerno, P.; Mencherini, T.; Villecco, F.; D’Ursi, A.M.; Aquino, R.P.; Lauro, M.R. Flavonoid Microparticles by Spray-Drying: Influence of Enhancers of the Dissolution Rate on Properties and Stability. J. Food Eng. 2010, 103, 188–196. [Google Scholar] [CrossRef] [Scilit]
- Bezerra, M.A.; Santelli, R.E.; Oliveira, E.P.; Villar, L.S.; Escaleira, L.A. Response Surface Methodology (RSM) as a Tool for Optimization in Analytical Chemistry. Talanta 2008, 76, 965–977. [Google Scholar] [CrossRef] [Scilit] [PubMed]
- Oberoi, D.P.S.; Sogi, D.S. Effect of Drying Methods and Maltodextrin Concentration on Pigment Content of Watermelon Juice Powder. J. Food Eng. 2015, 165, 172–178. [Google Scholar] [CrossRef] [Scilit]
- Teramoto, N.; Sachinvala, N.D.; Shibata, M. Trehalose and Trehalose-Based Polymers for Environmentally Benign, Biocompatible and Bioactive Materials. Molecules 2008, 13, 1773–1816. [Google Scholar] [CrossRef] [Scilit] [PubMed]
- Díaz-Ramos, D.I.; Jiménez-Fernández, M.; García-Barradas, O.; Ortiz-Basurto, R.I.; Fouconnier, B. Chemical Modification Methods for Inulin- and Agavin-Type Fructans: Synthesis, Characterization, and Biofunctional Activity: A Review. Molecules 2025, 30, 2672. [Google Scholar] [CrossRef] [Scilit] [PubMed]
- Zulkifli, S.A.; Gani, S.S.A.; Zaidan, U.H.; Halmi, M.I.E. Optimization of Total Phenolic and Flavonoid Contents of Defatted Pitaya (Hylocereus polyrhizus) Seed Extract and Its Antioxidant Properties. Molecules 2020, 25, 787. [Google Scholar] [CrossRef] [Scilit] [PubMed]
- Zhang, J.; Zhang, C.; Chen, X.; Quek, S.Y. Effect of spray drying on phenolic compounds of cranberry juice and their stability during storage. J. Food Eng. 2019, 269, 109744. [Google Scholar] [CrossRef] [Scilit]
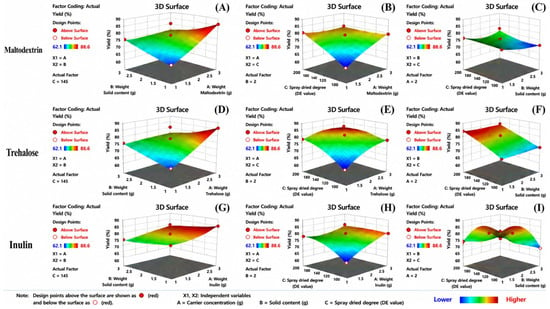
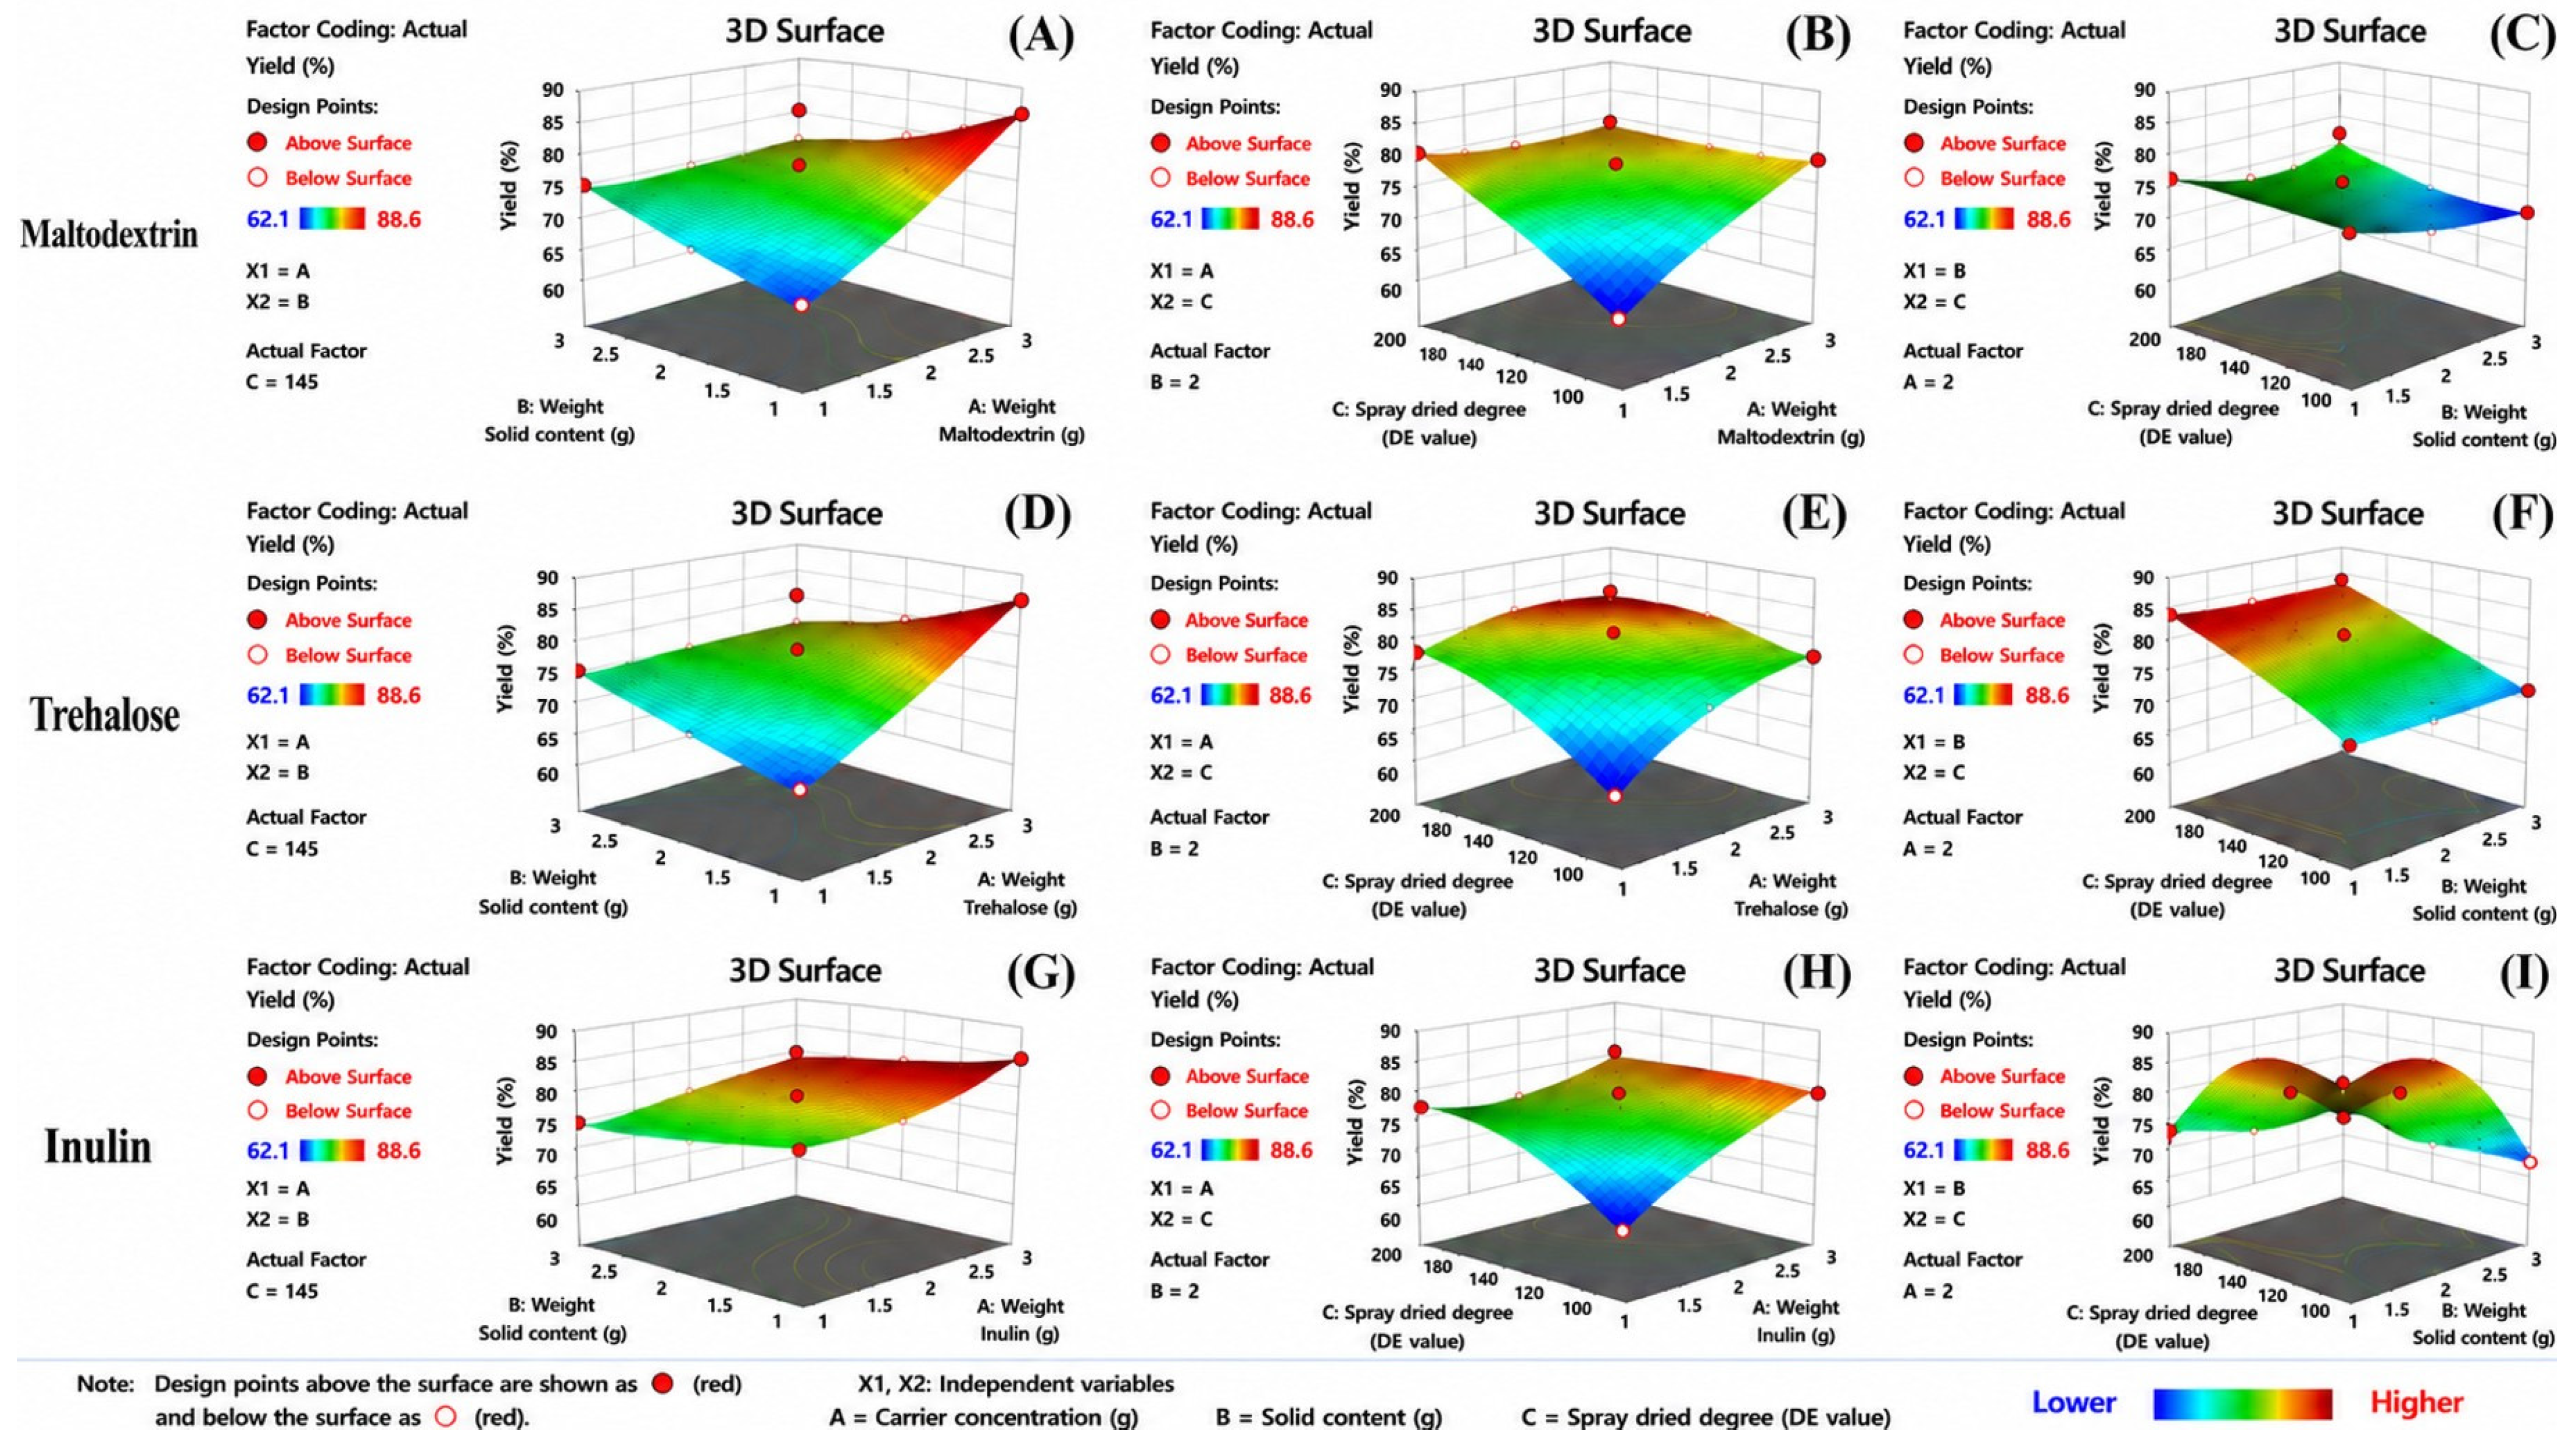
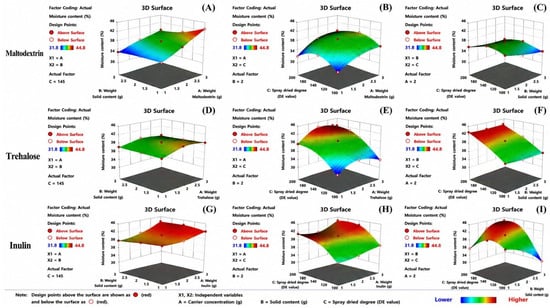
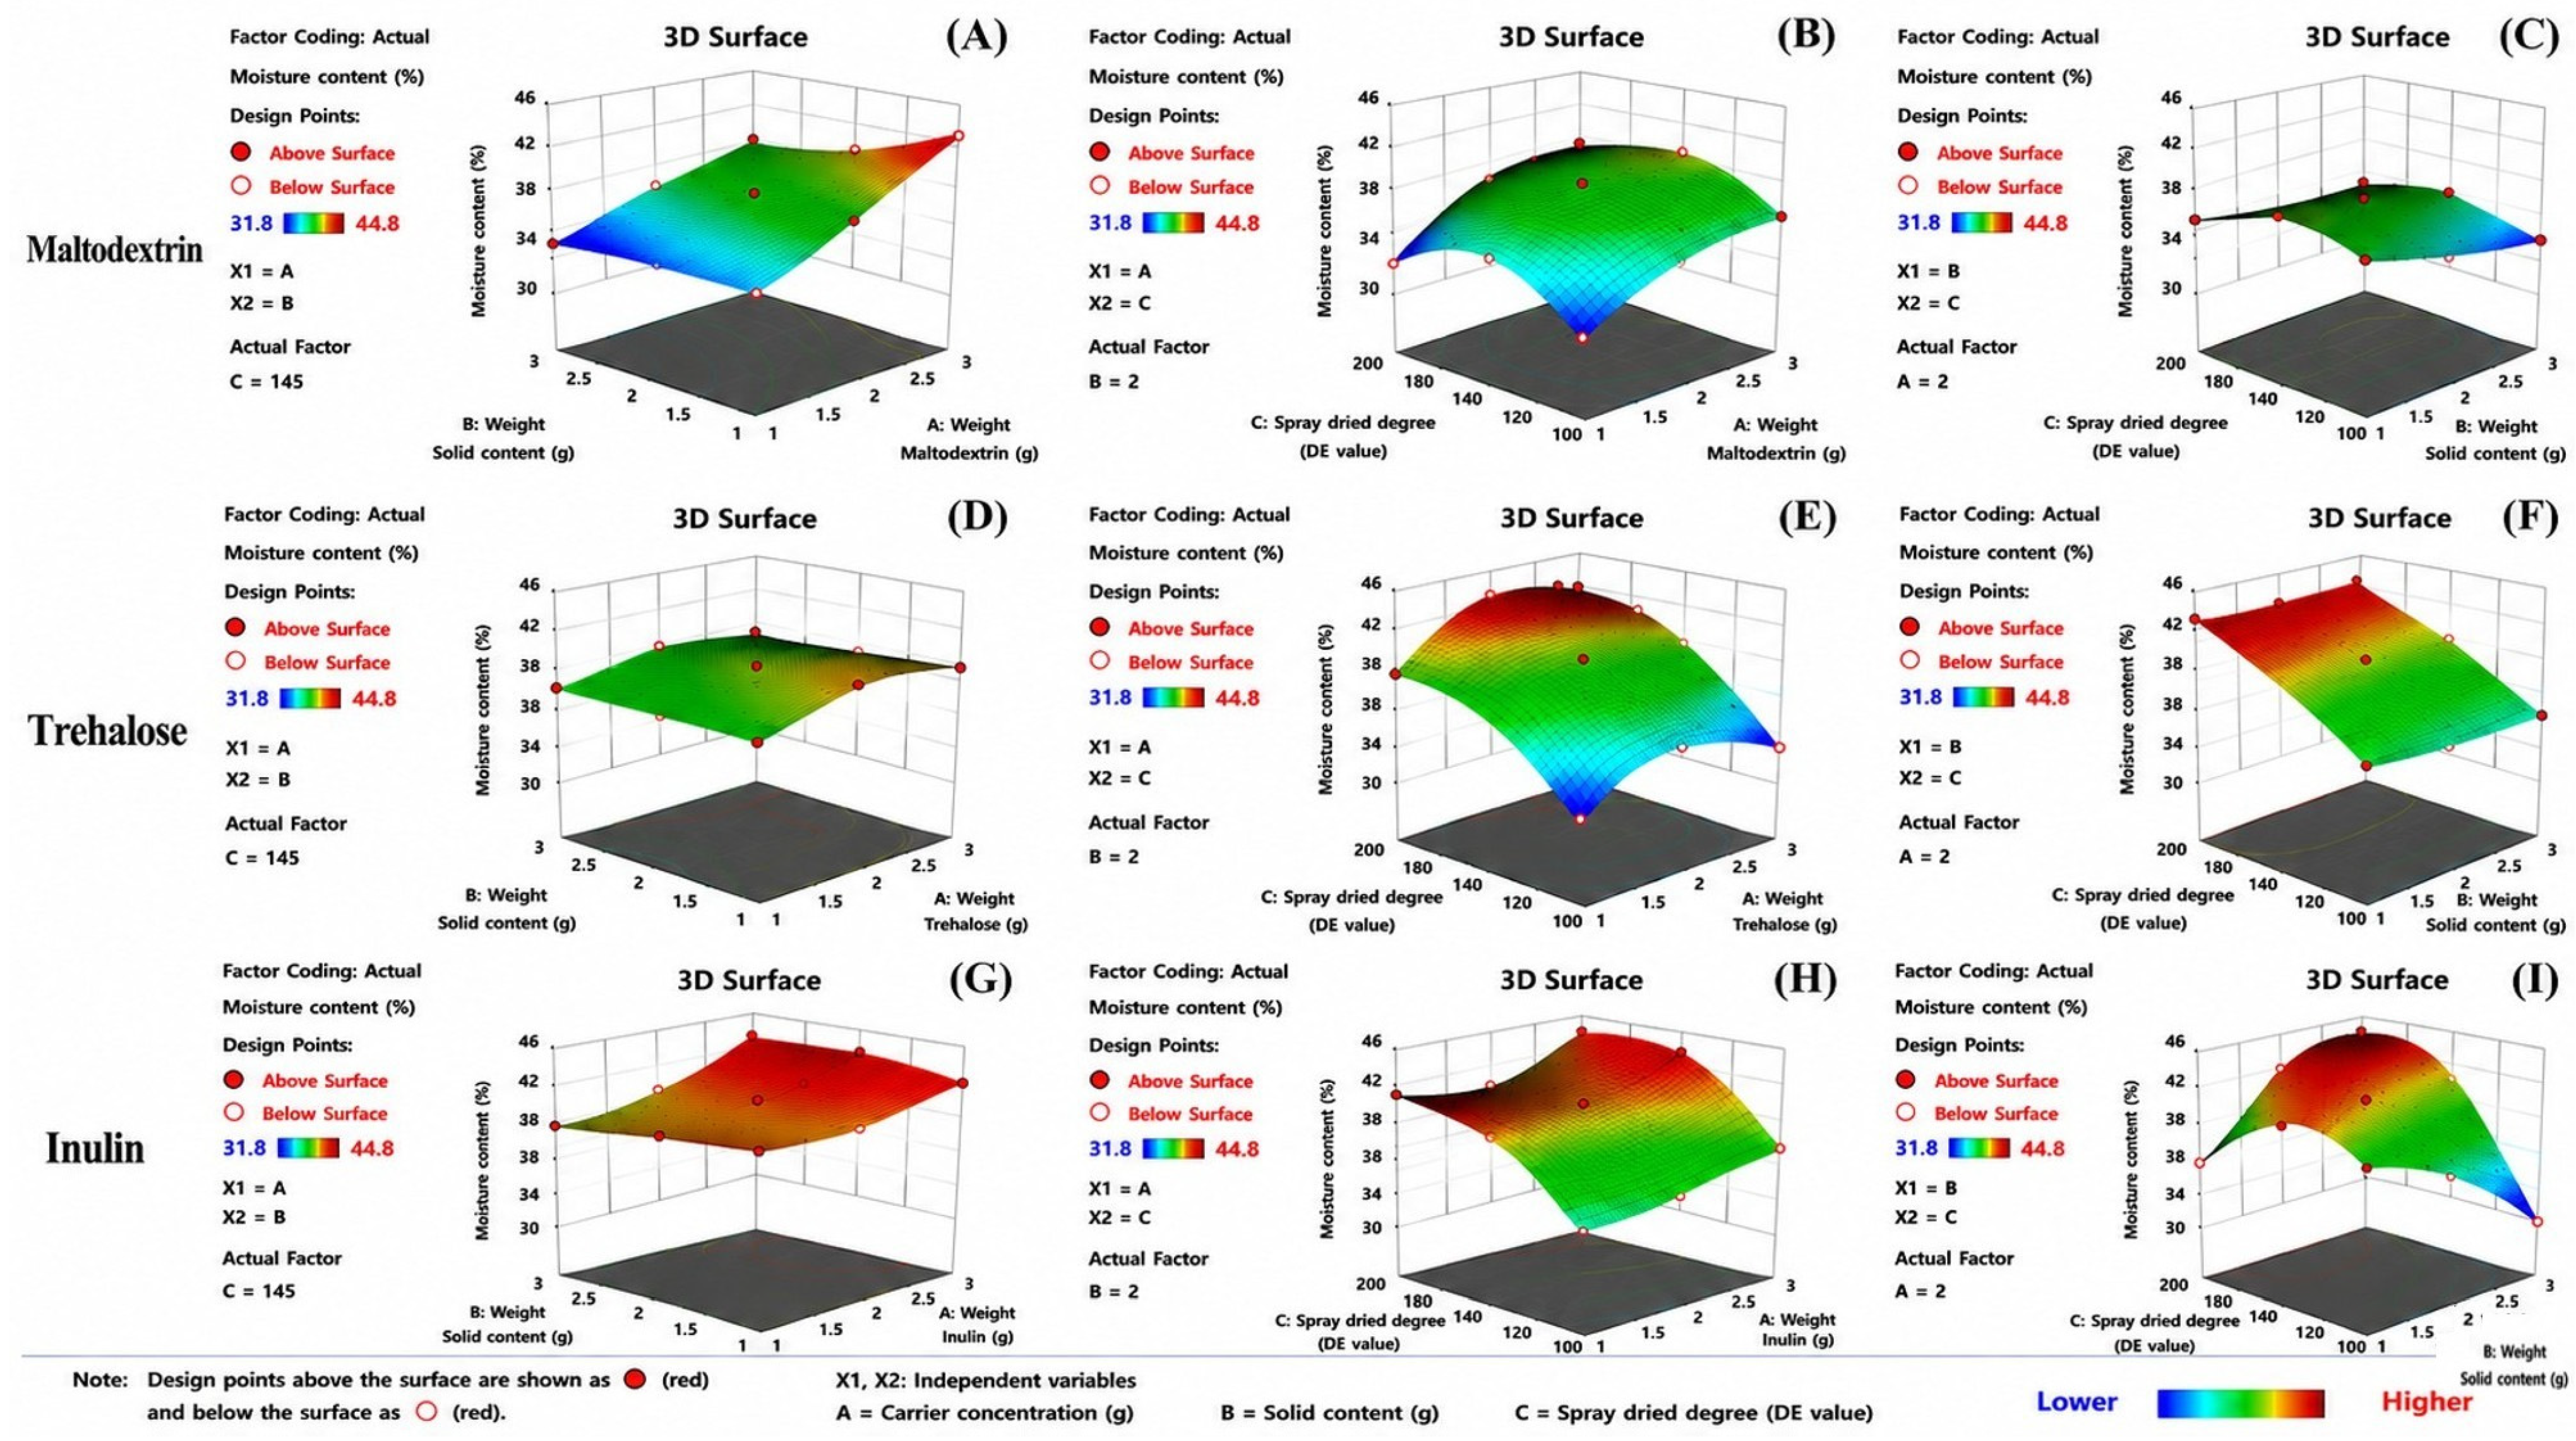
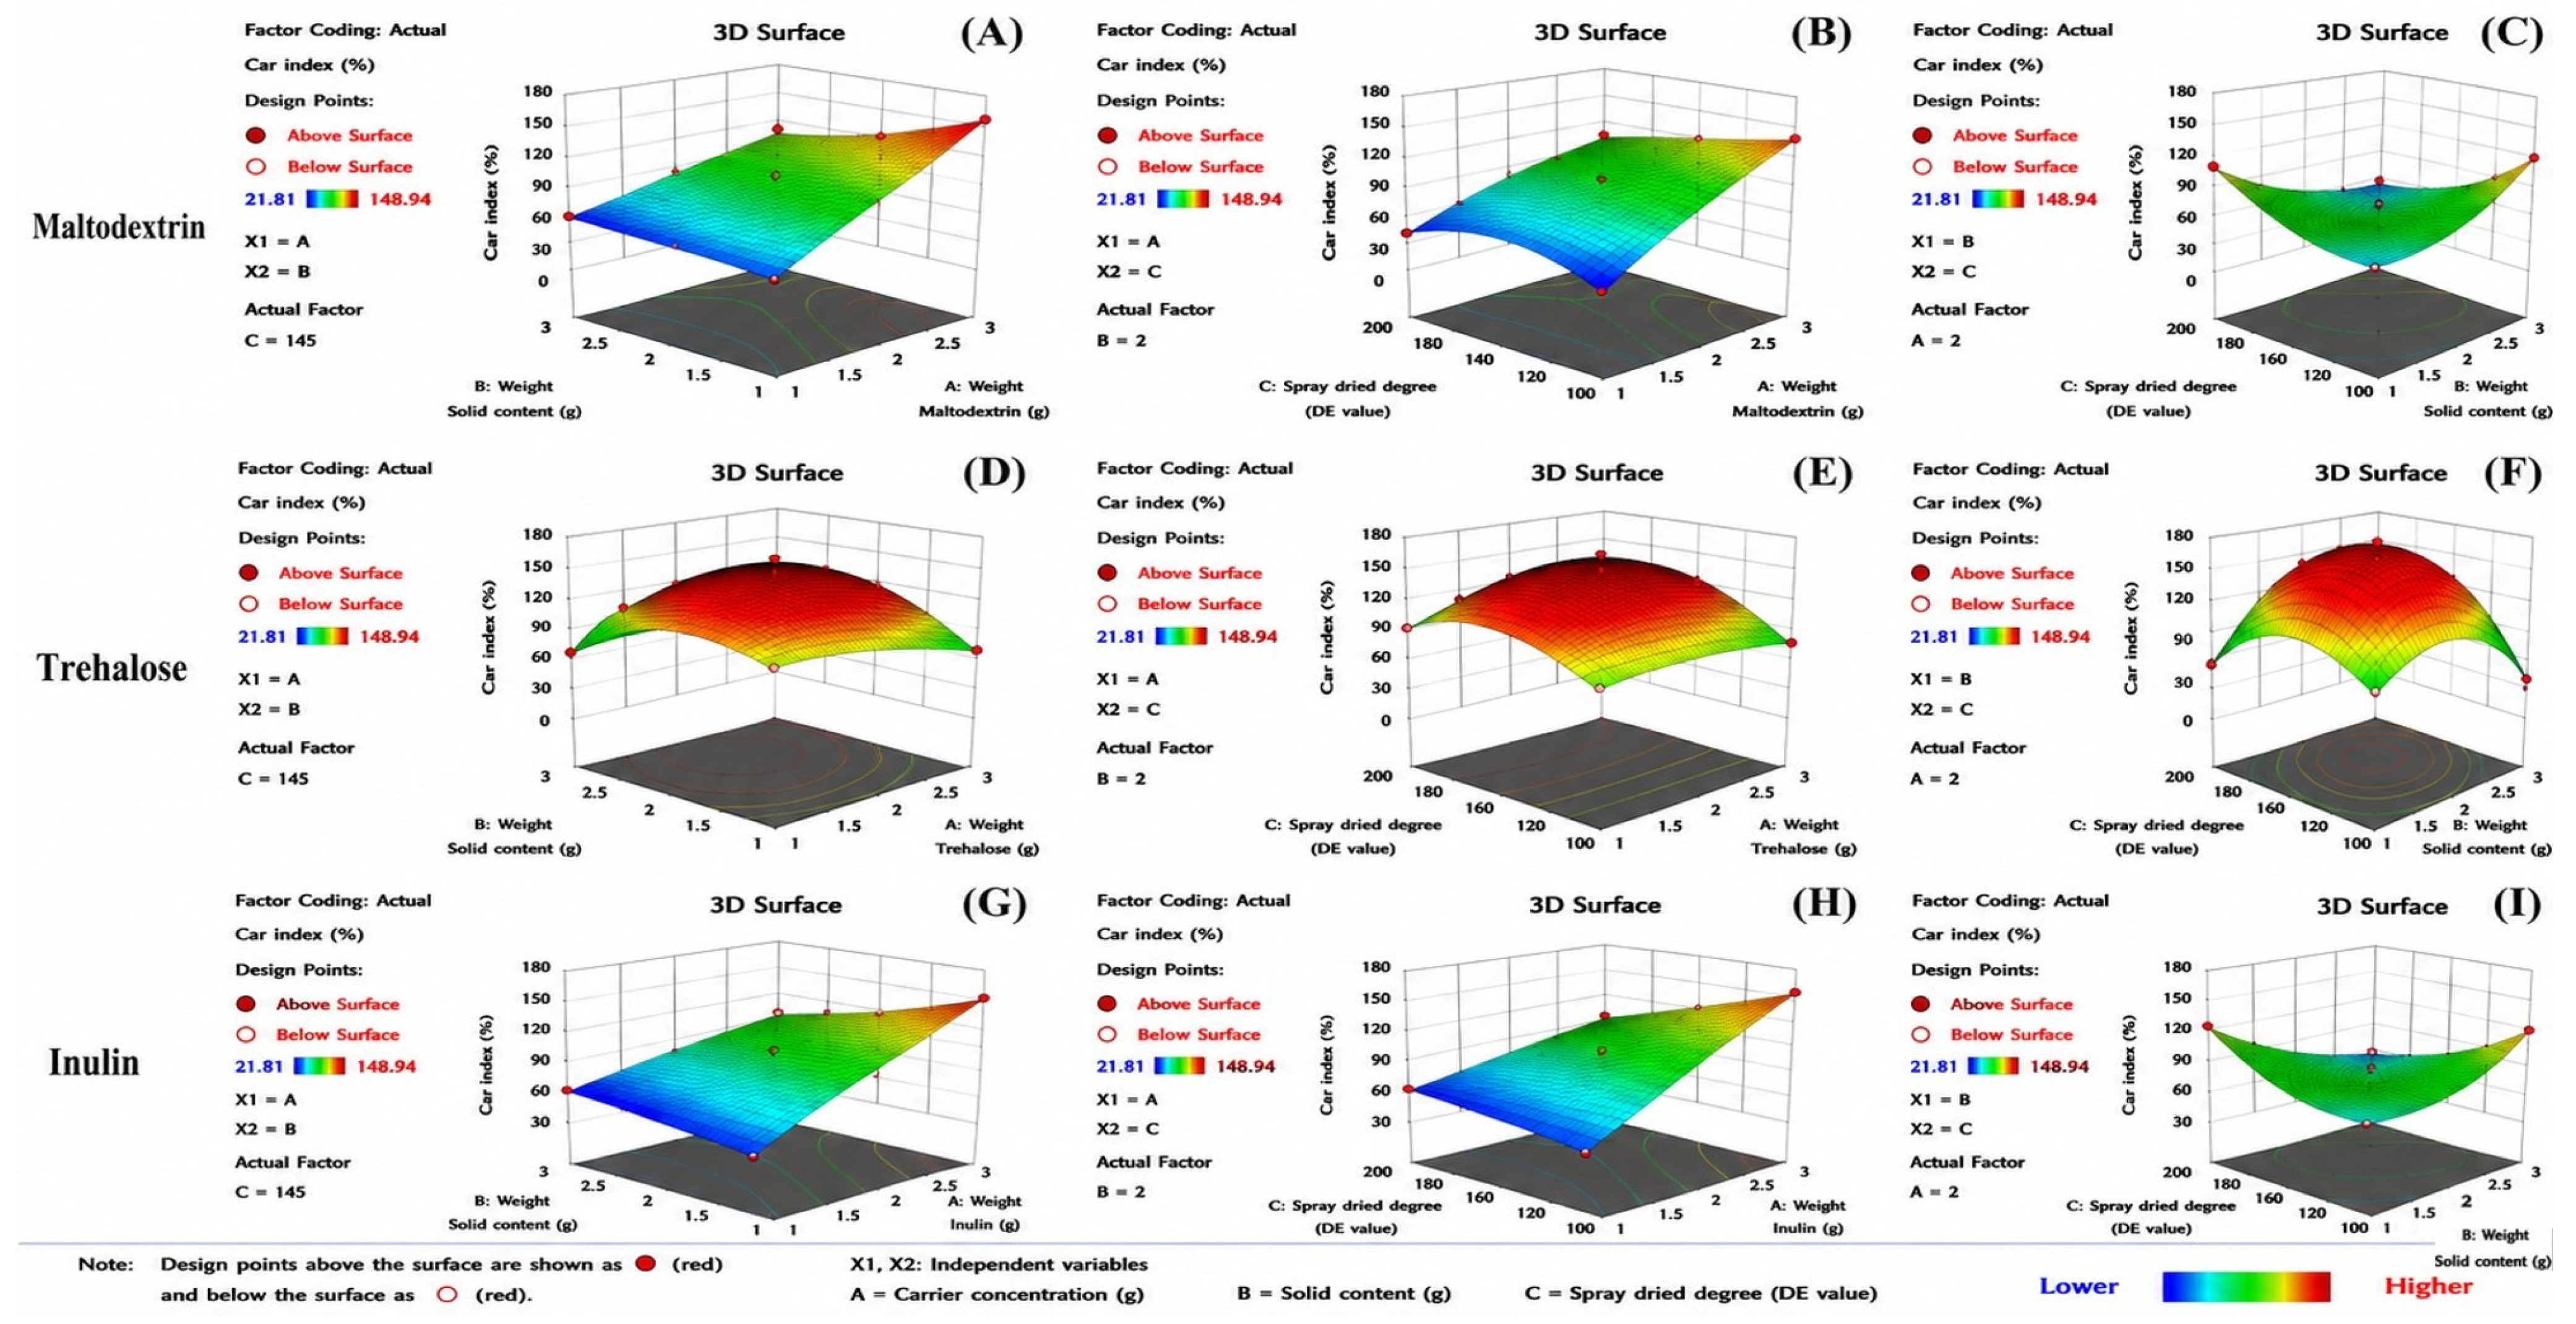
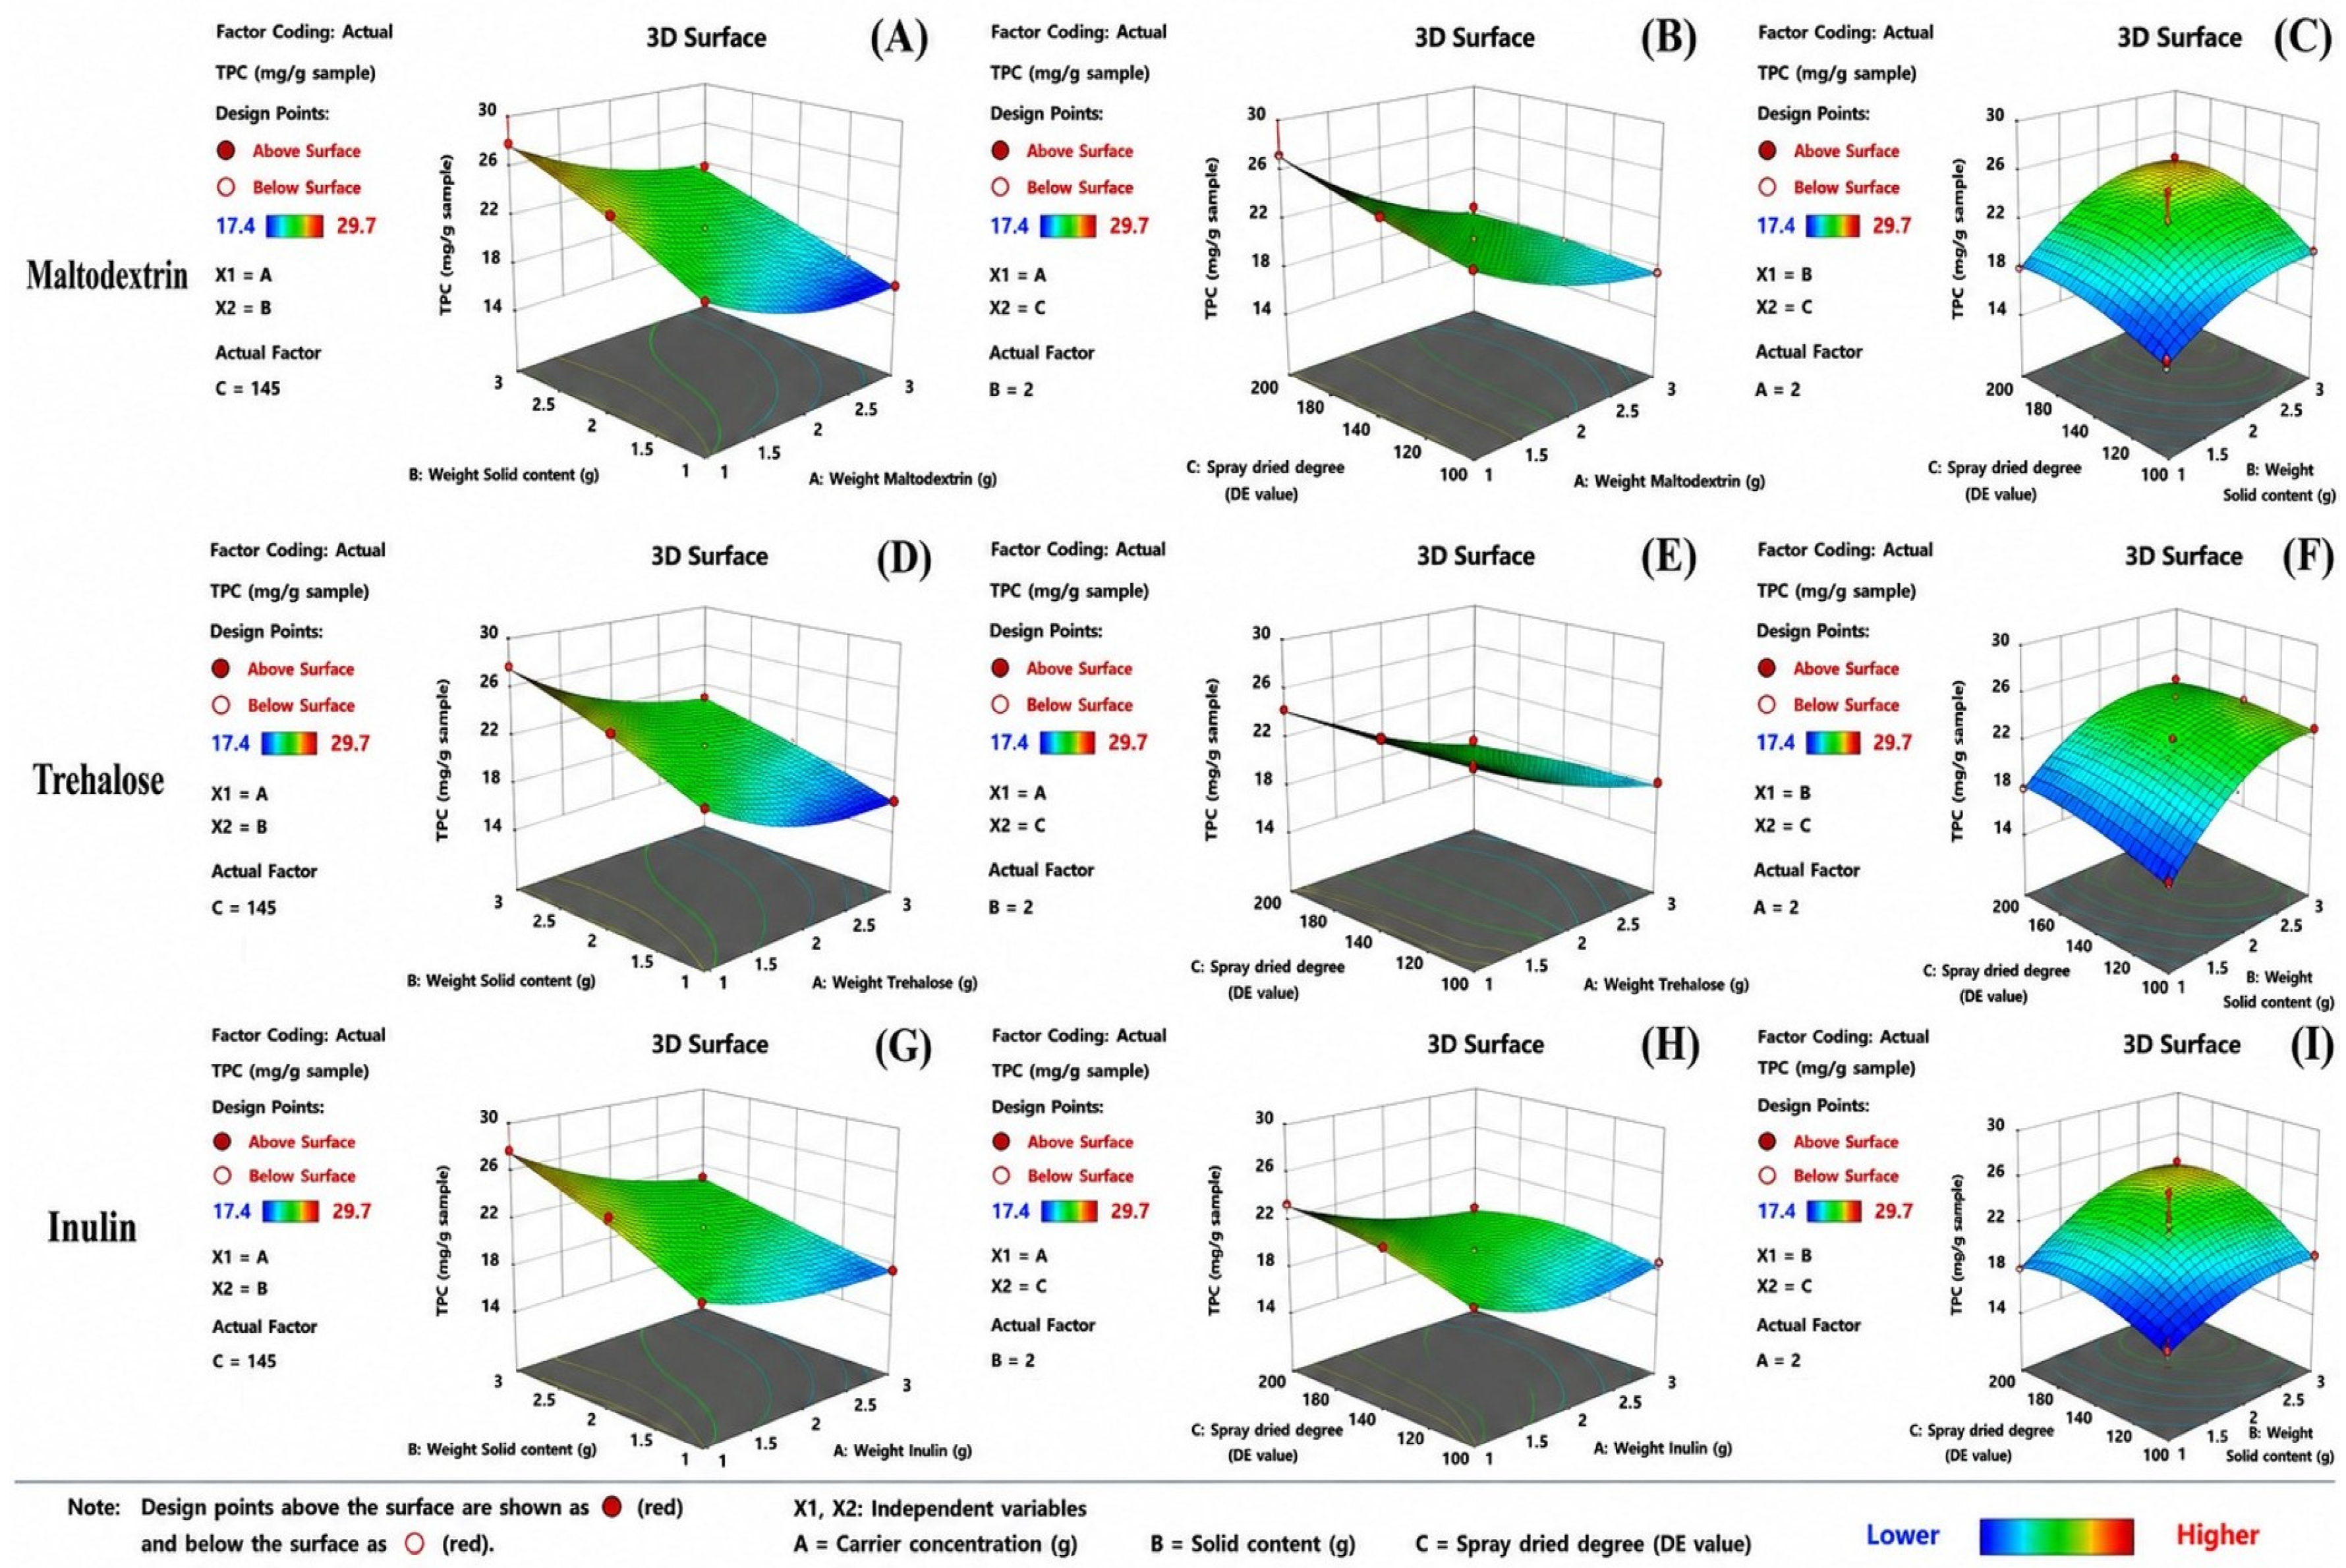
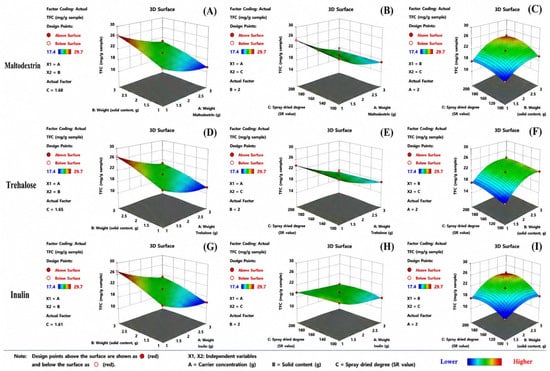
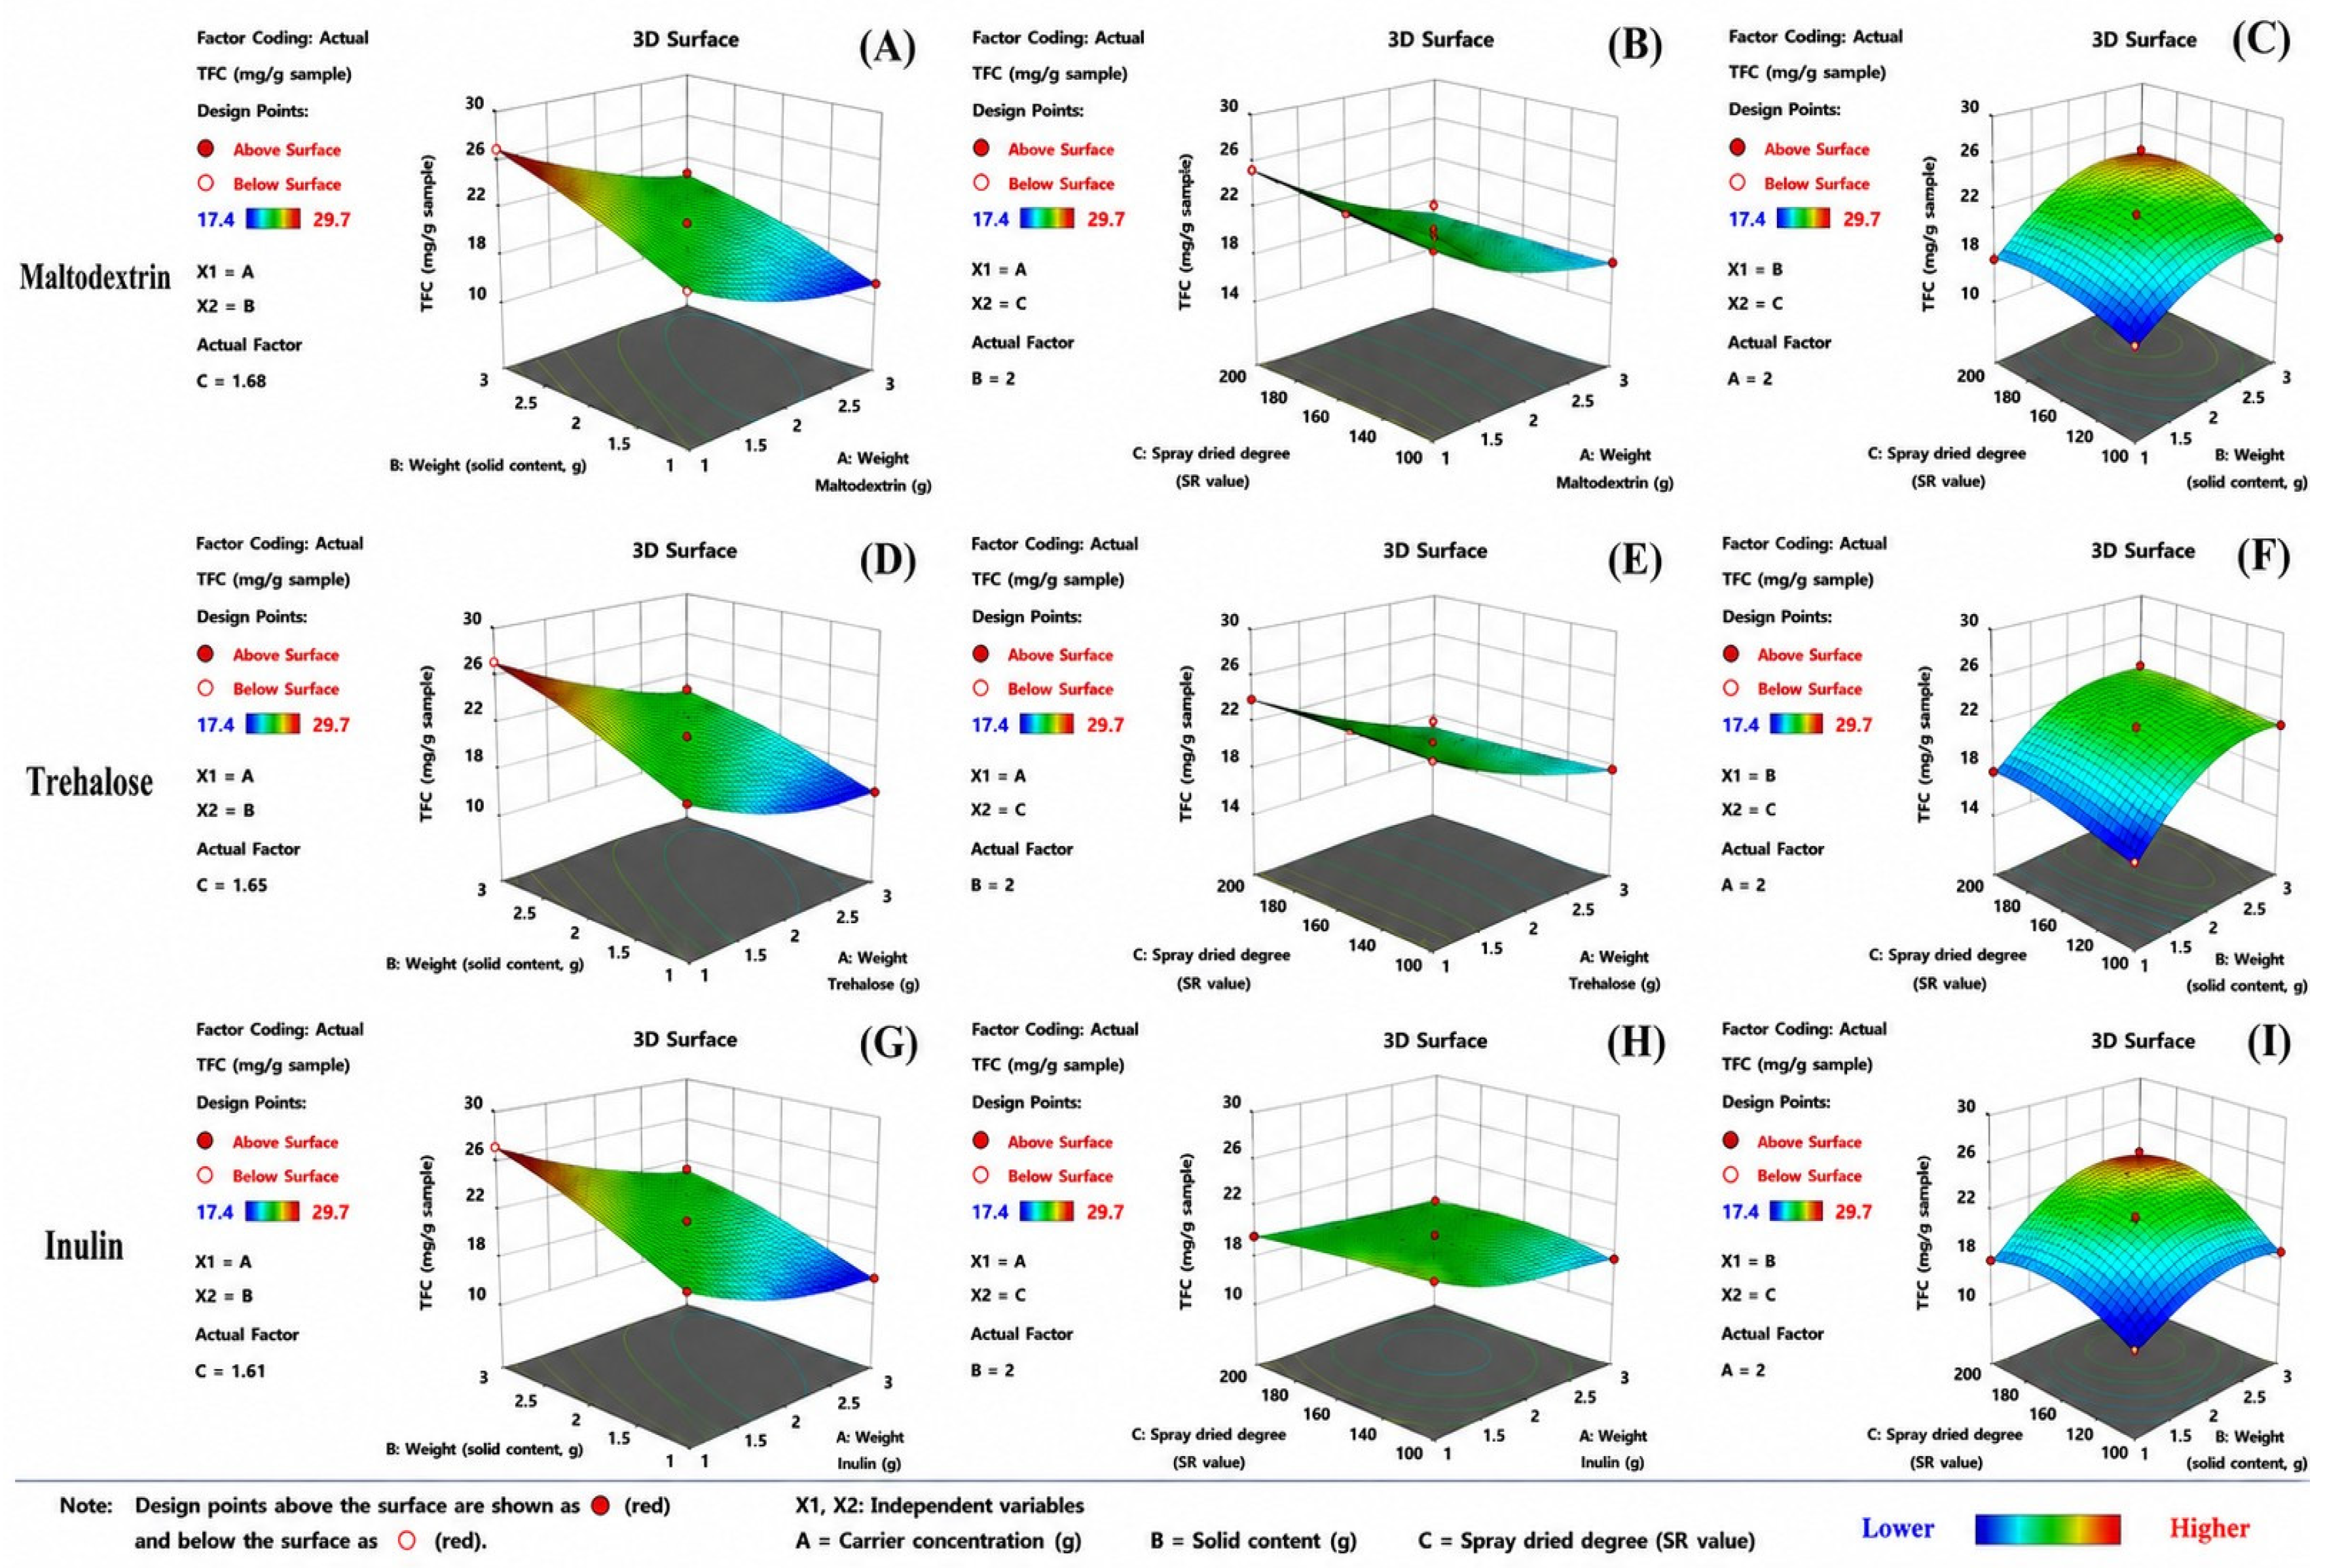
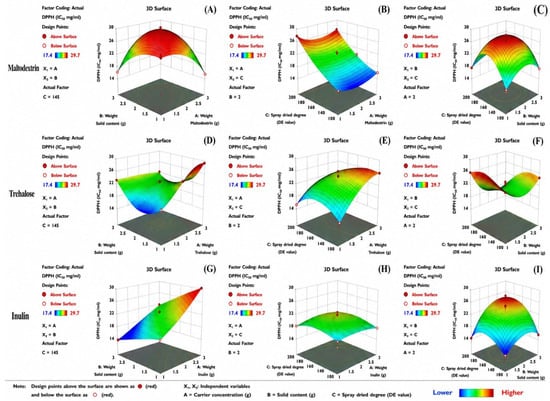
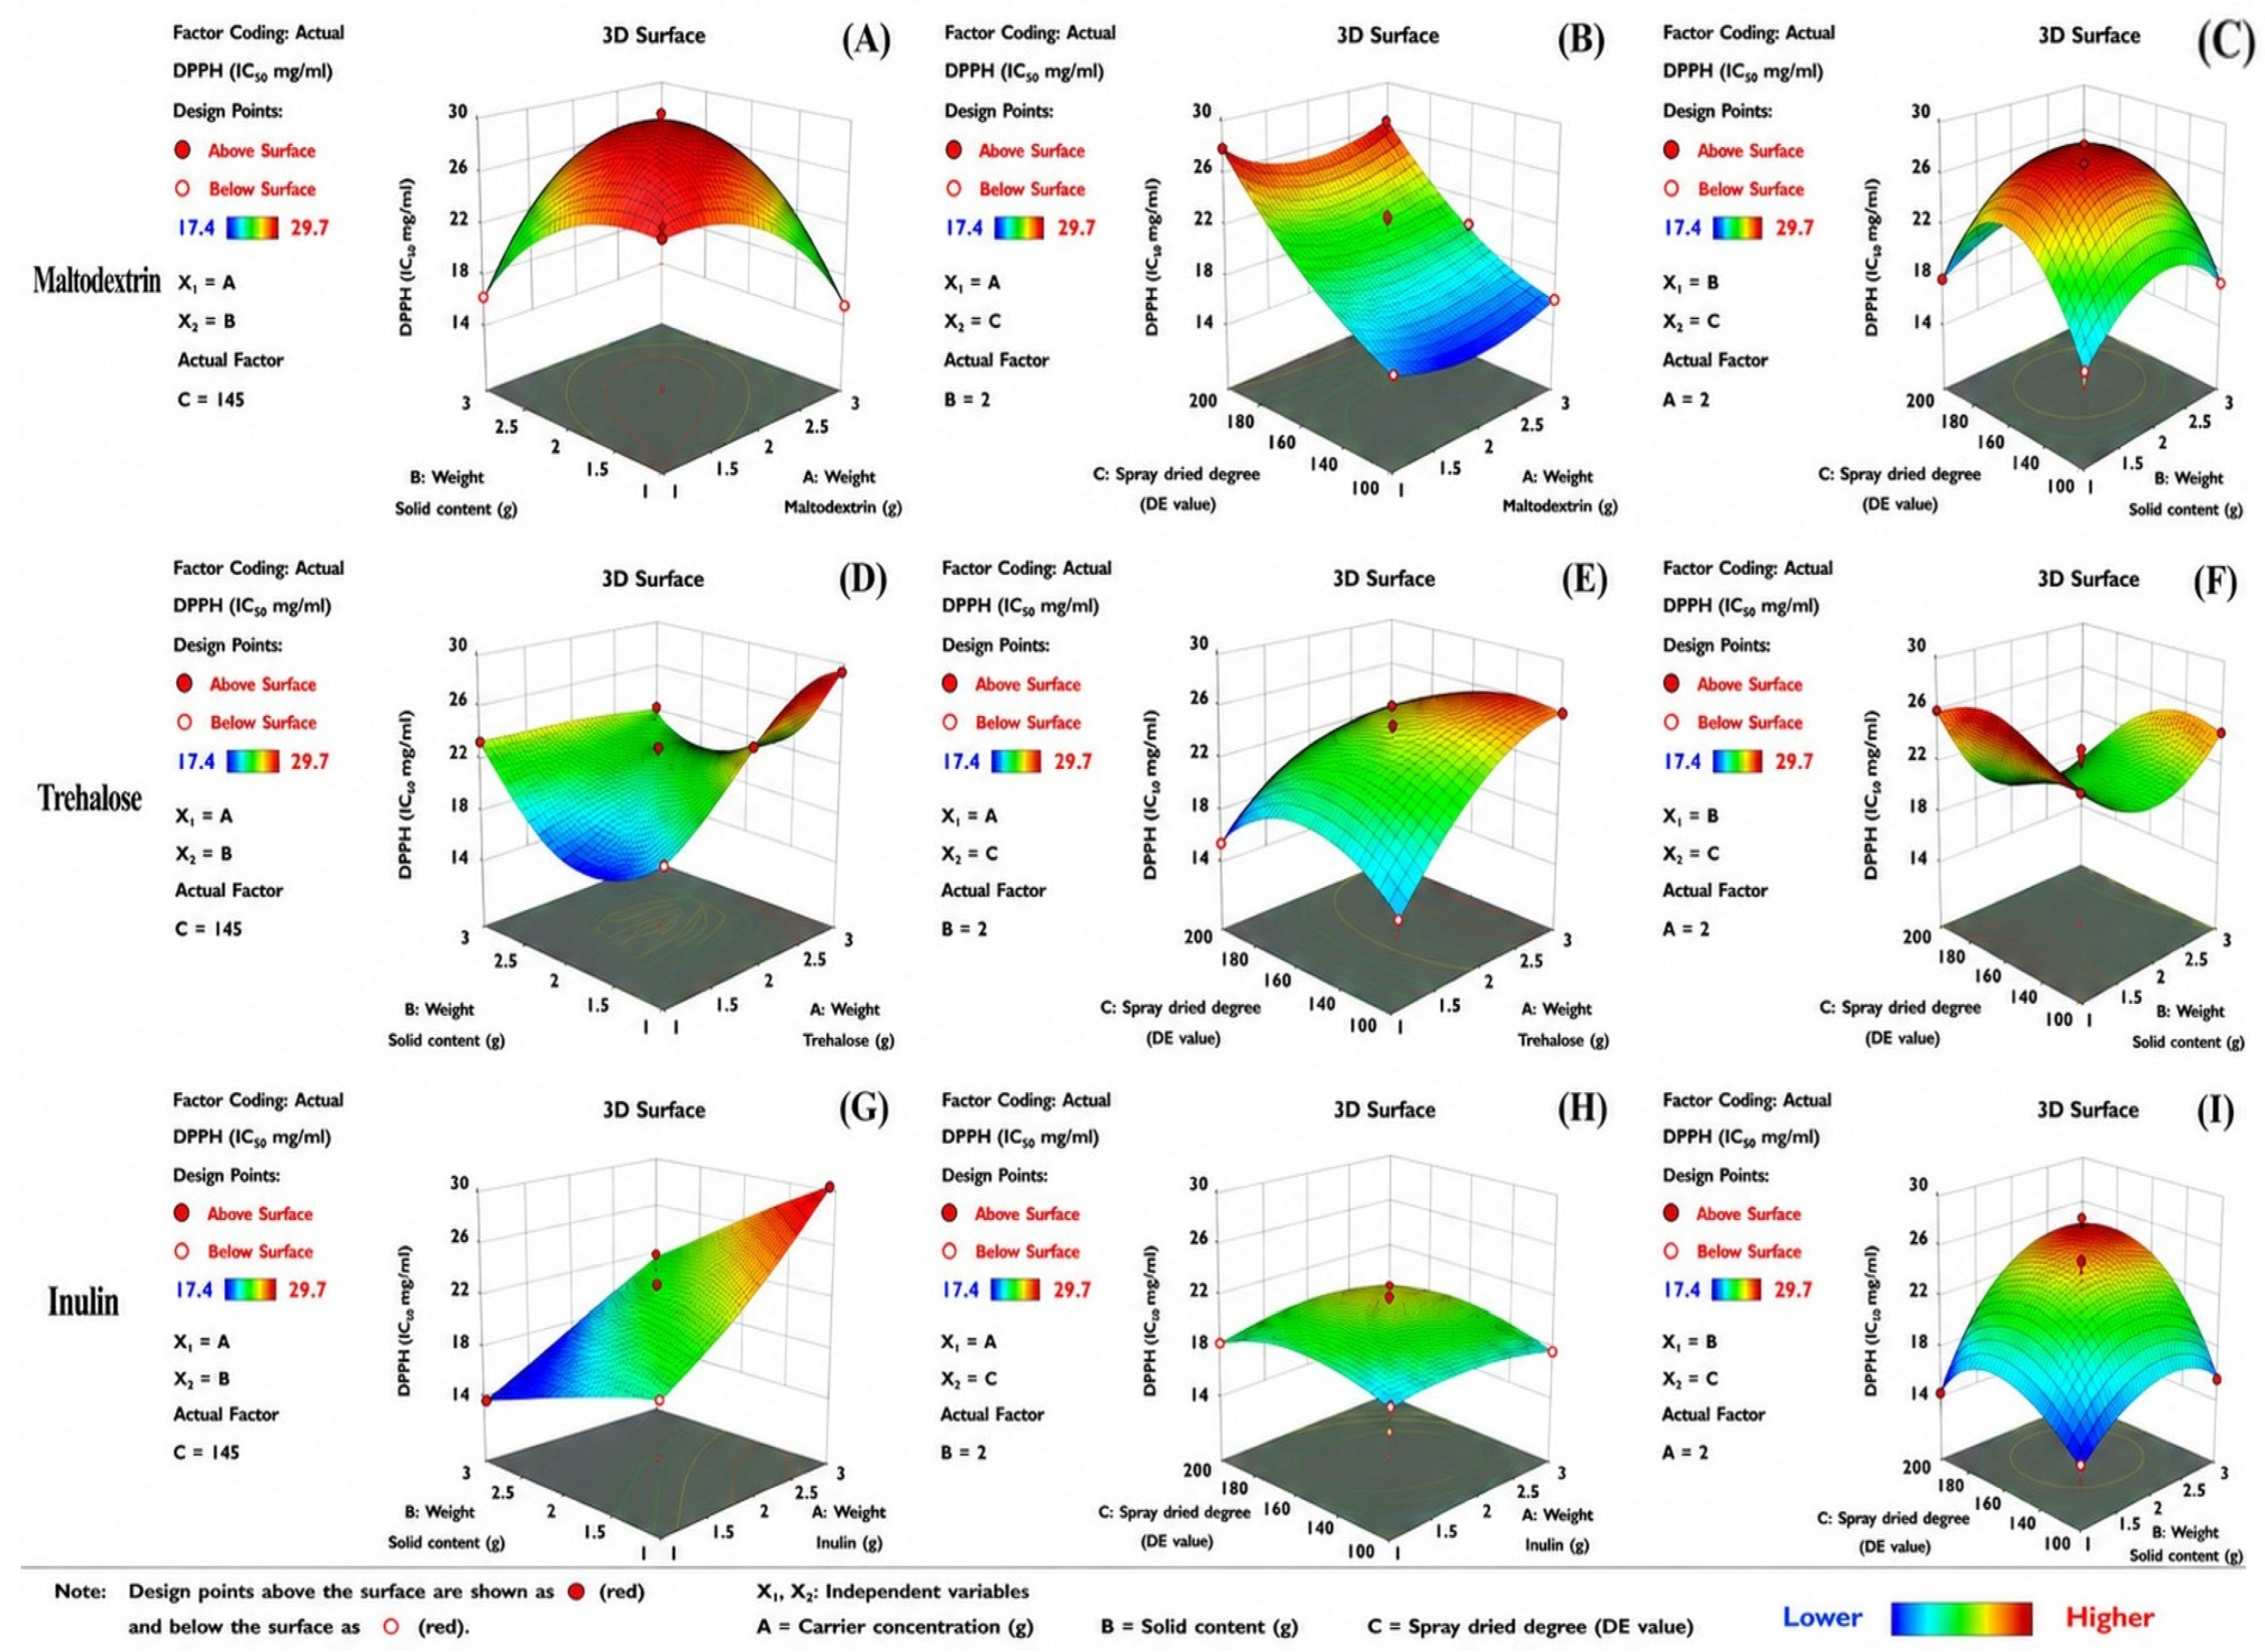
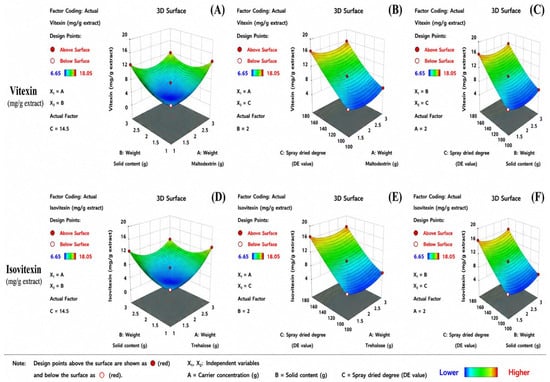
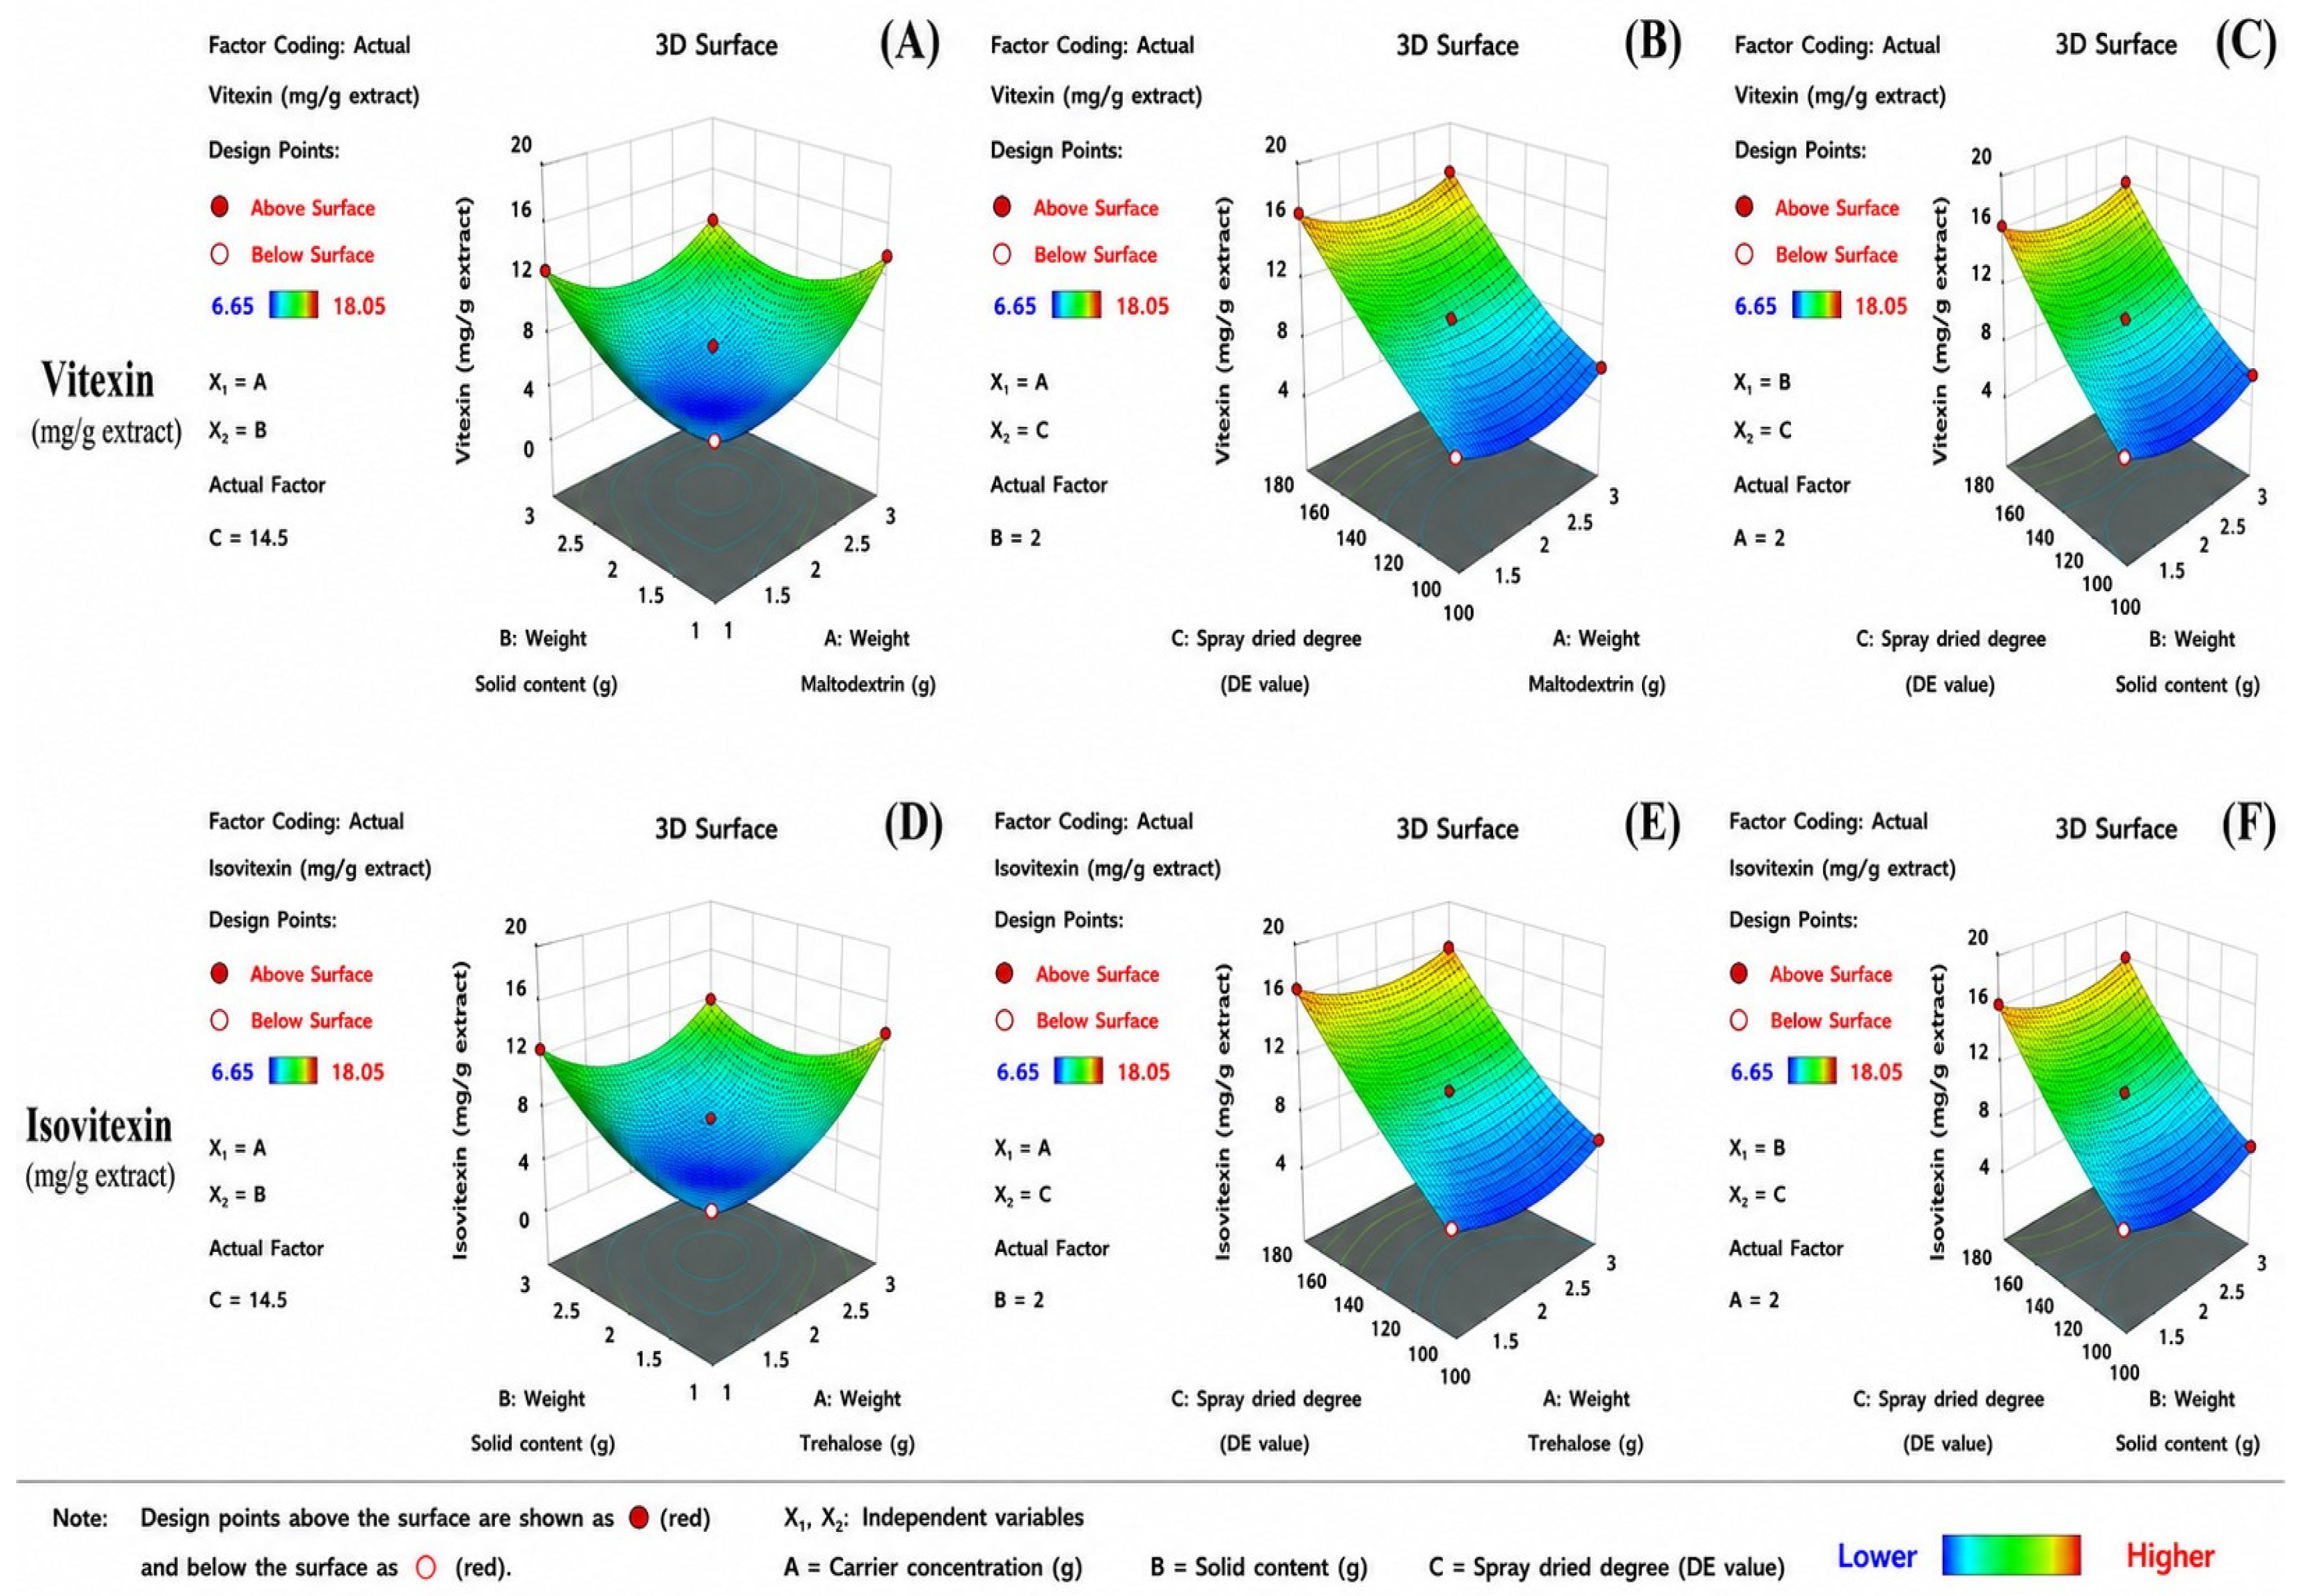
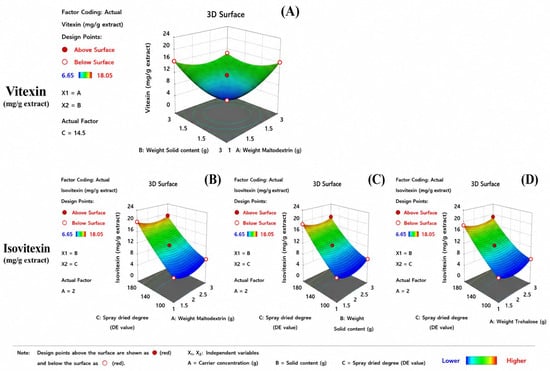
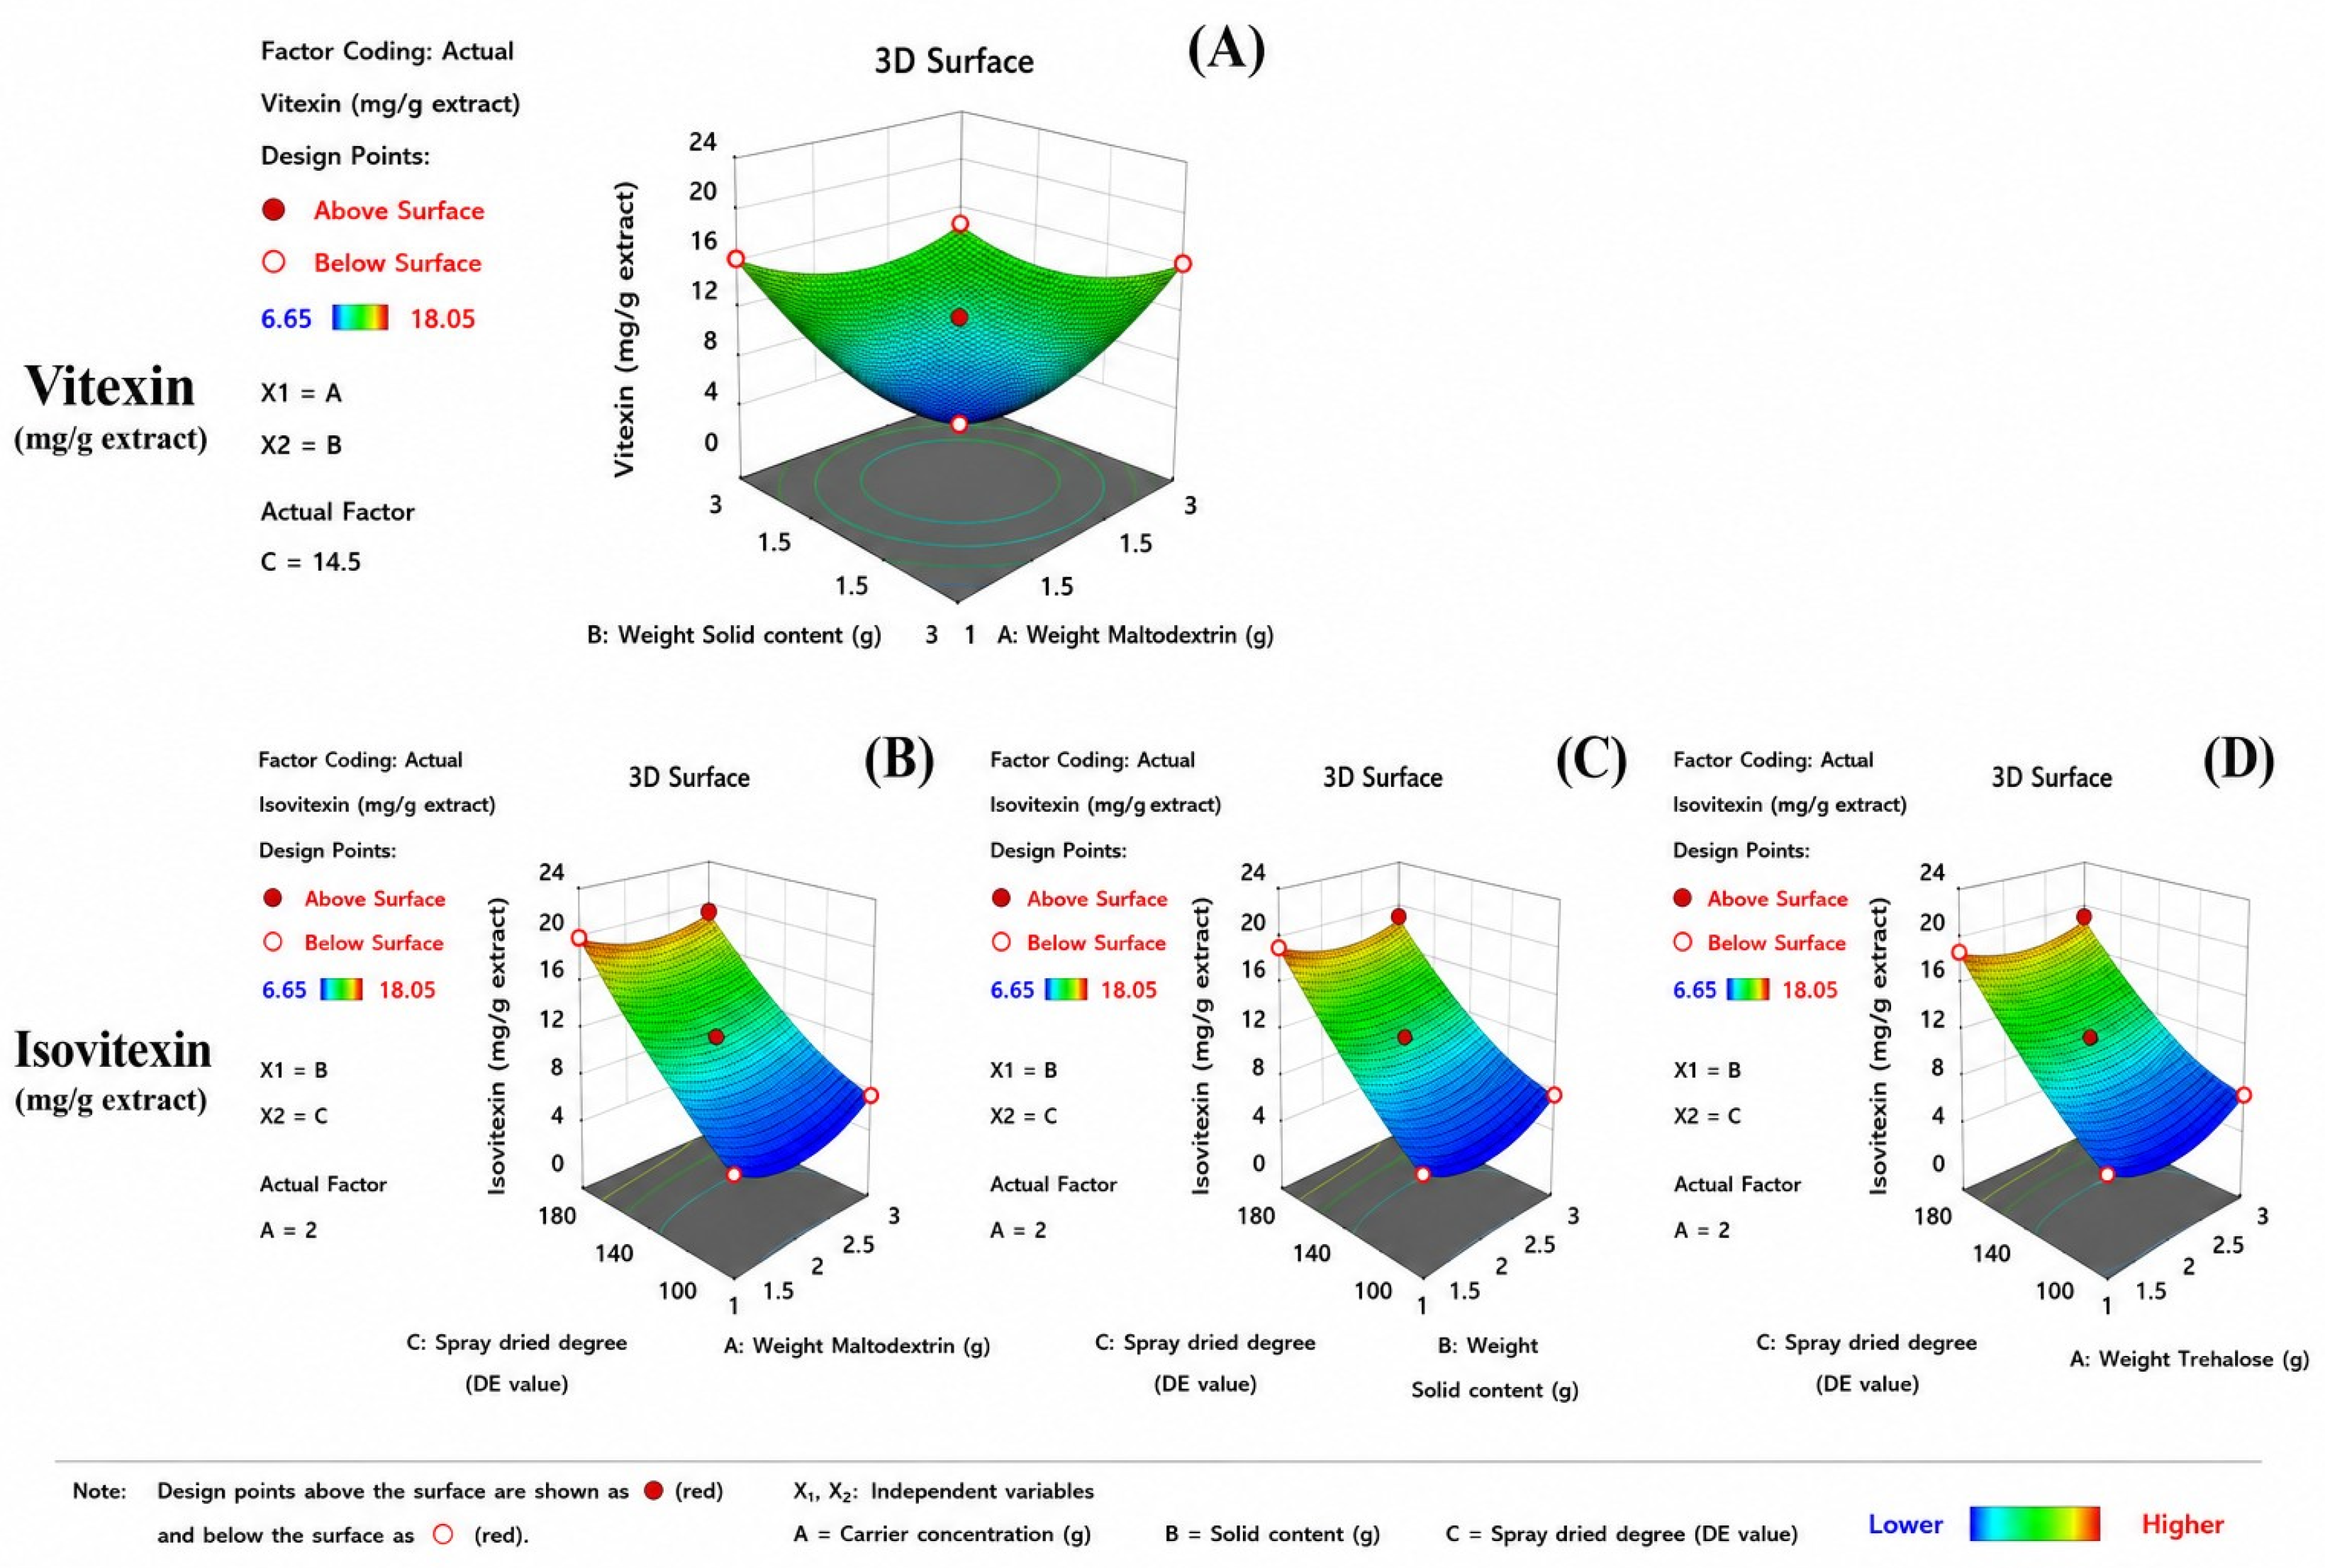
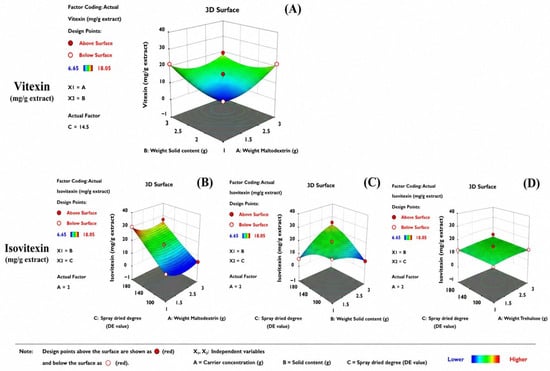
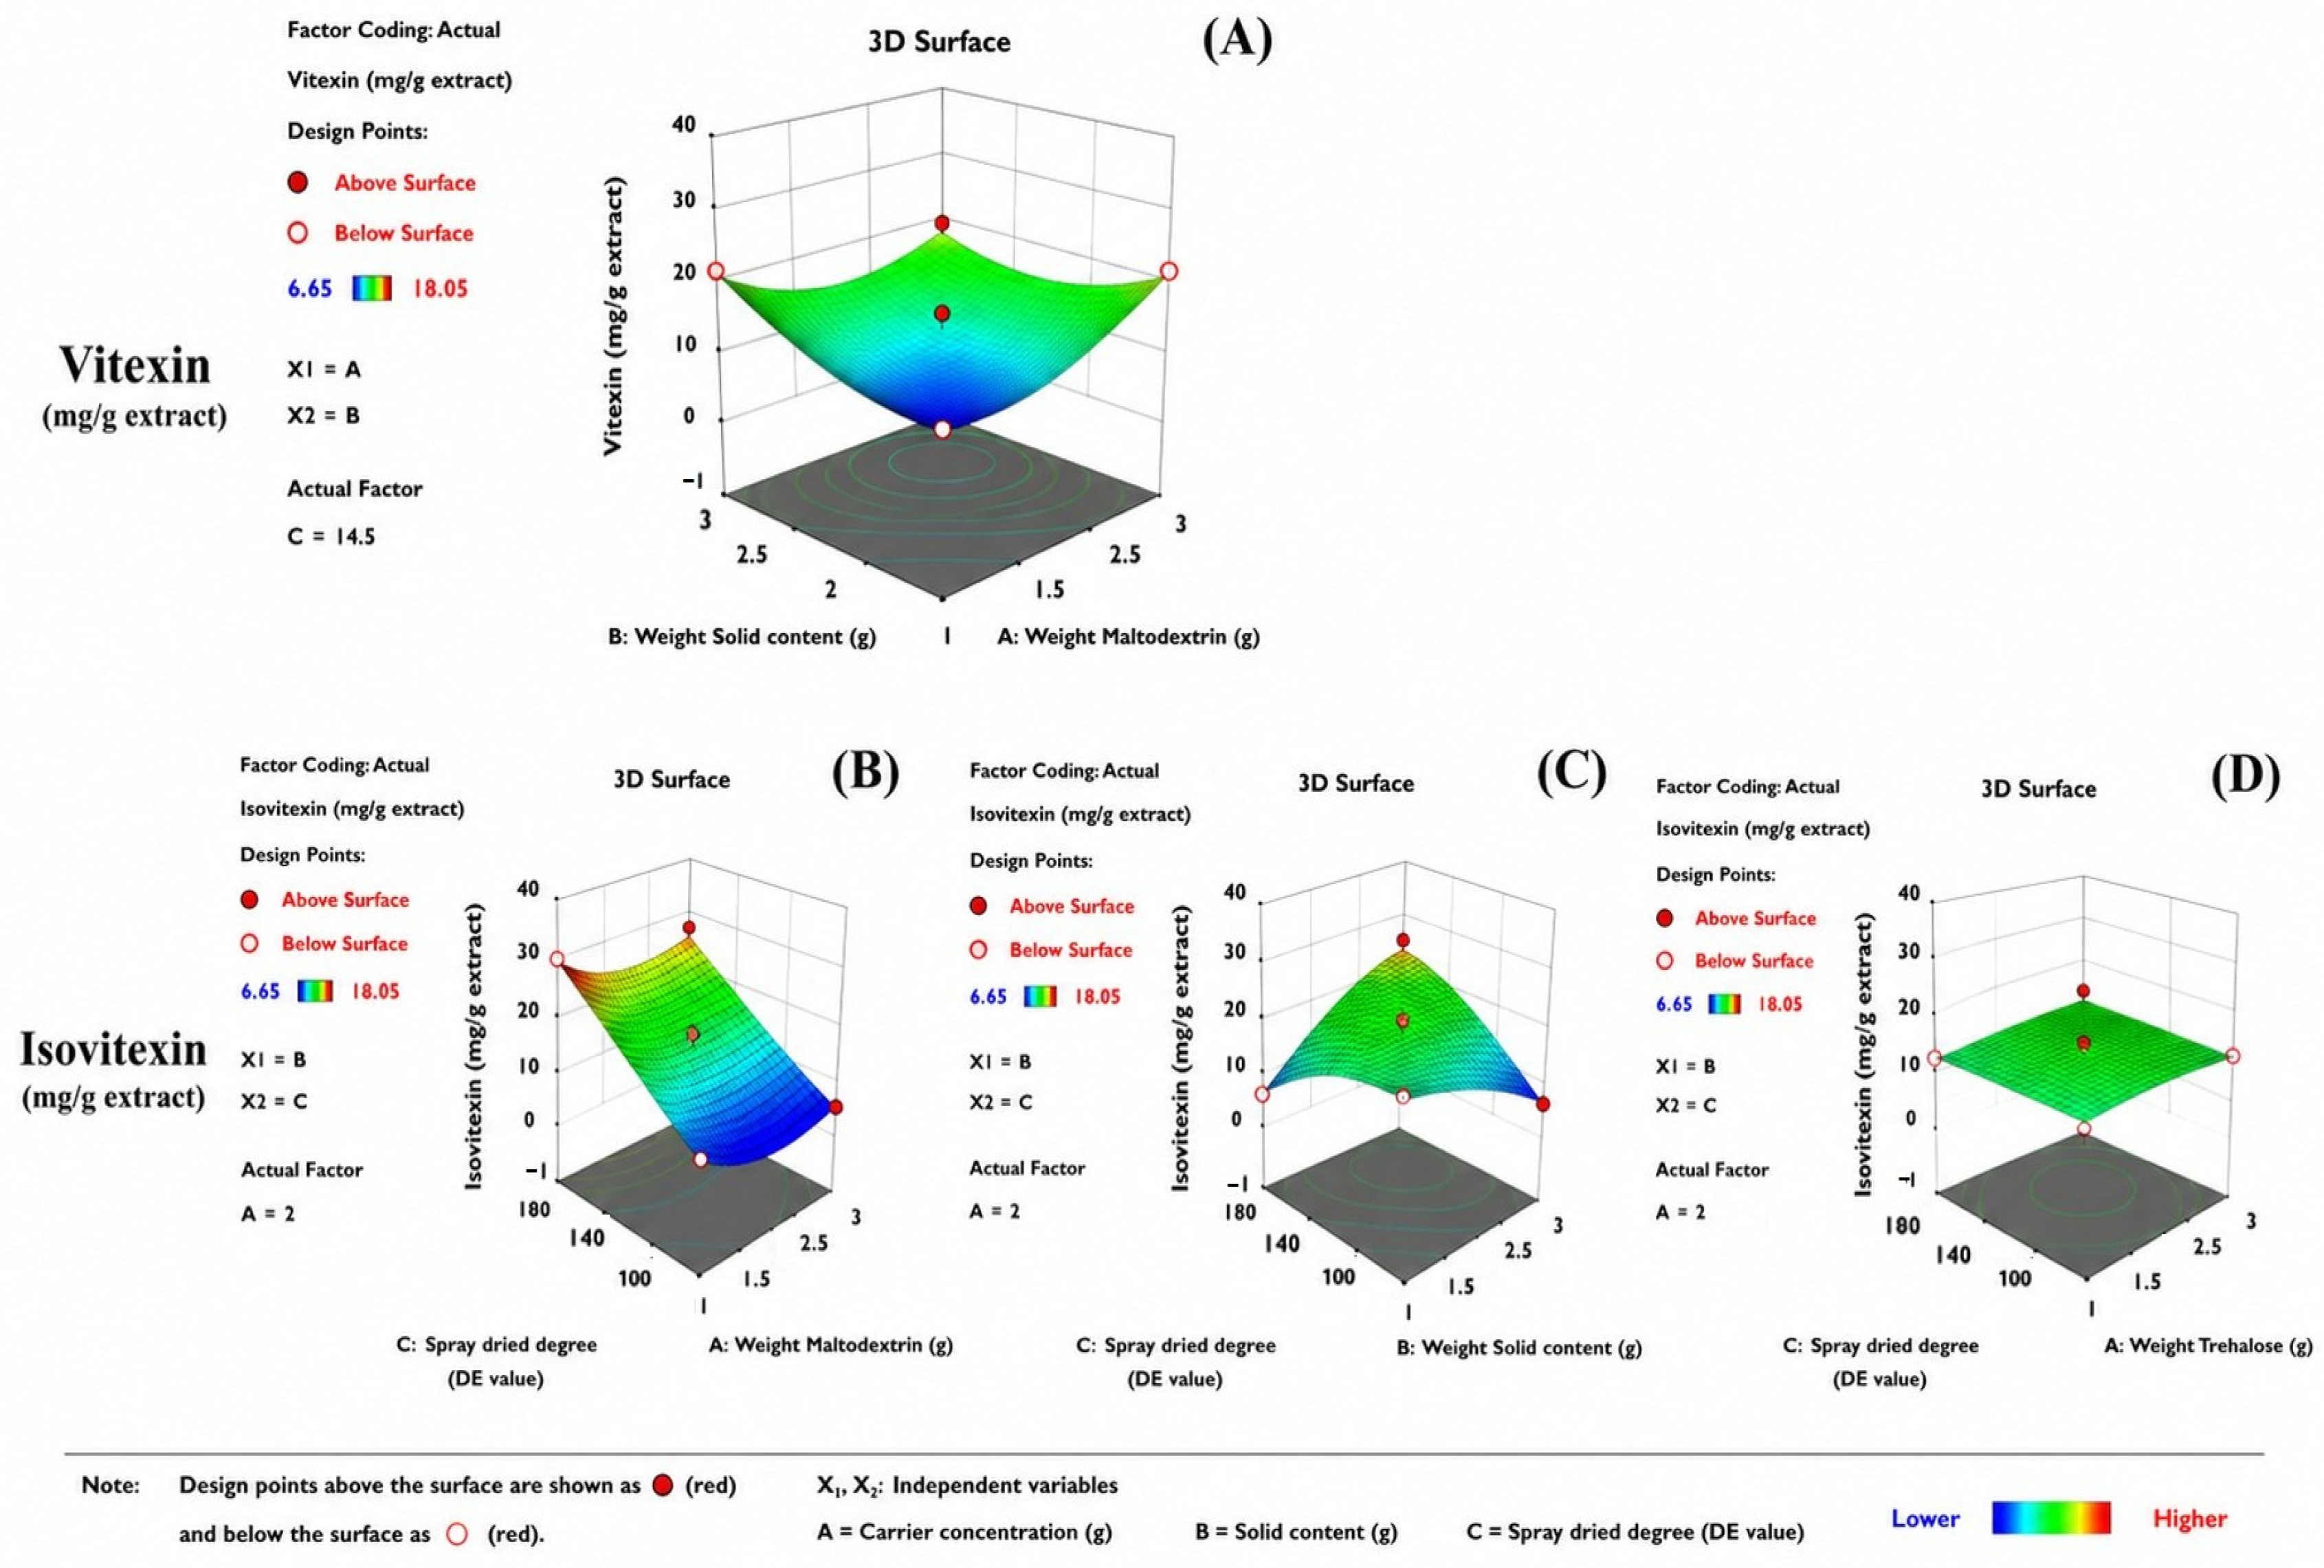

Disclaimer/Publisher’s Note: The statements, opinions and data contained in all publications are solely those of the individual author(s) and contributor(s) and not of MDPI and/or the editor(s). MDPI and/or the editor(s) disclaim responsibility for any injury to people or property resulting from any ideas, methods, instructions or products referred to in the content. |
© 2026 by the authors. Licensee MDPI, Basel, Switzerland. This article is an open access article distributed under the terms and conditions of the Creative Commons Attribution (CC BY) license.