


Abstract
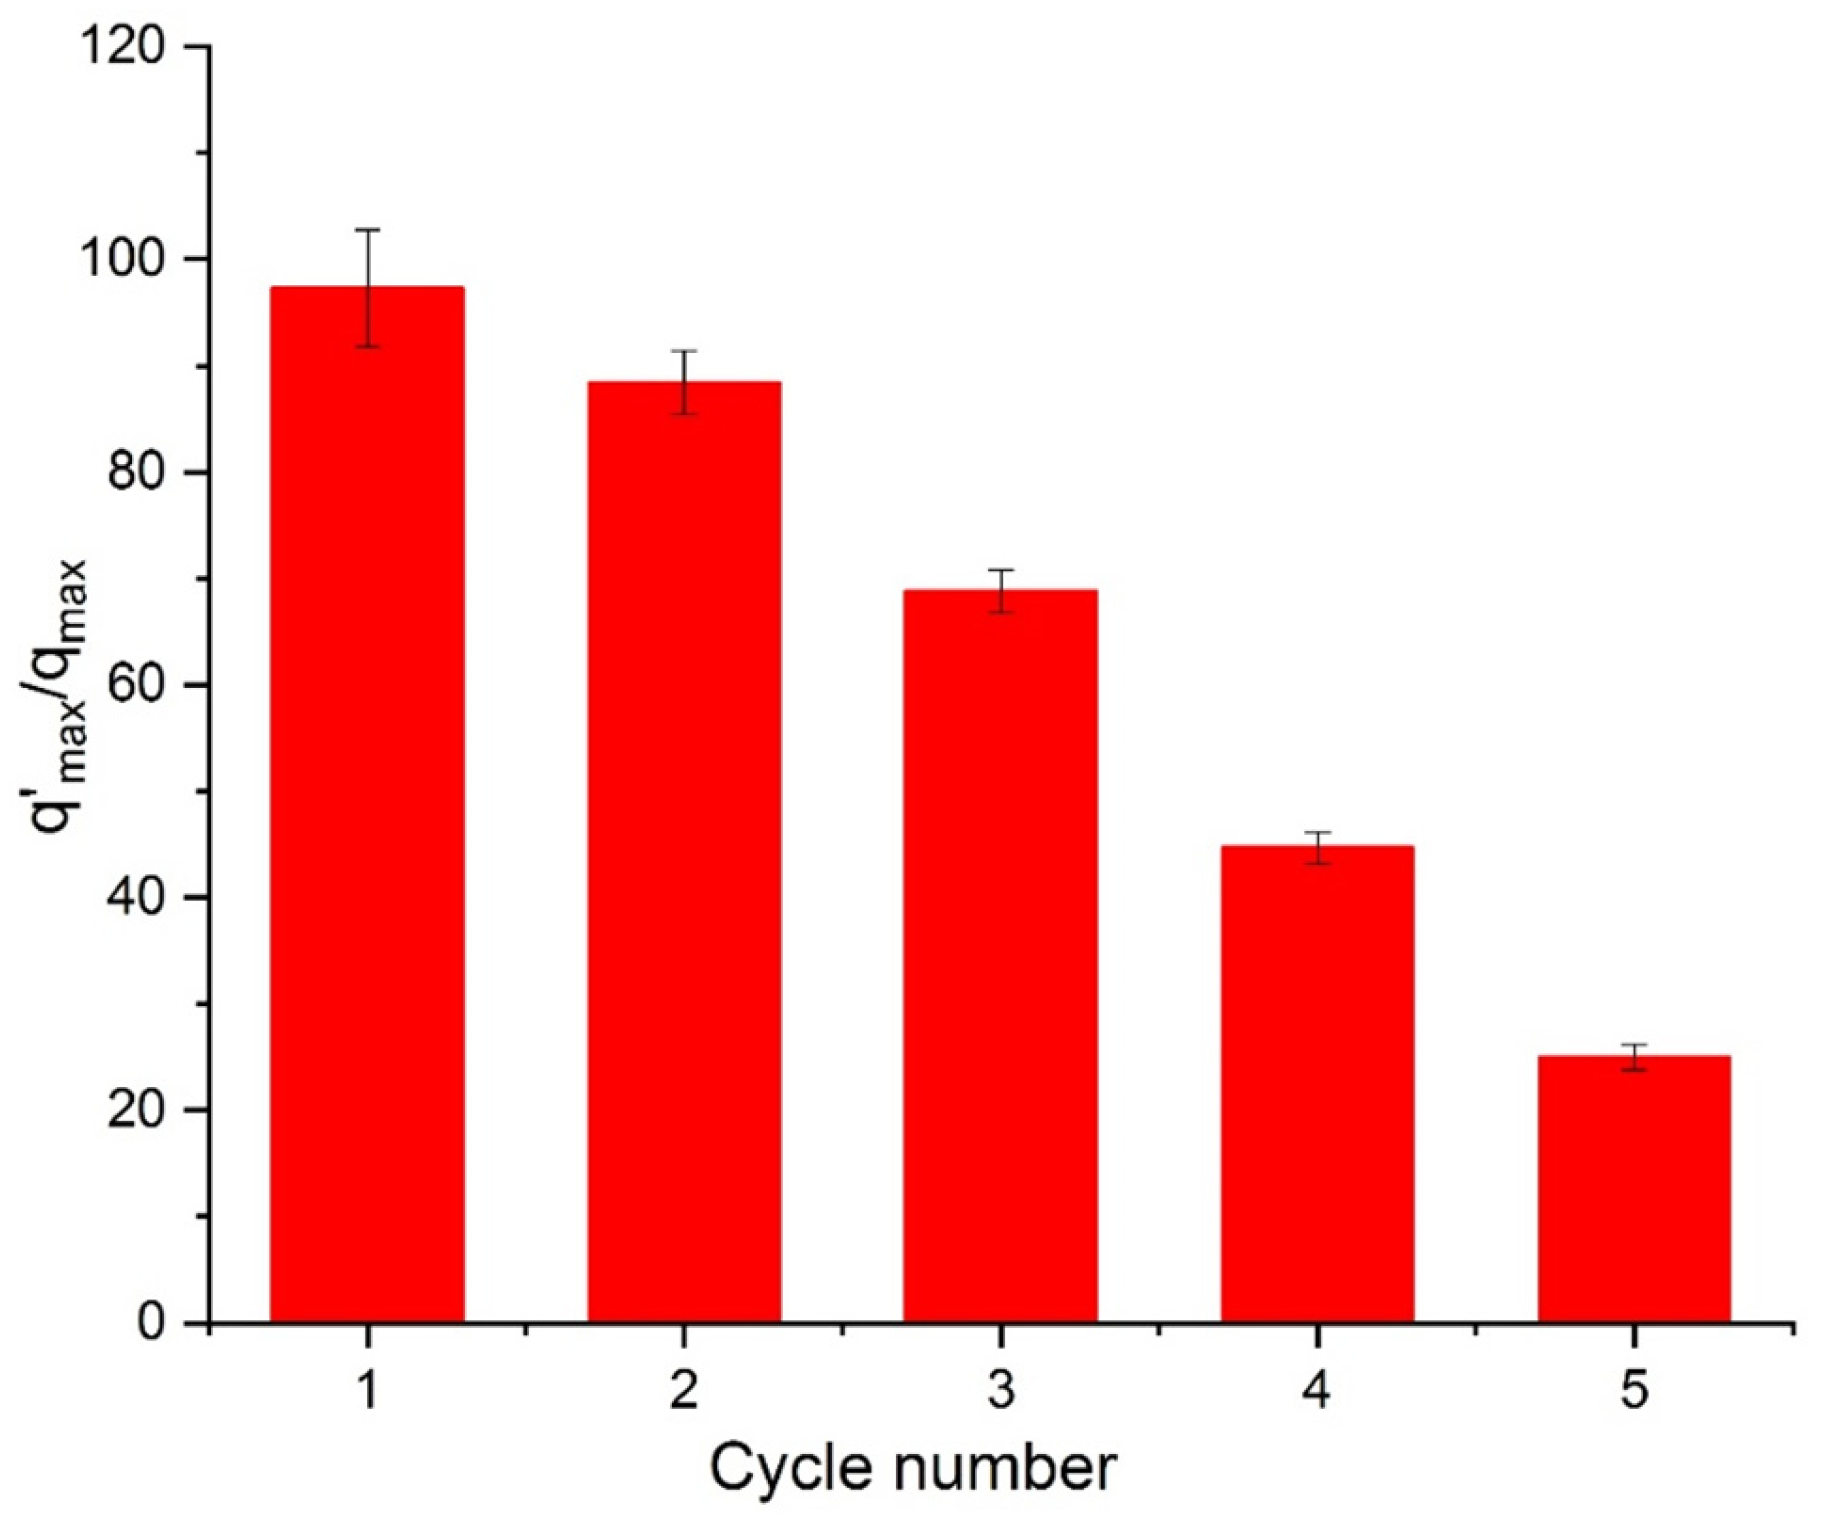
The adsorption and desorption behavior of the azo dye Orange II (OII) was investigated using composite beads prepared from shrimp shell–derived chitosan (50 wt%) and montmorillonite-rich clay. The structural and morphological properties of the synthesized beads were characterized using X-ray diffraction (XRD), scanning electron microscopy (SEM) and FT-IR (Fourier Transform Infrared Spectroscopy). Batch adsorption experiments were performed to evaluate the removal efficiency of OII from aqueous solutions under various conditions, revealing that a low adsorbent dosage (0.5 g L−1) and an acidic medium (pH 4) provided optimal adsorption performance. Adsorption kinetics and equilibrium isotherms were analyzed to elucidate the adsorption mechanism. Thermodynamic parameters indicated that the adsorption process was spontaneous (ΔG° < 0) and endothermic (ΔH° > 0). Equilibrium data were fitted to both Langmuir and Freundlich isotherm models, with the Freundlich model providing the best correlation (R2 = 0.99), suggesting multilayer adsorption on a heterogeneous surface. The adsorption capacity increased significantly with temperature, rising from 98.35 mg g−1 at 298 K to 182.57 mg g−1 at 318 K, further confirming the endothermic nature of the process. Kinetic analysis revealed relatively rapid adsorption, with maximum adsorption capacities increasing from approximately 100 mg g−1 at 25 °C to 123 mg g−1 at 45 °C. Regeneration and reusability tests demonstrated that the composite beads could be reused through adsorption–desorption cycles; however, a gradual decline in removal efficiency was observed, decreasing from 97% in the first cycle to 25% after the fifth cycle. This decrease is likely associated with partial structural degradation or the detachment of bead components during repeated regeneration. Overall, the results highlight the potential of chitosan–clay composite beads as promising and sustainable adsorbents for the removal of azo dyes from aqueous media.
1. Introduction
Orange II is a representative azo dye, a class of synthetic dyes distinguished by their high water solubility and structural features, including the azo bond (–N=N–), conjugated aromatic rings, and sulfonate groups (–SO3−). These functional groups play a crucial role in enhancing the dye’s aqueous solubility, chemical stability, and persistence in water environments [1,2]. Azo dyes constitute the dominant class of synthetic dyes, representing about 70% (by weight) of global dye production [3,4]. Their widespread application is especially pronounced in the textile and leather industries, where azo dyes account for nearly 80% of the total dyes used, due to their structural versatility and favorable dyeing performance [3,4]. Despite their extensive use, approximately 10–15% of azo dyes remain unfixed to textile fibers during dyeing operations and are subsequently discharged into industrial effluents, constituting a major source of environmental contamination [5]. Azo dyes exhibit strong resistance to biodegradation and photodegradation due to their stable azo bonds and conjugated aromatic structures, resulting in prolonged persistence in natural water systems [6]. Consequently, the elimination of azo dyes using conventional wastewater treatment processes remains highly inefficient. Their persistence in industrial effluents represents a significant environmental risk, adversely affecting water quality and exerting toxic impacts on human health and aquatic ecosystems [7]. These concerns have stimulated growing research interest in the removal or immobilization of azo dyes from contaminated waters. Among the different treatment strategies developed, adsorption is recognized as one of the most effective, straightforward, and widely studied methods for dye removal from aqueous media [8]. Although activated carbon is the most widely used adsorbent for dye removal, its high production and regeneration costs significantly restrict its large-scale application [9]. Consequently, considerable research efforts have been devoted to exploring low-cost and sustainable alternatives to activated carbon, notably natural or chemically modified clays [10] and polymer-based composite adsorbents [11]. Considering the increasing environmental and economic constraints, recent studies have increasingly emphasized the utilization of natural materials derived from geological, vegetal, or animal sources. Among geological materials, clays are particularly attractive owing to their versatility and multifunctionality, enabling their application as adsorbents, ceramic materials, and biomedical or therapeutic products.
Montmorillonite, a prototypical swelling smectite clay, has been extensively investigated for its outstanding ability to remove both organic and inorganic pollutants from aqueous media [12,13]. This performance is attributed to the high cation exchange capacity, large specific surface area, and expandable interlayer galleries, which can accommodate a wide range of molecular and ionic species [14]. In addition, its negatively charged lamellar structure and exfoliation capability impart enhanced chemical reactivity. The high aspect ratio of montmorillonite further enables its effective use as a reinforcing nanofiller in petroleum-derived polymer composites [15,16,17]. Despite its attractive properties, the incorporation of montmorillonite does not always lead to a consistent improvement in the performance of composite materials [18]. Consequently, attention has shifted toward chitosan–clay bead composites, which provide a versatile and efficient platform for pollutant removal. Chitosan’s intrinsic film-forming ability, biodegradability, hydrophilicity, and capacity to interact with clay to form stable organo-mineral complexes in aqueous systems make it particularly well-suited for dye adsorption applications [19,20].
Chitosan (chemical formula: C12H24N2O9) is a derivative of chitin, a naturally occurring polymer abundantly found in the exoskeletons of crustaceans [19,21]. It is widely recognized for its ability to form biodegradable thin films with inherent antibacterial properties [20]. The presence of active functional groups, including primary amines (–NH2) and hydroxyls (–OH), allows chitosan to function as an effective adsorbent. Nevertheless, its adsorption performance strongly depends on its physicochemical characteristics, such as the degree of deacetylation (DD), molecular weight (MW), and crystallinity index (CI) [22].
While most research has focused on incorporating small amounts of montmorillonite into chitosan films to improve their mechanical and physical properties [23,24], the development of chitosan–montmorillonite microspheres remains relatively underexplored [25]. The bead (microsphere) format offers several advantages over films or bulk composites: the spherical geometry provides a high surface-to-volume ratio, enhanced mass transfer, and ease of handling and separation from aqueous media. These features make chitosan–montmorillonite beads a particularly promising platform for efficient dye adsorption in wastewater treatment applications.
Given the limited number of detailed studies, the present work focuses on the characterization of chitosan–montmorillonite composite microspheres and their application in the adsorption and controlled release of the azo dye Orange II (OII). This study evaluates both the microstructural properties of the beads and their effectiveness as sustainable and reusable adsorbents for the removal of aqueous pollutants.
2. Materials and Methods
2.1. Chemicals and Reagents
Sodium hydroxide (NaOH, 99.9%) and hydrochloric acid (HCl, 37%) used in this study were purchased from Aldrich (Sigma-Aldrich, Burlington, MA, USA). The clay, referred to as bentonite (BN), was obtained from a deposit located near the city of Nador, Morocco. The chemical composition and physical properties of the used clay are summarized in Table 1. Shrimp shells, used as the raw material for the production of α-chitosan, were collected from local seafood vendors. Orange II (OII, C6H11N2NaO4S; M = 350.32 g·mol−1) was purchased from Merck (Taufkirchen, Munich, Germany) with a stated purity of 99%. The dye, supplied as a powder, is highly soluble in water and exhibits a maximum absorption wavelength (λmax) at 485 nm.
2.2. Chitosan-Clay Beads Preparation
The main preparation steps and operating conditions for the chitosan–clay beads are described as follows. Briefly, equal volumes of the chitosan solution and the clay dispersion were mixed and stirred at room temperature for 5 h to obtain a homogeneous gel. This approach allows control of the chitosan content while promoting good bead formation. The pH of the mixture was adjusted to 4.5 prior to shaping. The resulting gel was then loaded into a syringe and slowly dropped into a 1 M NaOH solution under continuous stirring, leading to the formation of spherical beads. The beads were kept in the alkaline medium for 4 h to ensure complete stabilization [26]. Subsequently, they were thoroughly washed with distilled water until the pH of the rinsing solution reached neutrality (≈7). Finally, the purified beads were stored at 4 °C for 24 h and then freeze-dried. The main physical characteristics of the prepared beads are summarized in Table 2.
2.3. Characterization Methods
The XRD analysis was performed on powder samples using a Rigaku Smart Lab diffractometer manufactured by Rigaku Corporation, Tokyo, Japan, operating with a copper anode (λKα = 1.5418 Å). The XRD traces were recorded under the following conditions: generator voltage: 40 kV; tube current: 30 mA. The diffraction angle (2θ) varied from 10 to 40°, with a scanning speed of 1.5° per minute and a step size of 0.05°. Circular samples were fixed on zero-background supports fabricated from 9 N semiconductor-grade silicon.
The microstructure of the carbon-coated cured samples was meticulously investigated using a the SEM analysis was performed using a TESCAN VEGA3 scanning electron microscope manufactured by TESCAN, Brno, Czech Republic, offering high-resolution imaging capabilities. This SEM was equipped with a 20 mm2 X-Max diffusion silicon detector, which significantly enhances energy-dispersive X-ray (EDX) analysis, enabling precise elemental mapping of the sample. The morphological examination provided detailed insights into the surface features and texture of the carbon coatings. Additionally, EDX spectroscopy was employed to analyze the elemental composition of the carbon-coated surfaces, allowing for the identification and quantification of specific elements present in the sample.
The crystallinity index was calculated from the X-ray diffraction (XRD) pattern of the chitosan using the method outlined in reference [27]:
where I200 is the maximum intensity of the (200) lattice diffraction and Iam is the intensity diffraction at 18°.
Crystal sizes were determined according to the Scherrer equation (Equation (1)), where
CS is the average crystal size (nm), λ is the X-ray wavelength (1.54059 Å), 0.9 is the Scherrer constant, θ is the half diffraction angle for the I200 plane in degrees, and β is the peak width at half its maximum in radians [28]:
Fourier-transform infrared (FT-IR) analysis was conducted on thin discs (1 mg of sample and 99 mg of KBr) in the range of 4000–400 cm−1 using a Perkin-Elmer Fourier-Transform 1720-x-spectrophotometer manufactured by Perkin-Elmer, Norwalk, CT, USA, all FTIR, SEM, and XRD measurements were performed using instruments located in Marrakech, Morocco.
The degree of deacetylation (DD) of the synthesized chitosan was determined by chemical assay, and the molecular weight (MW) was evaluated by viscometry, following the protocols established by Brugnerotto et al. [29], Tolaimate et al. [30], and Kumar [31], respectively, all measurements were performed in triplicate (n = 3).
Concerning the BN-CTS beads, the diameter of each bead was measured using a digital caliper to ensure accuracy, and the bulk density was determined using the standard tap-density method. All measurements were performed in triplicate (n = 3) to ensure reproducibility, and the average values with standard deviations are reported in Table 2.
The cation exchange capacity (CEC) of the clay samples was assessed using cobaltihexamine ions ([Co(NH3)6]3+), following the procedure described by Aran et al. [32]. The point of zero charge (pHpzc) of the clays was determined by plotting the initial pH values of a series of clay dispersions against their corresponding final pH values, as detailed in reference [33].
The adsorption performance of BN-CS beads toward Orange II (OII) was investigated under continuous stirring (500 rpm) at 25 °C. All experiments were conducted under identical conditions to evaluate the influence of key operating parameters.
The effect of adsorbent dosage was studied by adding BN-CS beads (0.5–2 g L−1) to an OII solution (25 mg L−1) and stirring for 180 min, a duration exceeding adsorption equilibrium. The influence of pH was examined over the range 4–10 using 0.5 g L−1 of BN-CS in a 25 mg L−1 OII solution under the same conditions.
Residual OII concentrations (Ct) were determined by UV–Vis spectrophotometry Perkin-Elmer Norwalk, CT, USA at 485 nm. The adsorption capacity (qt) was calculated using Equation (3), as described in [34].
where C0 is the initial concentration of OII solution (mg/L) and Ct is its concentration the concentration (mg/L) at a time t after the adsorption process. m is the dose of adsorbent (mg) and V is the volume of the OII solution (L).
Kinetic adsorption experiments were performed using BN-CS composite beads (0.5 g L−1) in OII solutions (25 mg L−1) at pH 4, corresponding to the maximum adsorption efficiency. The suspensions were stirred at 500 rpm and maintained at 298 or 318 K. After adsorption, the samples were centrifuged and the supernatants were analyzed.
Adsorption isotherms were obtained by contacting BN-CS with OII solutions of varying concentrations (5–100 mg L−1) at pH 4. The mixtures were stirred for 120 min at 500 rpm and kept at 298 and 318 K. The equilibrium adsorption capacity (qe) was calculated using the same method as for qt (Equation (3)).
All experiments were carried out in triplicate. The equilibrium data were analyzed using the linearized Langmuir and Freundlich isotherm models, with the Langmuir equation given by Equation (4) [35].
where KL is the Langmuir constant (L/mg) related to the affinity of binding sites and the free energy of sorption, qe is the dye concentration at equilibrium onto biosorbent (mg/g), Ce is the dye concentration at equilibrium in solution (mg/L), and qm is the dye concentration when monolayer forms on biosorbent (mg/g).
The Freundlich model, which accounts for adsorption on heterogeneous surfaces, is expressed by Equation (5) [36].
where KF and n are the Freundlich constants obtained from the linear plot of ln (qe) vs. ln (Ce). The parameters KF and 1/n represent the adsorption capacity and adsorption intensity, respectively.
The reusability of BN-CS beads was evaluated using 10 mg of OII-saturated adsorbent in 20 mL of 0.1 N NaCl solution. The suspension was stirred at 500 rpm for 180 min, after which the beads were recovered. The regenerated beads were subsequently reused in successive adsorption–desorption cycles, each with a contact time of 180 min.
3. Results and Discussion
3.1. Mineralogical Characterization and Purification of the Clays Used
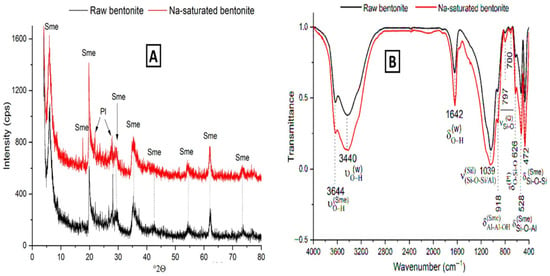
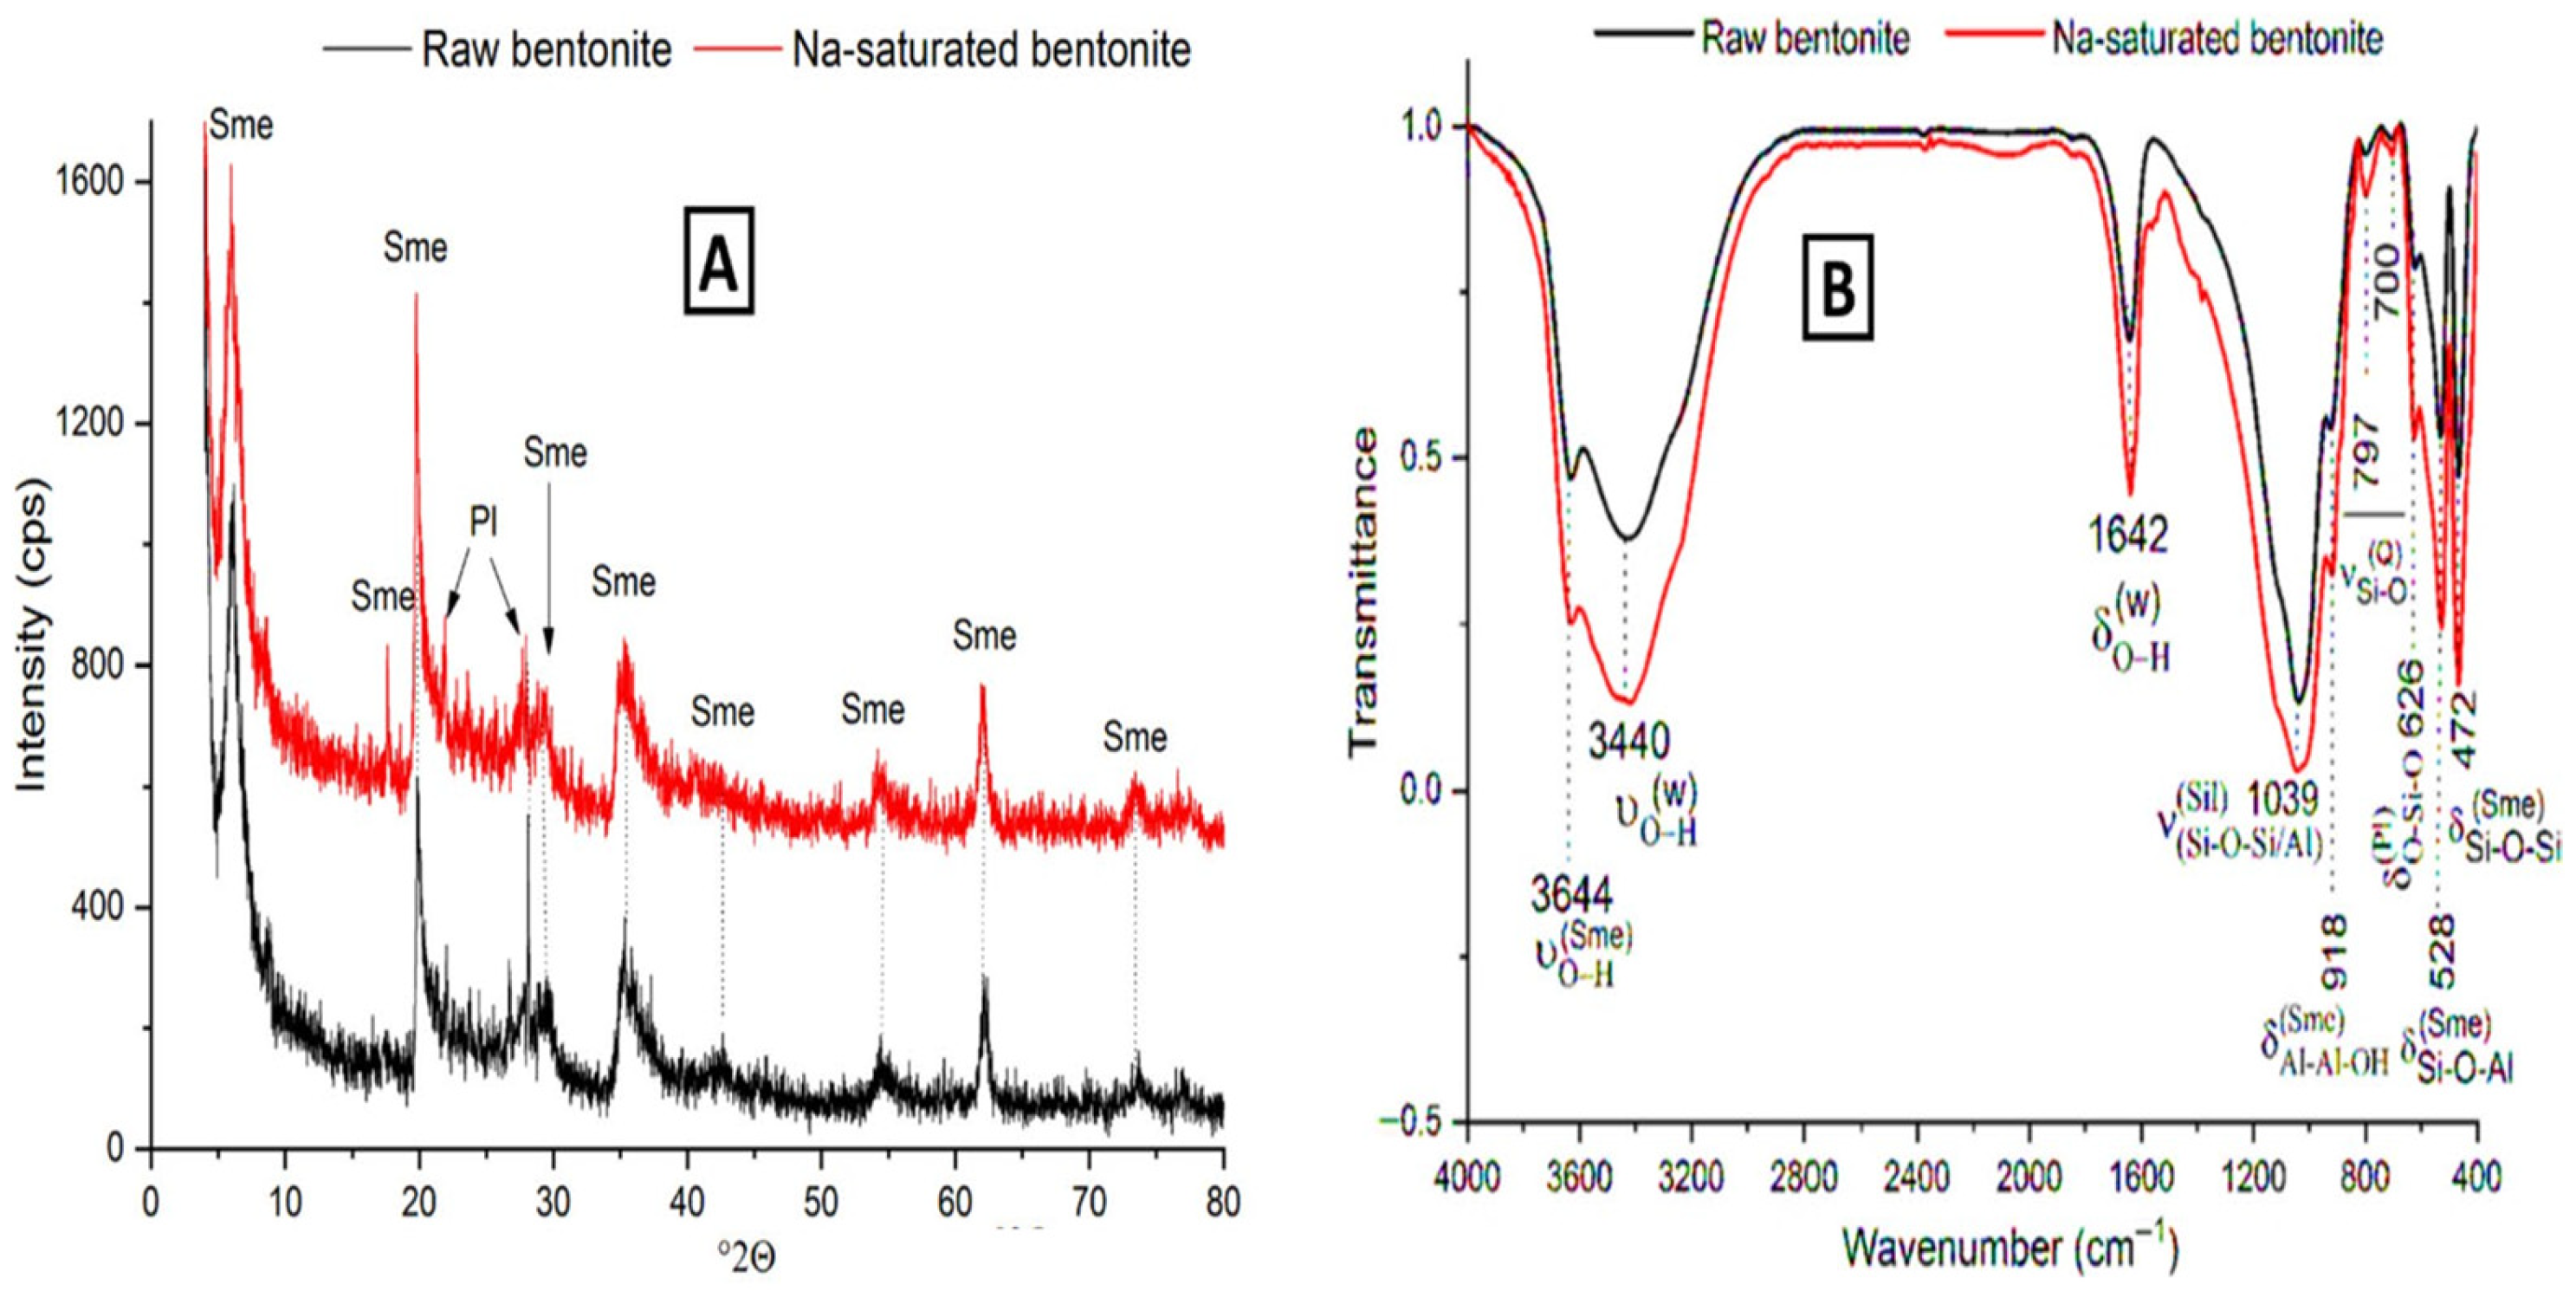
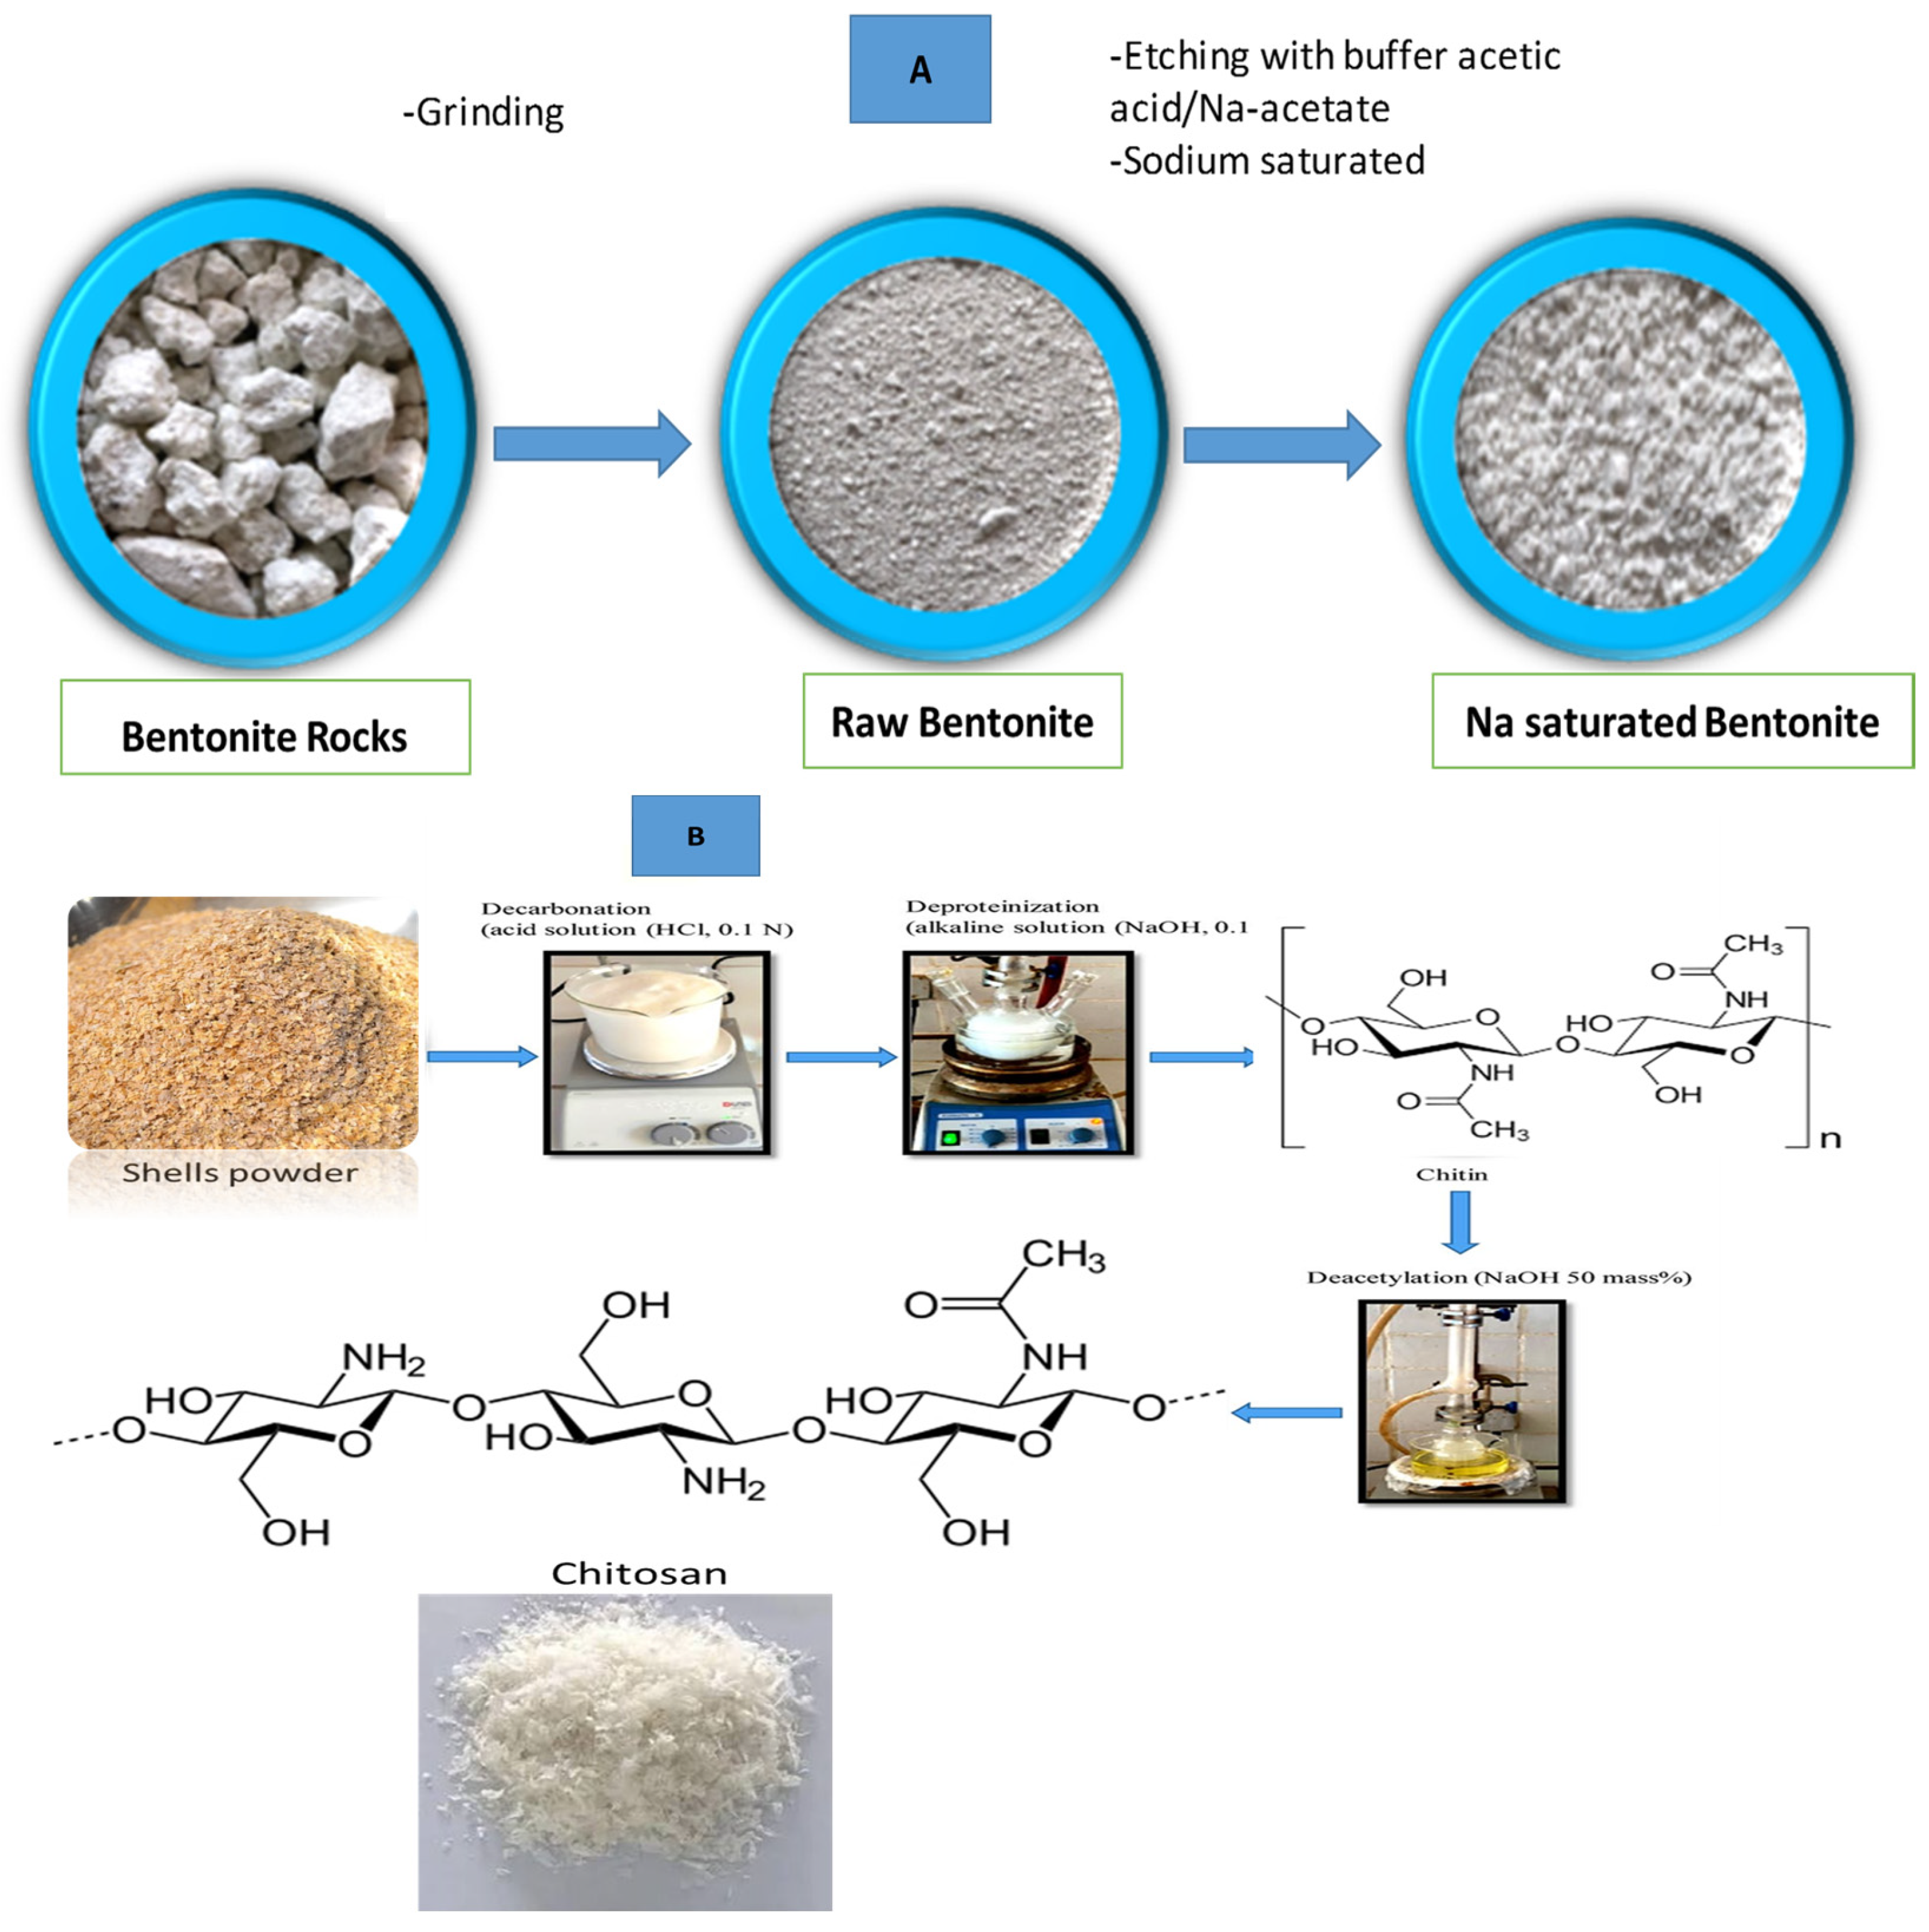
The clay material used was from the bentonite-rich zone. It was ground and sieved (<100 μm). Then, it was washed with a buffer solution (pH = 4.5) and sodium-saturated. The X-ray diffraction and the Fourier-transform infrared analyses of the raw and the Na-saturated clay (Figure 1) showed that the clay was composed of smectite di-octahedral clay minerals (montmorillonite/beidellite), plagioclase, and quartz. The clay mineral amount exceeded 80 mass%. The chemical composition, the CEC, and the external surface area (SA) are given in Table 1.
Figure 1.
X-ray diffraction patterns (A) and FT-IR spectra (B) of the raw and Na-saturated bentonite. Sme: smectite (PDF# 03-0010), Pl: plagioclase (PDF# 33-1161). Sil: silicate, W: water, Q: quartz.
Table 1.
Chemical composition and physical properties of the used clay (analytical techniques: XRF for composition, BET for surface area, CEC by ammonium acetate method, XRD for crystallite size).
3.2. Chitosan: Preparation and Physical Characterization
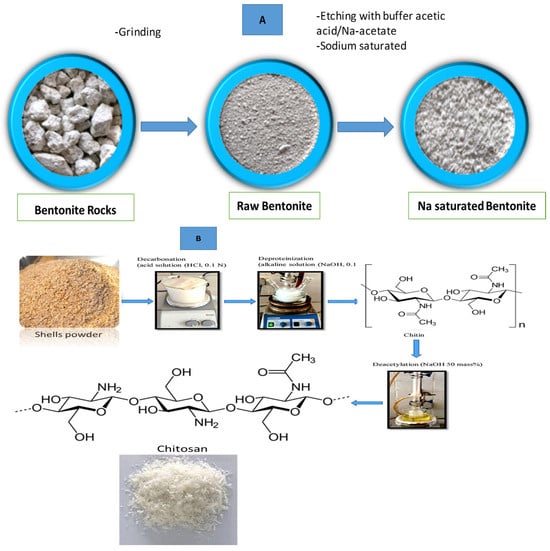
The shrimp shells underwent successive chemical treatments, including demineralization, deproteinization, and deacetylation, in order to obtain purified chitosan, as schematically illustrated in Figure 2B. These treatments effectively removed inorganic components and proteins, leading to the formation of a semi-crystalline biopolymer structure.
Figure 2.
Schematic illustration of the experimental procedures: (A) purification process of the clay; (B) synthesis of chitosan from shrimp shells via deacetylation, showing the main chemical transformations and processing steps.
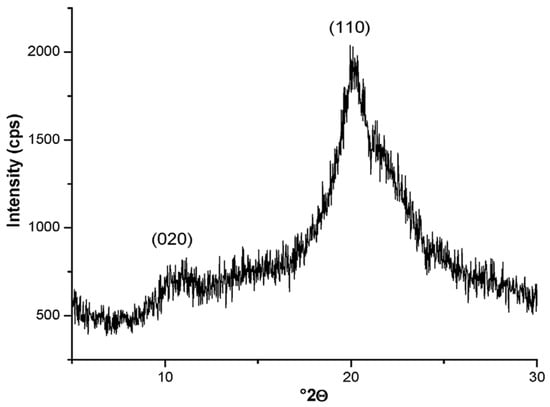
The crystalline structure of the synthesized chitosan was investigated by X-ray diffraction (XRD), and the crystallinity index was calculated according to Equation (1). The corresponding diffractogram is presented in Figure 3. The XRD pattern exhibits two characteristic diffraction peaks located around 10° and 20° (2θ), which are typically attributed to the hydrated crystalline form of chitosan. More specifically, these reflections correspond to the (020) and (110) crystallographic planes, respectively, confirming the semi-crystalline nature of the obtained chitosan. The peak around 20° (2θ) is generally associated with the ordered crystalline domains, whereas the broader contribution reflects the presence of amorphous regions within the polymer matrix.
Figure 3.
X-ray diffraction traces of the chitosan (CTS) used.
Key physical properties of the synthesized chitosan, determined using the experimental procedures described below, are summarized in Table 2.
Table 2.
Physical characteristics of the synthesized chitosan (CTS) and prepared beads.
3.3. Microstructure Characterization
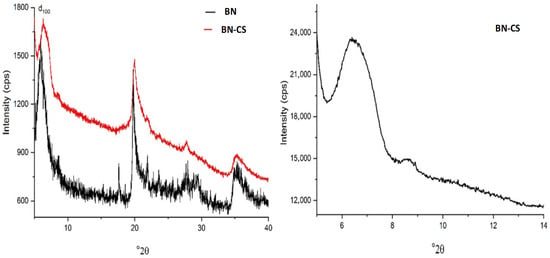
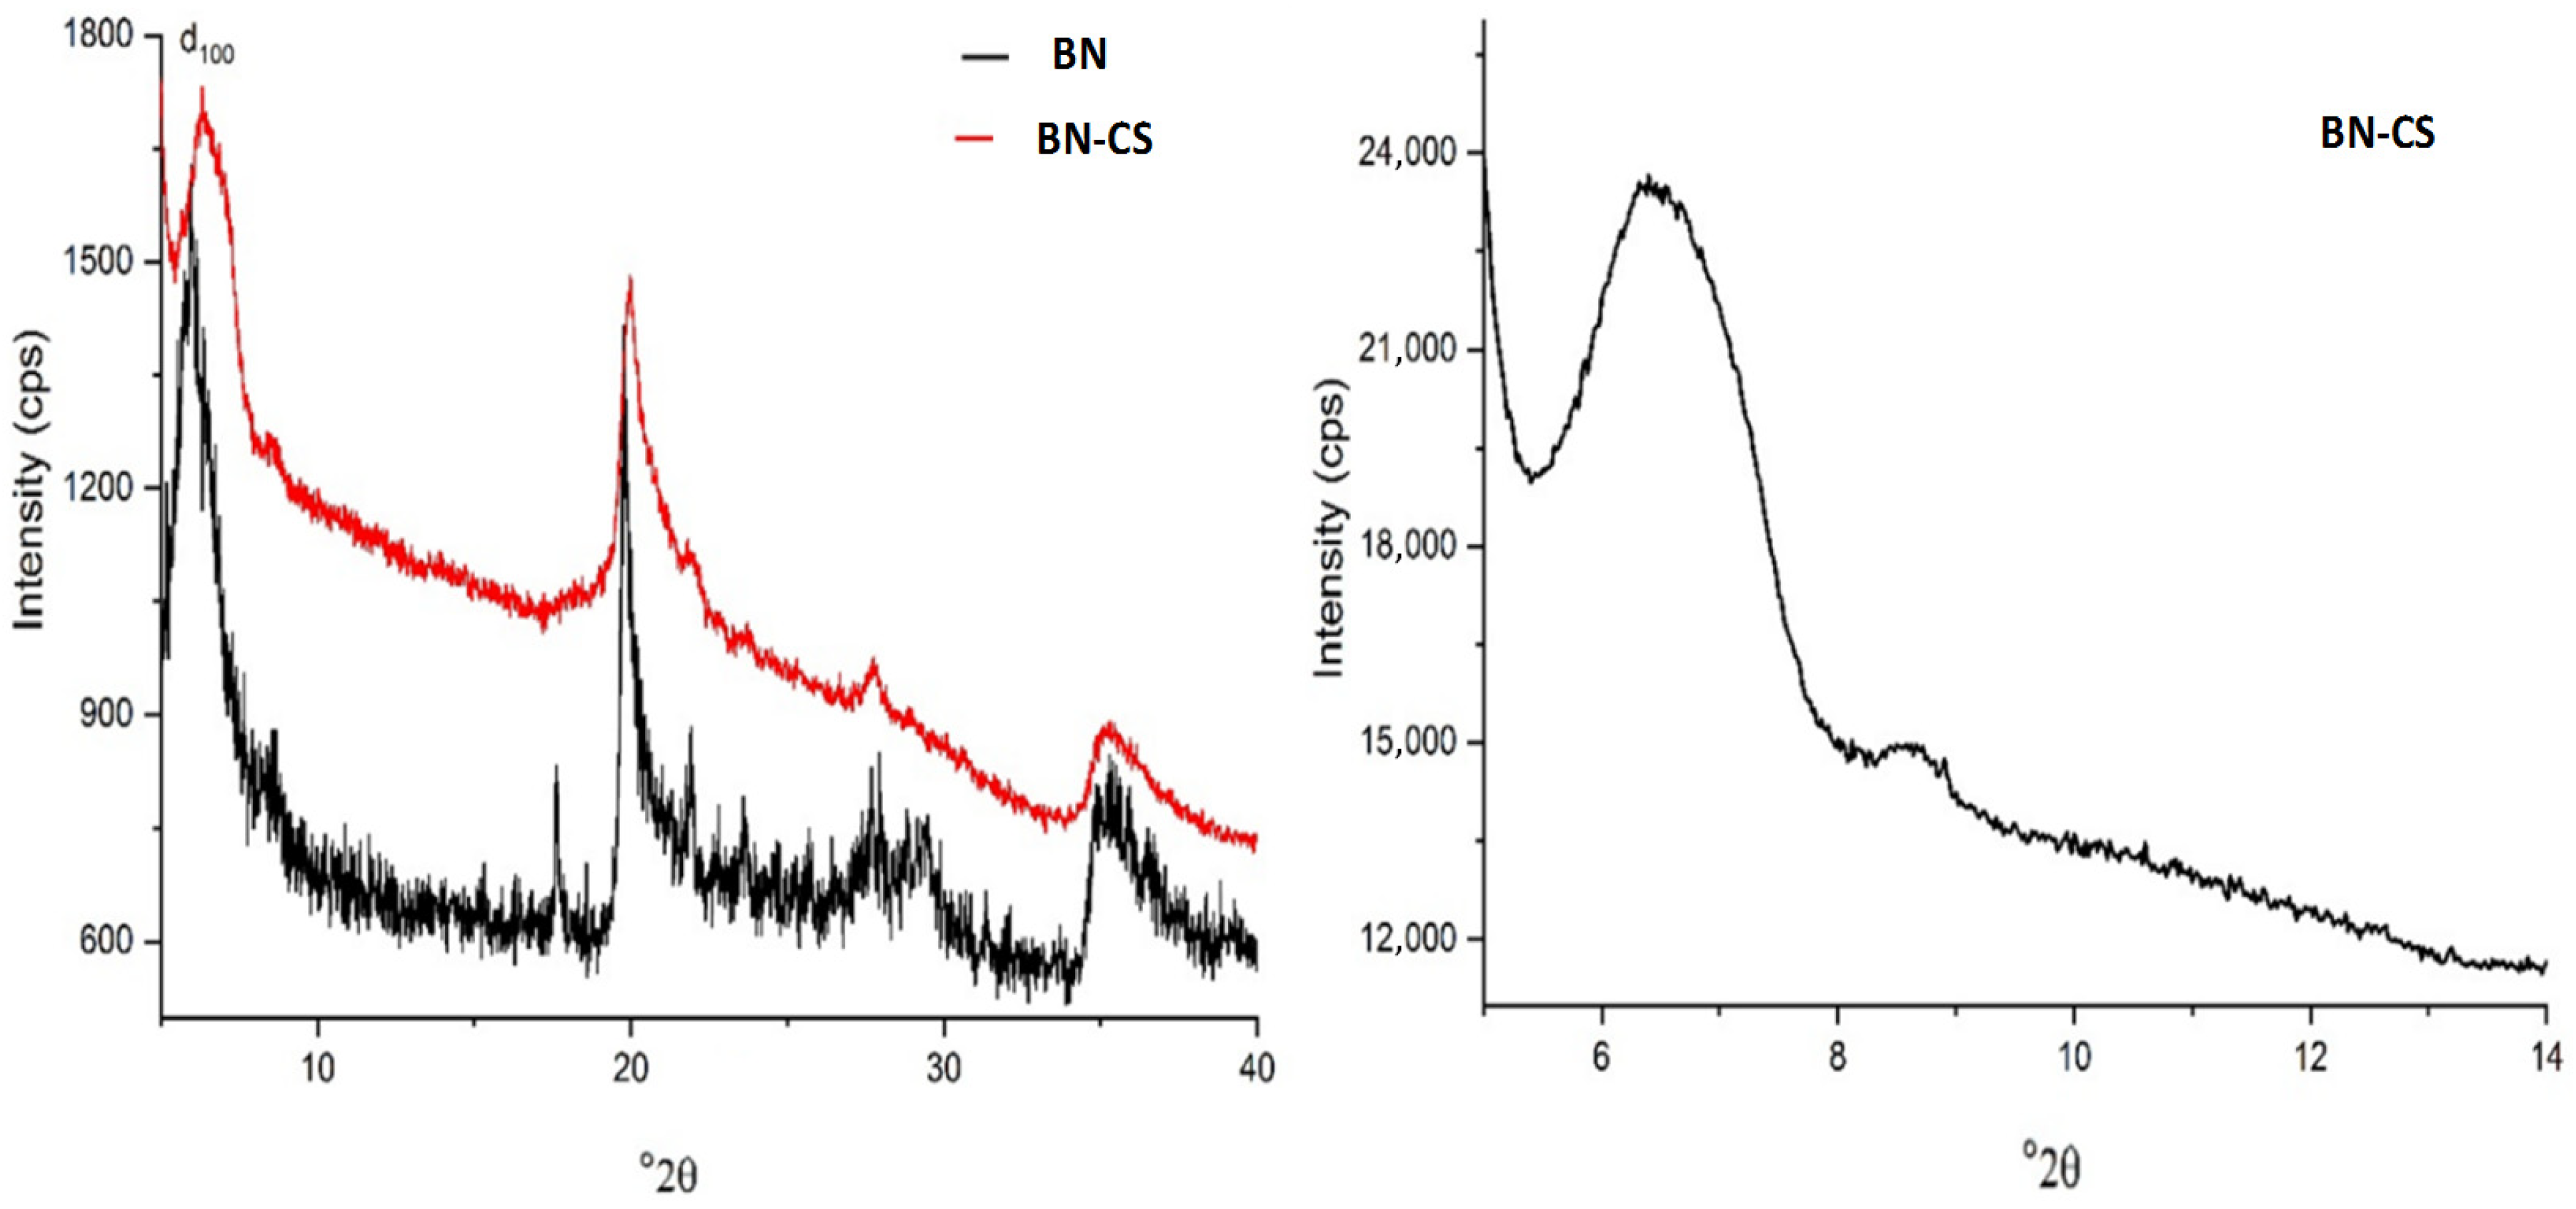
The interaction between BN particles and chitosan resulted in a slight broadening of the basal X-ray reflection (100) associated with montmorillonite, as shown in Figure 5. This broadening, however, did not accompany any shift in the reflection peak, suggesting that intercalation of chitosan into the interlayer spaces of montmorillonite, as proposed in previous studies [37,38], is unlikely. Instead, the observed broadening is attributed to a decrease in the crystallinity index, indicating that the clay particles were likely coated by chitosan chains.
Based on the characteristic X-ray reflections of pure chitosan (at approximately 2θ ≈ 6.1° and 10.9°; see Figure 3) and the dominant peak of the BN-CTS composite (Figure 4), no evidence of chitosan aggregation within the bead was found. This implies that the majority of the chitosan was uniformly distributed and adhered to the clay surface.
Figure 4.
X-ray diffraction (XRD) patterns of the synthesized chitosan–bentonite bead (BN–CS) and the raw bentonite (BN). The main diffraction peaks of bentonite appear at approximately 7° and 20° 2θ, corresponding to the basal (001) and (110) planes, respectively.
To gain a deeper understanding of the interaction mechanisms between chitosan and montmorillonite, the polarity of both components was assessed by comparing the point of zero charge (pHPZC) of montmorillonite (Table 1) with the pH of the chitosan–montmorillonite dispersion (pH = 4.5). This comparison offers valuable insights into potential electrostatic interactions, particularly in light of the protonation behavior of chitosan under these conditions:
[-NH3+] + H2O ↔ [H3O+] + [-NH2]
The concentration of protonated amino groups on chitosan (–NH3+) depends on the solution pH and is described by the relation: Ka/10−pH = [–NH2]/[–NH3+], where Ka is the acidity constant (pKa ≈ 6.5) [39]. Based on this expression and the dispersion pH (4.5), the majority of the chitosan molecules in the medium were in their protonated form, with the ratio [–NH3+] ≈ 102 × [–NH2]. Meanwhile, since the dispersion pH was close to the point of zero charge (pHPZC) of bentonite pH ≈ pHPZC (Table 1), the surface charge densities of montmorillonite particles were nearly balanced between positive and negative charges. These charges can arise from both the basal surfaces and the edges of the clay particles:
≡(Si, Al)-OH + H+ → ≡(Si, Al)-OH2+ → ≡(Si+, Al+) + H2O
≡Al-OH + OH− → ≡Si-(OH)2− → ≡Si-O− + H2O
-Al-OH + OH− → -Al-(OH)2− → -Al-O− + H2O
Based on the previously discussed data, it can be concluded that electrostatic attraction occurred between the protonated amine groups of chitosan (–NH3+) and the negatively charged active sites on the montmorillonite surface.
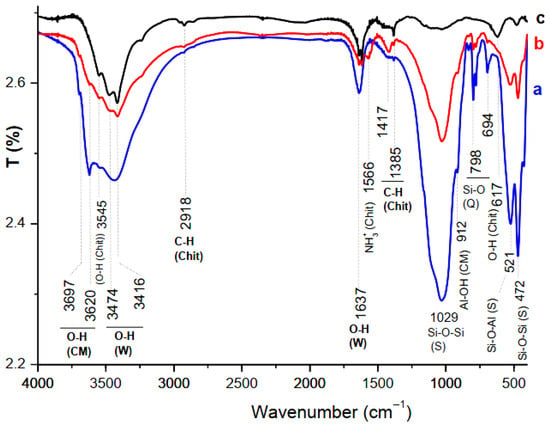
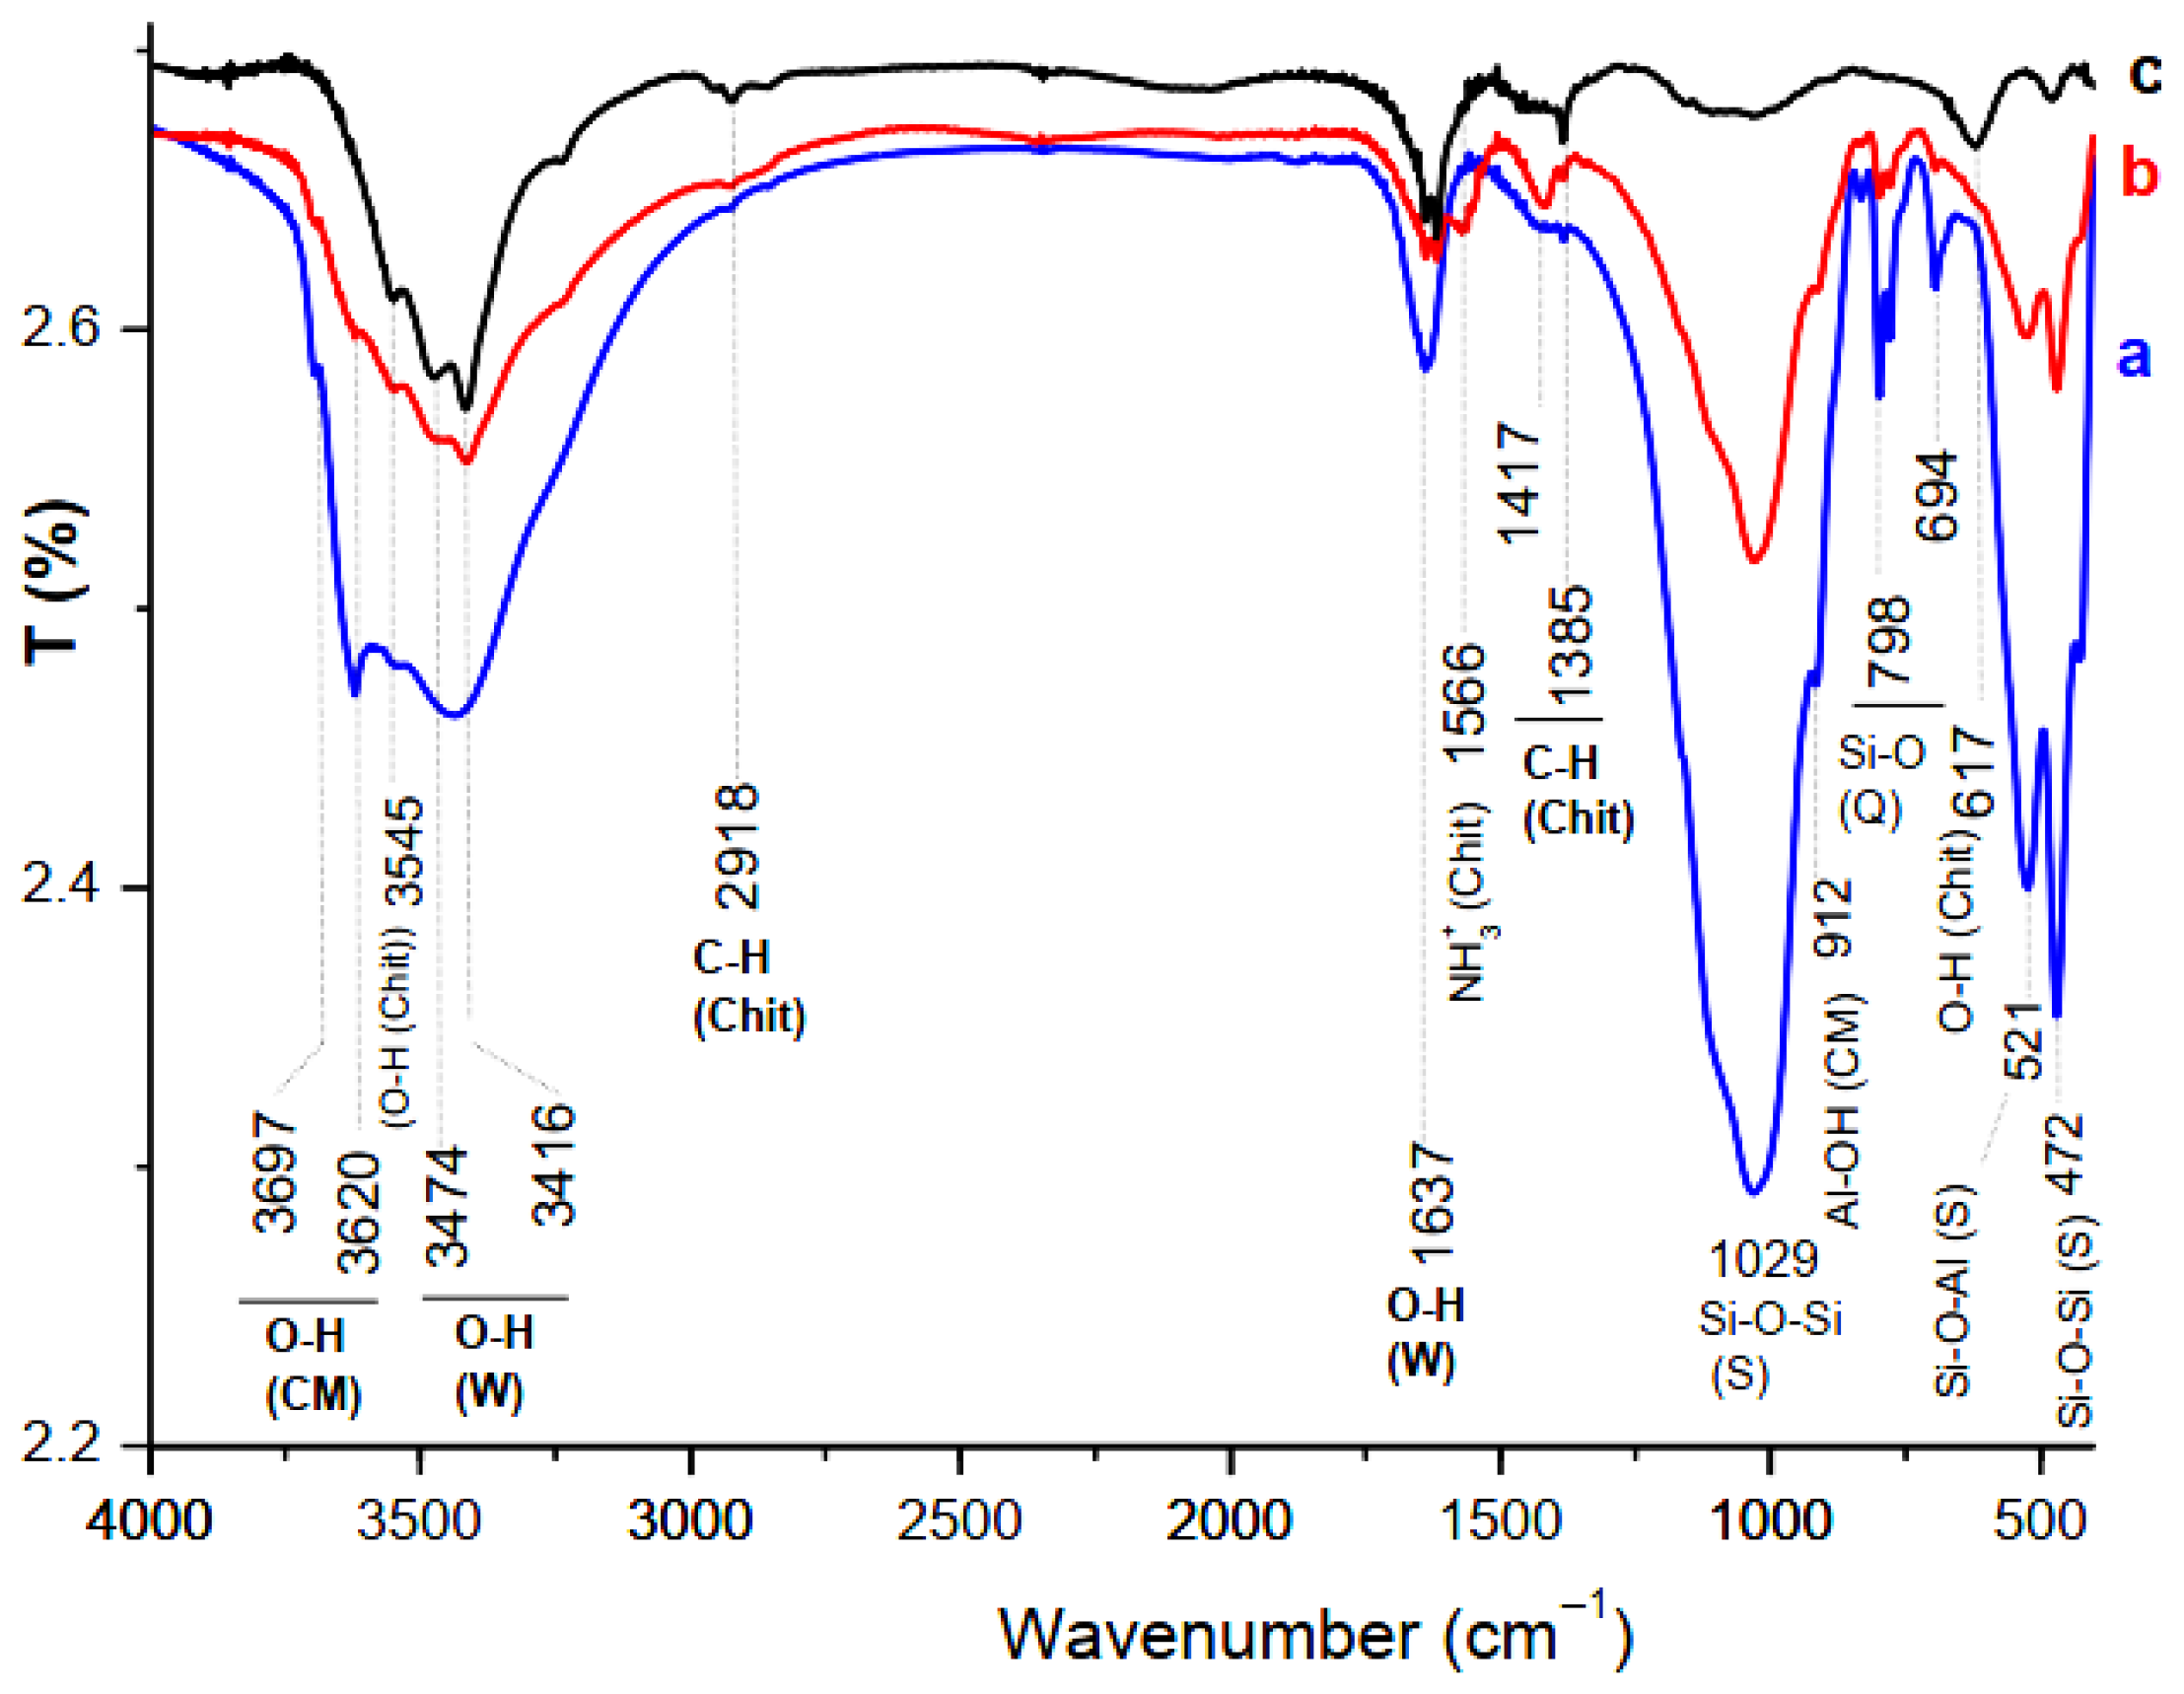
Considering the FT-IR traces shown in Figure 5, the spectrum of the film (b) consisted of an additional band at 1566 cm−1, which is associated with the protonated amino-groups of the chitosan. In addition, the band at 1417 cm−1 attributed to the deformation of the CH2 in the CH2OH group of the chitosan intensified. The bands related to the clay minerals bonds were not modified. These results allowed us to deduce that the functional groups (-NH3+ and CH2OH) of the chitosan were involved in its retention by the clay particles surfaces, which are negatively charged.
Figure 5.
FT-IR spectra of the clay fractions (a), the CS-BN (b), and the chitosan (c). CM: clay minerals, Chit: chitosan, W: water, Q: quartz, S: silicates.
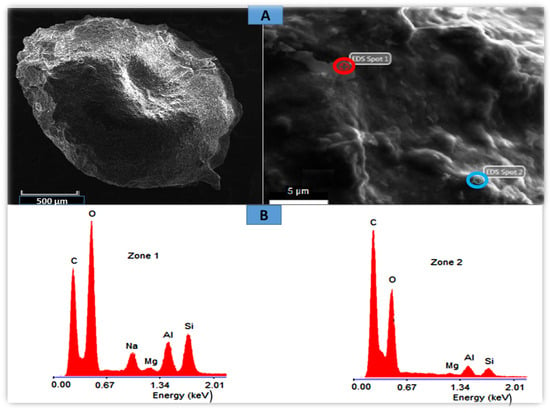
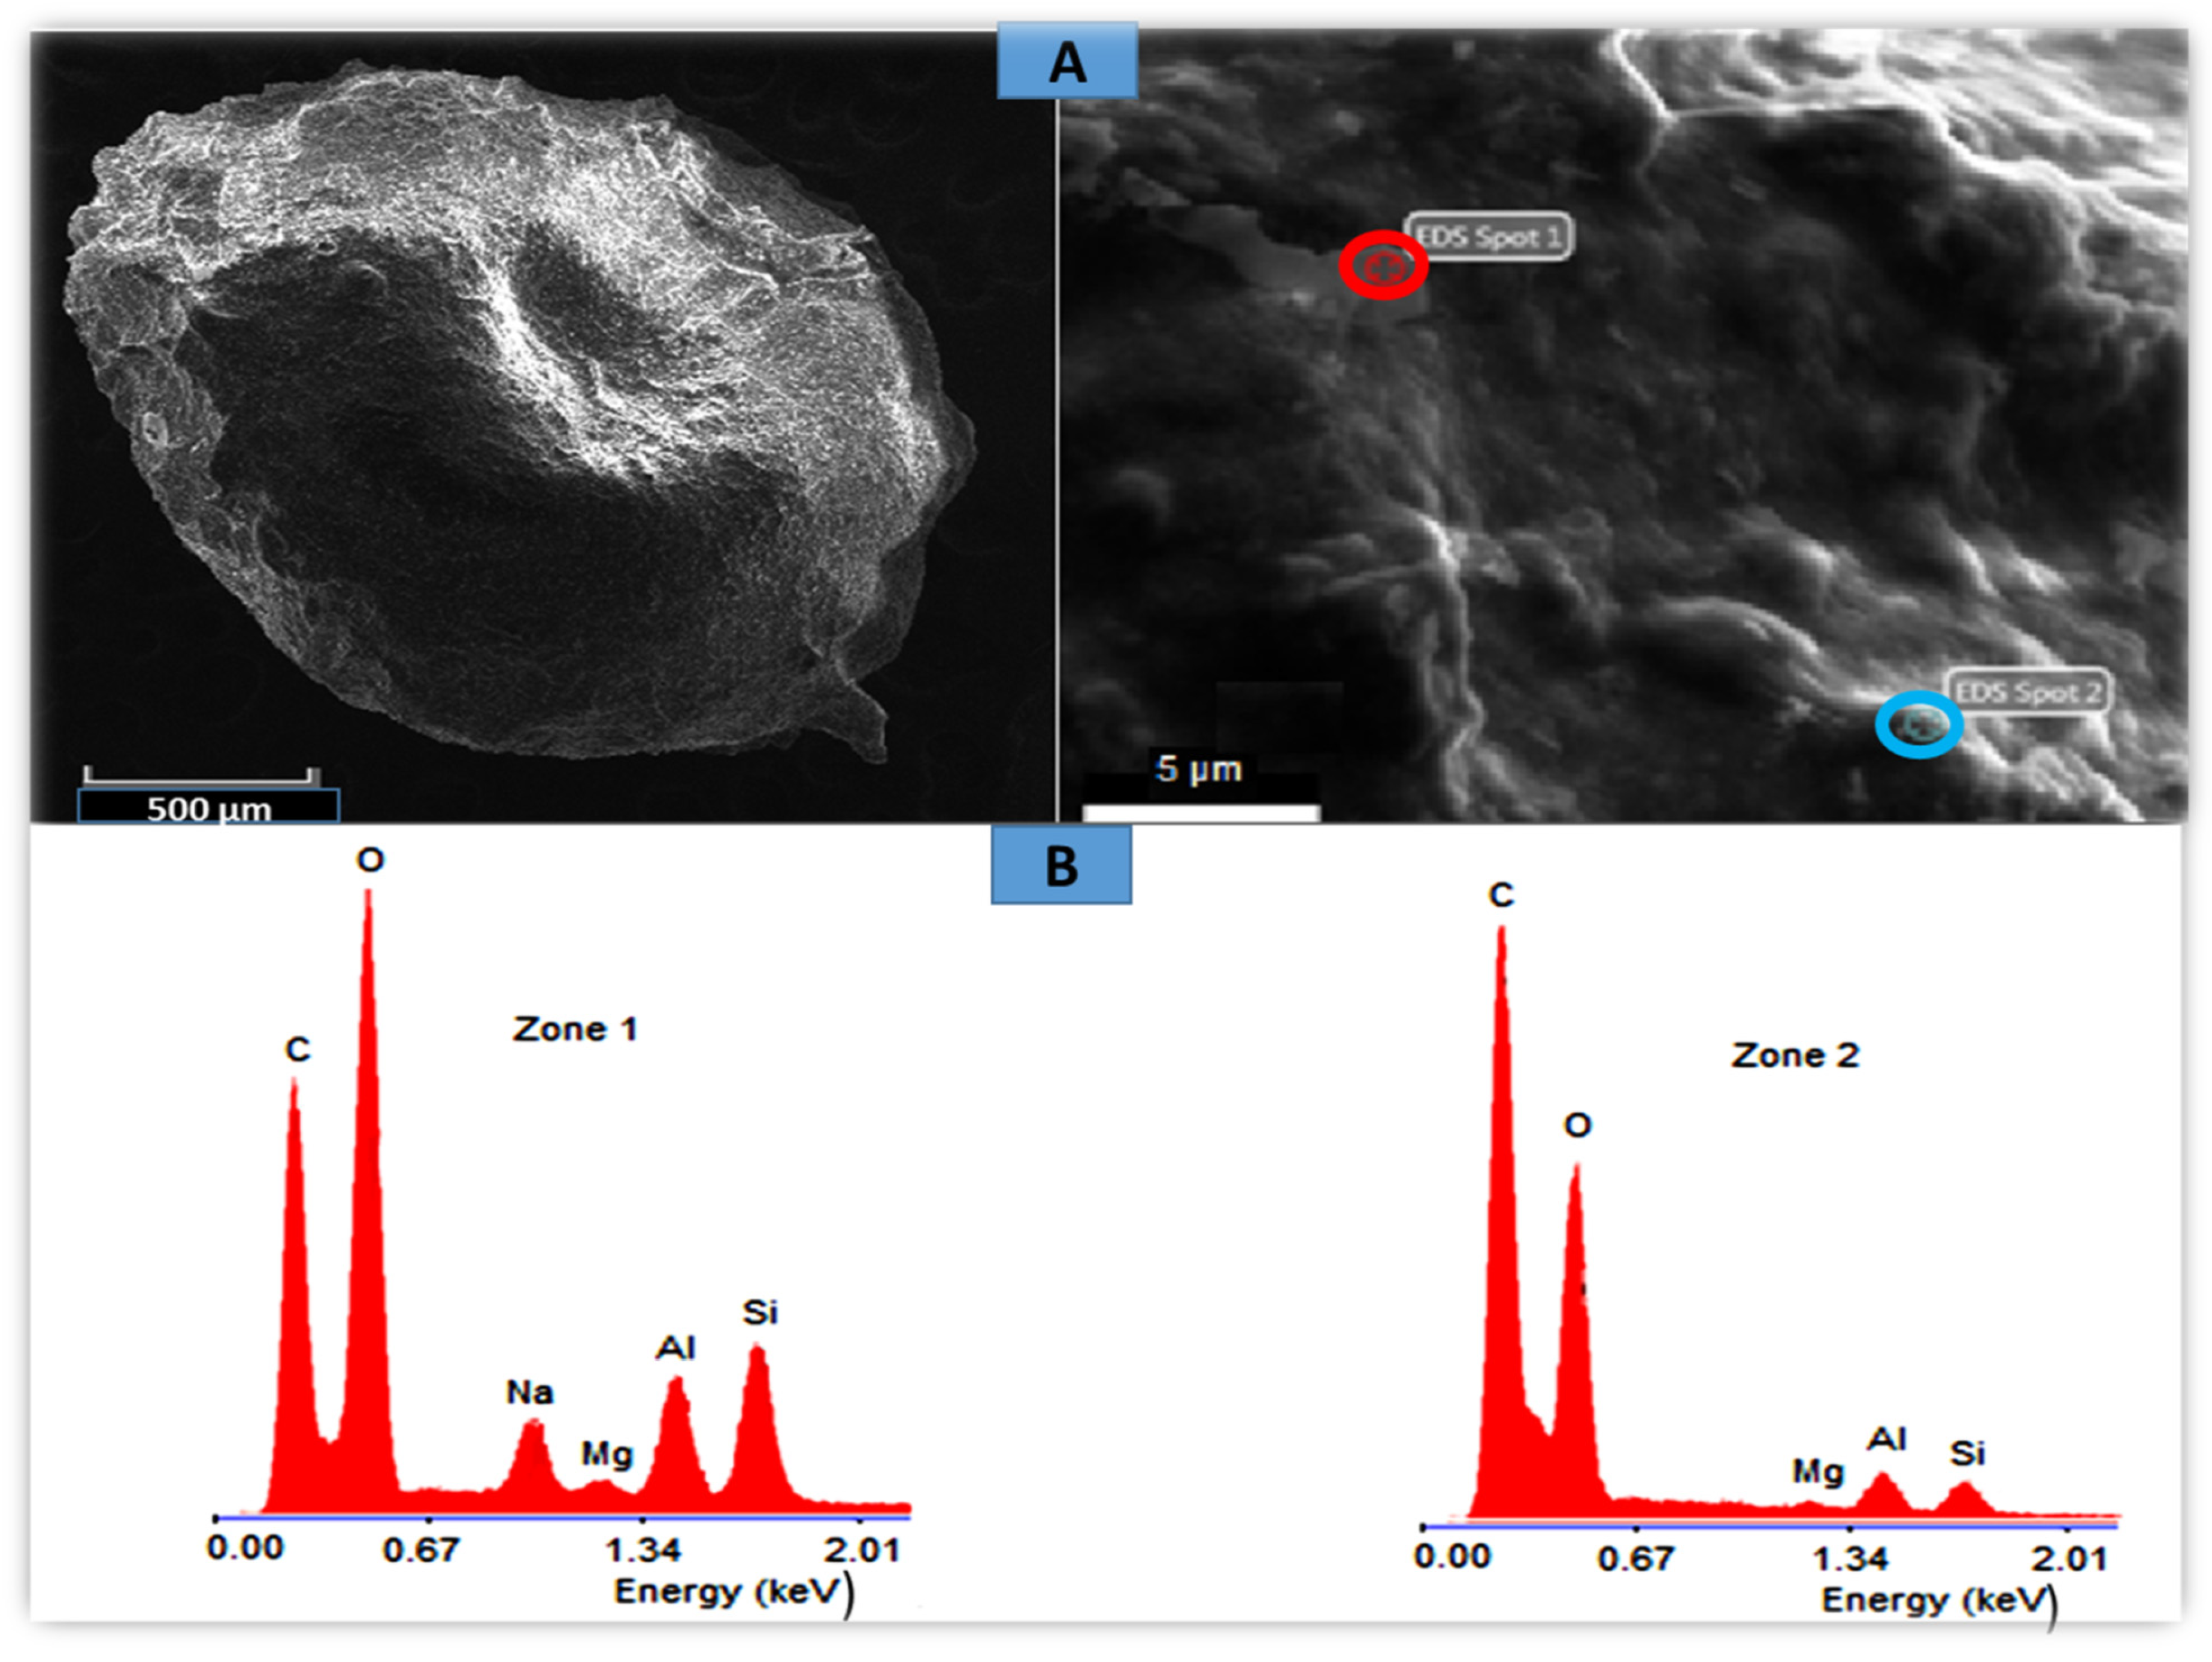
Scanning Electron Microscopy (SEM) analysis of the BN-CTS composite beads revealed mainly smooth surfaces with scattered pseudo-crater-like features (Figure 6). At higher magnification, pseudo-wave patterns and localized protrusions were observed. EDS analysis distinguished clay-rich and chitosan-rich regions (Zones 1 and 2). The detection of sodium in Zone 1, commonly associated with the interlayer spaces of montmorillonite [40], indicates the absence of chitosan intercalation, in agreement with XRD results showing no basal spacing shift.
Figure 6.
SEM micrographs (A) and EDS spectra (B) of the studied beads BN-CTS beads, Zone 1: clay-rich zone, Zone 2: chitosan-rich zone.
These findings suggest that the bead morphology is mainly controlled by interfacial interactions between chitosan chains and clay particles, as well as the intrinsic flexibility of the montmorillonite layers.
3.4. Orange II Adsorption Studies
3.4.1. Effect of Adsorbent Dose
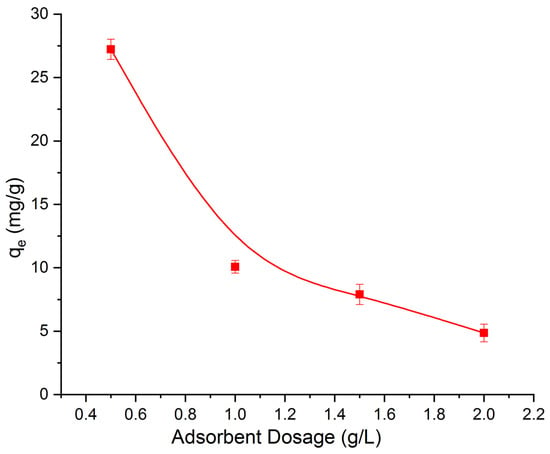
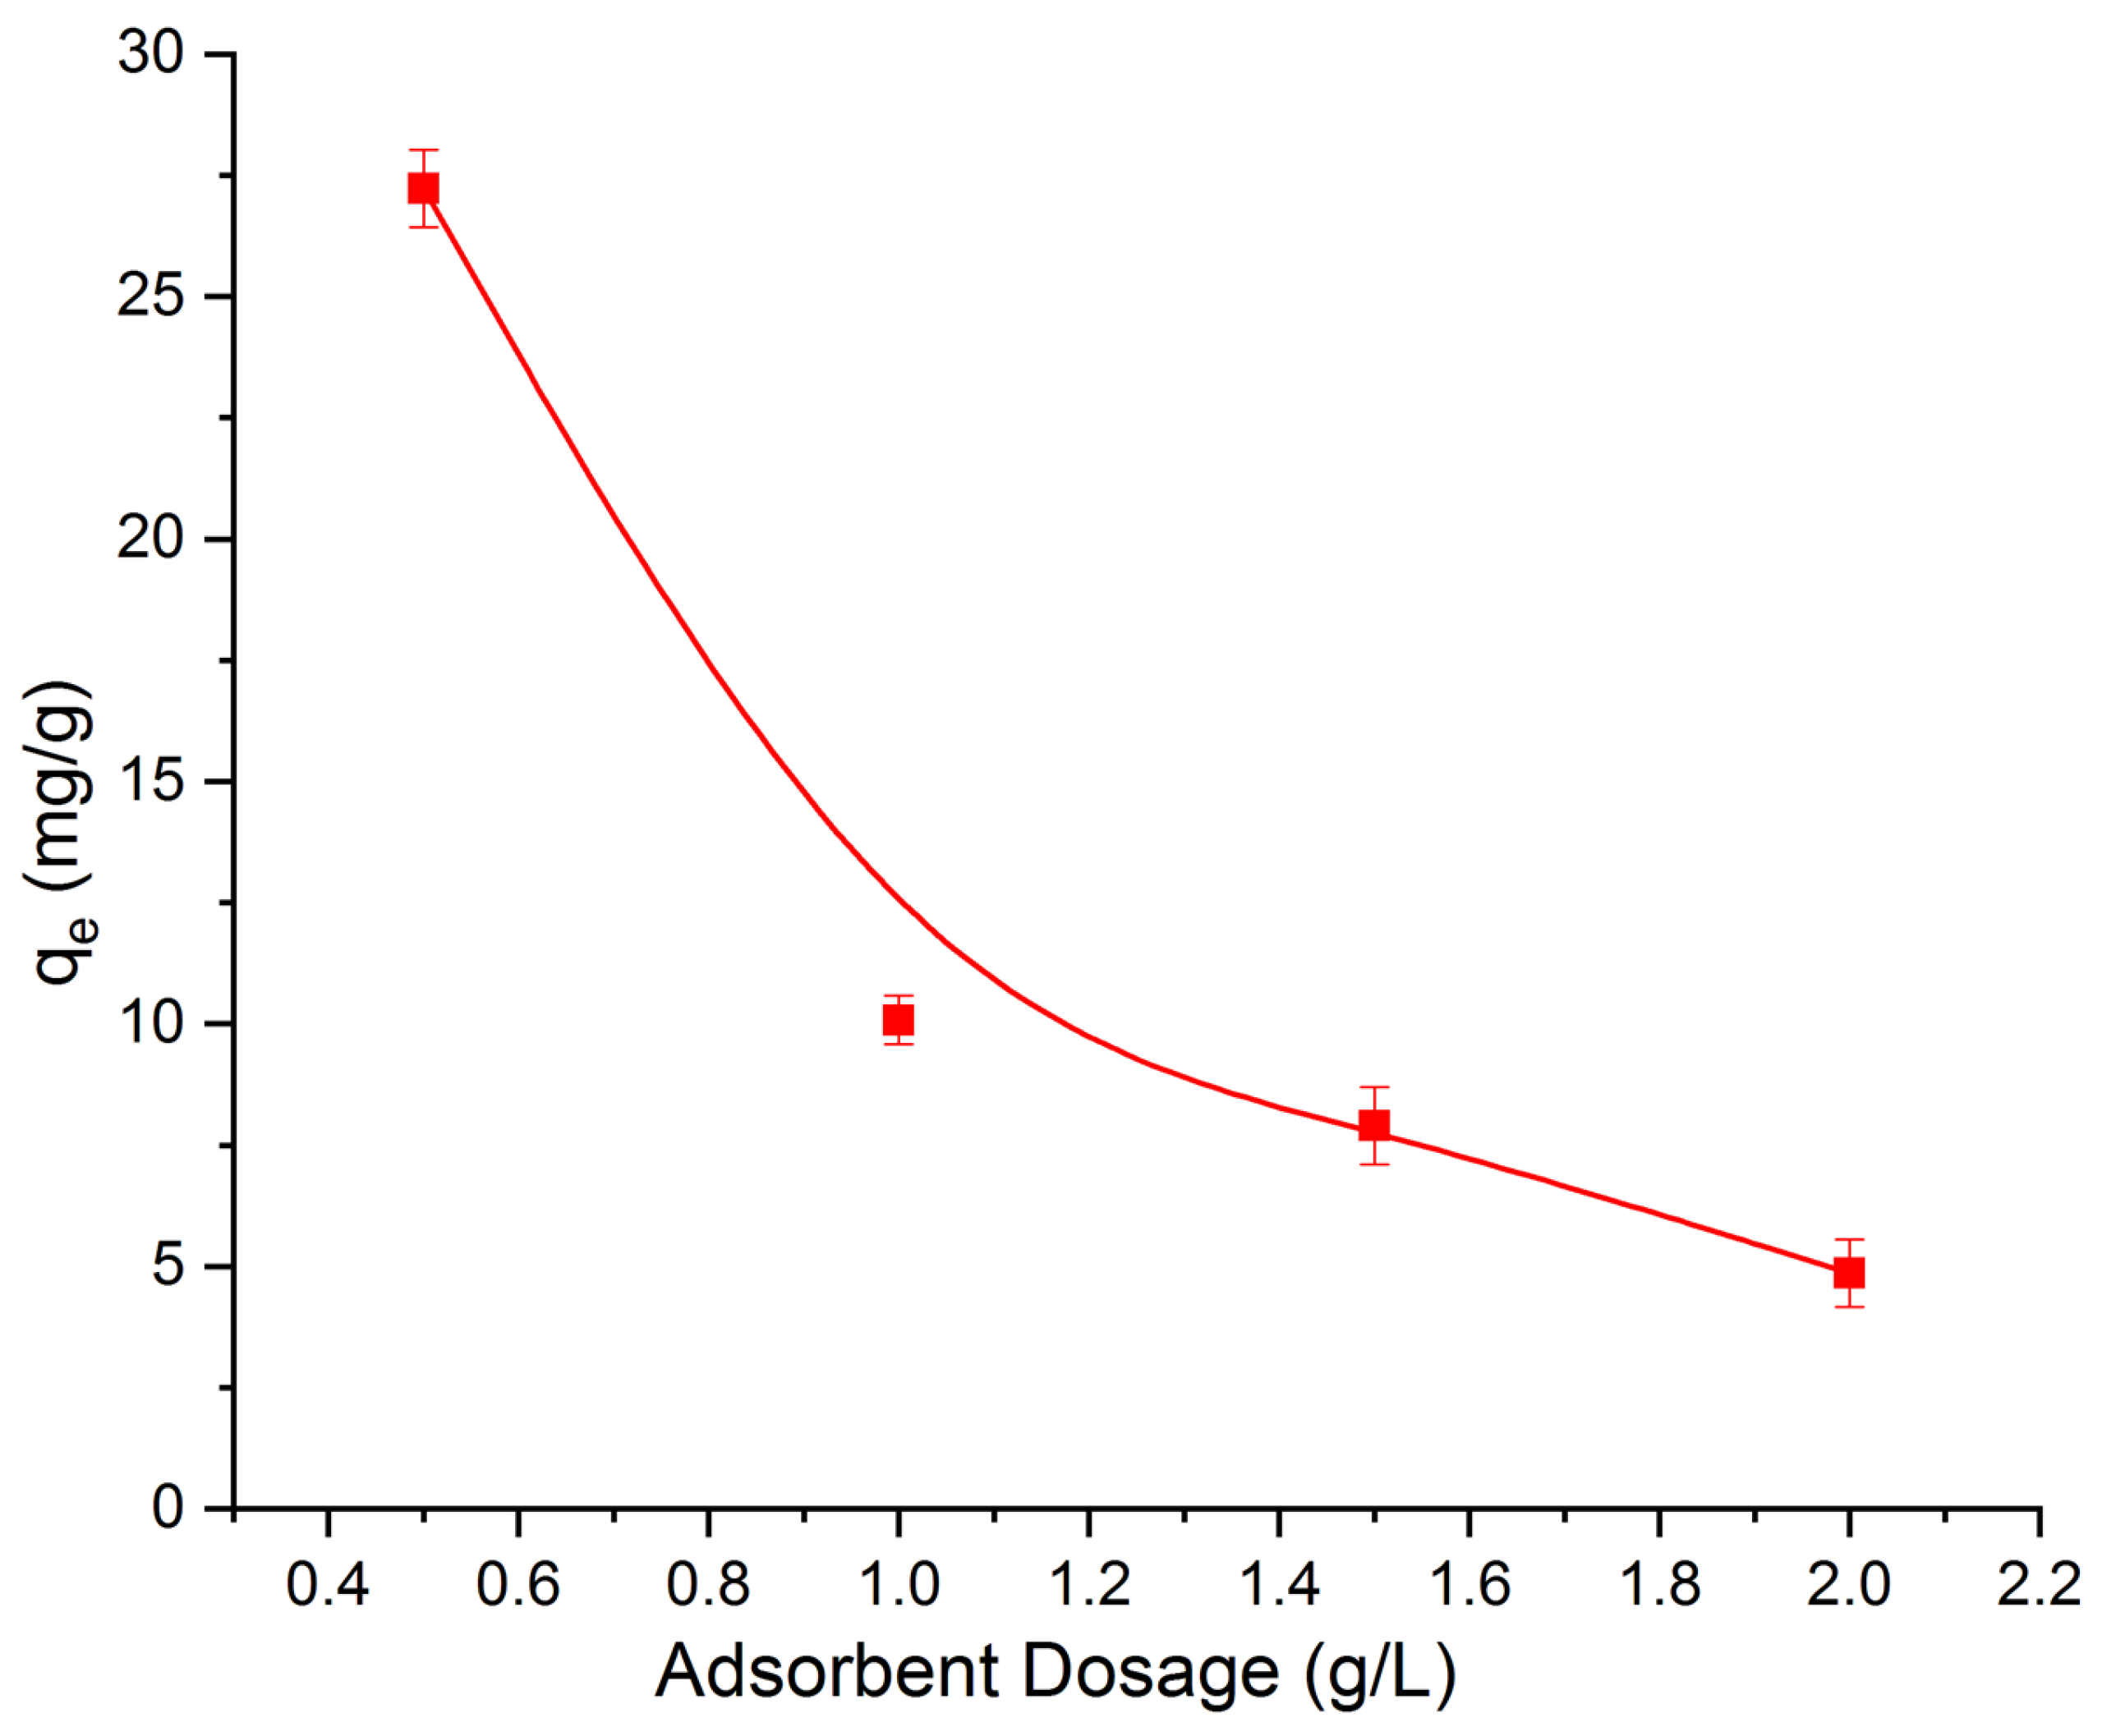
The influence of adsorbent dosage on the removal of OII dye was assessed to identify the optimal quantity necessary for maximum adsorption at a fixed dye concentration (25 mg/L). All experiments were conducted under uniform conditions, with the amount of BN-CS adsorbent varying between 0.5 and 2 g/L. The equilibrium adsorption capacity (qe) was determined and represented in Figure 7. As illustrated, increasing the BN-CS dosage led to a reduction in qe.
Figure 7.
Variation in the maximum OII adsorption capacity as a function of the adsorbent dosage. The experiments were carried out with an OII solution (25 mg L−1) under stirring for 180 min at pH = 5.
This trend can be ascribed to several factors. Firstly, a greater amount of adsorbent introduces more adsorption sites; however, because the dye concentration remains constant, the OII molecules are spread over a larger surface area. This dilution effect results in less dye uptake per gram of adsorbent. Secondly, excessive amounts of adsorbent can lead to particle agglomeration, which may obstruct some active sites and reduce the effective surface area available for adsorption [41].
Furthermore, the observed decline in adsorption capacity with higher adsorbent dosages might also be due to a lower concentration gradient between the solution and the solid phase, which limits mass transfer. Based on these observations, 0.5 g/L was identified as the optimal BN-CS dosage for OII removal. Doses exceeding this value led to decreased efficiency, likely due to active site obstruction caused by particle clustering.
3.4.2. Effect of pH
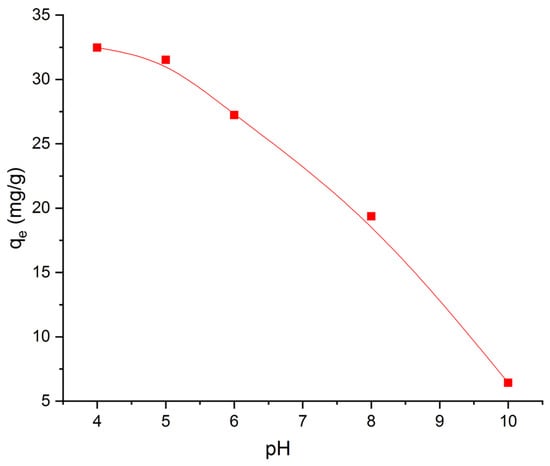
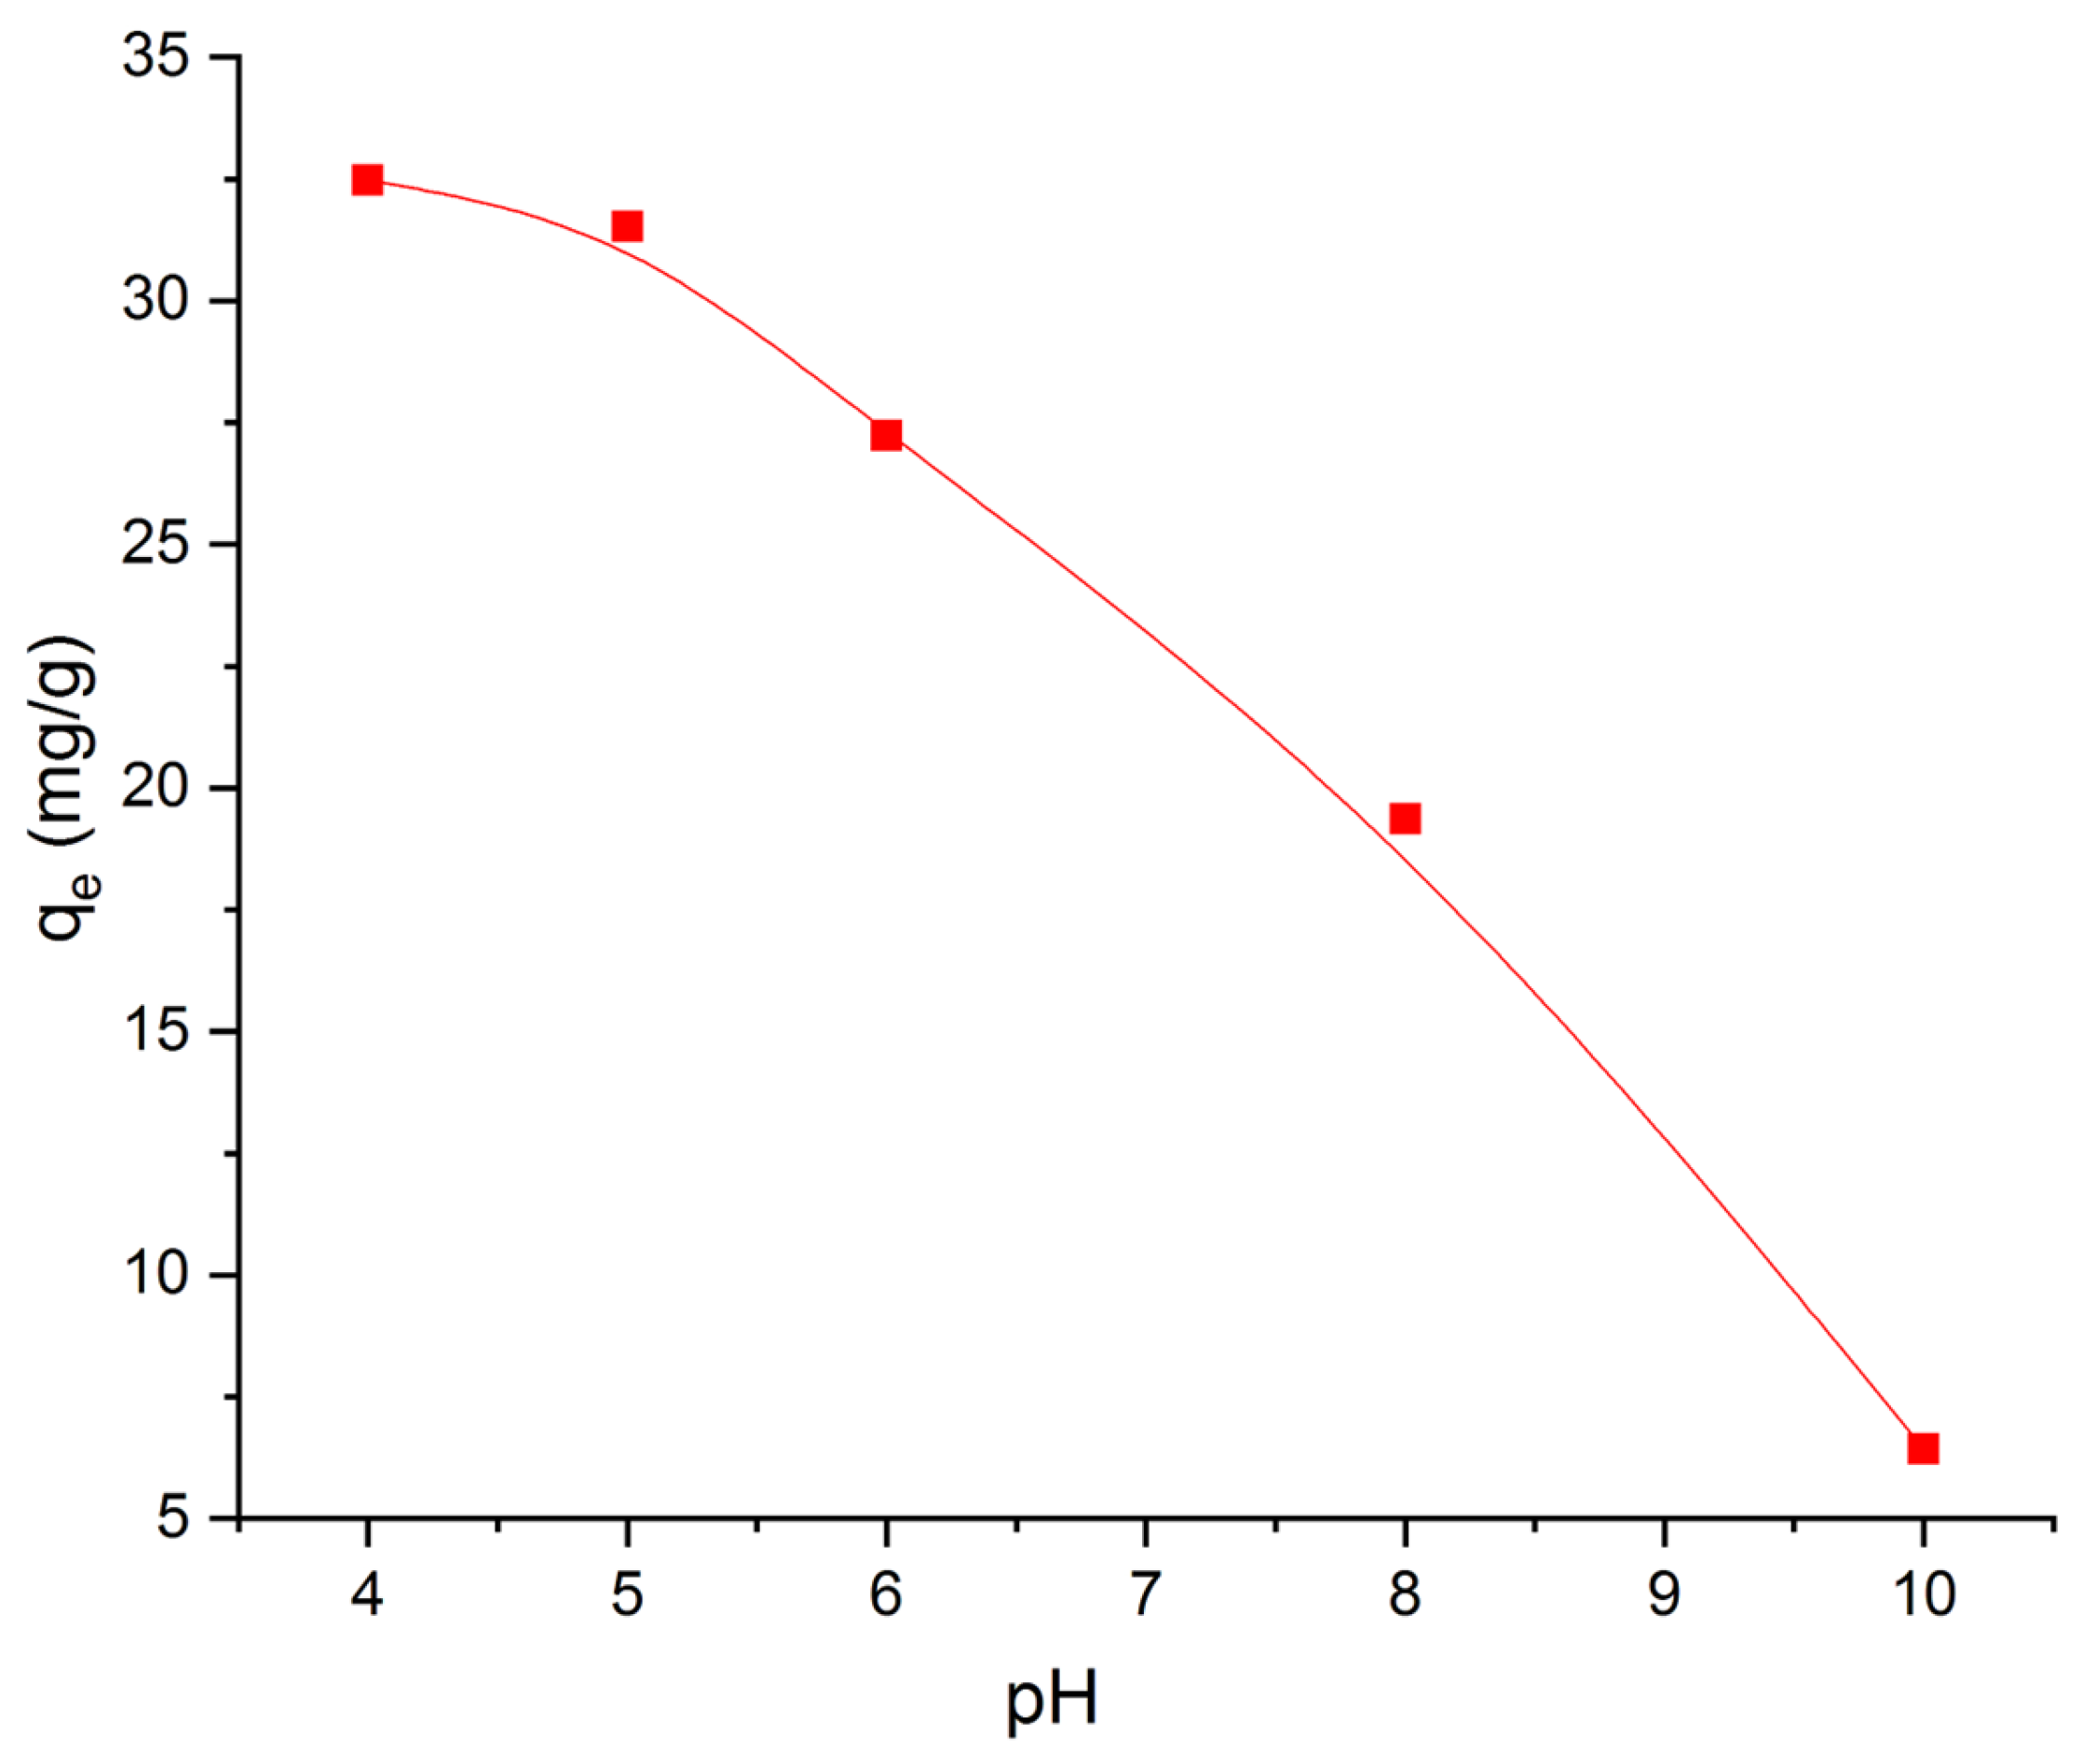
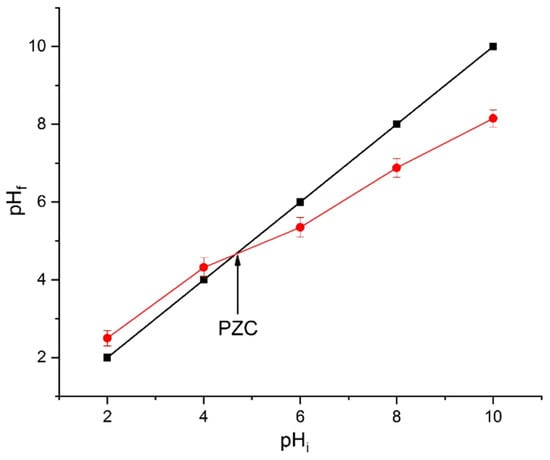
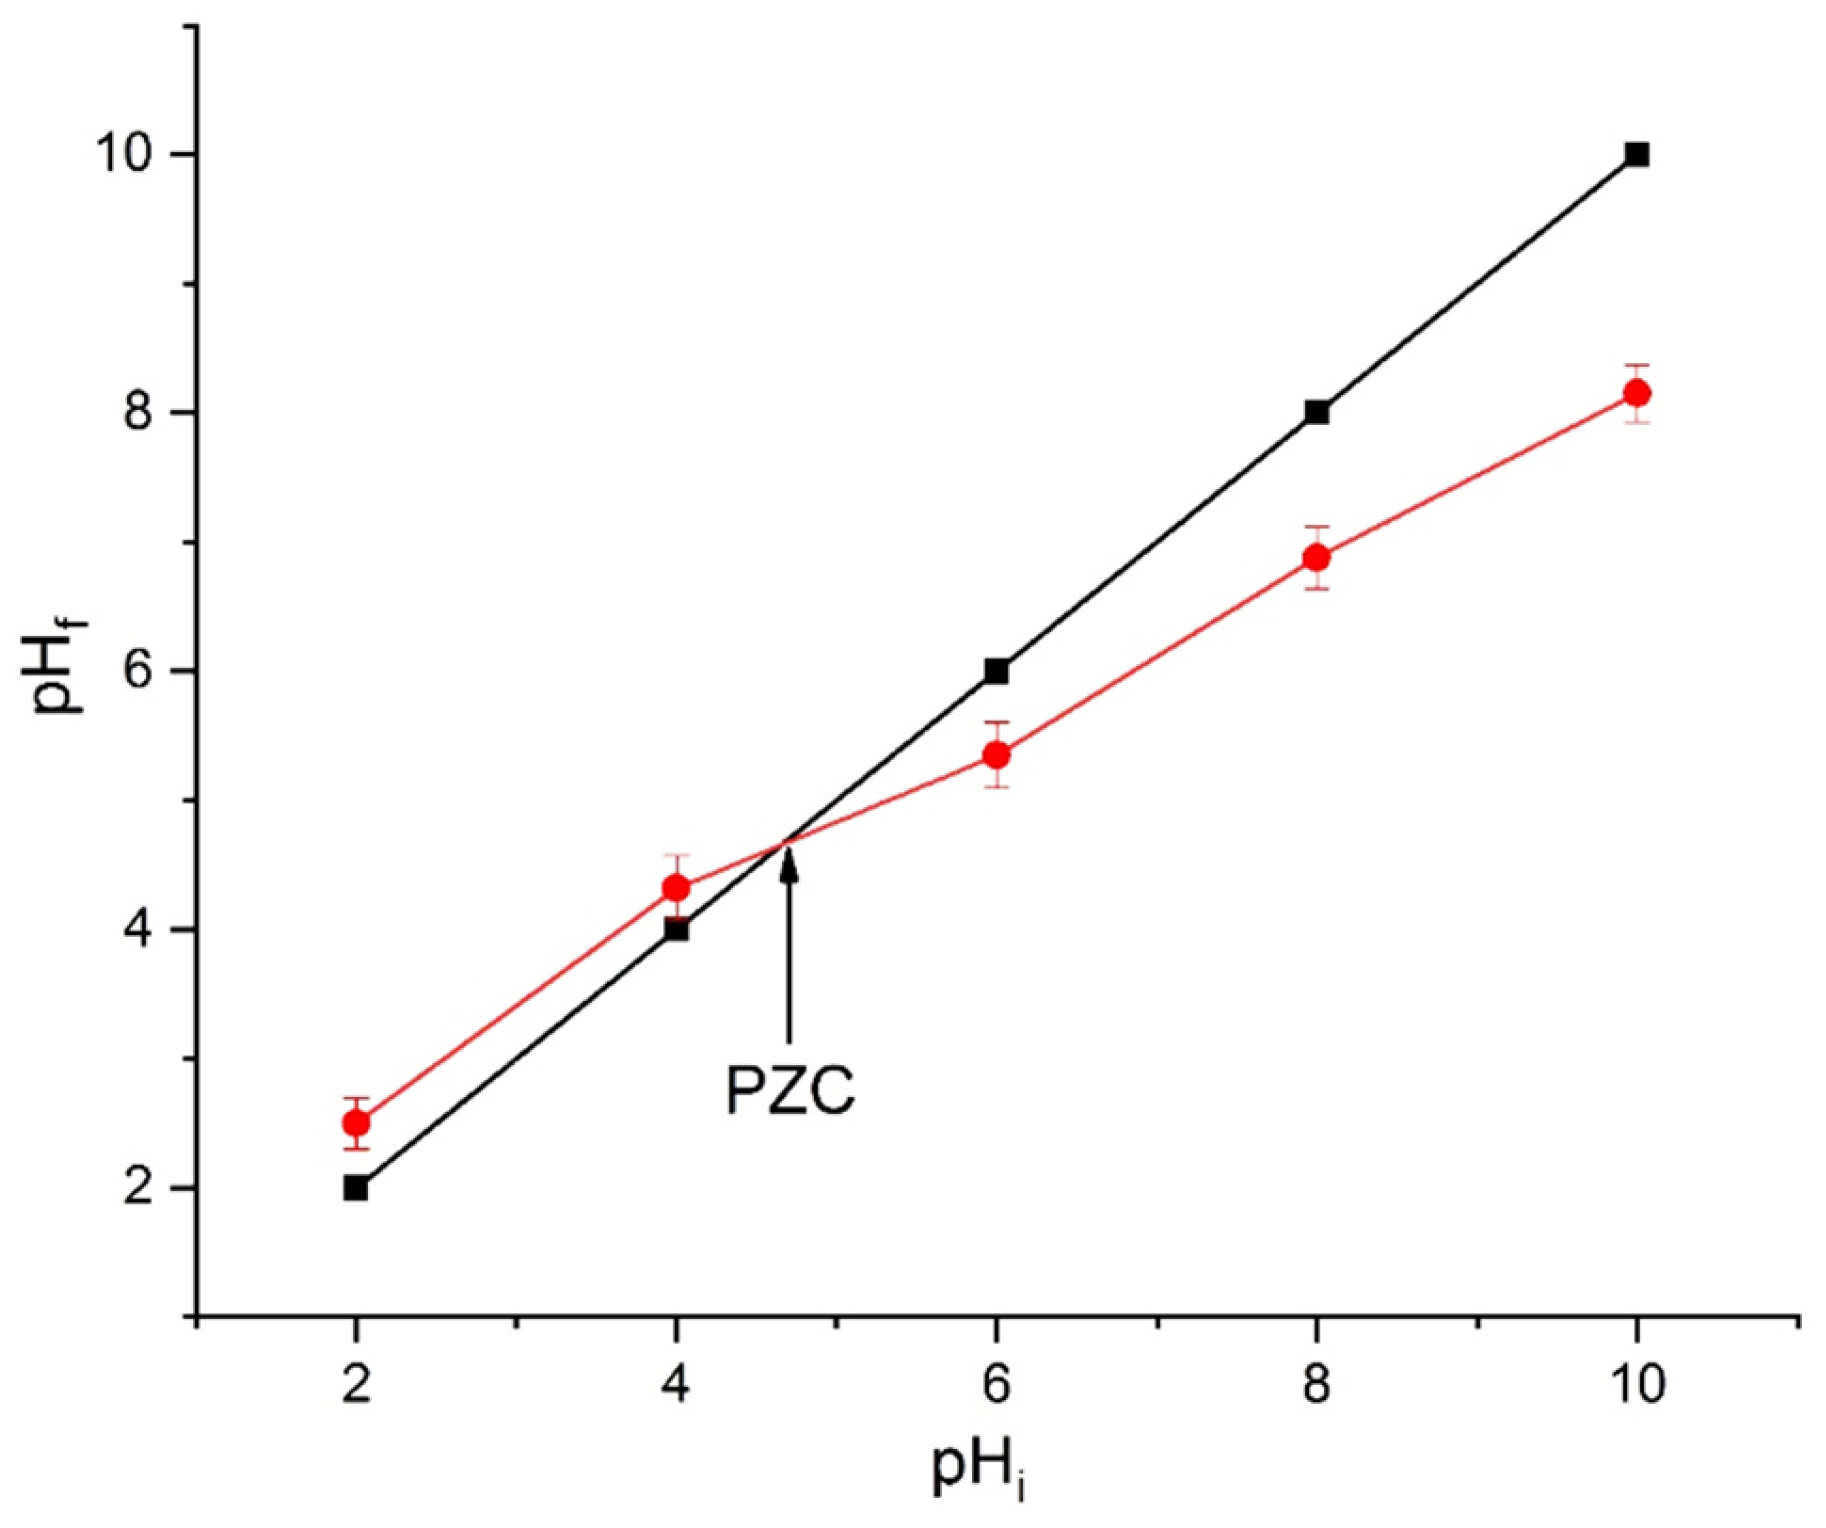
The influence of solution pH on the adsorption capacity of OII onto BN-CS was systematically investigated using an adsorbent dose of 0.5 g/L in a 25 mg/L dye solution over a pH range of 4–10. As shown in Figure 8, the adsorption capacity decreased progressively with increasing pH. The point of zero charge (pHPZC= 4.70) is indicated on the graph (Figure 9) as a reference for interpreting surface charge effects. At pH values below the pHPZC, the BN-CS surface is positively charged, favoring electrostatic attraction with the anionic OII molecules and resulting in higher adsorption capacities. As the pH approaches and exceeds the pHPZC, the surface charge becomes increasingly negative, reducing electrostatic interactions and thereby decreasing the adsorption efficiency. Above pH = 7, the surface is predominantly negatively charged, which further diminishes dye uptake due to electrostatic repulsion. These observations demonstrate that the adsorption of OII onto BN-CS is strongly governed by electrostatic interactions, with the pHPZC serving as a critical threshold for predicting the adsorbent’s charge state and its affinity toward anionic dyes. This mechanistic understanding provides a clear explanation for the observed pH-dependent adsorption behavior and can guide the optimization of operational conditions for efficient dye removal.
Figure 8.
Effect of pH on the adsorption capacity of OII by the studied adsorbents. Experiments were conducted using an OII solution (25 mg L−1) with an adsorbent dose of 0.5 g/L under stirring for 180 min.
Figure 9.
Determination of the point of zero charge (PZC) of BN clay by the pH drift method, showing the relationship between the initial pH (pHi) and the final pH (pHf).
3.4.3. Adsorption Kinetics
For the kinetic study, pseudo-first-order and pseudo-second-order models were investigated to evaluate the control mechanism of the OII adsorption process by BN-CS bead. The study was conducted under optimal conditions, including an OII concentration of 25 mg/L, a pH of 4, and a dose of 0.5 g/L.
The pseudo-first-order model consists of plotting the variation in ln(qe − qt) as a function of adsorption time (t) according to Formula (6):
where qe and qt are the adsorbed quantities of OII at the equilibrium time and at time t, and k1 is the rate of constant pseudo-first-order model. The plot representative of this kinetic model and its fitting data of are represented in Figure 10A.
The pseudo-second-order model consists of plotting the variation of with adsor tion time (t) using the Formula (7):
where k2 is the rate constant of the PSO model. Figure 10B shows the corresponding linear plot.
Based on the determination coefficients (R2) and the comparison between the calculated equilibrium adsorption capacities (qcal) and the experimental values (qexp) presented in Table 3, the adsorption kinetics are more accurately described by the pseudo-first-order (PFO) model. Although both kinetic models show relatively good linear correlations, the PFO model exhibits higher R2 values (>0.99) together with a closer agreement between qcal and qexp. This agreement demonstrates that the PFO model provides a more reliable prediction of the equilibrium adsorption capacity under the investigated conditions.
Figure 10.
Plots of pseudo-first-order (A) and pseudo-second-order (B) kinetic models for OII adsorption. The calculated equilibrium adsorption capacities (qcal) from the plots are compared with the experimental values (qexp) reported in Table 3.
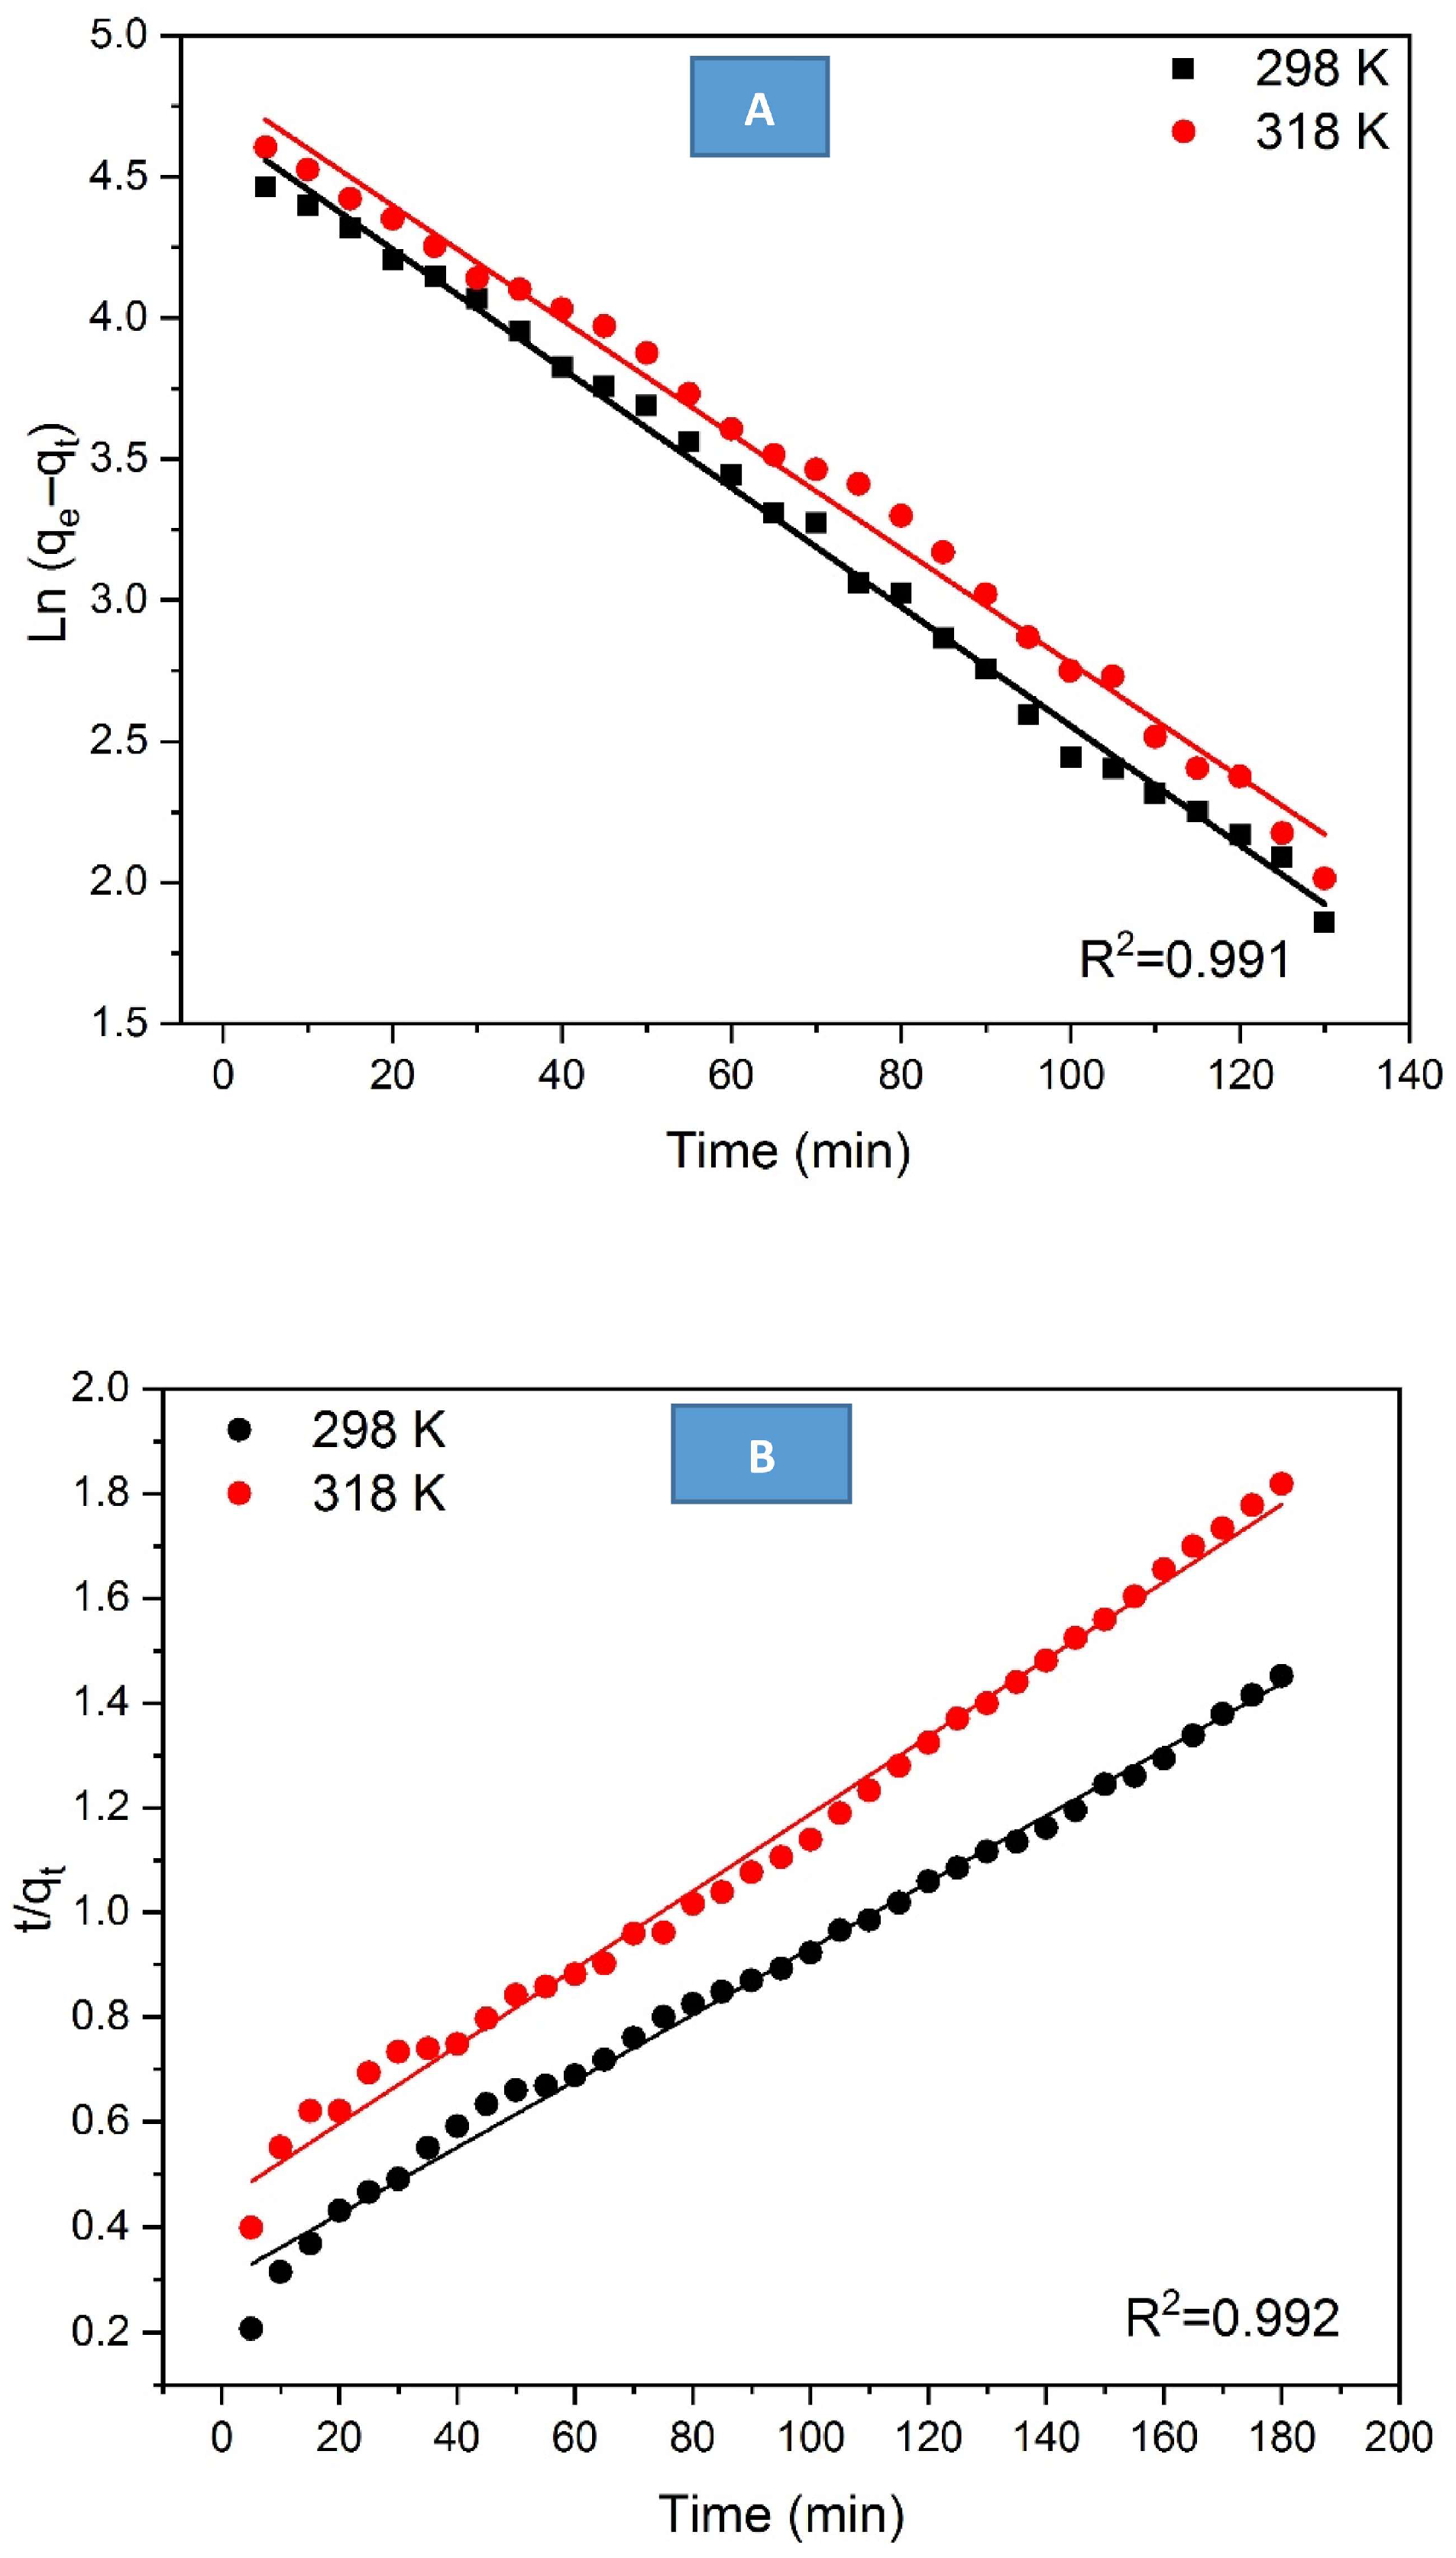
Table 3.
Kinetic data and parameter values associated with the kinetic models used.
In contrast, the pseudo-second-order (PSO) model presents slightly larger discrepancies between calculated and experimental qe values, indicating a comparatively lower predictive capability. Therefore, the selection of the PFO model is supported not only by linear regression analysis but also by the consistency between experimental and theoretical adsorption capacities.
The predominance of the PFO model suggests that the adsorption process may be primarily governed by diffusion-related mechanisms and physical interactions (physisorption). However, it should be emphasized that kinetic model fitting alone is not sufficient to definitively establish the adsorption mechanism. A more rigorous mechanistic interpretation would require complementary analyses, such as intraparticle diffusion modeling or mass transfer studies, to distinguish between film diffusion, pore diffusion, and surface interaction effects.
The equilibrium adsorption capacity (qexp) and the rate constant (k1) were determined from the slope and intercept of the linearized PFO plot and are summarized in Table 3.
3.4.4. Adsorption Isotherms
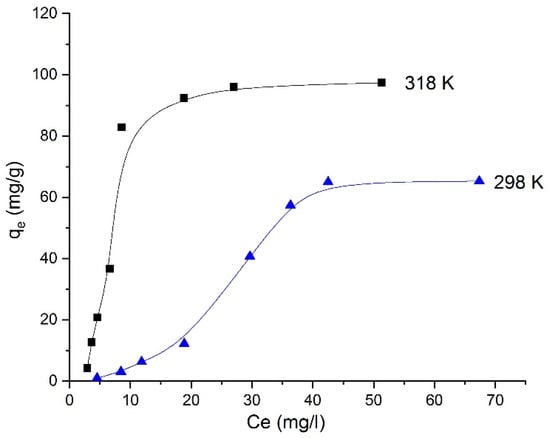
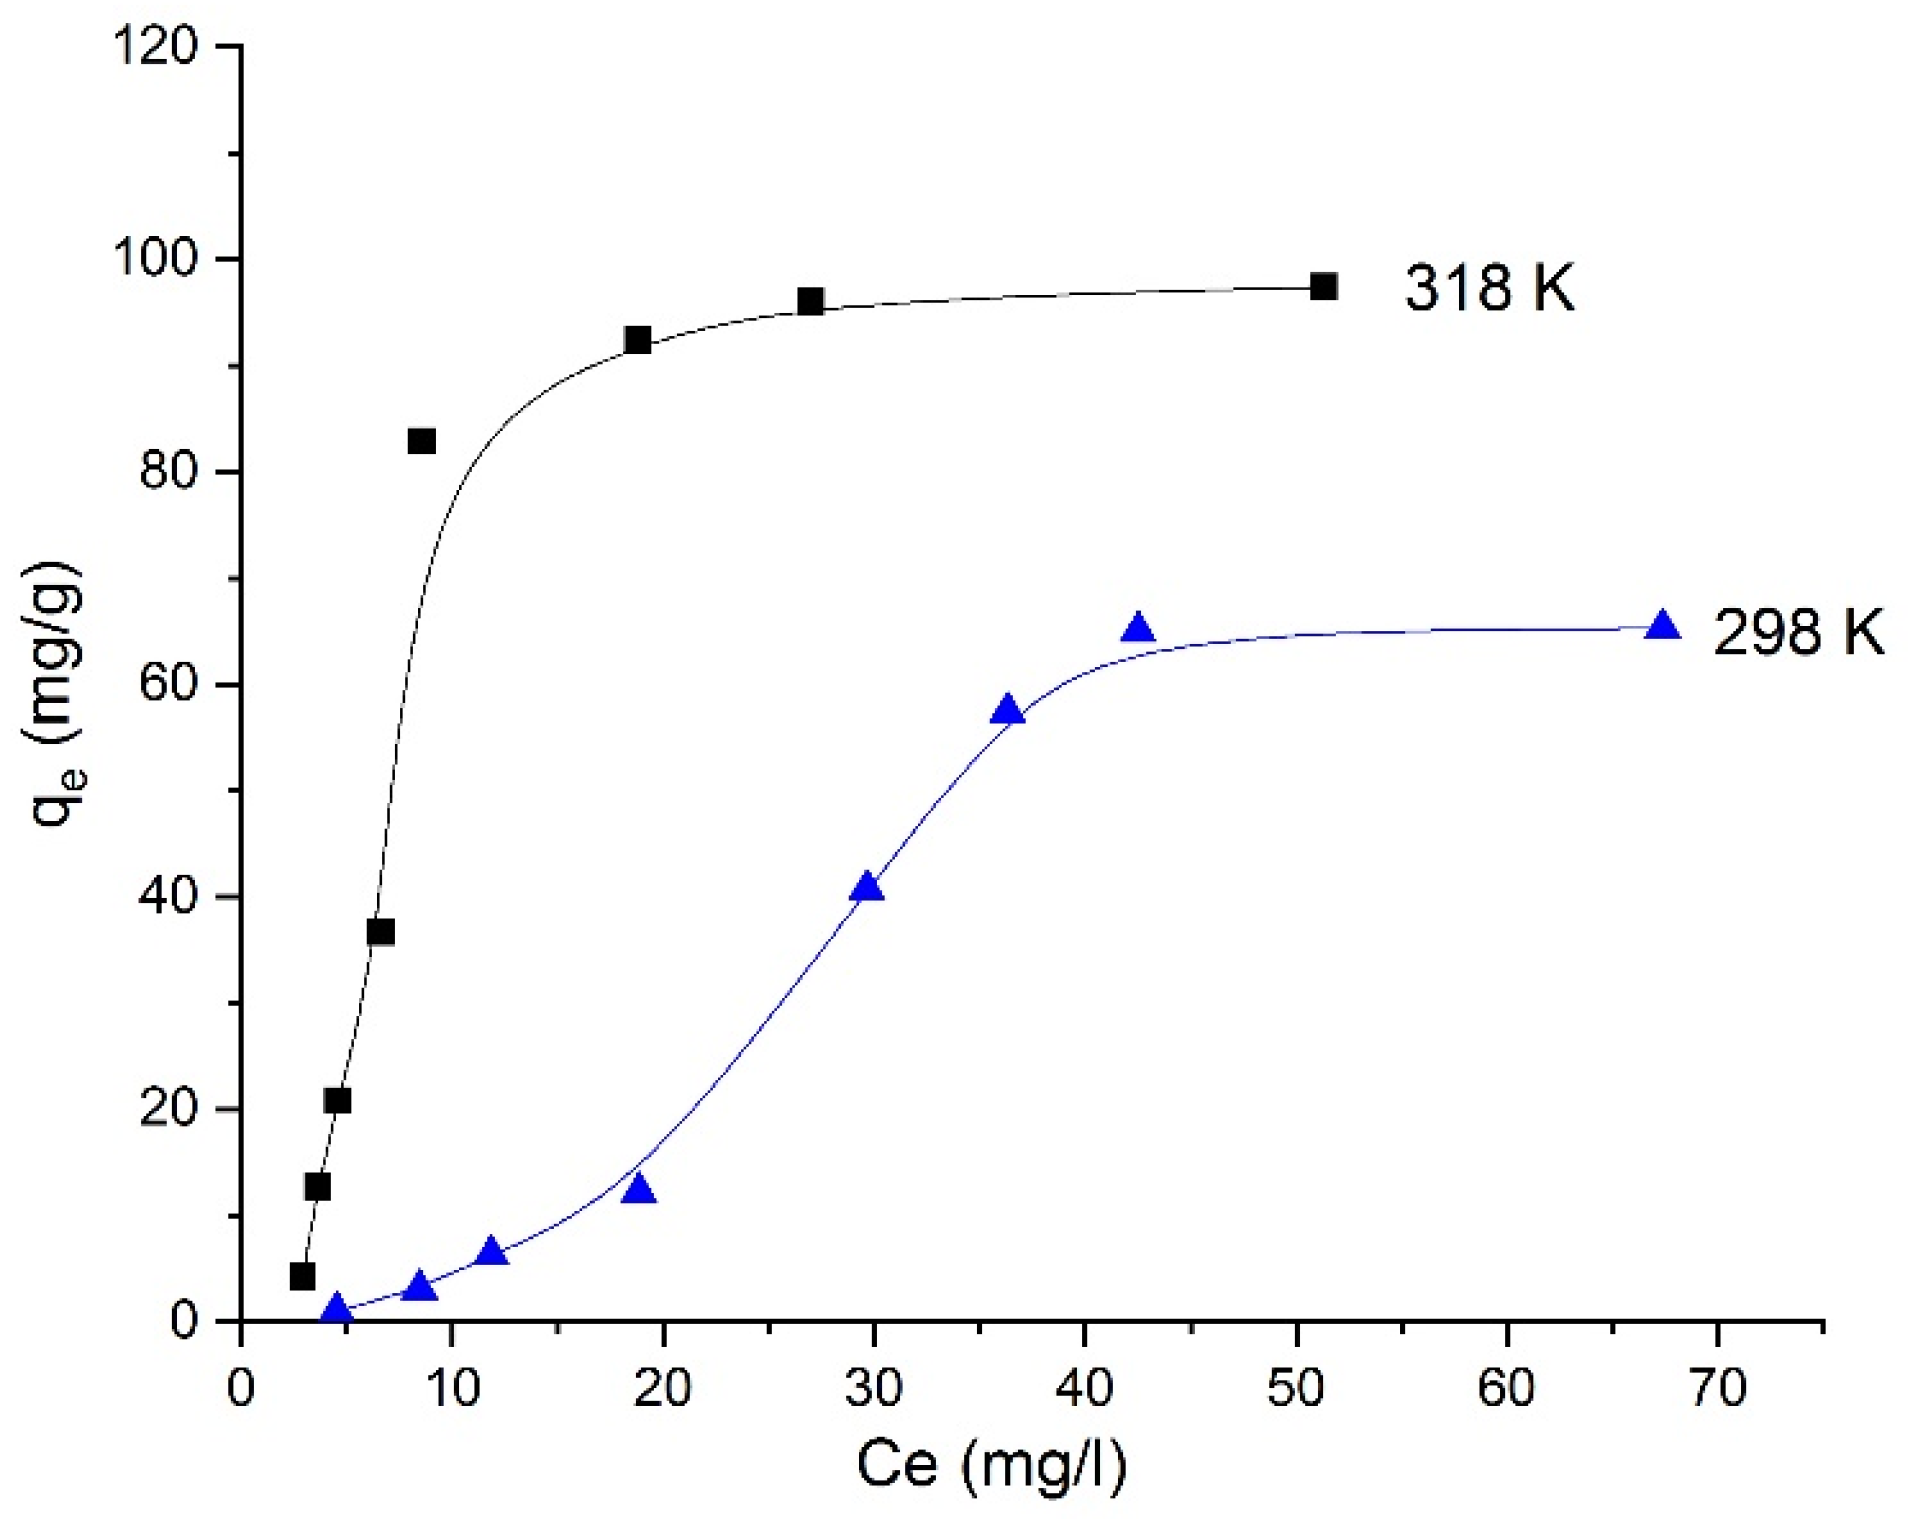
The adsorption isotherms of Orange II onto BN–CTS composite beads at 298 and 318 K are presented in Figure 11. The adsorption capacity (qe) increases with increasing equilibrium concentration (Ce) until reaching a plateau, indicating the progressive saturation of the available adsorption sites. Moreover, the adsorption capacity is significantly higher at 318 K than at 298 K, suggesting that increasing temperature enhances the adsorption process. This behavior indicates that the adsorption of Orange II on the composite beads is favored at higher temperatures, which is consistent with the endothermic nature of the process.
Figure 11.
Adsorption isotherms of Orange II on BN–CTS composite beads at 298 and 318 K, showing the variation in adsorption capacity (qe) as a function of equilibrium concentration (Ce).
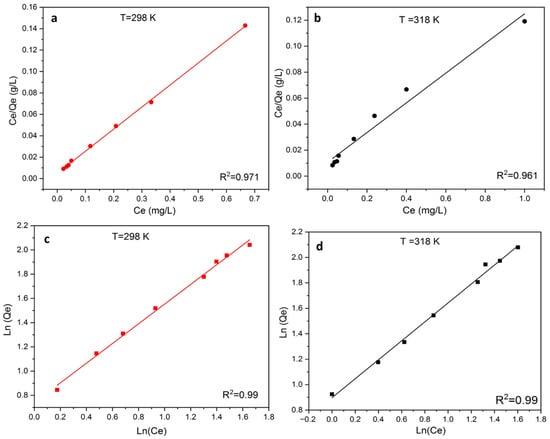
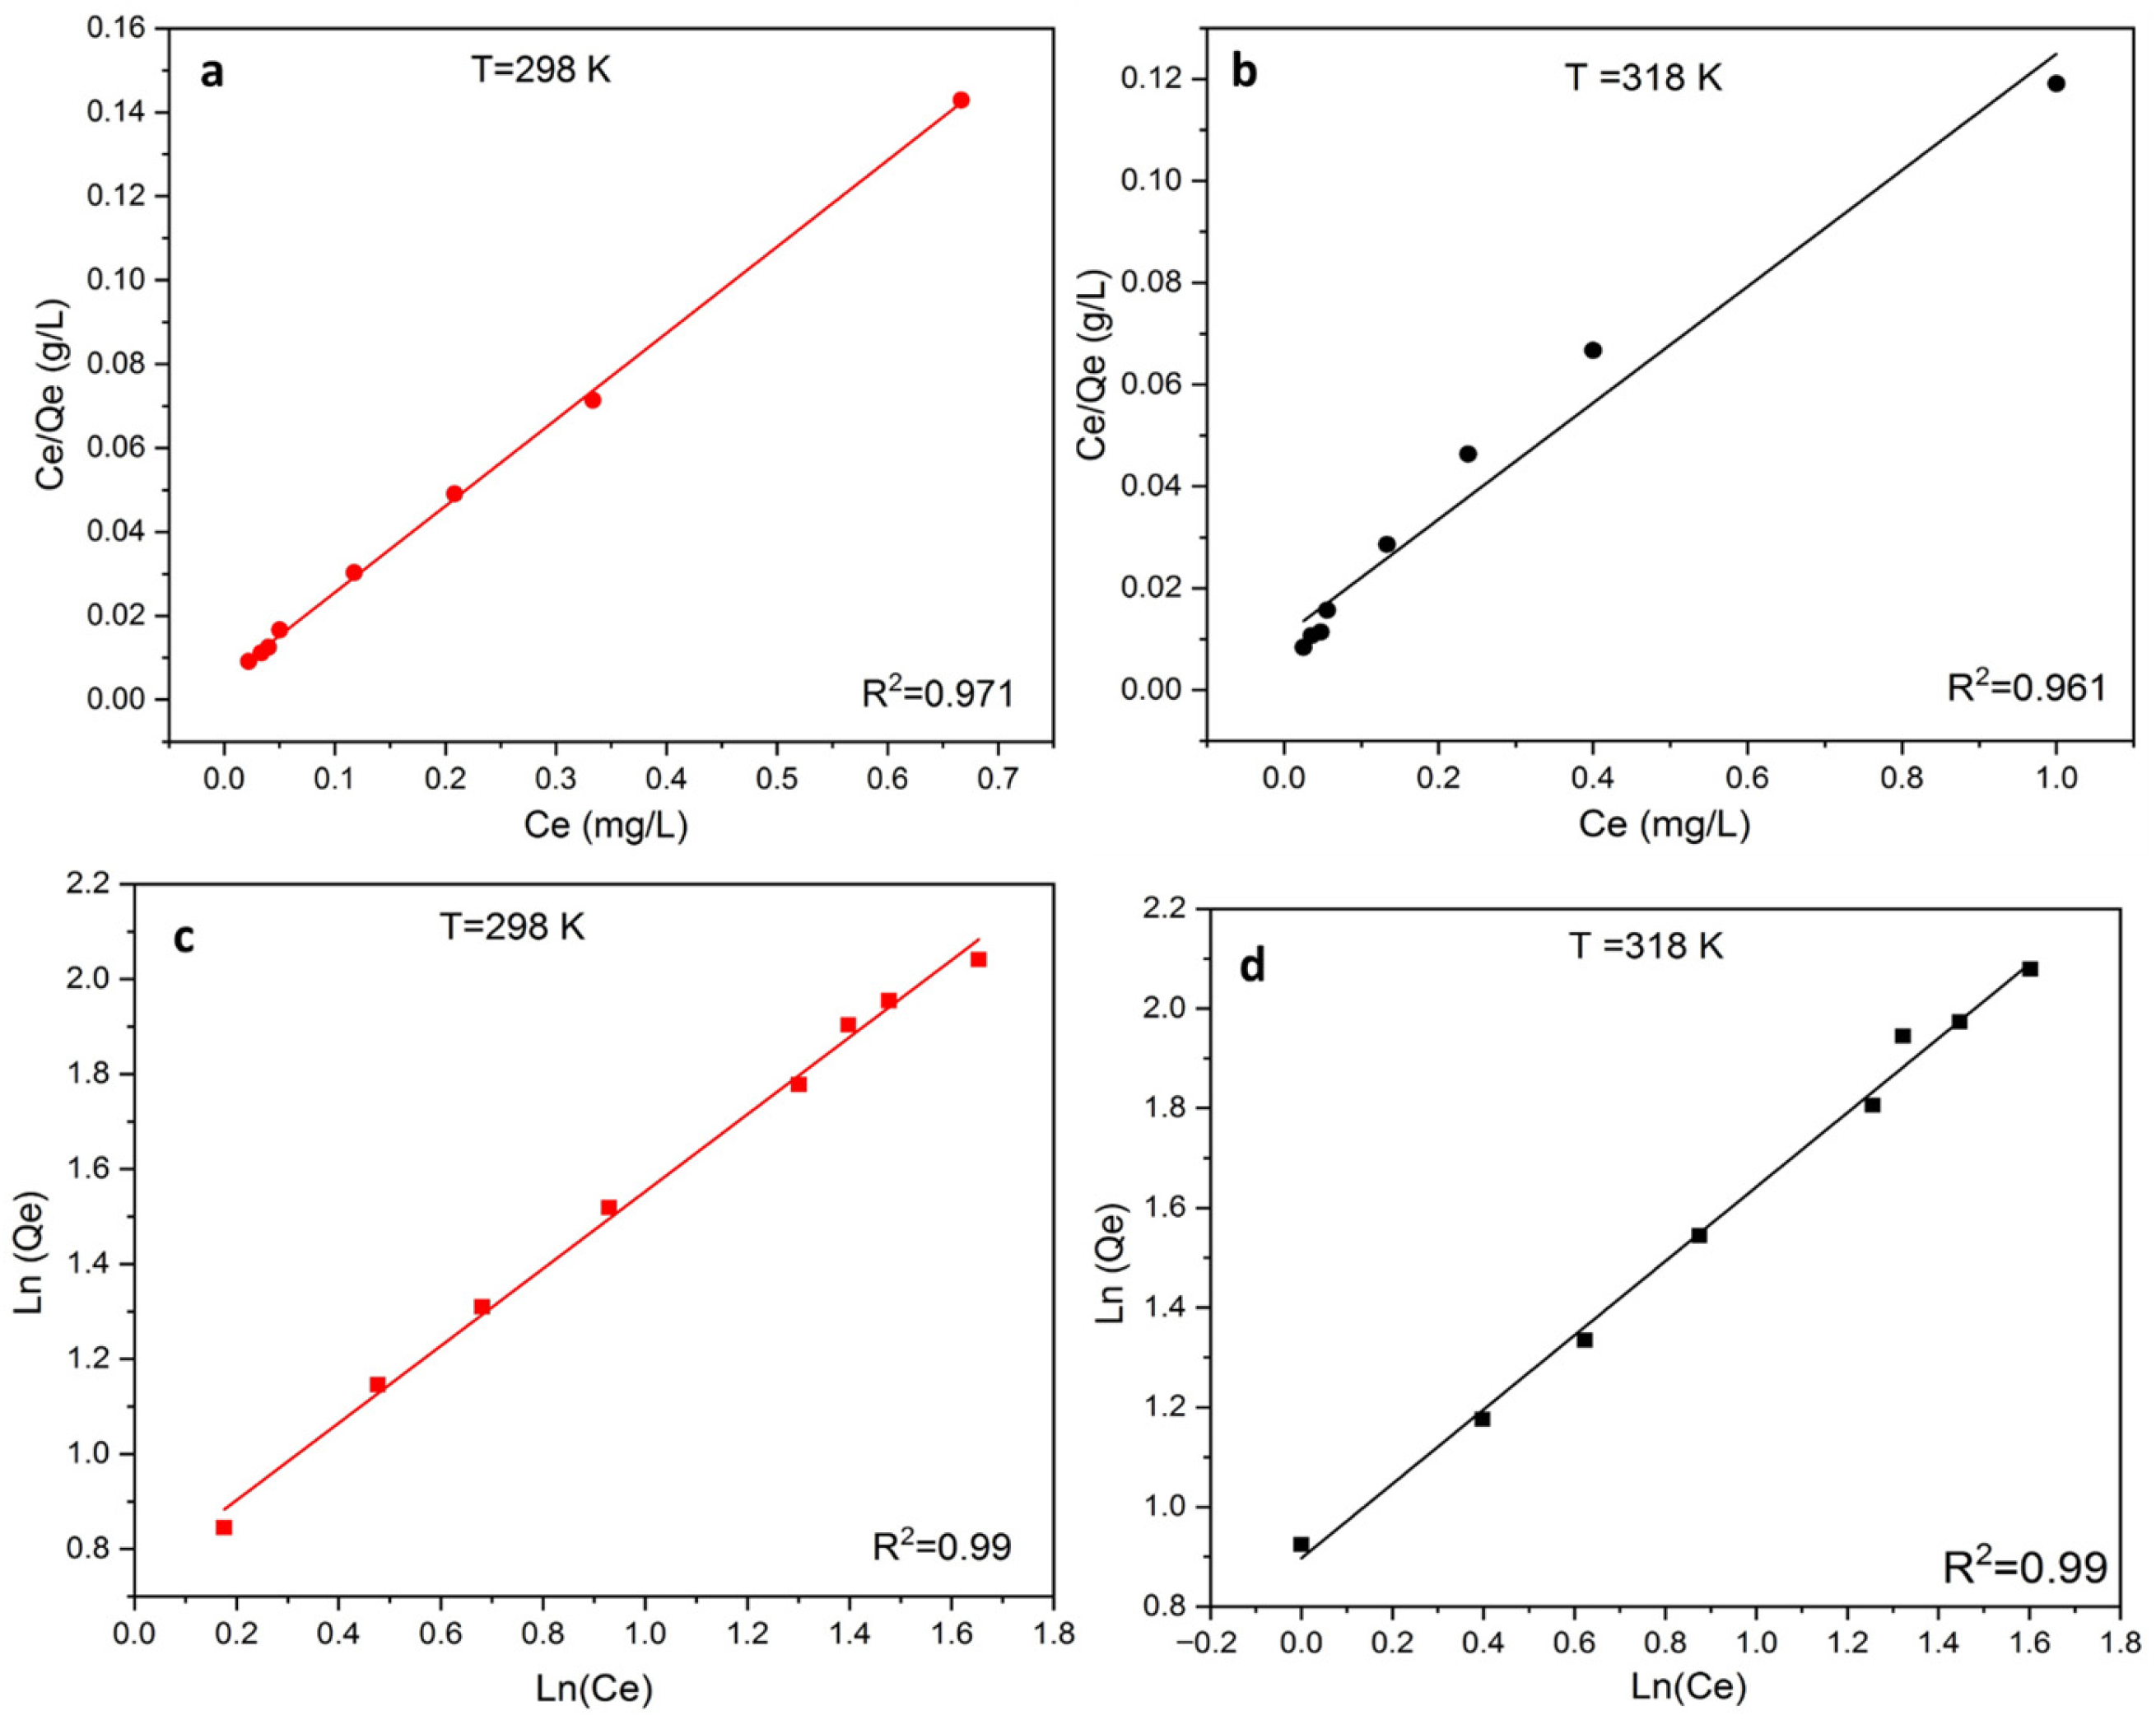
To gain deeper insight into the adsorption mechanism of Orange II (OII) onto BN–CS beads, the equilibrium data were analyzed using both Langmuir and Freundlich isotherm models (Figure 12). The Freundlich model exhibited higher correlation coefficients (R2 = 0.99) compared to the Langmuir model (R2 = 0.97 at 298 K and 0.96 at 318 K), indicating a better statistical fit to the experimental data. In addition to R2 values, the consistency of the model parameters was evaluated. The Freundlich constants KF, n, and 1/n (Table 4) confirm that the adsorption process is favorable (n > 1; 0 < 1/n < 1) and occurs on a heterogeneous surface with sites of varying adsorption energies. This behavior is consistent with the structural characteristics of the BN–CS composite, which combines the layered structure of bentonite with the irregular polymeric network of chitosan. Such heterogeneity favors multilayer adsorption rather than ideal monolayer coverage. Although the Langmuir model provides theoretical maximum adsorption capacities (qmax) of 98.35 mg/g at 298 K and 182.57 mg/g at 318 K, its lower R2 values and deviation from experimental trends suggest that the assumptions of homogeneous surface and monolayer adsorption are not strictly fulfilled. Therefore, the Langmuir qmax values should be interpreted as theoretical fitting parameters rather than definitive maximum capacities. Model selection was not based solely on R2 values. The physical relevance of the parameters, agreement with experimental equilibrium data, and consistency with the known structural heterogeneity of the composite were also considered. Additional statistical error analysis (e.g., comparison of residuals or deviation between experimental and calculated qe) supports the conclusion that the Freundlich model more adequately describes the adsorption behavior of OII on BN–CS beads.
Figure 12.
Langmuir (a,b) and Freundlich (c,d) isotherm plots for OII adsorption on the adsorbent at 298 K and 318 K.
Table 4.
Values of the parameters of the adsorption isotherm models used.
Thermodynamic analysis (Table 5) further supports the adsorption mechanism. The positive enthalpy change (ΔH° = 35.20 kJ/mol) indicates that the process is endothermic, which is consistent with the increase in adsorption capacity at higher temperature. The negative Gibbs free energy values (ΔG° < 0) confirm that the adsorption is spontaneous, while the positive entropy change (ΔS°) suggests increased randomness at the solid–liquid interface, likely due to the displacement of water molecules and structural rearrangements during dye uptake.
Table 5.
Thermodynamic data relating to the adsorption of OII by the bead studied.
The adsorption performance of the BN–CTS composite beads obtained in this study can be compared with other chitosan–clay-based adsorbents reported in the literature (Table 6). The maximum adsorption capacity obtained in the present work for Orange II reached 182.57 mg g−1 at 318 K, which is significantly higher than that reported for some chitosan-based hydrogels such as chitosan–alginate hydrogels (~6–7 mg g−1) for the same dye. It is also higher than several conventional chitosan–clay composites used for azo dye removal, such as chitosan–bentonite (~46.7 mg g−1) and chitosan/tannin–montmorillonite (~57.4 mg g−1). However, some modified or cross-linked systems, such as chitosan–saponin–bentonite composites (361 mg g−1), exhibit higher adsorption capacities due to additional functional groups or enhanced porosity. Overall, the relatively high adsorption capacity observed for the BN–CTS composite highlights the beneficial synergistic effect between chitosan functional groups and the layered structure of montmorillonite, which provides additional adsorption sites and improves the affinity toward azo dye molecules. These results demonstrate that the developed composite is a competitive and efficient adsorbent for the removal of azo dyes from aqueous solutions.
Table 6.
Performance comparison of chitosan–clay composites for azo dyes.
3.5. Cycle Adsorption/Desorption
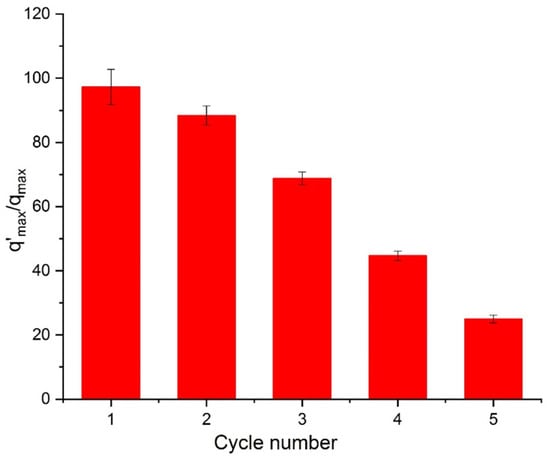
The long-term performance of an adsorbent, particularly its stability and reusability, is a key factor in determining its suitability for real-world applications such as wastewater treatment. In this study, the reusability of BN-CS bead was evaluated under optimal conditions for OII adsorption, as illustrated in Figure 13. Following each adsorption cycle, the beads were regenerated by immersion in a saline solution for one hour at neutral pH (pH = 7), then dried at 80 °C for four hours. This regeneration procedure was repeated for six consecutive cycles using the same BN-CS material. The adsorption performance across cycles is depicted in Figure 10. The data show that the adsorbed amount of OII remained relatively consistent through the first four cycles. However, a noticeable decline in adsorption capacity was observed after the fourth reuse. Despite this reduction, the BN-CS bead still exhibited a satisfactory level of efficiency up to the fourth cycle. This behavior may be attributed to the structural integrity of the chitosan–clay composite. The chitosan chains tightly bonded to the bentonite particles, particularly those intercalated within the clay layers, likely maintained their adsorption properties even after repeated use. These findings suggest that BN-CS beads exhibit promising regeneration potential, allowing multiple cycles of OII removal before significant performance loss occurs.
Figure 13.
Variation in the amount of OII released by the OII-loaded CS-BN bead as a function of time.
4. Conclusions
The results of this study lead to the following conclusions:
(i) The incorporation of montmorillonite into the chitosan matrix promoted favorable electrostatic interactions between the protonated amine groups (–NH3+) of chitosan and the negatively charged sites of the clay. Together with the intrinsic flexibility of the montmorillonite layers, these interactions governed bead formation, resulting in smooth surfaces and a wavy microstructure. Structural analyses confirmed the absence of chitosan intercalation into the clay interlayers, while sodium ions associated with the homoionic montmorillonite remained confined within the bead matrix. (ii) The adsorption efficiency toward Orange II (OII) was significantly enhanced at low adsorbent dosage (0.5 g L−1) and under acidic conditions (pH 4.5). This behavior was attributed to improved dispersion of the adsorbent particles and an increased positive surface charge density. (iii) Adsorption kinetics were rapid and best described by the pseudo-first-order model, indicating that diffusion was the dominant rate-limiting step. (iv) Equilibrium adsorption data showed a strong fit to the Freundlich isotherm model, suggesting a multilayer adsorption process on a heterogeneous surface. The maximum adsorption capacities reached between 98.35 and 182.57 mg/g at 25 °C and 45 °C, respectively. Moreover, the adsorption process was endothermic, as indicated by the positive standard enthalpy value (ΔH° = 35.20 kJ/mol), and occurred spontaneously, as confirmed by the negative Gibbs free energy values (ΔG° < 0). These thermodynamic parameters point to a physisorption mechanism. (v) Reusability experiments demonstrated that BN-CS beads maintained high adsorption efficiency over four successive adsorption–desorption cycles, highlighting their good stability and regeneration potential.
Author Contributions
Conceptualization, A.M.; Methodology, A.M.; Software, A.M., M.O. and N.E.; Validation, M.O., N.E. and A.A.; Formal analysis, A.M.; Investigation, A.M.; Resources, A.M., M.O. and N.E.; Data curation, N.E. and A.A.; Writing—original draft, A.M.; Writing—review & editing, A.M.; Visualization, M.O. and N.E.; Supervision, N.E. and A.A.; Project administration, A.M.; Funding acquisition, A.M. All authors have read and agreed to the published version of the manuscript.
Funding
This research received no external funding.
Data Availability Statement
The raw data supporting the conclusions of this article will be made available by the authors on request.
Conflicts of Interest
The authors declare no conflict of interest.
References
- Singh, R.L.; Singh, P.K.; Singh, R.P. Enzymatic Decolorization and Degradation of Azo Dyes—A Review. Int. Biodeterior. Biodegrad. 2015, 104, 21–31. [Google Scholar] [CrossRef] [Scilit]
- Louati, I.; Elloumi-Mseddi, J.; Cheikhrouhou, W.; Hadrich, B.; Nasri, M.; Aifa, S.; Woodward, S.; Mechichi, T. Simultaneous. Cleanup of Reactive Black 5 and Cadmium by a Desert Soil Bacterium. Ecotoxicol. Environ. Saf. 2020, 190, 110103. [Google Scholar] [CrossRef] [Scilit]
- Li, W.; Mu, B.; Yang, Y. Feasibility of Industrial-Scale Treatment of Dye Wastewater via Bio-Adsorption Technology. Bioresour. Technol. 2019, 277, 157–170. [Google Scholar] [CrossRef] [Scilit] [PubMed]
- Zhang, L.; Shao, Q.; Xu, C. Enhanced Azo Dye Removal from Wastewater by Coupling Sulfidated Zero-Valent Iron with a Chelator. J. Clean. Prod. 2019, 213, 753–761. [Google Scholar] [CrossRef] [Scilit]
- Sarkar, S.; Banerjee, A.; Halder, U.; Biswas, R.; Bandopadhyay, R. Degradation of synthetic azo dyes of textile industry: A Sustainable Approach using Microbial Enzymes. Water Conserv. Sci. Eng. 2007, 2, 121–131. [Google Scholar] [CrossRef] [Scilit]
- Bafana, A.; Devi, S.S.; Chakrabarti, T. Azo dyes: Past, present and the future. Environ. Rev. 2011, 19, 350–370. [Google Scholar] [CrossRef] [Scilit]
- Saratale, R.G.; Saratale, G.D.; Chang, J.S.; Govindwar, S.P. Bacterial decolorization and degradation of azo dyes: A review. J. Taiwan Inst. Chem. Eng. 2011, 42, 138–157. [Google Scholar] [CrossRef] [Scilit]
- Sithole, T. A review on regeneration of adsorbent and recovery of metals: Adsorbent disposal and regeneration mechanism. S. Afr. J. Chem. Eng. 2024, 50, 39–50. [Google Scholar]
- Naseer, A.; Younas, F.; Munir, R.; Sardar, M.F.; Noreen, S.; Cui, Z. Clay-based nanocomposite materials used in treatment of wastewater: Recent advancements, cost investigation and future perspectives. Sep. Purif. Rev. 2025, 54, 149–166. [Google Scholar]
- Hussain, E.; Ahtesham, A.; Shahadat, M.; Ibrahim, M.N.M.; Ismail, S. Recent advances of Clay/polymer-based nanomaterials for the treatment of environmental contaminants in wastewater: A review. J. Environ. Chem. Eng. 2024, 12, 112401. [Google Scholar] [CrossRef] [Scilit]
- Zango, Z.U.; Garba, A.; Garba, Z.N.; Zango, M.U.; Usman, F.; Lim, J.W. Montmorillonite for adsorption and catalytic elimination of pollutants from Wastewater: A State-of-the-Arts review. Sustainability 2022, 14, 16441. [Google Scholar] [CrossRef] [Scilit]
- Al Kausor, M.; Gupta, S.S.; Bhattacharyya, K.G.; Chakrabortty, D. Montmorillonite and modified montmorillonite as adsorbents for removal of watersoluble organic dyes: A review on current status of the art. Inorg. Chem. Commun. 2022, 143, 109686. [Google Scholar] [CrossRef] [Scilit]
- Wang, R.; Li, H.; Ge, G.; Dai, N.; Rao, J.; Ran, H.; Zhang, Y. Montmorillonite-based two-dimensional nanocomposites: Preparation and applications. Molecules 2021, 26, 2521. [Google Scholar] [CrossRef] [Scilit]
- Kumar, K.N.; Babu, P.D. Experimental study of mechanical, morphological and thermal performance of bamboo-reinforced polylactic acid-based montmorillonite clay hybrid composite. Ind. Crops Prod. 2024, 209, 117950. [Google Scholar] [CrossRef] [Scilit]
- Chen, J.; Lu, J.; Jiang, S.Y.; Lee, C.H.; Li, Y.; Ruan, H.D. The effect of modifier adding sequence on physical-chemical property and adsorption ability of Inorganic-Organic Montmorillonite (IOMMt). J. Environ. Chem. Eng. 2023, 11, 110115. [Google Scholar] [CrossRef] [Scilit]
- Yang, W.; Xia, X.; Liu, X.; Zhang, S. Interlayer structure and dynamic properties of CTMAB–montmorillonite: Experiment and molecular dynamics. RSC Adv. 2023, 13, 13324–13336. [Google Scholar] [CrossRef] [Scilit]
- Shubbar, A.A.; Sadique, M.; Kot, P.; Atherton, W. Future of clay-based construction materials–A review. Constr. Build. Mater. 2019, 210, 172–187. [Google Scholar] [CrossRef] [Scilit]
- Rinaudo, M. Chitin and chitosan: Properties and applications. Prog. Polym. Sci. 2006, 31, 603–632. [Google Scholar] [CrossRef] [Scilit]
- Shahidi, F.; Abuzaytoun, R. Chitin, chitosan, and co-products: Chemistry, production, applications, and health effects. Adv. Food Nutr. Res. 2005, 49, 93–135. [Google Scholar] [PubMed]
- Iber, B.T.; Kasan, N.A.; Torsabo, D.; Omuwa, J.W. A review of various sources of chitin and chitosan in nature. J. Renew. Mater. 2022, 10, 1097. [Google Scholar] [CrossRef] [Scilit]
- Lingait, D.; Rahagude, R.; Gaharwar, S.S.; Das, R.S.; Verma, M.G.; Srivastava, N.; Kumar, A.; Mandavgane, S. A review on versatile applications of biomaterial/polycationic chitosan: An insight into the structure-property relationship. Int. J. Biol. Macromol. 2023, 257, 128676. [Google Scholar] [CrossRef] [Scilit]
- Mourak, A.; Hajjaji, M.; Alagui, A.; Martin, P.; Joly, N. Effects of geomaterial-originated fillers on microstructure and mechanical/physical properties of α- and β-chitosan-based films. Molecules 2021, 26, 7514. [Google Scholar] [CrossRef] [Scilit]
- Nouri, A.; Yaraki, M.T.; Ghorbanpour, M.; Agarwal, S.; Gupta, V.K. Enhanced Antibacterial effect of chitosan film using Montmorillonite/CuO nanocomposite. Int. J. Biol. Macromol. 2018, 109, 1219–1231. [Google Scholar] [CrossRef] [Scilit] [PubMed]
- dos Santos, B.R.; Bacalhau, F.B.; dos Santos Pereira, T.; Souza, C.F.; Faez, R. Chitosan-montmorillonite microspheres: A sustainable fertilizer delivery system. Carbohydr. Polym. 2015, 127, 340–346. [Google Scholar] [CrossRef] [Scilit] [PubMed]
- Zhang, Y.; Xue, C.; Xue, Y.; Gao, R.; Zhang, X. Determination of the degree of deacetylation of chitin and chitosan by X-ray powder diffraction. Carbohydr. Res. 2005, 340, 1914–1917. [Google Scholar] [CrossRef] [Scilit]
- Mourak, A.; Hajjaji, M.; Alagui, A. Preparation and characterization of chitosan clay beads for water adsorption. Sci. Rep. 2025, 15, 29463. [Google Scholar] [CrossRef] [Scilit] [PubMed]
- Segal, L.G.; Creely, J.J.; Martin, J.A.E.; Conrad, C.M. An empirical method for estimating the degree of crystallinity of native cellulose using the X-ray diffractometer. Text. Res. J. 1957, 29, 786–794. [Google Scholar] [CrossRef] [Scilit]
- Monshi, A.; Foroughi, M.R.; Monshi, M.R. Modified Scherrer equation to estimate more accurately nano-crystallite size using XRD. World J. Nano Sci. Eng. 2012, 2, 154–160. [Google Scholar] [CrossRef]
- Brugnerotto, J.; Lizardi, J.; Goycoolea, F.M.; Arguelles-Monal, W.; Desbrieres, J.; Rinaudo, M. An infrared investigation in relation with chitin and chitosan characterization. Polymer 2001, 42, 3569–3580. [Google Scholar] [CrossRef] [Scilit]
- Tolaimate, A.; Desbrières, J.; Rhazi, M.; Alagui, A. Contribution to the preparation of chitins and chitosans with controlled physicochemical properties. Polymer 2003, 44, 7939–7952. [Google Scholar] [CrossRef] [Scilit]
- Kumar, M.N.V.R. A review of chitin and chitosan applications. React. Funct. Polym. 2000, 46, 1–27. [Google Scholar] [CrossRef] [Scilit]
- Aran, D.; Maul, A.; Masfaraud, J.F. A spectrophotometric measurement of soil cation exchange capacity based on cobaltihexamine chloride absorbance. Comptes Rendus Geosci. 2008, 340, 865–871. [Google Scholar] [CrossRef] [Scilit]
- Bakatula, E.N.; Richard, D.; Neculita, C.M.; Zagury, G.J. Determination of point of zero charge of natural organic materials. Environ. Sci. Pollut. Res. 2018, 25, 7823–7833. [Google Scholar] [CrossRef] [Scilit]
- Ulbrich, K.F.; Nishida, E.N.; Souza, B.S.; Campos, C.E.M. NiS2-NiS nanocrystalline composite synthesized by mechanochemistry and its performance for methylene blue dye adsorption. Mater. Chem. Phys. 2020, 252, 123226. [Google Scholar] [CrossRef] [Scilit]
- Ouaddari, H.; Abbou, B.; Lebkiri, I.; Habsaoui, A.; Ouzzine, M.; Fath Allah, R. Removal of Methylene Blue by adsorption onto natural and purified clays: Kinetic and thermodynamic study. Chem. Phys. Impact 2024, 8, 100405. [Google Scholar] [CrossRef] [Scilit]
- Hu, C.; Deng, Y.; Hu, H.; Duan, Y.; Zhai, K. Adsorption and intercalation of low and medium molar mass chitosans on/in the sodium montmorillonite. Int. J. Biol. Macromol. 2016, 92, 1191–1196. [Google Scholar] [CrossRef] [Scilit] [PubMed]
- Huang, H.J.; Huang, S.Y.; Wang, T.H.; Lin, T.Y.; Huang, N.C.; Shih, O.; Jeng, U.; Chu, C.; Chiang, W.H. Clay nanosheets simultaneously intercalated and stabilized by PEGylated chitosan as drug delivery vehicles for cancer chemotherapy. Carbohydr. Polym. 2023, 302, 120390. [Google Scholar] [CrossRef] [Scilit]
- Vassalini, I.; Maddaloni, M.; Depedro, M.; De Villi, A.; Ferroni, M.; Alessandri, I. From Water for Water: PEDOT: PSS-Chitosan Beads for Sustainable Dyes Adsorption. Gels 2024, 10, 37. [Google Scholar] [CrossRef] [Scilit]
- Xie, G.; Fu, L.; Gu, S.; Bai, Y.; Wang, P.; Ge, J.; Zhao, J. Investigation on the interlayer intercalation inhibition mechanism of polyamines with different adsorption functional groups on montmorillonite: Experiment and density functional theory simulation. Geoenergy Sci. Eng. 2024, 233, 212532. [Google Scholar] [CrossRef] [Scilit]
- Miyah, Y.; Idrissi, M.; Zerrouq, F. Study and modeling of the kinetics methylene blue adsorption on the clay adsorbents (Pyrophillite, Calcite). J. Mater. Environ. Sci. 2015, 6, 699–712. [Google Scholar]
- Unuabonah, E.I.; Adie, G.U.; Onah, L.O.; Adeyemi, O.G. Multistage optimization of the adsorption of methylene blue dye onto defatted Carica papaya seeds. Chem. Eng. J. 2009, 155, 567–579. [Google Scholar] [CrossRef] [Scilit]
- Laysandra, L.; Ondang, I.J.; Ju, Y.H.; Ariandini, B.H.; Mariska, A.; Soetaredjo, F.E.; Putro, J.N.; Santoso, S.P.; Darsono, F.L.; Ismadji, S. Highly adsorptive chitosan/saponin-bentonite composite film for removal of methyl orange and Cr (VI). Environ. Sci. Pollut. Res. 2019, 26, 5020–5037. [Google Scholar] [CrossRef] [Scilit]
- Tahari, N.; de Hoyos-Martinez, P.L.; Izaguirre, N.; Houwaida, N.; Abderrabba, M.; Ayadi, S.; Labidi, J. Preparation of chitosan/tannin and montmorillonite films as adsorbents for Methyl Orange dye removal. Int. J. Biol. Macromol. 2022, 210, 94–106. [Google Scholar] [CrossRef] [Scilit]
- Simion, A.I.; Grigoraș, C.G.; Favier, L. Batch adsorption of orange II dye on a new green hydrogel—Study on working parameters and process enhancement. Gels 2025, 11, 79. [Google Scholar] [CrossRef] [Scilit]

Disclaimer/Publisher’s Note: The statements, opinions and data contained in all publications are solely those of the individual author(s) and contributor(s) and not of MDPI and/or the editor(s). MDPI and/or the editor(s) disclaim responsibility for any injury to people or property resulting from any ideas, methods, instructions or products referred to in the content. |
© 2026 by the authors. Licensee MDPI, Basel, Switzerland. This article is an open access article distributed under the terms and conditions of the Creative Commons Attribution (CC BY) license.