


Abstract
We examined the effects of combining resistance training (RT) with semaglutide use on body composition, metabolism, strength, and muscle thickness and quality. Men and women (n = 11) aged 30–55 years participated in this study. Measurements included resting metabolic rate, body composition, fasting blood glucose, HbA1c, ultrasound-derived muscle thickness and quality of upper and lower extremity musculature, chest press and leg press 10-repetition maximum (10RM), and handgrip strength. Participants continued their medication use for four weeks without RT (GLP-1), and this was followed by an eight-week RT protocol alongside continued medication use (GLP-1+RT). Body mass decreased 0.991 kg (p = 0.019) and 2.627 kg (p = 0.011) during GLP-1 and GLP-1+RT, respectively. Fat mass and body fat percentage decreased significantly during GLP-1+RT (−3.355 kg, p = 0.008 and −3.073%, p = 0.013, respectively). There was a non-significant increase (1.1 kg) in fat-free mass. Muscle thickness and quality were maintained. Leg press and chest press 10RM improved during GLP-1+RT (p < 0.001 and p = 0.006, respectively). This exploratory study provides context regarding RT’s effects on fat-free mass, strength, and size and quality of muscle in individuals using semaglutide.
1. Introduction
Glucagon-like peptide-1 receptor agonists (GLP-1 RAs) have emerged as an effective medication for targeting obesity, a global epidemic that is estimated to affect >4 billion people by 2035 [1]. GLP-1 RAs, such as semaglutide, exert their effects through appetite suppression, reducing caloric intake, and in turn, reducing body and fat mass [2,3]. In the STEP-1 trial, a pivotal phase 3 trial that led to FDA approval of semaglutide for obesity treatment, individuals using semaglutide (2.4 mg) achieved a −14.9% mean weight change over 68 weeks [4]. Subsequently, the STEP-3 trial compared semaglutide (2.4 mg) vs. placebo, with both groups receiving an initial low-calorie diet and intensive behavioral therapy. The semaglutide group achieved a −16.0% weight change vs. −5.7% for placebo, indicating greater weight loss benefit than lifestyle change alone [5].
Concerns have been raised regarding lean body mass (LBM) loss with semaglutide use, alongside potential declines in muscle function such as strength or power [6,7,8]. Early evidence from Wilding et al. [4] reported ~40% of weight loss coming from reductions in LBM. More recent findings have demonstrated relative improvements in muscle mass-to-body weight ratio and maintenance of muscular function in both mice and humans despite decreases in LBM with semaglutide use [9]. Interpreting changes in LBM, which is comprised of muscle, bone, organs, and connective tissue, exclusively as changes in muscle mass may overestimate the consequential effects of GLP-1 RAs on muscle mass [10]. Whole-body composition assessment (e.g., dual-energy x-ray absorptiometry; DXA) has been primarily used to observe musculoskeletal changes in individuals using semaglutide [7,10]; thus, it is unclear how localized muscle mass, morphology, and composition is impacted. There is a growing, yet limited, body of literature employing magnetic resonance imaging (MRI) or ultrasonography to more closely examine changes in muscle [9,11]. Brightness-mode (B-mode) ultrasonography is convenient and reliable for assessing muscle size and morphology [12]. Using B-mode ultrasound, images of muscle can be collected to measure muscle thickness (MT), a proxy for muscle size, and echo intensity (EI), a proxy for muscle quality. Additionally, extended field of view (EFOV) techniques can be used to take a panoramic image of a muscle to determine cross-sectional area (CSA). Associations between functional characteristics of muscle such as strength, power, and ultrasonographic measurements of MT and EI have been demonstrated in a wide range of populations [13,14]. Utilization of modalities such as B-mode ultrasound will help clarify the impact of GLP-1 RAs on regional muscle morphology.
Resistance training (RT) is well-established as an exercise intervention capable of preserving or increasing muscle mass, metabolic rate, and glycemic regulation, even during periods of low energy availability [15,16,17]. Minimal evidence exists examining the effects of GLP-1 RA use when combined with exercise, with few studies addressing how resistance training and GLP-1 RA use interact to affect muscle size, health and function [18,19,20]. Combining the positive effects of GLP-1 RAs with the positive effects of RT may optimize long-term muscular, metabolic, and functional outcomes in individuals with overweight/obesity, though this needs investigated. This exploratory study examined the effects GLP-1 RA use (semaglutide), combined with RT, on body composition, muscle morphology, strength, and indices of metabolism in middle-aged (30–55 years) adults with overweight or obesity. We hypothesized that combining RT with semaglutide would amplify reductions in body and fat mass, retain LBM, improve muscle morphology (MT, EI, and CSA) and strength, and preserve or improve indices of metabolism, including resting metabolic rate, fasting blood glucose, and HbA1c.
2. Materials and Methods
This study was approved by the Missouri State University Institutional Review Board (IRB-FY2026-125). Eleven adults (9 females, 2 males) aged 30–55 years old participated in this study. Participants were recruited from the local, Springfield, MO, area via electronic (email, online social groups) and flyer advertising. Participants were screened for inclusion criteria, which included current use of semaglutide for weight loss, a BMI between 25 and 34.9 kg/m2, the absence of atypical dieting patterns (e.g., restrictive dietary habits), HbA1c < 6.5%, and the absence of contraindications to RT. Exclusion criteria included a BMI ≥ 35 kg/m2, partaking in atypical dieting patterns, diagnosis of cardiovascular disease or type 2 diabetes, an HbA1c > 6.5%, and a history of and/or current orthopedic injuries limiting the ability to participate in exercise. Additionally, participants completed the PAR-Q + (2021) and a health history questionnaire to determine exercise clearance.
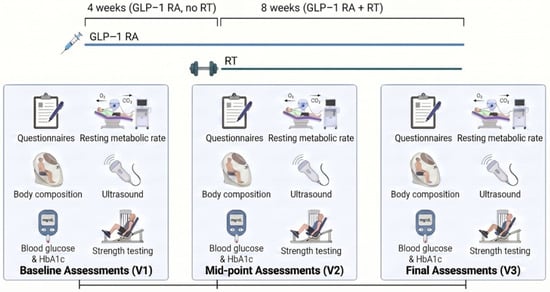
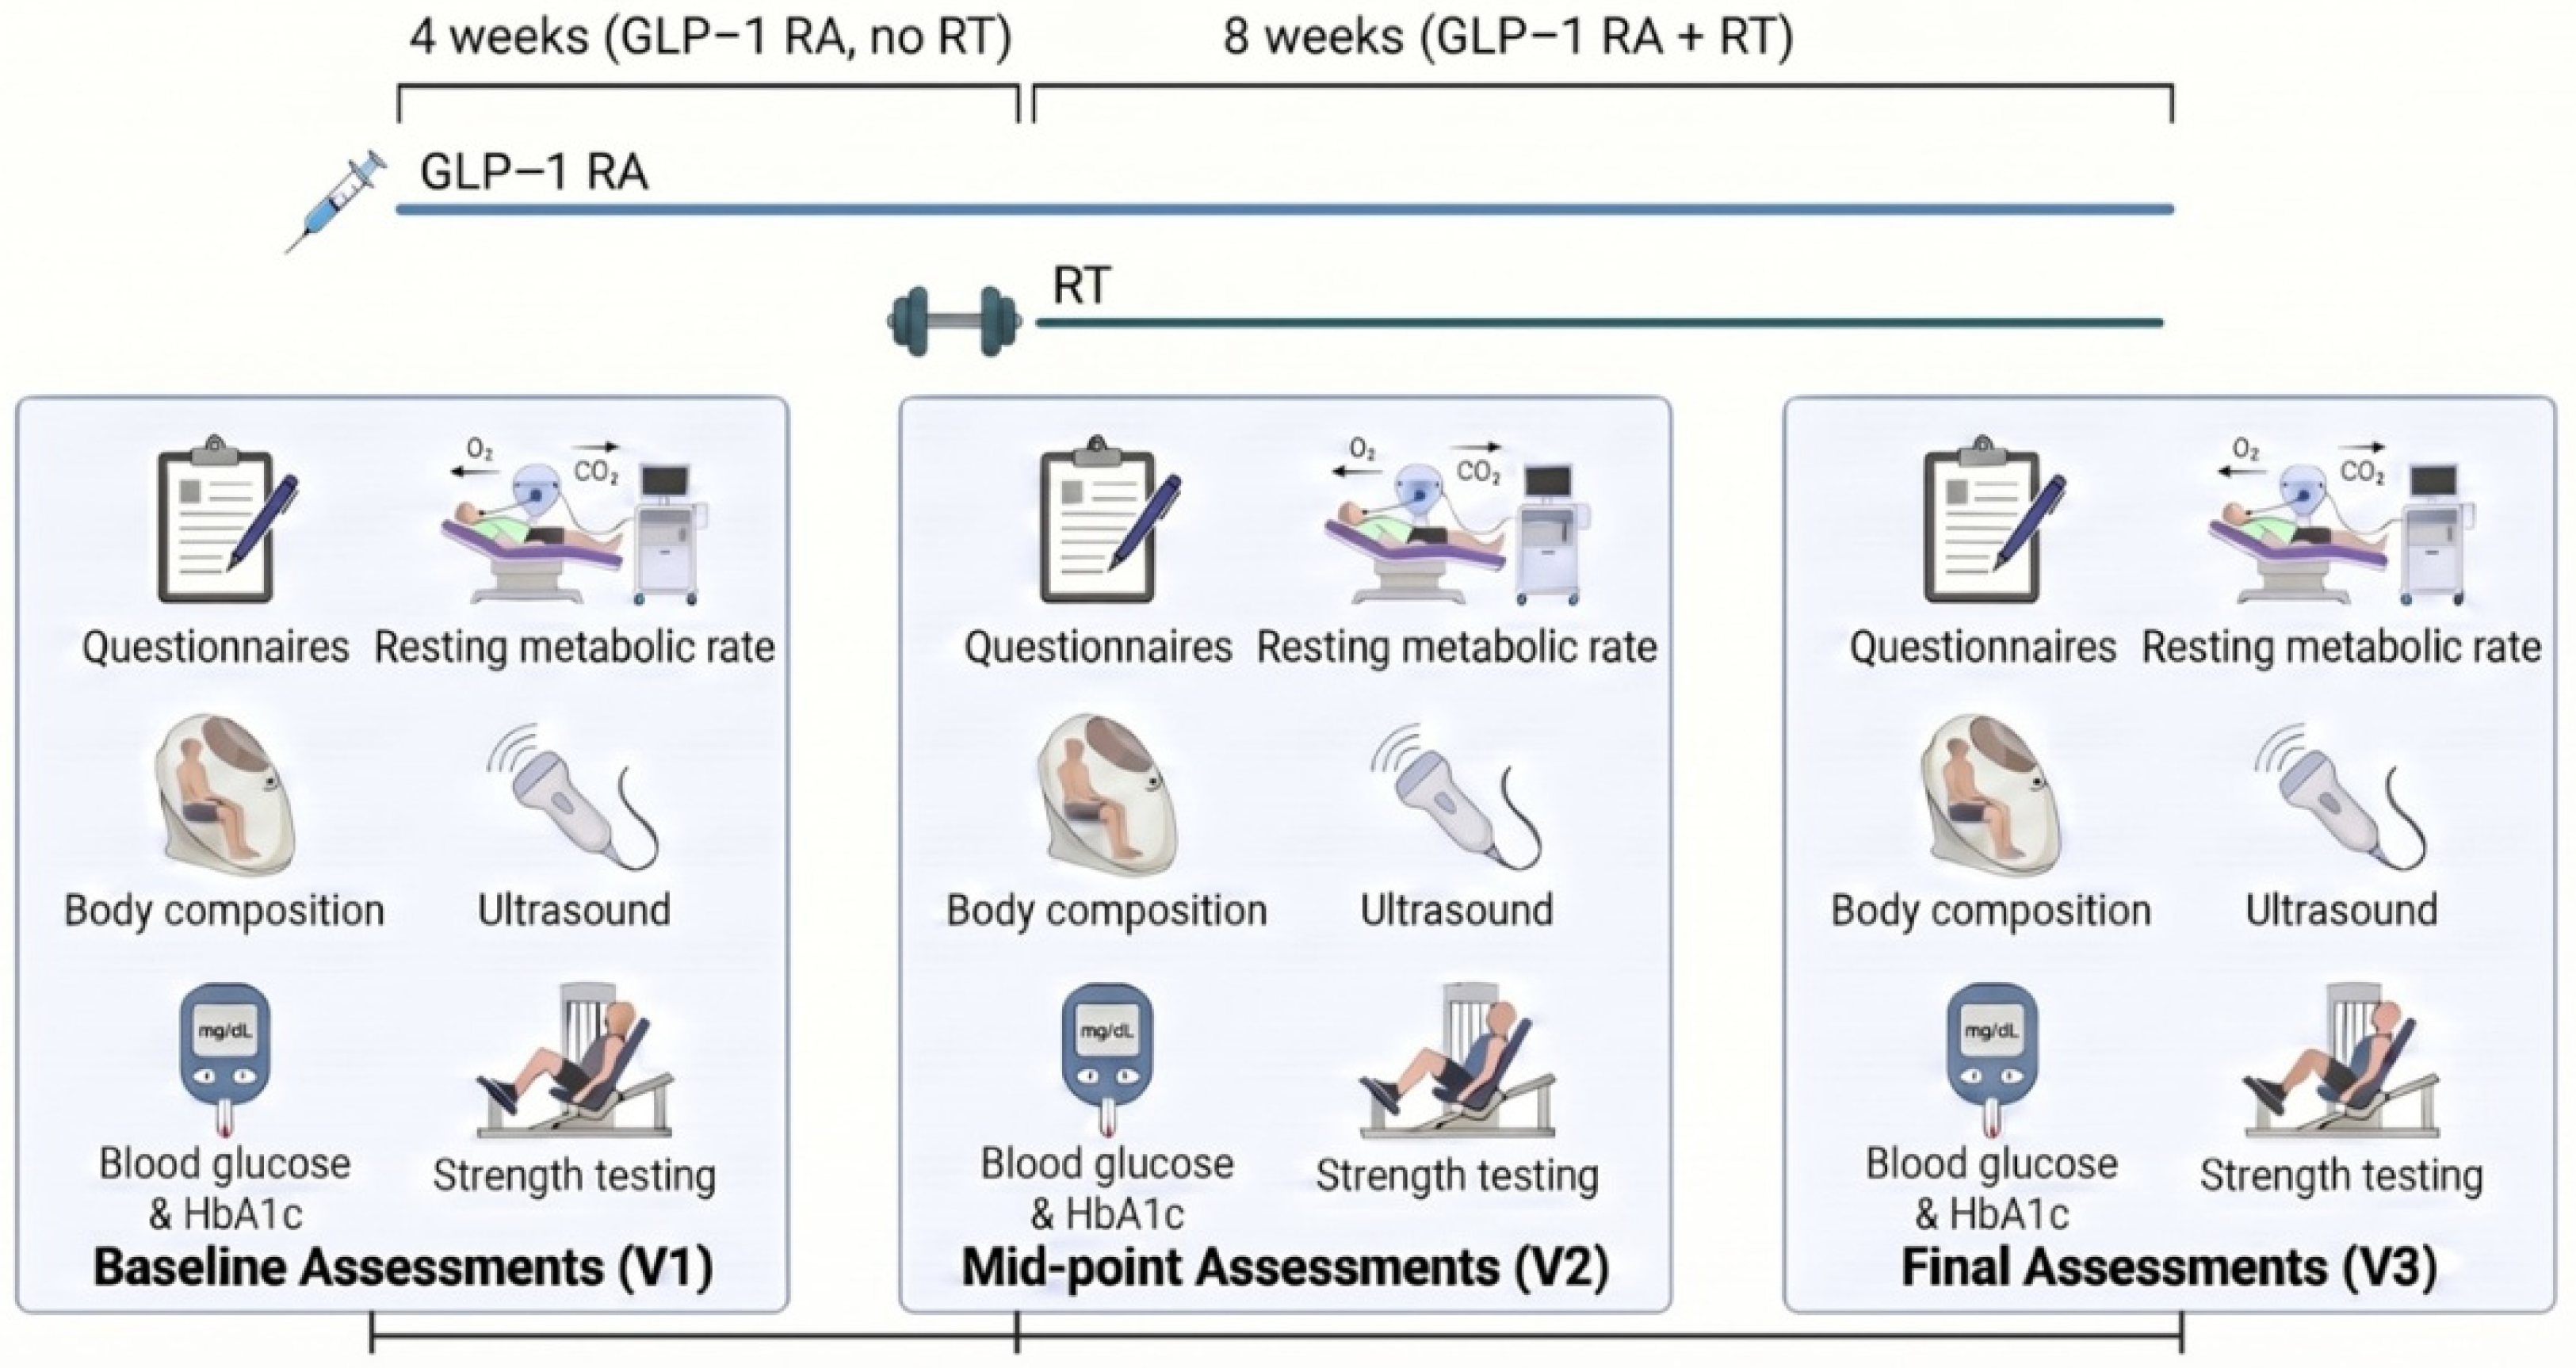
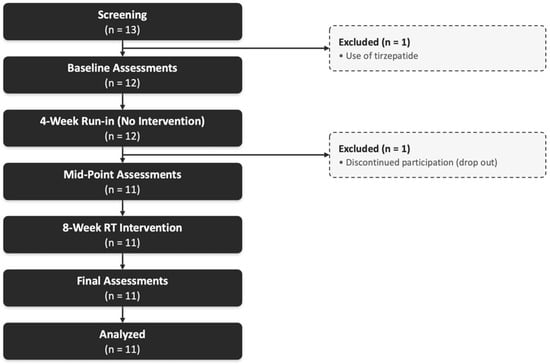
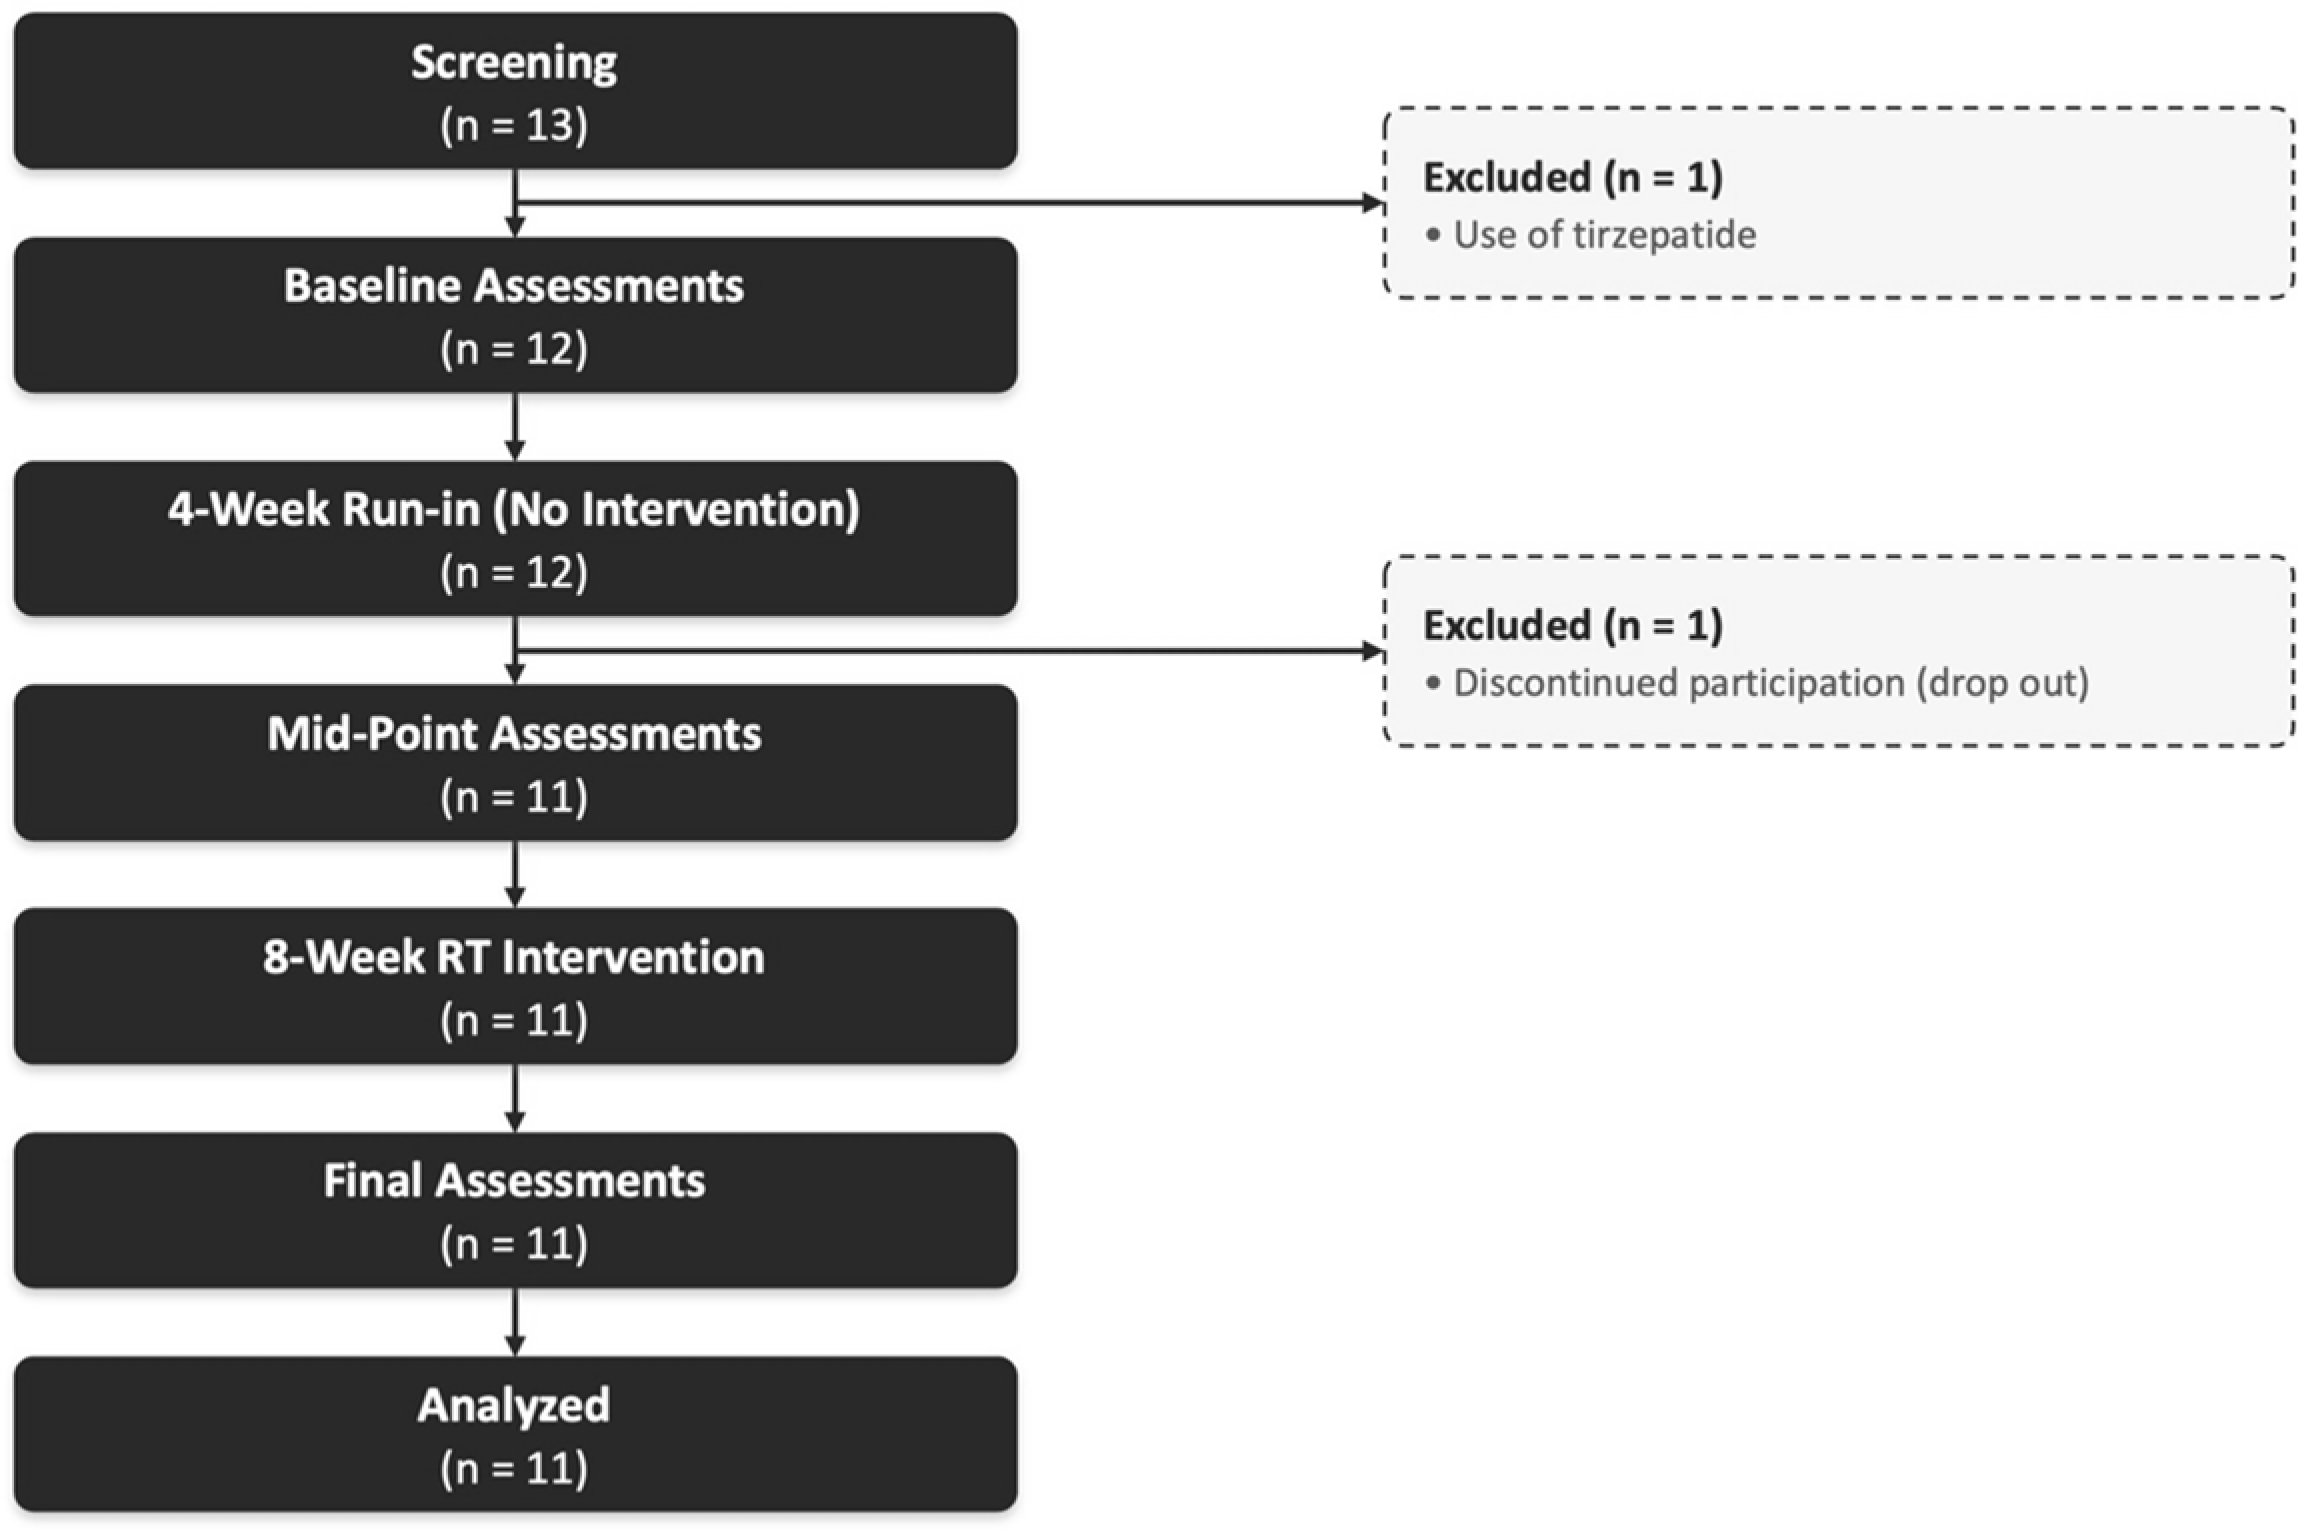
Participants visited the lab three times (V1, V2, V3). V1 and V2 were separated by four weeks of no RT while participants continued their regular use of semaglutide (coined GLP-1). V2 and V3 were separated by eight weeks of a supervised RT protocol combined with continued use of semaglutide (coined GLP-1+RT). Participants were instructed to fast for ≥4 h, avoid caffeine for ≥4 h, and avoid strenuous physical activity for 24 h prior to each lab visit. At each lab visit, participants submitted three-day food logs recorded through MyFitnessPal and completed a modified three-factor eating questionnaire (TFEQ). Participants then underwent measurements of height and weight, resting metabolic rate (RMR), body composition, fasting blood glucose (FBG) and HbA1c, ultrasonographic imaging of the rectus femoris (RF), vastus lateralis (VL), and biceps brachii (BB), and strength assessments. The study timeline and methodology are depicted in Figure 1 and a CONSORT diagram displaying participant enrollment, attrition, and study completion is shown in Figure 2.
Figure 1.
Study timeline and methodology. Created in BioRender. Hill, C. (2026). https://BioRender.com/7q5w5ks (accessed on 22 April 2026).
Figure 2.
CONSORT diagram depicting study screening, enrollment, and attrition.
2.1. Resting Energy Expenditure and Body Composition
Indirect calorimetry (TrueOne2400, ParvoMedics, Sandy, UT, USA) with dilution was used to collect expired gases to determine participants’ resting metabolic rate (RMR; kcal/day). Participants lay in a supine position in a darkened, thermoneutral environment. The first 5–10 min were used to stabilize FeCO2 per manufacturer instructions and a + minimum of 20 min of stable data was collected. Mean RMR was calculated from the final 20 min of collection. Air displacement plethysmography (ADP; BOD POD GS-X; COSMED USA, Inc., Concord, CA, USA) was used to assess body composition, including body mass, fat mass (FM), fat-free mass (FFM), and body fat percentage. Participants wore minimal compression clothing and a swim cap. Participants were instructed to breathe normally and remain still during the test. The system and scale were calibrated per manufacturer instructions prior to each test.
2.2. Ultrasonography
B-mode ultrasonography (GE LOGIQ e, GE Healthcare, Milwaukee, WI, USA) was used to collect images of targeted muscles (rectus femoris, RF; vastus lateralis, VL; biceps brachii, BB) for each participant. All images were taken by one trained sonographer. Prior to imaging, participants rested in the supine position for ~10 min to allow fluid redistribution and stabilization. Images were taken on the right side for all participants. Ultrasound settings were kept constant (Frequency: 12 Hz, Gain: 55 dB, Dynamic Range: 72, Image Mode: Convex) for all participants, adjusting for depth as needed. Images were taken at 50% of the distance between the anterior superior iliac spine and the proximal or lateral border of the patella (RF and VL, respectively), and at 50% of the distance between the acromion process and the antecubital space (BB). Sagittal and EFOV images were taken at each site. Images were analyzed using ImageJ (version 1.53, NIH, Bethesda, MD, USA). The straight-line function and the polygon function were used to determine MT and CSA, respectively. The histogram function was used to measure EI. Subcutaneous adipose tissue (ScAT) was measured using the straight-line function at the proximal, middle, and distal regions of each sagittal image. These measurements were averaged to determine ScAT, which was used to determine corrected EI (cEI) with the following equation [21]: corrected EI = raw EI + (average subcutaneous adipose tissue thickness * 40.4278). To assess intra-rater reliability, ultrasound images were analyzed by the same investigator on two separate occasions. The investigator was blinded to the participant, and images were randomized prior to each analysis to reduce recall bias. Intraclass correlation coefficients (ICCs) were calculated using a two-way mixed-effects model for absolute agreement (ICC(1,3)) using SPSS v31. Intra-rater reliability for MT was [ICC(3,1) RF = 0.996; 95% CI: 0.98–0.999; VL = 0.996; 95% CI: 0.981–0.999; BB = 0.994; 95% CI: 0.969–0.999], whereas intra-rater reliability for EI was [ICC(3,1) RF = 0.965; 95% CI = 0.797–0.994); VL = 0.989; 95% CI = 0.683–0.998); BB = 0.989; 95% CI = 0.898–0.998]. Additionally, our lab has also previously established excellent inter-rater reliability (ICC(2,1) = 0.949; 95% CI = 0.584–1.0, p < 0.012).
2.3. Fasting Blood Glucose, HbA1c, and Feeding
A capillary blood sample was collected using a Unistik 3 Comfort lancet (Owen Mumford Corporation’, Woodstock, UK). A Precision Xtra meter and glucose strips (Abbott Diabetes Care, Alameda, CA, USA) were used to measure FBG. A Siemens DCA Vantage Analyzer (Siemens Healthineers, Malvern, PA, USA) and cartridge were used to measure HbA1c. After all laboratory assessments were complete and prior to strength assessment, participants were given a predetermined amount of a Clif Bar (3 kcal/kg body weight). Participants were given five minutes to consume the Clif Bar.
2.4. Strength Assessment
Strength assessments were performed to determine maximal handgrip strength and 10-repetition maximums (10RM) of leg press and chest press. Handgrip strength was measured using a hand dynamometer (Johnson Scale Co., Pine Brook, NJ, USA). After two trials per hand, the highest value was recorded. After handgrip strength, participants worked to a 10RM of leg press on a 45-degree leg press sled. Participants were given two warm up sets of 5–8 repetitions. Participants performed 10 repetition sets until they could not complete the set or their rating of perceived exertion (RPE) was ≥9 using a modified Borg RPE scale (1–10). Between sets, participants self-selected increases in load and were given adequate rest periods (e.g., 120 to 180 s). Following leg press 10RM testing, the same procedures were performed for chest press 10RM testing on a vertical chest press machine (Nautilus Nitro, Nautilus, Inc., Vancouver, WA, USA).
2.5. Resistance Training Protocol
The eight-week RT protocol, which occurred between V2 and V3, followed an alternating format between lower body (session A) and upper body (session B) sessions. A standardized warmup was used for both session A and session B. The warmup and RT protocol are depicted in Appendix A. For the RT protocol, participants were instructed to perform 10 repetitions during the first two sets of each exercise. The final set of each exercise was taken to or near failure (as many repetitions as possible; AMRAP). Each training session consisted of five different exercises, totaling 15 working sets. Rating of perceived exertion was recorded for each set and a 90 s rest period was allotted between each set and exercise. Initial load was determined based on testing from V1 (75% of 10RM for leg press and chest press) or self-selection by participants to achieve the desired repetition target. Participants were able to select whether to increase (2.27–4.5 kg) or maintain load from set one to two and set two to three for each exercise within each training session. Progression of load between sessions was determined by the performance of the final set of each exercise (again, AMRAP). If participants performed < seven repetitions in the final set, the starting load for the next session was reduced by 2.27 kg. If the participant performed between 8–12 repetitions, the starting load remained the same for the next session. If the participant could perform 13+ repetitions, the starting load for the next session was increased by 2.27–4.5 kg. The RT protocol included 24 total training sessions, with participants aiming for three sessions per week. Participants achieved 92% adherence to the RT protocol. V3 took place three to five days after each participant’s final training session date.
2.6. Statistical Analyses
Statistical analyses were performed using SPSS v31. All data are reported as mean ± standard deviation (SD), or as individual data points, with 95% confidence intervals (CI) included where appropriate. We calculated effect sizes to provide context and magnitude of our observed effects. Effect sizes were assessed using partial eta squared (η2) and interpreted using the following: 0.01 (small effect), 0.06 (medium effect), and 0.14 (large effect) [22]. A priori power analysis, considering relevant studies [9,20], was conducted using G*Power (v.3.1.9.7) to determine the appropriate sample size for detecting significant differences in the dependent variables in this study. To achieve 80% power (1 − β, 0.8, β = 0.2) at a significance level of α = 0.05, the recommended sample size was n = 28. The main effects for all variables between the three assessment timepoints (V1; baseline, V2; GLP-1, V3; GLP-1+RT) were analyzed using a one-way (time), repeated-measures analysis of covariance (RM ANCOVA), with mean, individualized GLP-1 RA dose over the 12-week study, as well as duration of semaglutide use leading up to V1 (months) used as covariates. Bonferroni post hoc testing was applied for making comparisons between V1, V2, and V3 when appropriate. Mauchly’s test of sphericity was used to assess for assumptions of sphericity. Greenhouse–Geisser corrections were used when Mauchly’s test of sphericity was violated (p < 0.05). Alpha (α) for all variable analysis was set at p < 0.05. Figures were created using GraphPad Prism software (v11.0.0).
3. Results
3.1. Baseline Characteristics
Twelve participants enrolled in the study; one participant dropped out of the study due to time constraints. Thus, data from 11 participants (9 females, 2 males) were analyzed. Mean age was 41.5 ± 8.6 years. Participant baseline characteristics are depicted in Table 1.
Table 1.
Baseline characteristics. Data are presented as mean ± SD with 95% confidence intervals (CI); n = 11; BMI = body mass index; FBG = fasting blood glucose; RMR = resting metabolic rate.
3.2. Body Composition and Metabolism
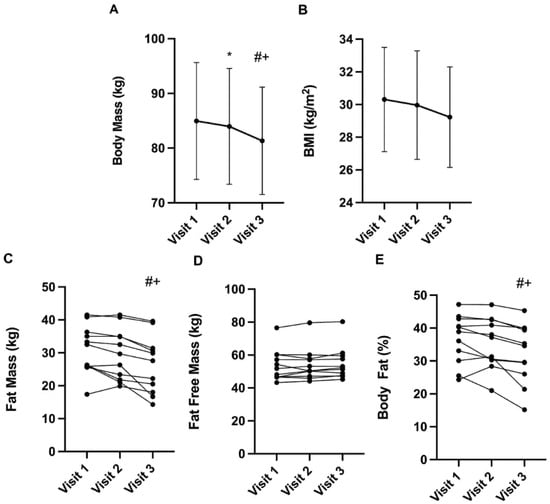
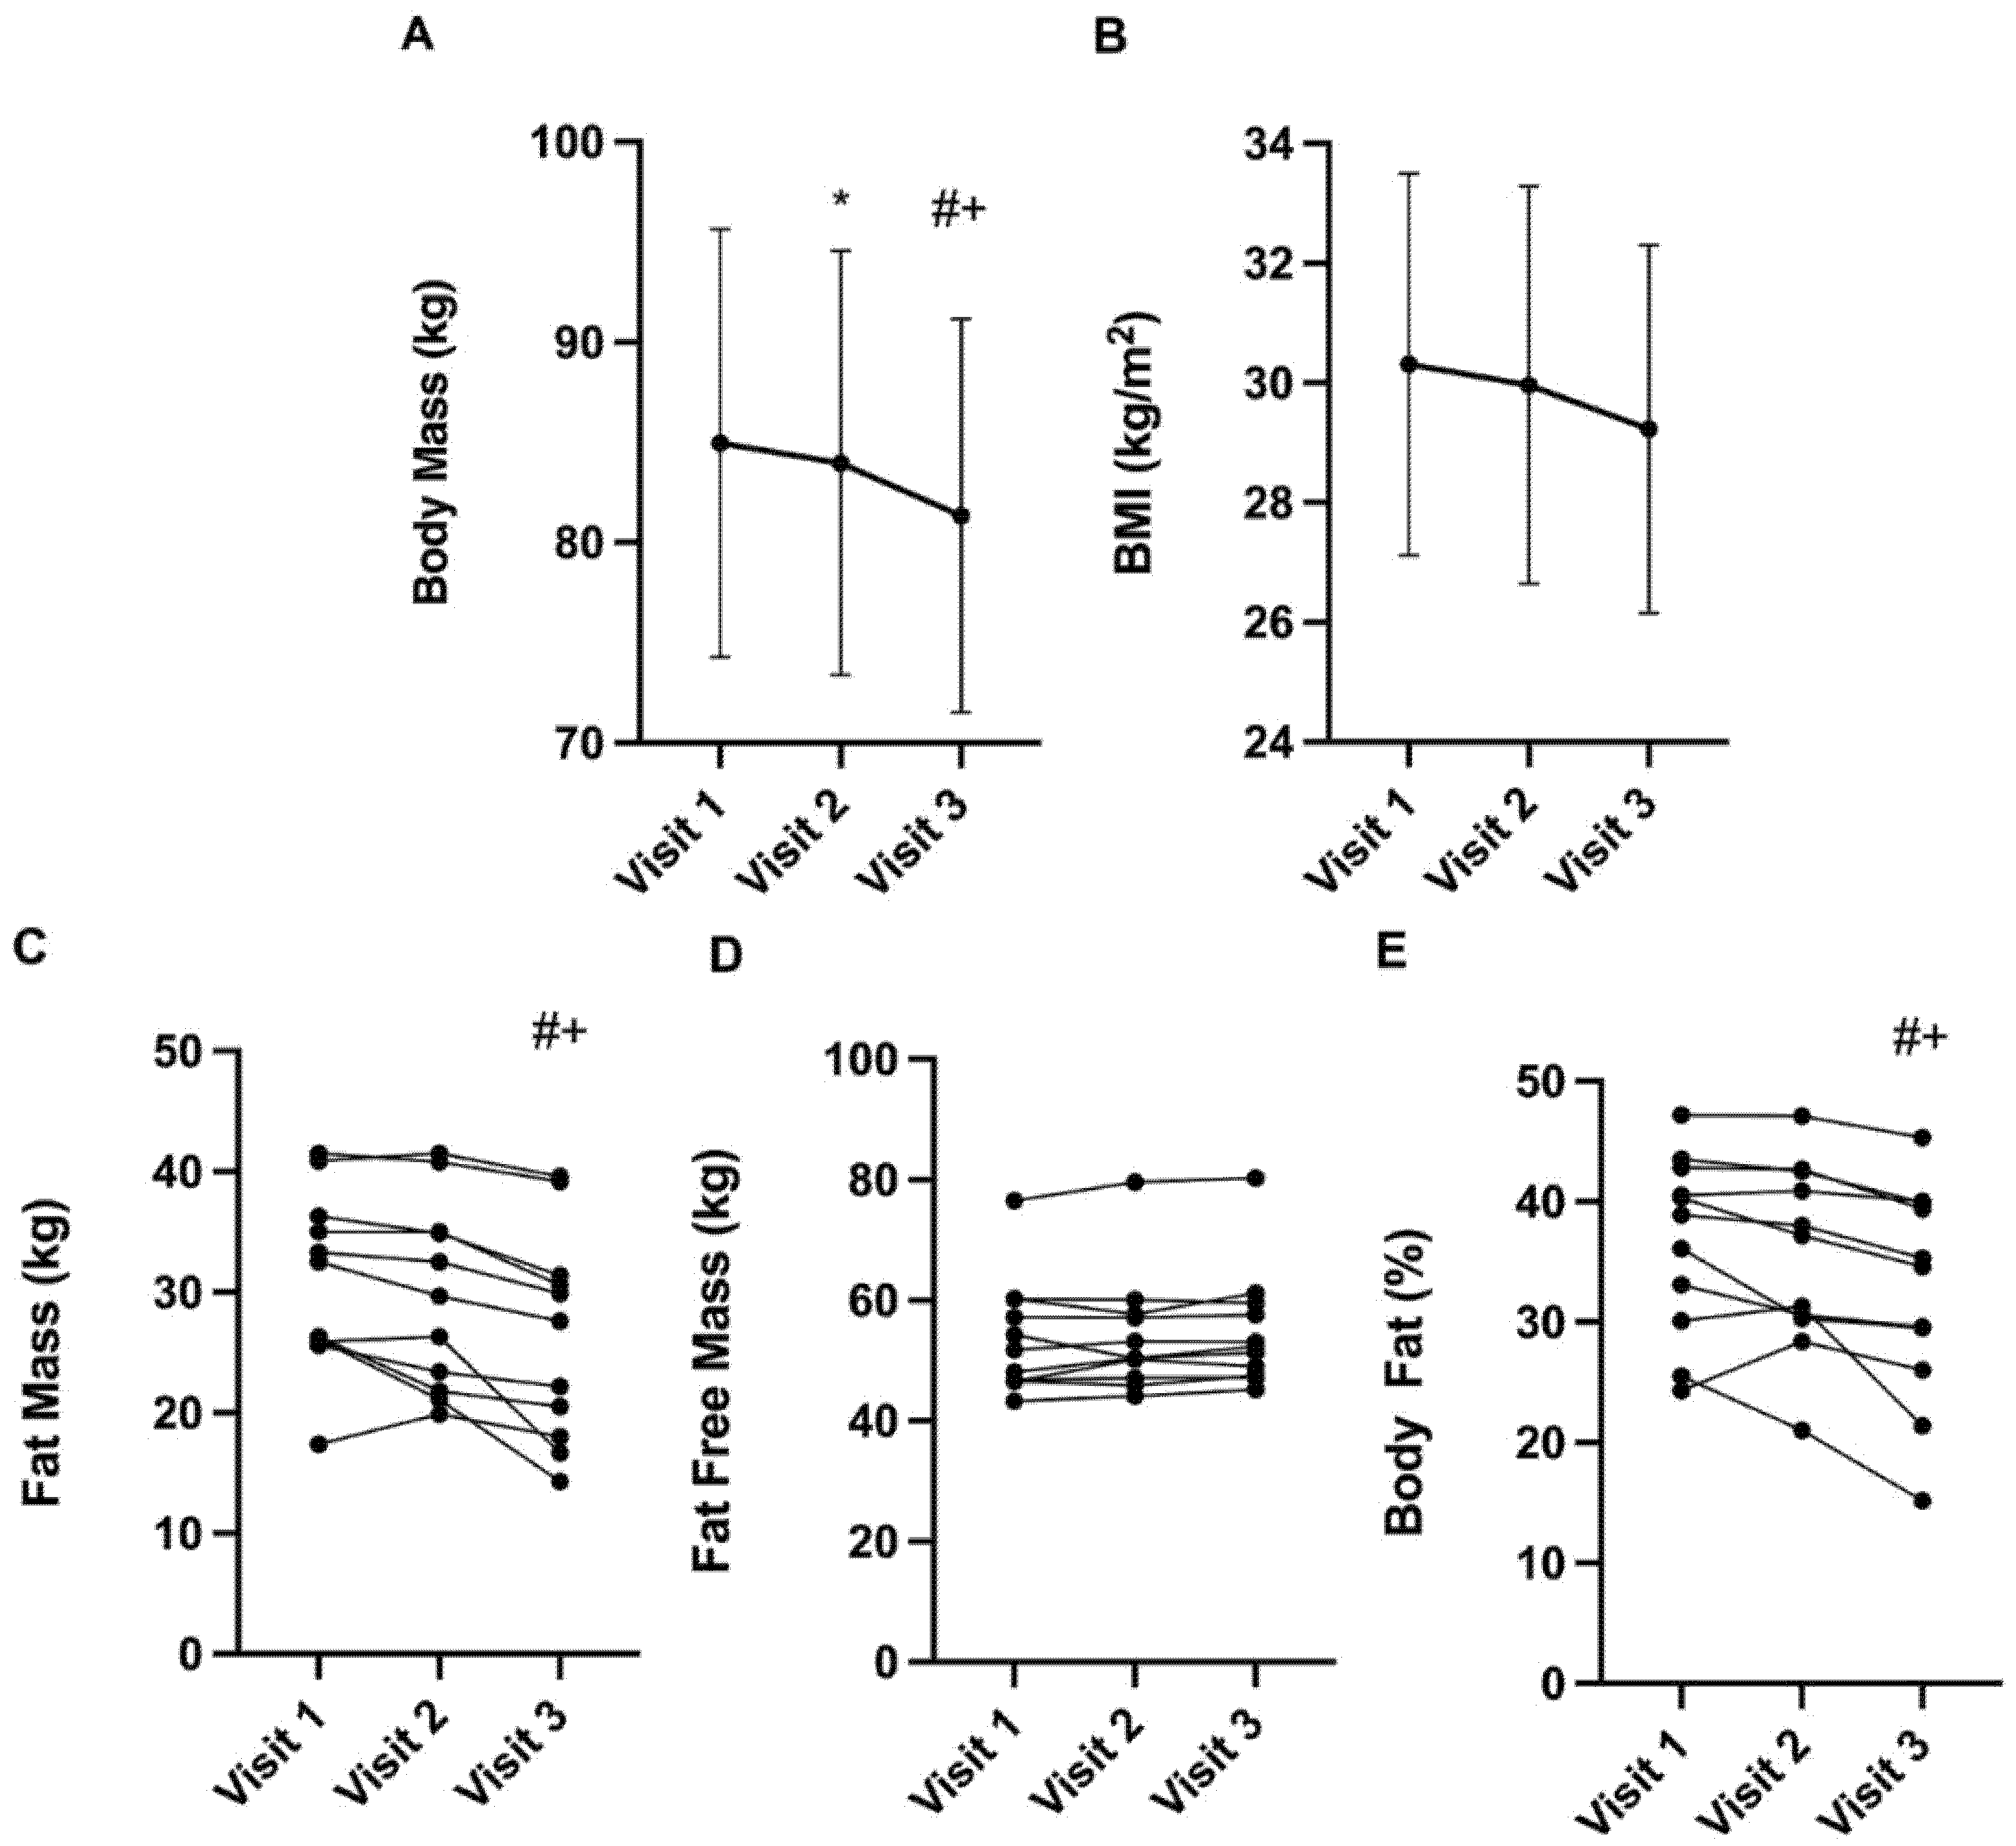
There was a significant main effect of time for body mass (F = 8.420, p = 0.014, partial η2 = 0.513). Body mass (kg) significantly decreased from V1 to V2 (mean difference [MD] = −0.991, 95% CI [CI] = −0.173 to −1.809, p = 0.019), from V2 to V3 (MD = −2.627, CI = −0.667 to −4.587, p = 0.011), and from V1 to V3 (MD = −3.618, CI = −1.302 to −5.934, p = 0.005). No significant time–dose (p = 0.206) or time–duration of medication (p = 0.921) interactions were observed. There was a significant main effect of time for both FM (F = 7.107, p = 0.019, partial η2 = 0.470) and body fat percentage (F = 5.407, p = 0.016, partial η2 = 0.403). Fat mass and body fat percentage were not significantly different from V1 to V2 (p = 0.093, p = 0.219, respectively). A significant decrease in FM (kg) was observed from V2 to V3 (MD = −3.355, CI = −0.979 to −5.730, p = 0.008), and from V1 to V3 (MD = −4.618, CI = −1.459 to −7.777, p = 0.007). A significant decrease in body fat percentage (%) was observed from V2 to V3 (MD = −3.073, CI = −0.711 to −5.434, p = 0.013) and from V1 to V3 (MD = −4.191, CI = −1.080 to −7.302, p = 0.011). No significant time–dose (p = 0.296, p = 0.208) or time–duration of medication (p = 0.173, p = 0.077) interactions were observed for FM or body fat percentage, respectively. No main effect of time was observed for FFM (kg; V1 = 53.8 ± 9.5; V2 = 54.2 ± 9.8; V3 = 54.9 ± 9.9; p = 0.319), but a time–dose relationship (F = 7.047, p = 0.006, partial η2 = 0.468) and a time–duration of medication relationship (F = 8.102, p = 0.004, partial η2 = 0.503) was observed. No main effects of time were observed for BMI, RMR, FBG, or HbA1c (all p > 0.05). Additionally, no time–dose or time–duration of medication interactions were observed for BMI, RMR, FBG, or HbA1c (all p > 0.05). Values (mean ± SD) for BMI, RMR, FBG, and HbA1c throughout the study are shown in Table 2. Body composition changes are depicted in Figure 3.
Table 2.
BMI, RMR, FBG, and HbA1c at V1, V2, and V3. Data are presented as mean ± SD with 95% confidence intervals (CI); n = 11; BMI = body mass index; RMR = resting metabolic rate; FBG = fasting blood glucose; HbA1c = glycated hemoglobin.
Figure 3.
Changes in body composition; body mass (kg) (A), BMI (kg/m2) (B), fat mass (kg) (C), fat-free mass (kg) (D), body fat percentage (%) (E). Data presented as mean ± SD (A,B) or individuals across time (C–E). *, significant difference between V1 and V2; #, significant difference between V2 and V3; +, significant difference between V1 and V3.
3.3. Strength Assessment
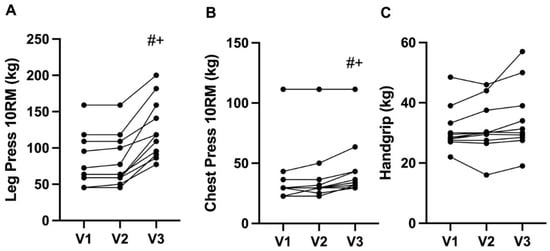
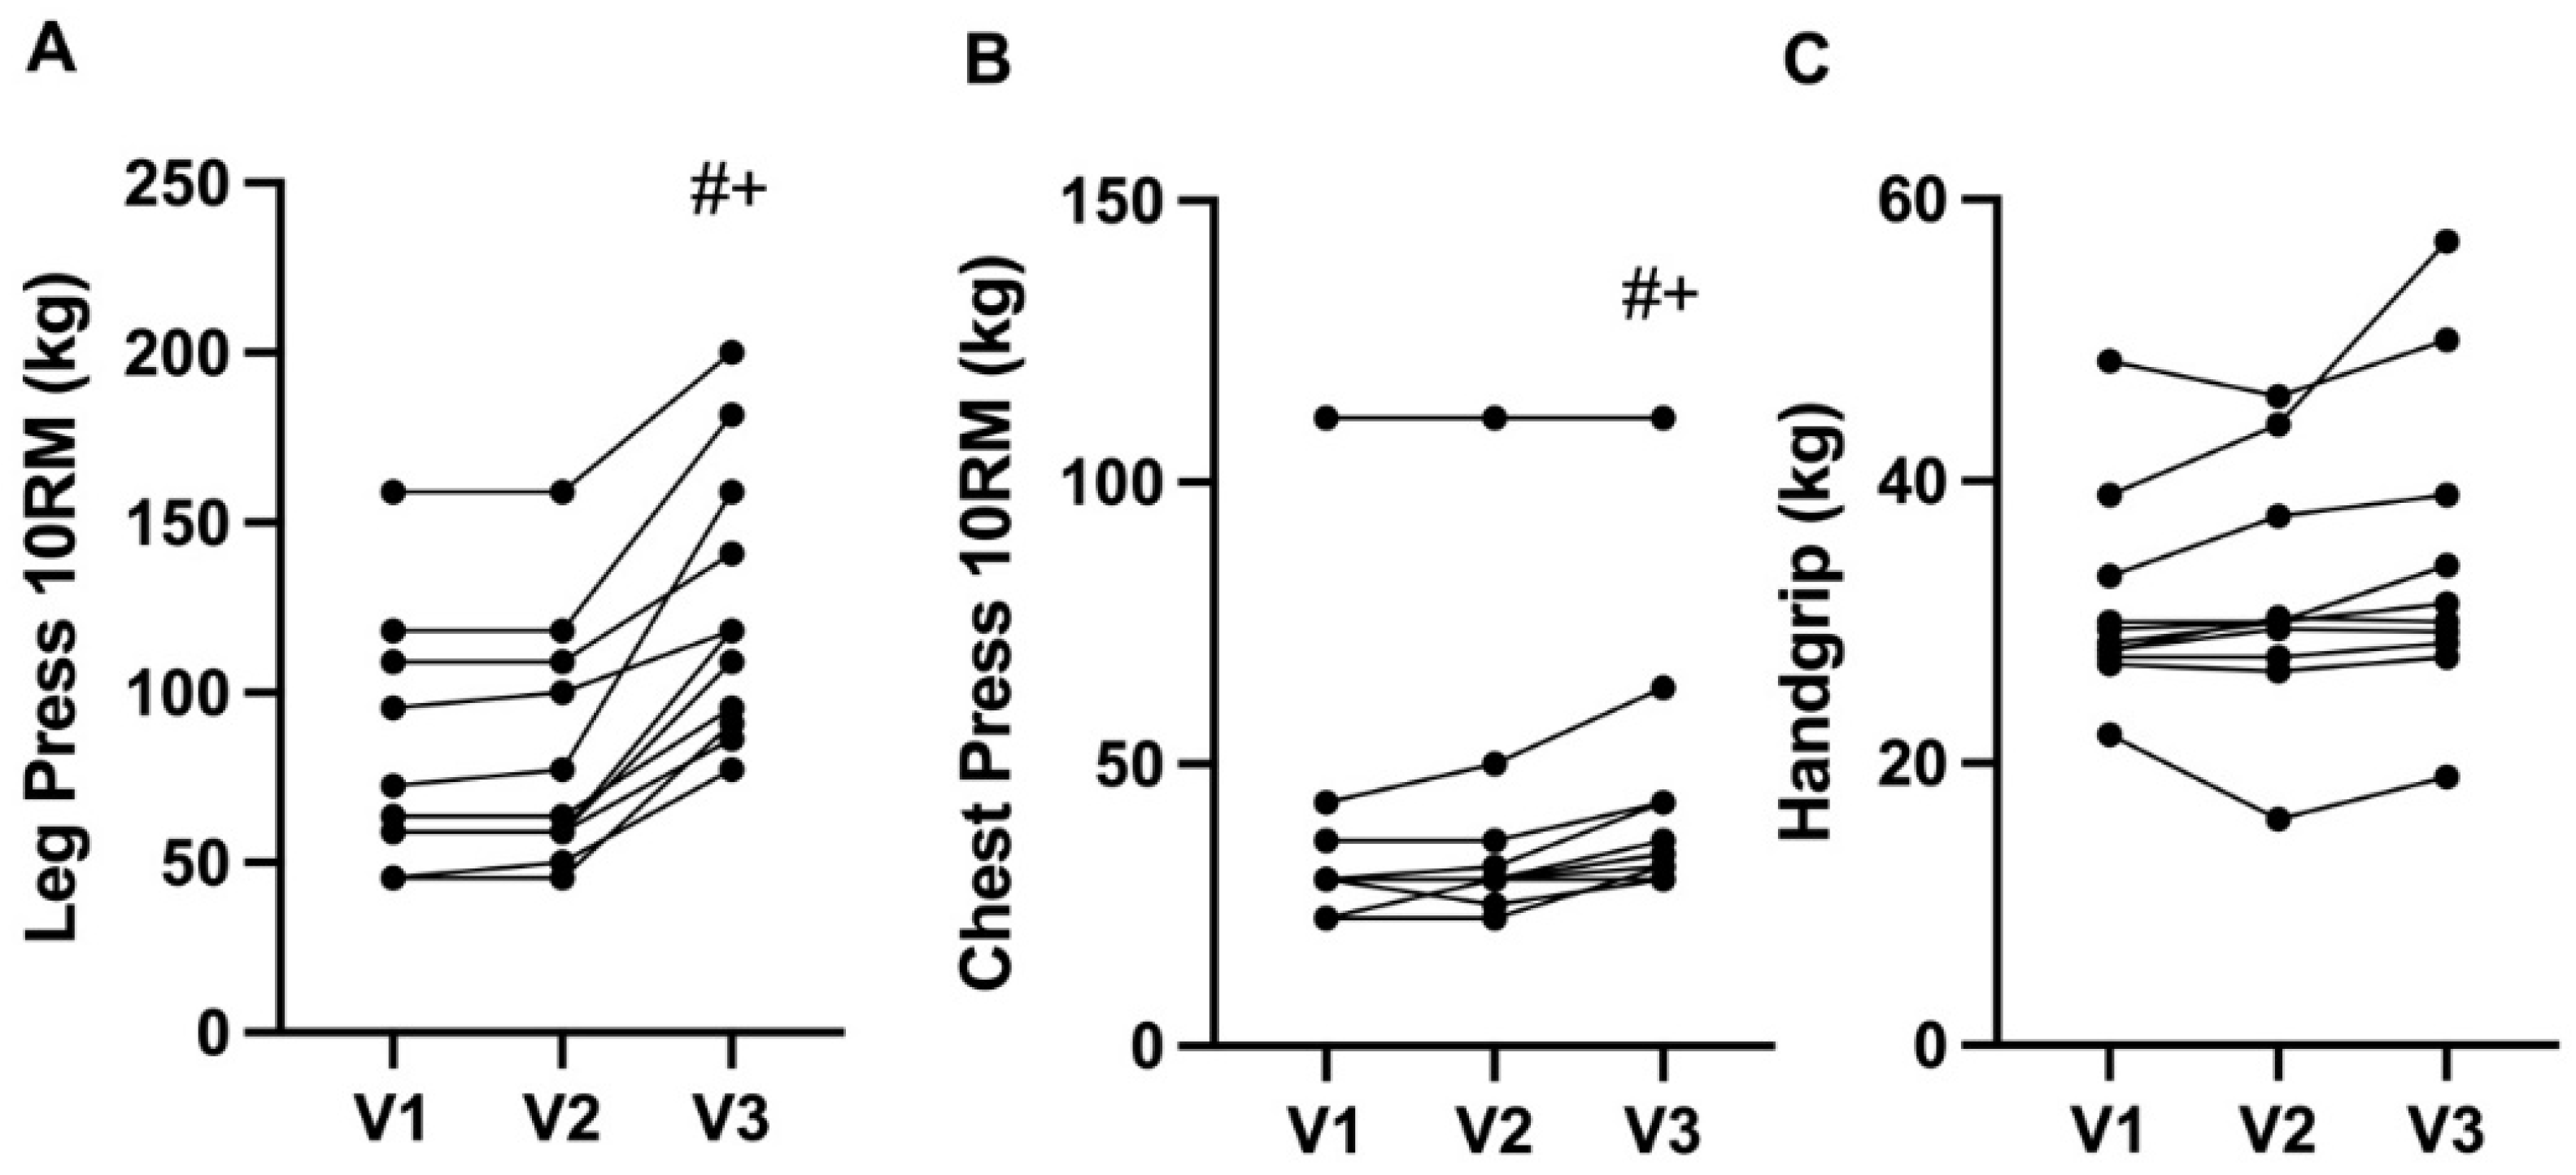
A main effect of time was observed for leg press 10RM (kg; F = 6.131, p = 0.037, partial η2 = 0.434). No significant difference was observed from V1 to V2. Leg press improved from V2 to V3 (MD = 43.391, CI = 24.428 to 62.354, p < 0.001) and from V1 to V3 (MD = 44.627, CI = 25.618 to 63.636, p < 0.001). No time–dose (p = 0.607) or time–duration of medication interactions (p = 0.879) were observed. A main effect of time was observed for chest press 10RM (kg; F = 7.061, p = 0.006, partial η2 = 0.469). No significant difference was observed from V1 to V2. Chest press improved from V2 to V3 (MD = 5.800, CI = 1.870 to 9.730, p = 0.006) and from V1 to V3 (MD = 6.800, CI = 2.193 to 11.407, p = 0.006). A time–dose interaction was observed for chest press 10RM (F = 5.120, p = 0.019, partial η2 = 0.390), whereas no time–duration of medication interaction was observed (p = 0.208). No main effects were observed for handgrip strength (kg; p > 0.05). Additionally, no time–dose (p = 0.834) or time–duration of medication (p = 0.774) interactions were observed. Changes in strength performance are depicted in Figure 4.
Figure 4.
Changes in leg press 10RM (A), chest press 10RM (B), and handgrip strength (C); #, significant difference between V2 and V3. +, significant difference between V1 and V3. Data presented as individuals across time.
3.4. Ultrasonographic Assessment
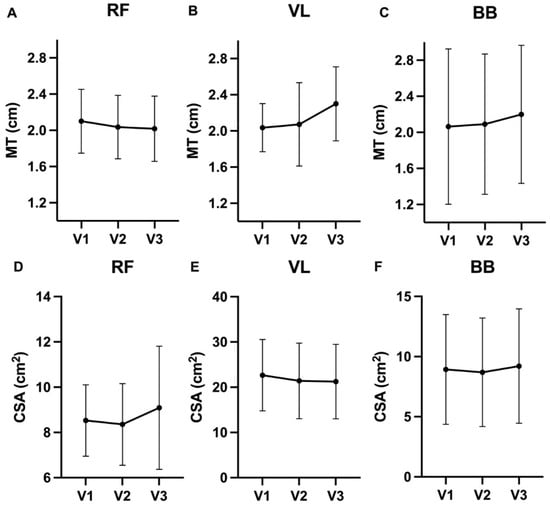
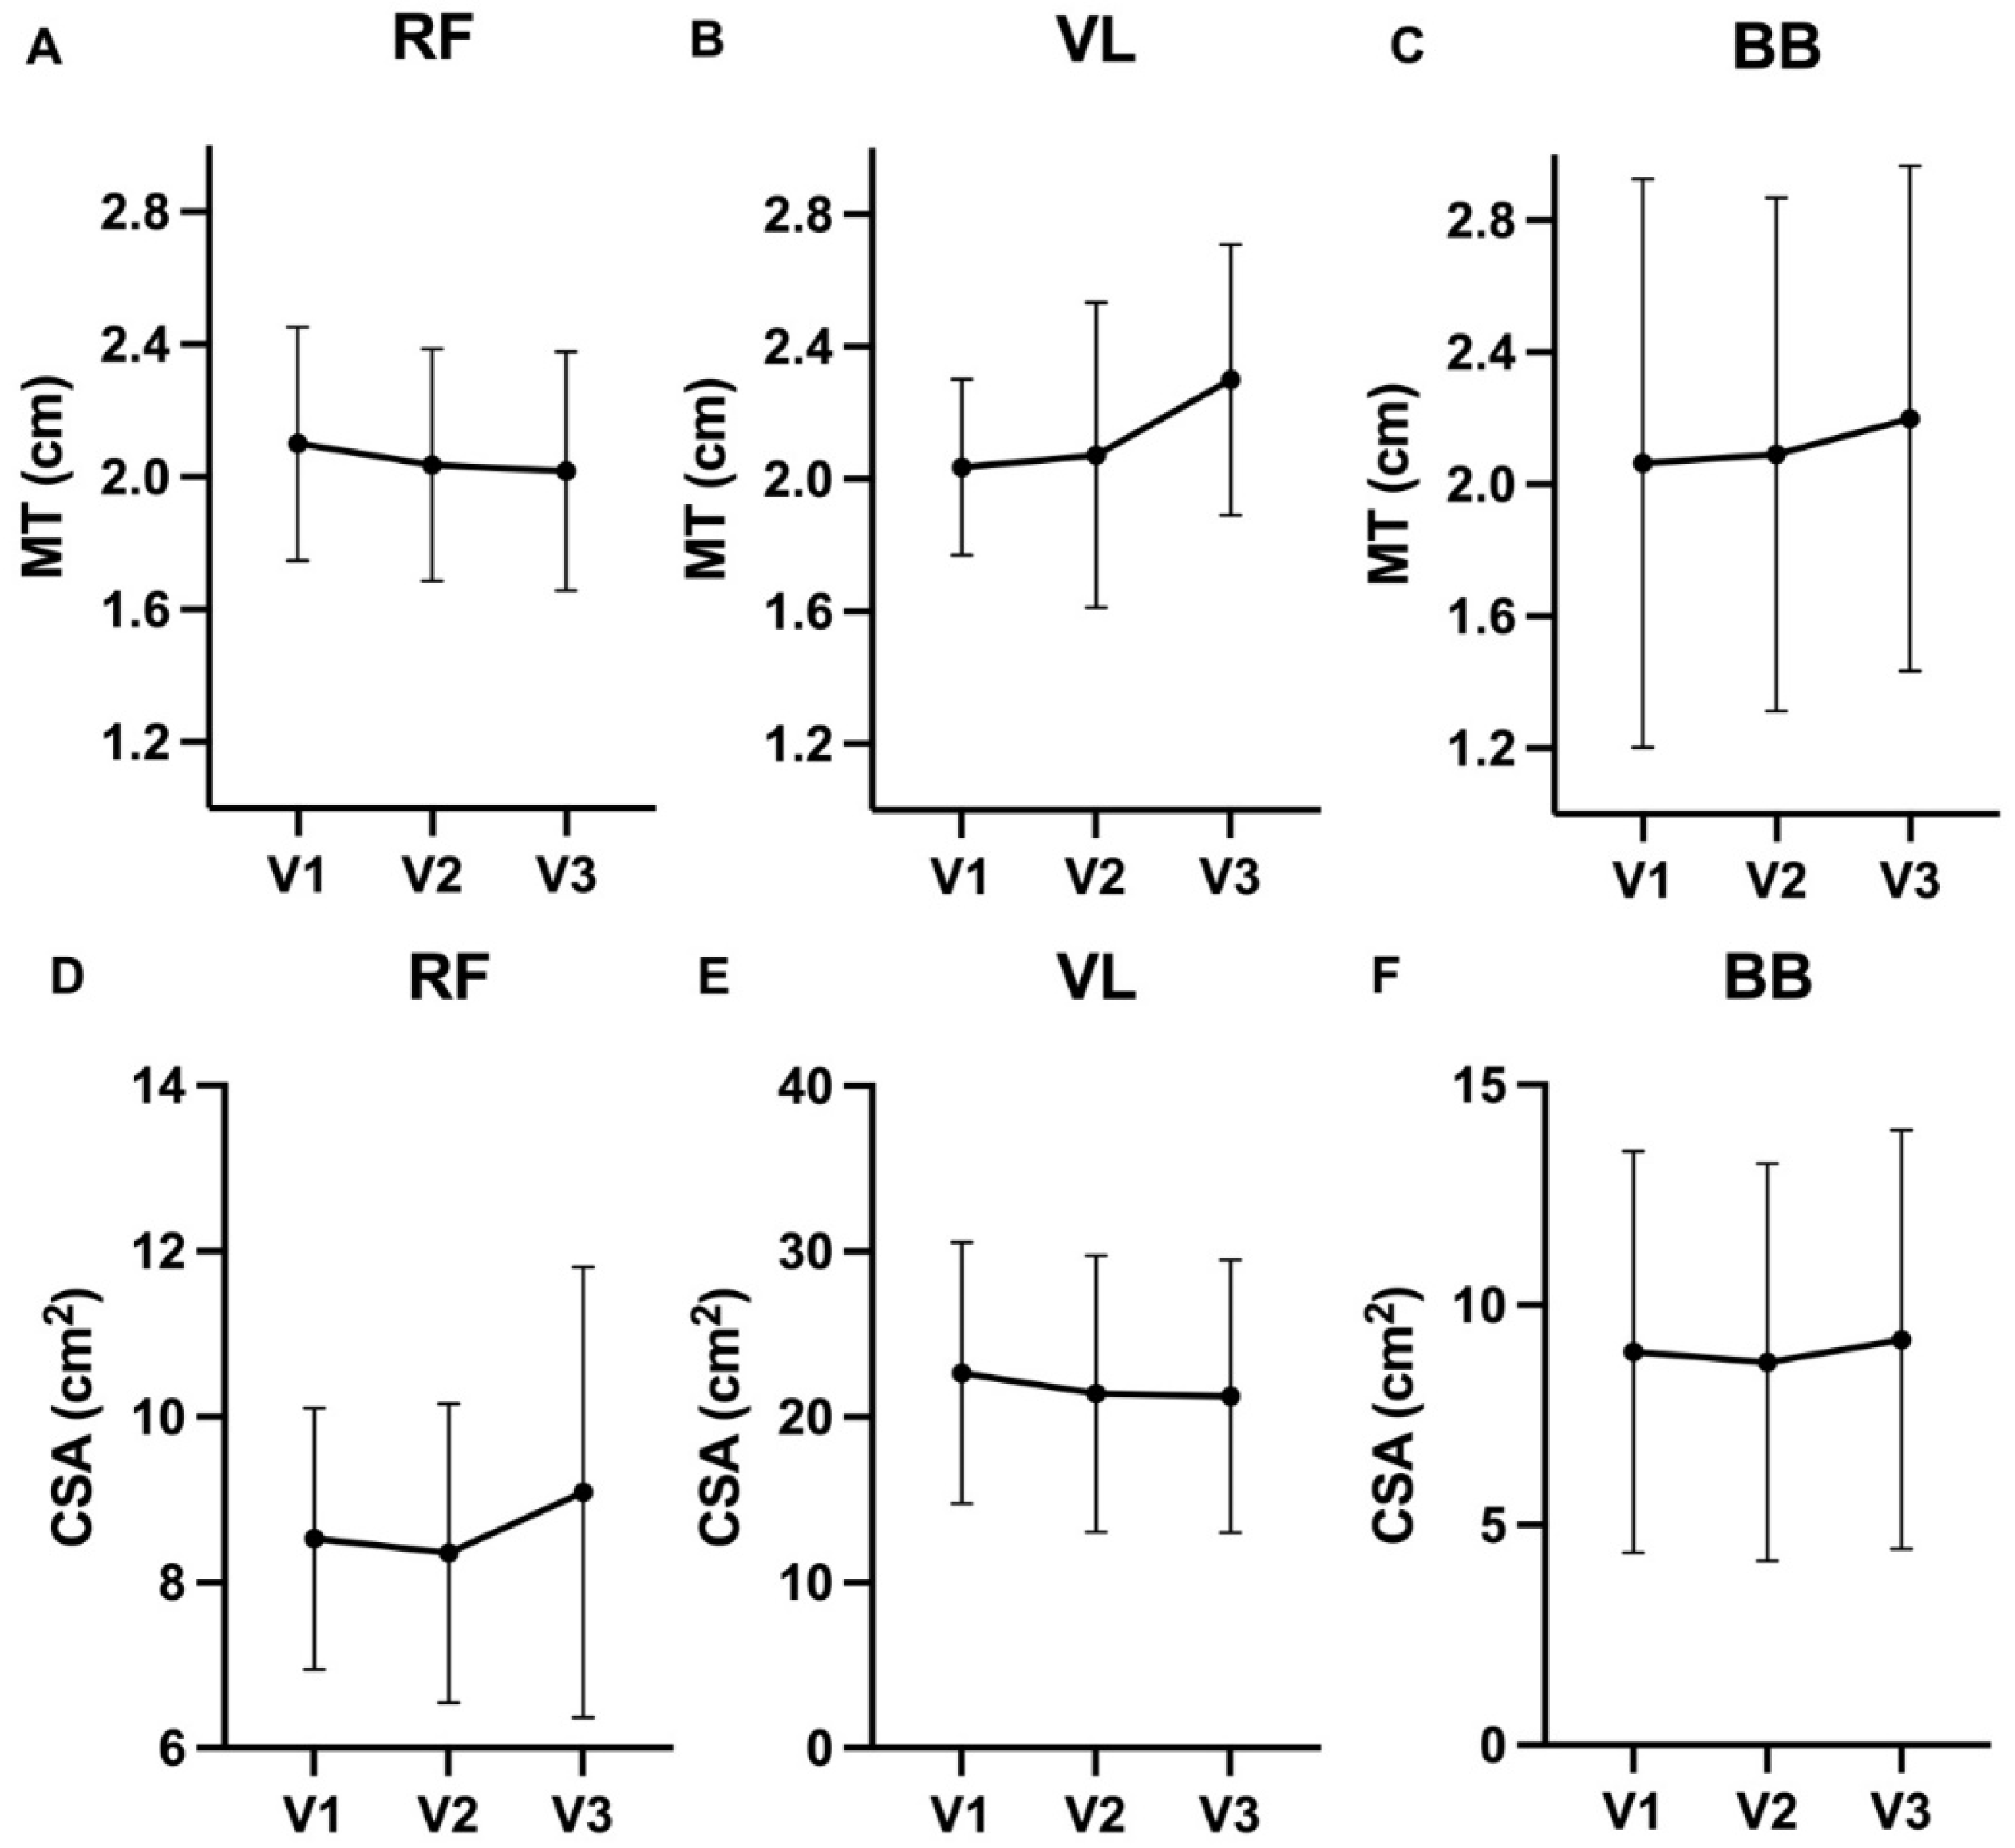
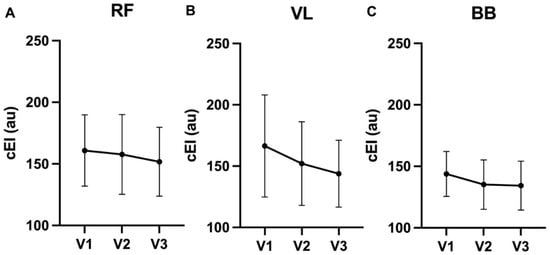
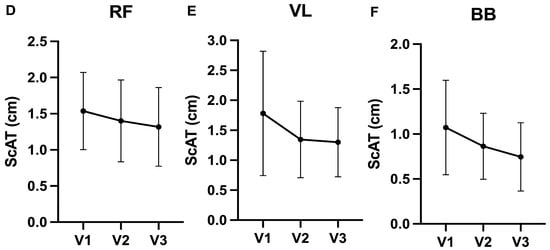
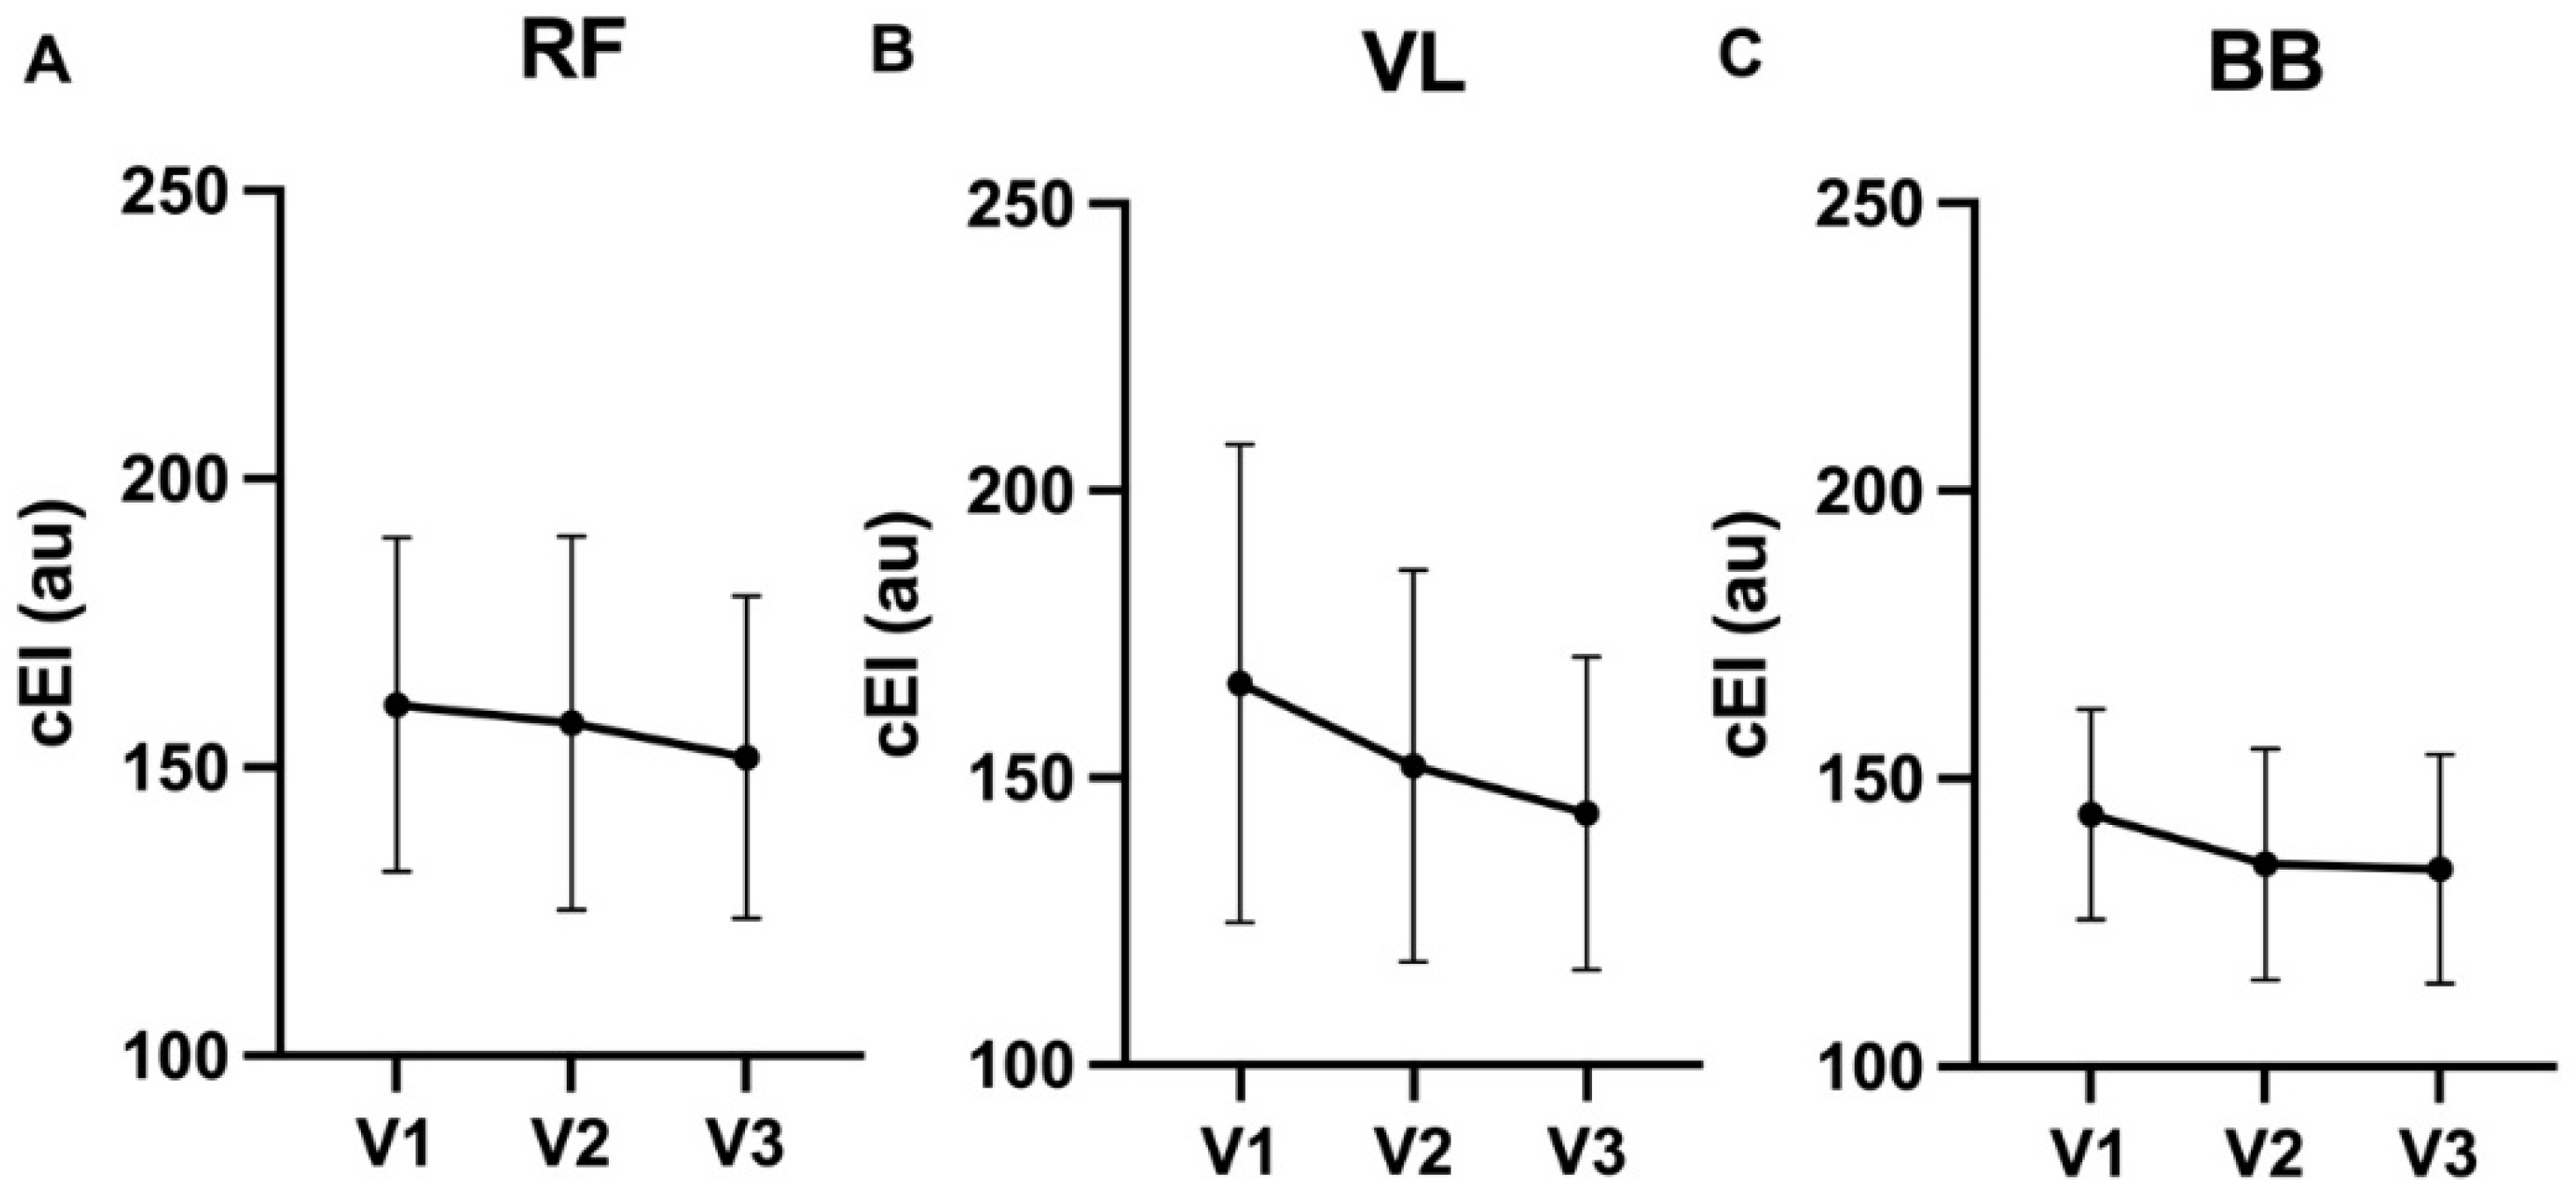
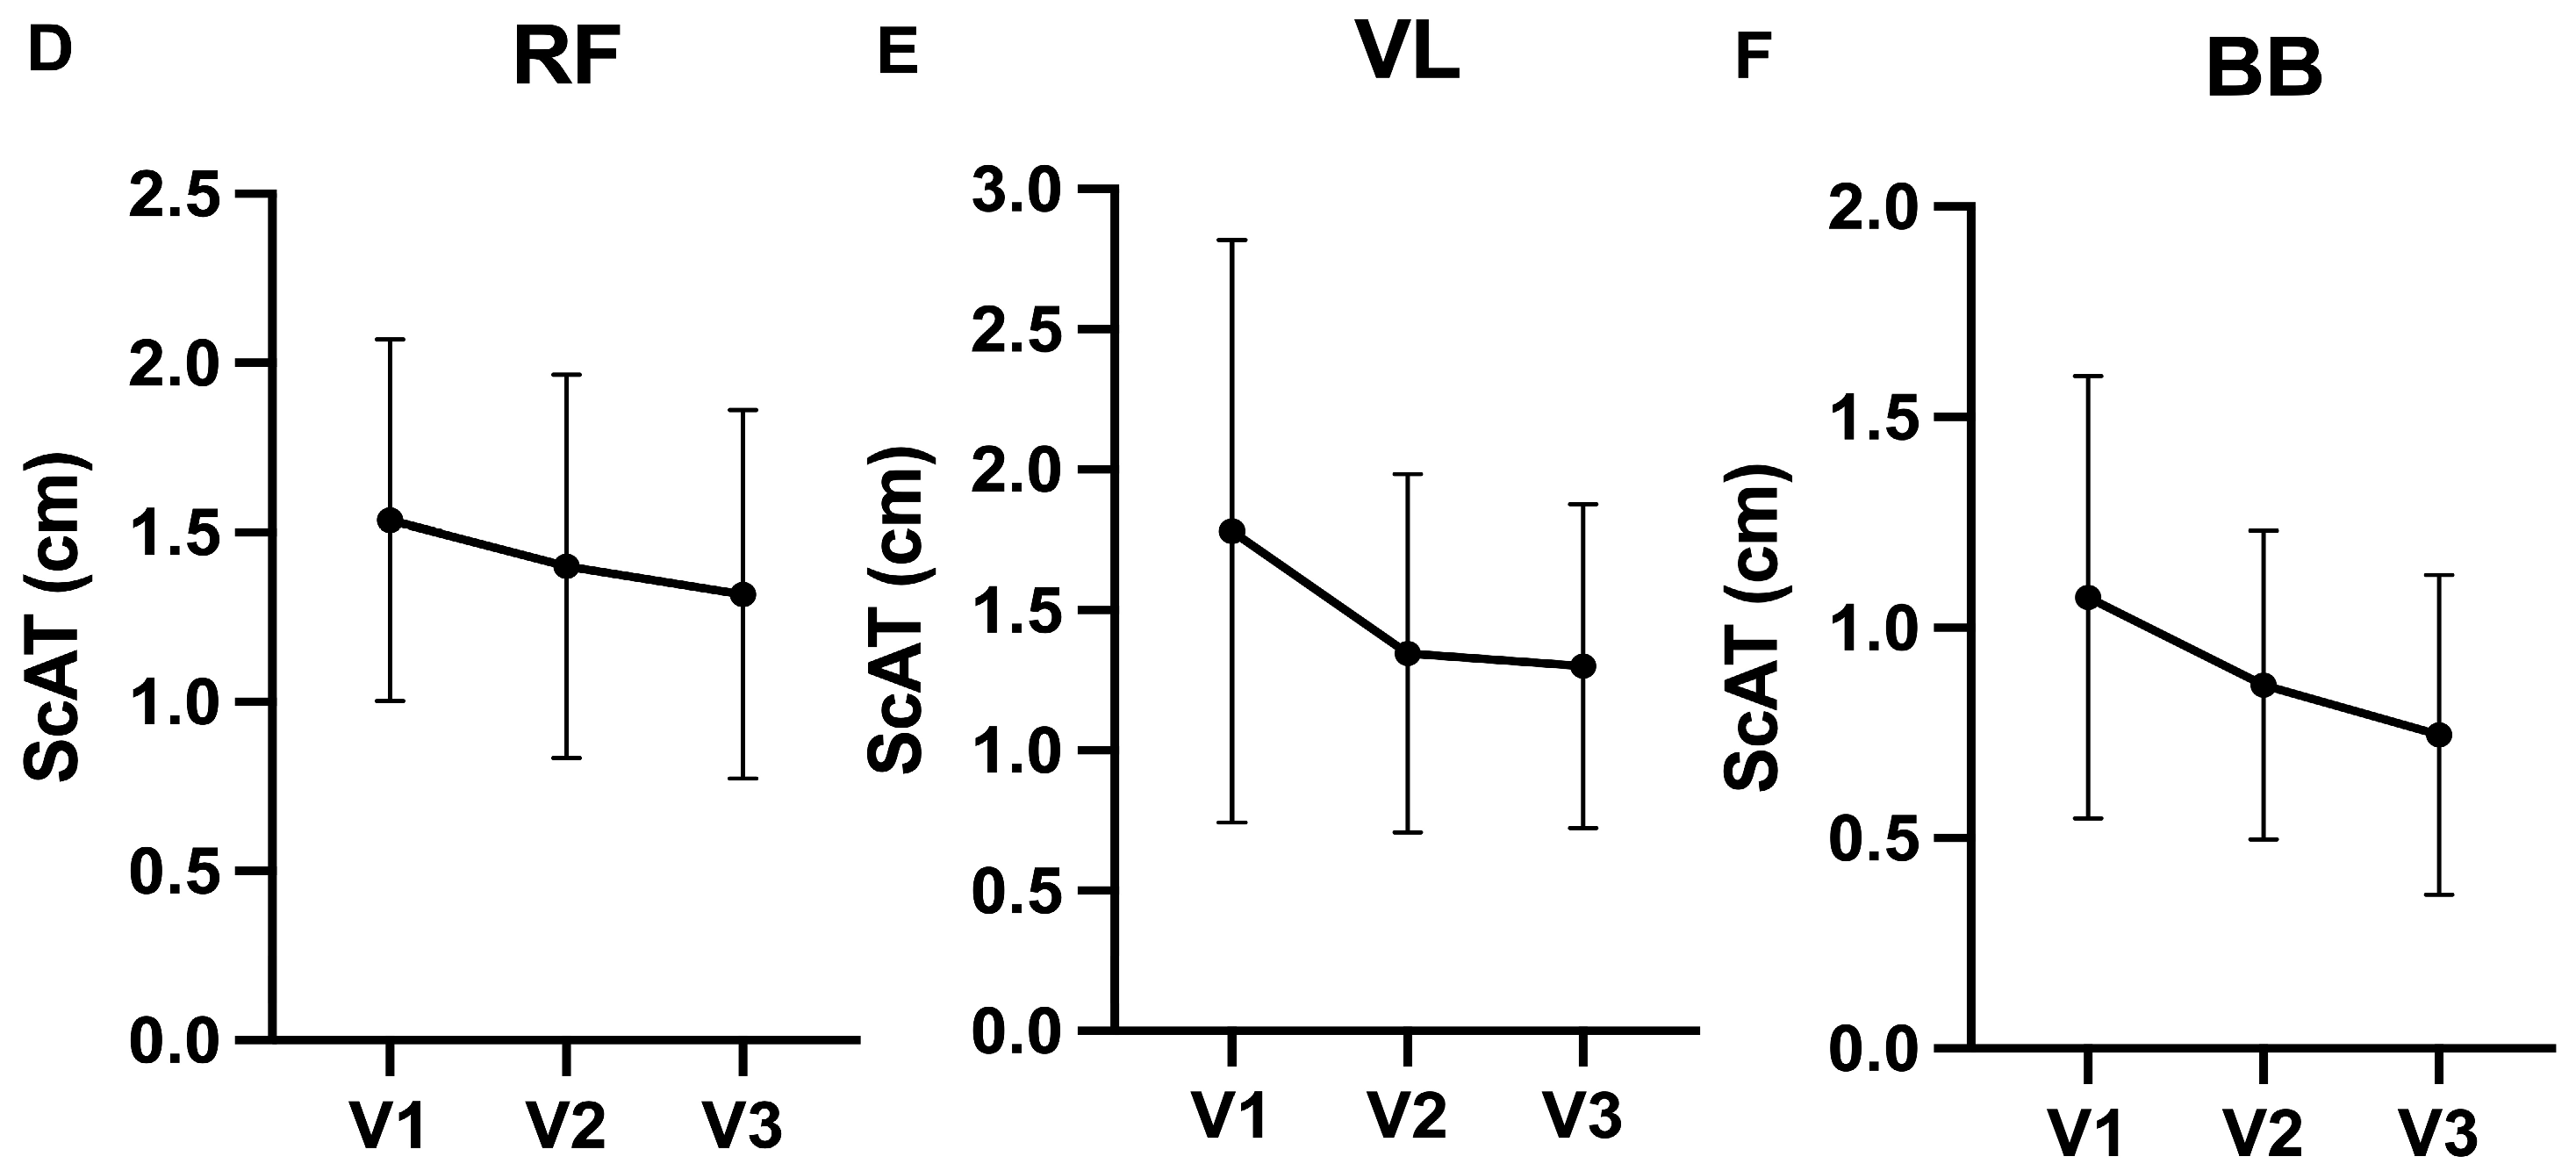
No main effects were observed for MT (cm) of the RF, VL or BB (p > 0.05). No main effects were observed for subcutaneous adipose tissue (ScAT; cm) of the RF, VL, or BB (p > 0.05). No main effects were observed for corrected echo intensity (cEI; a.u.) of the RF, VL, or BB (p > 0.05). No main effects were observed for cross-sectional area (CSA; cm2) of the RF, VL, or BB (p > 0.05). A time–duration of medication interaction was observed for BB CSA (F = 4.363, p = 0.031, partial η2 = 0.353). No time–dose or time–duration of medication interactions were observed for MT or CSA of the RF, VL, or BB (p > 0.05). Changes in muscle size (MT and CSA) are depicted as the mean and SD of all 11 participants in Figure 5.
Figure 5.
Changes in muscle thickness (MT; cm) of the rectus femoris (A), vastus lateralis (B), and biceps brachii (C); changes in cross-sectional area (CSA; cm2) of the rectus femoris (D), vastus lateralis (E), and biceps brachii (F). Data presented as pooled mean ± SD.
No time–dose or time–duration of medication interactions were observed for cEI or ScAT of the RF, VL, or BB (p > 0.05). Changes in cEI and ScAT are depicted as the mean and SD of all 11 participants in Figure 6.
Figure 6.
Changes in corrected echo intensity (cEI; a.u.) of the rectus femoris (A), vastus lateralis (B), and biceps brachii (C); changes in subcutaneous adipose tissue (ScAT; cm) of the rectus femoris (D), vastus lateralis (E), and biceps brachii (F). Data presented as pooled mean ± SD.
3.5. Dietary Intake
No changes were observed in 3-day averages for self-reported caloric intake (kcal/d; V1 = 1097 ± 449; V2 = 1239 ± 408; V3 = 1258 ± 448; p = 0.190) or protein intake (g/d; V1 = 53 ± 20; V2 = 63 ± 20; V3 = 62 ± 17; p = 0.256). No time–dose or time–duration of medication interactions were observed for caloric and protein intakes (p > 0.05).
4. Discussion
This exploratory study examined the effects of RT on body composition, muscle morphology, strength, and indices of metabolism in adult men and women using semaglutide. The weight loss effects of semaglutide and similar GLP-1 RAs are well documented [4,5,18], though the long-term effects of semaglutide on muscle mass, quality, and function remain unknown. Semaglutide use and its associated LBM loss [7] have raised concerns about potential problems for long-term health and discontinuation outcomes. The recent literature highlights that absolute muscle mass indeed decreases during semaglutide use, but relative muscle mass and functional capacity can improve [9]. The present study observed that FFM, muscle size (MT and CSA), and muscle quality (cEI) were maintained or marginally improved, strength increased, and participants experienced reductions in FM and BM during GLP-1+RT.
The present study’s findings for body mass (BM) suggest RT may help support weight loss during semaglutide use. A −3.618 kg mean change in BM was observed in 12 weeks with no time–dose or time–duration of medication interactions. A mean BM change of −0.25 kg/week was observed during GLP-1, whereas a mean change of −0.45 kg/week was observed during GLP-1+RT. In comparison, participants in the STEP-1 trial achieved a mean BM change of −0.225 kg/week [4]. Participants in the present study were previous users of semaglutide (mean duration of use: 9 mos.), yet the rate of weight loss was greater when RT was added to ongoing semaglutide use (GLP-1+RT). Importantly, given the design of this study, particularly the differences in the duration between GLP-1 (four weeks) and GLP-1+RT (eight weeks), as well as the lack of a true control group, we cannot confirm that this is strictly attributable to the addition of RT. Alternative explanations, including variation in medication dosing, dosing duration, effects of the medication alone, the duration of GLP-1+RT (eight weeks), changes in participant motivation, changes in appetite, participants’ overall dietary intake, or a combination of factors could have influenced this outcome. Participants in this study reported consuming < 1300 kcal/d at all three visits, though dietary and energy intake through self-report is historically rife with misinterpretations and underreporting [23]. Contrarily, if participants reported their dietary intake with relative accuracy, the severe caloric and protein deficits observed may have attenuated our findings for body composition, muscle morphology, and strength performance. Considering semaglutide’s well-established effects on dietary intake, the reported caloric and macronutrient intake for participants in this study is reasonable, despite the limitations of self-report and recall. Ultimately, more extensive work is necessary to highlight potential nutritional deficiencies in individuals using semaglutide and its effects on body composition, muscle mass, and function both with and without an exercise intervention. Our observations for BM are intriguing compared to other studies examining the combined effects of exercise and semaglutide. For example, a 2023 study reported greater overall reductions in body weight when semaglutide was used compared to when it was combined with thrice-weekly cycling for 12 weeks [24]. Similar to our study, participants used semaglutide for 20 weeks before exercise initiation, so it is difficult to discern if this 20-week period is responsible for these differences. Regardless, more work is needed that evaluates the combined effects of exercise, both aerobic and resistance, with semaglutide use on potentially augmenting reductions in BM while also enhancing various aspects of fitness and body composition.
Changes in BM in the present study fail to provide the full picture of compositional changes. Participants lost an average of 4.6 kg of FM and saw a 1.1 kg increase (not significant) in FFM. Due to the simultaneous decrease in FM and increase in FFM, our sample showed a greater reduction in BF% (−4.2% in 12 weeks) than that observed in the STEP-1 DXA subpopulation (−3.5% in 68 weeks) [5] Additionally, the changes in FM and FFM in this study occurred at a mean final dose of 1.6 mg, lower than the 2.4 mg used in most pivotal obesity trials [4,5,11], indicating RT alongside semaglutide may be equally beneficial for affecting desirable changes in body composition compared to higher dosing strategies of semaglutide alone. However, similar to BM, given the limitations of the study design, we cannot exclusively attribute these observations for FM and FFM to RT, as additional factors such as dosing and dose duration, timing, and effects of the medication could explain this. Long-term health and mortality are associated with BF%, and BF% is considered a better predictor of 15-year mortality risk than BMI or weight alone in adults aged 20–49 [25]. Thus, strategies and practices that focus on body composition rather than weight alone may better serve individuals using semaglutide.
A few important observations appear when examining the FFM responses in this study. First, FFM did not decrease from visit one to two (GLP-1), as was expected, but increased 0.4 kg in the absence of an exercise intervention. This discrepant finding may be due to differences in the measurement and partitioning of FFM vs. lean mass between devices (BOD POD vs. DXA), measurement error in the BOD POD, potential changes in dietary intake that were not detected in participants’ food logs, or the possibility that participants’ semaglutide use prior to the study’s onset may have already caused appreciable reductions in FFM. Given the design of this study, we are unable to confirm this, but the increase is intriguing nonetheless and should be explored further. Second, FFM increased 0.7 kg (not significant) during GLP-1+RT. This is an emergent finding, largely due to the lack of studies investigating the effects of RT in individuals using semaglutide. Reductions in lean mass are often observed in the context of a caloric deficit, though studies employing RT have been shown to help preserve lean mass while still promoting reductions in body and fat mass [26]. Within the context of this study, participants were in a caloric deficit, an environment that should have encouraged reductions in FFM. The 0.7 kg increase in FFM during GLP-1+RT suggests the RT protocol had an anabolic effect, irrespective of participants’ dietary intake, resulting in the marginal accretion of FFM, though this is speculative. That these participants were untrained also helps support this speculation, as this could have enhanced the stimulatory effect of RT. Collectively, additional studies are needed that address the combined and complementary effect of RT in individuals using semaglutide, with particular emphasis on new users and greater standardization of measurement techniques (DXA) for quantifying changes in FM and FFM/lean body mass.
Significant changes in leg press 10RM (+43.4 kg, p < 0.001) and chest press 10RM (+6.8 kg, p = 0.006) were observed during GLP-1+RT, whereas no significant changes were observed in handgrip strength (p = 0.170). A time–dose interaction was observed for chest press 10RM (5.120, p = 0.019, partial η2 = 0.390). The influence of dose-dependent effects on muscle strength requires further exploration, though a recent study reported relative strength improvements in individuals using GLP-1 RAs [9]. Importantly, the participants in this study were untrained when they started this study’s resistance training protocol. Untrained populations often see rapid increases in strength performance in response to RT, primarily due to initial neural adaptations [27]. Thus, our observations for the leg press and chest press were expected. Likewise, a recent meta-analysis reported that gains in muscle strength were not significantly impaired when longitudinal resistance training was performed in a caloric deficit, though gains in lean mass were impaired [28]. Collectively, our results add to the discussion concerning strength loss with semaglutide use and point to RT as an effective intervention for retaining or improving strength despite the medication’s effects on reducing overall body mass. Improvement or maintenance of strength is potentially of greater importance than concerns regarding muscle size in middle-aged adults with overweight or obesity. If absolute lean mass loss is an inevitable outcome during incretin use (which our results argue against), improvements in strength and function may compensate for that loss and prevent future injury, disability, or impacts on physical function.
No main effects were observed for ultrasound-derived MT, CSA, cEI, or ScAT at any of the three sites (RF, VL, BB). However, non-significant increases in MT of the VL and BB, as well as CSA of the RF and BB, were observed alongside non-significant improvements in ScAT and cEI. Moreover, the direction of changes in MT and ScAT across the 12 weeks align with our whole-body composition findings. Further work is necessary, but these findings support ultrasonography as a tool that can provide site-specific confirmation of whole-body composition patterns, though this is speculative and should be considered conservatively. Moreover, this highlights the importance of including multiple measurements of muscle size and composition in these types of studies, including whole body (DXA, BOD POD) and localized (ultrasound, MRI) measures. Importantly, given our sample size (n = 11), it is likely this study was underpowered, increasing the risk for type II error. With a larger sample, it is possible our observations for MT, cEI, and ScAT may have reached significance, though we cannot confirm this within the context of this study. Contrary to whole-body composition assessment and its initial warnings of lean mass loss, the findings from B-mode ultrasonography in the present study provide evidence that local muscular composition and local adipose tissue can remain stable or marginally improve, despite concurrent reductions in BM and FM, in individuals performing RT alongside semaglutide use. No significant changes in HbA1c or FBG were observed. Given that participants were previous users for ~9 months prior to the study, it is likely that the medication may have already influenced glycemic regulation. However, HbA1c decreased from 5.1% to 4.9% in 12 weeks, indicating that RT coupled with semaglutide use had a positive effect on glycemic regulation. Resting metabolic rate remained stable across the duration of the study, which is likely due to the observed retention of FFM, a significant contributor to RMR [29].
The RT protocol consisted of three sessions per week, with each session lasting ~40–45 min. A 92% training session adherence rate was achieved across the study duration, with missed sessions primarily due to weather, travel, holidays, or illness. The protocol instructed participants to perform the final set of each exercise to volitional failure, which has been shown to produce hypertrophic and strength adaptations across a wide range of repetitions [30]. Zero injuries occurred during the RT protocol. This protocol, consisting of three moderate-intensity sessions per week (beginning at 75% 10RM for main exercises), suggests that lean mass and muscle function can be positively affected without the implementation of highly specialized programming in this population. Additionally, a more rigorous or longer-term protocol may have accentuated the positive findings observed in the present study.
This study has several limitations. The present study’s sample (n = 11) was small, predominately female (n = 9), Caucasian (n = 10), and younger (41.5 y), which limits the generalizability of these findings to males and other demographics. Additionally, a priori power analysis recommended a sample size of 28. Given that our sample size was 11, this study was likely underpowered, which increases our risk of type II error; thus, our results should be interpreted with caution. Semaglutide dose, pre-study duration of use, and brand were not held constant, but participant dose and duration of medication use were controlled for and used as covariates in statistical analyses. Despite this, there was still variation in the dose and duration of use between participants. Thus, residual confounding cannot be excluded, as medication adherence, disparity regarding changes in body mass and composition due to dose, duration of use, and time, individual responsiveness to the medication, and differences in dietary intake between individuals and across time could have influenced outcomes in this study. Therefore, the effects of the RT intervention in this study should be interpreted in the context of these potentially influential variables. A major limitation of this study was that no control group was present in this study, as participants served as their own controls with the four-week period of no RT. Thus, we cannot definitively distinguish between the effects of RT, ongoing medication use, and time itself within this study’s findings. Future studies should incorporate a control group to help clearly discern the effects of semaglutide use with and without RT, while also assessing changes across a range of doses, durations of medication use, versions of GLP-1 RAs (dual- and triple-agonists), and explore discontinuation-related changes with and without an adjunct RT protocol. Participants in this study presented with moderate overweight and/or obesity (BMI = 30.3 kg/m2). Studies specifically investigating the combination of semaglutide and resistance training in individuals with more severe ranges of obesity are needed to understand their combined effects across a spectrum of BMIs. Further work is needed to elucidate the effects of these medications in combination with exercise in specific populations (e.g., different demographics, older adults, individuals with type 2 diabetes mellitus). Importantly, our study did not address bone health across time. In the context of significant reductions in body mass following GLP-1 RA use, bone mineralization is likely to be affected due to reduced mechanical loading on bone. Future studies should assess changes in bone health by monitoring bone mineral content and density alongside changes in fat and lean mass during GLP-1 RA use, and when exercise is implemented as an adjunct therapy. Additionally, future studies should investigate the effects of calcium and Vitamin D intake and supplementation as potential effectors that influence bone health during GLP-1 RA-induced changes in body mass. Furthermore, future work should address and monitor appetite and gastrointestinal symptoms that may occur during GLP-1 RA use, including nausea, satiety, vomiting, constipation, and aversions to food, all of which can impact overall dietary intake and one’s readiness and willingness to partake in exercise, which are key physiological inputs (i.e., nutrition and training quality/intensity) to outcomes in these types of studies. More work is necessary to determine the acute and chronic effects of GLP-1 RA use on muscle size, composition, and function using modalities such as B-mode ultrasonography, MRI, and functional outcomes using laboratory- or field-based tests, alongside mechanistic studies addressing molecular and adaptive responses of skeletal muscle to GLP-1 alone and in combination with exercise.
Collectively, an integrated approach in which GLP-1 receptor agonists (GLP-1 RAs) are used alongside proven lifestyle habits and interventions, including aerobic and resistance training, as well as requisite caloric and protein intake, is fundamental to long-term enhancement of cardiometabolic and musculoskeletal health. In the context of this study, resistance training and adequate dietary protein are particularly important for preserving FFM/LBM and muscle function during GLP-1 RA pharmacotherapy, while combined aerobic and resistance exercise represents a feasible adjunct to incretin-based treatment and may help support sustained health behaviors [31,32]. Importantly, direct evidence incorporating exercise following the discontinuation of GLP-1 RAs is limited. Following discontinuation, habitual resistance training is likely to be particularly beneficial for maintaining favorable changes in body composition and physical function [32]. The present study, which demonstrates that a feasible resistance training protocol maintained or modestly improved FFM/LBM and muscle characteristics while accelerating fat loss and improving strength, lends support for the incorporation of structured exercise and other lifestyle behaviors alongside GLP-1 RA therapy as part of a comprehensive strategy for long-term health [31,32].
5. Conclusions
The present study indicates that the addition of a feasible RT protocol to ongoing GLP-1 RA use may positively affect changes in FM and FFM, while improving indices of strength. Additionally, muscle thickness and quality were not negatively affected but were maintained or marginally improved. Overall, these changes occurred without evident decreases in RMR over 12 weeks. Despite limitations in the study design, this exploratory study lends support for adding RT as an adjunct to GLP-1 RA use and provides initial context for future randomized controlled trials examining their combined effects. With the recent approval of higher doses and other dual agonists, more work is necessary to observe the efficacy of different training strategies to improve these variables across the increasing diversity of medications and doses. The present study contributes to the ongoing discussion of the combined effects of RT with semaglutide use. Future studies should emphasize larger sample sizes, randomized controlled trials, and greater parity in dosing and dose duration, which will provide more definitive clinical guidance for prescribing exercise to individuals using GLP-1 RAs.
Author Contributions
Conceptualization, C.K.H. and R.A.G.; methodology, C.K.H., R.A.G., C.S., S.G., T.D.-M. and K.M.; formal analysis, C.K.H. and R.A.G.; investigation, C.K.H., J.R., A.M. (Adrien Martens), S.H., B.V., A.V., A.M. (Aidan Mclean) and S.B.; writing—original draft preparation, C.K.H. and R.A.G.; writing—review and editing, C.K.H., R.A.G., C.S., S.G., T.D.-M. and K.M.; funding acquisition, C.K.H. and R.A.G. All authors have read and agreed to the published version of the manuscript.
Funding
This study was financially supported by a student research grant from the Central States chapter of the American College of Sports Medicine.
Institutional Review Board Statement
The study was conducted in accordance with the Declaration of Helsinki and approved by the Institutional Review Board of Missouri State University (IRB-FY2026-125: Approval date:4 November 2025).
Informed Consent Statement
Written informed consent was collected from all participants in this study.
Data Availability Statement
Data can be made available upon request to the corresponding author.
Acknowledgments
During the preparation of this manuscript, the authors used BioRender. https://BioRender.com/7q5w5ks (accessed on 22 April 2026) for the purposes of methodology illustration.
Conflicts of Interest
The authors declare no conflicts of interest.
Abbreviations
The following abbreviations are used in this manuscript:
| RT | Resistance training |
| GLP-1 RA | Glucagon-like peptide-1 receptor agonist |
| FDA | Food and Drug Administration |
| LBM | Lean body mass |
| DXA | Dual-energy x-ray absorptiometry |
| MRI | Magnetic resonance imaging |
| B-mode | Brightness-mode |
| MT | Muscle thickness |
| EI | Echo intensity |
| EFOV | Extended field of view |
| CSA | Cross-sectional area |
| BMI | Body mass index |
| HbA1c | Glycated hemoglobin |
| PAR-Q | Physical activity readiness questionnaire |
| TFEQ | Three-factor eating questionnaire |
| RMR | Resting metabolic rate |
| FBG | Fasting blood glucose |
| RF | Rectus femoris |
| VL | Vastus lateralis |
| BB | Biceps brachii |
| ADP | Air displacement plethysmography |
| FM | Fat mass |
| FFM | Fat-free mass |
| BF | Body fat % |
| ScAT | Subcutaneous adipose tissue |
| 10RM | 10-repetition maximum |
| RPE | Rating of perceived exertion |
| AMRAP | As many reps as possible |
| BM | Body mass |
| cEI | Corrected echo intensity |
Appendix A. Resistance Training Protocol
Table A1.
Training session A.
Table A2.
Training session B.
References
- World Obesity Federation. World Obesity Day Atlases | Obesity Atlas 2023. 2023. Available online: https://data.worldobesity.org/publications/?cat=19 (accessed on 31 July 2026).
- Blundell, J.; Finlayson, G.; Axelsen, M.; Flint, A.; Gibbons, C.; Kvist, T.; Hjerpsted, J.B. Effects of once-weekly semaglutide on appetite, energy intake, control of eating, food preference and body weight in subjects with obesity. Diabetes Obes. Metab. 2017, 19, 1242–1251. [Google Scholar] [CrossRef] [Scilit] [PubMed]
- Friedrichsen, M.; Breitschaft, A.; Tadayon, S.; Wizert, A.; Skovgaard, D. The effect of semaglutide 2.4 mg once weekly on energy intake, appetite, control of eating, and gastric emptying in adults with obesity. Diabetes Obes. Metab. 2021, 23, 754–762. [Google Scholar] [CrossRef] [Scilit] [PubMed]
- Wilding, J.P.H.; Batterham, R.L.; Calanna, S.; Davies, M.; Van Gaal, L.F.; Lingvay, I.; McGowan, B.M.; Rosenstock, J.; Tran, M.T.; Wadden, T.A.; et al. Once-Weekly Semaglutide in Adults with Overweight or Obesity. N. Engl. J. Med. 2021, 384, 989–1002. [Google Scholar] [CrossRef] [Scilit] [PubMed]
- Wadden, T.A.; Bailey, T.S.; Billings, L.K.; Davies, M.; Frias, J.P.; Koroleva, A.; Lingvay, I.; O’neil, P.M.; Rubino, D.M.; Skovgaard, D.; et al. Effect of subcutaneous semaglutide vs placebo as an adjunct to intensive behavioral therapy on body weight in adults with overweight or obesity: The STEP 3 randomized clinical trial. JAMA 2021, 325, 1403–1413. [Google Scholar] [CrossRef] [Scilit] [PubMed]
- Mechanick, J.I.; Butsch, W.S.; Christensen, S.M.; Hamdy, O.; Li, Z.; Prado, C.M.; Heymsfield, S.B. Strategies for minimizing muscle loss during use of incretin-mimetic drugs for treatment of obesity. Obes. Rev. 2024, 26, e13841. [Google Scholar] [CrossRef] [Scilit] [PubMed]
- Bikou, A.; Dermiki-Gkana, F.; Penteris, M.; Constantinides, T.K.; Kontogiorgis, C. A systematic review of the effect of semaglutide on Lean Mass: Insights from clinical trials. Expert Opin. Pharmacother. 2024, 25, 611–619. [Google Scholar] [CrossRef] [Scilit] [PubMed]
- Locatelli, J.C.; Costa, J.G.; Haynes, A.; Naylor, L.H.; Fegan, P.G.; Yeap, B.B.; Green, D.J. Incretin-based weight loss pharmacotherapy: Can resistance exercise optimize changes in body composition? Diabetes Care 2024, 47, 1718–1730. [Google Scholar] [CrossRef] [Scilit] [PubMed]
- Langer, H.T.; Gilmore, N.K.; Hayden, C.M.T.; Roux, J.; Bariohay, B.; Rouquet, T.; Awada, M.; Marcotorchino, J.; Bournot, L.; Nunn, E.; et al. Weight loss with GLP-1 medicines does not result in a disproportionate loss of muscle mass or function in obese mice and humans. Cell Rep. Med. 2026, 7, 102665. [Google Scholar] [CrossRef] [Scilit] [PubMed]
- Tinsley, G.M.; Heymsfield, S.B. Fundamental Body Composition Principles Provide Context for Fat-Free and Skeletal Muscle Loss with GLP-1 RA Treatments. J. Endocr. Soc. 2024, 8, bvae164. [Google Scholar] [CrossRef] [Scilit]
- Kakegawa, T.; Sugimoto, K.; Saito, K.; Yunaiyama, D.; Araki, Y.R.; Wada, T.; Takahashi, H.; Yoshimasu, Y.; Takeuchi, H.; Itoi, T. Favorable liver and skeletal muscle changes in patients with MASLD and T2DM receiving glucagon-like peptide-1 receptor agonist: A prospective cohort study. Medicine 2024, 103, e38444. [Google Scholar] [CrossRef] [Scilit] [PubMed]
- Voskuil, C.; Dudar, M.; Zhang, Y.; Carr, J. Skeletal Muscle Ultrasonography and Muscle Fitness Relationships: Effects of Scanning Plane and Echogenicity Correction. Muscles 2023, 2, 109–118. [Google Scholar] [CrossRef] [Scilit] [PubMed]
- Stock, M.S.; Thompson, B.J. Echo intensity as an indicator of skeletal muscle quality: Applications, methodology, and future directions. Eur. J. Appl. Physiol. 2020, 121, 369–380. [Google Scholar] [CrossRef] [Scilit] [PubMed]
- Yuan, H.; Kim, M.K. Exploring the relationship between ultrasound parameters and muscle strength in older adults: A meta-analysis of sarcopenia-related exercise performance. Front. Med. 2024, 11, 1429530. [Google Scholar] [CrossRef] [Scilit] [PubMed]
- Broeder, C.; Burrhus, K.; Svanevik, L.S.; Wilmore, J.H. The effects of either high-intensity resistance or endurance training on resting metabolic rate. Am. J. Clin. Nutr. 1992, 55, 802–810. [Google Scholar] [CrossRef] [Scilit] [PubMed]
- Hunter, G.R.; Byrne, N.M.; Sirikul, B.; Fernández, J.R.; Zuckerman, P.A.; Darnell, B.E.; Gower, B.A. Resistance Training Conserves Fat-free Mass and Resting Energy Expenditure Following Weight Loss. Obesity 2008, 16, 1045–1051. [Google Scholar] [CrossRef] [Scilit] [PubMed]
- Wan, Y.; Su, Z. The Impact of Resistance Exercise Training on Glycemic Control Among Adults with Type 2 Diabetes: A Systematic Review and Meta-Analysis of Randomized Controlled Trials. Biol. Res. Nurs. 2024, 26, 597–623. [Google Scholar] [CrossRef] [Scilit] [PubMed]
- Marmett, B.; da Silva, I.; Lira, F.; Dorneles, G. Anti-obesity drugs alone or combined with exercise training in the management of obesity: A systematic review with meta-analysis. Transl. Exerc. Biomed. 2025, 2, 51–62. [Google Scholar] [CrossRef] [Scilit]
- Jensen, S.B.K.; Blond, M.B.; Sandsdal, R.M.; Olsen, L.M.; Juhl, C.R.; Lundgren, J.R.; Janus, C.; Stallknecht, B.M.; Holst, J.J.; Madsbad, S.; et al. Healthy weight loss maintenance with exercise, GLP-1 receptor agonist, or both combined followed by one year without treatment: A post-treatment analysis of a randomised placebo-controlled trial. eClinicalMedicine 2024, 69, 102475. [Google Scholar] [CrossRef] [Scilit] [PubMed]
- Tinsley, G.M.; Nadolsky, S. Preservation of lean soft tissue during weight loss induced by GLP-1 and GLP-1/GIP receptor agonists: A case series. Sage Open Med. Case Rep. 2025, 13, 2050313X251388724. [Google Scholar] [CrossRef] [Scilit] [PubMed]
- Young, H.; Jenkins, N.T.; Zhao, Q.; Mccully, K.K. Measurement of intramuscular fat by muscle echo intensity. Muscle Nerve 2015, 52, 963–971. [Google Scholar] [CrossRef] [Scilit] [PubMed]
- Cohen, J. Statistical Power Analysis for the Behavioral Sciences, 2nd ed.; Routledge: New York, NY, USA, 1988. [Google Scholar] [CrossRef] [Scilit]
- Ravelli, M.N.; Schoeller, D.A. Traditional Self-Reported Dietary Instruments Are Prone to Inaccuracies and New Approaches Are Needed. Front. Nutr. 2020, 7, 90. [Google Scholar] [CrossRef] [Scilit] [PubMed]
- Ingersen, A.; Schmücker, M.; Alexandersen, C.; Graungaard, B.; Thorngreen, T.; Borch, J.; Holst, J.J.; Helge, J.W.; Dela, F. Effects of Aerobic Training and Semaglutide Treatment on Pancreatic β-Cell Secretory Function in Patients with Type 2 Diabetes. J. Clin. Endocrinol. Metab. 2023, 108, 2798–2811. [Google Scholar] [CrossRef] [Scilit] [PubMed]
- Mainous, A.G.; Yin, L.; Wu, V.; Sharma, P.; Jenkins, B.M.; Saguil, A.A.; Nelson, D.S.; Orlando, F.A. Body Mass Index vs Body Fat Percentage as a Predictor of Mortality in Adults Aged 20–49 Years. Ann. Fam. Med. 2025, 23, 240330. [Google Scholar] [CrossRef] [Scilit] [PubMed]
- Roth, C.; Schoenfeld, B.J.; Behringer, M. Lean mass sparing in resistance-trained athletes during caloric restriction: The role of resistance training volume. Eur. J. Appl. Physiol. 2022, 122, 1129–1151. [Google Scholar] [CrossRef] [Scilit] [PubMed]
- Škarabot, J.; Brownstein, C.G.; Casolo, A.; Del Vecchio, A.; Ansdell, P. The knowns and unknowns of neural adaptations to resistance training. Eur. J. Appl. Physiol. 2020, 121, 675–685. [Google Scholar] [CrossRef] [Scilit] [PubMed]
- Murphy, C.; Koehler, K. Energy Deficiency Impairs Resistance Training Gains in Lean Mass but not Strength: A Meta-Analysis and Meta-Regression. Scand. J. Med. Sci. Sports 2021, 32, 125–137. [Google Scholar] [CrossRef] [Scilit] [PubMed]
- Wang, Z.; Heshka, S.; Gallagher, D.; Boozer, C.N.; Kotler, D.P.; Heymsfield, S.B. Resting energy expenditure-fat-free mass relationship: New insights provided by body composition modeling. Am. J. Physiol.-Endocrinol. Metab. 2000, 279, E539–E545. [Google Scholar] [CrossRef] [Scilit] [PubMed]
- Lopez, P.; Radaelli, R.; Taaffe, D.R.; Newton, R.U.; Galvão, D.A.; Trajano, G.S.; Teodoro, J.L.; Kraemer, W.J.; Häkkinen, K.; Pinto, R.S. Resistance Training Load Effects on Muscle Hypertrophy and Strength Gain. Med. Sci. Sports Exerc. 2020, 53, 1206–1216. [Google Scholar] [CrossRef] [Scilit] [PubMed]
- Joy, E.; Bonnet, J. Lifestyle First and Lifestyle Always, Does Not Mean Lifestyle Only: Reimagining Cardiometabolic Care in the Era of GLP-1 Receptor Agonists. Am. J. Lifestyle Med. 2026, 25, 15598276261450530. [Google Scholar] [CrossRef] [Scilit] [PubMed]
- Zeigler, Z.; Havenar, J.; Smith, E.; Tang, L.; Marthaler, C.; Gardner, K. Structured Exercise During and After Incretin-Based Pharmacotherapy Discontinuation: A Narrative Review of Mechanisms, Evidence, and Prescription Guidance. Healthcare 2026, 14, 2345. [Google Scholar] [CrossRef] [Scilit] [PubMed]

Disclaimer/Publisher’s Note: The statements, opinions and data contained in all publications are solely those of the individual author(s) and contributor(s) and not of MDPI and/or the editor(s). MDPI and/or the editor(s) disclaim responsibility for any injury to people or property resulting from any ideas, methods, instructions or products referred to in the content. |
© 2026 by the authors. Licensee MDPI, Basel, Switzerland. This article is an open access article distributed under the terms and conditions of the Creative Commons Attribution (CC BY) license.