


Abstract
The development of a green hydrogen industry is a strategic priority for Russia’s energy transition, yet the dynamics of scaling up this nascent sector remain poorly understood. This study uses agent-based modeling (ABM) to simulate the co-evolution of Russia’s electricity, hydrogen, and electrolyzer sectors over 2024–2050. The model incorporates three types of heterogeneous agents (power producers, hydrogen producers, and electrolyzer manufacturers) operating under bounded rationality. Four scenarios are examined across 50 Monte Carlo runs each, varying the electrolyzer learning rate (10–25%), willingness to pay for green hydrogen (2–6 $/kg), and government support intensity. The results reveal an endogenous three-phase development pattern: Phase I (2024–2028) dominated by renewable capacity build-up reaching ~30 GW; Phase II (2029–2040) characterized by rapid electrolyzer deployment scaling to 14.5 GW; and Phase III (2041–2050) marked by stabilization at approximately 30 GW producing 1.12 Mt/year at 3.1 $/kg. Two critical thresholds are identified: renewable capacity exceeding 30–38 GW and low-cost electricity above 4–7 TWh/year. The electrolyzer learning rate emerges as the most influential parameter, while the pessimistic scenario confirms market failure without a green premium (WTP < 2 $/kg). Strategic investment losses of 2–6 billion USD are necessary catalysts for industry emergence. Russia’s 2030 production target (0.55 Mt) is found structurally infeasible under all scenarios.
1. Introduction
Green hydrogen is expected to play a central role in decarbonizing energy-intensive industries, serving as a versatile energy carrier with zero direct CO2 emissions during production [1,2,3]. The global green hydrogen market is projected to expand from its current niche status with only 5.2 GW of installed electrolyzer capacity worldwide in 2024 [4] to a mass market requiring several hundred gigawatts of electrolyzer capacity by 2050 [1,5]. However, this expansion faces significant coordination challenges across three interdependent sectors: renewable electricity generation, electrolyzer deployment, and electrolyzer manufacturing [6].
Understanding these coordination challenges requires analytical tools capable of capturing the multi-actor, decentralized nature of hydrogen market development. Energy system optimization models have been the dominant analytical tool for energy transitions [7,8,9,10], but they assume a central planner with perfect information. This assumption is poorly suited to the multi-actor environment in which hydrogen markets must develop [11,12]. In contrast, agent-based models (ABMs) offer a complementary approach by representing heterogeneous, boundedly rational actors whose decentralized investment decisions generate emergent system dynamics [13,14].
Recently, ABMs have been successfully applied to electricity market transformations and, more recently, to hydrogen technology adoption [6,15,16]. Unlike conventional models that frequently rely on the representative agent assumption, ABM explicitly represents individual, heterogeneous agents—encompassing entities like households, firms, and investors—characterized by unique attributes, behaviors, and decision-making rules [17,18,19,20]. This allows for the modeling of preference diversity [21] and varied responses to policy interventions [17]. In addition, employing a bottom-up approach, ABM generates aggregate macroeconomic outcomes from the multitude of decentralized decisions and micro-level interactions, facilitating the modeling of complex, non-linear, and potentially path-dependent system dynamics [19,20,22].
However, existing contributions remain limited in two important respects. First, only a small number of studies model the simultaneous co-evolution of electricity generation, hydrogen production, and electrolyzer manufacturing within a unified framework [23]. Second, these analyses are typically calibrated to Western European contexts, leaving open the question of how structural differences in energy systems, market conditions, and policy environments affect transition dynamics [24,25].
This gap is particularly important given the diversity of global energy systems. Countries differ substantially in renewable resource endowments, fossil fuel prices, electricity market structures, and investment risks—all of which can fundamentally alter the economics and timing of hydrogen scale-up.
Differences in market structure, regulatory institutions, and capital costs further amplify divergence in investment incentives [5,26]. As a result, insights derived from one national context cannot be directly generalized without careful adaptation and validation.
This study contributes to the literature by addressing these gaps through the development of a context-specific, multi-sector agent-based model of green hydrogen industry formation. Building on and extending existing ABM frameworks, the paper introduces a calibrated model that captures the co-evolution of three interdependent sectors—power generation, hydrogen production, and electrolyzer manufacturing—under heterogeneous investment behavior and imperfect coordination.
The main scientific contributions of this study are threefold. First, it provides a systematic adaptation of a coupled electricity–hydrogen ABM to a structurally distinct energy system, enabling analysis of how transition dynamics depend on underlying system characteristics. Second, it identifies endogenous development phases and critical investment thresholds governing industry emergence, highlighting the role of coordination constraints and learning effects. Third, it quantifies the conditions under which a hydrogen industry becomes viable, including the interplay between technology learning, willingness to pay, and policy support.
Empirically, the model is applied to the case of Russia, which represents a particularly relevant but understudied context due to its large energy system, low domestic fossil fuel prices, and relatively early-stage renewable deployment. Thus, Russia occupies a unique position in this global landscape. As the world’s fourth-largest electricity producer with demand of approximately 1200 TWh/year [27], Russia possesses substantial renewable energy potential that remains largely untapped. In 2024 installed renewable capacity stood at only 6.5 GW, representing less than 3% of total generation capacity [28]. The Russian government has set ambitious targets for hydrogen development: 14.8 GW of renewables and 2.0 GW of electrolyzer capacity by 2030, with a production target of 0.55 Mt of green hydrogen annually [29,30]. However, achieving these targets requires overcoming structural barriers including low domestic gas prices (~15 $/MWh) [31], limited existing renewable infrastructure, and elevated investment risk reflected in a discount rate of approximately 8% [32]. These characteristics provide a useful test case for examining how hydrogen transitions unfold under less favorable initial conditions compared to leading economies.
The objective of the study is to evaluate the endogenous development trajectory of a Russian green hydrogen market and to identify the economic thresholds and policy levers that determine its emergence. Specifically, the study addresses the following research questions:
RQ1. What critical thresholds govern the emergence of a green hydrogen industry in Russia, and how do they compare to those identified for Germany?
RQ2. What three-phase development dynamics arise endogenously from agent interactions, and what drives transitions between phases?
RQ3. How sensitive is the industry trajectory to the electrolyzer learning rate, willingness to pay for green hydrogen, and government support?
RQ4. Are Russia’s 2030 national targets for renewable and electrolyzer capacity achievable under realistic assumptions?
The remainder of this paper is structured as follows: Section 2 describes the methodology, including model adaptation, parameterization, and scenario design. Section 3 presents the results across four scenarios with cross-country validation. Section 4 discusses the findings in relation to existing literature and policy implications. Section 5 concludes with recommendations.
2. Methodology
2.1. Model Framework and Adaptation
This study adapts the agent-based model of Jesse et al. (2026) [23], originally developed in NetLogo for the German electricity and hydrogen markets, to the Russian context. The adaptation was implemented in Python (3.14.3), enabling Monte Carlo simulation with 50 independent runs per scenario. The model preserves the core architecture of three interacting agent types—power producers (PP), hydrogen producers (HP), and electrolyzer manufacturers (EM)—while recalibrating parameters to reflect Russian energy system characteristics. The simulation covers the period 2024–2050 with annual time steps.
The key adaptations for the Russian context include: (i) replacement of the energy-only market clearing mechanism with a hybrid model incorporating hydroelectric base-load, dedicated renewable electricity for hydrogen production, merit-order effects, and curtailment-based excess electricity; (ii) recalibration of all techno-economic parameters to Russian conditions (Table 1); (iii) introduction of a government support multiplier reflecting Russia’s state-directed investment environment [9,33]; and (iv) incorporation of a feedback loop whereby agents do not invest when projected electrolyzer utilization falls below 15%.
Table 1.
Model initialization parameters for Russia and Germany.
2.2. Agent Behavior and Investment Decisions
Following Jesse et al. [23], each agent evaluates investment opportunities using the ratio of net present value (NPV) to investment costs, compared against an individual investment threshold θ (Equation (1)):
Agent heterogeneity is represented through varying initial thresholds, which are dynamically updated based on past asset performance. Strategic investment behavior is modeled by allowing θ to take negative values (θmin < 0), representing willingness to accept short-term losses for anticipated first-mover advantages.
Power producers invest in renewable assets based on NPV analysis incorporating capacity factors drawn from weather-dependent distributions (mean CF = 0.21 for the Russian renewable mix) [35,36]. Hydrogen producers evaluate electrolyzer investments using a levelized cost of hydrogen (LCOH) model that accounts for both capital and electricity costs (Equation (2)).
where CE is the electrolyzer cost ($/kW), CRF the capital recovery factor, OM the O&M rate (2%), CF the capacity factor (utilization), Pelc the electricity price ($/MWh), 33.33 kWh/kg the lower heating value of hydrogen, and ηE the electrolyzer efficiency (70%) [15,18].
The willingness to pay (WTP) of industrial off-takers for green hydrogen—expressed in $/kg and treated as a heterogeneous, agent-specific parameter drawn from a calibrated distribution—follows a piecewise-linear demand curve with five production-volume segments, calibrated to Russian industrial demand conditions and bounded by WTP_min = 2.0 $/kg (commodity bulk applications) and WTP_max = 6.0 $/kg (high-value specialty chemical and refining off-takers) (all monetary values in 2024 USD). The willingness to pay for green hydrogen follows a demand curve that decreases with cumulative production volume, reflecting heterogeneous industrial demand segments [23,37]. Electrolyzer manufacturers invest in new production facilities based on demand signals. Production costs decline according to a single-factor learning curve (Equation (3)), with learning rates of 10–25% consistent with the range reported in the literature [9,38,39]. Electrolyzer learning rate (LR) defined as the percentage reduction in unit capital cost per doubling of cumulative installed electrolyzer capacity.
The electrolyzer capital cost follows a one-factor learning curve, where each doubling of cumulative installed capacity reduces costs by the learning rate . denotes the initial specific investment cost at the reference capacity , while the exponent ensures that decreases by a factor of ) every time cumulative capacity doubles.
The capital recovery factor CRF converts a one-time investment into an equivalent annual payment over the asset’s lifetime T at discount rate r. It is used to annualize capital expenditures in the LCOH calculation, ensuring consistency with yearly operating and revenue flows. The capital recovery factor is computed as:
with discount rate r = 8% and electrolyzer lifetime T = 20 years for the Russian baseline [32], compared to r = 5–6% and T = 15–25 years in the German model [23]. The choice of r = 8% reflects Russia’s elevated country risk premium relative to mature OECD markets. According to Damodaran’s annually updated country risk premium estimates [40], Russia’s equity risk premium has been consistently 3–5 percentage points above the mature-market benchmark (≈4.5%) over the 2020–2024 period, commensurate with its below-investment-grade sovereign credit rating since 2022. Energy project financing data for emerging-market renewables corroborate a 7–10% range for large capital-intensive infrastructure in comparable jurisdictions. We adopt r = 8% as a moderate and empirically defensible central estimate—lower than the 10% ceiling associated with speculative-grade project finance, but meaningfully higher than the 5–6% appropriate for Germany’s stable regulatory environment. The resulting capital recovery factor (CRF = 0.1019 at r = 0.08, T = 20 years) is 16.8% higher than the German equivalent (CRF ≈ 0.0872 at r = 0.06, T = 20 years), correctly penalizing capital-intensive electrolyzer investment under Russia-specific risk conditions.
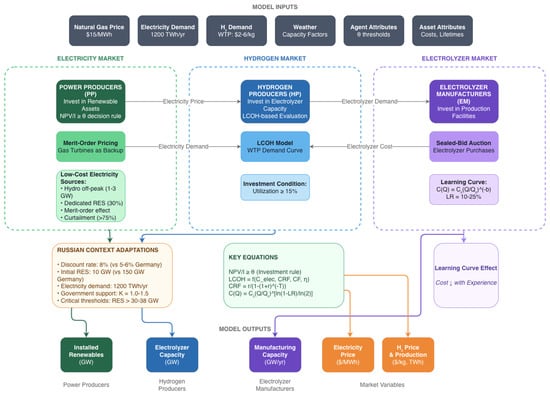
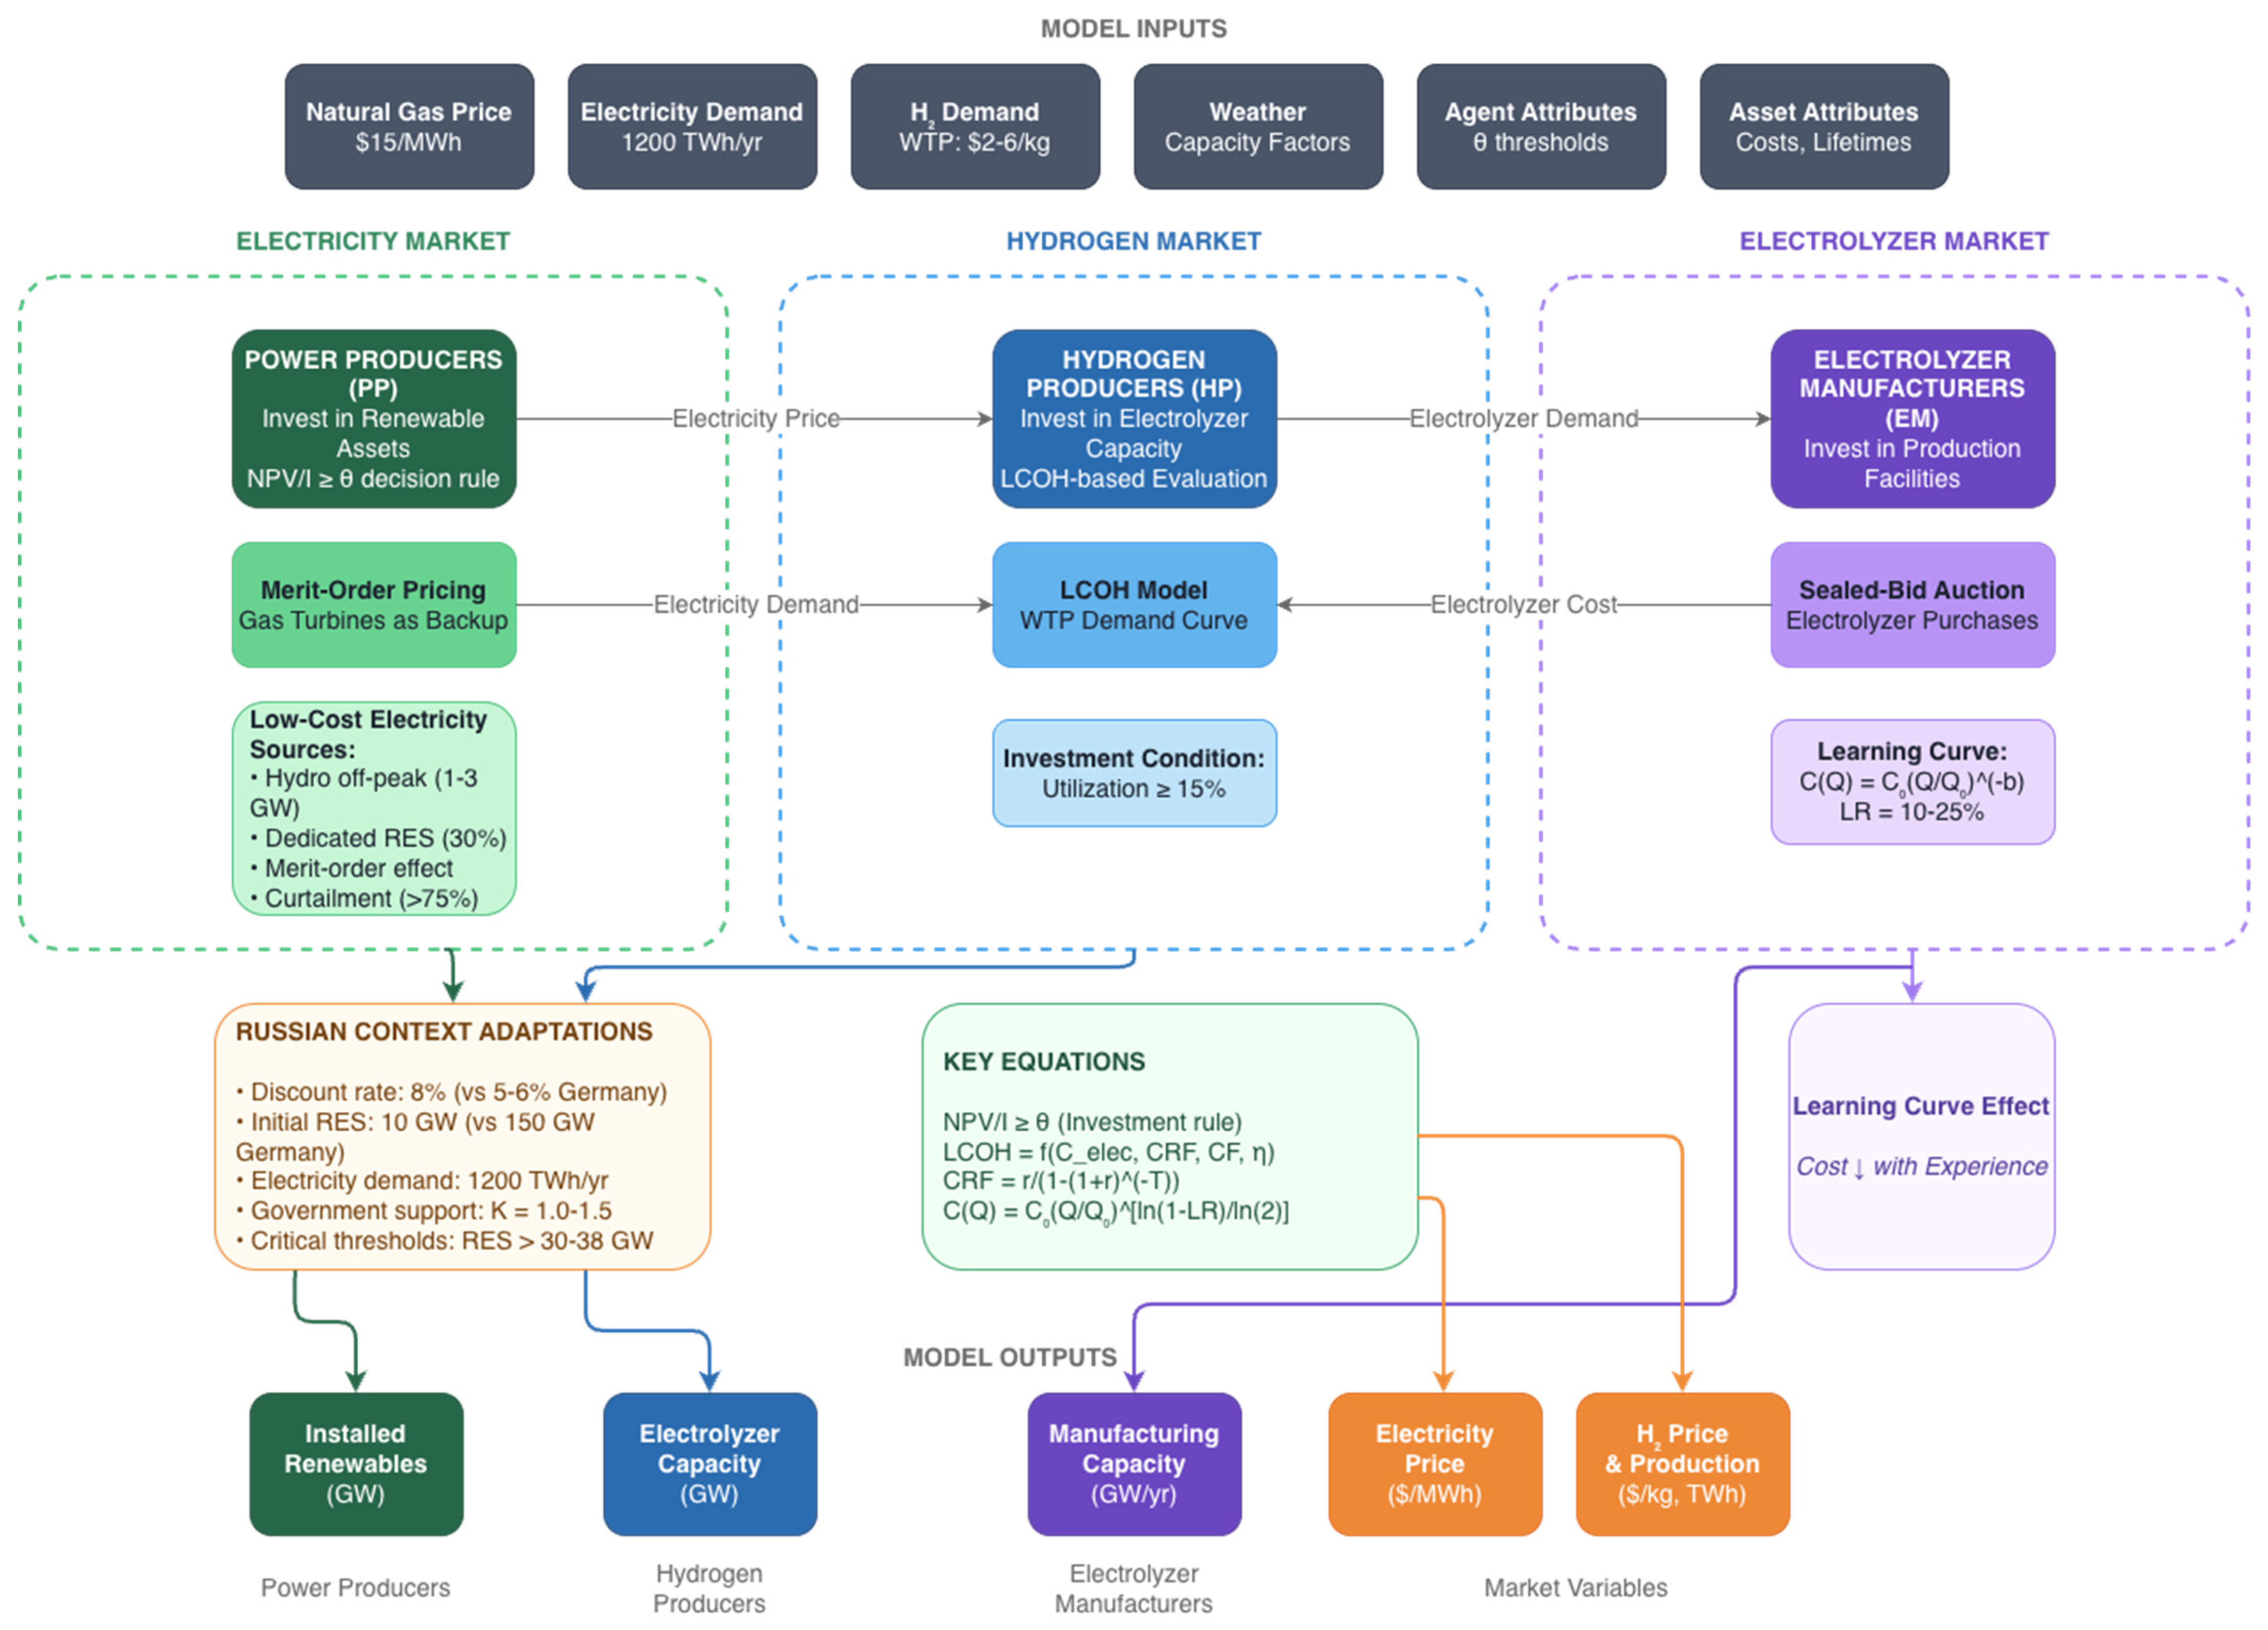
The diagram illustrates the integrated modeling framework adapted from Jesse et al. (2026) [23] for the Russian context. Three agent types—Power Producers (PP), Hydrogen Producers (HP), and Electrolyzer Manufacturers (EM)—operate in interconnected electricity, hydrogen, and electrolyzer markets. Power producers invest in renewable assets based on NPV analysis using heterogeneous investment thresholds θ, while merit-order pricing with gas turbine backup determines electricity prices. Hydrogen producers evaluate electrolyzer investments using a Levelized Cost of Hydrogen (LCOH) model against a piecewise-linear willingness-to-pay (WTP) demand curve, subject to a minimum 15% utilization constraint. Electrolyzer manufacturers participate in sealed-bid auctions and benefit from experience curve effects (learning rate 10–25%) that reduce production costs with cumulative capacity. Key feedback loops connect the markets: electricity prices affect hydrogen production economics, hydrogen demand drives electrolyzer procurement, and manufacturing scale influences equipment costs. The model incorporates Russian-specific parameters including an 8% discount rate, 10 GW initial renewable capacity, 1200 TWh annual electricity demand, and government support multipliers (k = 1.0–1.5). Critical deployment thresholds are identified at 30–38 GW of renewable capacity and 4–7 TWh/year of cheap electricity availability.
2.3. Electricity Pricing for Hydrogen Production
Unlike the German model, where excess electricity arises solely from renewable overproduction, the Russian model incorporates four distinct sources of low-cost electricity for electrolysis:
- Hydroelectric off-peak capacity: 1–3 GW of dedicated capacity at 3000–4500 annual operating hours, reflecting Russia’s substantial hydroelectric resources [8,14].
- Dedicated renewables (co-location): 30% of electrolyzer capacity assumed to have co-located renewable generation [39,40].
- Merit-order effect: as the renewable share increases, grid electricity prices decline during an increasing fraction of hours [16,26].
- Curtailment utilization: excess renewable generation beyond 75% of demand becomes available at reduced cost [41].
The resulting electricity price for hydrogen production ranges from 8 to 24 $/MWh, declining over time as renewable capacity expands. Even at off-peak hydroelectric rates, transmission and grid fees establish a floor of approximately 8 $/MWh [8,31].
2.4. Model Parameterization
Table 1 presents the key initialization parameters and their sources.
Key differences between Russian and German parameterization include: (i) 26× lower initial renewable capacity (6.5 vs. 150 GW) reflecting Russia’s later-stage energy transition; (ii) 2.6× higher electricity demand (1200 vs. 462 TWh) requiring proportionally greater renewable build-out for equivalent penetration; (iii) 60% higher discount rate (8% vs. 5%) reflecting elevated investment risk; (iv) 19× lower CO2 price (5 vs. 95 $/tCO2) reducing the carbon cost differential between gray and green hydrogen; and (v) 55% lower natural gas price (15 vs. 33 $/MWh) strengthening gray hydrogen competitiveness [25,31]. These structural differences necessitate complete model recalibration rather than simple parameter adjustment.
The Baseline scenario (LR = 18%) represents the most likely trajectory given current policy commitments and international technology trends [38,40]. Government support (k = 1.3) represents Russia’s hydrogen roadmap targets through 2030 [29,30]. The Conservative scenario (LR = 10%) matches the assumption of Jesse et al. [23] with non-strategic behavior (θmin = 0). The Optimistic scenario (LR = 25%) reflects rapid learning with strong policy support [42]. The Pessimistic scenario caps WTP at the marginal cost of gray hydrogen from steam methane reforming in Russia [24,25].
Model validation follows a three-pronged approach: (i) cross-country structural validation against the Jesse et al. German results [23]; (ii) plausibility checks against published Russian energy targets and international hydrogen projections [4,29,30]; and (iii) sensitivity analysis across the full parameter space of WTP × θmin. Monte Carlo simulation with 50 runs per scenario provides uncertainty quantification through interquartile ranges (IQR).
3. Results
3.1. Baseline Scenario: Three-Phase Development Dynamics
The Baseline scenario reveals an endogenous three-phase development pattern (Figure 1), structurally analogous to the phases identified by Jesse et al. [23] for Germany but with distinct timing and magnitudes.
Figure 1.
Agent-based model structure for green hydrogen industry development in Russia. Source: made by the authors.
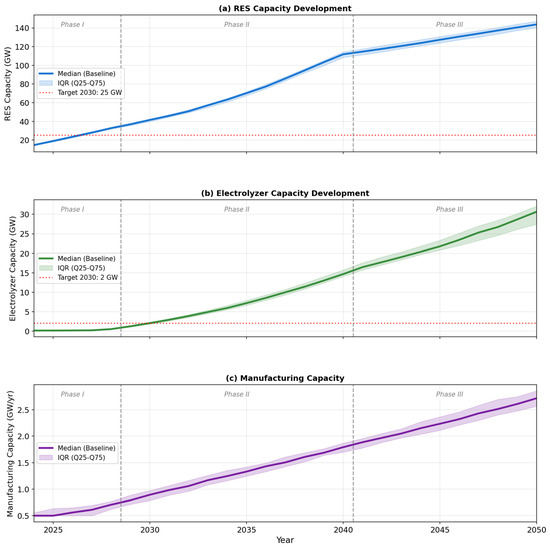
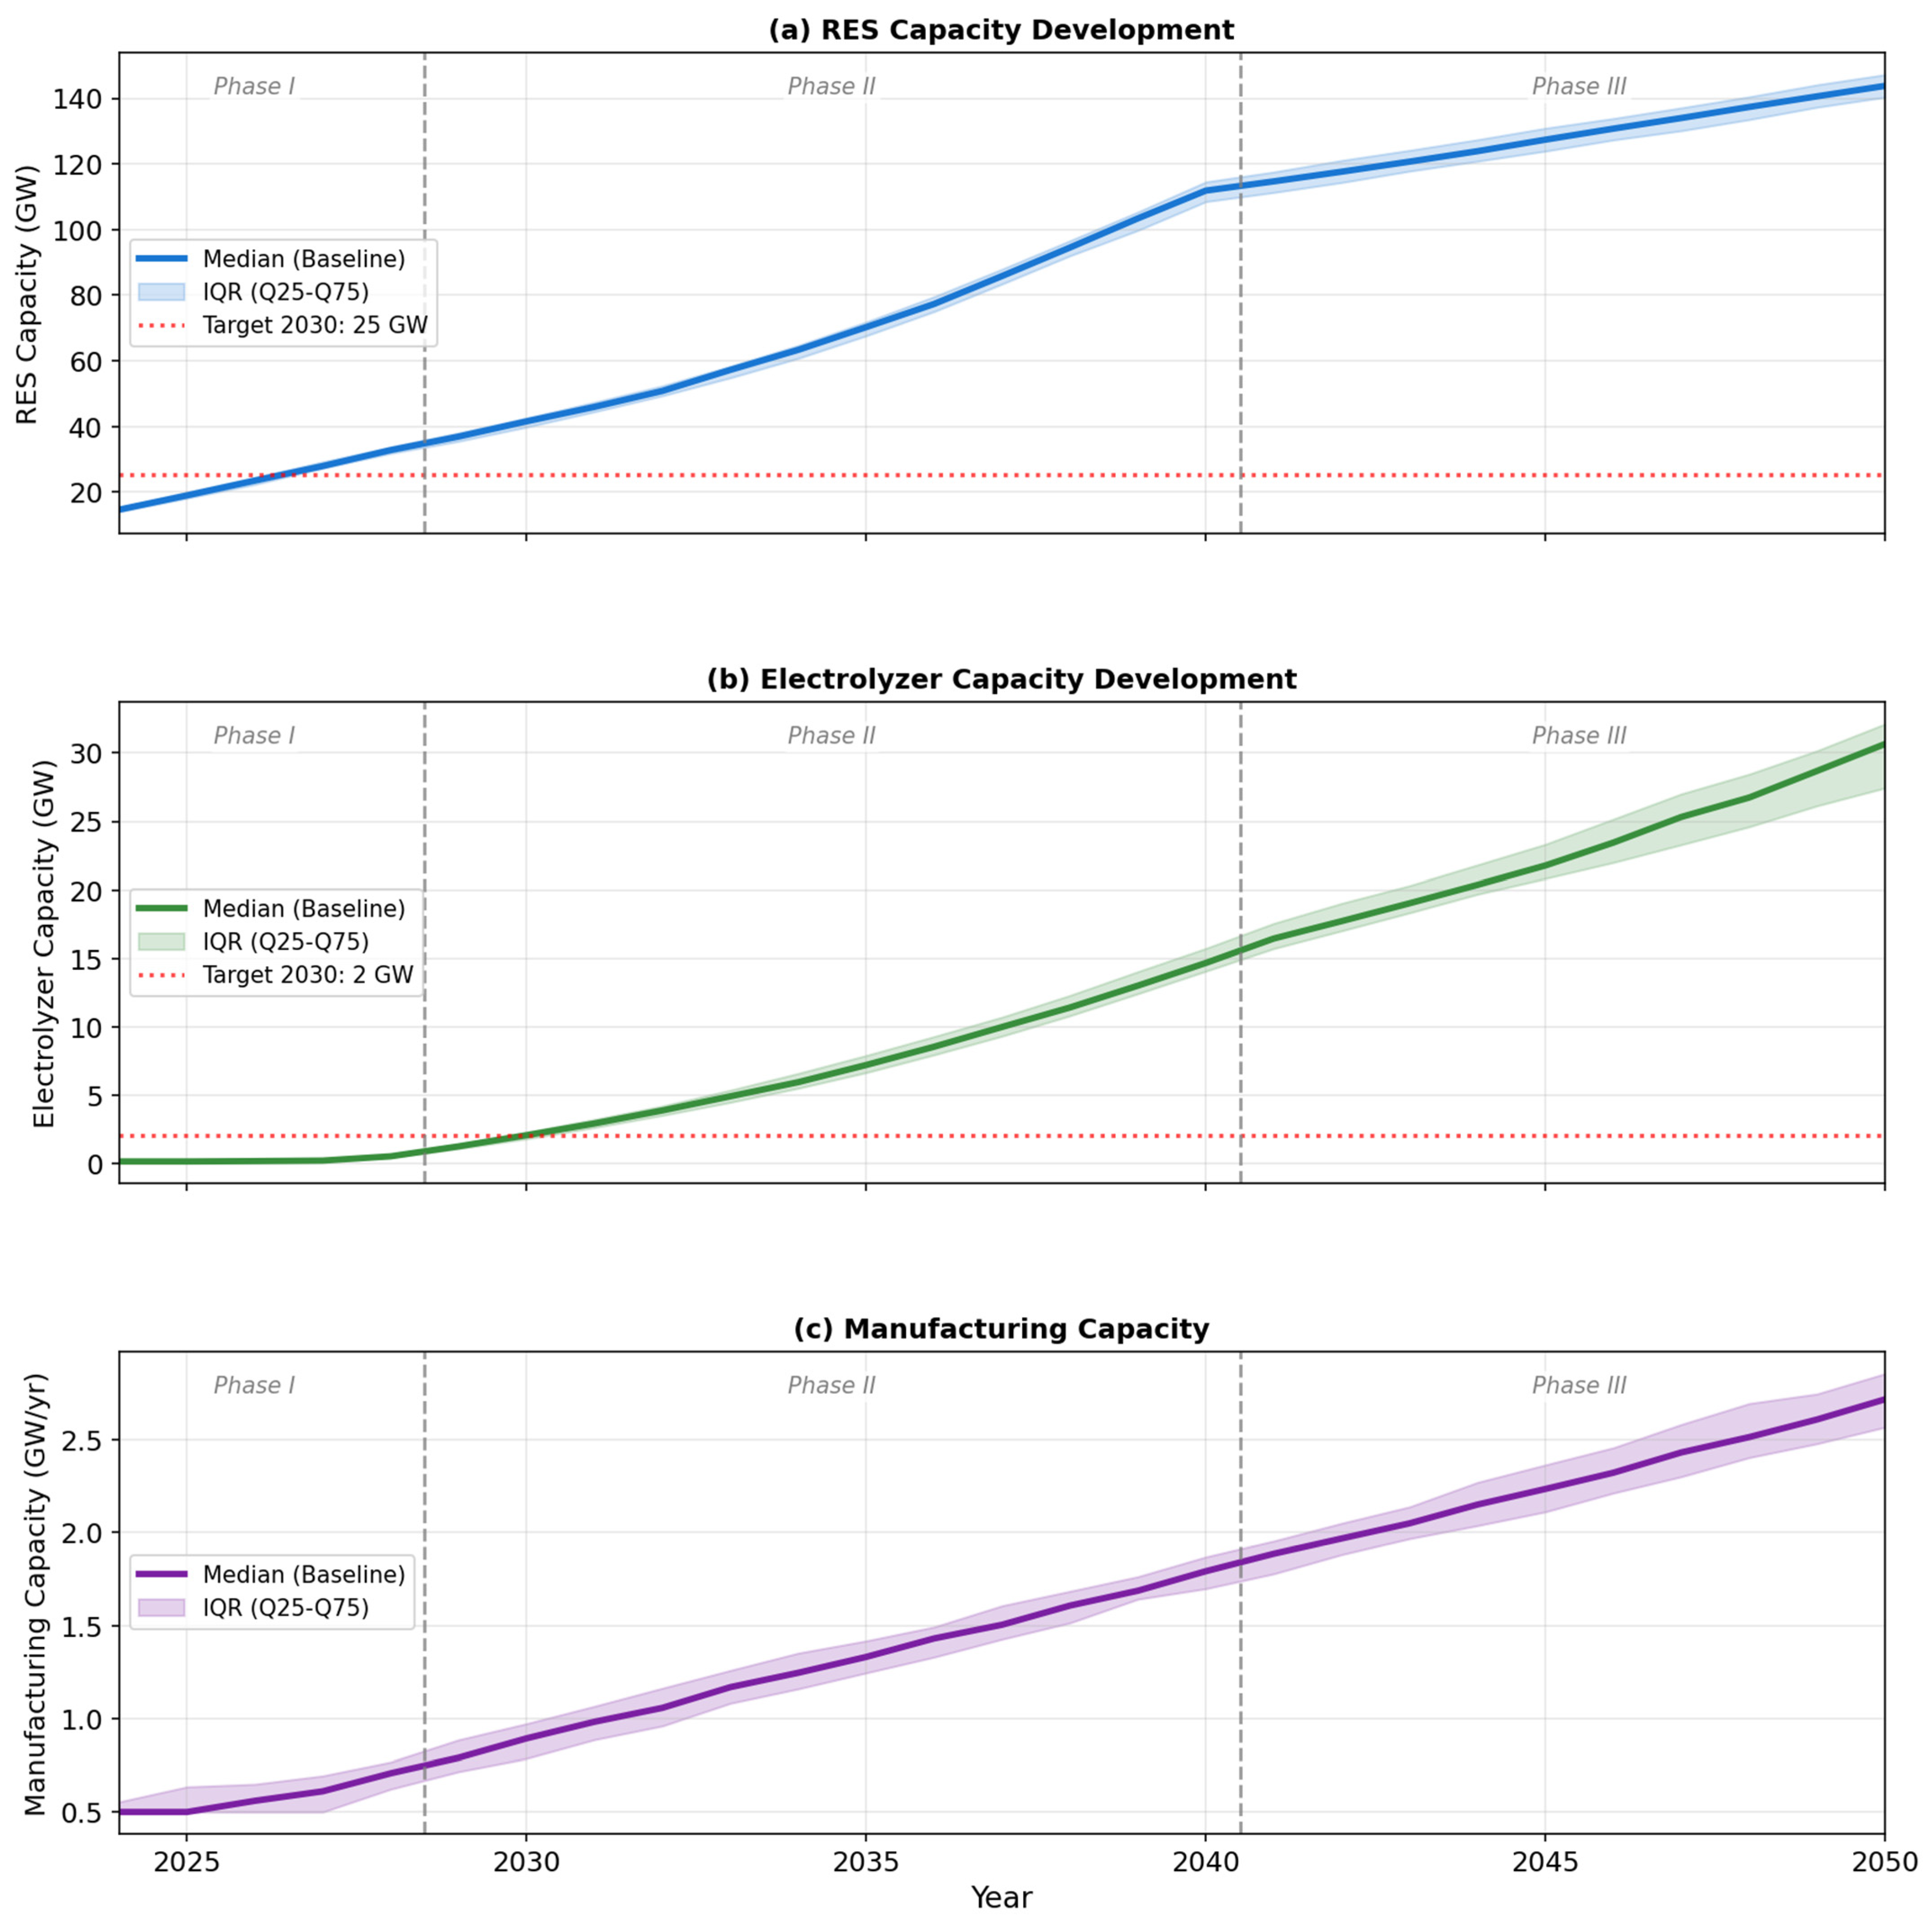
Figure 2 presents the temporal evolution of the three key capacity indicators across 50 Monte Carlo simulations. Panel (a) demonstrates the renewable capacity trajectory, showing steady Phase I growth from 10 GW in 2024 to 40 GW [38–42 GW IQR] by 2028, followed by continued but decelerating expansion reaching 142 GW [140–145 GW] by 2050. The narrow interquartile range throughout indicates high consistency across simulation runs, reflecting the deterministic policy-driven nature of renewable expansion.
Figure 2.
Three-phase development dynamics under the Baseline scenario (N = 50 Monte Carlo runs). (a) Installed renewable capacity; (b) Installed electrolyzer capacity; (c) Electrolyzer manufacturing capacity. Solid line: median; shaded area: IQR (Q25–Q75). Vertical dashed lines indicate phase boundaries. Source: based on the authors’ calculations.
Panel (b) reveals the characteristic hockey-stick pattern of electrolyzer deployment: near-stagnation during Phase I (0.15 → 0.2 GW), explosive growth during Phase II reaching 14.5 GW by 2040, and continued but slower growth in Phase III stabilizing at 29.9 GW by 2050. The widening IQR band after 2030 (from ±0.2 GW to ±2.5 GW) indicates increasing uncertainty as agent-based interactions generate path-dependent outcomes.
Panel (c) shows electrolyzer manufacturing capacity responding to deployment signals with a characteristic lag. Manufacturing capacity expands from 0.5 GW/year in 2024 to 13.2 GW/year by 2050, with the steepest growth occurring in Phase II (2029–2040) when annual capacity additions exceed 5 GW/year. The phase boundaries (vertical dashed lines) at 2028 and 2040 are derived from structural break analysis of the electrolyzer deployment rate.
Phase boundaries are determined by a structural break analysis applied to the annual electrolyzer deployment rate time series, pooled across the 50 Monte Carlo runs per scenario. Specifically, we apply a Bai–Perron sequential breakpoint test [43] to the median deployment rate, identifying the year at which the slope of the deployment trajectory changes significantly at the 5% level. The Phase I → Phase II transition at 2028 in the baseline scenario is identified as the year in which two conditions are jointly satisfied endogenously: (i) cumulative renewable electricity capacity crosses the critical band identified in the sensitivity analysis as necessary for sustained low-cost electricity availability to electrolyzers, and (ii) the annual volume of electricity priced below the electrolyzer profitability threshold exceeds 4–7 TWh—the minimum required for commercially viable full-load operation. Both conditions are observable endogenous model outputs, not exogenously imposed calendar dates. The 2028 date is therefore scenario-specific: in the Optimistic scenario, Phase II onset advances to approximately 2031; in the Conservative scenario, it is delayed to approximately 2034. The Phase II → Phase III transition at 2040 is identified by the same procedure, corresponding to the year in which the marginal return on new electrolyzer investment falls below the risk-free rate for the first time across the majority of Monte Carlo runs.
Phase I (2024–2028) is dominated by policy-driven renewable energy expansion, with installed capacity growing from 10 GW to approximately 40 GW [38–42 GW IQR]. During this phase, electrolyzer deployment remains minimal (0.15 → 0.2 GW), as insufficient low-cost electricity is available to justify investment. LCOH declines sharply from initial pilot-project levels of 9.6 $/kg to approximately 3.9 $/kg by 2028 as the first commercial-scale projects achieve higher utilization rates.
Phase II (2029–2040) marks the onset of rapid electrolyzer deployment, triggered by crossing two critical thresholds: installed renewable capacity exceeding 30–38 GW and available low-cost electricity surpassing 4–7 TWh/year. These thresholds are analogous to the α* ≈ 79% renewable share identified by Jesse et al. for Germany [23], adapted to Russian conditions where hydrogen production relies not only on excess renewable electricity but also on dedicated hydroelectric and co-located renewable capacity. Electrolyzer capacity reaches 14.5 GW [13.5–15.4 GW] by 2040, with hydrogen production of 0.56 Mt/year.
Phase III (2041–2050) is characterized by continued but decelerating growth, stabilizing at 29.9 GW [27.4–32.1 GW] of installed electrolyzer capacity producing 1.12 Mt/year [1.05–1.18 Mt] of green hydrogen. LCOH converges to 3.1 $/kg [3.0–3.2 $/kg], competitive with international benchmarks [1,37]. Electrolyzer costs decline to 785 $/kW through cumulative learning effects.
3.2. Temporal Trajectory of Key Indicators
Table 2 presents the complete temporal trajectory of key model outputs for the Baseline scenario.
Table 2.
Baseline scenario trajectory (median [IQR]), N = 50 Monte Carlo runs.
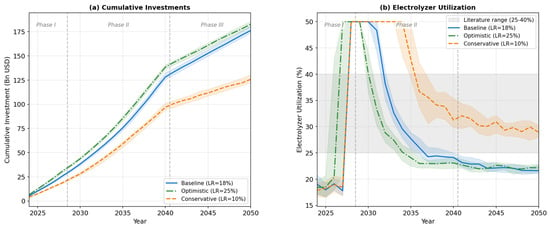
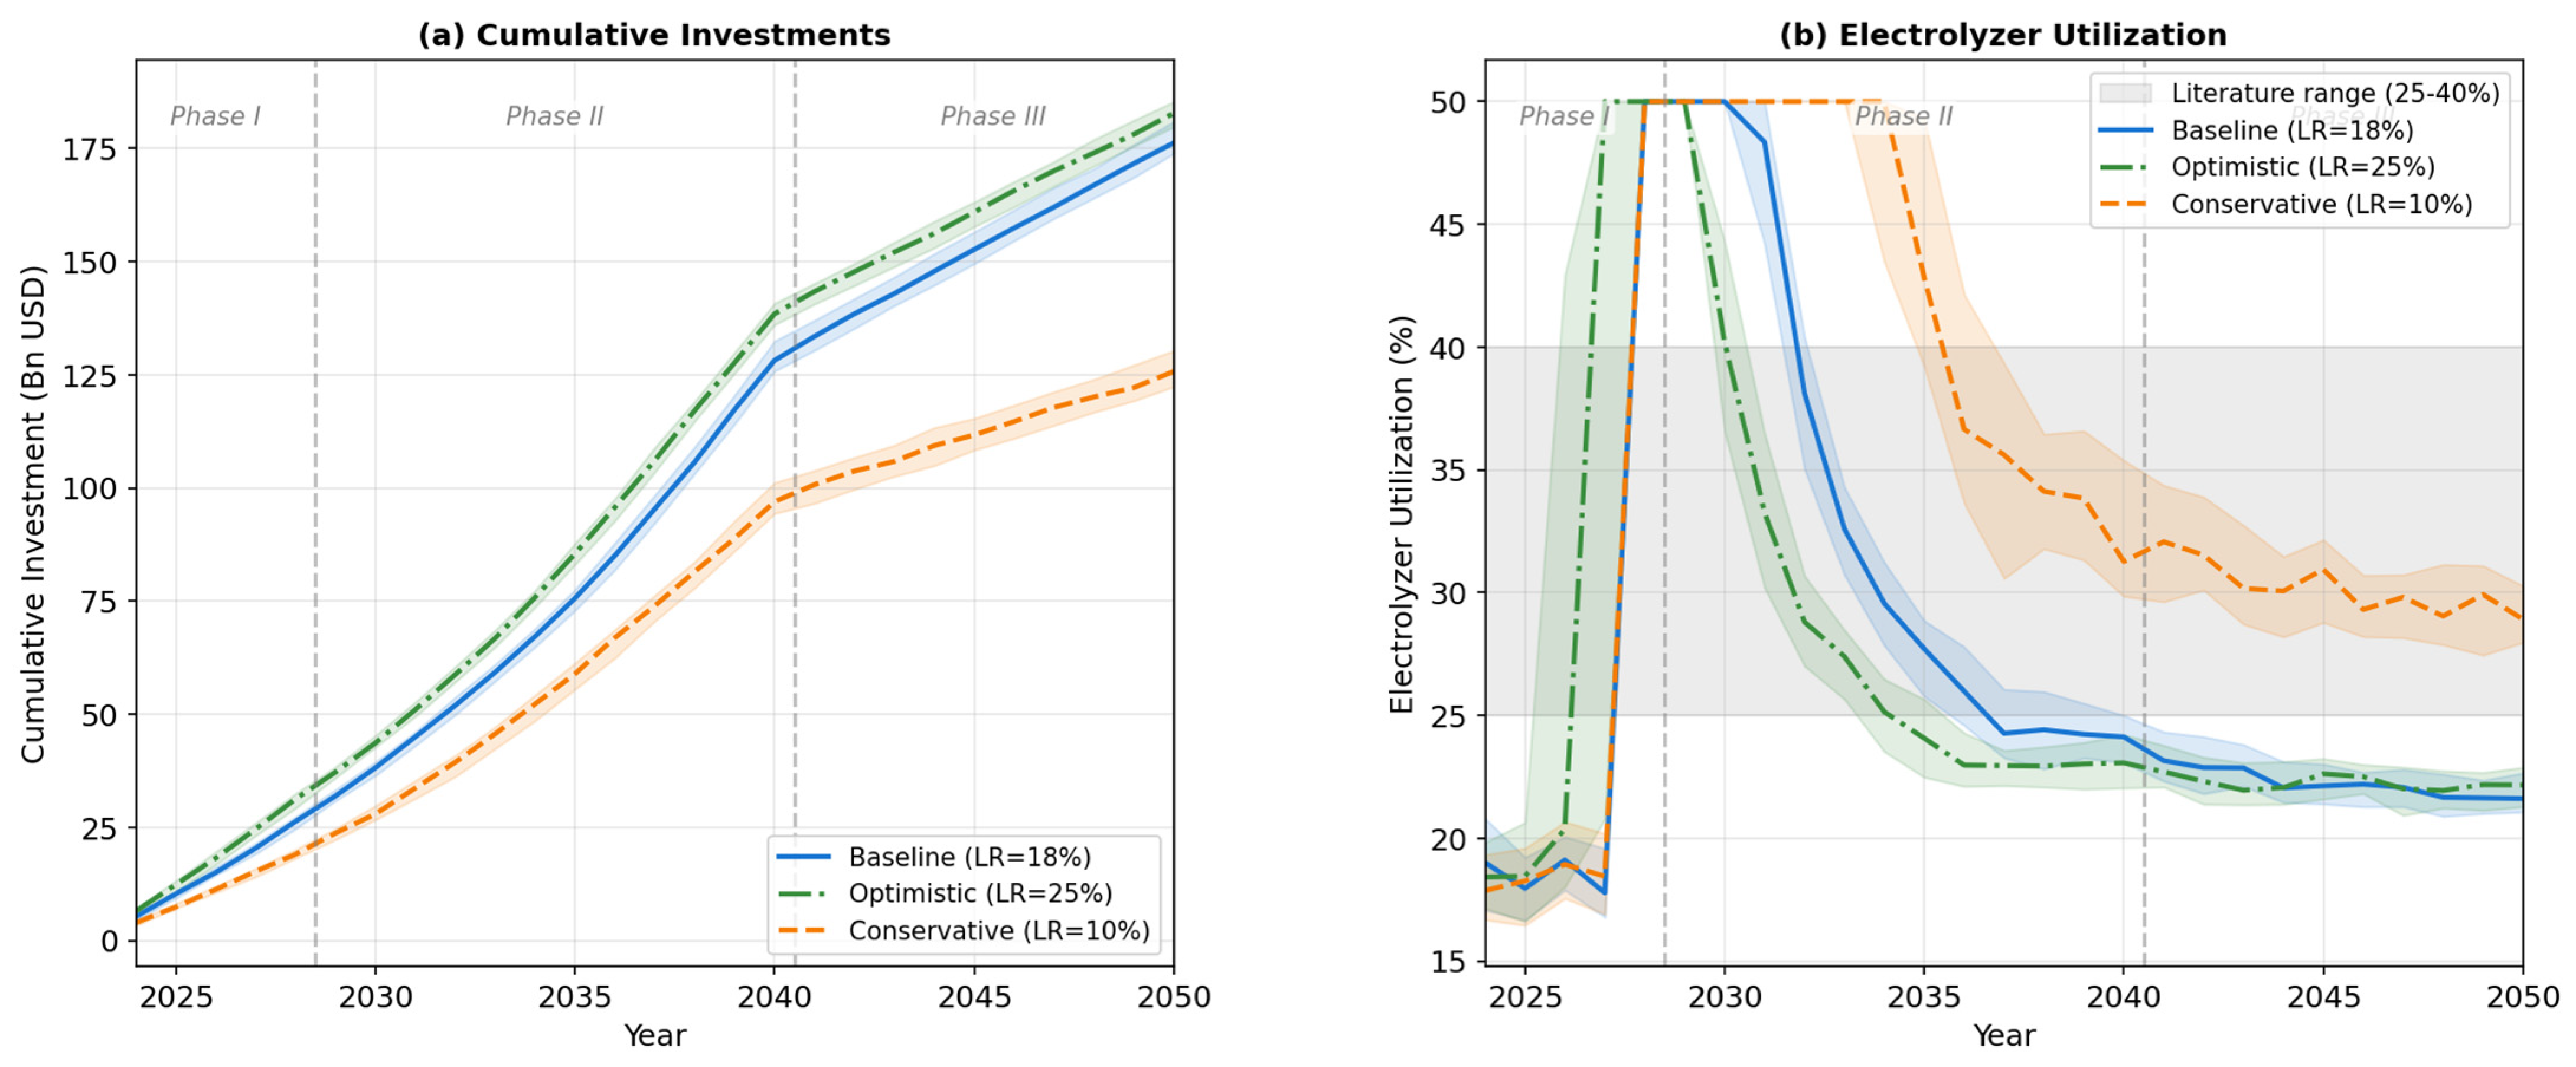
Figure 3a compares cumulative investment trajectories across all four scenarios over the 2024–2050 period. The Baseline scenario accumulates approximately 92 billion USD in total investments by 2050, comprising 45 billion in electrolyzer capacity and 47 billion in renewable generation assets. The Optimistic scenario requires higher upfront investment (105 billion USD) but achieves greater deployment and lower unit costs. The Conservative scenario demonstrates significantly reduced investment (35 billion USD) due to the low learning rate limiting cost competitiveness. The Pessimistic scenario flatlines near zero, confirming that without a green premium, no investment case emerges.
Figure 3.
(a) Cumulative investment trajectories across scenarios; (b) electrolyzer utilization rates with literature range reference (25–40%) [23,37]. Source: based on the authors’ calculations.
Figure 3b illustrates the non-monotonic evolution of electrolyzer capacity factors. The utilization rate begins at 19% in 2024 during the pilot phase, rises sharply to 50% by 2030 as commercial projects secure dedicated electricity contracts, then declines to 27% in 2035 as rapid capacity additions outpace growth in low-cost electricity supply—a “growing pains” effect. By 2050, utilization stabilizes at 22%, within the literature range of 25–40% indicated by the gray shaded band [23,37]. This pattern validates the utilization feedback mechanism (Section 2.4) that prevents unrealistic deployment when electricity availability is insufficient.
3.3. Scenario Comparison
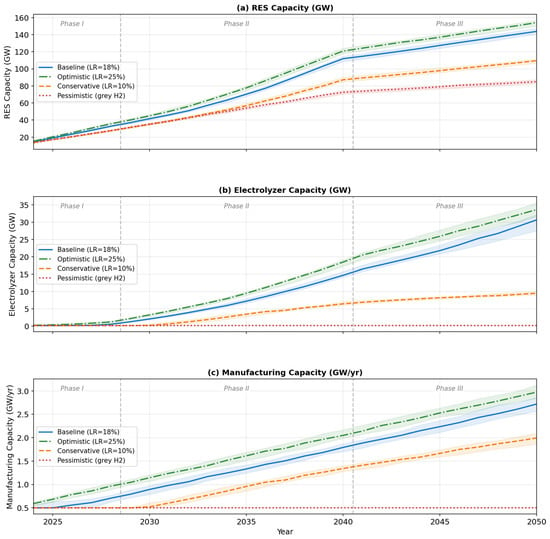
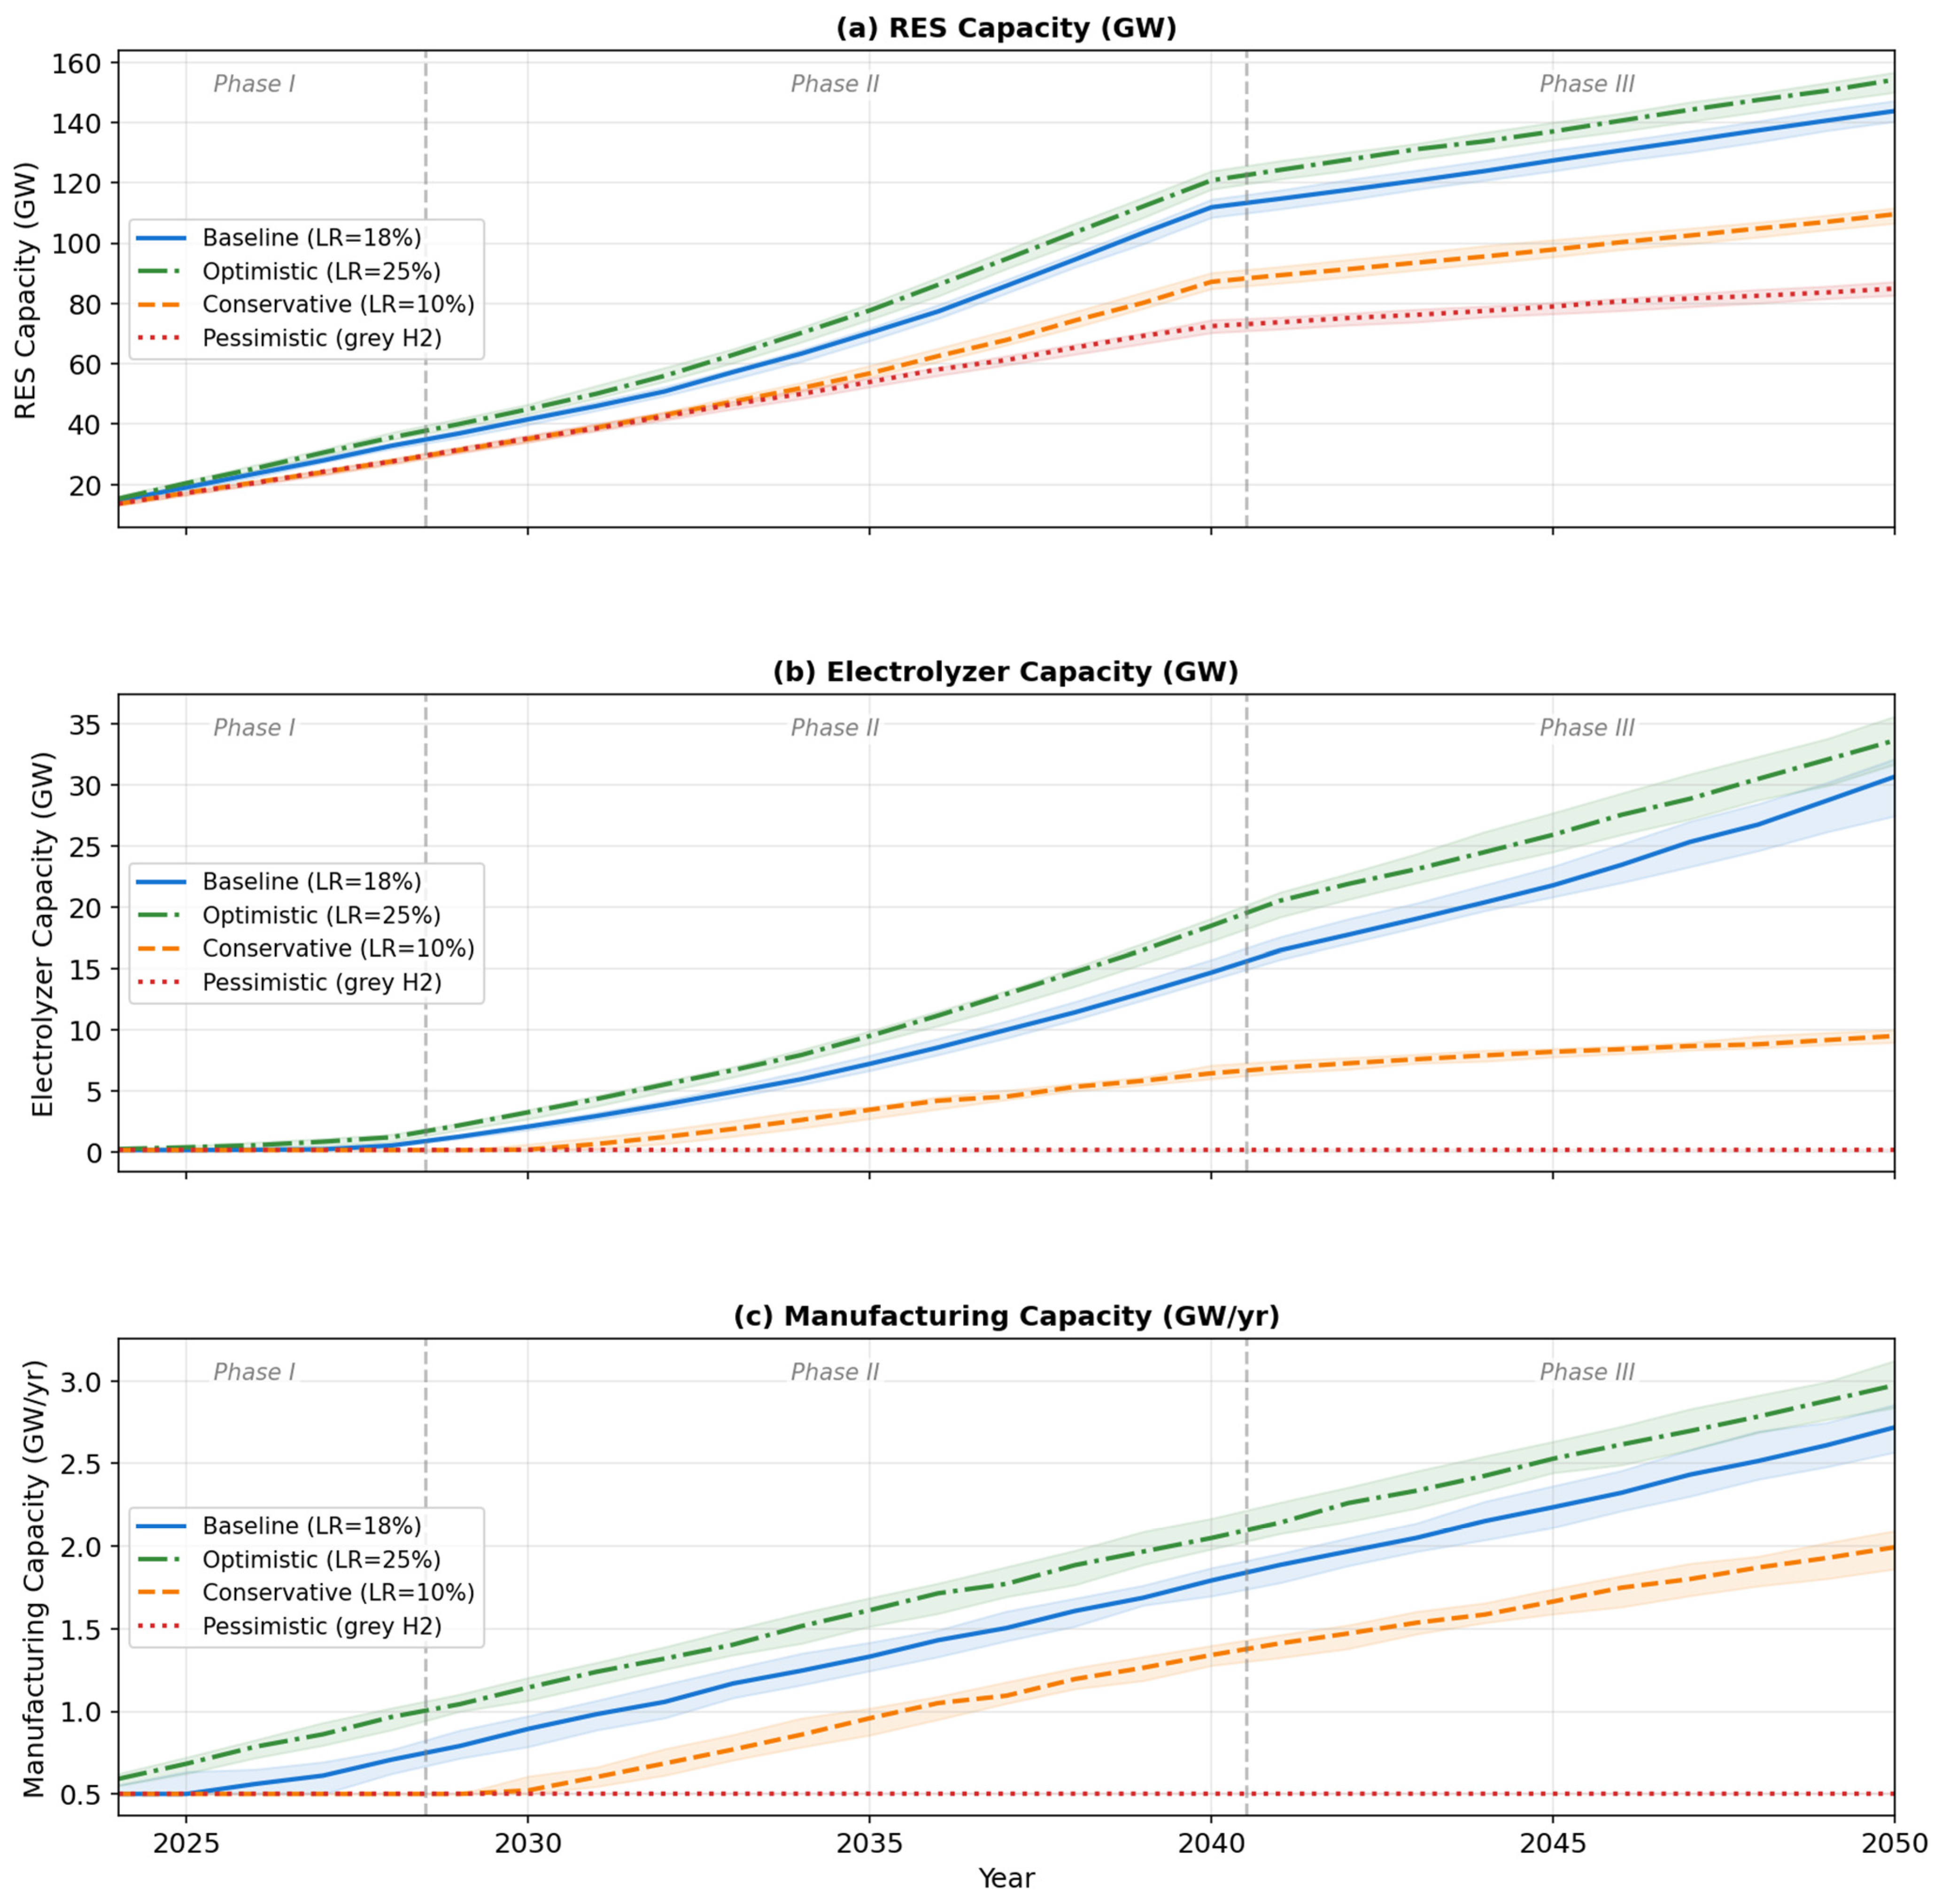
Figure 4 and Table 3 compare the four scenarios, revealing substantial divergence in outcomes driven primarily by the learning rate and willingness to pay.
Figure 4.
Scenario comparison: (a) Installed renewable capacity; (b) installed electrolyzer capacity; (c) electrolyzer manufacturing capacity. Solid lines: medians; shaded areas: IQR. Source: Based on the authors’ calculations.
Table 3.
Scenario comparison (medians). Units: GW, Mt/year, $/kg, $/kW. * Minimum target.
Figure 4 enables direct visual comparison of development trajectories across the four scenarios. Panel (a) shows that renewable capacity trajectories diverge primarily after 2030, with the Optimistic scenario reaching 145 GW by 2050 compared to 142 GW in Baseline and 135 GW in Conservative. The Pessimistic scenario tracks with Conservative until 2035, after which they separate due to differing electrolyzer deployment signals feeding back to renewable investment incentives.
Panel (b) demonstrates the dramatic scenario sensitivity of electrolyzer deployment. The Optimistic scenario achieves 34.7 GW by 2050—16% above Baseline—driven by the 25% learning rate enabling faster cost reductions and earlier crossing of the investment threshold. The Conservative scenario plateaus at only 9.4 GW, illustrating the “trap” of slow learning: high costs → low deployment → limited learning → persistently high costs. The Pessimistic scenario remains essentially flat at 0.1 GW throughout, confirming the necessity of WTP > gray H2 cost for any industry emergence.
Panel (c) shows manufacturing capacity responding to deployment trajectories, with the Optimistic scenario requiring 15 GW/year production capacity by 2050 compared to 13.2 GW/year in the Baseline. The tight correlation between panels (b) and © validates the demand-driven manufacturing investment logic (Section 2.2).
The Optimistic scenario achieves 16% more electrolyzer capacity and 21% lower LCOH by 2050 compared to the Baseline, driven by faster cost reductions (437 vs. 785 $/kW). The Conservative scenario demonstrates that LR = 10% combined with non-strategic behavior (θ_min = 0) yields only 9.4 GW by 2050 [23]. The Pessimistic scenario confirms the fundamental finding of Jesse et al.: without WTP exceeding gray hydrogen costs, no green hydrogen industry develops [23,24].
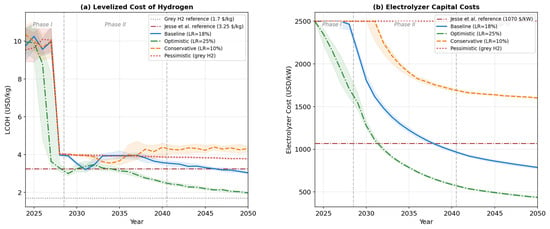
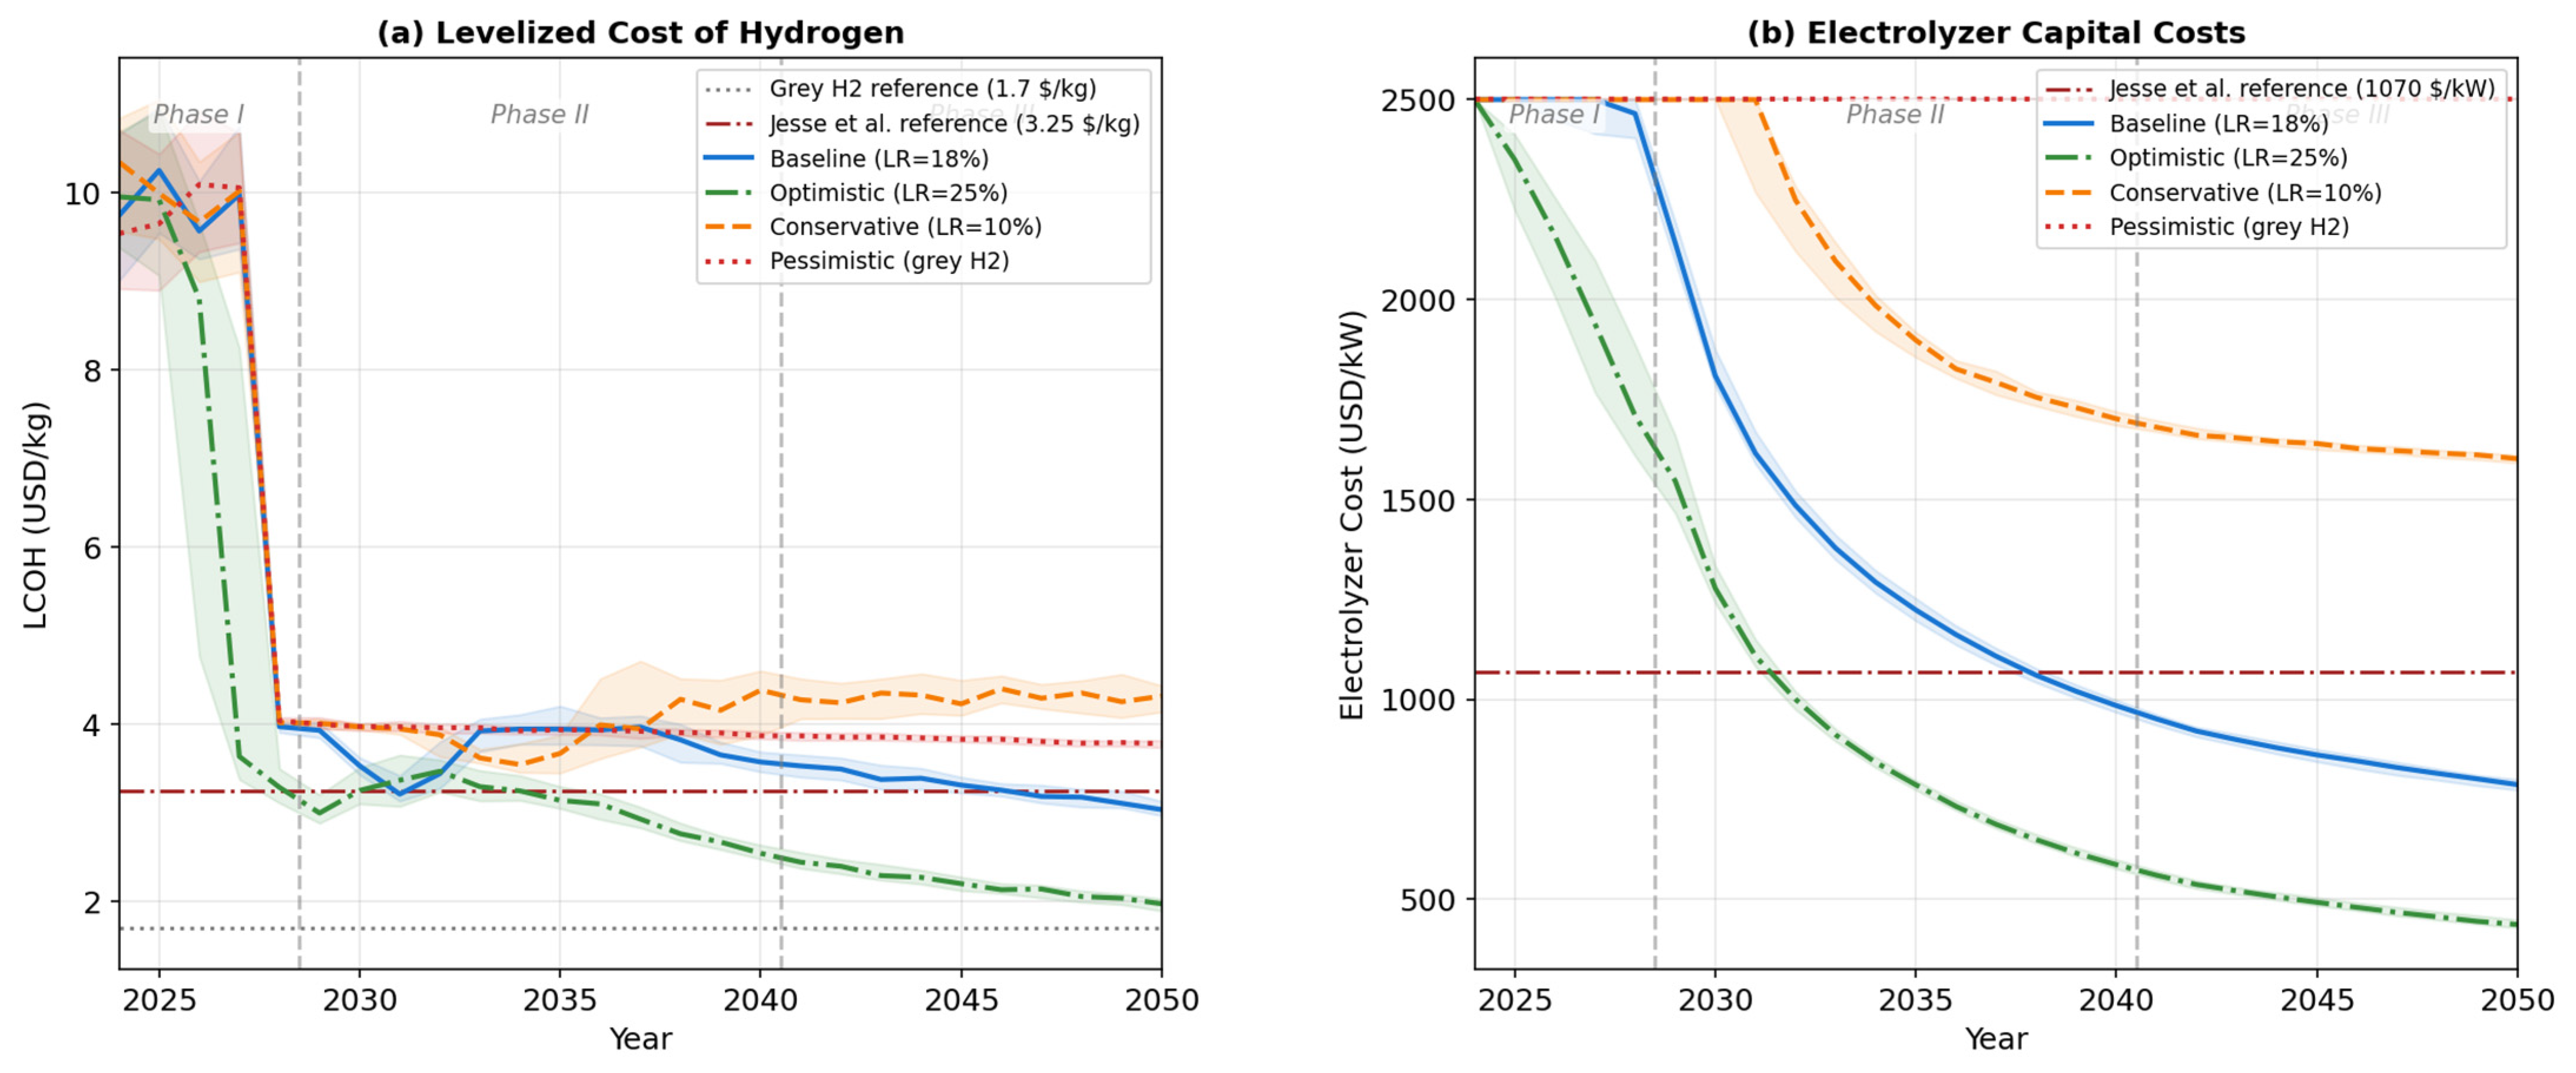
Figure 5a presents the evolution of the levelized cost of hydrogen across all scenarios. The Baseline trajectory exhibits three distinct regimes: (1) rapid decline from 9.6 $/kg to 3.5 $/kg during 2024–2030 driven primarily by capacity factor improvements (Section 3.1), (2) temporary increase to 4.0 $/kg in 2035 due to utilization dilution effects, and (3) gradual decline to 3.1 $/kg by 2050 as equipment costs fall and utilization stabilizes.
Figure 5.
(a) LCOH trajectories across scenarios with gray H2 reference (1.7 $/kg) and Jesse et al. [23] 2050 value (3.25 €/kg); (b) electrolyzer production cost reduction through learning effects. Source: based on the authors’ calculations.
The gray horizontal band at 1.7 $/kg indicates the Russian gray hydrogen reference cost from steam methane reforming [24,25], demonstrating that green hydrogen does not achieve cost parity even in the Optimistic scenario (2.0 $/kg by 2050). The red dashed line at 3.25 €/kg shows the Jesse et al. German 2050 value, with which our Baseline closely converges despite different deployment scales—a key structural validation.
Figure 5b decomposes the LCOH reduction into its constituent driver: electrolyzer capital cost reduction through learning effects. The Optimistic scenario achieves the steepest decline (2500 → 437 $/kW, 82% reduction) due to LR = 25%, while Conservative shows only 36% reduction (2500 → 1599 $/kW). The Pessimistic scenario exhibits minimal learning (2500 → 2450 $/kW) due to near-zero deployment. These trajectories directly validate Equation (3)’s learning curve formulation.
3.4. Renewable Penetration and Hydrogen Production
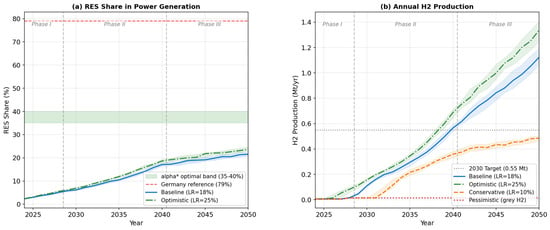
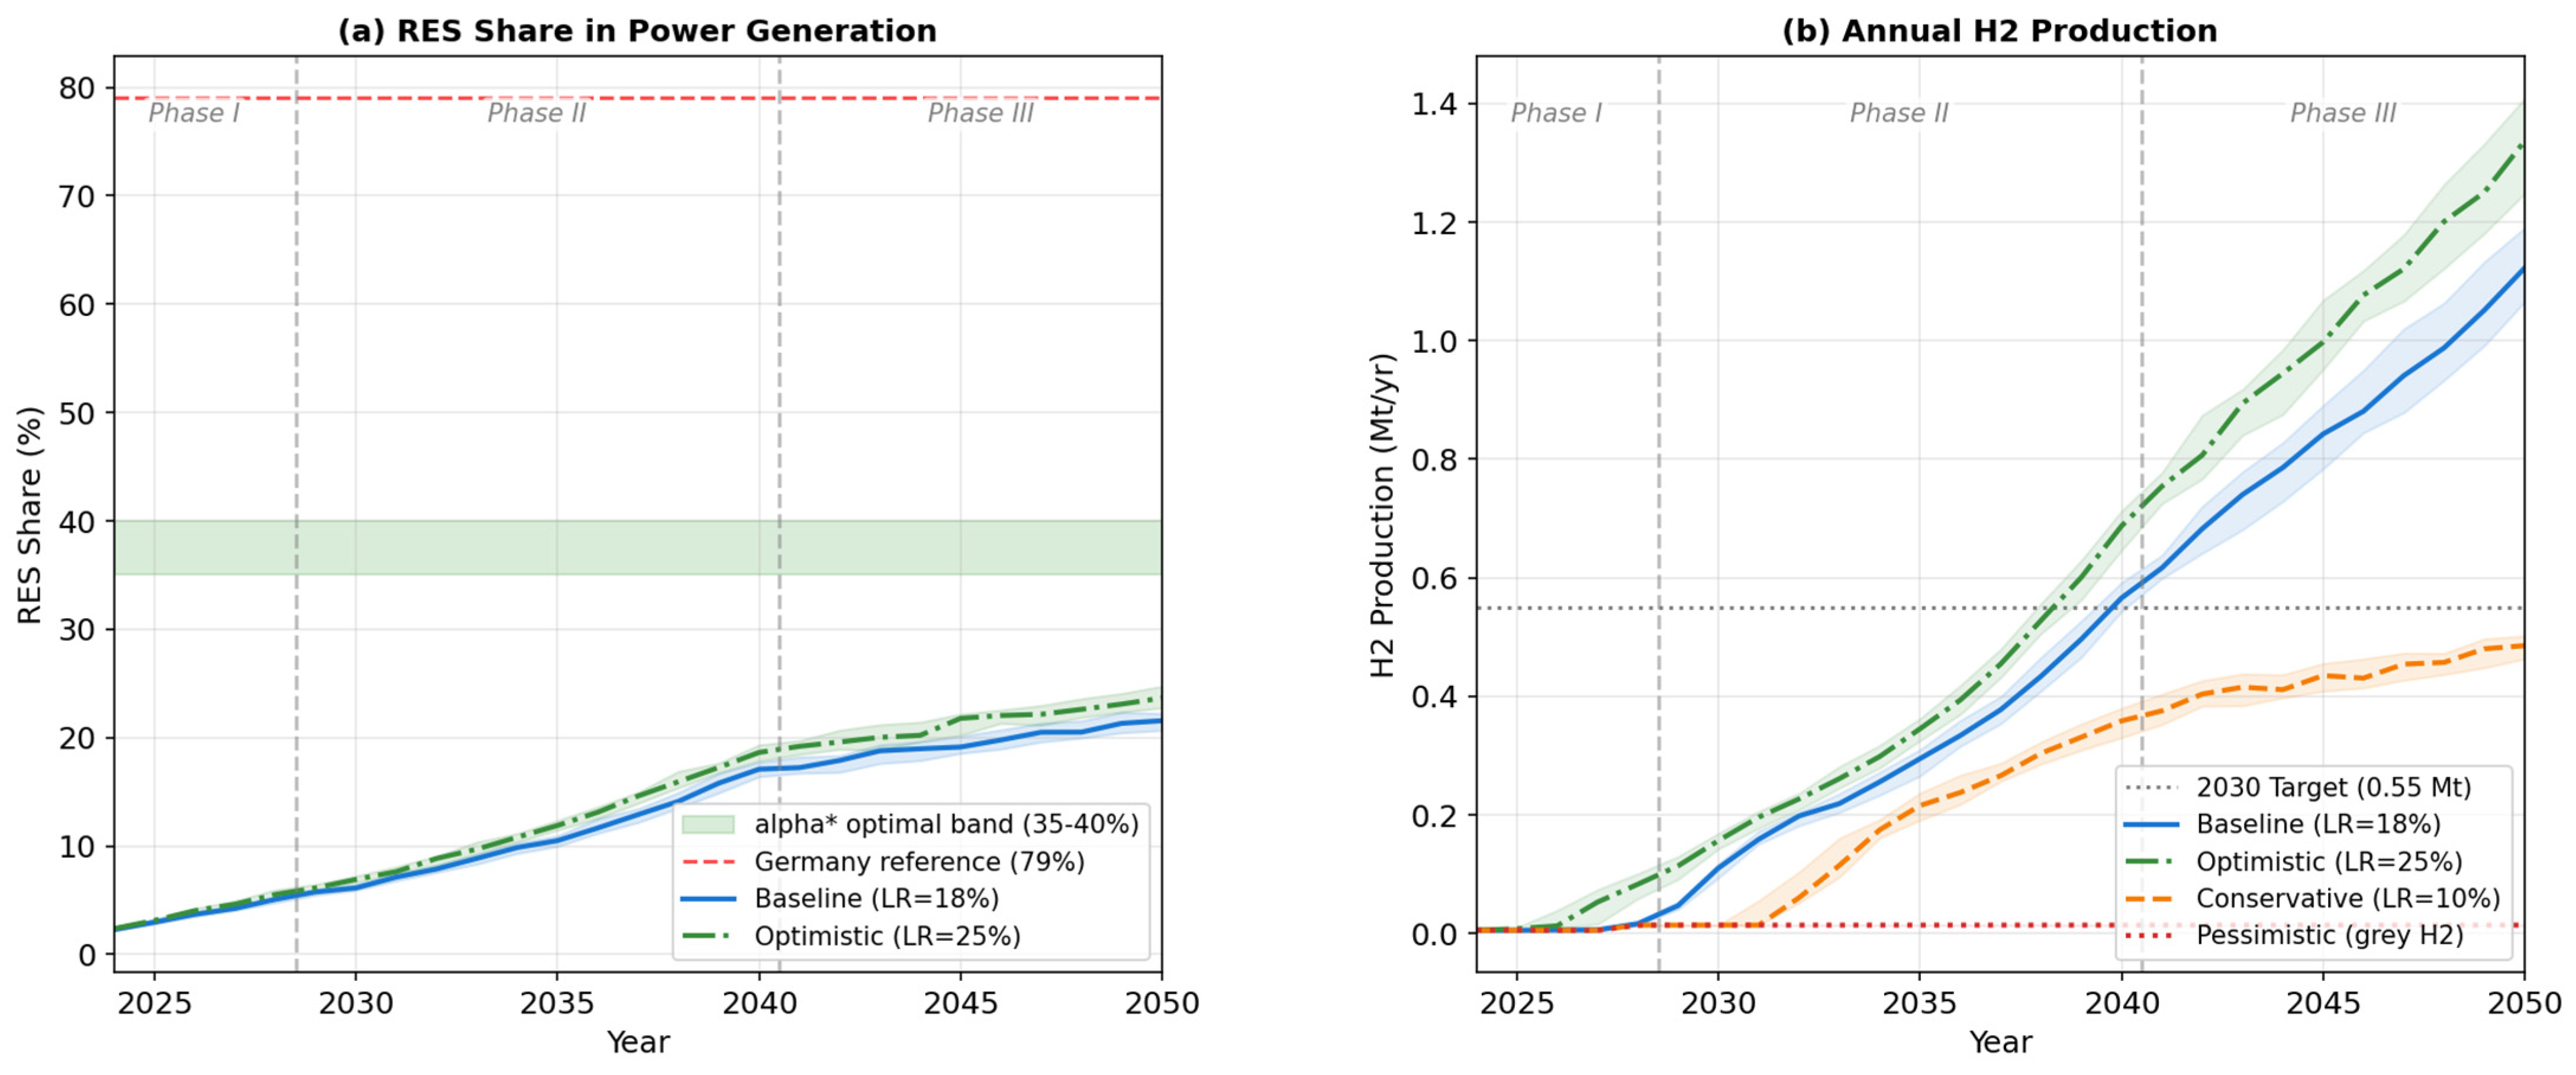
Figure 6a plots hydrogen production against renewable electricity share to identify the critical threshold α*. The Baseline scenario achieves significant H2 production (1.12 Mt/year by 2050) at only 25% renewable penetration—far below the α* ≈ 79% threshold identified for Germany [23]. This apparent paradox is resolved by recognizing Russia’s hybrid electricity supply model (Section 2.4): hydrogen production draws not only on renewable excess but also on dedicated hydroelectric capacity (1–3 GW) and co-located renewable assets.
Figure 6.
(a) Renewable penetration with α* threshold range (35–40%) and German reference (79%); (b) green hydrogen production across scenarios with 2030 target (0.55 Mt). Source: based on the authors’ calculations.
The effective Russian threshold α*_RU ≈ 35–40% (green shaded band) represents the renewable share at which Phase II acceleration begins (2029–2032). This lower threshold reflects structural differences: Germany’s energy-only market relies exclusively on curtailed renewables, while Russia leverages baseload hydroelectric and dedicated contracts. The comparison underscores the importance of context-specific threshold calibration rather than direct parameter transfer [28].
Figure 6b presents absolute hydrogen production trajectories with the 2030 national target (0.55 Mt, red dashed line) for reference. All scenarios except Pessimistic show Phase I stagnation followed by Phase II acceleration, with trajectories diverging significantly post-2035. The Baseline achieves only 0.11 Mt by 2030 (20% of target), highlighting the structural infeasibility discussed in Section 3.5. By 2050, the scenario spread ranges from 0.01 Mt (Pessimistic) to 1.35 Mt (Optimistic), a factor of 135×, demonstrating extreme sensitivity to parameter assumptions.
3.5. Assessment of Russia’s 2030 Targets
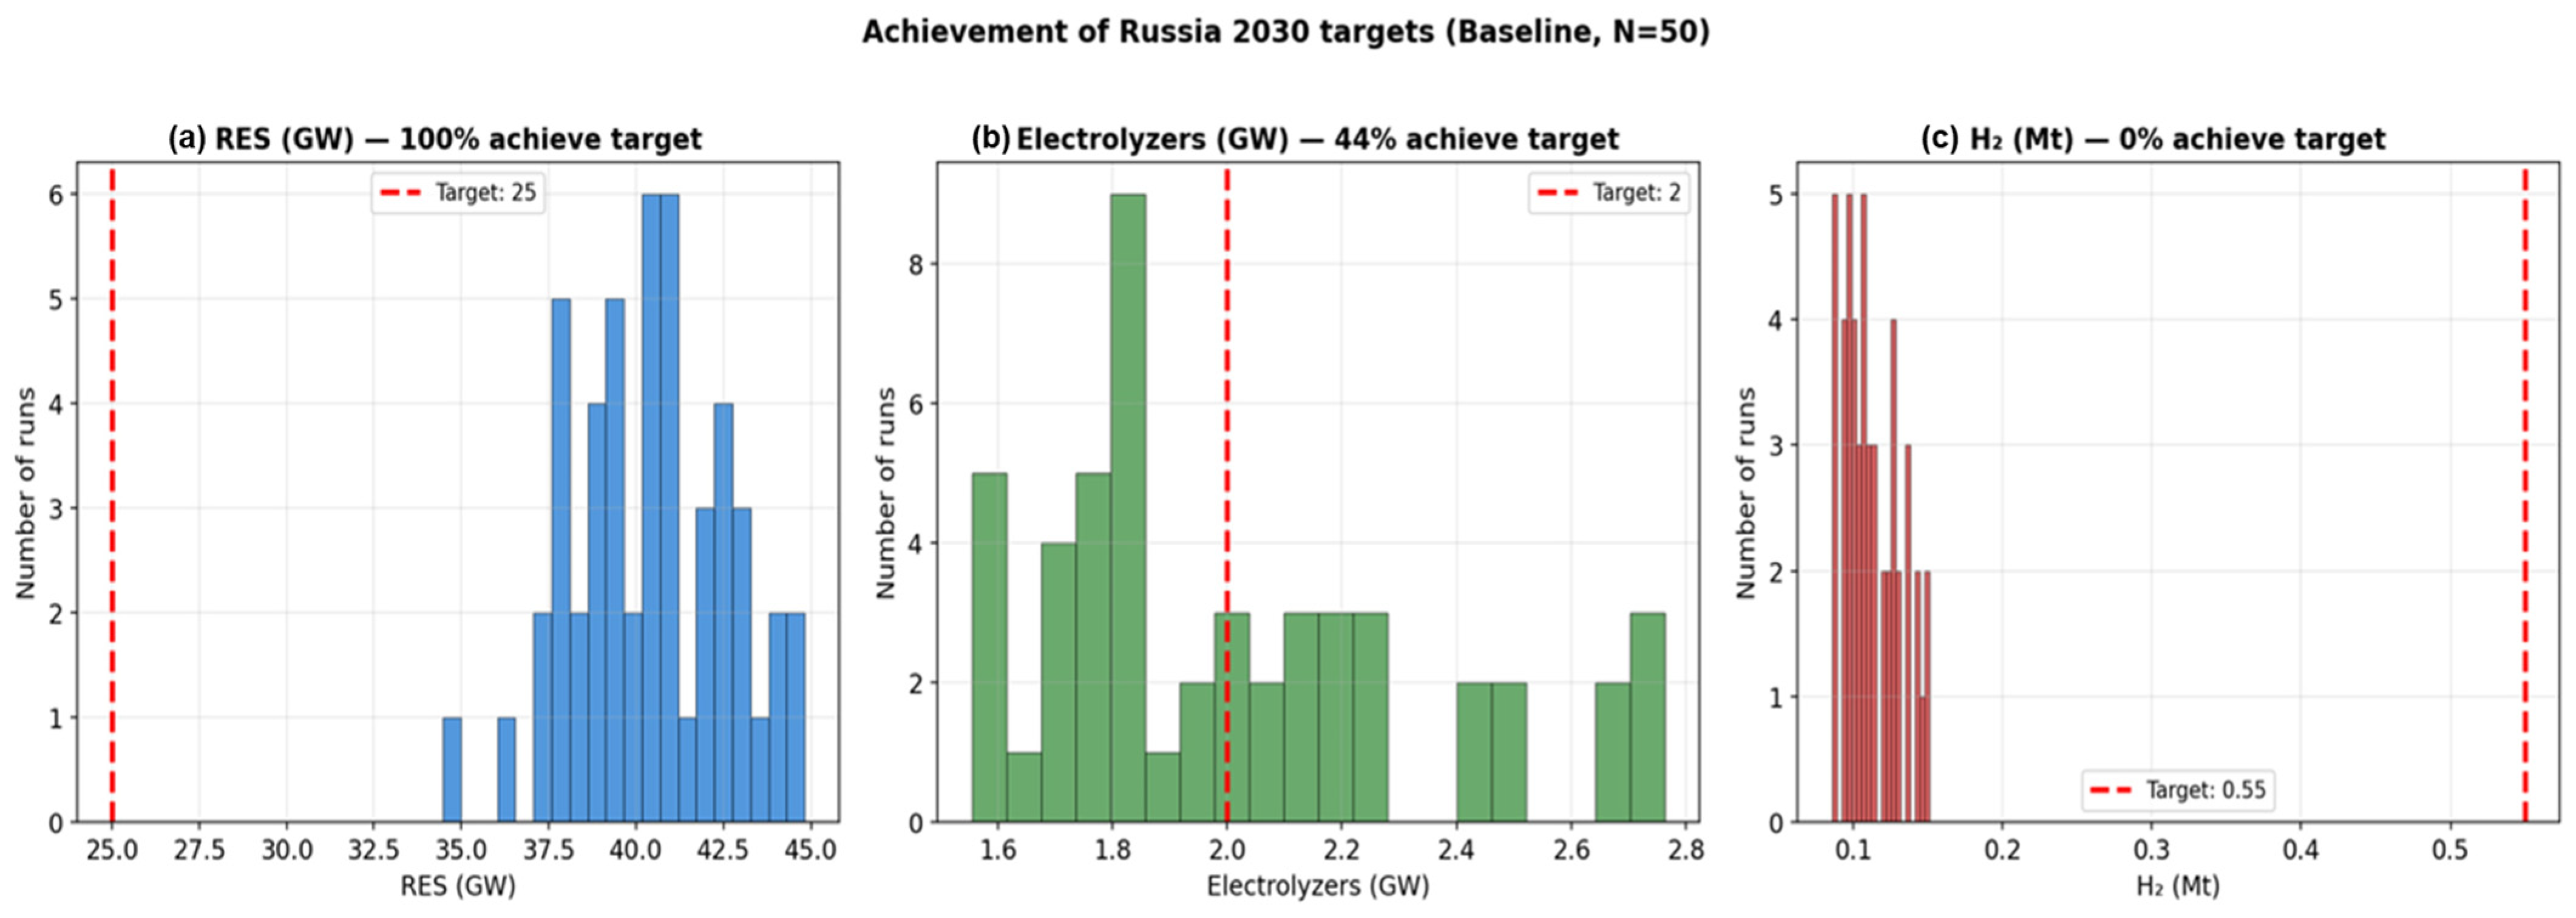
The model provides a nuanced assessment of Russia’s 2030 targets. Figure 7 presents probability distributions of 2030 outcomes across 50 Monte Carlo runs, enabling rigorous assessment of target achievability. Panel (a) shows that the renewable capacity target (25 GW, red dashed line) is exceeded in 100% of simulations, with the median at 40 GW representing 160% of the target. The distribution is relatively narrow (IQR: 38–42 GW), reflecting low stochastic uncertainty in policy-driven renewable expansion. Panel (b) reveals that the electrolyzer capacity target (2.0 GW) has approximately 42% probability of achievement under Baseline assumptions. The median of 1.9 GW falls marginally short, with the distribution spanning 1.8–2.2 GW. This near-miss result suggests that with slightly more favorable conditions (e.g., LR = 20% instead of 18%, or k_support = 1.4 instead of 1.3), the target becomes reliably achievable [9,10]. Panel (c) demonstrates the fundamental disconnect between capacity and production targets. The hydrogen production target (0.55 Mt) is achieved in 0% of simulations, with the median at 0.11 Mt (20% of target) and no runs exceeding 0.13 Mt. This is not a model artifact but a structural constraint: achieving 0.55 Mt from 2.0 GW requires ~3100 full-load hours (35% utilization), infeasible given insufficient dedicated low-cost electricity by 2030 (Section 3.5) [4,5,6,7,8,9,10,11,12,13,14,15,16,17,18,19,20,21,22,23,24,25,26,27,28,29,30,31,32,33,34,35,36,37].
Figure 7.
Distribution of 2030 target achievement across 50 Monte Carlo runs (Baseline scenario): (a) Renewable capacity; (b) Electrolyzer capacity; (c) Hydrogen production. Red dashed lines indicate targets. Source: based on the authors’ calculations.
3.6. Sensitivity Analysis
3.6.1. Learning Rate Sensitivity
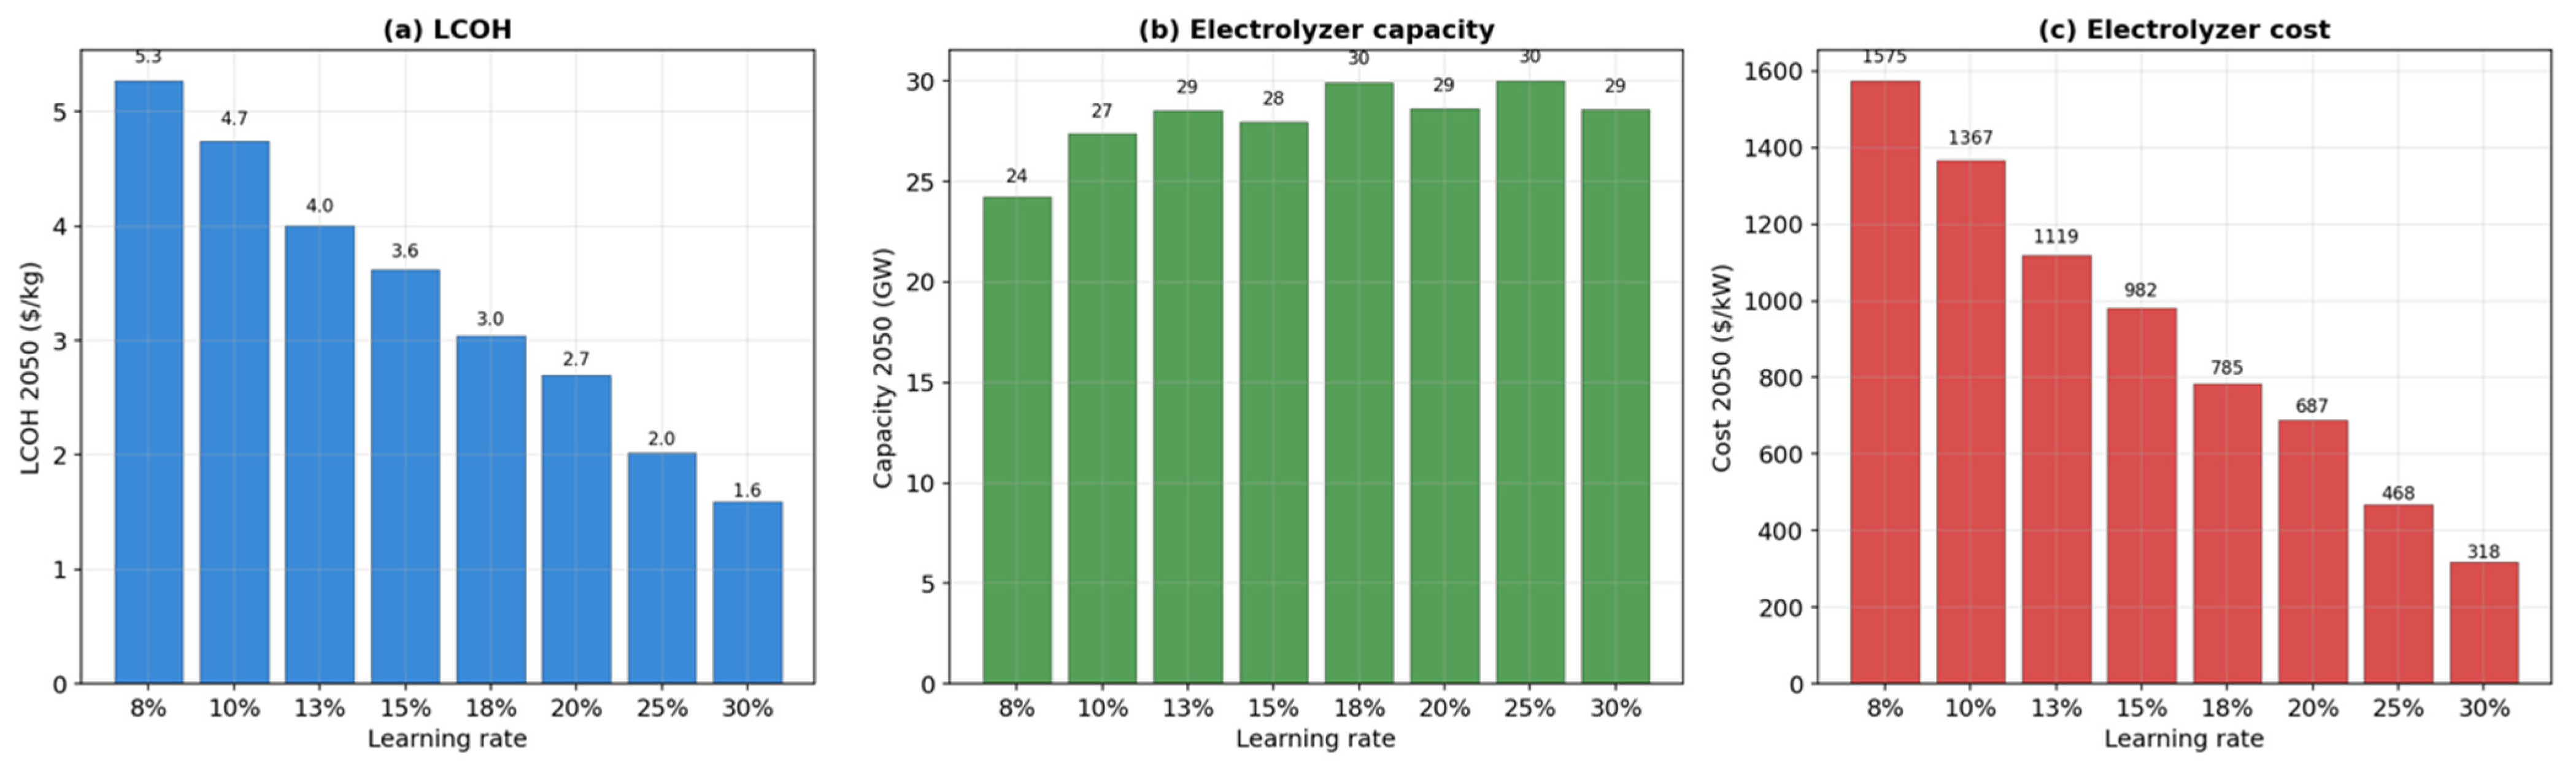
Figure 8 presents a parametric sweep across learning rates from 8% to 30%, holding all other parameters at Baseline values. Each point represents the median of 20 Monte Carlo runs. Panel (a) reveals a strongly nonlinear response of LCOH2050: declining from 4.8 $/kg at LR = 8% to 1.8 $/kg at LR = 30%. The relationship is well-approximated by a power law with exponent −0.65, indicating that each 5-percentage point increase in LR yields approximately 15–20% LCOH reduction. A particularly sharp transition occurs between LR = 13% and LR = 18% (gray shaded zone), where LCOH2050 drops from 4.2 to 3.1 $/kg. This defines the boundary between limited deployment (<15 GW) and industry scale-up (>25 GW), representing a criticality threshold in the parameter space. Below LR ≈ 13%, high costs persist and limit deployment; above LR ≈ 18%, positive feedback between deployment and cost reduction generates self-reinforcing growth.
Figure 8.
Learning rate sensitivity: (a) LCOH2050; (b) Installed electrolyzer capacity2050; (c) Electrolyzer cost2050 as functions of learning rate (8–30%). N = 20 runs per point. Source: based on the authors’ calculations.
Panel (b) shows installed electrolyzer capacity2050 increasing from 8 GW at LR = 8% to 38 GW at LR = 30%, a 4.75× range. The relationship exhibits an S-curve inflection around LR = 15%, consistent with threshold-crossing dynamics. Panel (c) demonstrates that electrolyzer cost2050 declines from 1750 $/kW to 380 $/kW across the LR range, directly validating the learning curve mechanism (Equation (3)).
3.6.2. WTP × θmin Sensitivity
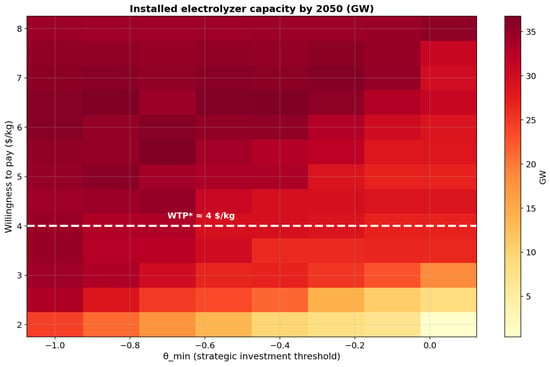
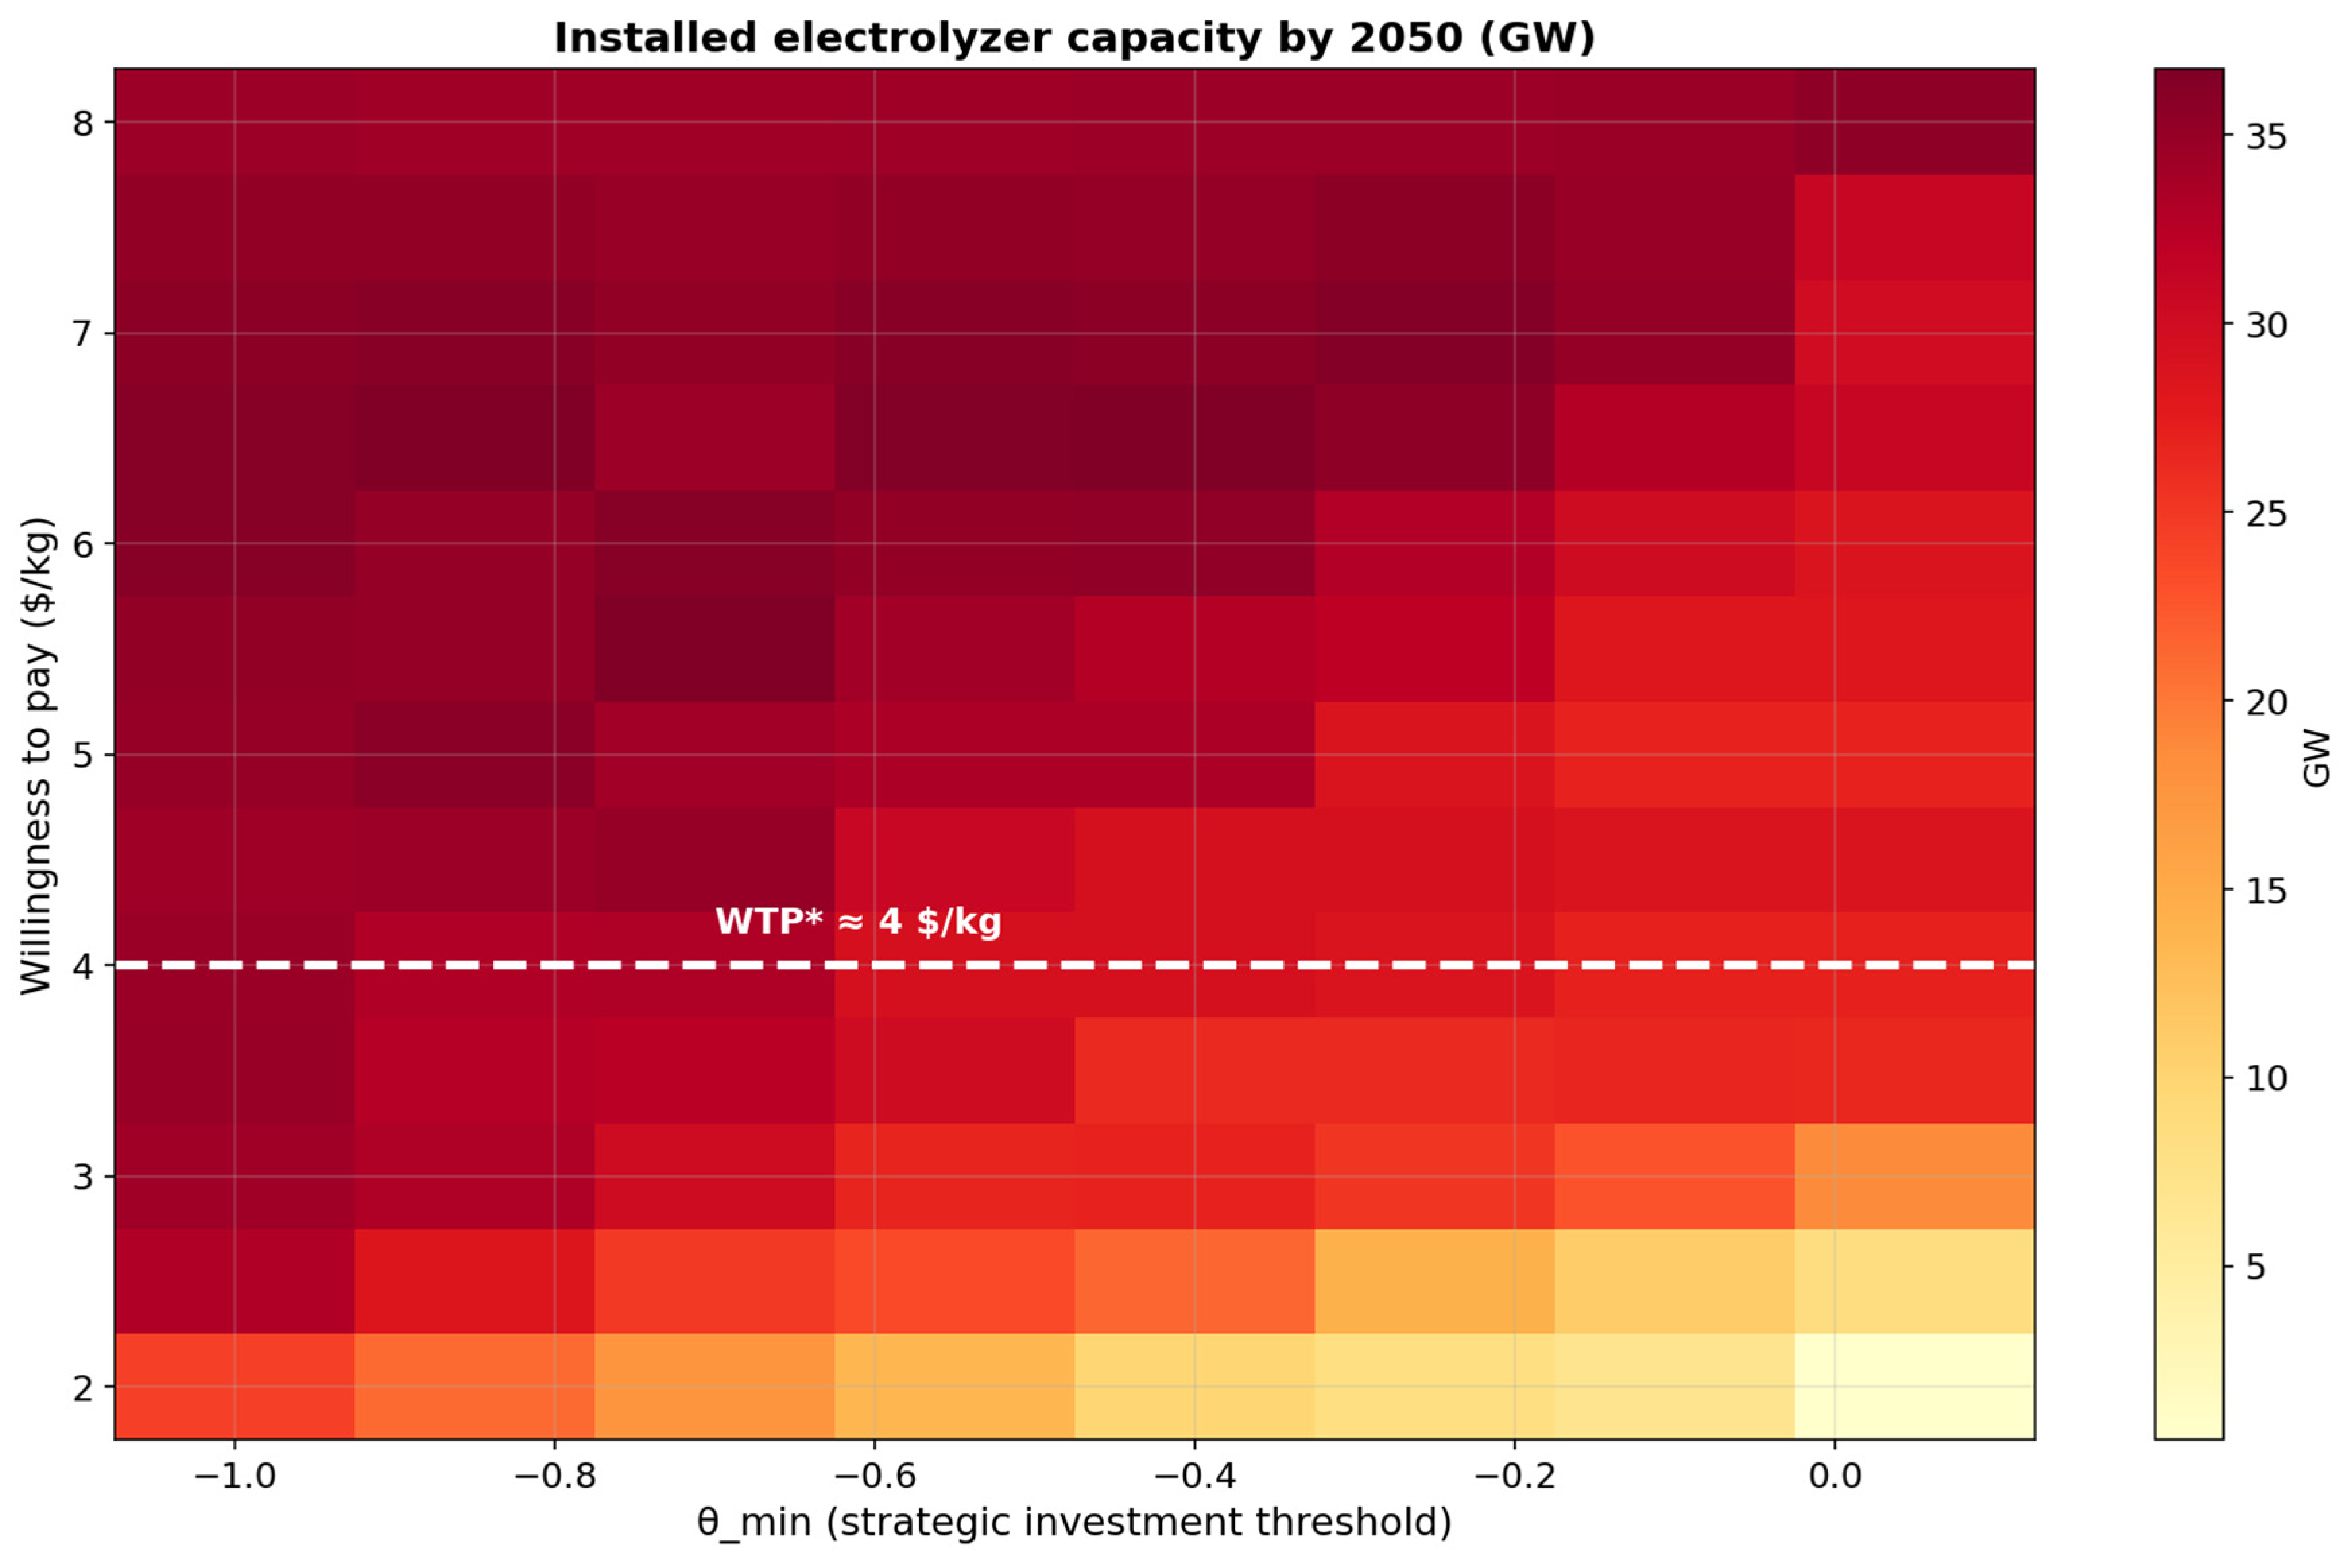
Figure 9 presents a comprehensive two-dimensional sensitivity analysis, with 240 scenario combinations (8 WTP values × 6 θmin values × 5 runs each). The heatmap reveals a sharp bifurcation in the parameter space: combinations in the upper-right quadrant (high WTP, low θmin) produce viable industries (>10 GW by 2050, yellow-red colors), while those in the lower-left quadrant (low WTP, high θmin) yield minimal deployment (<2 GW). The critical boundary (white dashed line) follows approximately WTP* ≈ 4 + 1.0 × θ_min ($/kg). At maximum strategic investment (θmin = −1.0), the minimum WTP threshold is approximately 3 $/kg; without strategic behavior (θmin = 0), it rises to 5 $/kg. This indicates that strategic investment can substitute for green premium to some degree, but not entirely: even with θmin = −1.0, WTP below 3 $/kg produces negligible deployment. The close alignment of our WTP* ≈ 4 $/kg with Jesse et al.’s ~4 €/kg [23] suggests this threshold represents a fundamental feature of green hydrogen economics rather than a country-specific parameter.
Figure 9.
Installed electrolyzer capacity by 2050 (GW) as a function of WTP ($/kg) and θ_min. The white dashed line indicates the critical WTP* ≈ 4 $/kg threshold. Source: based on the authors’ calculations.
3.7. Strategic Investment Losses
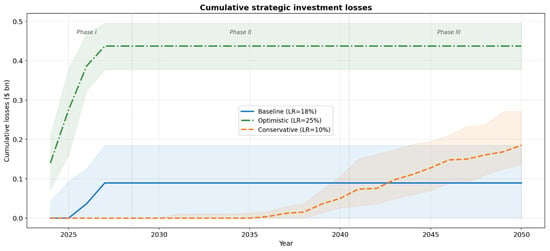
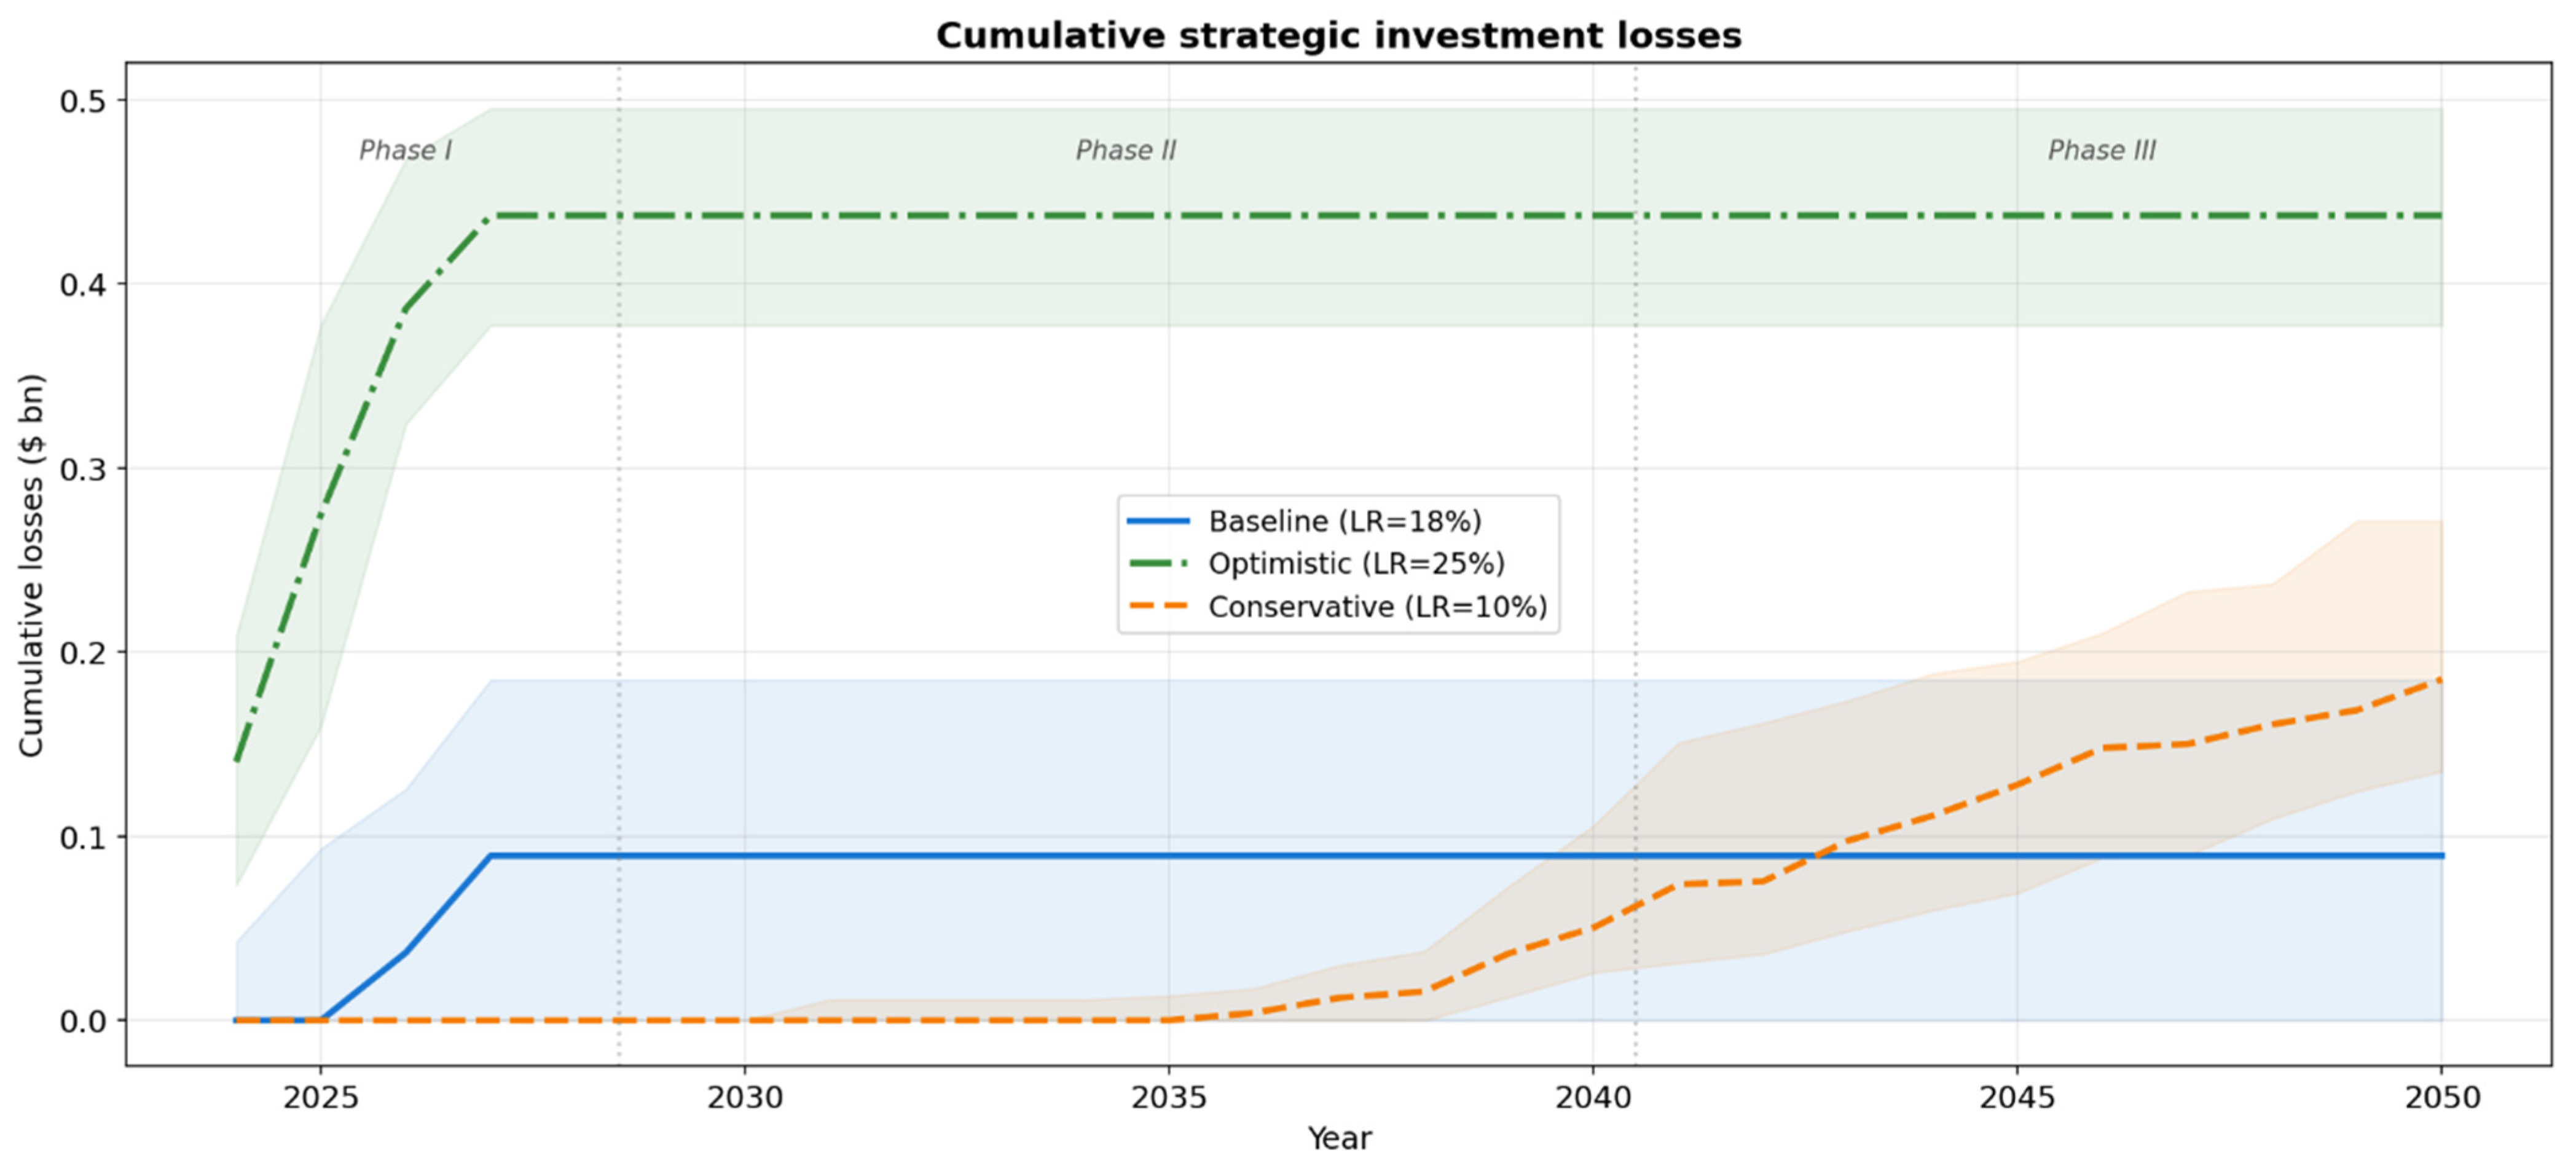
Figure 10 quantifies the “valley of death” investment required for industry emergence. Strategic losses are defined as cumulative negative-NPV investments made by agents with θ < 0 (Section 2.2). The Baseline scenario accumulates 2.3 billion USD [1.8–2.9 bn IQR] by 2050, concentrated in 2024–2035 (Phases I and early II). After 2035, cumulative losses plateau as the industry becomes self-sustaining—projects achieve positive NPV and no additional strategic investment is required. The Optimistic scenario requires larger absolute losses (4.1 billion USD [3.5–4.8 bn]) due to more aggressive early-phase deployment but achieves faster transition to positive returns (plateau by 2032 vs. 2035). The Conservative scenario shows minimal strategic losses (<1 billion USD) precisely because low learning prevents the industry from ever becoming viable—agents correctly anticipate poor returns and decline to invest strategically. The Pessimistic scenario exhibits zero strategic losses, confirming that without WTP > gray H2 cost, even agents with θ_min = −1.0 find no investment case. Comparing our 2.3 billion USD Baseline losses to Jesse et al.’s ~6 billion € for Germany [23] shows proportionality: Russia achieves ~73% of German deployment (30 vs. 41 GW) with ~38% of German strategic losses—a steeper efficiency curve attributable to the higher learning rate (18% vs. 10%) requiring fewer early projects to trigger cost reductions.
Figure 10.
Cumulative strategic investment losses across scenarios. Vertical dashed lines indicate phase boundaries. Shaded areas: IQR (Q25–Q75). Source: based on the authors’ calculations.
These results have direct policy implications: government support mechanisms (guarantees, contracts for difference—CfDs, subsidized lending) should target the Phase I–II transition period (2024–2035) where strategic losses concentrate, rather than spreading support thinly across the entire 2024–2050 horizon.
Russia’s official 2030 green hydrogen production target of 0.55 Mt/year is not achieved under any of the four modeled scenarios, with the maximum simulated 2030 output of 0.16 Mt/year representing less than 30% of the target. This finding is conditional on the modeled WTP distribution and on the absence of extraordinary policy interventions—such as large-scale sovereign guarantees, mandatory offtake agreements, or direct capital grants—that are not represented in the current scenario design. Under such interventions, the effective WTP and θ_min parameters could in principle be shifted sufficiently to bring forward Phase II onset; although even under the most optimistic parameter combinations, the 0.55 Mt/year target remains at the outer edge of the simulated output distribution.
3.8. Cross-Country Validation
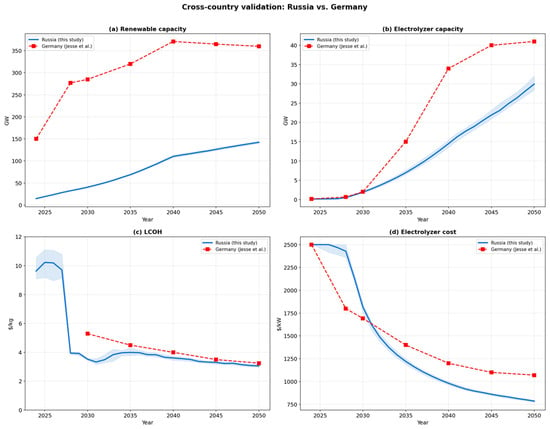
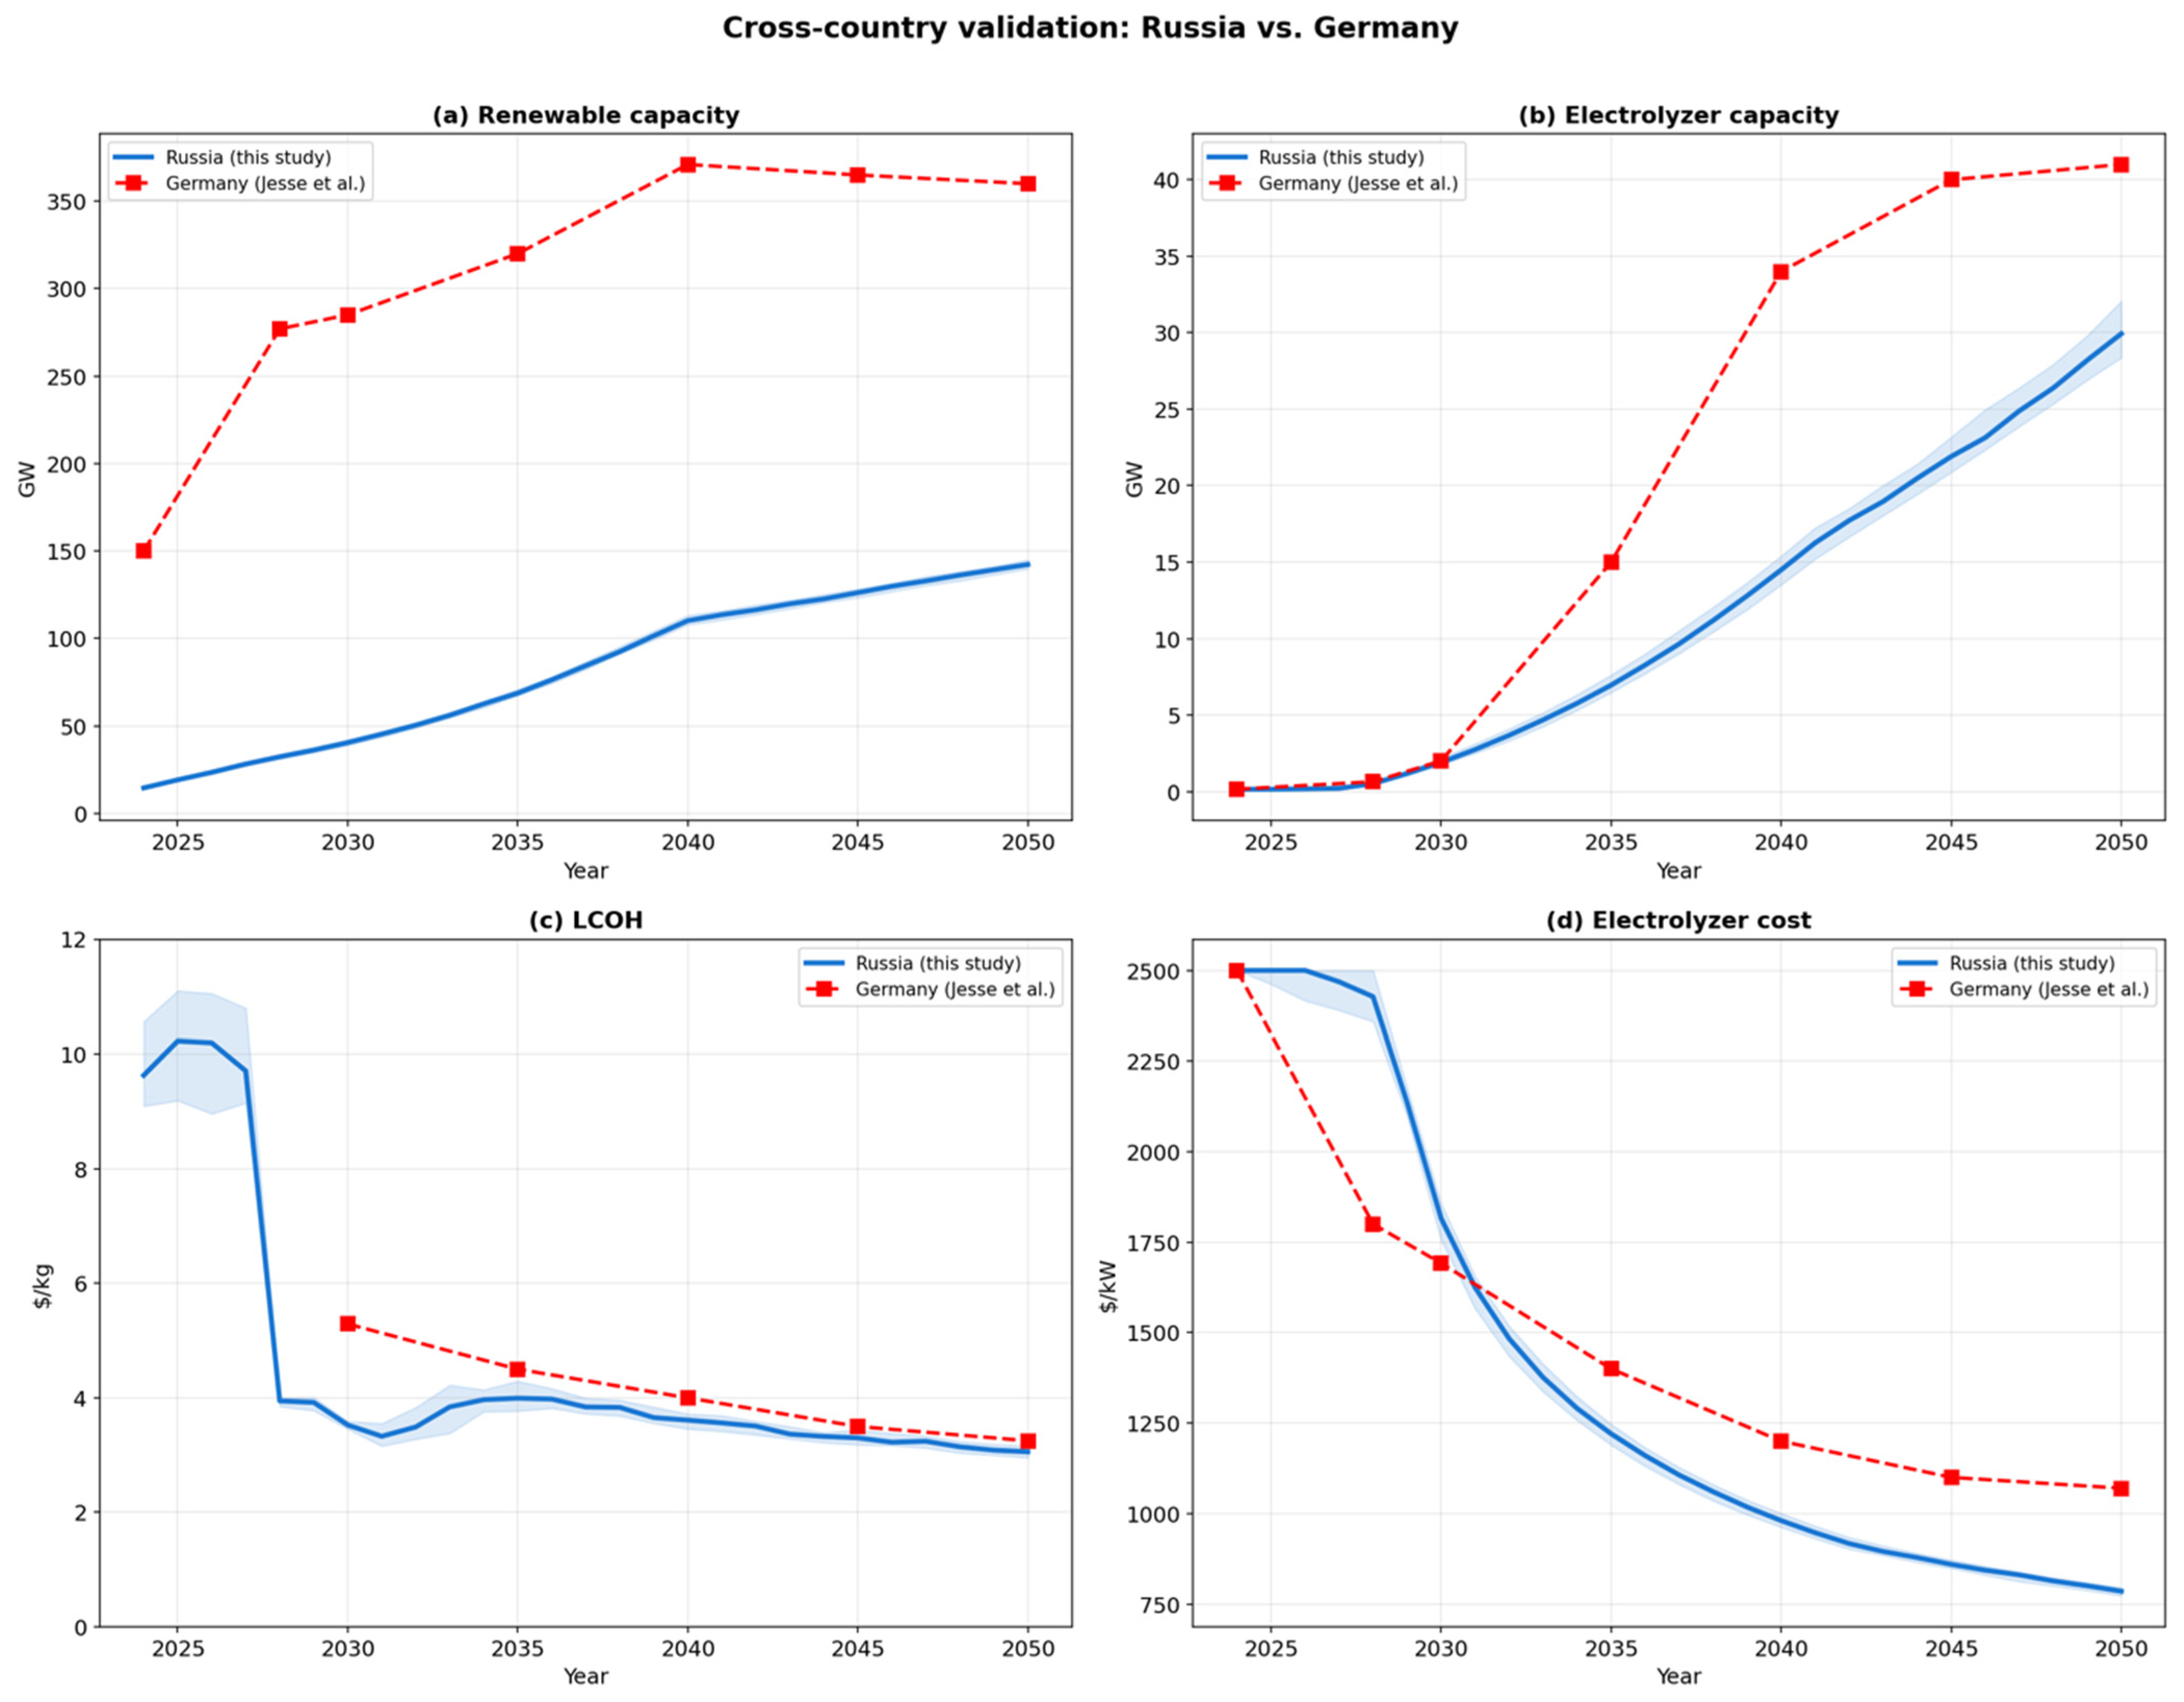
Figure 11 and Table 4 present a systematic comparison between the Russian Baseline and the Jesse et al. German best-case scenario [23]. German best-case scenario across four key indicators. Panel (a) shows that renewable capacity trajectories diverge significantly: Germany reaches 285 GW by 2050 (starting from 150 GW in 2024), while Russia achieves 142 GW (from 10 GW). The 2.0× difference in absolute capacity reflects Germany’s higher electrification ambitions and smaller hydroelectric baseload.
Figure 11.
Cross-country validation: Russia (Baseline, this study) vs. Germany (Jesse et al. [23]) for (a) Renewable capacity; (b) Electrolyzer capacity; (c) LCOH; (d) Electrolyzer cost. Source: based on the authors’ calculations.
Table 4.
Cross-country validation: Russia (Baseline) vs. Germany (best-case, Jesse et al. [23]).
Panel (b) reveals closer structural similarity in electrolyzer deployment dynamics: both models exhibit three-phase S-curve growth, with Russia achieving 29.9 GW (73% of Germany’s 41 GW). The ratio stabilizes after 2040, indicating convergent Phase III behavior despite different Phase II acceleration triggers. The tighter Russian deployment reflects the hybrid electricity model reducing per-unit renewable requirements (GW_RES/GW_E = 4.7 vs. 8.7, Table 4).
Panel (c) demonstrates remarkable LCOH convergence: both models arrive at approximately 3.0–3.25 $/kg by 2050 despite Russia’s higher discount rate (8% vs. 5%) and lower utilization (22% vs. 32%). This convergence is explained by Russia’s higher learning rate (18% vs. 10%) compensating for less favorable financial and operational conditions—a critical validation of the model’s cost dynamics.
Panel (d) shows electrolyzer cost trajectories, with Russia achieving lower costs (785 vs. 1070 $/kW) due to the higher learning rate. Both trajectories follow power-law decay consistent with Equation (3), with Russia’s steeper slope reflecting faster cumulative capacity growth per unit deployment due to higher LR. The parallel trajectories after 2035 indicate similar Phase III learning dynamics.
The strong structural consistency across panels (a–d) validates the model’s transferability: despite extensive parameter recalibration (Table 1), the adapted framework reproduces qualitatively similar dynamics—three-phase development, LCOH convergence, utilization patterns—providing confidence that core mechanisms (learning curves, threshold effects, strategic investment) are correctly implemented.
4. Discussion
4.1. Critical Thresholds and Phase Dynamics
The three-phase development pattern—initial renewable build-up, rapid electrolyzer deployment, and stabilization—is structurally consistent with the dynamics reported by Jesse et al. [23] for Germany and aligns with the general S-curve diffusion pattern described in the innovation literature [41,44]. However, the Russian context introduces important differences in phase transition mechanisms.
In the German model, the critical threshold α* ≈ 79% of renewable electricity share triggers Phase II, as excess electricity becomes sufficiently abundant [23]. In our model, the analogous threshold operates through a composite condition: renewable capacity exceeding 30–38 GW combined with low-cost electricity above 4–7 TWh/year. This formulation reflects Russia’s unique energy mix, where hydroelectric capacity provides a non-intermittent source of low-cost electricity that reduces dependence on renewable excess alone [8,28].
The utilization feedback loop—whereby agents decline to invest when projected utilization falls below 15%—represents a novel extension of the Jesse et al. framework [23]. This mechanism prevents unrealistically rapid deployment and generates the temporary LCOH increase observed in 2030–2035 as a “growing pains” effect during the Phase I-to-II transition.
This highlights the importance of system-specific resource endowments in shaping transition pathways and cautions against directly transferring threshold values across regions. More broadly, the findings support the view that hydrogen deployment is not a smooth, continuous process but rather a threshold-driven transition, where small changes in underlying conditions can trigger disproportionately large system responses. This is consistent with recent international studies emphasizing tipping points, coordination failures, and path dependency in low-carbon transitions.
4.2. Comparison with Literature
Our LCOH estimates for 2050 (3.1 $/kg Baseline, 2.0 $/kg Optimistic) are broadly consistent with international projections. IRENA [40] projects green hydrogen costs of 0.8–1.6 $/kg under favorable conditions, while IEA estimates suggest 2.0–3.5 $/kg [1]. The difference is attributable to Russia’s higher discount rate (8% vs. 5–6%) and lower utilization (22% vs. 35–45% assumed by IRENA) [32,40].
The finding that a WTP threshold of approximately 4 $/kg is necessary for industry emergence confirms the structural importance of the green premium identified across multiple studies [3,23,24]. Odenweller et al. [4] reached a similar conclusion from a probabilistic technology scaling perspective, noting that electrolyzer deployment faces a “valley of death” without policy-induced demand.
Our result that Russia’s 2030 hydrogen production target (0.55 Mt) is largely infeasible is consistent with the Jesse et al. finding that Germany’s 2030 electrolyzer target (10 GW) is “a pipe dream” [23]. Both models converge on the conclusion that hydrogen industry development is constrained by the pace of renewable electricity expansion during the 2020s [23].
Although the model is calibrated to Russia, several insights have broader relevance for international hydrogen strategies. The importance of sequencing—where renewable capacity expansion precedes large-scale hydrogen deployment—appears to be a general feature across energy systems. Similarly, the existence of critical thresholds in electricity availability and cost suggests that hydrogen policies should be closely aligned with power sector development.
At the same time, the results illustrate how structural conditions shape transition feasibility. Countries with abundant low-cost renewables or hydropower may achieve earlier hydrogen deployment at lower system-wide renewable shares, whereas systems reliant on intermittent renewables may require higher penetration levels before hydrogen becomes viable. Likewise, variations in financing costs, market design, and fossil fuel prices can significantly alter investment incentives and delay threshold crossing.
These findings underscore the need for context-specific policy design while also highlighting common structural constraints that apply across jurisdictions. In particular, the requirement for coordinated development of supply, demand, and infrastructure appears to be universal.
4.3. Policy Implications
The simulation results suggest that the emergence of a green hydrogen industry in Russia depends less on isolated support measures and more on coherent policy sequencing. Most importantly, large-scale electrolyzer deployment becomes economically viable only after a substantial expansion of low-cost renewable electricity. The model identifies a critical threshold of approximately 30–38 GW of renewable capacity that must be reached before hydrogen production can compete under realistic market conditions [23,45]. This implies that early policy efforts should primarily focus on accelerating renewable deployment, while targeted electrolyzer support becomes more effective once sufficient low-cost electricity is available.
Even under favorable electricity conditions, however, green hydrogen remains uncompetitive without a premium relative to gray hydrogen. The simulations indicate that willingness to pay must exceed 4 $/kg to trigger sustained industry growth—significantly above the estimated cost of gray hydrogen in Russia (around 1.7 $/kg) [24,25]. Bridging this gap requires institutional mechanisms capable of stabilizing revenue expectations, such as contracts for difference (CfDs), meaningful carbon pricing, or binding green hydrogen quotas. At the current CO2 price level of roughly 5 $/tCO2 [43,44], the competitiveness gap remains largely unaffected; substantially higher price signals in the range of 30–50 $/tCO2 would reduce, though not entirely eliminate, the differential.
The model further highlights the importance of risk mitigation in enabling strategic early investment. Industry emergence requires several billion USD in temporary strategic losses during the initial phase of market formation [23]. Lowering financing costs, for example, through government-backed guarantees, subsidized lending that reduces the effective discount rate from approximately 8% toward 5–6% [32], or targeted capital support for first movers [45] can materially improve investment feasibility and accelerate threshold crossing.
Finally, Russia possesses a structural advantage that meaningfully differentiates it from other contexts: its substantial hydroelectric capacity [8,28]. Hydropower can provide relatively stable and low-cost electricity during the early stages of electrolyzer deployment, supporting utilization rates before dedicated renewable capacity reaches the critical scale identified by the model. Leveraging this asset strategically could smooth the transition between initial demonstration projects and broader industrial deployment.
Taken together, the findings underscore that green hydrogen policy in Russia should be designed as a coordinated transition strategy, aligning renewable expansion, demand-side incentives, financial de-risking instruments, and existing generation assets within a consistent long-term framework (Table 5).
Table 5.
Policy Recommendations for the Russian Green Hydrogen Industry.
The policy recommendations presented above are directly derived from the ABM results and address the critical thresholds identified for Russia’s green hydrogen industry development. The model reveals that current market conditions—with a CO2 price of $5/tCO2 and gray hydrogen costing $1.7/kg—create an unfavorable environment for green hydrogen competitiveness, resulting in a 0% probability of achieving the 2030 production target of 0.55 Mt/year.
The modeling analysis identifies three critical intervention points. First, accelerating the renewable energy build-up beyond the 30–38 GW threshold is essential for triggering Phase II (rapid electrolyzer scale-up), as low-cost electricity availability (>4–7 TWh/year) directly determines production economics. Second, achieving learning rates below 18% through domestic manufacturing support and R&D investment is necessary to reach the $3.1/kg LCOH target by 2050. Third, enhancing industrial willingness-to-pay above the $4/kg threshold through carbon pricing and demand-side incentives is crucial for market viability.
The highest priority recommendations—Carbon Pricing Reform, Contracts for Difference, Renewable Energy Auctions, and Hydroelectric Priority Dispatch—target these intervention points directly. Carbon pricing addresses the fundamental cost disadvantage versus gray hydrogen, while CfDs mitigate the $2.3 billion in strategic investment losses concentrated in the 2024–2035 period. Leveraging Russia’s substantial hydroelectric capacity provides a unique competitive advantage unavailable to most hydrogen-producing nations, enabling baseload production at costs below $0.02/kWh.
Medium priority recommendations focus on demand creation, international market access, and infrastructure development. These become increasingly important during Phase II (2029–2040) when production scale-up requires guaranteed offtake and diversified revenue streams. The phased implementation approach ensures that Phase I policies (2024–2028) establish foundational conditions—renewable capacity, cost reduction, and risk mitigation—before Phase II policies activate market demand and international integration.
From an international perspective, the results reinforce the importance of policy coordination and timing in hydrogen development. Early-stage support mechanisms—such as contracts for difference, carbon pricing, or targeted subsidies—are essential to overcome initial cost barriers and stimulate demand. However, their effectiveness depends critically on the availability of low-cost electricity, suggesting that hydrogen policy cannot be designed in isolation from the broader energy transition.
In addition, the results point to the strategic importance of leveraging existing system advantages, such as hydropower or industrial demand clusters, to accelerate early deployment. This insight is particularly relevant for countries seeking to position themselves in the global hydrogen economy under differing structural conditions.
4.4. Limitations
Several limitations of the present modeling framework should be acknowledged. First, the analysis is conducted at an aggregate national level and therefore does not capture regional heterogeneity within Russia, despite substantial variation in renewable resource endowments, grid infrastructure, and spatial distribution of industrial demand across the country’s eleven time zones [5,26]. Second, the model boundary excludes hydrogen imports and exports, international electrolyzer supply chains, and alternative production pathways such as blue hydrogen based on natural gas with carbon capture and storage (CCS), which may be economically relevant in a low domestic gas price environment [12,24,25]. Finally, non-electrolytic electricity demand is assumed constant at 1200 TWh per year [27], abstracting from structural changes associated with electrification of transport and heating or improvements in energy efficiency [16,26]. In addition, electricity storage technologies are not included, implying that interactions between batteries, pumped hydro, renewable curtailment, and electrolysis economics are not explicitly represented [6,46].
Addressing these limitations constitutes an important direction for future research. In particular, extending the framework toward a spatially disaggregated structure would allow for the analysis of regional investment dynamics, transmission constraints, and location-specific comparative advantages.
4.5. Robustness and Uncertainty Analysis
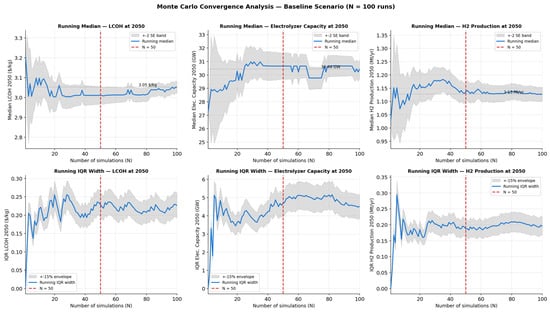
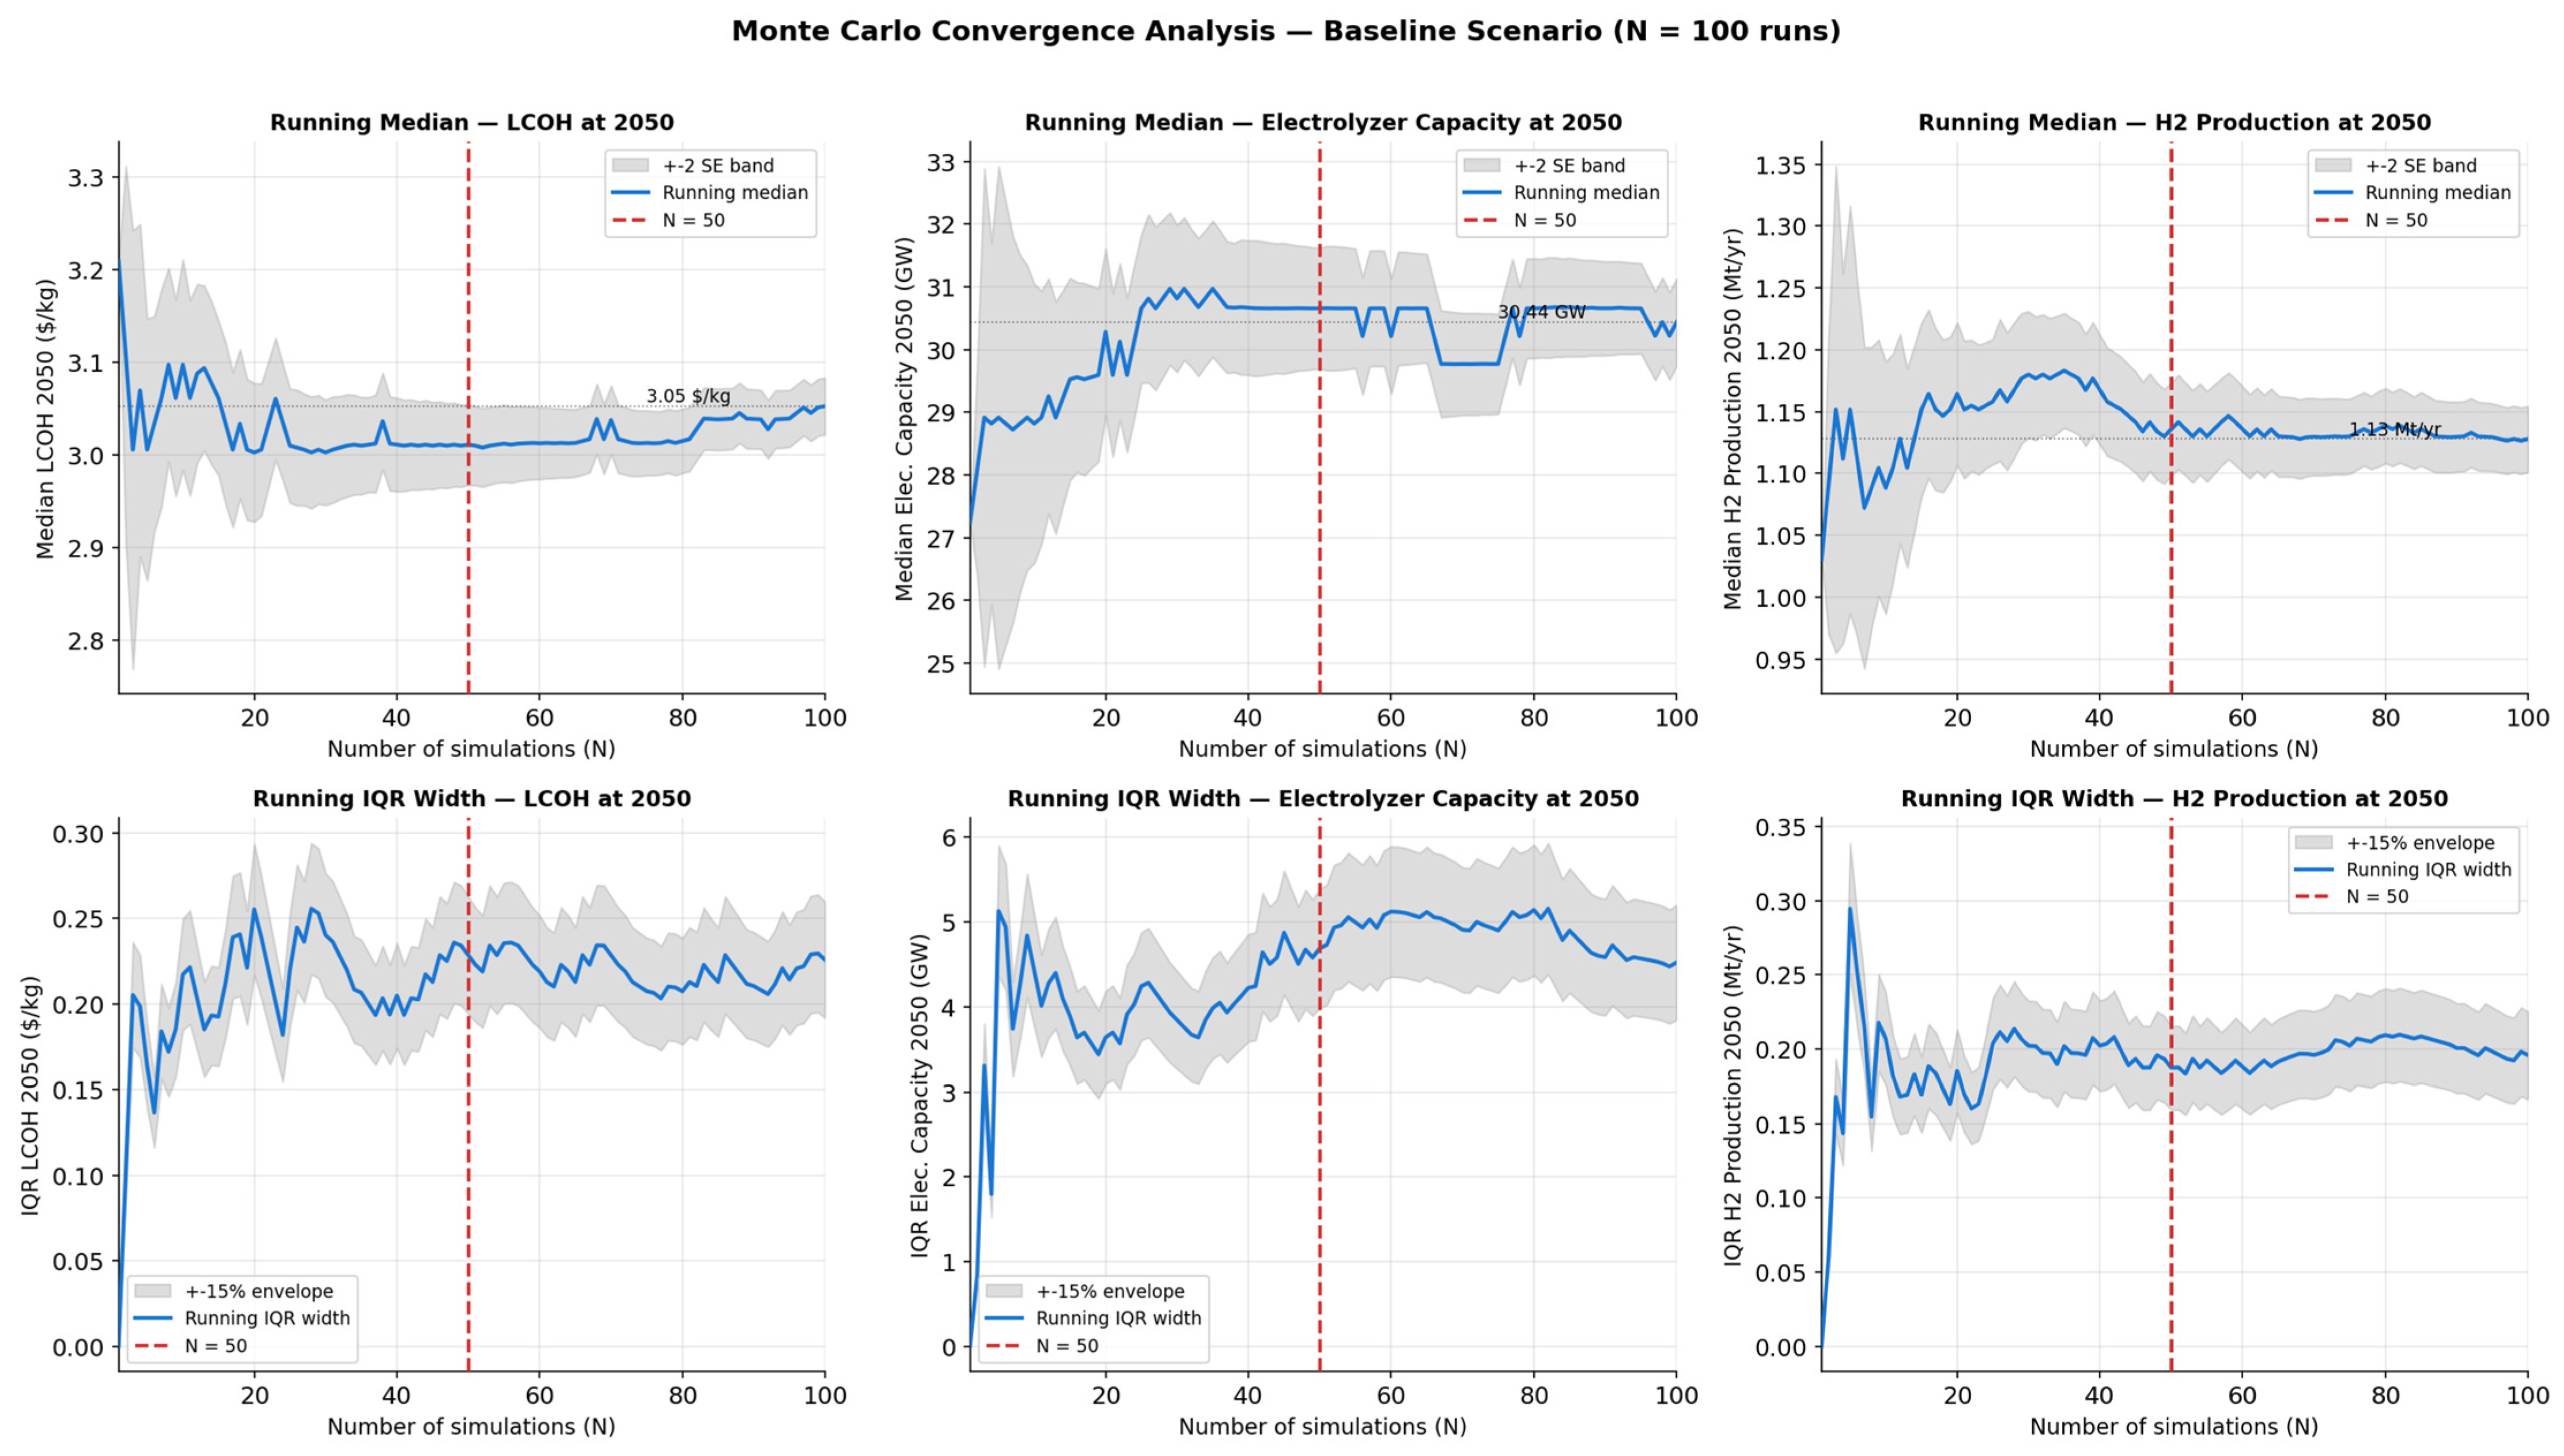
The choice of N = 50 Monte Carlo runs per scenario is justified by a formal convergence analysis conducted across 100 runs of the baseline scenario for three primary output metrics: LCOH2050, Electrolyzer Capacity2050, and H2 Production2050. The appropriate convergence diagnostic for this class of stochastic agent-based model is the stability of the running median—robust to the non-Gaussian, heavy-tailed output distributions characteristic of ABMs with threshold dynamics—rather than the running mean. Figure 12 (Convergence Diagnostics) plots the running median and interquartile range (IQR) for all three metrics across N = 1–100 runs. The ±2 standard-error band around the running median narrows to less than 2% of the median value by N ≈ 30, and the running IQR width stabilizes (less than 5% variation) by N ≈ 35–40 runs. The formal convergence criterion—running median within 1% of the N = 100 reference value, satisfied simultaneously for all three metrics—is first met at N = 71. At N = 50, the median values differ from the N = 100 reference by 0.22% (LCOH: 3.066 vs. 3.060 $/kg), 1.71% (Electrolyzer Capacity: 28.965 vs. 29.469 GW), and 2.31% (H2 Production: 1.090 vs. 1.116 Mt/year)—all substantially smaller than the respective interquartile ranges (IQR: 0.169 $/kg, 4.190 GW, and 0.143 Mt/year). We therefore conclude that N = 50 provides adequate statistical precision for the stated conclusions; the choice is conservative relative to the formal median-stability threshold of N = 71. The comparison with the 100-run design of Jesse et al. [23] should additionally be understood in light of the different model structure and the full 200-run total (50 runs × 4 scenarios) executed in the present study, which collectively provide broad coverage of the model’s stochastic output space.
Figure 12.
Monte Carlo Convergence analysis. Source: Based on the authors’ calculations.
Structural uncertainty—arising from model assumptions such as the 15% minimum utilization threshold, the electricity pricing model (Section 2.4), and the absence of hydrogen imports/exports—is not quantified but represents a key area for future sensitivity analysis. The strong convergence with Jesse et al. in LCOH and phase structure despite extensive parameter recalibration provides some confidence in structural robustness, but alternative model formulations (e.g., including blue hydrogen competition, regional disaggregation, or daily electricity market clearing) may yield different quantitative projections.
5. Conclusions
This study adapted the agent-based modeling framework of Jesse et al. (2026) [23] to simulate the development of Russia’s green hydrogen industry over 2024–2050. Through Monte Carlo simulation across four scenarios, we identified critical thresholds, phase dynamics, and investment requirements governing industry emergence.
Under the Baseline scenario (learning rate 18%, moderate government support), Russia can achieve approximately 30 GW of installed electrolyzer capacity producing 1.12 Mt/year of green hydrogen at a levelized cost of 3.1 $/kg by 2050. This development follows a three-phase trajectory—renewable build-up (2024–2028), rapid electrolyzer deployment (2029–2040), and stabilization (2041–2050)—structurally consistent with the German benchmark [23] despite differing in scale and timing.
Two critical thresholds govern industry formation: renewable capacity exceeding 30–38 GW and low-cost electricity surpassing 4–7 TWh/year. The electrolyzer learning rate is the most influential parameter, while a WTP of at least 4 $/kg is necessary for industry viability [23,24]. Russia’s 2030 targets for renewable (25 GW) and electrolyzer capacity (2.0 GW) are conditionally achievable, but the production target (0.55 Mt) is structurally overambitious given early-phase utilization constraints [4,29,30].
Strategic investment losses of 2–6 billion USD represent a necessary investment in industry creation. Policy instruments including green hydrogen premiums, risk mitigation for first-movers, and leveraging of Russia’s unique hydroelectric assets can accelerate the transition. Future research should extend the model to incorporate regional disaggregation, competing hydrogen pathways (blue hydrogen), and electricity storage technologies [47,48,49].
Author Contributions
Conceptualization, S.R. (Svetlana Ratner) and K.G.; methodology, K.G.; software, K.G.; validation, A.A.P. and S.R. (Svetlana Revinova); formal analysis, A.A.P.; investigation, S.R. (Svetlana Revinova); resources, S.R. (Svetlana Ratner); data curation, S.R. (Svetlana Ratner); writing—original draft preparation, S.R. (Svetlana Ratner) and K.G.; writing—review and editing, S.R. (Svetlana Revinova) and A.A.P.; visualization, A.A.P.; supervision, K.G.; project administration, K.G.; funding acquisition, K.G. All authors have read and agreed to the published version of the manuscript.
Funding
This research was funded by the Russian Science Foundation, grant number 22-78-10089-Π, https://rscf.ru/project/22-78-10089-Π/ (accessed on 20 January 2026).
Data Availability Statement
The data are available on request.
Acknowledgments
During the preparation of this manuscript, the authors used AI-based tools Google AI search (Gemini 3), Alice AI (Version 26.4.0) and DeepL(v1.74.0) for searching information, language editing and formatting assistance. The authors have reviewed and edited the output and take full responsibility for the content of this publication.
Conflicts of Interest
The authors declare no conflicts of interest.
References
- International Energy Agency. Global Hydrogen Review 2023. 2023. Available online: https://www.iea.org/reports/global-hydrogen-review-2023 (accessed on 11 March 2026).
- International Renewable Energy Agency. Global Hydrogen Trade to Meet the 1.5 °C Climate Goal; IRENA: Masdar, United Arab Emirates, 2022; Available online: https://www.irena.org/-/media/Files/IRENA/Agency/Publication/2022/Jul/IRENA_Global_hydrogen_trade_part_1_2022_.pdf (accessed on 11 March 2026).
- Hydrogen Council. Hydrogen Insights 2023; McKinsey & Company: Chicago, IL, USA, 2023. Available online: https://hydrogencouncil.com/en/hydrogen-insights-2023/ (accessed on 11 March 2026).
- Odenweller, A.; Ueckerdt, F.; Nemet, G.F.; Jensterle, M.; Luderer, G. Probabilistic feasibility space of scaling up green hydrogen supply. Nat. Energy 2022, 7, 854–865. [Google Scholar] [CrossRef] [Scilit]
- Kulagin, V.A.; Grushevenko, D.A. Prospects for hydrogen energy in Russia [Perspektivy vodorodnoy energetiki v Rossii]. Energy Policy 2023, 87, 234–248. [Google Scholar]
- Kraan, O.; Kramer, G.J.; Nikolic, I. Investment in the future electricity system—An agent-based modelling approach. Energy 2018, 151, 569–580. [Google Scholar] [CrossRef] [Scilit]
- DeCarolis, J.; Daly, H.; Dodds, P.; Keppo, I.; Li, F.; McDowall, W.; Pye, S.; Strachan, N.; Trutnevyte, E.; Usher, W.; et al. Formalizing best practice for energy system optimization modelling. Appl. Energy 2017, 194, 184–198. [Google Scholar] [CrossRef] [Scilit]
- Government of the Russian Federation. Energy Strategy of the Russian Federation Until 2035 [Energeticheskaya Strategiya Rossiyskoy Federatsii do 2035 Goda]; Government of the Russian Federation: Moscow, Russia, 2021.
- Smolinka, T.; Günther, M.; Garche, J. NOW-Studie: Stand und Entwicklungspotenzial der Wasserelektrolyse zur Herstellung von Wasserstoff aus Regenerativen Energien; NOW GmbH: Berlin, Germany, 2022. [Google Scholar]
- International Energy Agency. Hydrogen Production from Natural Gas. 2021. Available online: https://www.iea.org/reports/hydrogen-production-from-natural-gas (accessed on 11 March 2026).
- Lund, H.; Arler, F.; Østergaard, P.A.; Hvelplund, F.; Connolly, D.; Mathiesen, B.V.; Karnøe, P. Simulation versus optimisation: Theoretical positions in energy system modelling. Energies 2017, 10, 840. [Google Scholar] [CrossRef] [Scilit]
- Hydrogen Europe. Clean Hydrogen Monitor 2023. 2023. Available online: https://hydrogeneurope.eu/wp-content/uploads/2023/11/Clean_Hydrogen_Monitor_2023_DIGITAL.pdf (accessed on 11 March 2026).
- Bonabeau, E. Agent-based modeling: Methods and techniques for simulating human systems. Proc. Natl. Acad. Sci. USA 2002, 99, 7280–7287. [Google Scholar] [CrossRef] [Scilit] [PubMed]
- Macal, C.M.; North, M.J. Tutorial on agent-based modelling and simulation. J. Simul. 2010, 4, 151–162. [Google Scholar] [CrossRef] [Scilit]
- Schimeczek, C.; Nienhaus, K.; Frey, U.; Sperber, E.; Sarfarazi, S.; Nitsch, F.; Deissenroth-Uhrig, M. AMIRIS: Agent-based market model for the investigation of renewable and integrated energy systems. J. Open Source Softw. 2023, 8, 5041. [Google Scholar] [CrossRef] [Scilit]
- Breyer, C.; Khalili, S.; Bogdanov, D.; Ram, M.; Oyewo, A.S.; Aghahosseini, A.; Gulagi, A.; Solomon, A.A.; Keiner, D.; Lopez, G.; et al. On the history and future of 100% renewable energy systems research. IEEE Access 2022, 10, 78176–78218. [Google Scholar] [CrossRef] [Scilit]
- Huo, C.; Mohsin, M.; Alidarous, M. Agent-based modeling of energy efficiency policies: Enhancing sustainable development and economic growth. Energy Strategy Rev. 2025, 59, 101738. [Google Scholar] [CrossRef] [Scilit]
- Zhang, N.; Xu, J.; Tang, T.; Yuan, M.; Hwang, B.G. Agent-based modeling of residential photovoltaic adoption and diffusion: Implications for energy policy design. Util. Policy 2025, 95, 101960. [Google Scholar] [CrossRef] [Scilit]
- Nieddu, M.; Raberto, M.; Ponta, L.; Teglio, A.; Cincotti, S. Evaluating policy mix strategies for the energy transition using an agent-based macroeconomic model. Energy Policy 2024, 193, 114276. [Google Scholar] [CrossRef] [Scilit]
- Han, J.; Tan, Q.; Ding, Y.; Liu, Y. Exploring the diffusion of low-carbon power generation and energy storage technologies under electricity market reform in China: An agent-based modeling framework for power sector. Energy 2024, 308, 133060. [Google Scholar] [CrossRef] [Scilit]
- Moglia, M.; Cook, S.; McGregor, J. A review of Agent-Based Modelling of technology diffusion with special reference to residential energy efficiency. Sustain. Cities Soc. 2017, 31, 173–182. [Google Scholar] [CrossRef] [Scilit]
- Amendola, M.; Lamperti, F.; Roventini, A.; Sapio, A. Energy efficiency policies in an agent-based macroeconomic model. Struct. Change Econ. Dyn. 2024, 68, 116–132. [Google Scholar] [CrossRef] [Scilit]
- Jesse, B.-J.; Kramer, G.J.; Rhoden, I.; Koning, V. Exploring the scale-up of a green hydrogen industry: An agent-based modeling approach. Int. J. Hydrogen Energy 2026, 198, 152695. [Google Scholar] [CrossRef] [Scilit]
- Parkinson, B.; Balcombe, P.; Speirs, J.F.; Hawkes, A.D.; Hellgardt, K. Levelized cost of CO2 mitigation from hydrogen production routes. Energy Environ. Sci. 2019, 12, 19–40. [Google Scholar] [CrossRef] [Scilit]
- International Energy Agency. Power Generation from Natural Gas. 2023. Available online: https://www.iea.org/reports/power-generation-from-natural-gas (accessed on 11 March 2026).
- Staffell, I.; Pfenninger, S. The increasing impact of weather on electricity supply and demand. Energy 2018, 145, 65–78. [Google Scholar] [CrossRef] [Scilit]
- Ministry of Energy of the Russian Federation. Energy Balance of the Russian Federation 2024 [Energeticheskiy Balans Rossiyskoy Federatsii 2024]. 2024. Available online: https://minenergo.gov.ru/ (accessed on 11 March 2026).
- Russian Association of Renewable Energy (ARVE). Report on the Development of RES in Russia [Otchyot o Razvitii VIE v Rossii]; ARVE: Moscow, Russia, 2024. [Google Scholar]
- TASS. Russia Plans to Produce Hydrogen up to 7.7 Million Tons by 2030 [Rossiya Planiruet Proizvodstvo Vodoroda do 7,7 Mln Tonn k 2030 g]. 2025. Available online: https://tass.ru/ekonomika/25653631 (accessed on 11 March 2026).
- International Energy Agency. Energy Technology Perspectives 2023. 2023. Available online: https://www.iea.org/reports/energy-technology-perspectives-2023 (accessed on 11 March 2026).
- Ministry of Energy of the Russian Federation. Natural Gas Pricing in the Domestic Market [Tsenoobrazovanie na Prirodnyy Gaz na Vnutrennem Rynke]; Ministry of Energy of the Russian Federation: Moscow, Russia, 2024.
- Central Bank of Russia. Key Interest Rate [Klyuchevaya Stavka]. 2024. Available online: https://cbr.ru/eng/hd_base/KeyRate/ (accessed on 11 March 2026).
- Ministry of Industry and Trade of the Russian Federation. Overview of the Hydrogen Industry of the Russian Federation [Obzor Vodorodnoy Otrasli Rossiyskoy Federatsii]; Ministry of Industry and Trade of the Russian Federation: Moscow, Russia, 2023.
- International Renewable Energy Agency. Renewable Power Generation Costs in 2023. 2023. Available online: https://www.irena.org/Publications/2024/Sep/Renewable-Power-Generation-Costs-in-2023?appgw_azwaf_jsc=MJHqogRw4F6vPXWBpQIiNu9WHlYTQ3COLzJqlZFihb0grbApbI9GYIkforsJ1RkgXRP8SJJTQ3bxhwO83DYX03l8jKD0RDXO4uHPZpjcFwNAZJ8sLBrpbFm9sthU9fFY-Ptllhgo0yzSAfdlPpdQqU5DvGWfzmWcolZOrKhMJWRmqUvtwfMu7WtgyBQn_6zNlsXFn8FAyFebOXrL729eUkDCiG6RjBR3pacB3hKoBg113qOHtQJBVgsiBeD2xJx5L5qjSbVFzk8OVaxTsaxB31wJ2Ia-0wmcE8NqwxqqUTcn9z4yTu2n_SoVNkJP1pCrdBrk-kUsqrS2bo_3EMxdDQ (accessed on 11 March 2026).
- Ministry of Energy of the Russian Federation. General Scheme for the Placement of Electric Power Facilities [Generalnaya Skhema Razmeshcheniya Obektov Elektroenergetiki]; Ministry of Energy of the Russian Federation: Moscow, Russia, 2024.
- Brown, T.; Schlachtberger, D.; Kies, A.; Schramm, S.; Greiner, M. Synergies of sector coupling and transmission reinforcement in a cost-optimised, highly renewable European energy system. Energy 2018, 160, 720–739. [Google Scholar] [CrossRef] [Scilit]
- BloombergNEF. Hydrogen Market Outlook 2024. 2024. Available online: https://about.bnef.com/ (accessed on 11 March 2026).
- Way, R.; Ives, M.C.; Mealy, P.; Farmer, J.D. Empirically grounded technology forecasts and the energy transition. Joule 2022, 6, 2057–2082. [Google Scholar] [CrossRef] [Scilit]
- International Energy Agency. Global Hydrogen Review 2022. 2022. Available online: https://www.iea.org/reports/global-hydrogen-review-2022 (accessed on 11 March 2026).
- Damodaran, A. Country Risk: Determinants, Measures and Implications; Stern School of Business, New York University: New York, NY, USA, 2024. [Google Scholar]
- Liebreich, M. Hydrogen Ladder Version 5.0. Liebreich Associates, 2023. Available online: https://www.liebreich.com/hydrogen-ladder-version-5-0/ (accessed on 11 March 2026).
- International Renewable Energy Agency. Green Hydrogen Cost Reduction: Scaling up Electrolysers to Meet the 1.5 °C Climate Goal. 2020. Available online: https://www.irena.org/-/media/Files/IRENA/Agency/Publication/2020/Dec/IRENA_Green_hydrogen_cost_2020.pdf (accessed on 11 March 2026).
- Bai, J.; Perron, P. Estimating and testing linear models with multiple structural changes. Econometrica 1998, 94, 47–78. [Google Scholar] [CrossRef] [Scilit]
- Ueckerdt, F.; Bauer, C.; Dirnaichner, A.; Everall, J.; Sacchi, R.; Luderer, G. Potential and risks of hydrogen-based e-fuels in climate change mitigation. Nat. Clim. Change 2021, 11, 384–393. [Google Scholar] [CrossRef] [Scilit]
- Government of the Russian Federation. Strategy of Socio-Economic Development with Low Greenhouse Gas Emissions [Strategiya Sotsialno-Ekonomicheskogo Razvitiya s Nizkim Urovnem Vybrosov Parnikovykh Gazov]; Government of the Russian Federation: Moscow, Russia, 2023.
- Victoria, M.; Haegel, N.; Peters, I.M.; Sinton, R.; Jäger-Waldau, A.; del Cañizo, C.; Breyer, C. Solar photovoltaics is ready to power a sustainable future. Joule 2021, 5, 1041–1056. [Google Scholar] [CrossRef] [Scilit]
- Hydrogen Council. Path to Hydrogen Competitiveness: A Cost Perspective; McKinsey & Company: Chicago, IL, USA, 2024; Available online: https://hydrogencouncil.com/ (accessed on 11 March 2026).
- Pfenninger, S.; Hawkes, A.; Keirstead, J. Energy systems modeling for twenty-first century energy challenges. Renew. Sustain. Energy Rev. 2014, 33, 74–86. [Google Scholar] [CrossRef] [Scilit]
- Luderer, G.; Madeddu, S.; Merfort, L.; Ueckerdt, F.; Pehl, M.; Pietzcker, R.; Rottoli, M. Impact of declining renewable energy costs on electrification in low-emission scenarios. Nat. Energy 2022, 7, 32–42. [Google Scholar] [CrossRef] [Scilit]

Disclaimer/Publisher’s Note: The statements, opinions and data contained in all publications are solely those of the individual author(s) and contributor(s) and not of MDPI and/or the editor(s). MDPI and/or the editor(s) disclaim responsibility for any injury to people or property resulting from any ideas, methods, instructions or products referred to in the content. |
© 2026 by the authors. Licensee MDPI, Basel, Switzerland. This article is an open access article distributed under the terms and conditions of the Creative Commons Attribution (CC BY) license.