


Abstract
Sea beet (Beta vulgaris subsp. maritima (L.) Arcang.) is the primary gene pool of breeding programs for sugar beet and cultivated beets (B. vulgaris subsp. vulgaris L.). It mainly inhabits the Mediterranean region, where anthropogenic activities and climate change threaten this globally significant genetic resource. The present study aims to (i) assess the phenotypic and molecular diversity within the sea beet across its geographic gradients, including both wild and crop–weed populations, and (ii) explore the correlations between the phenotypic and molecular diversity and the environmental factors. The morphological diversity of seven populations representing their geographic range in Egypt was studied. This research used 59 quantitative and 39 qualitative traits to assess the phenotypic plasticity within sea beet. UPGMA cluster analysis grouped these populations into two clusters. Canonical correspondence analysis (CCA) evaluated relationships between variation in morphological traits among populations and 18 soil and climatic parameters. Further molecular investigation was conducted using ISSR and SRAP markers. The study found a higher polymorphism rate with SRAP markers compared to ISSR markers. Diverse molecular diversity indices were observed with the two markers (ISSR, SRAP), revealing molecular differentiation among populations. Mantel and partial Mantel analyses showed that environmental factors rather than molecular ones mainly influence morphological divergence. The suitability of the markers used for assessing the molecular profiles of Beta populations was evaluated using six polymorphism indices for each marker. Overall, the current study suggests that the classical coastal–wild prostrate hairy (var. pilosa) and inland crop–weed erect glabrous (var. glabra) sea beet forms in Egypt represent an environmentally induced phenotypic gradient rather than distinct genetic lineages. However, as this clear phenotypic divergence did not correlate with the molecular variation detected by the surveyed ISSR and SRAP loci, further testing with high-density, genome-wide markers remains necessary to definitively confirm the absence of subtle genetic differentiation.
1. Introduction
Crop Wild Relatives (CWRs) are wild relatives of domesticated plants and are more broadly defined as including species that have socio-economic utility in food, fodder, medicinal, or ornamental uses [1]. Such species constitute an essential genetic resource for the improvement of crops, containing relevant alleles for disease resistance, abiotic stress tolerance, and improved nutritional quality, which have been frequently lost during domestication and intensive breeding [2]. They are becoming increasingly threatened by over-exploitation, habitat degradation, and climate change [3]. The reliance on genetically uniform crop varieties has reduced their genetic diversity, making them more susceptible to pests, diseases, and environmental stresses [4]. Such efforts have motivated researchers to analyze the genetic diversity in wild relatives of cultivated species to formulate effective conservation strategies [5]. The North African CWR checklist comprises 5780 taxa, belonging to 136 families, and is divided into 765 genera and 4866 species [6]. These findings highlight the region’s vital role in global plant genetic diversity and underscore the urgent need for systematic identification and conservation efforts.
Sea beet (Beta vulgaris L. subsp. maritima; family Amaranthaceae) is the wild ancestor of all cultivated beets (Beta vulgaris subsp. vulgaris) [7]. The taxonomy of this species has been a matter of great controversy. While the Euro+Med Database treats it as a subspecies of B. vulgaris [8], others, like the World Flora Online, regard it as a synonym of Beta vulgaris L. [9]. Meanwhile, several taxonomists consider it a separate species, Beta maritima [10]. Sea beet exhibits greater genetic diversity than sugar beet, enhancing its ability to cope with various environmental challenges [11]. It can be found almost everywhere in the Mediterranean coastal areas, on many Atlantic islands, and along most of Europe’s Atlantic coast, reflecting its ecological flexibility and evolutionary success [1]. As a result, various ecotypes suited to different environmental conditions, ranging from saline coastal habitats to disturbed inland areas, have emerged [2].
Over time, various potential genetic resources have been lost, including the sea beet germplasm in Egypt. The first step towards the collection of wild beet accessions in Egypt was made nearly forty years ago by El-Manhaly, who collected twenty-six accessions from three different areas in Egypt, including the North Western Coast, the Nile Delta, and Upper Egypt [12]. However, recently, only six populations of sea beet have been found on the Mediterranean coast [7]. In addition, there is a need for an exhaustive characterization of the different populations using both morphological and molecular markers.
Climate change affects the dynamics of species, which influences ecosystems and biodiversity at a global scale [13]. In addition, anthropogenic activities endanger the genetic stability of the sea beet, leading to genetic erosion and loss of valuable traits [1]. Consequently, the conservation of such a threatened germplasm is essential for the ongoing development of sustainable agriculture and ensuring food security [14]. The phenotypic and genotypic diversity of the Beta vulgaris subsp. maritima has been studied among the Madeira archipelago populations, where high levels of diversity have been reported [15]. Moreover, in Monteiro et al. [16], the EcoTILLING genetic tool was associated with ecological data for biodiversity assessment of sugar beet species and their wild relatives. In addition, Ben Mahmoud et al. [1] and Abdelhameed et al. [7] investigated the relationships between the phenotypic variability and eco-geographic characteristics of Beta sp. wild relatives, highlighting the potential of such an integrated approach for biodiversity assessment studies. These studies have contributed significantly to understanding the adaptive potential of sea beet populations and their importance for crop improvement, notably in terms of abiotic stress tolerance.
Molecular markers are considered essential tools for genetic diversity studies [17]. They are crucial in research and practice due to their reliability, independence from the environment, and applicability at various stages of plant development [5]. Therefore, there is a need for molecular markers to distinguish similar genotypes from each other and to identify those that are similar [18]. By contrast, the visual morphological traits/markers (stem habit, leaf, and flower pigmentation) that do not require complex and tedious procedures alone have several disadvantages, including potential dependence on environmental factors [19] and differences depending on the developmental stage or particular parts of the plant [18]. Despite this limitation, morphological characterization is still an essential tool for screening and recording traits of agronomic importance [7].
Molecular markers facilitate the rapid assessment of wild relatives of cultivated plants and the detection of disease-resistance alleles, supporting crop improvement through marker-assisted selection [20]. Numerous DNA-marker systems are essential in contemporary plant genetics, including ISSR, SSR, SNP, AFLP, RAPD, and SCAR markers [17]. ISSR markers, in particular, are widely used to evaluate genetic diversity and population structure in plant germplasm [21].
ISSR markers are highly effective tools for assessing genetic diversity and population structure in plants [22]. They are also reproducible, polymorphic, and cost-effective [23]. SRAP (Sequence-Related Amplified Polymorphism) markers are valuable tools in molecular genetics, as they amplify DNA coding regions using primers that target open reading frames [24]. SRAP markers have been successfully used to study the genetic diversity, molecular characteristics, and population structure of sugar beet germplasm resources, and they were efficient in identifying species to the gender level in the genus Ephedra [25,26,27,28]. The complementary nature of the proposed molecular marker systems is that ISSR targets non-coding regions and SRAP targets coding regions [29], providing a comprehensive assessment of sea beet genetic diversity. Relying on a single marker type is insufficient [30], and using multiple markers provides more reliable information on population genetics [31,32]. The integration of two molecular marker systems was used to assess the genetic relationships and genetic diversity within and among wild and cultivated beets [33,34,35].
Research on the eco-geographic distribution, morphological variation, and molecular diversity of wild Beta relatives in Egypt remains remarkably limited, with notable exceptions being the foundational surveys by El-Manhaly et al. [12] and Abdelhameed et al. [7]. Although visually distinct morphotypes are widely distributed across Egyptian habitats, no study to date has systematically linked these morphological forms to their underlying molecular identity. Bridging this knowledge gap is essential for connecting stress-adaptive traits in wild sea beet germplasm with cultivated sugar beet improvement.
To address this gap, the present study aims to: (i) assess the phenotypic diversity of wild beet populations (Beta vulgaris subsp. maritima) across Egypt, (ii) evaluate the key ecological parameters shaping these populations, (iii) determine their molecular diversity and genomic structure using dual marker systems, and (iv) explore the relationships among physical traits, molecular markers, and micro-environmental factors. Ultimately, characterizing these Egyptian sea beet populations will establish a crucial baseline for targeting conservation efforts while unlocking promising wild genetic resources for breeding climate-resilient sugar beet varieties.
2. Materials and Methods
2.1. Site Selection and Plant Materials
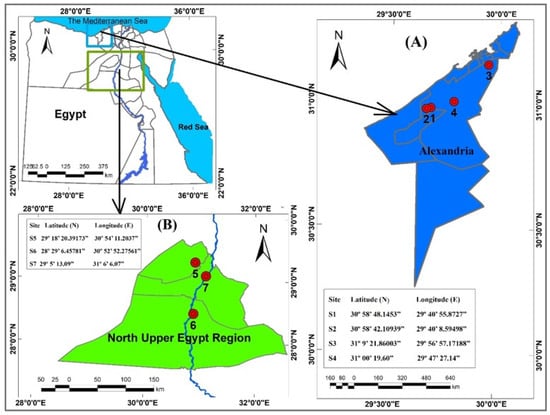
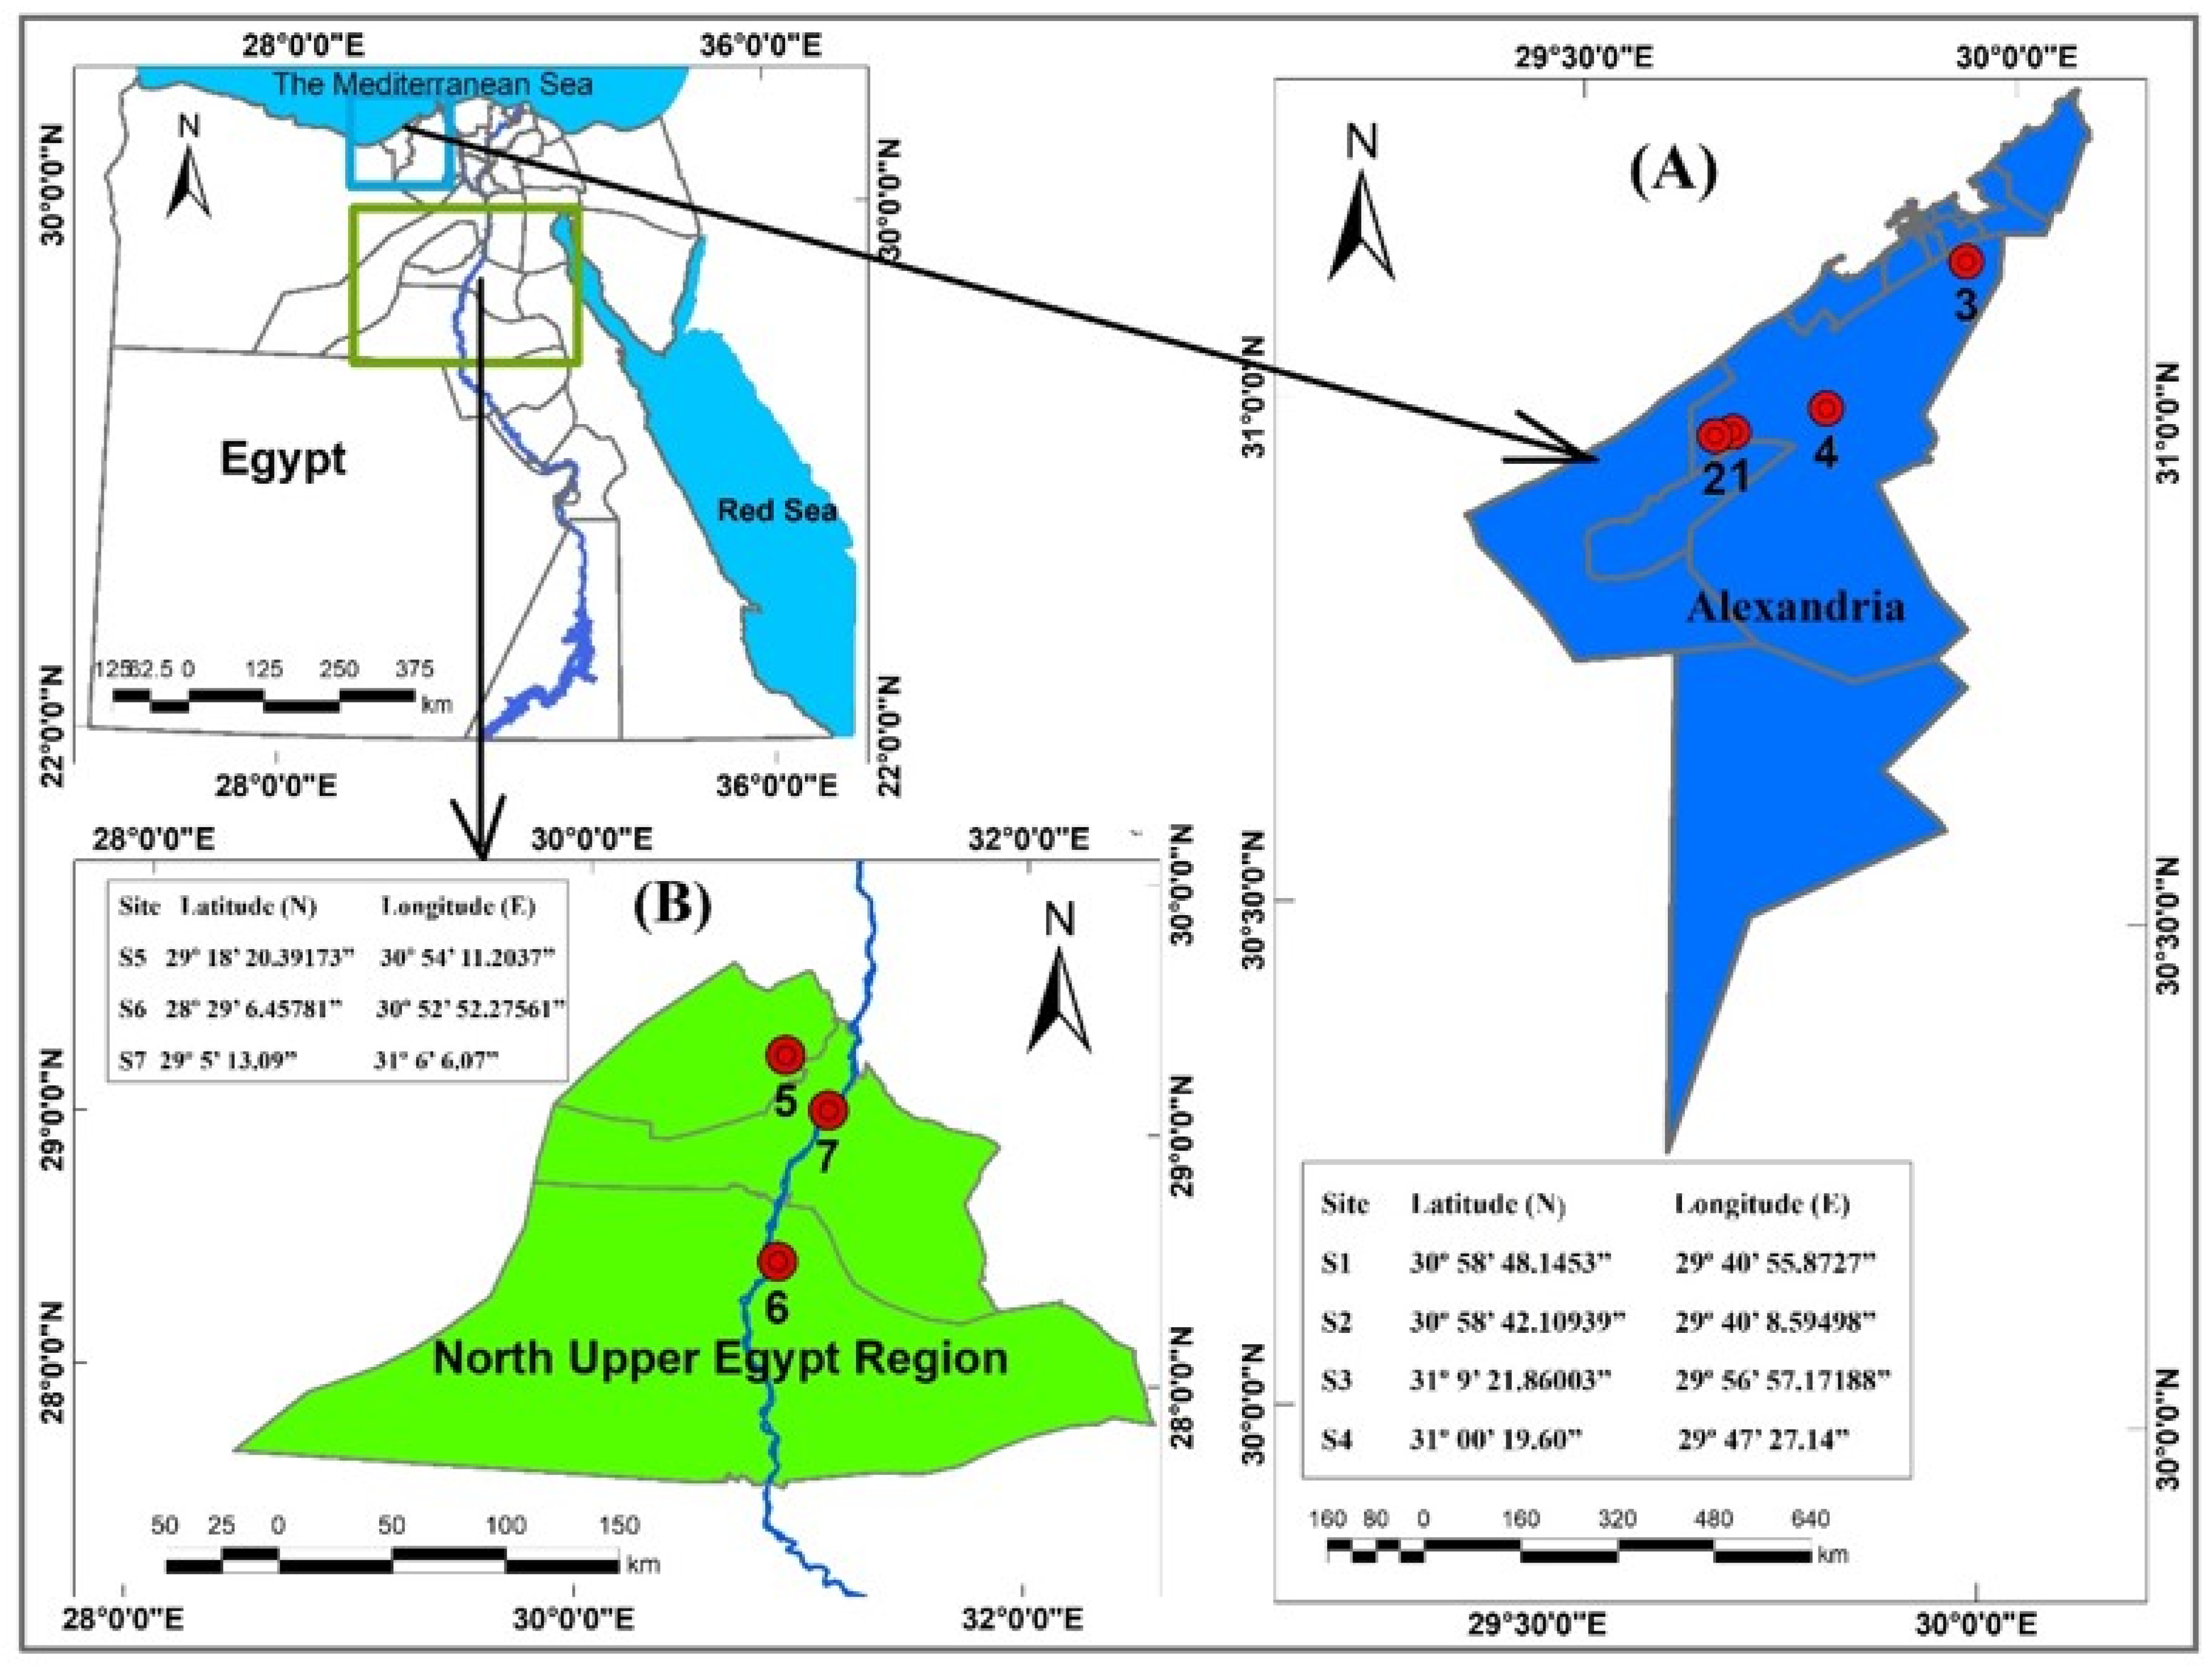
Seven populations of sea beet (Beta vulgaris ssp. maritima (L.) Arcang.) were collected across various regions of Egypt during the spring of 2021 and 2022. These populations represented the geographic range of sea beet, including the Mediterranean coastal region (wild populations), in addition to its growth as a crop weed in Fayoum, Beni-Suef, and Minya governorates, the northern part of Upper Egypt (Figure 1). A total of 70 individuals (10/population), representing the seven different habitats, were utilized in this study. Voucher specimens were deposited in the Department of Botany and Microbiology herbarium (BSUH) at Beni-Suef University and the Cairo University herbarium (CAI), Egypt. The species identified were determined based on earlier taxonomic studies [7,36,37]. In addition, the following online databases were accessed in 2024: World Flora Online: https://www.worldfloraonline.org; Royal Botanic Gardens: https://www.kew.org; International Plant Names Index: https://www.ipni.org. Plants of the World Online: https://powo.science.kew.org.
Figure 1.
A distribution map indicating the collection sites of the seven studied populations of Beta maritima across Egypt: (A) 1–4: Mediterranean coast wild populations & (B) 5–7: Inland weeds of cultivation. The map design was created using ArcGIS software v. 10.8, based on the shapefile issued by the Central Agency for Public Mobilization and Statistics of the Arab Republic of Egypt.
2.2. Morphological Characterization
We analyzed populations for 59 quantitative and 39 qualitative traits related to plant growth habit, leaves, stems, bracts, inflorescences, and flowers. Observations were conducted on five randomly selected individuals from each population. The selected traits were based on the descriptor lists for Beta (Beta spp.) from the International Plant Genetic Resources Institute (IPGRI) and previous studies [1,7,15,38,39,40]. These morphological characteristics were utilized for population comparison and to identify distinguishing features that set one population apart from another.
2.3. Soil Analysis and Meteorological Data Preparation
Five soil samples/population were collected from each locality at a depth of 20 cm, with subsamples taken for moisture and field capacity determination. The air-dried samples were sieved (2 mm) and kept in clean plastic bags. pH and Electrical Conductivity were measured using a Professional Multi-Parameter Bench Meter (Model AD8000, Adwa instruments, Szeged, Hungary) with a soil-water extract (1: 2.5 w/v). Soil texture was determined according to the pipette method [41] and organic carbon content was determined by rapid titration [42]. The available nutrients (nitrogen, phosphorus, potassium, and zinc) were assessed according to Cottenie et al. [43]. Meteorological data (temperature, relative humidity, precipitation, wind speed, and solar irradiance) were sourced from the Prediction of Worldwide Energy Resources (POWER) [44].
2.4. DNA Extraction and PCRs
DNA extraction was performed primarily from seeds of the seven populations using the EZ-10 Spin Column Plant Genomic DNA Isolation Kit from (Bio Basic, Markham, ON, Canada). Five samples per population were equally mixed for a single DNA extraction [28]. We evaluated sample quality and quantity using a 1% agarose gel, and measured concentration at 260 nm with a UV spectrophotometer. PCR was conducted according to the protocol described by Williams et al. [45]. The Polymerase chain reaction (PCR) was conducted for ISSR markers, and a set of 10 ISSR primers was tested for consistent amplification; three were positive (Table 1). PCR amplifications were performed according to Izzatullayeva et al. [46]. For SRAP markers, ten SRAP primers were tested using a DNA Thermal Cycler (TC-512, Techne, Stone, UK), and 5 were positive (Table 1). The PCR amplifications were performed according to Shaye et al. [27]. The developed gels were stained with ethidium bromide (EB; 0.5 µg/ml) and the fragment patterns were photographed under UV light.
Table 1.
Molecular markers (ISSR and SRAP) used to assess polymorphism for the studied Beta populations, F: forward and R: reverse. Abbreviations such as 14A, HB-9, HB-11, and EM/ME codes represent the specific ISSR and SRAP primers used in this study, respectively; bp: base pair.
2.5. Statistical Analysis
- Morphological, Cluster Analysis, and Visualization with a Heatmap
The morphological dataset consisted of ninety-eight mixed variables, including continuous measurements for quantitative characters and multi-state categorical traits coded numerically (e.g., 1, 2, 3). A hierarchical cluster analysis combined with a heatmap was conducted to visualize the phenotypic differentiation among populations using R software version 4.6.1. A Gower’s distance matrix was calculated, and pairwise dissimilarity scores were established using the daisy function from the cluster package. A feature dendrogram was built by transforming a mixed-association matrix of Pearson, Cramer’s V, and Eta coefficients into a dissimilarity structure using the DescTools package. Hierarchical clustering was done with the UPGMA algorithm. Z-score standardization was applied using the heatmap.2 function from the gplots package, so as not to have large numerical values dominate the color gradients.
- Canonical Correspondence Analysis (CCA)
We examined the relationship between the studied populations and the environmental variables by employing a Canonical Correspondence Analysis (CCA). The R vegan package was utilized. We also constructed a CCA biplot to visualize multivariate relationships and illustrate how environmental gradients impact phenotypic differentiation among the studied populations.
- ISSR and SRAP data analysis
The reproducible ISSR and SRAP products were scored as present (1) or absent (0) bands at the population level, resulting in the data matrix that was statistically analyzed. Performance of each marker was measured using six basic polymorphism indices to determine the usefulness of both markers for evaluating the molecular profiles of Beta populations. These indices were Polymorphism Information Content (PIC), Discriminating Power (D), Resolving Power (RP), Effective Multiplex Ratio (E), Marker Index (MI), and Arithmetic Mean Heterozygosity (Havp). Data processing and statistical analysis were performed using core functions in R. To investigate the molecular relationships among various populations using ISSR and SRAP, as well as their combined marker system, we created distinct distance matrices for each binary dataset. Three separate Bray–Curtis’s distance matrices (mathematically equivalent to the Sørensen-Dice dissimilarity (1—Dice similarity)) were generated using the vegdist function from the vegan package. We utilized these matrices, along with Gower’s distance matrix for morphological data, to create tanglegram plots using the UPGMA (Unweighted Pair Group Method with Arithmetic Mean) algorithm. These plots illustrate the relationships between different molecular markers and their associations with morphological traits. The congruence between each pair of dendrograms was evaluated using the Baker’s Gamma coefficient, entanglement values, and p-values calculated with the ‘dendextend’ package.
- Morphological, Molecular, and Ecological Relationships
To evaluate the relationships among molecular data, morphological characteristics, and environmental factors, a multivariate statistical approach in R using the vegan, cluster, and dendextend packages was applied. The environmental variables were standardized with the Z-score method and subsequently used to compute the Euclidean distance matrix. Additionally, precalculated Gower’s and Bray–Curtis’s distance matrices were used.
Mantel tests were conducted to assess the correlation between distance matrices using Pearson’s correlation with 999 permutations [47]. Furthermore, for environmental isolation, we performed a Partial Mantel test to assess the true relationships among molecular and morphological characteristics.
3. Results and Discussion
3.1. Morphological Characterization, Population Clustering, and Similarity
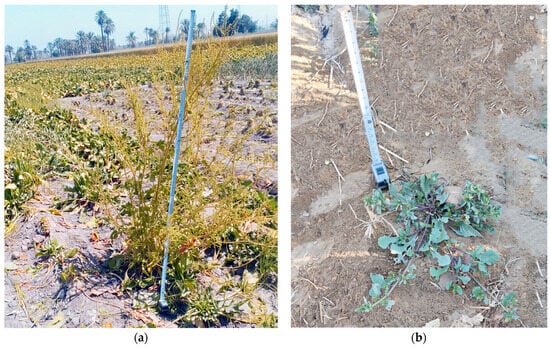
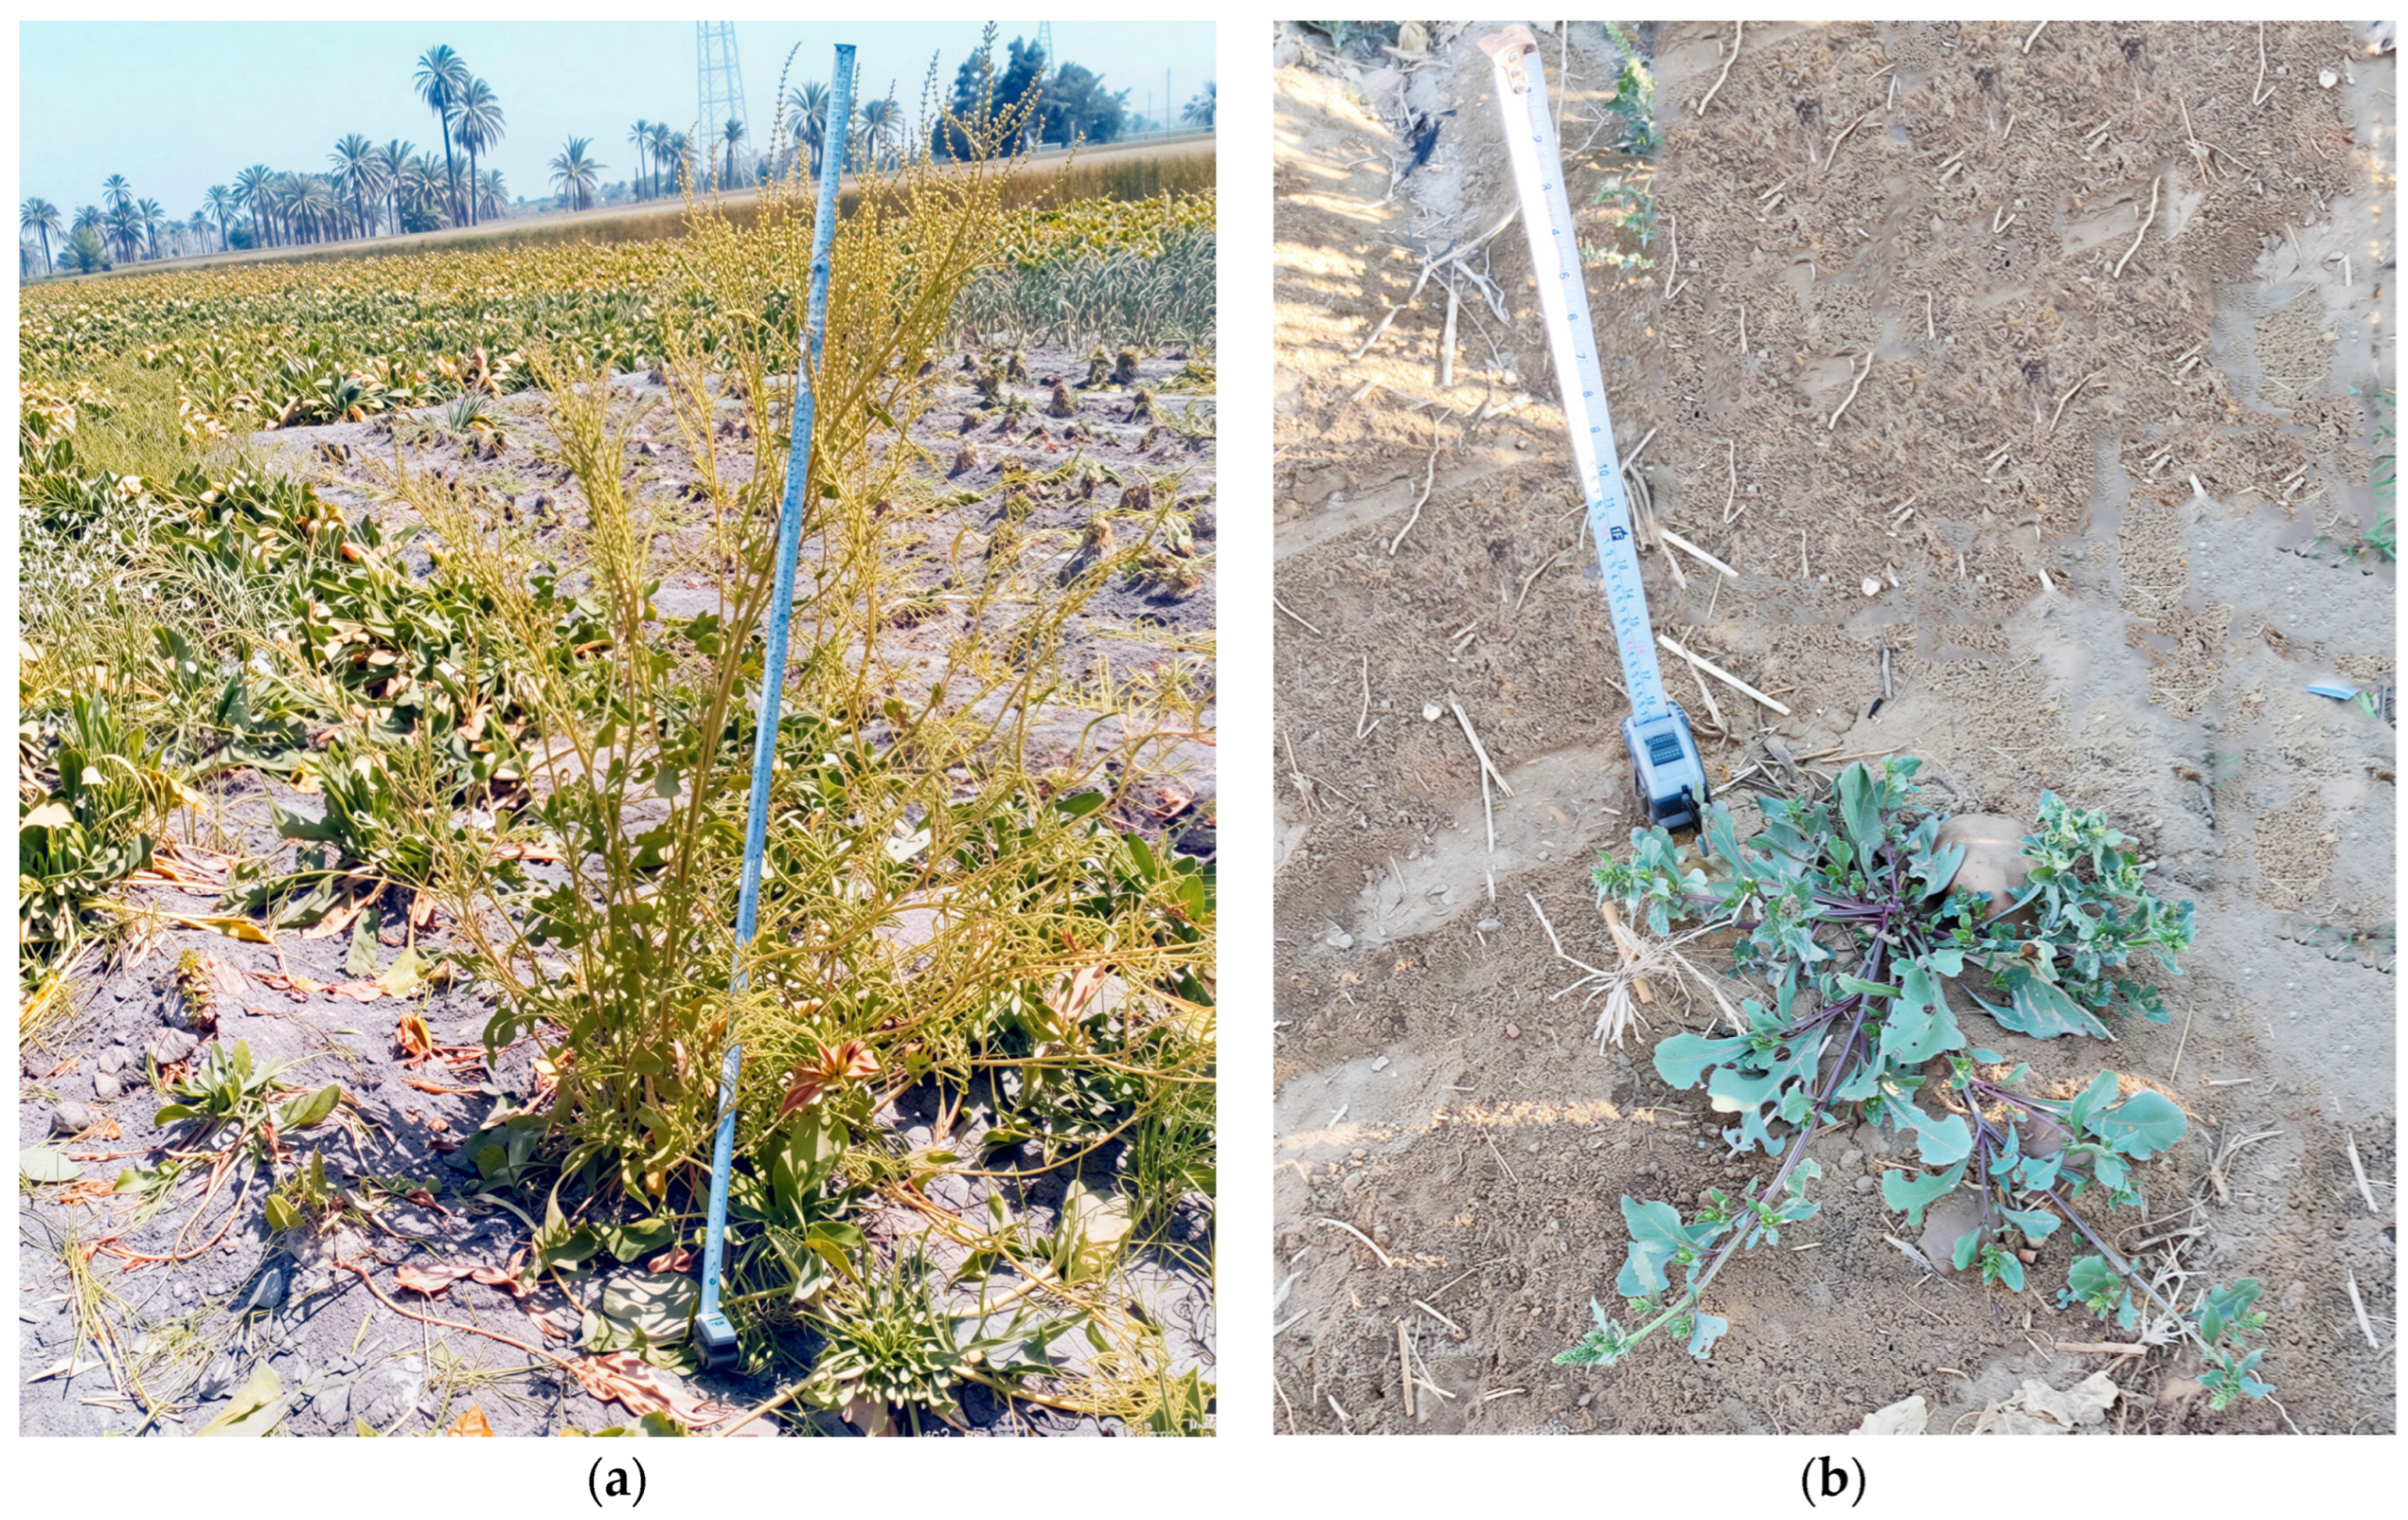
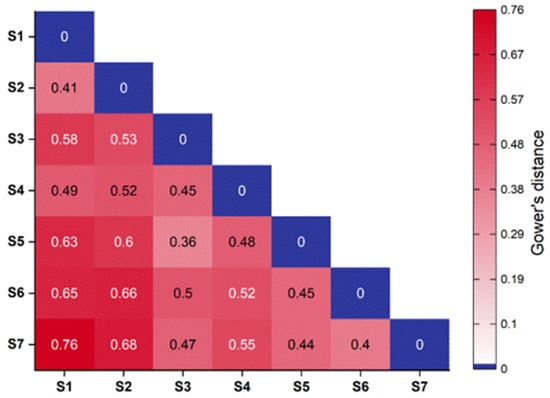
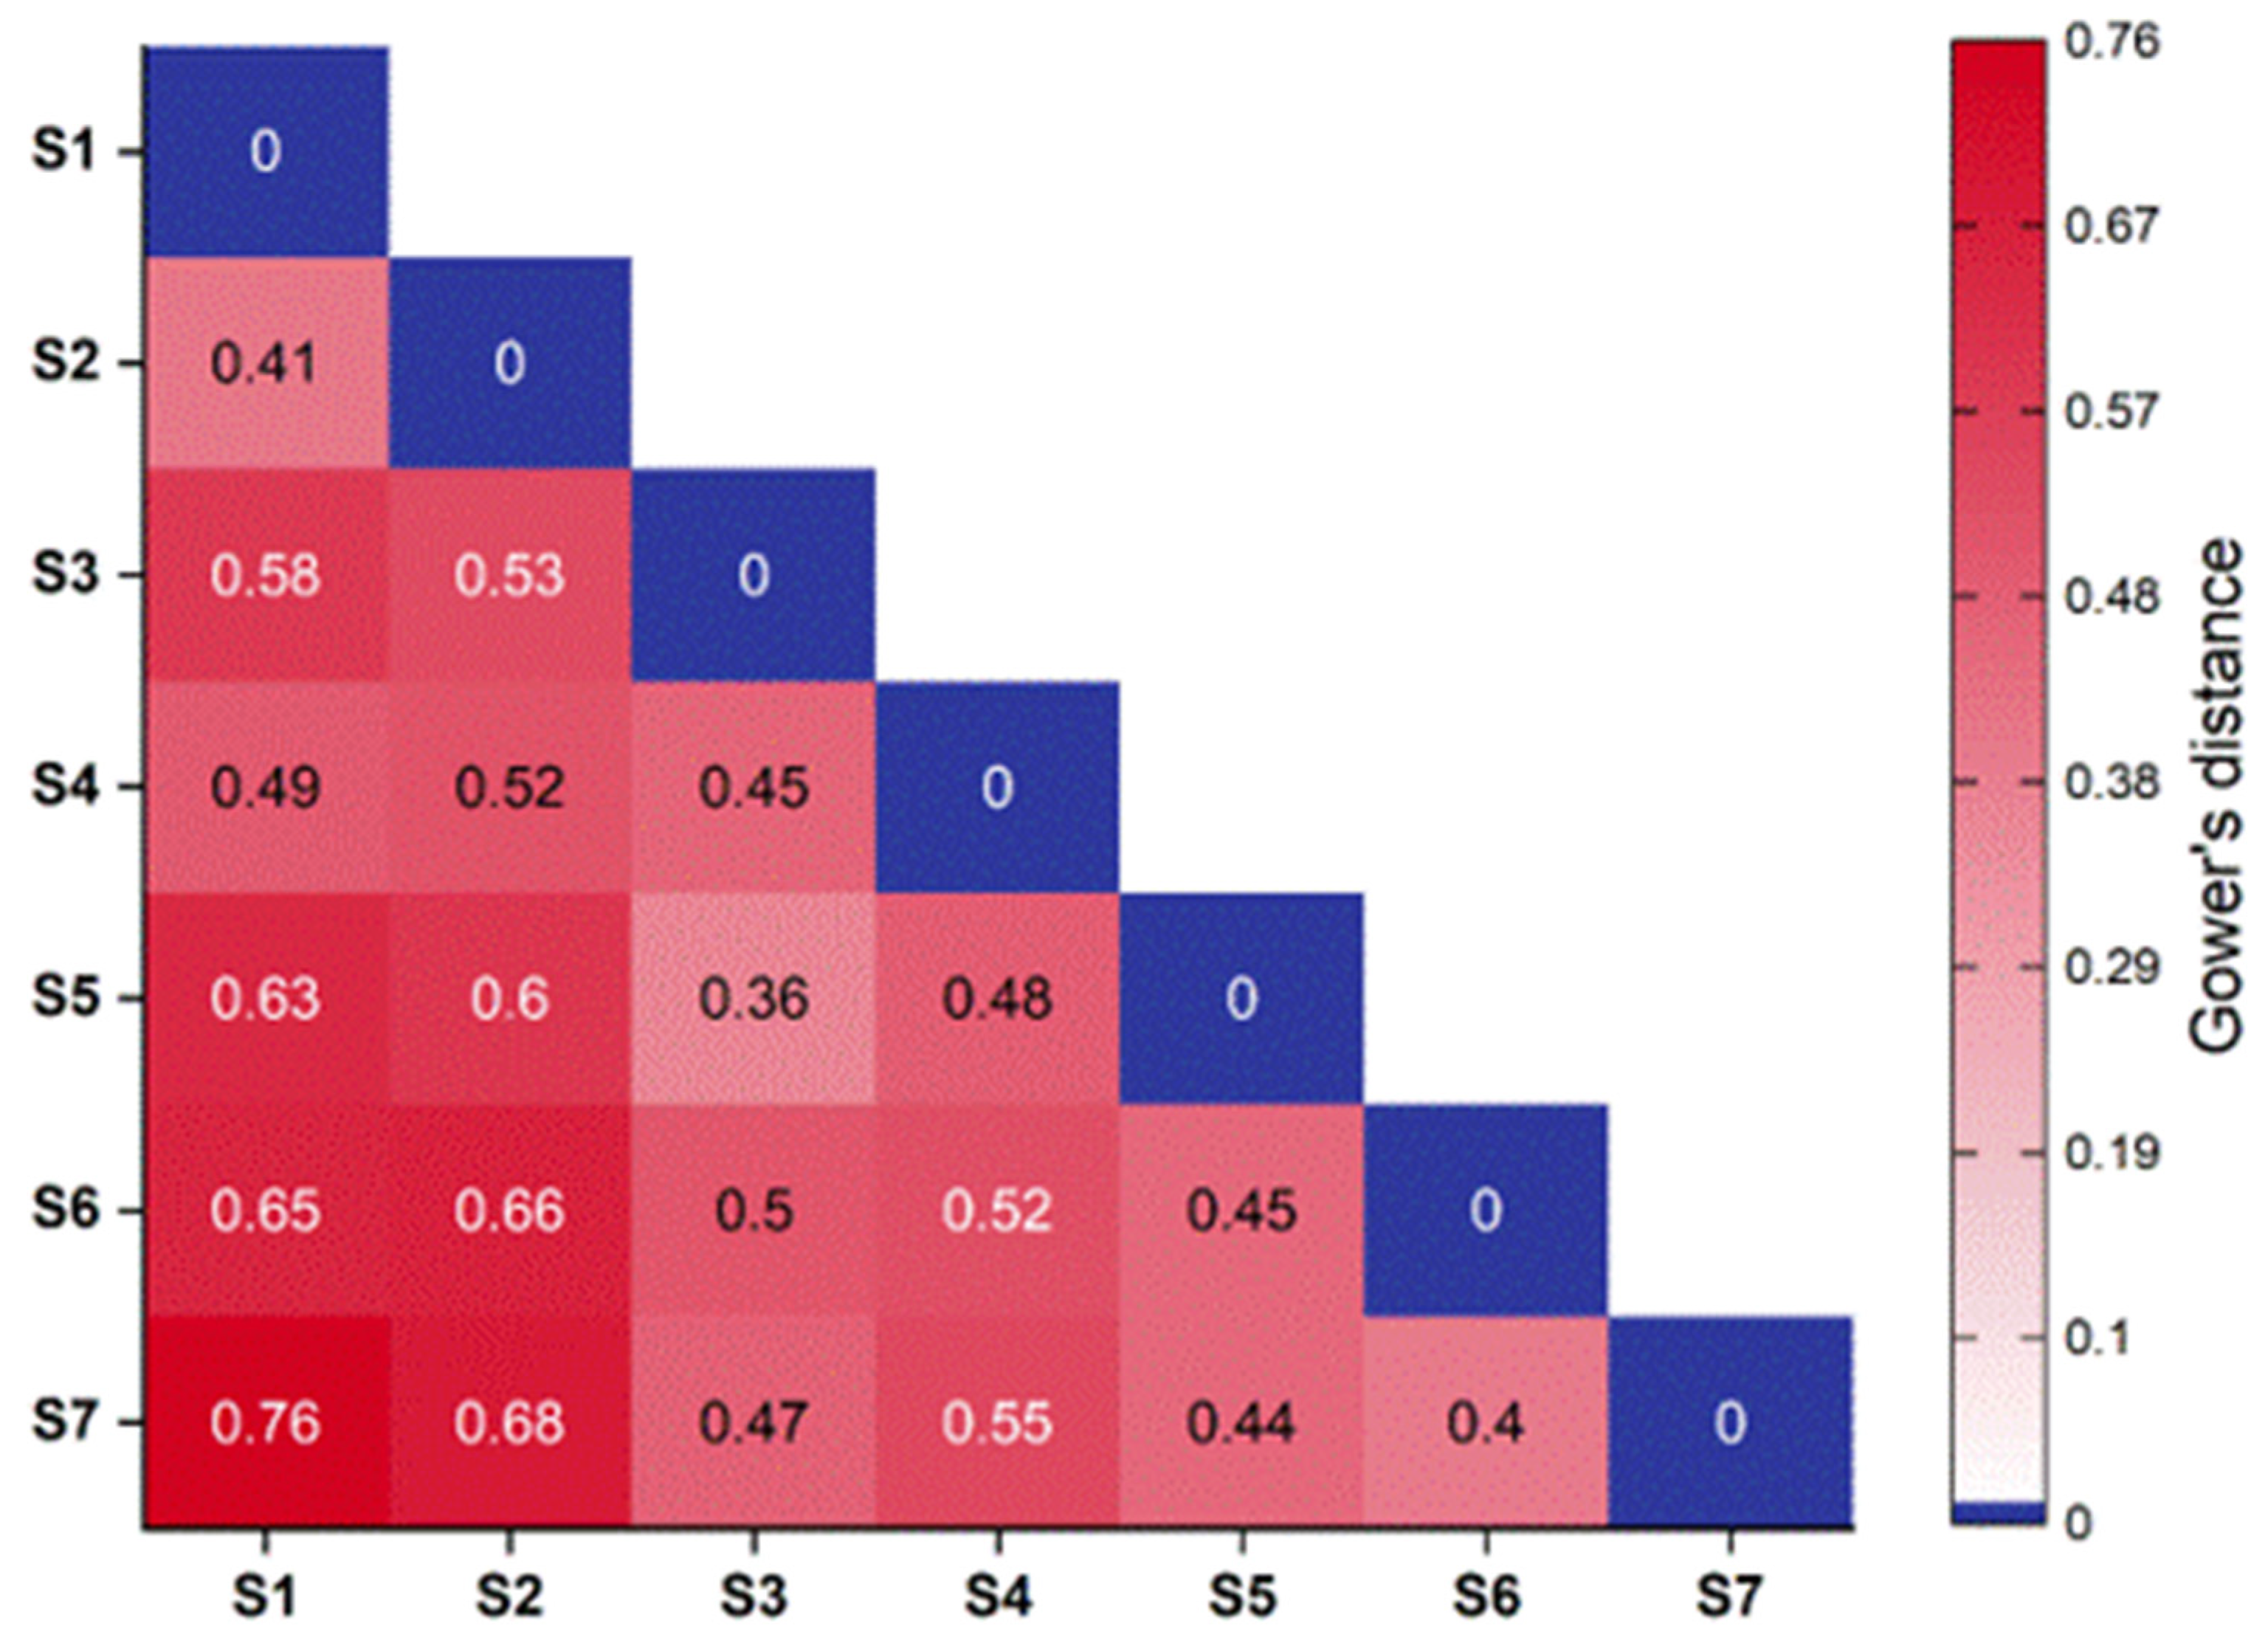
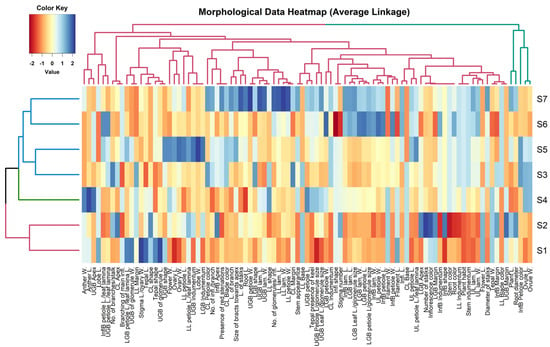
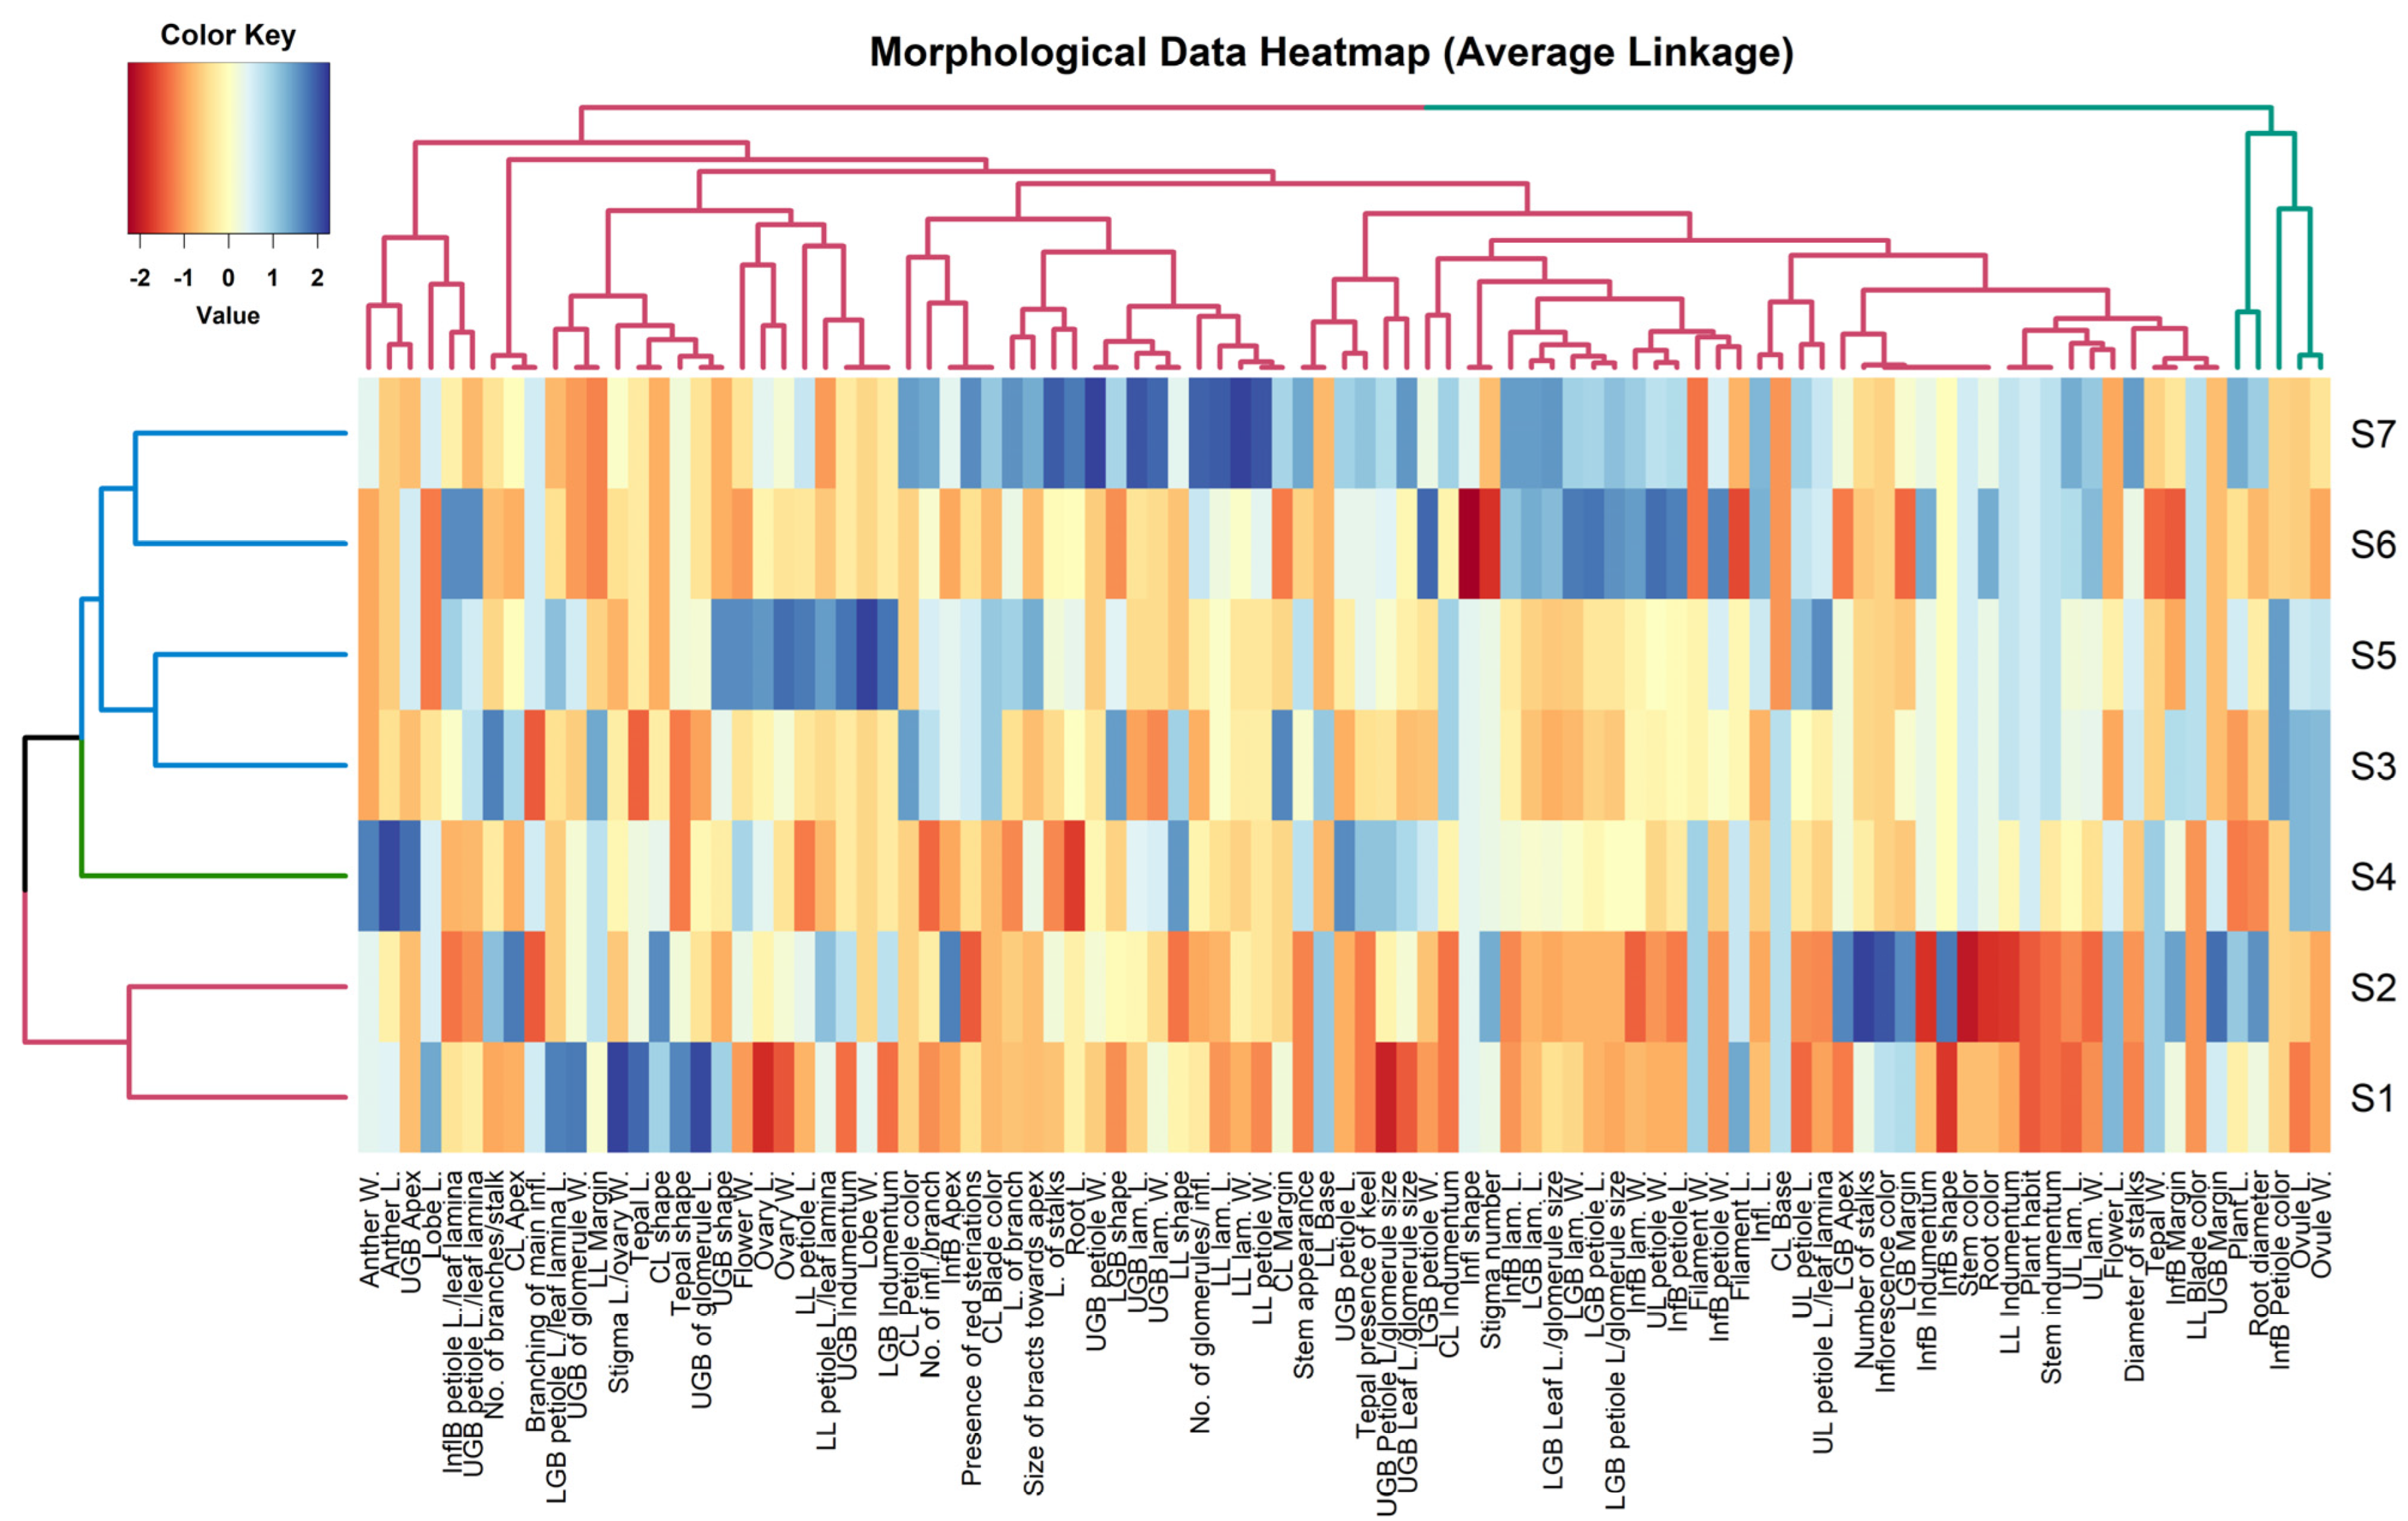
Phenotypic characterization is a practical first step for evaluating germplasm, documenting accession performance, and revealing genetic diversity and adaptive potential [48]. According to the field observations, distinct phenotypic differences were noted in the growth pattern of the examined populations; growth forms varied from prostrate to erect (Figure 2). To assess morphological diversity among the studied Beta vulgaris subsp. maritima (L.) Arcang. populations, hierarchical clustering based on Gower’s distances was employed (Figure 3 and Figure 4).
Figure 2.
Representative field photographs of Beta vulgaris ssp. maritima showing the two main growth habits in Egypt: (a) the erect growth form and (b) the prostrate growth form.
Figure 3.
A triangular Heat Map Diagram representing Gower’s distance matrix based on the analyzed morphological characters of the studied Beta populations (S1−S4: coastal-wild & S5−S7: inland crop–weed).
Figure 4.
Hierarchical clustering analysis of the studied Beta populations (S1−S4: coastal-wild & S5−S7: inland crop–weed), based on quantitative and qualitative morphological data, with different colors for separate clusters.
The populations were grouped into two major clusters, as explained in the dendrogram (Figure 4). The heatmap displays the phenotypic differentiation among wild populations (S1 and S2) from the Mediterranean coast, with a Gower’s distance of 0.41. These populations formed a distinct cluster characterized by prostrate to decumbent growth forms, extremely hairy plants, and reduced overall size of the lower and upper leaves, bracts, and stem diameter. In contrast, the remaining coastal populations (S3 and S4; distance = 0.45) were grouped in the second cluster, alongside the inland crop–weed populations from Upper Egypt (S5, S6, and S7). This cluster exhibits erect to ascending, mostly glabrous plants (Table S1). It was further divided into two subclusters: one comprising the salt-affected population (S4), and a dichotomous subcluster including the crop–weed populations (S5–S7) and ICR (S3). Separating the studied populations into two main morphological clusters is consistent with previous work showing substantial phenotypic diversity in Beta vulgaris subsp. maritima across its range [7,15]. In various regional studies, including those conducted in Madeira, notable differences in plant stature and inflorescence features have been documented [15]. These characteristics, particularly plant and inflorescence height, played a significant role in distinguishing between populations. Overall, these similarities imply that the observed difference between erect/glabrous and prostrate/hairy forms is probably not just a result of sampling error. Nonetheless, because morphological differences in sea beet are closely linked to local environmental factors, this pattern is better understood as a recurring phenotypic axis that may reflect both ecological differentiation and underlying genetic variation [7].
Another significant finding is the connection between the inland groups S5–S7 and the coastal group S3, with S3 and S5 showing a particularly strong phenotypic similarity. This pattern in Beta vulgaris is plausible due to the evolutionary ties among its wild, ruderal, weedy, and cultivated forms, which share a common species background, high levels of infertility, and frequent chances for genetic mixing [2,49,50]. Population-genetic work across the Beta complex has shown that sea beet structure is shaped by both geography and dispersal, including Atlantic–Mediterranean differentiation, clinal variation, admixture, and regionally limited gene flow [29,50,51,52]. Within this broader context, the similarity between coastal S3 and inland S5 is more cautiously interpreted as being consistent with shared ancestry, ecological convergence, or crop–wild introgression than as direct proof of any one mechanism. That caution is warranted because morphology alone cannot separate these alternatives, especially in a species where plasticity is high and where disturbed inland habitats can impose strong selection on flowering behavior and life history [2,10,49].
Population S4 occupied an intermediate position between the two principal clusters and formed a distinct subcluster, suggesting a transitional phenotype rather than a clearly assignable extreme morphotype. This population had relatively large floral characters (tepal width, flower diameter, filament size) and inhabits a salt-affected area (intensive morphological characterization is provided in Table S1 and Table S2. Such intermediacy is biologically credible in sea beet, given the species’ pronounced physiological plasticity under salinity and drought and the strong dependence of multivariate discrimination on stress type and intensity [51]. Environmental effects on sea beet morphology have also been documented in both Egyptian and Madeiran populations, where habitat-specific conditions contributed to phenotypic differentiation [7,15].
The combination in S4 of intermediate vegetative characters with relatively enlarged floral traits may therefore reflect stress-associated phenotypic adjustment rather than a discrete taxonomic entity. For this reason, S4 is best regarded as a promising population for future work on salinity adaptation, particularly through common-garden experiments and molecular characterization designed to separate environmentally induced plasticity from heritable divergence [7].
The observed Gower’s distance range (Figure 3) indicates moderate to strong phenotypic differentiation among the studied Beta populations. The largest distance, between S1 and S7 (0.76), is consistent with their contrasting morphological and ecological traits. Whereas the smallest distance between S3 and S5 (0.36) reinforces their close morphological affinity. This pattern agrees with previous studies that showed substantial variation among the sea beet populations and repeated clustering by morphological traits [7,15].
Nevertheless, Gower’s distances quantify phenotypic resemblance, not genetic distance. In sea beet, both genotype and environment contribute to population differentiation, and genetic structure does not always mirror morphology exactly [51,53]. Therefore, these distance values are most appropriately interpreted as evidence of morphological diversity among populations, and not a stand-alone measure of introgression or evolutionary relatedness [15].
3.2. Canonical Correspondence Analysis of Environmental Parameters and Studied Beta maritima Populations
Beyond the necessity of understanding wild populations’ genetic diversity, the ecological description of their habitats may reveal that the species has the physiological, ecological, or behavioral adaptations necessary to inhabit that specific environment [16]. Previous studies have shown that environmental conditions influence morphological variation in Beta maritima populations [1,7,29]. In addition to thriving in coastal habitats, previous research showed that this species can also inhabit inland clayey gully systems with marine clay deposits [54].
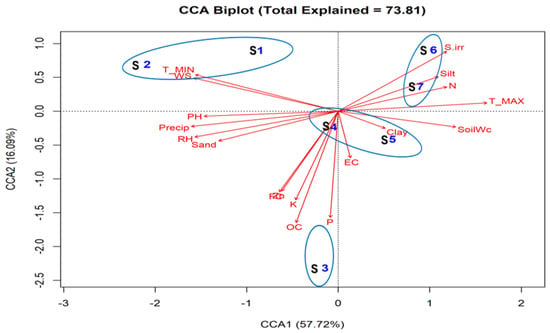
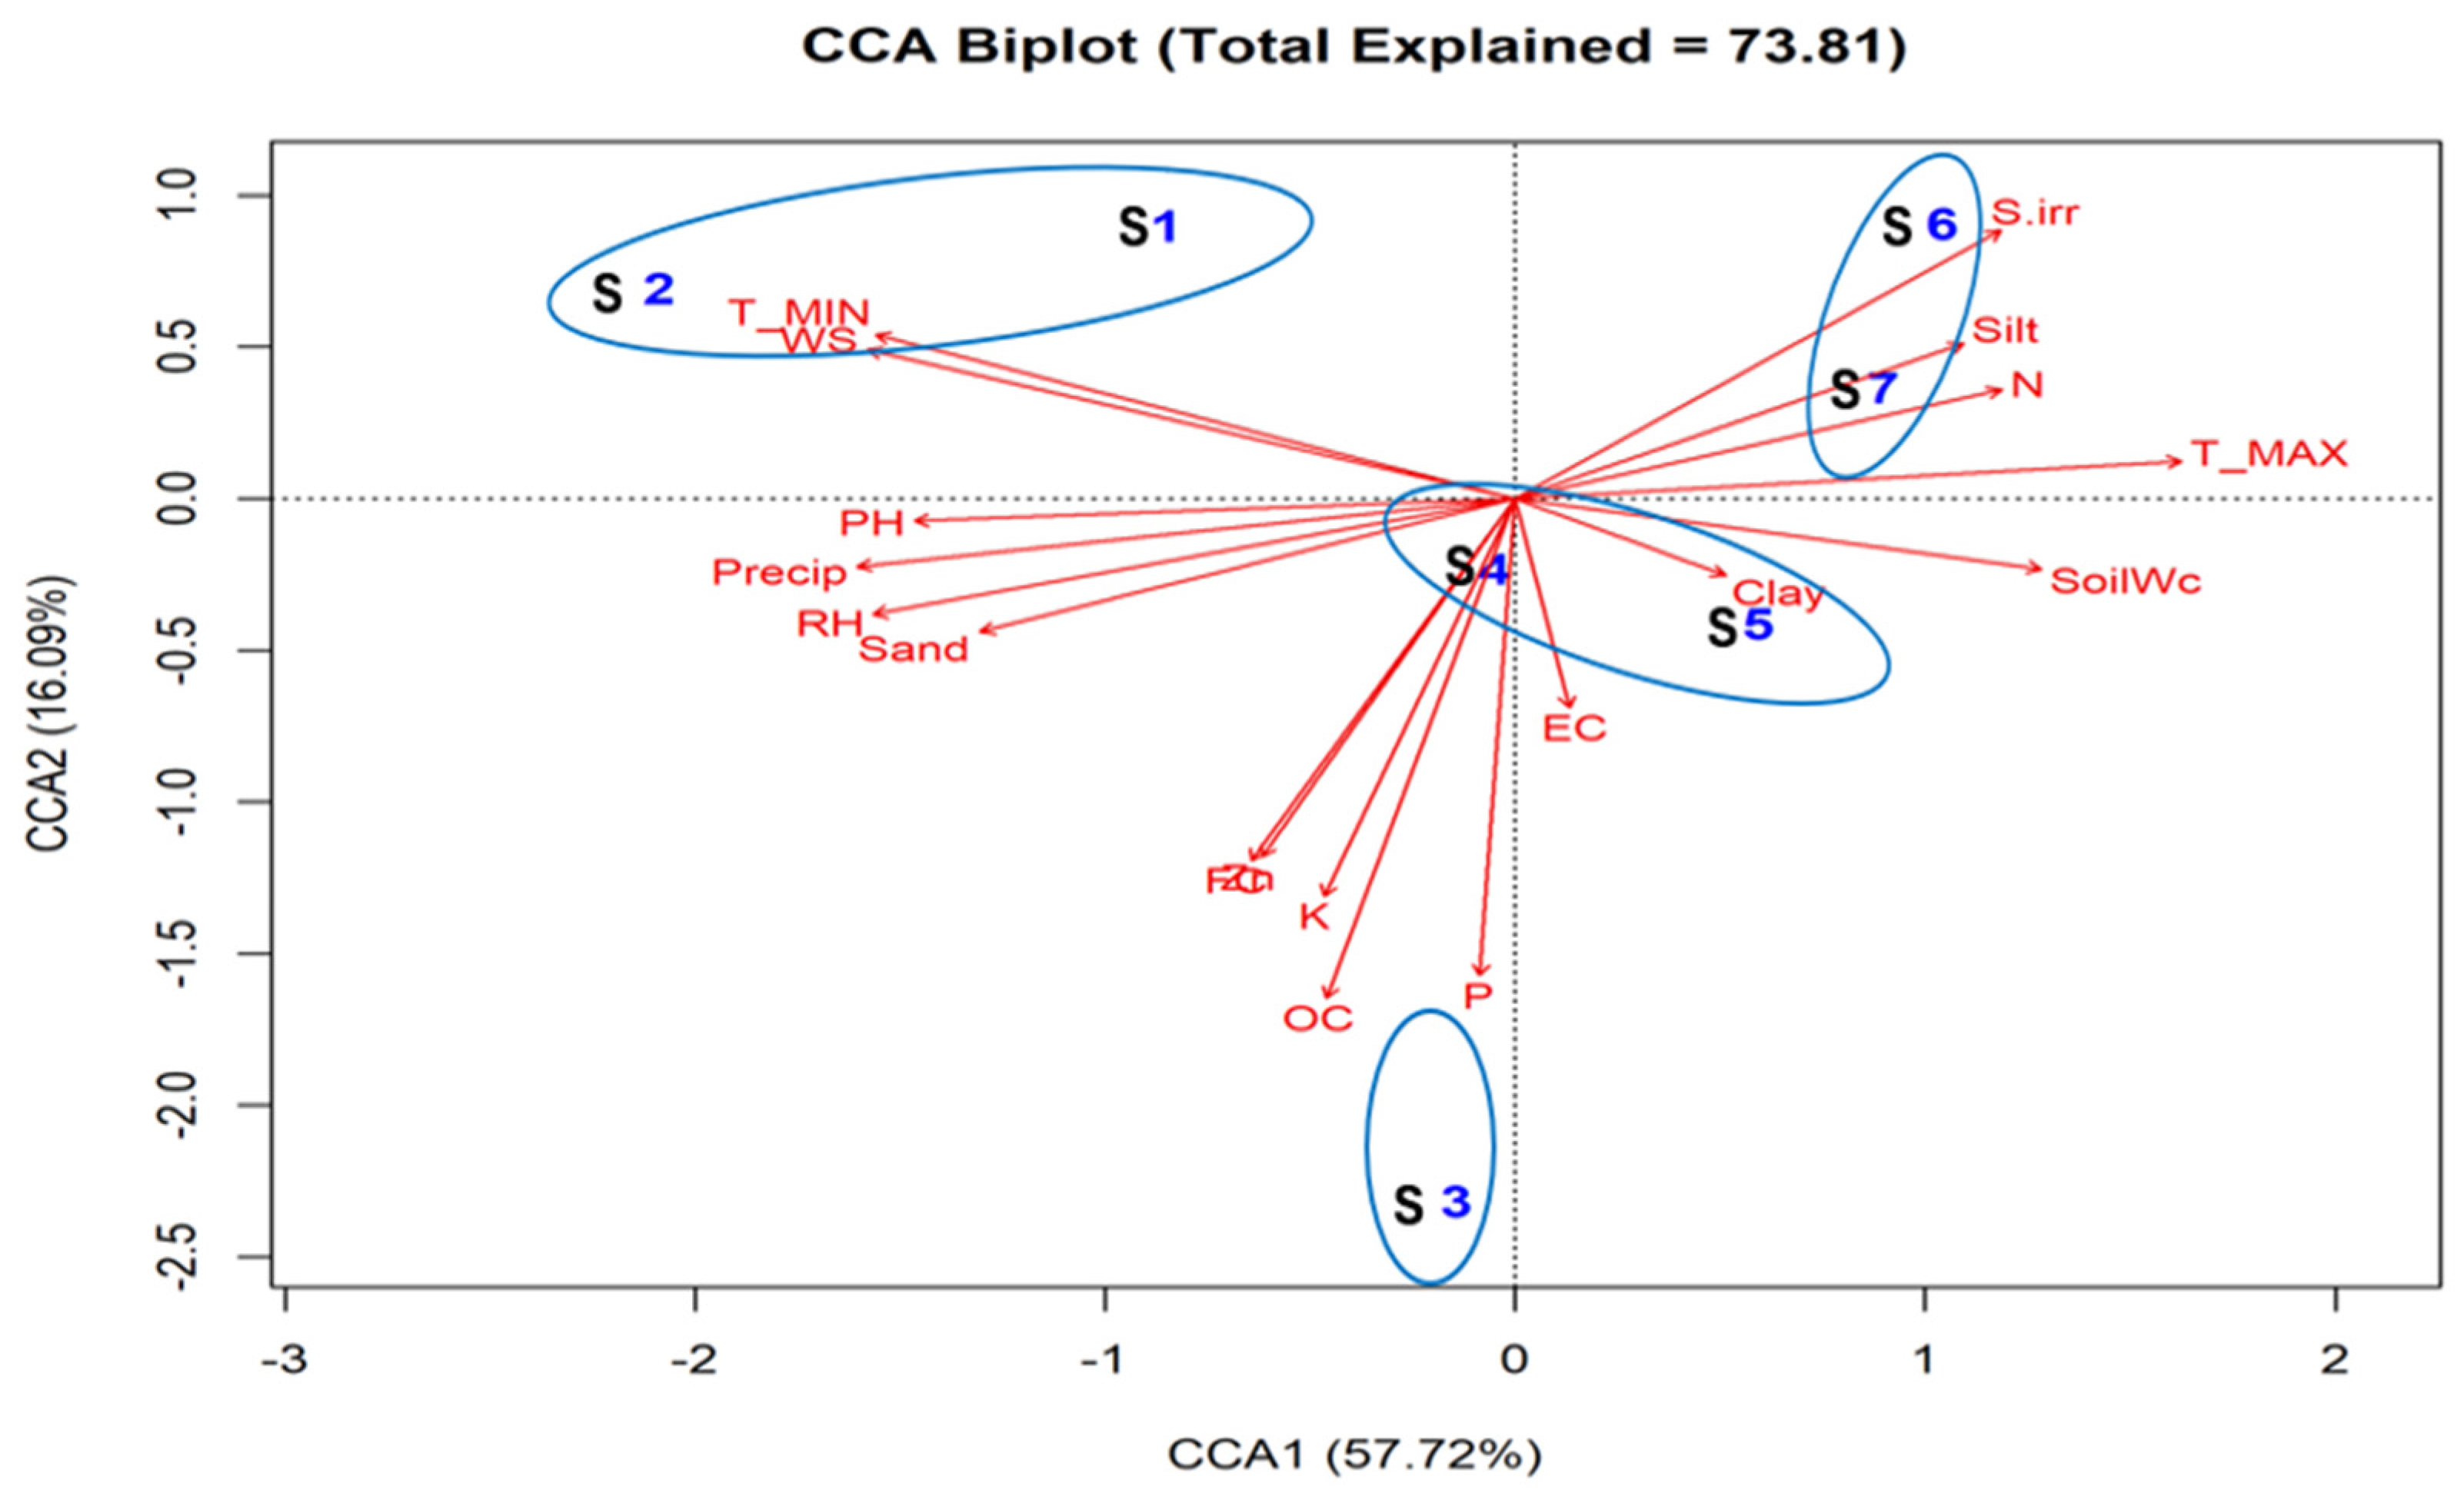
The environmental analyses further support this reading of the clustering pattern. Canonical Correspondence Analysis (CCA) was used to explore the relationship between the studied Beta populations and their environmental gradient. The CCA biplot showed a clear environmental gradient along CCA1 (57.72%), separating populations by temperature, soil texture, and moisture. CCA2 (16.09%) distinguished high-radiation sites from those with high organic content and salinity (Figure 5). In Egyptian sea beet, morphology has already been shown to covary with soil properties, humidity, temperature, precipitation, wind speed, and solar irradiance, with soil organic carbon emerging as an important correlate of morphological variability [7]. More generally, eco-geographic studies indicate that coastal Beta populations frequently adopt reduced leaf area, prostrate growth, or other stress-avoidance traits under saline, dry, and wind-exposed conditions, whereas plants in more favorable or anthropogenically buffered habitats tend to develop larger vegetative organs [1,55]. Also, Ascarini et al. [15] reported that sea beet populations exposed to wind in saline-dry coastal habitats grow in a prostrate habit with smaller leaf area and increased seed production. This framework helps explain why S1 and S2, associated with windier, sandier, and less fertile coastal settings, expressed reduced stature and a prostrate to decumbent architecture (Figure 5). The more vigorous inland populations S6 and S7 likely reflect the joint effects of higher nutrient availability, greater moisture, and more favorable resource capture conditions.
Figure 5.
Canonical correspondence analysis (CCA) biplot showing the relationship between environmental variables and the distribution of the seven studied Beta populations across Egypt: (S1−S4: coastal-wild & S5−S7: inland crop–weed). T_MAX: maximum temperature; T_MIN: minimum temperature; RH: relative humidity; Precip: precipitation; WS: wind speed; S.irr: solar irradiance; OC: organic carbon; pH: potential hydrogen; EC: electrical conductivity; N: nitrogen; P: phosphorus; K: potassium; Zn: zinc; FC: field capacity; Soilwc: soil water content.
These populations (S6 and S7) were mineral-fertile (Nitrogen= 89.18 and 98.12 ppm, respectively), as shown in Table 2. They had high soil water content (39.42 and 17.62%, respectively) and high solar irradiance, which favored a competitive growth form with large vegetative size [56]. Previously, Nitrogen, phosphorus, and potassium were regarded as essential elements for plant growth and development, which dramatically enhance leaf area and stimulate root size [57,58]. Because of their enormous genotypic and phenotypic variability, sea beets are highly tolerant and have a significant environmental adaptation to circumstances like high salt and poor soil [59]. Therefore, Populations S3 (In the lower part of the plot) and S5 (in the bottom-right quadrant) (Figure 5) showed a similar morphological architecture despite their distant locations. S3 had moderate salinity (EC = 2.37 mS cm−1) despite good soil (1.90% organic matter, 29.54 ppm phosphorus). Moreover, the S5 population (EC = 2.76 mS cm−1) had almost no rainfall (0.33 mm) and poor fertility (Table 2). As a result, populations S3 and S5, to some extent, showed relatively reduced vegetative measurements compared to populations S6 and S7.
Table 2.
ANOVA and Tukey’s HSD post-hoc test results for Soil and Meteorological data across the studied Beta populations (Mean ± SE); populations with the same letters are not significantly different at the p ≤ 0.05 level.
The intermediate placement of S4 is also biologically plausible in light of previous work on stress responses in beet. Salinity and limited soil moisture can jointly restrict plant water status while promoting osmotic adjustment, leaf succulence, and altered biomass allocation, and these responses are often strongly dependent on stress intensity and local edaphic context [60]. Experimental studies in beet have likewise shown that salt stress reduces plant height and leaf area while increasing traits associated with tissue conservation and water balance, including succulence and leaf mass per area [61]. The combination in S4 of high salinity (EC = 5.78 mS cm−1) with relatively favorable nutrient availability therefore offers a credible explanation for its intermediate vegetative morphology together with comparatively enlarged floral traits, as resource limitation and osmotic stress do not necessarily constrain reproductive allocation in the same way they constrain foliage expansion [62,63]. For that reason, S4 is best interpreted as a stress-associated transitional phenotype rather than as evidence of a discrete taxonomic unit.
3.3. Molecular Diversity (ISSR and SRAP)
3.3.1. Comparative Molecular (ISSR and SRAP) Analysis
To evaluate the molecular diversity of the seven Egyptian Beta vulgaris subsp. maritima populations, two marker systems (ISSR and SRAP) were used. Using multiple marker systems together ensures that results from plant genetic investigations are validated by analyzing each marker system [64]. The analysis detected clear but marker-dependent diversity patterns.
Of the ten primers screened for each marker system, only three ISSR primers and five SRAP primer combinations generated polymorphic and scorable profiles (Table 1). The PCR analysis resulted in amplified fragments of size ranging from 200–1500 bp for ISSR and 86–720 bp for SRAP primers (Table 1). A total of 26 bands were scored (14 for SRAP and 12 for ISSR). Table 3 shows that the SRAP primer system has higher average and total values of the molecular parameters studied compared to the ISSR primers. Notably, the mean polymorphism for SRAP is significantly higher at 75%, while that of ISSR is 50% (Table 3).
Table 3.
Molecular diversity indices revealed by ISSR & SRAP markers applied to Beta populations.
This low number of informative primers should be treated as an important methodological constraint and weakens confidence in strong phylogenetic or taxonomic conclusions [28]. Despite this, the detected polymorphic loci identified offered adequate resolution for initial classification. However, incorporating higher-throughput markers like SNPs in future research will be beneficial to confirm these patterns.
The polymorphism information content (PIC) measures how effectively a molecular marker detects allelic diversity, making it a crucial criterion for selecting markers for genetic research [65]. The average PIC for the ISSR markers was 0.26, ranging from 0.21 for primer 14A to 0.29 for primer HB-11. The average PIC was 0.29, with values ranging from 0.21 (EM1/ME4) to 0.35 (EM8/ME6) for the SRAP markers (Table 3). These values suggest that the markers are moderately informative, indicating a sufficient level of polymorphism [66]. Primers EM2/ME5 (PIC = 0.32), EM8/ME6 (PIC = 0.35), and EM7/ME6 (PIC = 0.37) were most effective at detecting inter-population variability. However, the primers 14A, EM1/ME4, and EM10/ME10 were less informative, with a PIC value of 0.21. Furthermore, the SRAP method showed superior values for parameters such as PIC, average heterozygosity (H. av.), marker index (MI), diversity (D), and resolving power (RP), which confirm its reliability in identifying fine-scale molecular relationships.
Song et al. [28] demonstrated that SRAP markers effectively identified moderate genetic diversity and a coherent population structure within 106 sugar beet germplasm accessions using 24 informative primer pairs and 127 alleles, resulting in a four-group structure validated by UPGMA, STRUCTURE, and DAPC analyses. These findings underscore the utility of SRAP markers for beet germplasm analysis, particularly when marker coverage is significantly denser than in the current study. Hancı and Paşazade [67] likewise reported that SRAP can outperform ISSR in revealing variation in Allium germplasm, while Khan and Khalid [68] attributed the stronger resolving ability of SRAP to its association with coding regions and related functional genomic compartments. Rini et al. [69] reported the opposite ranking in Indonesian rice, where ISSR generated higher resolving power and marker index than SRAP and was considered more effective for assessing rice diversity, even though both systems produced high polymorphism and largely concordant population-level signals.
3.3.2. Molecular Characterization and Population Uniqueness
Molecular profiling demonstrated the effectiveness of SRAP and ISSR primers in characterizing Beta maritima populations by producing population-specific banding patterns. For example, population S1 exhibited clear molecular divergence, characterized by unique bands at 425 bp and 470 bp (primers EM10/ME10 and HB-9, respectively; Table S3). Its sister population S2 was particularly noteworthy; it lacked a specific diagnostic band at 435 bp with HB-11. This band was present in all other samples, clearly distinguishing it. Population S6 showed a unique marker: the absence of a band at 86 bp with the SRAP primer pair EM1/ME4, allowing quick identification. The intermediate populations (S3 & S4) are similar in lacking the three diagnostic bands (435 bp, 240 bp, and 165 bp) associated with the SRAP primer pair EM2/ME3 (Table S3). Additionally, population S4 showcased a unique band associated with the SRAP primer pair EM10/ME10 at 205 bp. Population S7 was identified by two unique bands from the ISSR primers 14A and HB-9, corresponding to 500 bp and 470 bp, respectively.
These markers therefore have practical diagnostic value, although at present they identify population profiles rather than validated locus-specific polymorphisms. Sharma et al. [70] reported comparable use of ISSR-type unique bands for Sesamum indicum L. genotype discrimination. Also, Yue et al. [71] showed that ISSR, SRAP, and related marker systems can be converted into more specific species-diagnostic SCAR tools, which makes the present population-specific bands useful as hypothesis-generating leads for future assay development.
3.3.3. Molecular Similarities and Population Clustering
The Dice similarity coefficients among the seven studied populations were calculated for the two marker systems, ISSR and SRAP, as well as the combination of both markers. For the ISSR marker, the similarity coefficients ranged from 0.71 to 1.00. The lowest similarity (at 0.71) was observed between the wild populations S1 and S2. Conversely, the highest similarity was found between the pair (S3 and S6), sharing a similarity of 1.00. Population S7 was the most isolated from the other six populations, showing a mean similarity coefficient of 0.76 (Table S4a).
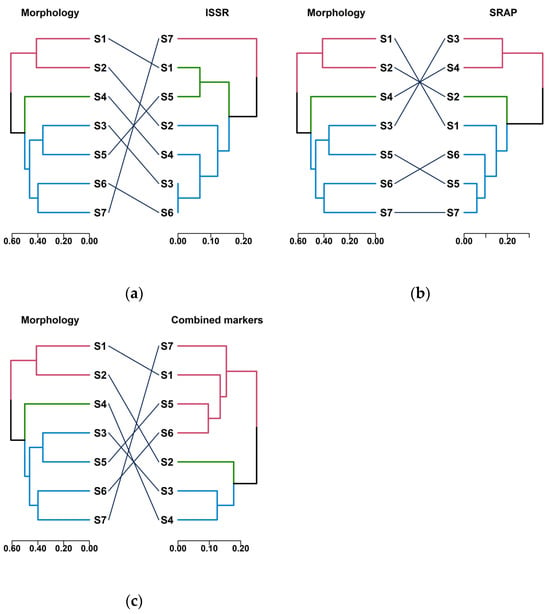
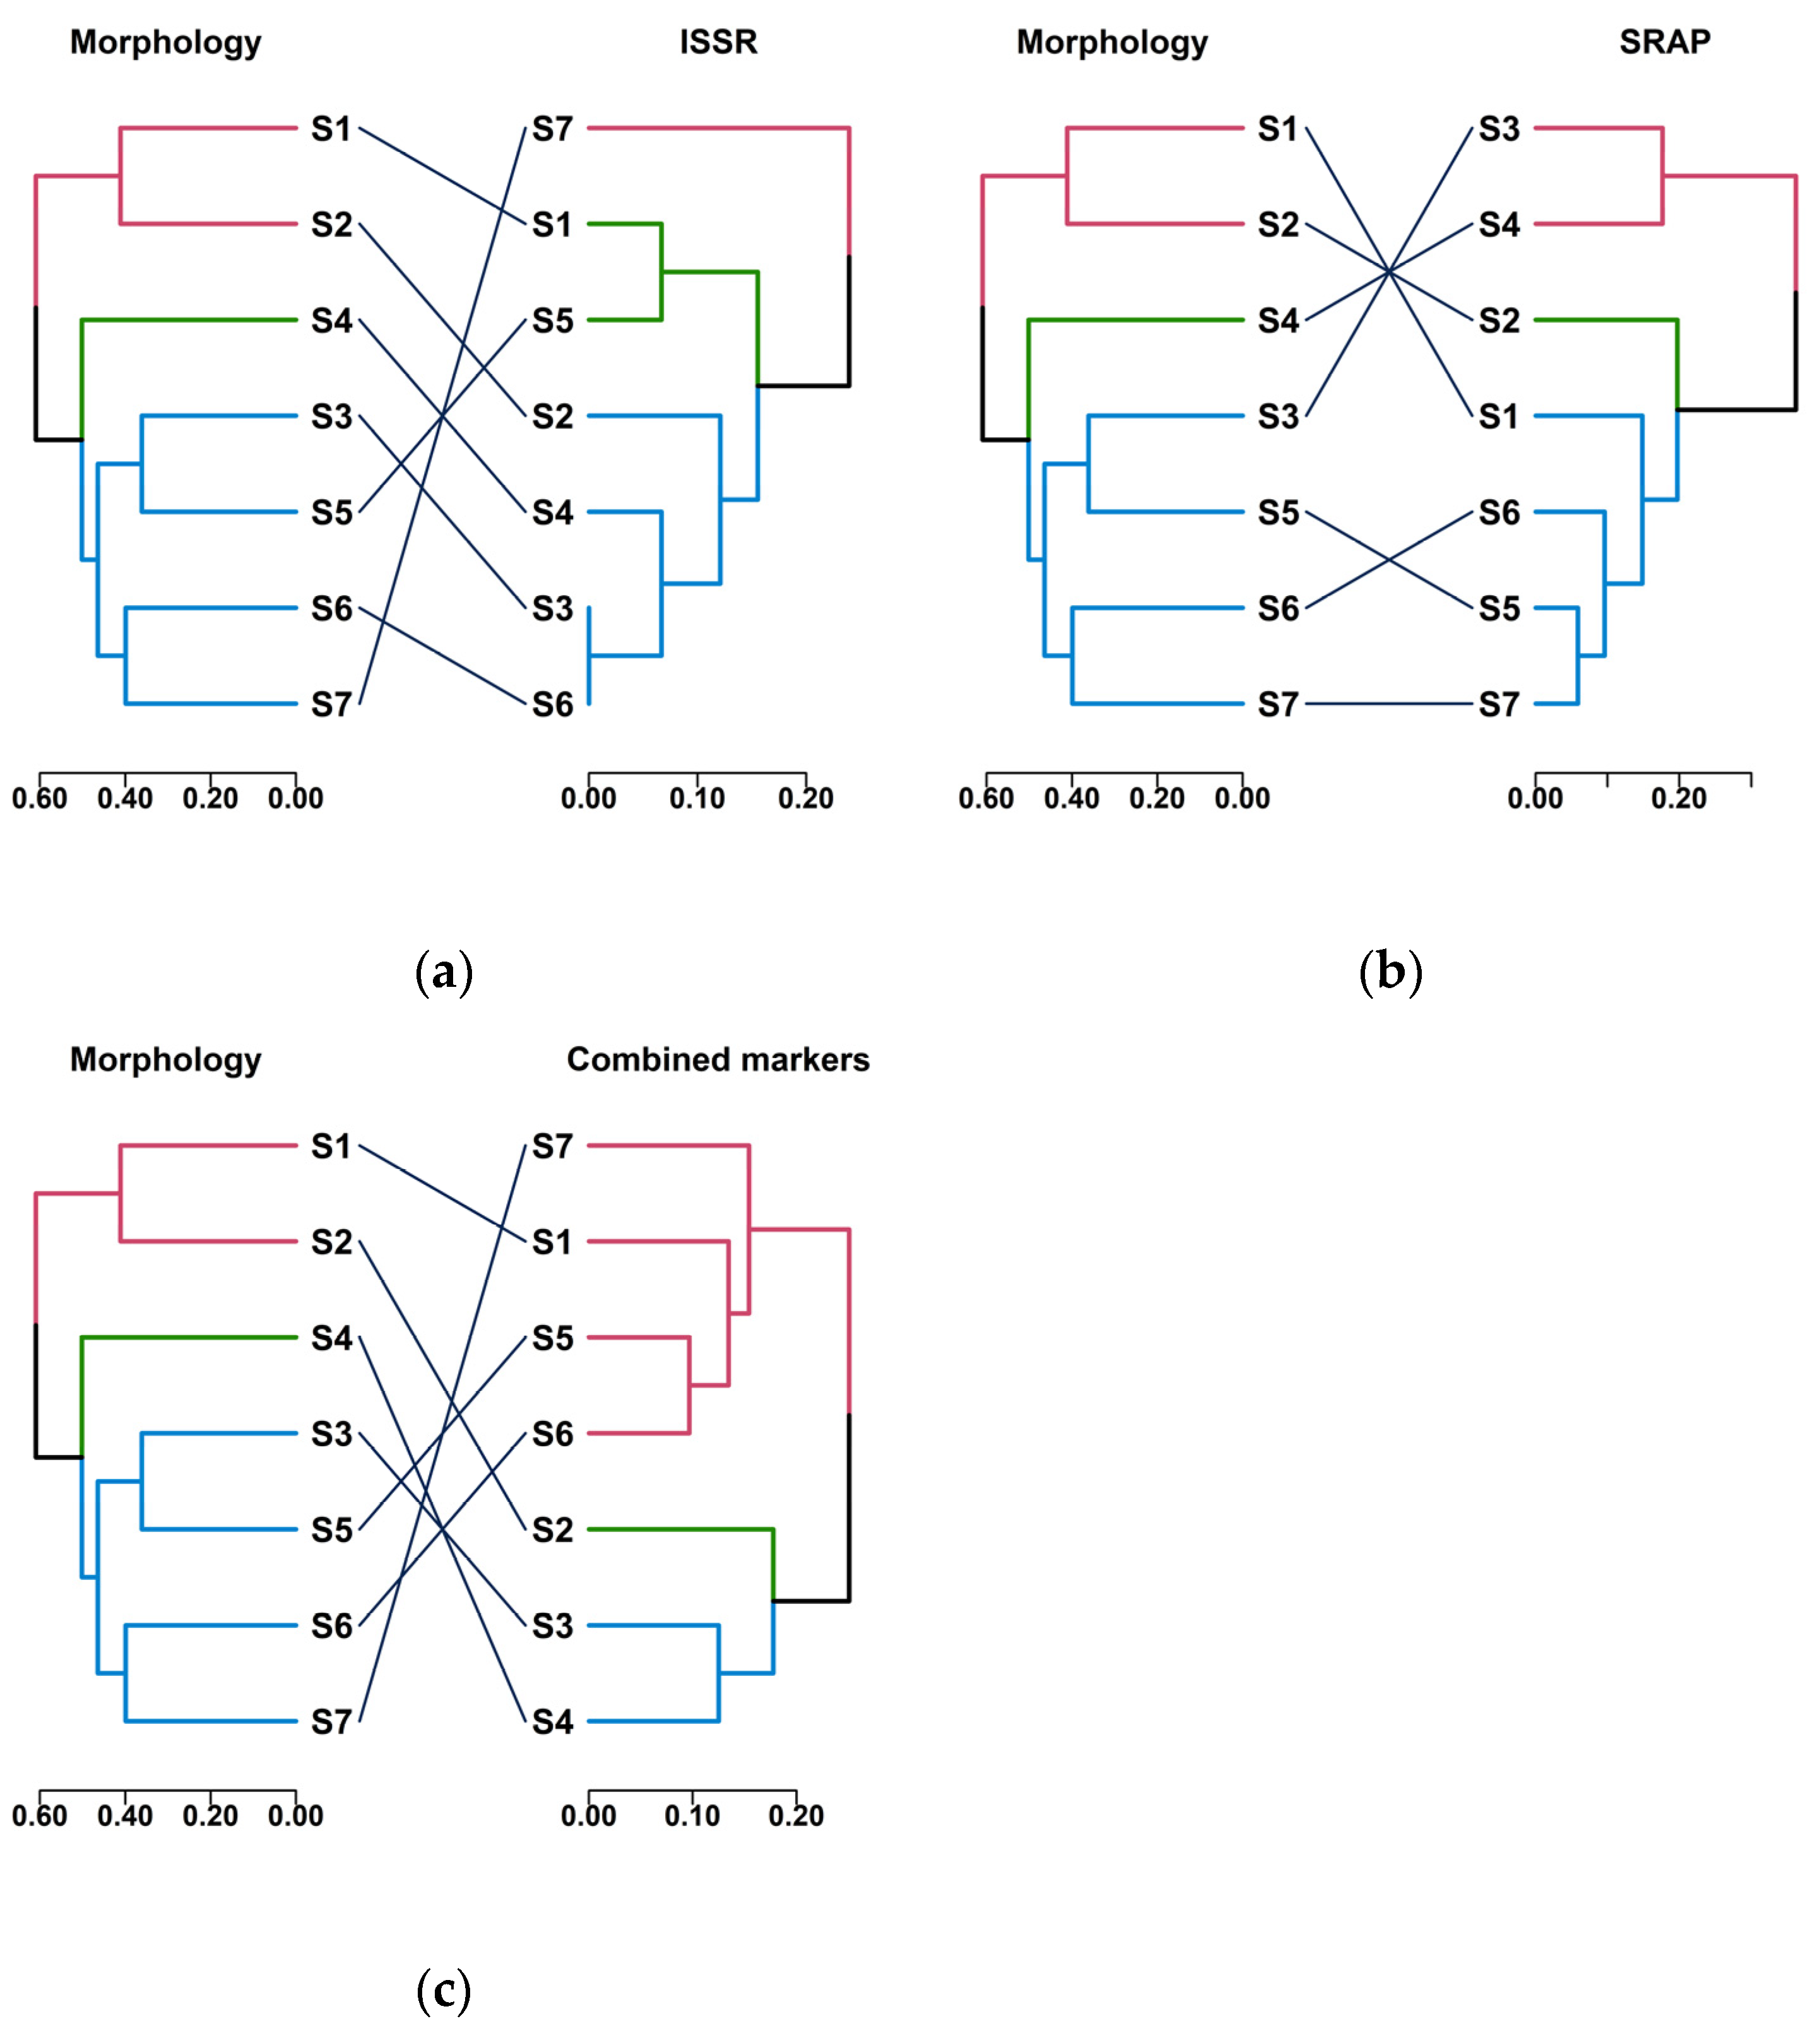
The dendrogram generated from the ISSR analysis indicated that all genotypes were classified into two main clusters, with a cophenetic correlation coefficient (CCC) of 0.80, demonstrating a very good fit. Population S7 was identified as a distinct group, while the other populations were placed in a separate group that exhibited more internal branching, indicating that this latter group has higher molecular variability (Figure 6a).
Figure 6.
Tanglegram visualizations of topological congruence between UPGMA clustering based on morphological characteristics and (a) UPGMA clustering based on ISSR markers, (b) UPGMA clustering based on SRAP markers, and (c) UPGMA clustering based on combined molecular markers in the Beta maritima population: (S1–S4: coastal-wild & S5–S7: inland crop–weed). Each color represents a different cluster.
Alongside the ISSR analysis, the SRAP marker system helped identify the molecular structure of the studied populations. For the given group of samples, the molecular similarity indices varied from 0.47 to 0.94 (see Table S4b). Thus, the greatest molecular similarity was found between S5 and S7, whereas the lowest was observed for S4 and S6. The dendrogram in Figure 6b was constructed using a CCC value of 0.85. It is possible to see the unique pattern of the clustering process, which is specific to this marker system, unlike ISSR. In this case, the mean Dice similarity coefficient was 0.85 for ISSR and 0.75 for SRAP.
These topological discrepancies should be interpreted as a property of the markers as much as of the populations. ISSR mainly samples microsatellite-flanking non-coding regions, whereas SRAP preferentially amplifies open reading frames and nearby coding-associated regions, so each system captures different fractions of genomic variation and may recover different demographic signals [28,69]. Rini et al. [69] also found that ISSR and SRAP grouped the same rice material into different numbers of clusters, with ISSR resolving three groups and SRAP two, despite both markers remaining informative. The disagreement between ISSR and SRAP dendrograms in the present study therefore cannot be equated directly with the true evolutionary history of the Egyptian Beta populations; it is more defensibly interpreted as marker-specific sampling of different genomic compartments.
To gain a more comprehensive understanding of molecular relationships and to address the limitations associated with single marker analysis, we integrated the ISSR and SRAP datasets. Indeed, the combined analysis highlighted a major clustering tendency with a CCC equal to 0.80. The similarity coefficients varied from 0.67 (between S4 and S7) to 0.9 (between S5 and S6), with a mean of 0.79. On the other hand, sample S4 was clearly different from other samples, with a mean similarity of 0.75 (Table S4c). The combined dendrogram (Figure 6c) showed that the combined data set improved the discrimination power for the overall population. These findings support the notion that these marker systems are synergistic, providing a more elaborated molecular map as well as solving the inconsistencies observed in analyzing each marker system separately [67,69,72].
3.4. Molecular Diversity and Trait-Environment Correlations: A Multi-Marker Approach
Species diversity can be seen as a reflection of the relationships between organisms and the available environmental and biotic resources [73]. The ability of plants to adapt to human-induced climate change is determined by the level of phenotypic plasticity that occurs at different levels, ranging from populations to communities [74,75]. Phenotypic plasticity can result from genetic factors, environmental influences, or the complex interactions between them [76]. The wide distribution of Beta maritima is an indication of its plasticity and ecological adaptability [11]. The pairwise Mantel test was applied to assess relationships between the molecular marker systems (ISSR, SRAP, and their combination), morphological markers, and environmental parameters across the geographic range of Beta maritima in Egypt. The results indicated that all relationships with morphological features were non-significant (p-value > 0.05) for the molecular markers used. The Tanglegram graphs reflect this finding, as the UPGMA dendrograms of ISSR, SRAP, and the combination showed low congruence with each other and with that of the morphological traits (Baker’s Gamma coefficient = −0.17, 0.078, and −0.036, respectively; Figure 6 and Table 4). Molecularly similar populations were characterized by different phenology, while different morphotypes were found within non-related molecular branches.
Table 4.
Tanglegram Metrics of Statistical Congruence Between Morphological and Molecular Markers (ISSR, SRAP, and Combined Data) based on the UPGMA method.
The discordance between molecular and morphological clustering found here is not unique to sea beet and also occurs in other plants. For example, Preisigke et al. [77] found that the entanglement rate equals 0.65 among 77 passion fruit genotypes, indicating some dissimilarity between molecular and agronomic data. Moreira et al. [78] identified the same divergence in the sample distribution on dendrograms in 65 hot pepper accessions. The populations of Beta maritima fit this general pattern with the additional complexity of an outcrossing mating system and human-mediated coastal dispersal, which amplifies the molecular-morphological discordance. Therefore, we cannot consider the morphological resemblance of the studied Egyptian Beta maritima populations as an indication of their molecular relationships.
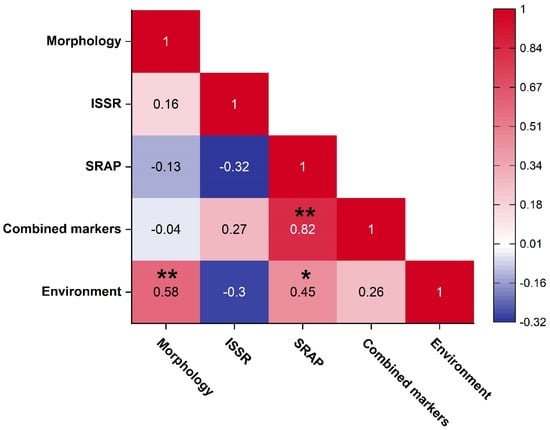
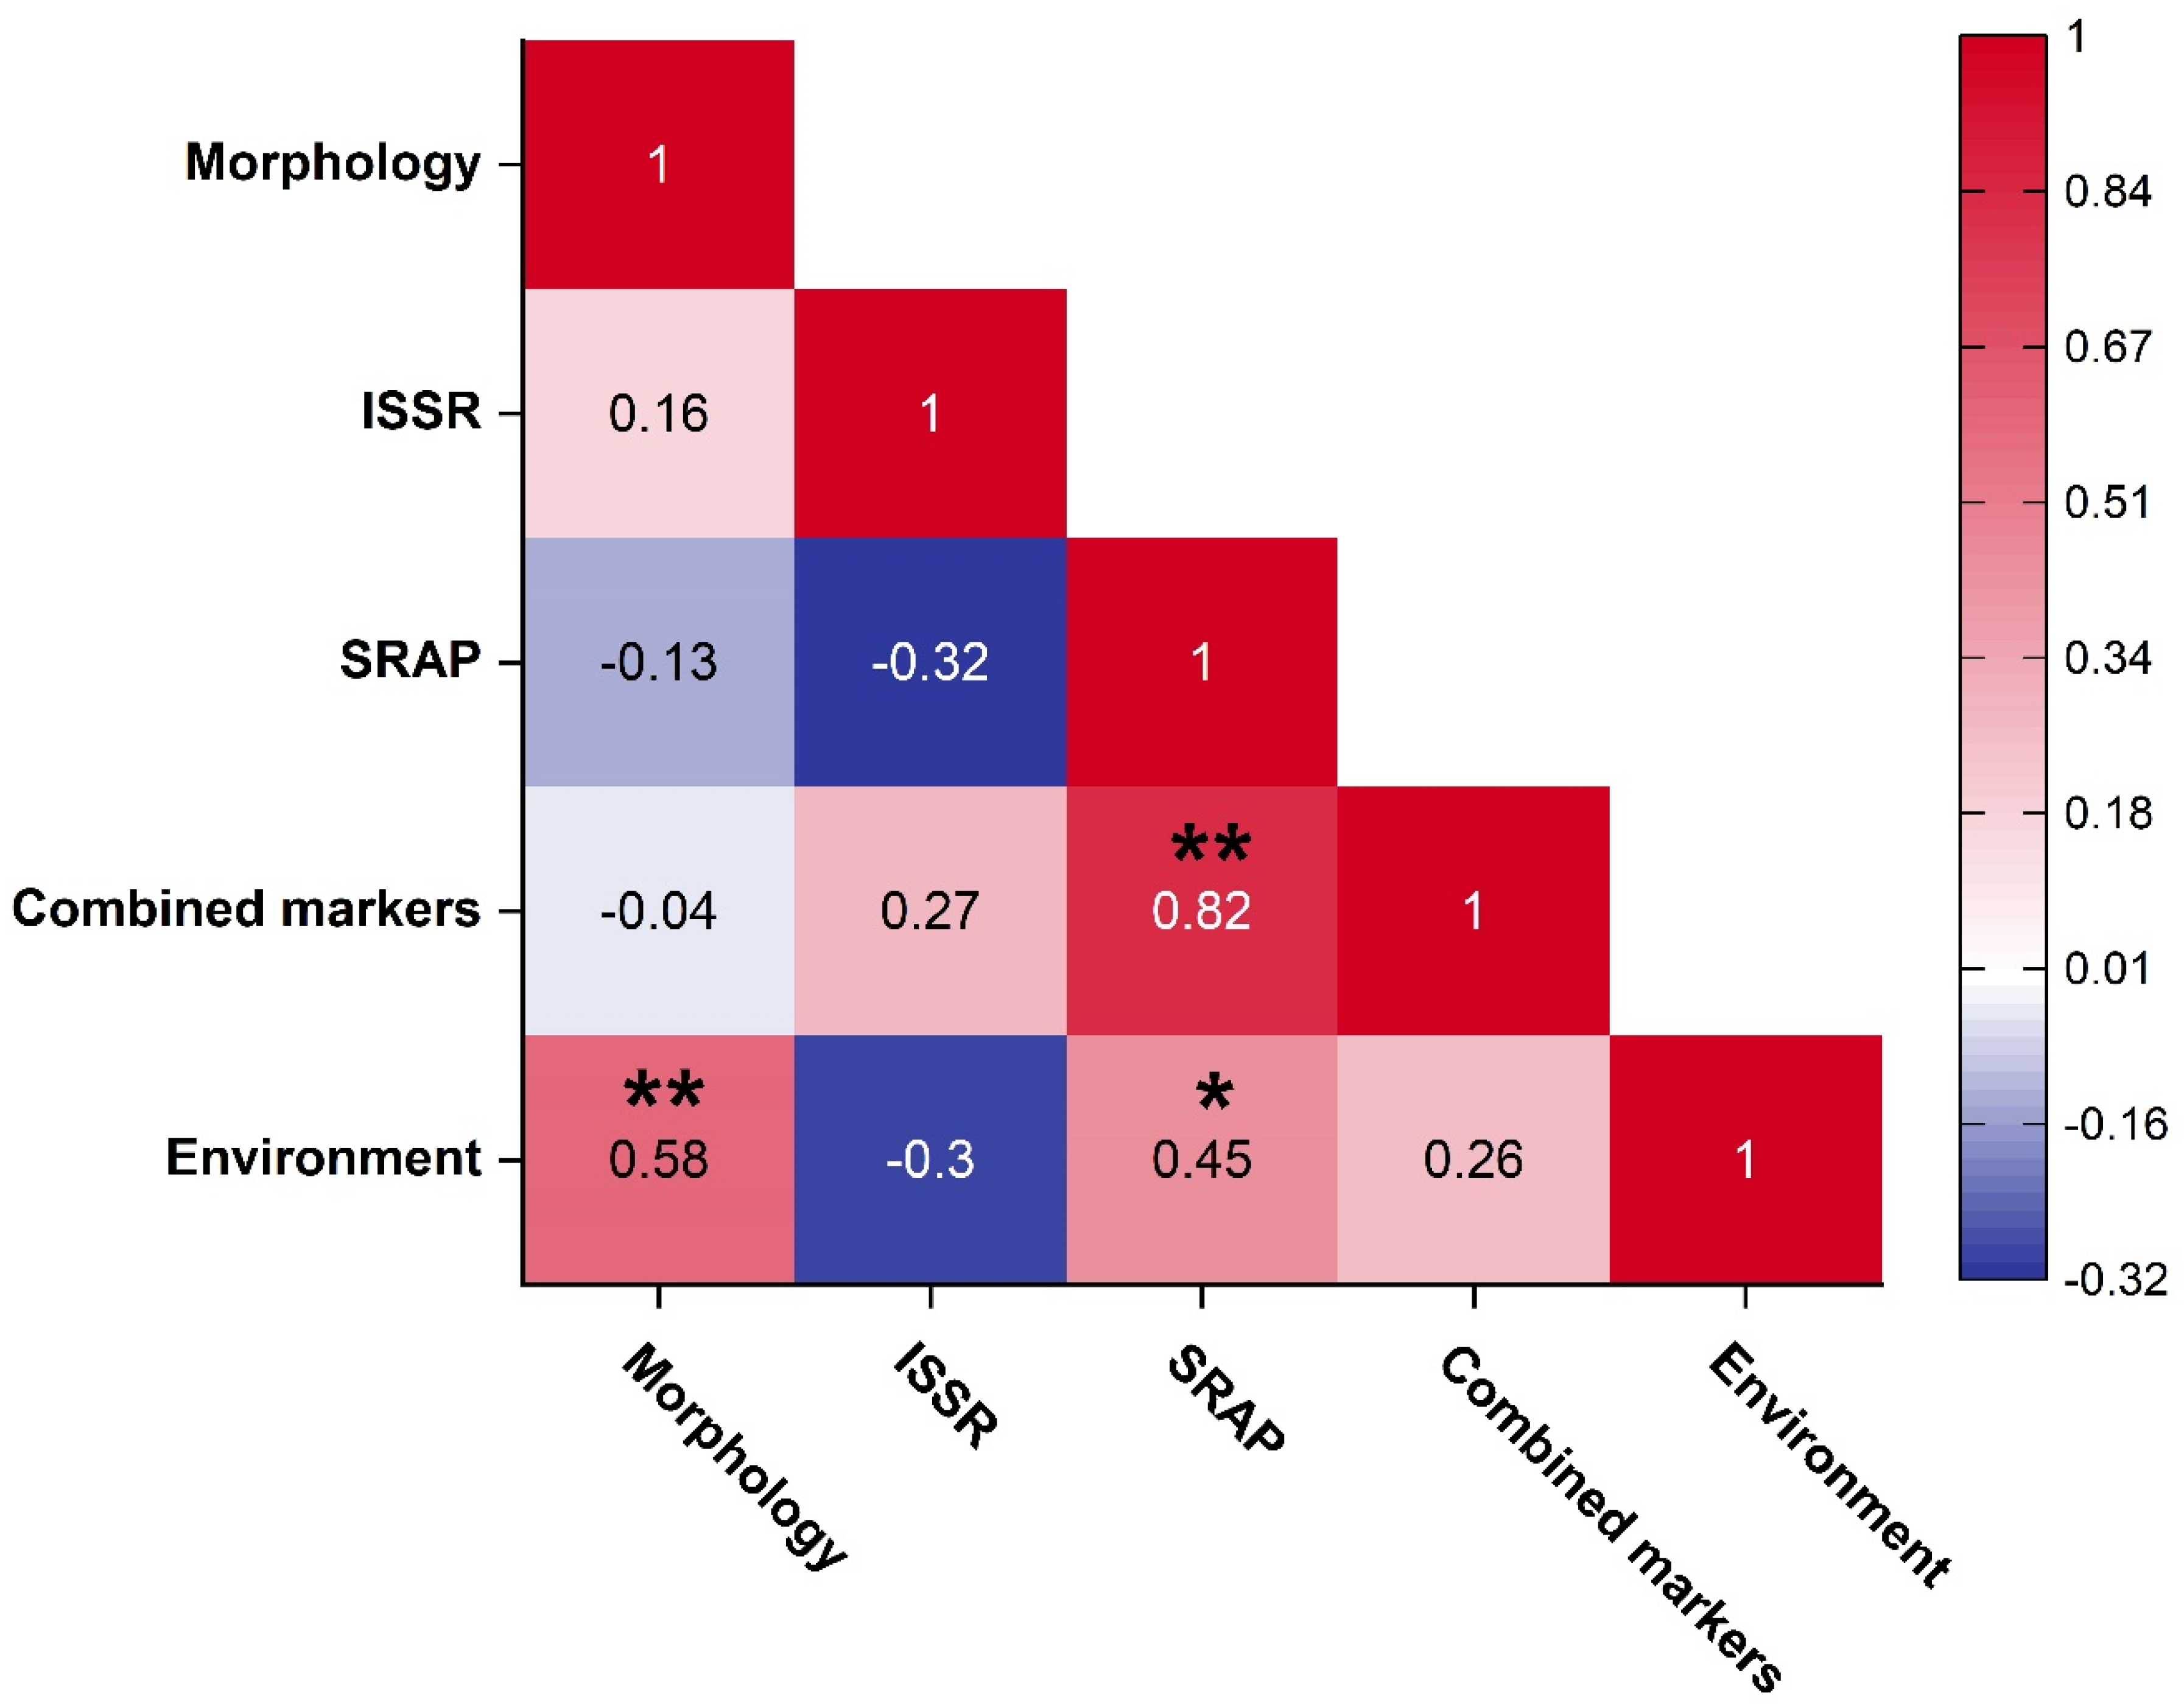
The most interesting result is that a positive Mantel correlation (r = 0.58, p-value < 0.01) was observed between the matrix of morphological distance and that of the distance matrix based on the environmental parameters (Figure 7). Comparing these results with the partial Mantel tests provides a better understanding of the mechanisms behind morphological variation. After controlling for the ISSR, SRAP, and combined markers data, the partial Mantel test supported the significant morphological and environmental positive correlation (r = 0.67, 0.73, and 0.62, respectively; Table 5). These results are consistent with Abdelhameed et al. [7], Letschert and Frese [40], and Stevanato et al. [79], suggesting that adaptation to varied Mediterranean habitats is the engine driving the observed morphological diversity. This contrasts with the concept that local adaptation strictly drives detected genetic differentiation, as observed in Tunisian Beta maritima populations [1]. Although phenotypic divergence in these Egyptian Beta populations appears more tightly linked to habitat variation than to the specific ISSR/SRAP loci surveyed, hidden genetic structure at unmapped genomic regions remains possible and should be evaluated in future work using experimental-garden testing and genome-wide high-throughput markers.
Figure 7.
A triangle Heat Map Diagram showing the Mantel test results, highlighting pairwise correlations (r) among five matrix comparisons: Morphology, Molecular Markers (ISSR, SRAP, and the two combined markers), and the associated environmental parameters. Asterisks indicate statistical significance based on 999 random permutation tests; * p-value > 0.05, ** p-value > 0.01.
Table 5.
Partial Mantel test results, including Mantel correlation coefficient (r) and p-value, between morphological and molecular markers (ISSR, SRAP, and combined data) and environmental data; (ns: non-significant correlation; ** significant at p-value < 0.01).
Furthermore, Mantel tests showed significant relationships between SRAP markers and environmental characteristics (r = 0.45, p-value < 0.05), and between these markers and the combined ISSR+SRAP markers (r = 0.82, p-value < 0.01), as shown in Figure 7. The SRAP marker data are significantly correlated with environmental data when morphological variation is controlled, even though neither analysis found a connection between SRAP markers and environmental parameters when controlling for ISSR markers.
The Tanglegram analyses reveal a significant lack of agreement across all marker comparisons (see Figure S1). As for the morphological part, it is found that the differentiation of coastal and inland populations is clear-cut, but at the molecular level, it is fragmented. Overall, the ISSR and SRAP markers contradict each other (entanglement = 0.78, Baker’s Gamma = −0.26, p = 1.00). The two marker systems interpret the sea beet’s DNA demographic history differently. While ISSR targets microsatellite-flanking regions that are usually non-coding, highly mutable, and selectively neutral, SRAP preferentially amplifies open reading frames, focusing on coding regions that may reflect different demographic histories [29].
The combined data set demonstrates a preference for ISSR markers with an entanglement of 0.12, Gamma of 0.063, and a p-value of 0.51, but with a poor fit and no statistical significance. On the other hand, the data for SRAP markers are almost entirely discordant, with an entanglement of 0.93, a Gamma of 0.73, and a p-value of 1.00. Both the SRAP and combined Tanglegrams reveal a conserved cluster at the extremes of the trees: populations S3 (wild-costal) and S4 (salt–affected) remain paired in both trees, while populations S5 to S7 (crop–weed populations) are loosely grouped, though S7 moves to the base in the combined analysis. The high levels of entanglement scores are mainly driven by populations S1 and S2, which are separated by the combined markers. S1 is grouped with the Upper Egypt cluster while S2 is alone; SRAP, on the other hand, pulls these two populations towards the middle of the tree.
This instability in coastal-wild pair positioning, rather than total topological chaos, accounts for the inflated entanglement statistic. Concordance between these sets is achieved at the deep structure level, affirming the wild-coastal and salt-affected populations (S3, S4) as two distinct groups. The populations of Upper Egypt (crop–weed) have proven cohesive, though they differ in the position of the coastal-wild pair. None of the molecular trees have morphological boundary correspondence. Mantel results add further complications to the issue. ISSR shows no environmental correlation. SRAP shows positive simple and partial correlations (r = 0.45 and 0.66, respectively) when morphology is controlled for. On the other hand, it vanishes when ISSR is controlled for, and it finds no echo in the Tanglegram topology. That disagreement in the Tanglegram topology is enough to erase any meaningful Mantel correlation in the combined data and enough to expose the SRAP environmental signal as fragile.
The broader interpretation remains that the studied coastal and inland morphotypes are phenotypically distinct but not cleanly separated by the used dominant markers. We reported that coastal and inland differentiation is clear at the morphological level but fragmented genetically, and that the classical pilosa–glabra [36] contrast is better interpreted as a phenotypic gradient than as a discrete genetic lineage in the studied material. That interpretation aligns with the Egyptian morphological survey, which documented two contrasting morphotypes associated with different habitats, but also called for molecular characterization and experimental-garden testing before treating those forms as stable biological units [7,37]. It also aligns with Tunisian work showing strong morphological structure, but stopping short of equating that structure with confirmed genetic divergence without molecular validation [1].
Taken together, this study does not definitively prove that Egyptian sea beet populations lack genetic variation; rather, it more clearly shows that morphology–environment coupling is stronger than morphology–ISSR/SRAP coupling in our dataset. To fully confirm whether the phenotypic plasticity of the studied populations reflects their genetic structure, future investigations employing high-density, genome-wide SNP markers alongside controlled common-garden cultivation experiments are highly recommended.
Finally, regardless of whether these variations stem from phenotypic plasticity or fine-scale genetic divergence, these stress-adapted populations hold immense agronomic value. Therefore, we recommend implementing ex-situ conservation strategies to safeguard these valuable genetic resources for future breeding of climate-resilient Beta crops.
4. Conclusions
In this study, morphological parameters were integrated with ISSR and SRAP molecular markers to evaluate population structure and environmental adaptation across Egyptian Beta vulgaris subsp. maritima (L.) Arcang. populations. Our analysis reveals a clear decoupling between the molecular and morphological datasets, alongside a strong, statistically significant association between morphological variation and soil-climatic factors. Among the marker systems evaluated, SRAP proved substantially more informative than ISSR for profiling Beta populations. However, while our findings across 26 dominant loci offer compelling preliminary evidence that morphological divergence is tightly aligned with environmental gradients, this system captures only a restricted fraction of the genome. Consequently, our conclusions are best understood as a foundational hypothesis. To definitively resolve whether the observed phenotypic plasticity reflects fine–scale genetic structure, future research should pair high–density, genome–wide SNP profiling under controlled conditions to fully clarify the genetic architecture of these potential wild genetic resources.
Supplementary Materials
The following supporting information can be downloaded at https://www.mdpi.com/article/10.3390/ecologies7040116/s1. Table S1: Qualitative morphological characters of the studied sea beet populations (S1–S7). Table S2: Quantitative morphological characters (Mean ± SE) of the studied sea beet populations (S1–S7). Table S3: Reproducible ISSR and SRAP banding patterns scored as presence (1) and absence (0) for the seven studied sea beet populations. Table S4: Dice similarity coefficients between the studied sea beet populations based on ISSR (a), SRAP (b), and combined markers (c) data. Figure S1: Tanglegram visualizations of topological congruence between UPGMA clustering based on (a) ISSR and SRAP markers, (b) combined markers and ISSR markers, and (c) combined markers and SRAP markers in sea beet population analysis. Each color represents a different cluster.
Author Contributions
A.A.A.: Methodology, Investigation, Formal analysis, Resources, Data curation, Visualization, Writing—original draft. W.A.H.: Formal analysis, Visualization, Writing—review & editing. M.O.H.: Methodology, Writing—review & editing. H.S.: Investigation, Resources, Funding acquisition. W.M.A.: Conceptualization, Formal analysis, Writing—review & editing, Supervision, and Project administration. All authors have read and agreed to the published version of the manuscript.
Funding
This research was funded by Princess Nourah bint Abdulrahman University Researchers Supporting Project number (PNURSP2026R83), Princess Nourah bint Abdulrahman University, Riyadh, Saudi Arabia.
Data Availability Statement
The original contributions presented in the study are included in the article/Supplementary Material; further inquiries can be directed to the corresponding author.
Acknowledgments
The authors extend their appreciation to Princess Nourah bint Abdulrahman University Researchers Supporting Project number (PNURSP2026R83), Princess Nourah bint Abdulrahman University, Riyadh, Saudi Arabia.
Conflicts of Interest
The authors declare no conflicts of interest.
References
- Ben Mahmoud, K.; Mezghani, N.; Ouakrim, Y.; Mezghani, N.; Jemai, N.; Jemmali, A. Distribution of Tunisian beet wild relatives (Beta sp.) according to morphological characteristics and eco-geographical origin. Heliyon 2025, 11, e41773. [Google Scholar] [CrossRef] [Scilit] [PubMed]
- Bertram, L.; Frisch, M. Morphological and genetic diversity of Beta maritima populations across Europe and North Africa: A comprehensive review. Front. Plant Sci. 2025, 16, 1731515. [Google Scholar] [CrossRef] [Scilit] [PubMed]
- Manda, L.; Idohou, R.; Agoyi, E.E.; Agbahoungba, S.; Salako, K.V.; Agbangla, C.; Adomou, A.C.; Assogbadjo, A.E. Progress of in situ conservation and use of crop wild relatives for food security in a changing climate: A case of the underutilised Vigna Savi. Front. Sustain. 2025, 6, 1453170. [Google Scholar] [CrossRef] [Scilit]
- Babalola, K.O.; Monacelli, N.; Gozzi, M.; Ceccarelli, S.; Folloni, S.; Galaverna, G. Genetic diversity and climate change adaptation in wheat: A systematic review of landraces, composite cross populations, and evolutionary populations. Front. Sustain. Food Syst. 2025, 9, 1504922. [Google Scholar] [CrossRef] [Scilit]
- Choudhary, S.B.; Sharma, H.K.; Arroju, A.K.; Thimmaiah, M.R.; Kumar, D.; Mitra, J. Phenological traits and molecular markers established genetic relationship and population structure in jute (Corchorus species) populations collected from Southern India. Genet. Resour. Crop Evol. 2024, 72, 2843–2864. [Google Scholar] [CrossRef] [Scilit]
- Lala, S.; Amri, A.; Maxted, N. Towards the conservation of crop wild relative diversity in North Africa: Checklist, prioritisation and inventory. Genet. Resour. Crop Evol. 2018, 65, 113–124. [Google Scholar] [CrossRef] [Scilit]
- Abdelhameed, A.A.; Amer, W.M.; Al Shaye, N.A.; Hassan, M.O.; Hassan, W.A. Assessing the Diversity of Beta vulgaris L. ssp. maritima (Sea Beet) Populations in Egypt. Plants 2024, 13, 3152. [Google Scholar] [CrossRef] [Scilit] [PubMed]
- PlantBase, E.M. Euro+Med PlantBase: The Information Resource for Euro-Mediterranean Plant Diversity. Available online: https://europlusmed.org/cdm_dataportal/taxon/2584ce98-01b2-4344-bc9e-d13f359293c2 (accessed on 1 June 2026).
- WFO. Beta L. Available online: http://www.worldfloraonline.org/taxon/wfo-4000004539 (accessed on 20 September 2024).
- Biancardi, E.; Panella, L.W.; Lewellen, R.T. Beta maritima: The Origin of Beets, 2nd ed.; Springer: Berlin/Heidelberg, Germany, 2012; pp. 1–284. [Google Scholar]
- Bertram, L.; Gholami, M.; Kopisch-Obuch, F.; Frisch, M. Exploring the diversity of three Northern Atlantic sea beet populations. Front. Plant Sci. 2025, 16, 1635602. [Google Scholar] [CrossRef] [Scilit] [PubMed]
- El Manhaly, M.; Badawy, O.; Doney, D. Evaluation of some Egyptian wild types of beet. In Proceedings of the International Beta Genetic Resources Network: A Report on the 4th International Beta Genetic Resources Workshop and World Beta Network Conference Held at the Aegean Agricultural Research Institute, Izmir, Turkey, 28 February–3 March 1996; p. 109. [Google Scholar]
- Bedair, H.; Hazzazi, Y.; Abo Hatab, A.; Halmy, M.W.A.A.; Dakhil, M.A.; Alghariani, M.S.; Sumayli, M.; El-Shabasy, A.; El-Khalafy, M.M.M. Predicting climate-driven shift of the East Mediterranean endemic Cynara cornigera Lindl. Front. Plant Sci. 2025, 16, 1461639. [Google Scholar] [CrossRef] [Scilit] [PubMed]
- Labokas, J.; Maxted, N.; Kell, S.; Brehm, J.M.; Iriondo, J.M. Development of national crop wild relative conservation strategies in European countries. Genet. Resour. Crop Evol. 2018, 65, 1385–1403. [Google Scholar] [CrossRef] [Scilit]
- Ascarini, F.; Nóbrega, H.G.M.; Leite, M.I.S.; Freitas, G.; Ragonezi, C.; Zavattieri, M.A.; Pinheiro de Carvalho, M.Â. Assessing the Diversity of Sea Beet (Beta vulgaris L. ssp. maritima) Populations. J. Agric. Sci. Technol. 2021, 23, 685–698. [Google Scholar]
- Monteiro, F.; Romeiras, M.M.; Batista, D.; Duarte, M.C. Biodiversity assessment of sugar beet species and its wild relatives: Linking ecological data with new genetic approaches. Am. J. Plant Sci. 2013, 4, 21–34. [Google Scholar] [CrossRef]
- Pradhan, L.; Parida, P.; Pradhan, D.; Surabhi, G.K. Recent advances in molecular markers in deciphering genetic diversity of wild and crop species for conservation and food security. Discov. Plants 2026, 3, 137. [Google Scholar] [CrossRef] [Scilit]
- Chesnokov, Y.V.; Kosolapov, V.M.; Savchenko, I.V. Morphological Genetic Markers in Plants. Russ. J. Genet. 2020, 56, 1406–1415. [Google Scholar] [CrossRef] [Scilit]
- Aworunse, O.S.; Popoola, J.O.; Fayeun, L.S.; Ahuekwe, E.F.; Obembe, O.O. Morphological trait variation and correlation analysis in Landraces of Southern Nigerian Fluted Pumpkin (Telfairia occidentalis Hook. F.). In Biotechnological Approaches to Sustainable Development Goals; Springer: Berlin/Heidelberg, Germany, 2023; pp. 53–82. [Google Scholar]
- Garrido-Cardenas, J.A.; Mesa-Valle, C.; Manzano-Agugliaro, F. Trends in plant research using molecular markers. Planta 2018, 247, 543–557. [Google Scholar] [CrossRef] [Scilit] [PubMed]
- Rasul, K.S.; Majeed, H.O.; Faraj, J.M.; Lateef, D.D.; Tahir, N.A.-r. Genetic diversity and relationships among Iris aucheri genotypes determined via ISSR and CDDP markers. Genet. Resour. Crop Evol. 2025, 72, 3235–3248. [Google Scholar] [CrossRef] [Scilit]
- Hamid, R.; Ghorbanzadeh, Z.; Panahi, B. Integration of inter-simple sequence repeats with machine learning approach for diversity analysis and authentication of Iranian cotton cultivars. Biochem. Biophys. Rep. 2026, 45, 102435. [Google Scholar] [CrossRef] [Scilit] [PubMed]
- Eren, B. ISSR-Based Genetic Diversity and Structure of Medicago sativa L. Populations from the Aras Basin, a Crossroad of Gene Centers. Life 2025, 16, 21. [Google Scholar] [CrossRef] [Scilit] [PubMed]
- Zhou, Y.-J.; Wang, X.-G.; Zhang, X.-Q. Development and application of a SRAP marker for the identification of sex in Buchloe dactyloides. Euphytica 2011, 181, 261–266. [Google Scholar] [CrossRef] [Scilit]
- Yi, L.; Dong, Z.; Lei, Y.; Zhao, J.; Xiong, Y.; Yang, J.; Xiong, Y.; Gou, W.; Ma, X. Genetic Diversity and Molecular Characterization of Worldwide Prairie Grass (Bromus catharticus Vahl) Accessions Using SRAP Markers. Agronomy 2021, 11, 2054. [Google Scholar] [CrossRef] [Scilit]
- Zheng, Y.; Xu, S.; Liu, J.; Zhao, Y.; Liu, J. Genetic diversity and population structure of Chinese natural bermudagrass [Cynodon dactylon (L.) Pers.] germplasm based on SRAP markers. PLoS ONE 2017, 12, e0177508. [Google Scholar] [CrossRef] [Scilit] [PubMed]
- Shaye, N.A.A.; Amer, W.M.; Hassan, M.O.; Gomaa, N.H.; Khalaf, M.H. Application of SRAP Markers to Identify Gender and Species in Genus Ephedra Tourn. ex L. Diversity 2025, 17, 600. [Google Scholar] [CrossRef] [Scilit]
- Song, Y.; Li, J.; Li, S.; Wu, Z.; Pi, Z. Genetic Diversity Analysis of Sugar Beet Multigerm Germplasm Resources Based on SRAP Molecular Markers. Horticulturae 2025, 11, 988. [Google Scholar] [CrossRef] [Scilit]
- Andrello, M.; Henry, K.; Devaux, P.; Desprez, B.; Manel, S. Taxonomic, spatial and adaptive genetic variation of Beta section Beta. Theor. Appl. Genet. 2016, 129, 257–271. [Google Scholar] [CrossRef] [Scilit] [PubMed]
- Tikendra, L.; Rahaman, H.; Dey, A.; Sahoo, M.R.; Nongdam, P. Applicability of Molecular Markers in Ascertaining Genetic Diversity and Relationship Between Five Edible Bamboos of North-East India. In Molecular Marker Techniques: A Potential Approach of Crop Improvement; Kumar, N., Ed.; Springer Nature Singapore: Singapore, 2023; pp. 141–160. [Google Scholar]
- Amom, T.; Tikendra, L.; Apana, N.; Goutam, M.; Sonia, P.; Koijam, A.S.; Potshangbam, A.M.; Rahaman, H.; Nongdam, P. Efficiency of RAPD, ISSR, iPBS, SCoT and phytochemical markers in the genetic relationship study of five native and economical important bamboos of North-East India. Phytochemistry 2020, 174, 112330. [Google Scholar] [CrossRef] [Scilit] [PubMed]
- Tahir, N.; Lateef, D.; Rasul, K.; Rahim, D.; Mustafa, K.; Sleman, S.; Mirza, A.; Aziz, R. Assessment of genetic variation and population structure in Iraqi barley accessions using ISSR, CDDP, and SCoT markers. Czech J. Genet. Plant Breed. 2023, 59, 148–159. [Google Scholar] [CrossRef] [Scilit]
- El-Samad, E.; El-Gizawy, A.; El-Khishin, D.; Lashine, Z. Estimation of genetic diversity in wild and cultivated form of beet using RAPD and AFLP markers. Res. J. Agric. Biol. Sci. 2009, 5, 207–219. [Google Scholar]
- Nasiri, A.; Mirzaie-Asl, A.; Aghaeizadeh, M.; Deljou, A. Assessment of genetic diversity of Beta vulgaris subsp. maritima using nuclear and mitochondrial molecular markers. J. Sugar Beet 2022, 37, fa139–fa151. [Google Scholar] [CrossRef]
- Yücel, B.; Çilesiz, Y.; Karaköy, T. Evaluation of Genetic Diversity in Sugar Beet Using SCoT and ISSR Markers. Plants 2026, 15, 613. [Google Scholar] [CrossRef] [Scilit] [PubMed]
- Täckholm, V. Students’ Flora of Egypt, 2nd ed.; Cairo University: Giza, Egypt, 1974; p. 888. [Google Scholar]
- Boulos, L. Flora of Egypt: Volume 1 (Azollaceae–Oxalidaceae); Al-Hadara Publishing: Cairo, Egypt, 1999. [Google Scholar]
- International Plant Genetic Resources Institute. Descriptors for Beta (Beta spp.); International Plant Genetic Resources Institute: Rome, Italy, 1994; p. 46. [Google Scholar]
- Buttler, K.P. Variation in wild populations of annual beet (Beta, Chenopodiaceae). Plant Syst. Evol. 1977, 128, 123–136. [Google Scholar] [CrossRef] [Scilit]
- Letschert, J.; Frese, L. Analysis of morphological variation in wild beet (Beta vulgaris L.) from Sicily. Genet. Resour. Crop Evol. 1993, 40, 15–24. [Google Scholar] [CrossRef] [Scilit]
- Piper, C. Soil and Plant Analysis; International Public Inc.: New York, NY, USA, 1950. [Google Scholar]
- Black, C.A. Method of soil analysis part 2. Chem. Microbiol. Prop. 1965, 9, 1387–1388. [Google Scholar]
- Cottenie, A.; Verloo, M.; Kiekens, L.; Velghe, G.; Camerlynck, R. Chemical Analysis of Plants and Soils; Laboratory of Analytical Agrochemistry. State University of Gent: Gent, Belgium, 1982; pp. 80–284. [Google Scholar]
- POWER. NASA Prediction of Worldwide Energy Resource. Available online: http://power.larc.nasa.gov/ (accessed on 26 August 2023).
- Williams, J.G.; Kubelik, A.R.; Livak, K.J.; Rafalski, J.A.; Tingey, S.V. DNA polymorphisms amplified by arbitrary primers are useful as genetic markers. Nucleic Acids Res. 1990, 18, 6531–6535. [Google Scholar] [CrossRef] [Scilit] [PubMed]
- Izzatullayeva, V.; Akparov, Z.; Babayeva, S.; Ojaghi, J.; Abbasov, M. Efficiency of using RAPD and ISSR markers in evaluation of genetic diversity in sugar beet. Turk. J. Biol. 2014, 38, 429–438. [Google Scholar] [CrossRef] [Scilit]
- Mantel, N. The detection of disease clustering and a generalized regression approach. Cancer Res. 1967, 27, 209–220. [Google Scholar] [PubMed]
- Zhou, Y.; Wei, X.; Abbas, F.; Yu, Y.; Yu, R.; Fan, Y. Genome-wide identification of simple sequence repeats and assessment of genetic diversity in Hedychium. J. Appl. Res. Med. Aromat. Plants 2021, 24, 100312. [Google Scholar] [CrossRef] [Scilit]
- Höft, N.; Dally, N.; Hasler, M.; Jung, C. Haplotype Variation of Flowering Time Genes of Sugar Beet and Its Wild Relatives and the Impact on Life Cycle Regimes. Front. Plant Sci. 2018, 8, 02211. [Google Scholar] [CrossRef] [Scilit] [PubMed]
- Tehseen, M.M.; Wyatt, N.A.; Bolton, M.D.; Fugate, K.K.; Preister, L.S.; Yang, S.; Ramachandran, V.; Li, X.; Chu, C. Genetic drift, historic migration, and limited gene flow contributing to the subpopulation divergence in wild sea beet (Beta vulgaris ssp. maritima (L.) Arcang). PLoS ONE 2024, 19, e0308626. [Google Scholar] [CrossRef] [Scilit] [PubMed]
- Ribeiro, I.C.; Pinheiro, C.; Ribeiro, C.M.; Veloso, M.M.; Simoes-Costa, M.C.; Evaristo, I.; Paulo, O.S.; Ricardo, C.P. Genetic Diversity and Physiological Performance of Portuguese Wild Beet (Beta vulgaris spp. maritima) from Three Contrasting Habitats. Front. Plant Sci. 2016, 7, 1293. [Google Scholar] [CrossRef] [Scilit] [PubMed]
- Richards, C.M.; Reeves, P.A.; Fenwick, A.L.; Panella, L. Genetic structure and gene flow in Beta vulgaris subspecies maritima along the Atlantic coast of France. Genet. Resour. Crop Evol. 2013, 61, 651–662. [Google Scholar] [CrossRef] [Scilit]
- Sandell, F.L.; Stralis-Pavese, N.; McGrath, J.M.; Schulz, B.; Himmelbauer, H.; Dohm, J.C. Genomic distances reveal relationships of wild and cultivated beets. Nat. Commun. 2022, 13, 2021. [Google Scholar] [CrossRef] [Scilit] [PubMed]
- Zucchini, C.; Raggi, L.; Grassi, A.; Spataro, G.; Gigante, D.; Negri, V. In situ occurrence and conservation of Beta vulgaris subsp. maritima ((L.) Arcangeli) in Italy. Front. Ecol. Evol. 2024, 12, 1399341. [Google Scholar] [CrossRef] [Scilit]
- Ciccarelli, D.; Bona, C. Exploring the Functional Strategies Adopted by Coastal Plants Along an Ecological Gradient Using Morpho-functional Traits. Estuaries Coasts 2022, 45, 114–129. [Google Scholar] [CrossRef] [Scilit]
- Liu, R.-L.; van Kleunen, M.; Pierce, S.; Chytrý, M.; Guo, K.; Pyšek, P.; Guo, W.-Y. Grime’s CSR theory revisited: A whole-plant view of vascular plant functioning across contrasting environments. J. Ecol. 2025, 113, 3019–3036. [Google Scholar] [CrossRef] [Scilit]
- Drechsel, P.J.O.A.; Cofie, A.R.A.; Forster, K.N.K.; Aune, M.A. Fertilizer use and market development for vegetable production in West Africa. In Fertilizer Use and Market Development for Vegetable Production in West Africa; Drechsel, P., Birner, R., Van der Veen, M.N., Eds.; International Fertilizer Development Center (IFDC): Muscle Shoals, AL, USA, 2006. [Google Scholar]
- Xu, X.; Du, X.; Wang, F.; Sha, J.; Chen, Q.; Tian, G.; Zhu, Z.; Ge, S.; Jiang, Y. Effects of potassium levels on plant growth, accumulation and distribution of carbon, and nitrate metabolism in apple dwarf rootstock seedlings. Front. Plant Sci. 2020, 11, 904. [Google Scholar] [CrossRef] [Scilit] [PubMed]
- Tan, A.; Adanacioglu, N.; Karabak, S.; Aysar, N.; Tan, A.S.; Aykas, L. Sea Beets [Beta vulgaris subsp. maritima (L.) Arcang.] Wild Edible Beets and Home Garden Beets of Turkey. ANADOLU Ege Tarımsal Araşt. Enstitüsü Derg. 2017, 27, 54–61. [Google Scholar]
- Leal, L.Y.d.C.; Paulino, M.K.S.S.; e Silva, Ê.F.d.F.; Schaffer, B.; de Souza, E.R. Coordinated regulation of water relations and leaf succulence in beet (Beta vulgaris L.) under interacting salinity and soil moisture stress. Acta Physiol. Plant. 2026, 48, 88. [Google Scholar] [CrossRef] [Scilit]
- He, H.; Zhou, W.; Lü, H.; Liang, B. Growth, Leaf Morphological and Physiological Adaptability of Leaf Beet (Beta vulgaris var. cicla) to Salt Stress: A Soil Culture Experiment. Agronomy 2022, 12, 1393. [Google Scholar] [CrossRef] [Scilit]
- Ozoliņa, K.A.; Jēkabsone, A.; Andersone-Ozola, U.; Ievinsh, G. Comparison of Growth and Physiological Effects of Soil Moisture Regime on Plantago maritima Plants from Geographically Isolated Sites on the Eastern Coast of the Baltic Sea. Plants 2024, 13, 633. [Google Scholar] [CrossRef] [Scilit] [PubMed]
- Wang, S.; Zhao, Z.; Ge, S.; Peng, B.; Zhang, K.; Hu, M.; Mai, W.; Tian, C. Root Morphology and Rhizosphere Characteristics Are Related to Salt Tolerance of Suaeda salsa and Beta vulgaris L. Front. Plant Sci. 2021, 12, 677767. [Google Scholar] [CrossRef] [Scilit] [PubMed]
- Bidyananda, N.; Jamir, I.; Nowakowska, K.; Varte, V.; Vendrame, W.A.; Devi, R.S.; Nongdam, P. Plant genetic diversity studies: Insights from DNA marker analyses. Int. J. Plant Biol. 2024, 15, 607–640. [Google Scholar] [CrossRef] [Scilit]
- Serrote, C.M.L.; Reiniger, L.R.S.; Silva, K.B.; dos Santos Rabaiolli, S.M.; Stefanel, C.M. Determining the polymorphism information content of a molecular marker. Gene 2020, 726, 144175. [Google Scholar] [CrossRef] [Scilit] [PubMed]
- Botstein, D.; White, R.L.; Skolnick, M.; Davis, R.W. Construction of a genetic linkage map in man using restriction fragment length polymorphisms. Am. J. Hum. Genet. 1980, 32, 314. [Google Scholar] [PubMed]
- Hancı, F.; Paşazade, E. A Comparison of Efficiency Parameters of SRAP and ISSR Markers in Revealing Variation in Allium Germplasm. Horticulturae 2025, 11, 294. [Google Scholar] [CrossRef] [Scilit]
- Khan, M.; Khalid, T. Unveiling Plant Genetic Diversity: A Review of DNA Marker Techniques. J. Agric. Sci./Tarim Bilim. Derg. 2026, 32, 1. [Google Scholar] [CrossRef] [Scilit]
- Rini, D.S.; Budiyanti, Y.; Valentine, M.; Permana, R. ISSR and SRAP for assessing genetic variability of Indonesian local rice genotypes (Oryza sativa L.). Crop Breed. Appl. Biotechnol. 2023, 23, e448923411. [Google Scholar] [CrossRef] [Scilit]
- Sharma, S.; Kumar, V.; Mathur, S. Comparative analysis of RAPD and ISSR markers for characterization of sesame (Sesamum indicum L.) genotypes. J. Plant Biochem. Biotechnol. 2009, 18, 37–43. [Google Scholar] [CrossRef] [Scilit]
- Yue, W.; Zixia, G.; Min, C.; Yanmei, Z.; Xiaoqin, S.; Yifeng, Z.; Peng, B. Genetic relationship and species identification of Dioscorea polystachya Turcz. in Yams determined by ISSR, ISAP, SRAP and SCAR markers. Genet. Resour. Crop Evol. 2022, 69, 1953–1964. [Google Scholar] [CrossRef] [Scilit]
- Bo, W.; Wang, S.; Xing, G.; Wang, Y. Genetic diversity analysis of Iris germanica cultivars based on ISSR and SRAP molecular markers. Front. Plant Sci. 2025, 16, 1629234. [Google Scholar] [CrossRef] [Scilit] [PubMed]
- Galiana, N.; Araújo, M.B. Biotic interactions biogeography: A framework for understanding how species interactions shape biodiversity patterns across scales. PLoS Biol. 2026, 24, e3003813. [Google Scholar] [CrossRef] [Scilit] [PubMed]
- Feeley, K.; Bravo-Avila, C.; Fadrique, B.; Perez, T.; Zuleta, D. Climate-driven changes in the composition of New World plant communities. Nat. Clim. Change 2020, 10, 965–970. [Google Scholar] [CrossRef] [Scilit]
- Tierney, J.E.; Poulsen, C.J.; Montañez, I.P.; Bhattacharya, T.; Feng, R.; Ford, H.L.; Hönisch, B.; Inglis, G.N.; Petersen, S.V.; Sagoo, N. Past climates inform our future. Science 2020, 370, eaay3701. [Google Scholar] [CrossRef] [Scilit] [PubMed]
- Napier, J.D.; Heckman, R.W.; Juenger, T.E. Gene-by-environment interactions in plants: Molecular mechanisms, environmental drivers, and adaptive plasticity. Plant Cell 2023, 35, 109–124. [Google Scholar] [CrossRef] [Scilit] [PubMed]
- Preisigke, S.d.C.; Viana, A.P.; Santos, E.A.; Santos, P.R.d.; Santos, V.O.d.; Ambrósio, M.; Silva, F.A.d.; Walter, F.H.d.B. Selection strategies in a segregating passion fruit population aided by classic and molecular techniques. Bragantia 2020, 79, 47–61. [Google Scholar] [CrossRef] [Scilit]
- Moreira, A.F.P.; Ruas, P.M.; de Fátima Ruas, C.; Baba, V.Y.; Giordani, W.; Arruda, I.M.; Rodrigues, R.; Gonçalves, L.S.A. Genetic diversity, population structure and genetic parameters of fruit traits in Capsicum chinense. Sci. Hortic. 2018, 236, 1–9. [Google Scholar] [CrossRef] [Scilit]
- Stevanato, P.; Biaggi, M.D.; Skaracis, G.N.; Colombo, M.; Mandolino, G.; Biancardi, E. The sea beet (Beta vulgaris L. ssp. maritima) of the Adriatic coast as source of resistance for sugar beet. Sugar Tech 2001, 3, 77–82. [Google Scholar] [CrossRef] [Scilit]

Disclaimer/Publisher’s Note: The statements, opinions and data contained in all publications are solely those of the individual author(s) and contributor(s) and not of MDPI and/or the editor(s). MDPI and/or the editor(s) disclaim responsibility for any injury to people or property resulting from any ideas, methods, instructions or products referred to in the content. |
© 2026 by the authors. Licensee MDPI, Basel, Switzerland. This article is an open access article distributed under the terms and conditions of the Creative Commons Attribution (CC BY) license.