


Abstract
Buildings and construction account for nearly one-third of global energy demand, making the thermal performance of building envelopes an important factor in reducing heating and cooling loads. Conventional steady-state indicators are useful for comparison, but they do not always describe how complete assemblies respond to changing outdoor conditions. This study presents a dynamic experimental method for evaluating construction assemblies using energy compensation under controlled indoor conditions. A highly insulated test module was used to maintain a stable indoor temperature while measuring the electrical heating energy required to compensate for heat losses through interchangeable assemblies exposed to outdoor temperature variations. Three systems were tested: double gypsum board, hollow concrete block, and externally insulated hollow concrete block. To compare the assemblies under different outdoor conditions, corrected heating energy was normalized by test area and heating degree-hours (HDHs), resulting in a Dynamic Thermal Performance Index (DTPI). The DTPI decreased from 52.4 Wh/(m2·°C·h) for the double gypsum board assembly to 21.5 Wh/(m2·°C·h) for the externally insulated hollow concrete block, while the mean corrected heating energy decreased from 2.23 to 0.91 kWh/day. The gypsum board assembly showed the fastest thermal response and the highest energy demand, whereas the externally insulated block provided the most stable indoor-side behavior by reducing the effect of outdoor fluctuations on the concrete mass. The method links transient thermal behavior with measured energy consumption and offers a practical complement to conventional steady-state metrics for comparing building envelope systems.
1. Introduction
The buildings and construction sector represents one of the largest sources of global energy demand and carbon dioxide emissions. Recent international assessments indicate that, in 2023, buildings accounted for approximately 32% of global energy demand and 34% of energy-related CO2 emissions [1,2,3]. A substantial portion of this demand is associated with space heating and cooling, both of which are strongly influenced by the thermal performance of the building envelope. In this context, the evaluation of walls, roofs, and complete construction assemblies under representative operating conditions is essential for estimating energy demand, reducing operating costs, and supporting the design of lower-carbon buildings. Heating demand remains a critical issue in building energy performance. Although efficiency improvements have been implemented in many regions, global energy demand for heating in buildings has increased by approximately 10% since 2010 [4]. This trend reflects the combined effects of population growth, increasing heated floor area, expanded access to indoor thermal comfort, and climatic variability. Consequently, the capacity of building envelopes to limit heat losses under real boundary conditions has direct implications for energy consumption, heating costs, and associated environmental impacts [5,6,7]. Traditionally, the thermal characterization of building components has relied on steady-state parameters such as thermal conductivity, thermal resistance, and thermal transmittance [8,9,10]. These indicators, commonly expressed through R-values and U-values, are widely used in building standards, energy codes, and simulation tools because they provide comparable measures of heat transfer performance [8,11,12]. However, these parameters are generally obtained under controlled laboratory conditions and may not fully represent the behavior of complete construction assemblies during operation. Building envelopes are typically composed of multilayered systems that include heterogeneous materials, joints, cavities, interfaces, and construction-related discontinuities. As a result, the thermal response of complete assemblies cannot always be accurately inferred from isolated material properties or steady-state indicators alone [9,11,12,13]. Steady-state approaches provide limited information on transient heat transfer phenomena such as thermal inertia, heat storage, time lag, decrement effects, and delayed heat propagation across multilayer assemblies. These effects can influence the energy required to maintain indoor comfort under variable outdoor conditions [10,11,12,13].
Under real exposure conditions, outdoor temperature fluctuations, wind, humidity, and solar radiation impose variable boundary conditions that differ from those assumed in simplified thermal calculations. Consequently, the measured performance of building envelopes may differ from the values predicted during the design stage [10,11,12,13]. This difference between expected and measured building performance is commonly described as the performance gap. The gap may result from multiple causes, including occupant behavior, system operation, construction quality, climatic variability, and limitations in material data. Within this broader problem, the present study focuses specifically on the contribution of construction assemblies to envelope-related thermal performance differences. From an energy and economic perspective, inaccurate estimation of envelope performance may lead to higher heating or cooling demand, oversized thermal systems, and increased operating costs over the building service life.
Dynamic building energy simulation tools, such as EnergyPlus and TRNSYS, are widely used to estimate envelope behavior under variable environmental conditions [14,15,16,17]. These tools allow detailed analysis of energy flows, indoor temperature response, and transient heat transfer. Nevertheless, their reliability depends on the quality of input data, material properties, boundary conditions, and modeling assumptions. In practice, this can be a limitation when evaluating locally manufactured materials, emerging construction systems, or region-specific assemblies for which validated thermophysical data are not available. Moreover, numerical models may not fully capture localized effects such as thermal bridges, air leakage, construction imperfections, and non-uniform heat transfer [18,19,20]. Therefore, experimental methods remain necessary to validate thermal behavior and reduce uncertainty in building energy assessment [10,11,12,13,15]. In this context, future work may include the development of a calibrated digital twin of the experimental module in EnergyPlus or TRNSYS to compare the experimentally obtained DTPI values with simulation-based dynamic envelope performance indicators. Standardized hot-box procedures, including guarded and calibrated hot-box methods, provide reliable measurements of thermal transmission under controlled laboratory conditions [9,15,21,22,23]. However, these methods require specialized infrastructure, strict environmental control, and relatively high operational costs [11,24]. Their primary purpose is the determination of steady-state thermal properties, which limits their use for evaluating time-dependent envelope behavior under naturally varying outdoor conditions [9]. For this reason, complementary experimental approaches are needed to evaluate complete construction assemblies under controlled indoor conditions while allowing exposure to outdoor thermal variability [10,13,22]. Despite the availability of standardized laboratory methods and advanced simulation tools, there remains a methodological gap in the accessible experimental evaluation of complete construction assemblies under dynamic conditions [11,12,13,14,15]. This gap is especially relevant for local construction systems, retrofit configurations, and assemblies whose performance cannot be fully described using material-level data or generic simulation databases [15,23].
This study presents a dynamic experimental method for evaluating the thermal performance of construction assemblies based on energy compensation under controlled indoor temperature conditions. The method is based on maintaining a stable indoor temperature inside a highly insulated test module and measuring the electrical energy required to compensate for heat losses through an interchangeable construction assembly. In this configuration, energy consumption is used as an empirical indicator of system-level thermal performance, while temperature measurements provide information on heat transfer dynamics across the tested assembly. The experimental module consists of a highly insulated enclosure with a dedicated test section where different construction assemblies can be installed and evaluated under equivalent indoor conditions. The module is exposed to outdoor temperature variations, while indoor air temperature is controlled using an electric heating system. Temperature sensors are placed at multiple locations, including indoor air, outdoor air, internal and external surfaces of the assembly, and intermediate points within the tested system. Electrical energy consumption is recorded simultaneously to quantify the energy required to maintain indoor thermal stability [15,21,24].
To enable comparison among assemblies tested under variable outdoor conditions, energy consumption is normalized using heating degree-hours. This normalized metric, defined in this study as a Dynamic Thermal Performance Index, relates daily corrected energy demand to the effective test area and the outdoor thermal gradient experienced during the monitoring period [23,25]. While degree-hour methods are commonly based on simplified temperature–energy relationships, their use in this study provides a practical reference against which deviations associated with thermal mass, heat storage, damping behavior, and phase-shift effects can be evaluated. In this way, the metric reflects not only conductive resistance, but also the combined effects of thermal inertia, internal configuration, and transient response [25,26]. The novelty of this study lies in the development and experimental application of a low-complexity, energy-compensation-based method for comparing the dynamic thermal performance of complete construction assemblies under controlled indoor temperature conditions and variable outdoor exposure. Unlike conventional steady-state approaches, the proposed Dynamic Thermal Performance Index integrates measured heating energy demand, effective test area, and heating degree-hours, providing a practical comparative indicator for evaluating envelope systems under transient outdoor conditions. The proposed method is intended to complement, rather than replace, standardized thermal characterization techniques by offering an accessible experimental framework that links assembly-level thermal behavior with measured energy demand [9,10,21,22,23,24,25].
Specifically, this study contributes by:
- developing a controlled experimental framework for evaluating the dynamic thermal performance of integrated construction assemblies;
- using electrical energy compensation as a measurable indicator of heat losses through the tested system;
- combining multipoint temperature monitoring with corrected heating energy demand to characterize transient thermal behavior;
- introducing the Dynamic Thermal Performance Index as a normalized energy-based indicator for comparing assemblies under variable outdoor temperature conditions;
- providing an accessible methodology to support envelope design, retrofit assessment, heating energy reduction, and low-carbon building strategies.
2. Materials and Methods
The experimental campaign was conducted in Mexicali, Baja California, Mexico, a low-altitude city located in northwestern Mexico near the United States border. Although Mexicali is generally characterized by hot-arid climatic conditions, winter nighttime temperatures can decrease substantially. Climatological records from the Mexicali SMN station indicate that the average minimum temperature in January is approximately 7–8 °C, while historical daily minimum temperatures have reached values below 0 °C during specific cold events [27,28]. These winter conditions can generate a measurable indoor–outdoor thermal gradient when the indoor environment is maintained near 19–20 °C, providing suitable outdoor thermal boundary conditions for evaluating heat losses through building envelope assemblies during the selected heating-dominated monitoring periods.
2.1. Experimental Module Design
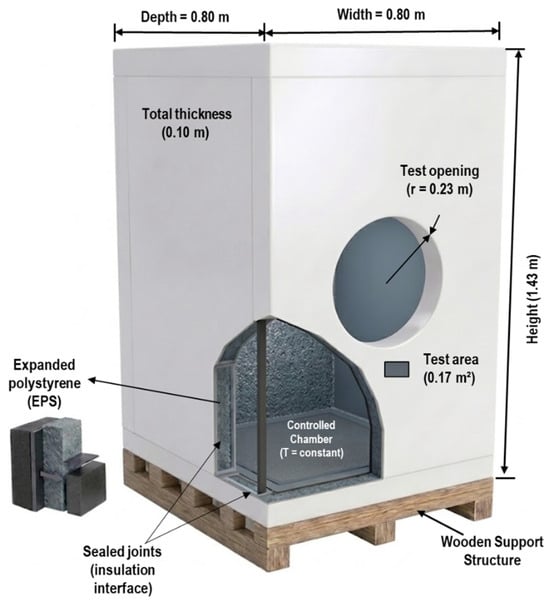
A dedicated experimental module was developed to evaluate the thermal performance of construction assemblies under controlled indoor temperature conditions and variable outdoor exposure. The module was conceived as a highly insulated control volume in which the main intended heat transfer pathway occurs through an interchangeable test section. This configuration allows different construction assemblies to be evaluated under equivalent internal boundary conditions while being exposed to naturally varying outdoor temperatures [9,24]. The enclosure was constructed using expanded polystyrene (EPS) panels with a thickness of 0.10 m. EPS was selected because of its low thermal conductivity, low density, and high thermal resistance, which help reduce heat losses through the non-tested surfaces of the module. Therefore, the insulated enclosure was designed to concentrate the measurable thermal response on the installed construction assembly rather than on the module boundaries.
The module consisted of four lateral panels with dimensions of 1.43 m × 0.80 m and top and bottom panels with dimensions of 0.80 m × 0.80 m, resulting in a total external surface area of approximately 5.86 m2. All joints between EPS panels were sealed using insulating foam and adhesive tape to reduce air infiltration and uncontrolled heat exchange. The structure was elevated on a wooden support to reduce direct conductive heat transfer with the ground and to improve the repeatability of the boundary conditions during the tests. A circular opening was incorporated at the center of one lateral wall to serve as the test section for the interchangeable construction assemblies. The opening had an approximate radius of 0.23 m and an effective area of approximately 0.17 m2. The circular geometry was selected to reduce corner-related edge effects and to promote a more uniform heat transfer distribution across the tested area. Each construction assembly was installed within this section and sealed along the perimeter to minimize air leakage and localized thermal bypasses. The complete configuration of the experimental module, including its geometric characteristics, EPS envelope, support structure, and test section location, is shown in Figure 1.
Figure 1.
Schematic representation of the experimental module used for thermal performance evaluation. The figure shows the EPS enclosure, support structure, circular test section, and main geometric dimensions used to install and evaluate the interchangeable construction assemblies.
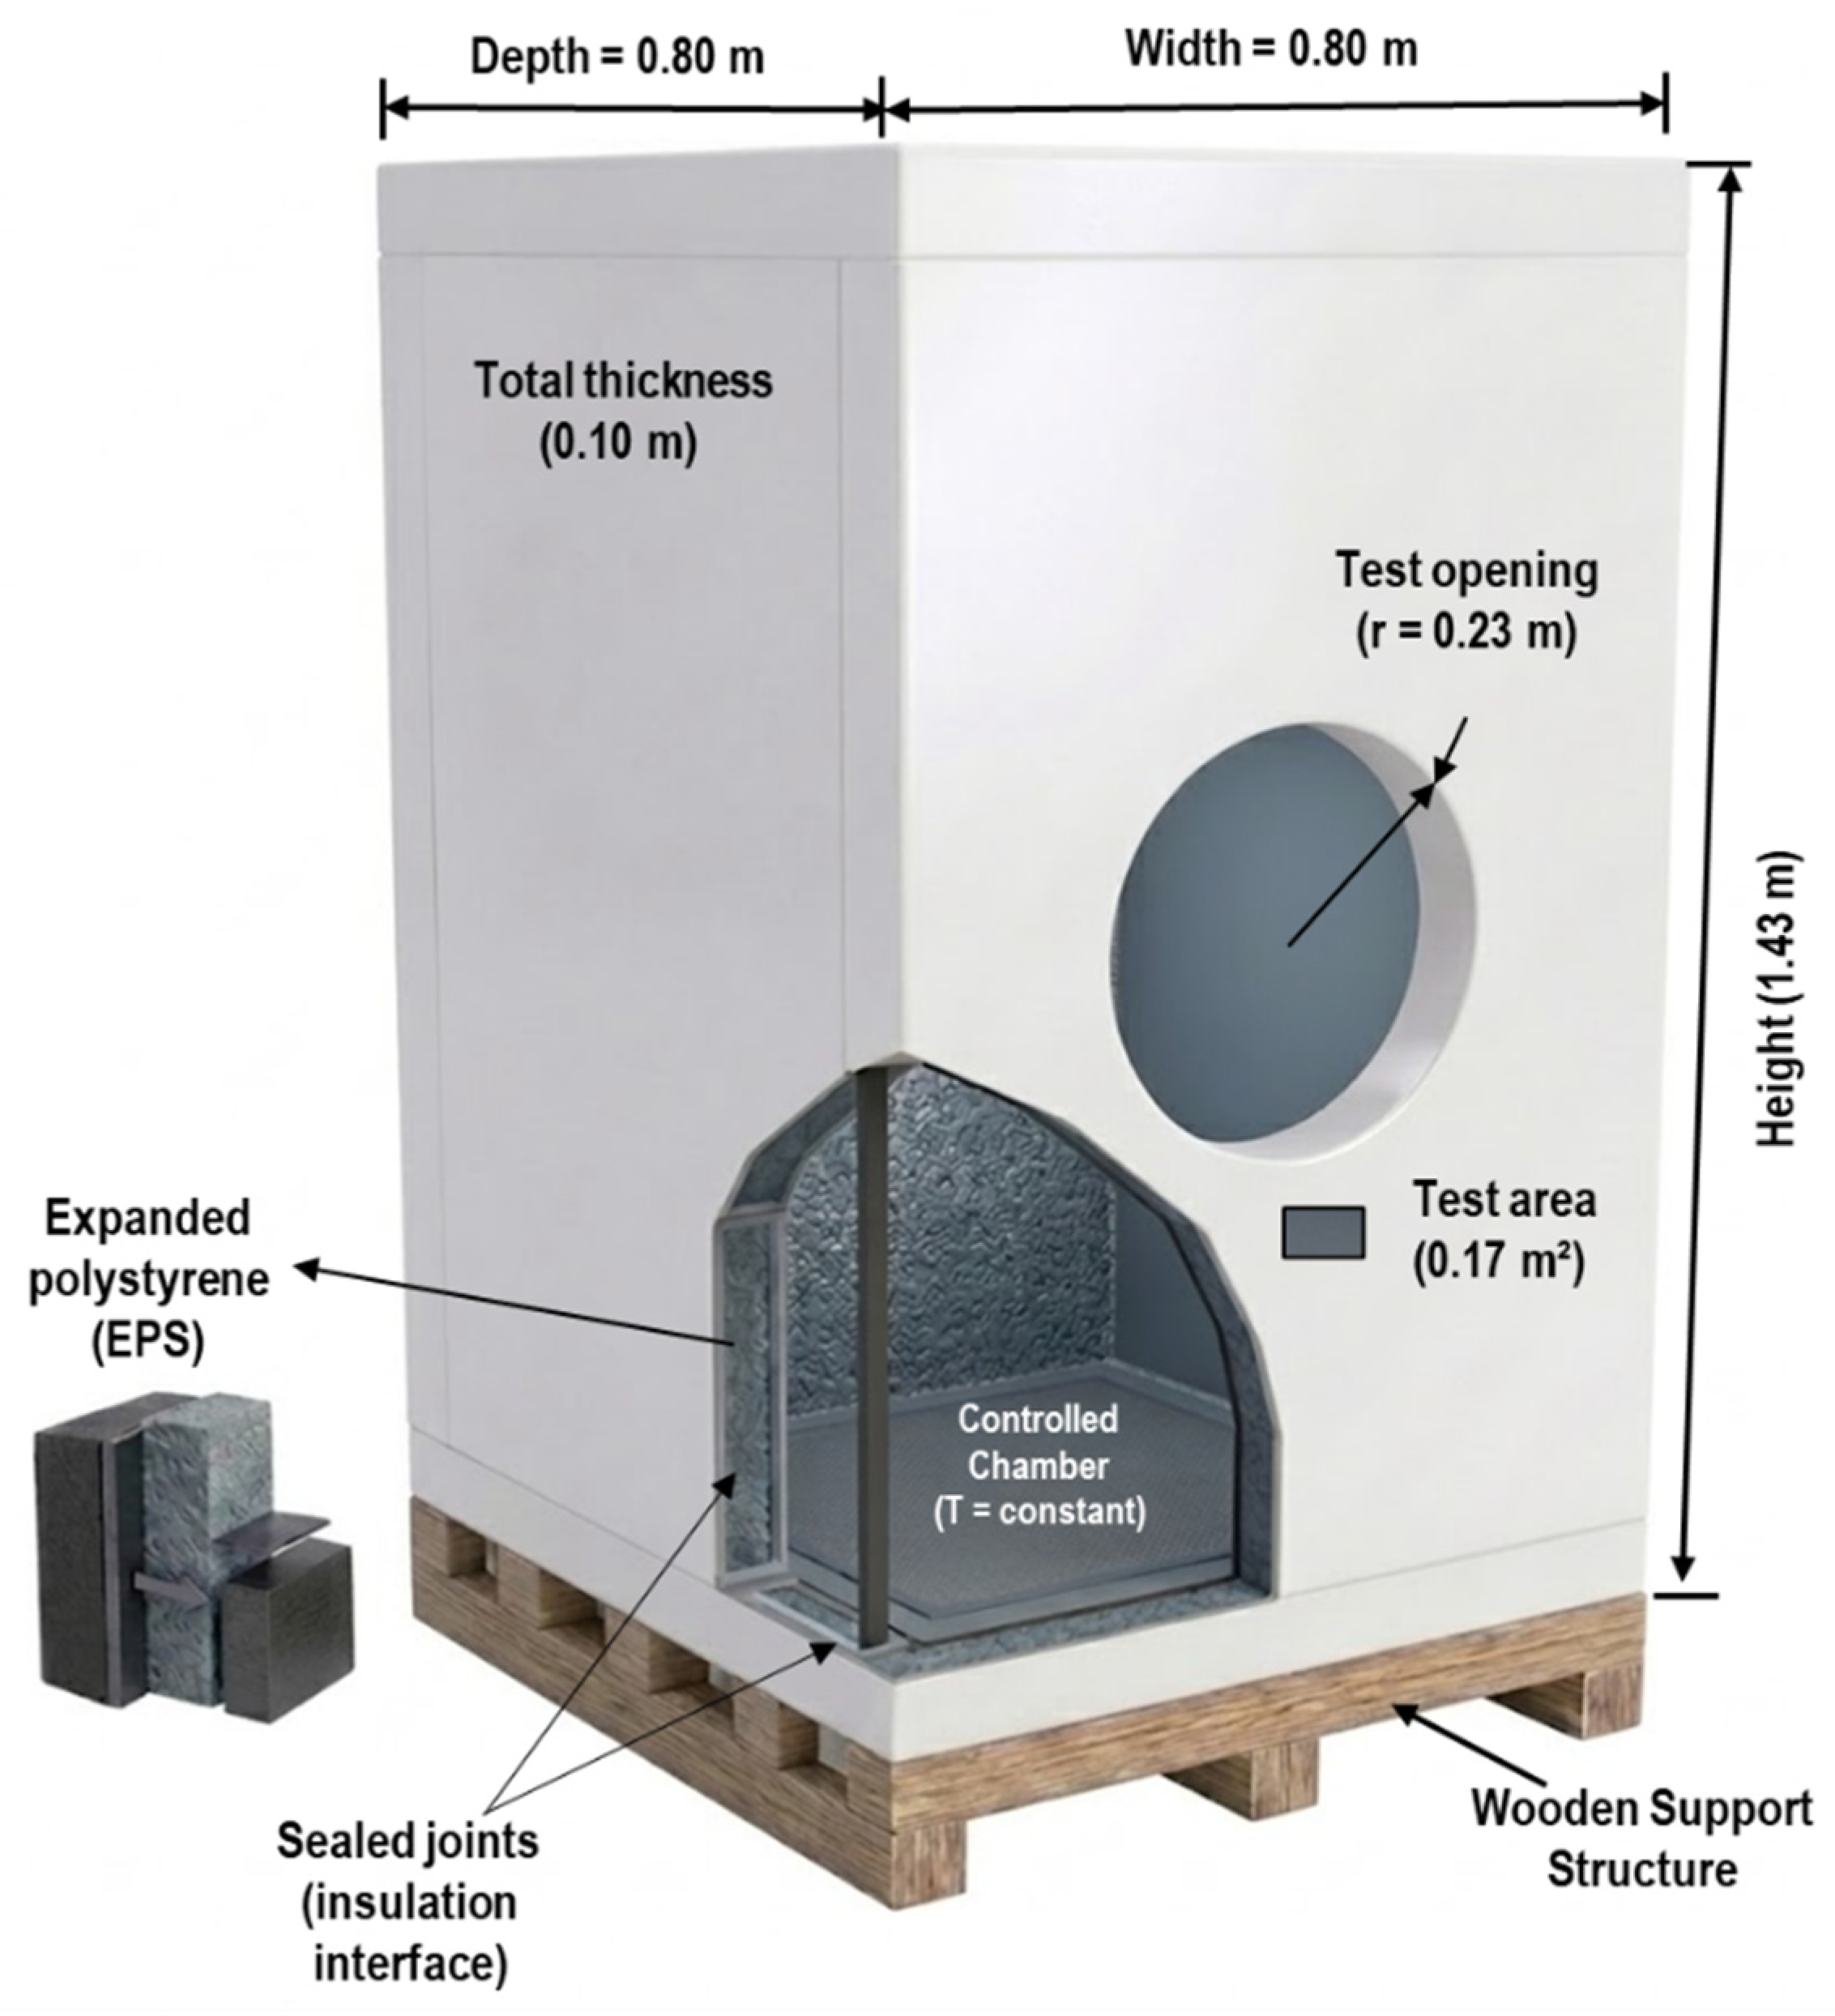
In the specific case of the concrete block assembly, the original rectangular blocks were cut and adapted to fit the circular test opening. The adapted specimen covered the effective circular test area, while the remaining perimeter interface between the specimen and the EPS module wall was sealed using insulating foam and adhesive tape. This sealing procedure was applied to reduce air leakage and minimize uncontrolled thermal bypasses at the specimen edges. Although the circular geometry was selected to reduce corner-related edge effects, a possible localized edge effect at the interface between the adapted block and the surrounding insulation was considered and is schematically indicated in Figure 2. This detail is included to clarify how the rectangular concrete blocks were adjusted to the circular test section and how the perimeter interface was treated during installation.
Figure 2.
Schematic representation of the installation of the cut/adapted concrete block specimen in the circular test opening. The left panel shows the front view of the circular test area, with an effective radius of 0.23 m and an approximate test area of 0.17 m2. The right panel shows the cross-sectional arrangement of the concrete block between the EPS module walls, including the perimeter seal made with insulating foam and adhesive tape. The diagram also indicates the heat-flow direction and the possible localized edge effect at the interface between the adapted block and the insulation.
2.2. Experimental System Configuration and Instrumentation
The experimental system operated as a thermally controlled indoor volume exposed to outdoor environmental conditions. Unlike conventional dual-chamber or guarded hot-box systems, the present configuration used a single insulated enclosure with active indoor temperature control and an interchangeable test section. Therefore, the objective was not to reproduce a fully standardized hot-box apparatus, but to provide a lower-complexity experimental framework for comparing the dynamic thermal response of complete construction assemblies under equivalent boundary conditions [9,10].
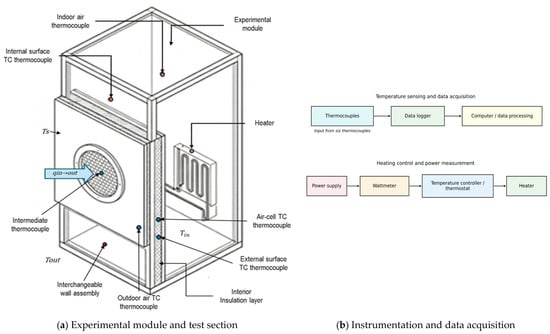
The system integrated three main components: a thermally insulated module acting as the control volume, an electric heating system used to maintain the indoor temperature setpoint, and a monitoring system for temperature and energy measurements. Under controlled operation, the electrical energy required to maintain indoor thermal equilibrium was associated with heat losses through the tested construction assembly and residual losses through the insulated module. These residual losses were quantified through a calibration procedure, as described in Section 2.4, and accounted for in the energy analysis presented in Section 3. The experimental system was designed to evaluate each construction assembly under equivalent internal conditions. Accordingly, the same module, heater, sensor distribution, data acquisition system, and data processing criteria were used for all tests [8,11]. This approach reduced variability associated with the experimental setup and allowed the observed differences in temperature response and heating energy demand to be attributed primarily to the tested assembly [25,26]. The experimental setup and instrumentation scheme are shown in Figure 3. The figure identifies the experimental module, the interchangeable wall assembly used as the test section, the main temperature measurement locations, and the heat transfer direction considered in the analysis.
Figure 3.
Experimental setup and instrumentation scheme used to evaluate heat transfer through the tested construction assembly. (a) Experimental module and interchangeable wall assembly used as the test section, showing the location of temperature measurements, including Tin, Tout, and Ts, and the direction of heat flux, qin→out. (b) Instrumentation and data acquisition system, including temperature sensing, data logging, heating control, and power measurement configuration.
Temperature measurements were obtained using Type K thermocouples distributed across critical locations in the experimental system [10,29]. Up to ten sensors were deployed to measure air and material temperatures. The measurement points included indoor air at the module center, outdoor air shielded from direct radiation, internal and external assembly surfaces, edge temperatures near the circular interface, and intermediate points within the core layer or cavity of the tested system [24]. The thermocouples were connected to digital data loggers, and temperature data were recorded every 5 min. This interval was selected to capture transient temperature variations while keeping the data volume manageable for multi-day experimental campaigns. Before testing, all temperature sensors were checked against a reference thermometer under stable temperature conditions. The uncertainty associated with the Type K thermocouples was considered according to the manufacturer specifications. For the uncertainty analysis, a conservative tolerance of ±1.1 °C or ±0.4% of the measured value was adopted for Type K thermocouples with Special Limits of Error [29,30]. Electrical energy consumption was measured with a wattmeter connected exclusively to the electric heating system. The data acquisition devices, temperature sensors, and auxiliary monitoring equipment were powered by an independent electrical circuit and were not included in the recorded heating energy demand. This ensured that the measured consumption corresponded only to the energy required to maintain the indoor temperature setpoint, avoiding overestimation from auxiliary instrumentation loads. The wattmeter was verified prior to the tests using a known resistive electrical load. A conservative wattmeter accuracy of ±1% of the measured value was adopted for the uncertainty analysis and incorporated into the energy-based indicators. Geometric measurements of the module and test section were obtained using measuring tape and calipers. The radius of the circular test section was measured at different angular positions, and the average value was used to calculate the effective test area. This procedure allowed the uncertainty associated with the circular test area to be included in the total uncertainty assessment [30].
Although the proposed configuration allows the dynamic thermal response of different construction assemblies to be compared under equivalent experimental conditions, its applicability must be interpreted within the scope of a low-complexity comparative method rather than as a substitute for standardized guarded hot-box or calibrated hot-box testing. In contrast to standardized hot-box methods, the present single-module configuration does not fully control all boundary heat losses, local edge effects, possible thermal bridges at the interface between the test specimen and the EPS enclosure, surface heat-transfer coefficients, or surface air velocity on both sides of the assembly. In addition, the thermal balance conditions achieved in this setup are less restrictive than those required in standardized steady-state apparatuses. Therefore, the proposed method is most appropriate for comparative studies, preliminary screening of construction assemblies, and energy-based evaluations performed under the same mounting, sealing, instrumentation, and indoor temperature-control protocol. The resulting indicators, including corrected heating energy demand and DTPI, should be interpreted primarily as relative performance metrics for comparing assemblies tested under identical conditions, rather than as certified absolute thermal transmittance values. This limitation is addressed by applying the same experimental configuration to all assemblies and by correcting residual module losses through the calibration procedure described in Section 2.4.
2.3. Experimental Procedure
The experimental procedure was designed to ensure repeatability and comparability across the tested assemblies [9,23]. Indoor air temperature was controlled using an electric heater with a nominal power of 500–600 W. The heater was regulated by a thermostat with a setpoint of 18 °C. Due to the thermal response of the system and thermostat cycling, the average indoor air temperature remained within a narrow range of approximately 19–20 °C during the monitoring periods. This stable indoor condition provided a consistent internal thermal boundary for comparative analysis [25,26]. The module was installed outdoors in a protected location to avoid direct solar radiation and strong wind exposure, thereby reducing the influence of non-conductive heat-transfer mechanisms during this first validation stage. This configuration was intentionally selected as a controlled outdoor validation condition to focus primarily on transient conductive heat transfer through the tested assemblies. Diffuse solar radiation was not actively controlled or measured as an independent variable and was therefore not included explicitly in the DTPI calculation. Nevertheless, its potential influence was minimized by the protected location of the module and by focusing the main comparative analysis on heating-dominated periods, particularly nighttime conditions, when solar gains are absent and the indoor–outdoor thermal gradient is mainly driven by heating demand. This approach does not eliminate the relevance of solar radiation and wind in real facades; rather, it isolates the conductive response of the assemblies during the first validation stage of the proposed method. Future applications of the methodology may incorporate controlled or measured solar radiation and wind exposure to evaluate more complex facade behavior under full environmental forcing [23,27]. Before each test, the construction assembly was installed in the circular opening and sealed around its perimeter using insulating foam and adhesive tape. Double perimeter sealing and consistent installation procedures were used to reduce air infiltration and localized thermal bypasses around the test section [9,19,25]. Although a pressurization test was not performed, all assemblies were tested under the same sealing protocol; therefore, any residual infiltration effect was treated as a systematic experimental condition rather than as a variable among assemblies [26].
After installation, the system was allowed to operate until the indoor temperature reached the control range. Data collection was then conducted over multiple days to capture variations in outdoor temperature and to reduce the influence of short-term fluctuations on the comparative thermal performance analysis. Temperature and energy data were recorded simultaneously throughout the monitoring period. For analysis, only periods in which the outdoor temperature was below the measured indoor air temperature were considered. This criterion ensured a consistent heat transfer direction from the interior of the module toward the exterior environment [10,21,22,25,26]. Three representative construction assemblies were evaluated sequentially under equivalent operating conditions: a double gypsum board system, a 10 cm hollow concrete block system, and a concrete block system with external insulation. Each assembly was tested using the same experimental module, heating system, sensor configuration, sampling interval, and analysis criteria [9,24,25,26,30]. To support the comparison among the evaluated construction assemblies, their main physical characteristics were summarized before the thermal-performance analysis. Table 1 presents the nominal total thickness, estimated surface density, estimated areal thermal capacity, estimated steady-state U-value, and main material layers of the three tested assemblies. These values were estimated from the nominal dimensions of the specimens and representative thermophysical properties reported in technical documentation, standards, and literature [31,32]. Therefore, they are intended to characterize the assemblies and support the comparative interpretation of the results, rather than to represent independently measured thermophysical properties.
Table 1.
Physical characteristics of the evaluated construction assemblies.
2.4. Calibration of Residual Module Losses
A calibration test was performed to quantify the residual heat losses associated with the insulated module before evaluating the construction assemblies. For this purpose, the circular test opening was sealed using an EPS panel with the same thickness as the module envelope, namely 0.10 m. This configuration represented the reference condition of the module without an installed construction assembly. During the calibration test, indoor temperature was maintained using the same electric heating system, while outdoor temperature and heating energy consumption were recorded with the same instrumentation and sampling interval applied during the assembly tests [25,30].
Since the test section was sealed with EPS, the measured heating demand during this stage was used to characterize residual thermal losses through the module envelope, joints, support structure, and remaining non-tested surfaces [9,23,24]. The calibration data were used to determine the effective residual heat loss coefficient of the module, Kres. This coefficient was subsequently applied in the mathematical correction of the assembly energy demand, as described in Section 2.7. This calibration procedure reduced the influence of parasitic losses and improved the comparability of the results among construction assemblies [25,26,30].
2.5. Instrumental Uncertainty and Error Control
An uncertainty assessment was included to quantify the influence of instrumental precision on the calculated thermal performance indicators. The main sources of uncertainty were associated with temperature measurements, electrical power measurements, time integration of heating energy, and the effective area of the circular test section. The uncertainty of temperature measurements was based on the tolerance of the Type K thermocouples [29,30]. The uncertainty of heating energy measurement was based on wattmeter accuracy and the sampling interval used for numerical integration. The uncertainty of the test area was calculated from the uncertainty in the measured radius of the circular opening. These individual uncertainty sources were propagated to the derived indicators using a first-order Taylor series approach, as detailed in Section 2.9. The instrumental uncertainty values considered in the analysis are summarized in Table 2.
Table 2.
Instrumental uncertainty considered in the experimental analysis.
The resulting uncertainty was reported together with the energy-based performance indicators. This procedure ensured that the comparative analysis considered both the measured differences among assemblies and the uncertainty associated with the experimental system.
2.6. Heat Transfer Model
The thermal behavior of the tested construction assemblies was interpreted as a transient heat transfer process. Since each assembly was installed in the circular test section of a highly insulated module, the dominant heat transfer pathway was assumed to occur across the assembly thickness [30]. Lateral heat losses were reduced by the test-section geometry and the surrounding insulation; however, they were not assumed to be negligible and were addressed through the residual loss correction described in Section 2.7. For the experimental interpretation, heat transfer across the tested assembly was considered predominantly one-dimensional [22,33]. Under this assumption, transient heat conduction can be expressed as Equation (1).
where is the material density, is the specific heat capacity, is the thermal conductivity, is the temperature, is time, and is the spatial coordinate across the assembly thickness. This formulation describes the time-dependent propagation of heat through the construction system and supports the interpretation of thermal inertia, heat storage, and delayed temperature response [22].
2.7. Energy Balance and Residual Loss Correction
The proposed methodology is based on an energy balance applied to the experimental module. Under controlled indoor temperature conditions, the electrical power supplied to the heating system compensates for heat transfer through the tested assembly and residual losses through the insulated module [25,26]. Short-term energy storage effects within the control volume were minimized by analyzing stabilized daily monitoring periods [22,23]. Residual module losses were estimated using the calibration coefficient , obtained from the calibration test described in Section 2.4:
where is the residual heat loss rate through the insulated module, is the indoor air temperature, and is the outdoor air temperature at time . The corrected power associated with heat transfer through the tested assembly was calculated as:
where is the net power associated with the tested construction assembly after subtracting residual module losses, and is the measured electrical power supplied to the heating system. Since measurements were recorded at discrete time intervals, the corrected net heating energy was calculated as:
where is the corrected net heating energy, is the heating power measured at each time interval, and are the indoor and outdoor air temperatures at the same interval, is the sampling interval expressed in hours, and is the number of measurements in the analysis period. This correction separates the energy associated with the tested construction assembly from the residual losses of the experimental module, providing a system-level performance indicator directly linked to the heating energy required to maintain controlled indoor conditions [30,33].
2.8. Thermal Performance Indicators
Thermal performance was evaluated using temperature-based and energy-based indicators. Temperature-based indicators were used to describe the transient thermal response of each assembly, whereas energy-based indicators were used to quantify the corrected heating energy required to maintain controlled indoor conditions.
2.8.1. Temperature-Based Indicators
The temperature-based analysis considered indoor air temperature, outdoor air temperature, internal and external surface temperatures, and intermediate temperatures recorded within the tested system. The instantaneous surface temperature gradient across the assembly was calculated as:
where is the surface temperature gradient across the assembly, is the internal surface temperature, and is the external surface temperature of the assembly. The dynamic response of each assembly was also assessed through thermal lag and temperature damping. Thermal lag was defined as the time delay between a peak or valley in the external thermal excitation and the corresponding response observed on the internal surface. Temperature damping was evaluated by comparing the amplitude of temperature fluctuations at the external and internal surfaces of the assembly. These indicators provide information on thermal inertia, heat storage, and attenuation of outdoor temperature variations as heat propagates through the system. Indoor temperature stability was assessed using the standard deviation of the indoor air temperature during each test to verify that stable internal boundary conditions were maintained [25,26,30].
2.8.2. Energy-Based Indicators and Normalization
The primary energy-based indicator was the corrected net heating energy consumption, , expressed in kWh. This value represents the electrical energy associated with heat transfer through the tested assembly after subtracting residual module losses. The electrical consumption of the data acquisition system, sensors, and auxiliary monitoring equipment was excluded from the measured heating energy [21,25,30,33]. To account for variations in outdoor temperature conditions, heating degree-hours were calculated using the measured indoor and outdoor air temperatures:
where represents the heating degree-hours, expressed in , is the measured indoor air temperature, is the outdoor air temperature, is the sampling interval expressed in hours, and is the number of measurements in the analysis period. The use of measured indoor temperature instead of only the nominal thermostat setpoint provides a more representative normalization basis because it reflects the actual internal thermal condition maintained during the tests.
The normalized energy indicator, defined in this study as the Dynamic Thermal Performance Index, was calculated as:
where is the Dynamic Thermal Performance Index, is the corrected net heating energy expressed in kWh, is the effective area of the circular test section, and is the heating degree-hours calculated during the same analysis period. The factor 1000 converts from kWh to Wh; therefore, the units of are Wh/(m2·°C·h). This index expresses the corrected heating energy required per unit area and per unit of outdoor thermal severity. While degree-hour methods are commonly based on simplified temperature–energy relationships, their use in this study provides a reference baseline against which deviations associated with thermal mass, heat storage, and phase-shift effects can be evaluated. Therefore, differences in among assemblies are interpreted as indicators of their system-level thermal response under the same experimental framework [22,23,25,26].
2.9. Data Processing and Comparative Analysis
Temperature and power data were processed using the same workflow for all tested assemblies. The raw records were first reviewed to identify valid heating periods, defined as intervals in which the outdoor air temperature was lower than the measured indoor air temperature. This criterion ensured that the heat transfer direction was predominantly from the interior of the module toward the exterior environment. For each valid interval, residual module losses were estimated using the calibration coefficient and subtracted from the measured heating power according to Equation (4). The corrected net heating energy, was then calculated by summing the corrected heating power over the daily monitoring period [34]. Heating degree-hours were calculated using the measured indoor and outdoor air temperatures for the same valid intervals. Daily values of , , and were calculated for each construction assembly and used for comparative analysis under variable outdoor conditions. The uncertainty of the calculated indicators was estimated using the propagation procedure described in Section 2.6 and reported together with the energy-based results. This processing sequence allowed the construction assemblies to be compared on a corrected and normalized basis, reducing the influence of outdoor temperature variability, residual module losses, and auxiliary electrical loads [21,25,26,30].
3. Results and Discussion
3.1. Thermal Boundary Conditions and Experimental Stability
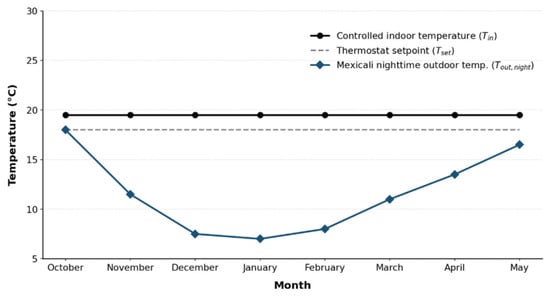
The reliability of the proposed experimental approach was first examined by verifying the thermal boundary conditions used during the heating analysis. Because the method depends on maintaining a stable indoor environment while the tested assembly is exposed to outdoor temperature variation, indoor temperature control is essential for interpreting both transient heat transfer and heating energy demand [22,23,25,26,30]. To place the experiment within the seasonal climate of Mexicali, the indoor reference temperature was compared with average nighttime outdoor temperatures from October to May, as shown in Figure 4 [27,28]. The experimental indoor reference was set at 19.5 °C, consistent with the stable range observed during testing, whereas the thermostat setpoint was maintained at 18 °C. The difference between the thermostat setting and the measured indoor condition is attributed to the thermal response of the module and thermostat cycling during operation [25,29].
Figure 4.
Seasonal thermal boundary conditions for the experimental heating analysis in Mexicali.
The controlled indoor temperature was fixed at 19.5 °C based on the indoor range observed during the experiment, while the thermostat setpoint was maintained at 18 °C. Outdoor values correspond to average nighttime temperatures in Mexicali from October to May, averaged across the two studied cold seasons: 2023–2024 and 2024–2025 [25,26,27,28,29]. The largest thermal gradients occur in December and January, when nighttime outdoor temperatures decrease to approximately 7.5 °C and 6.5 °C, respectively [28]. Under these conditions, the temperature difference between the module interior and the outdoor environment reaches approximately 12–13 °C, providing the most representative heating scenario for evaluating heat losses from the module toward the exterior. The comparison shows that the experimental configuration generated a clear heating gradient during the coldest months. This condition provides the thermal driving force required to evaluate heat transfer through the tested construction assemblies under heating-dominated operation [22,23]. Since the indoor condition remained stable, subsequent differences in surface temperatures and heating energy demand can be interpreted mainly because of the thermal response of each assembly rather than as an artifact of internal temperature fluctuations. Overall, these results support the use of the experimental module as a controlled framework for comparing the dynamic performance of construction assemblies under equivalent indoor conditions and representative outdoor thermal exposure [30,33].
3.2. Dynamic Temperature Response of the Tested Assemblies
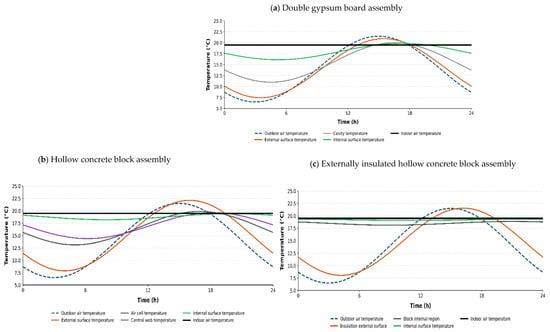
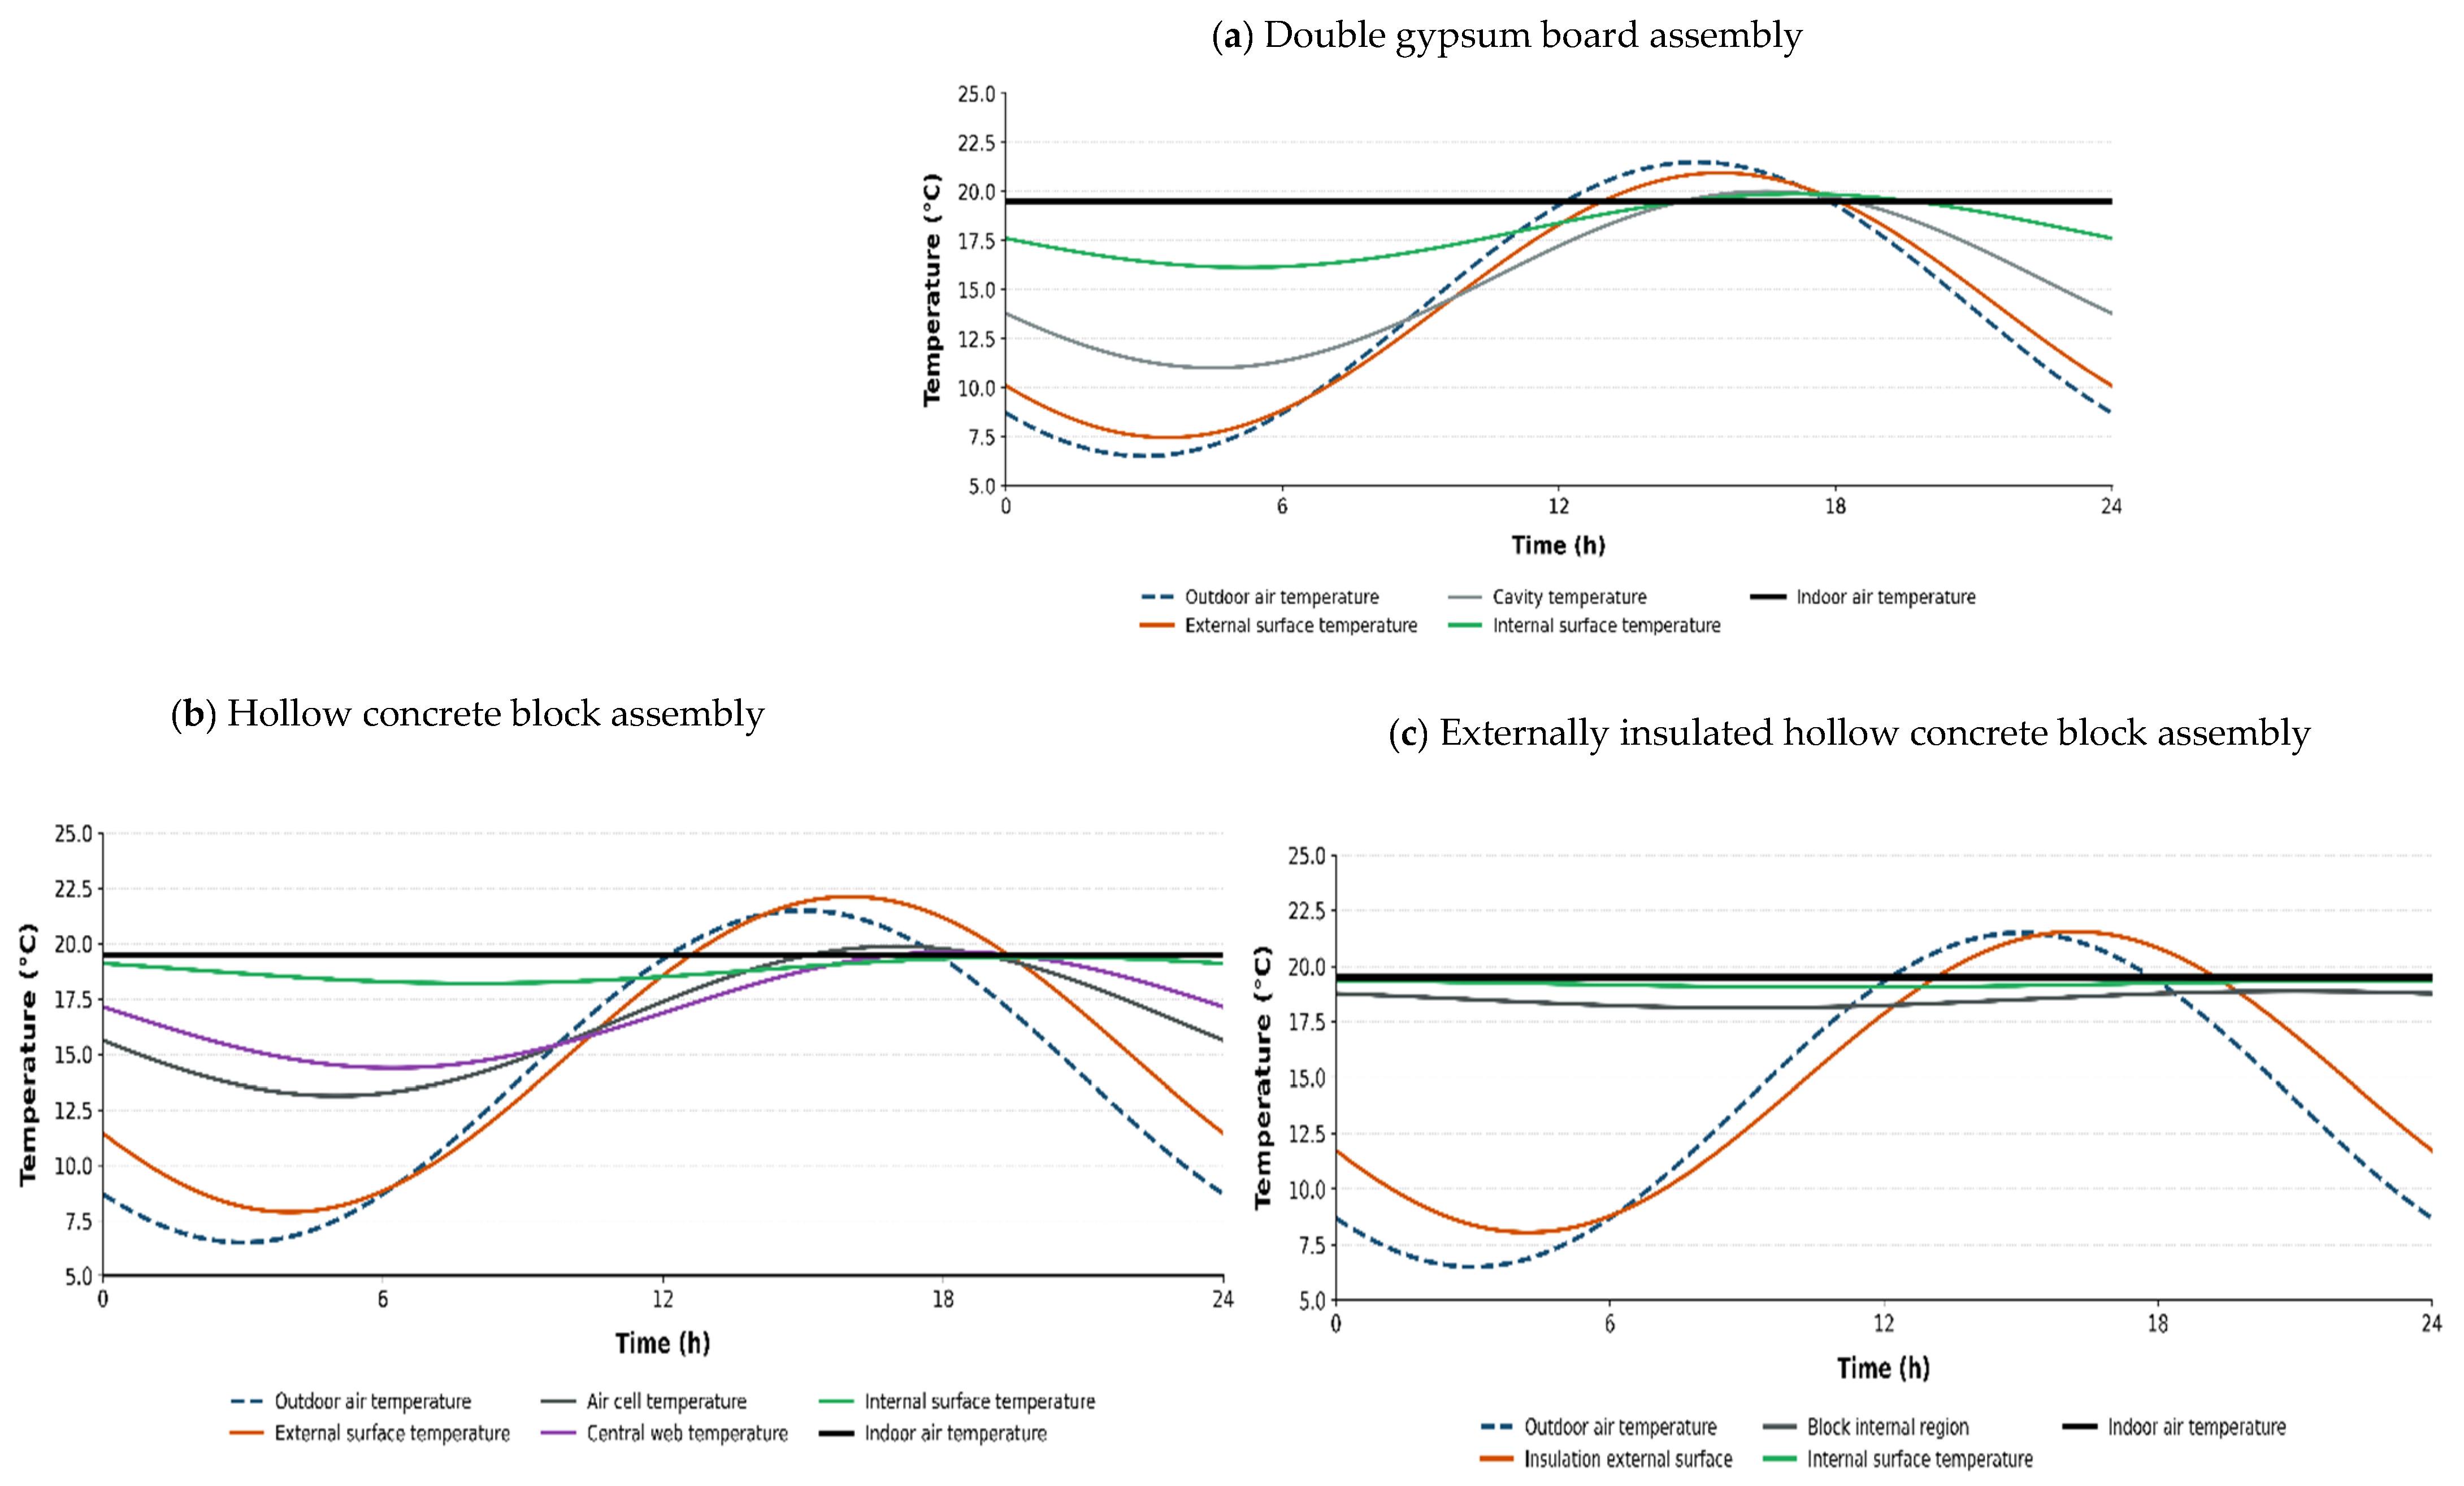
The transient thermal response of the tested assemblies was analyzed using multipoint temperature measurements obtained from the indoor air, outdoor air, external surface, internal surface, and intermediate regions of each construction system. This approach made it possible to examine not only the temperature difference between the indoor and outdoor environments, but also the way heat propagated through surfaces, cavities, webs, and insulation layers under controlled indoor conditions [25,33]. This was consistent with the purpose of the experimental setup: to evaluate complete construction assemblies rather than isolated material samples. As shown in Figure 5, the multipoint temperature profiles reveal clear differences in the transient response of the three tested assemblies. The figure compares the temperature evolution across the double gypsum board assembly, the hollow concrete block assembly, and the externally insulated hollow concrete block assembly under controlled indoor conditions [11,22,23,26].
Figure 5.
Transient temperature profiles measured across the tested construction assemblies under controlled indoor conditions: (a) double gypsum board assembly, showing outdoor air, external surface, cavity, internal surface, and indoor air temperatures; (b) hollow concrete block assembly, showing outdoor air, external surface, air cell, central web, internal surface, and indoor air temperatures; and (c) externally insulated hollow concrete block assembly, showing outdoor air, external insulation surface, block internal region, internal surface, and indoor air temperatures.
The double gypsum board assembly exhibited the fastest response to outdoor temperature variations, as shown in Figure 5a. The external surface temperature closely followed the outdoor air temperature, while the cavity and indoor-facing surface showed a more attenuated response. This behavior is consistent with a lightweight assembly with limited thermal storage capacity, where outdoor fluctuations are transmitted relatively quickly through the system. Although the indoor air temperature remained controlled, the temperature gradient across the gypsum assembly indicates lower thermal inertia than in the concrete-based systems. The hollow concrete block assembly showed a more distributed thermal response, as shown in Figure 5b. In contrast to the gypsum board assembly, the temperatures measured in the internal air cell and central web did not follow the outdoor fluctuations as directly as the external surface. This suggests that the block geometry, internal cavities, and concrete mass contributed to delaying and redistributing heat transfer across the assembly. Therefore, the hollow concrete block should not be interpreted as a homogeneous layer, but as a heterogeneous system in which solid webs and air cavities interact during transient heat transfer [34].
The externally insulated hollow concrete block presented the most stable indoor-side behavior, as shown in Figure 5c. The exterior insulation layer reduced the direct influence of outdoor temperature fluctuations on the concrete block, allowing the block internal region, internal surface, and indoor air to remain close to the controlled indoor condition. In this configuration, the insulation acted as an external protective layer, while the concrete mass remained thermally buffered toward the indoor side. This confirms the relevance of insulation placement, since exterior insulation limits heat exchange at the external boundary and helps preserve the thermal stability of the indoor-facing region.
A comparison of the three assemblies shows a clear progression in dynamic thermal stability. The gypsum board assembly responded rapidly to outdoor variations, the hollow concrete block delayed and redistributed heat through its mass and cavities, and the externally insulated block minimized internal temperature fluctuations. Overall, the profiles demonstrate that the dynamic thermal performance of a construction assembly depends not only on nominal thermal resistance, but also on mass, internal geometry, cavities, interfaces, and insulation position. These findings indicate that steady-state indicators should be complemented with dynamic experimental assessment when evaluating complete construction systems under variable environmental conditions [12,22,23,35,36].
3.3. Heating Energy Demand Under Variable Outdoor Conditions
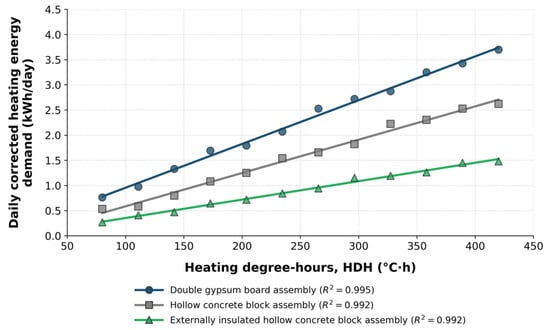
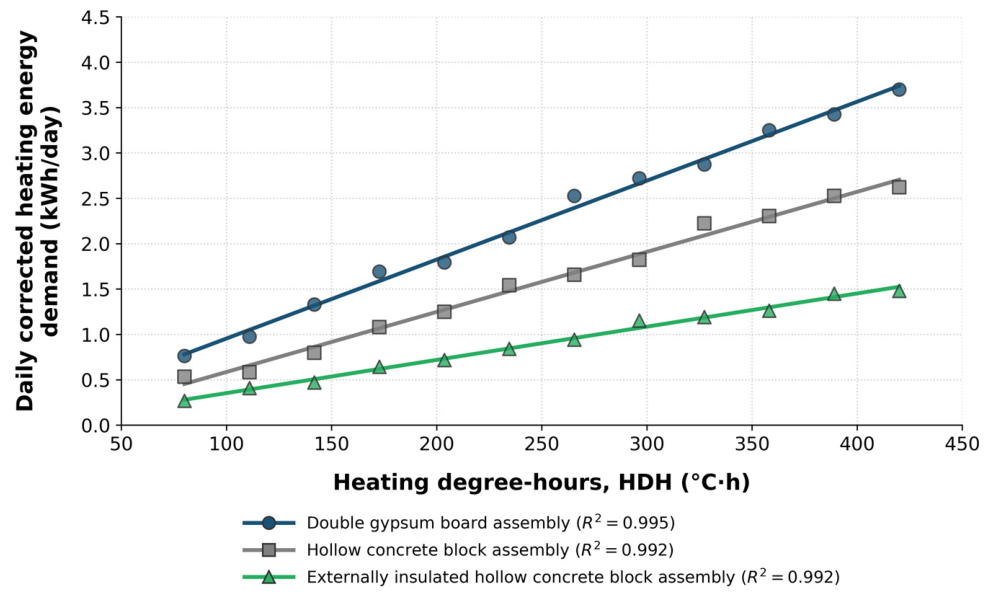
Heating energy demand was evaluated in relation to heating degree-hours (HDHs) to account for variations in outdoor thermal severity during the monitoring period. This approach allows for a consistent comparison of energy consumption, since each construction assembly was exposed to slightly different environmental conditions. As shown in Figure 6, the relationship between HDH and corrected heating energy demand provides a direct way to compare the energy sensitivity of the tested assemblies under variable outdoor conditions [21,22,23]. Each point represents one experimentally monitored day after residual-loss correction, and the trend lines indicate the energy sensitivity of each assembly to changes in HDH.
Figure 6.
Heating energy demand as a function of heating degree-hours. Relationship between heating degree-hours (HDHs) and daily corrected heating energy demand for the tested construction assemblies. Each point represents one experimentally monitored day after residual-loss correction, and the trend lines indicate the energy sensitivity of each assembly to changes in HDH. A steeper slope reflects greater energy demand, whereas a lower slope indicates better thermal performance.
A clear positive relationship was observed between heating degree-hours and corrected heating energy demand. As outdoor thermal demand increased, the energy required to maintain the indoor setpoint also increased. However, the rate of this increase differed among the tested assemblies, indicating that heating demand depends not only on external conditions, but also on the thermal characteristics of each system. The double gypsum board assembly showed the highest sensitivity to outdoor conditions, with a steeper increase in energy demand as HDH increased. This behavior is consistent with its low thermal mass and limited ability to buffer temperature variations [36,37,38]. The hollow concrete block assembly exhibited a more moderate response.
The presence of internal cavities and higher thermal mass contributed to a partial attenuation of heat transfer, resulting in a lower rate of increase in energy demand compared with the gypsum system [37]. The externally insulated concrete block showed the most favorable performance, with the lowest sensitivity to changes in HDH. The external insulation reduced the impact of outdoor temperature fluctuations, leading to a more gradual increase in heating demand. This behavior reflects the improved thermal stability of the assembly and the reduced transmission of heat losses toward the exterior. These results highlight the importance of combining temperature-based analysis with energy measurements. While temperature profiles describe the physical thermal response of the assemblies, corrected heating energy provides a direct measure of their operational performance under real conditions [36,37,38,39].
3.4. Integrated Dynamic Thermal Performance Assessment
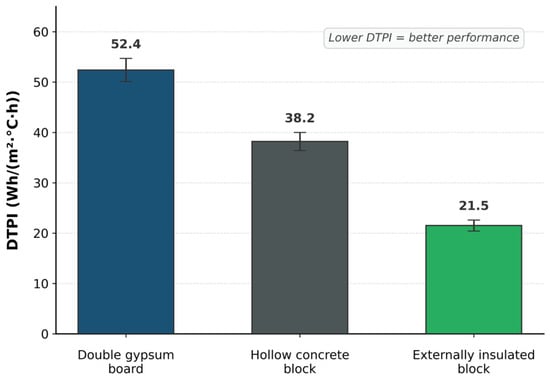
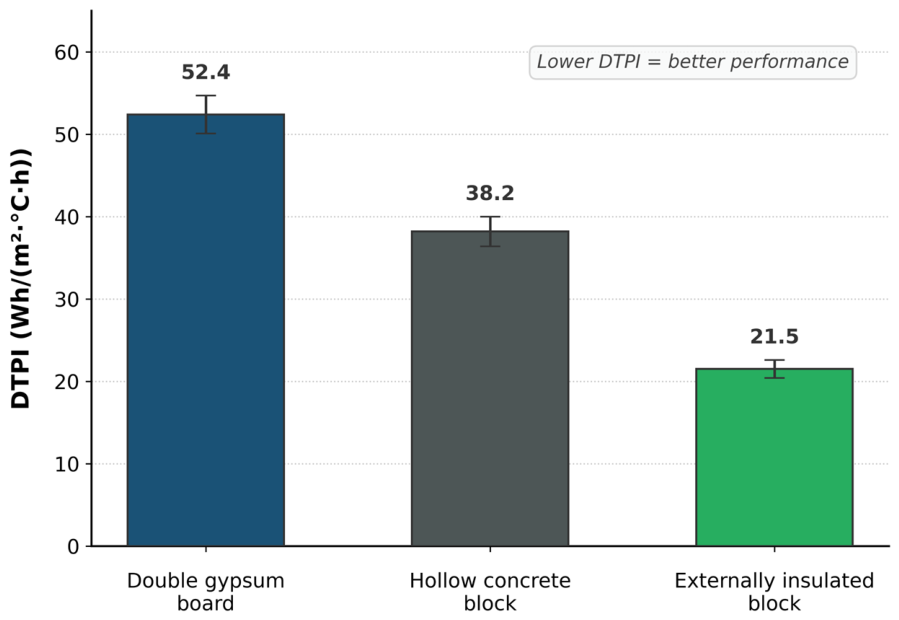
The experimentally corrected heating energy was normalized by the effective test area and the heating degree-hours to obtain the Dynamic Thermal Performance Index (DTPI). This indicator allows the tested assemblies to be compared under variable outdoor conditions using a common energy-based reference [21,36]. A lower DTPI denotes lower corrected heating energy per unit area and per unit of outdoor thermal severity. Figure 7 compares the normalized performance of the three assemblies, showing how their energy demand varied after accounting for differences in heating degree-hours [22,37,38,39,40].
Figure 7.
Dynamic Thermal Performance Index (DTPI) of the tested construction assemblies. Error bars represent propagated instrumental uncertainty.
DTPI enables a direct comparison of assembly-level performance under dynamic conditions. Unlike conventional steady-state indicators, it reflects the combined influence of thermal resistance, thermal mass, heat storage, internal cavities, damping behavior, and insulation placement. The externally insulated hollow concrete block achieved the most favorable dynamic performance among the tested systems, which is consistent with the temperature profiles and the energy-demand analysis. The exterior EPS layer reduced the effect of outdoor fluctuations on the concrete mass and helped maintain a more stable indoor-facing surface. The hollow concrete block showed an intermediate response associated with its mass and internal geometry, while the double gypsum board assembly presented the fastest response to outdoor changes. This behavior is consistent with previous studies showing that envelope thermal properties, thermal mass, and insulation strategies influence dynamic thermal response and energy demand [37,39,41]. The main thermal and energy indicators derived from the experimental records are summarized in Table 3, bringing together corrected heating energy, outdoor thermal severity, normalized performance, thermal lag, damping behavior, and final performance ranking.
Table 3.
Summary of dynamic thermal performance metrics for the tested construction assemblies.
The integrated comparison shows that the tested assemblies exhibited different thermal and energy-performance responses. The externally insulated hollow concrete block reduced the mean corrected heating energy by approximately 59% compared with the double gypsum board assembly. The double gypsum board assembly reacted rapidly to outdoor temperature variations, which is consistent with its lower thermal storage capacity and higher sensitivity to external boundary conditions. The hollow concrete block showed a slower response, as its mass and internal cavities contributed to delaying and redistributing heat transfer. The externally insulated hollow concrete block presented the most stable indoor-side behavior and the lowest normalized energy demand among the evaluated assemblies.
These results indicate that the DTPI can be used as a complementary indicator for comparing complete construction assemblies under dynamic outdoor conditions. The index is not intended to replace standardized thermal parameters, such as steady-state transmittance values, but to provide additional information based on measured energy demand. This is relevant because the performance of a wall or envelope component depends not only on the properties of each material, but also on the way materials are arranged, the presence of cavities, the thermal inertia of the system, and the interaction between the assembly and the outdoor environment [12,23,36,42].
The findings also suggest that improving envelope performance can reduce the heating energy required to maintain indoor comfort. In practical terms, assemblies with lower corrected heating energy and lower DTPI values may contribute to lower electricity consumption and lower operating costs during the service life of a building. This is particularly relevant in the context of energy efficiency and energy-transition strategies, where reducing demand at the building-envelope level represents a direct pathway to decreasing pressure on the electrical system and limiting energy-related emissions [37,43,44]. As a future research direction, the measured energy-demand data generated by this method could be integrated into building energy simulations and life cycle assessment frameworks to estimate reductions in operational energy use and associated greenhouse gas emissions. This would support material selection, retrofit decisions, and sustainable construction strategies based on measured thermal and energy-performance indicators.
3.5. Methodological Scope, Limitations, and Future Work
The proposed experimental method provides an accessible framework for comparing the dynamic thermal performance of complete construction assemblies; however, its scope should be interpreted within the conditions of the present validation stage. The experiments were conducted under heating-dominated conditions, with the module protected from direct solar radiation and strong wind exposure to isolate conductive heat transfer as much as possible. This configuration was useful for identifying differences in conductive heat-loss behavior among the tested assemblies. Nevertheless, real building envelopes are simultaneously exposed to solar radiation, wind-driven convection, and long-wave radiation exchange. In the present experimental campaign, direct solar radiation was avoided through the protected location of the module; however, diffuse solar radiation was not actively controlled or measured as an independent variable, and minor variations associated with diffuse radiation may have occurred during daytime monitoring. Therefore, the DTPI values reported in this study should be interpreted as comparative indicators obtained under controlled outdoor exposure conditions, primarily during heating-dominated periods and nighttime thermal gradients, when solar gains are absent and conductive heat loss is the dominant mechanism, rather than as direct representations of full facade performance under all realistic weather conditions [24,25].
Another limitation is associated with the intrinsic porosity and air permeability of the tested materials. Although all assemblies were installed using the same double perimeter sealing protocol with insulating foam and adhesive tape, the tested materials have different intrinsic porosities and air permeabilities. In particular, the hollow concrete block assembly may have allowed internal air movement, micro-infiltration, or localized bypass effects that differ from those of the gypsum board system or the externally insulated concrete block system. Since a pressurization test was not performed, the present method cannot fully separate purely conductive heat transfer from possible air leakage or bypass-related heat losses [45]. However, the use of the same experimental module, installation procedure, sealing protocol, instrumentation, and data-processing criteria for all assemblies preserves the comparative validity of the results. Thus, the reported DTPI values should be understood as system-level comparative indicators that may include the combined effect of conductive heat transfer and any residual assembly-specific air leakage under the applied experimental conditions.
The analysis was performed at experimental module scale and included three representative construction assemblies. Future work should extend the method to additional materials and larger assembly areas and conduct sensitivity analyses under controlled solar simulation, including solar-lamp exposure, forced-wind conditions, and measured long-wave radiation exchange. Pressurization or air-leakage testing should also be incorporated to quantify the possible influence of assembly-specific permeability on the measured heat-loss behavior. These additional tests would allow the influence of combined environmental forcing and material-specific air leakage on DTPI to be quantified, thereby improving the transferability of the proposed method to real facade operation. Future studies should also evaluate cooling-dominated summer conditions, particularly considering the hot-arid climate of Mexicali, by adapting the proposed index to cooling degree-hours (CDHs), controlled indoor cooling loads, and the reverse heat-flow direction from the exterior toward the interior. This adaptation would allow the method to assess assembly performance under air-conditioning demand and to compare envelope systems under summer operating conditions. In addition, the resulting cooling-based indicator, together with the heating-based DTPI reported in this study, could be validated against a calibrated digital twin of the experimental module developed in EnergyPlus or TRNSYS [15]. This would allow measured DTPI values to be compared with simulation-based dynamic thermal performance indicators and would support the calibration of material properties, boundary conditions, and heat-transfer assumptions.
4. Conclusions
This study presented a dynamic experimental method for evaluating the thermal performance of construction assemblies based on energy compensation under controlled indoor temperature conditions. The approach combined a highly insulated test module, multipoint temperature measurements, residual loss correction, heating degree-hours, and corrected heating energy demand to compare complete assemblies exposed to variable outdoor conditions. The results showed that the dynamic thermal behavior of the tested assemblies was influenced not only by nominal thermal resistance, but also by thermal mass, internal configuration, cavities, damping behavior, and insulation placement. The double gypsum board assembly exhibited the fastest response to outdoor temperature variations, reflecting its lower thermal inertia. The hollow concrete block assembly showed an intermediate response, as its mass and internal cavities delayed and redistributed heat transfer. The externally insulated hollow concrete block achieved the most favorable performance by maintaining a more stable indoor-side thermal response and the lowest normalized energy demand.
The Dynamic Thermal Performance Index (DTPI) provided a practical energy-based basis for comparing assemblies tested under different outdoor conditions. By normalizing corrected heating energy by test area and heating degree-hours, the index linked transient thermal behavior with measured energy consumption. In this sense, the DTPI complements conventional steady-state indicators, such as R-values and U-values, by providing an assembly-level perspective under dynamic operating conditions. These results indicate that complete construction assemblies can be evaluated through an accessible experimental procedure without relying exclusively on isolated material properties or advanced laboratory infrastructure. This is relevant for the preliminary comparison of local construction systems, retrofit alternatives, and envelope configurations intended to reduce heating energy demand. Overall, the energy-based procedure developed in this study can support envelope design decisions, retrofit evaluation, and the selection of construction systems with improved thermal stability and lower heating energy demand, while the methodological scope and future validation needs are addressed in Section 3.
Author Contributions
Conceptualization, M.E.R.-L., R.O.-C., F.N.M.-R. and J.A.N.-L.; methodology, R.O.-C., M.E.R.-L., D.R.B.-G., J.R.A.-B. and J.A.N.-L.; software, D.R.B.-G., J.R.A.-B. and M.A.C.-O.; validation, R.O.-C., F.N.M.-R., G.T.-H., J.A.A.-G., J.A.N.-L. and M.E.R.-L.; formal analysis, R.O.-C., M.A.C.-O., D.R.B.-G., J.A.N.-L. and M.E.R.-L.; investigation, R.O.-C., D.R.B.-G., J.R.A.-B., M.A.C.-O., J.A.A.-G., J.A.N.-L. and M.E.R.-L.; resources, R.O.-C., F.N.M.-R., J.A.N.-L. and M.E.R.-L.; data curation, D.R.B.-G., J.R.A.-B., M.A.C.-O. and R.O.-C.; writing—original draft preparation, M.E.R.-L., R.O.-C. and F.N.M.-R.; writing—review and editing, M.E.R.-L., F.N.M.-R., G.T.-H., J.A.A.-G., J.A.N.-L. and R.O.-C.; visualization, D.R.B.-G., J.R.A.-B. and G.T.-H.; supervision, R.O.-C., F.N.M.-R., J.A.N.-L. and M.E.R.-L.; project administration, R.O.-C. and M.E.R.-L. All authors have read and agreed to the published version of the manuscript.
Funding
This research received no external funding. The article processing charge was covered by the authors.
Institutional Review Board Statement
Not applicable.
Informed Consent Statement
Not applicable.
Data Availability Statement
Data are contained within the article.
Conflicts of Interest
The authors declare no conflicts of interest.
References
- United Nations Environment Programme; Global Alliance for Buildings and Construction. Not Just Another Brick in the Wall: The Solutions Exist—Scaling Them Will Build on Progress and Cut Emissions Fast; Global Status Report for Buildings and Construction 2024/2025; United Nations Environment Programme: Nairobi, Kenya, 2025; Available online: https://wedocs.unep.org/handle/20.500.11822/47214 (accessed on 20 May 2026).
- International Energy Agency. Tracking Clean Energy Progress 2023; IEA: Paris, France, 2023; Available online: https://www.iea.org/reports/tracking-clean-energy-progress-2023 (accessed on 20 May 2026).
- Lops, C.; Montelpare, S. Sustainability in Energy and Buildings: Future Perspectives and Challenges. Appl. Sci. 2025, 15, 11401. [Google Scholar] [CrossRef] [Scilit]
- International Energy Agency. Heating; IEA: Paris, France, 2023; Available online: https://www.iea.org/energy-system/buildings/heating (accessed on 20 May 2026).
- Ma, M.; Zhou, N.; Feng, W.; Yan, J. Challenges and Opportunities in the Global Net-Zero Building Sector. Cell Rep. Sustain. 2024, 1, 100154. [Google Scholar] [CrossRef] [Scilit]
- Chetouni, A.; Idrissi Kaitouni, S.; Jamil, A. Climate Change Impacts on Future Thermal Energy Demands and Indoor Comfort of a Modular Residential Building across Different Climate Zones. J. Build. Eng. 2025, 102, 111927. [Google Scholar] [CrossRef] [Scilit]
- REN21. Renewables 2025 Global Status Report Collection: Renewable Energy in Buildings; REN21: Paris, France, 2025; Available online: https://www.ren21.net/gsr-2025/sectors/buildings/ (accessed on 20 May 2026).
- ISO 6946:2017; Building Components and Building Elements—Thermal Resistance and Thermal Transmittance—Calculation Methods. International Organization for Standardization: Geneva, Switzerland, 2017. Available online: https://www.iso.org/standard/65708.html (accessed on 20 May 2026).
- ASTM C1363-24; Standard Test Method for Thermal Performance of Building Materials and Envelope Assemblies by Means of a Hot Box Apparatus. ASTM International: West Conshohocken, PA, USA, 2024. Available online: https://www.astm.org/c1363-24.html (accessed on 20 May 2026).
- ISO 9869-1:2014; Thermal Insulation—Building Elements—In-Situ Measurement of Thermal Resistance and Thermal Transmittance—Part 1: Heat Flow Meter Method. International Organization for Standardization: Geneva, Switzerland, 2014. Available online: https://www.iso.org/standard/59697.html (accessed on 20 May 2026).
- Lu, X.; Memari, A.M. Comparison of the Experimental Measurement Methods for Building Envelope Thermal Transmittance. Buildings 2022, 12, 282. [Google Scholar] [CrossRef] [Scilit]
- Song, A.; Kim, Y.; Hwang, S.; Shin, M.; Lee, S. A Comprehensive Review of Thermal Transmittance Assessments of Building Envelopes. Buildings 2024, 14, 3304. [Google Scholar] [CrossRef] [Scilit]
- Teni, M.; Krstić, H.; Kosiński, P. Review and Comparison of Current Experimental Approaches for In-Situ Measurements of Building Walls Thermal Transmittance. Energy Build. 2019, 203, 109417. [Google Scholar] [CrossRef] [Scilit]
- Crawley, D.B.; Lawrie, L.K.; Winkelmann, F.C.; Buhl, W.F.; Huang, Y.J.; Pedersen, C.O.; Strand, R.K.; Liesen, R.J.; Fisher, D.E.; Witte, M.J.; et al. EnergyPlus: Creating a New-Generation Building Energy Simulation Program. Energy Build. 2001, 33, 319–331. [Google Scholar] [CrossRef] [Scilit]
- Klein, S.A.; Beckman, W.A.; Mitchell, J.W.; Duffie, J.A.; Duffie, N.A.; Freeman, T.L.; Mitchell, J.C.; Braun, J.E.; Evans, B.L.; Kummer, J.P.; et al. TRNSYS, Version 18; A Transient System Simulation Program; Solar Energy Laboratory, University of Wisconsin: Madison, WI, USA, 2017. Available online: https://sel.me.wisc.edu/trnsys/ (accessed on 20 May 2026).
- Nageler, P.; Schweiger, G.; Pichler, M.; Brandl, D.; Mach, T.; Heimrath, R.; Schranzhofer, H.; Hochenauer, C. Validation of Dynamic Building Energy Simulation Tools Based on a Real Test-Box with Thermally Activated Building Systems (TABS). Energy Build. 2018, 168, 42–55. [Google Scholar] [CrossRef] [Scilit]
- Tian, W. A Review of Sensitivity Analysis Methods in Building Energy Analysis. Renew. Sustain. Energy Rev. 2013, 20, 411–419. [Google Scholar] [CrossRef] [Scilit]
- Ge, H.; Baba, F. Dynamic Effect of Thermal Bridges on the Energy Performance of a Low-Rise Residential Building. Energy Build. 2015, 105, 106–118. [Google Scholar] [CrossRef] [Scilit]
- Waqas, A.; Araji, M.T.; Sherif, S.S. A Novel Method for Monitoring Material Behaviour in Urban Buildings Using Aerial Multi-Modality Imaging. Build. Environ. 2025, 282, 113300. [Google Scholar] [CrossRef] [Scilit]
- Videras Rodríguez, M.; Gómez Melgar, S.; Andújar Márquez, J.M. Evaluation of Aerial Thermography for Measuring the Thermal Transmittance (U-Value) of a Building Façade. Energy Build. 2024, 324, 114874. [Google Scholar] [CrossRef] [Scilit]
- ISO 15927-6:2007; Hygrothermal Performance of Buildings—Calculation and Presentation of Climatic Data—Part 6: Accumulated Temperature Differences (Degree-Days). International Organization for Standardization: Geneva, Switzerland, 2007. Available online: https://www.iso.org/standard/35564.html (accessed on 20 May 2026).
- ISO 13786:2017; Thermal Performance of Building Components—Dynamic Thermal Characteristics—Calculation Methods. International Organization for Standardization: Geneva, Switzerland, 2017. Available online: https://www.iso.org/standard/65711.html (accessed on 20 May 2026).
- Verbeke, S.; Audenaert, A. Thermal Inertia in Buildings: A Review of Impacts across Climate and Building Use. Renew. Sustain. Energy Rev. 2018, 82, 2300–2318. [Google Scholar] [CrossRef] [Scilit]
- ISO 8990:1994; Thermal Insulation—Determination of Steady-State Thermal Transmission Properties—Calibrated and Guarded Hot Box. International Organization for Standardization: Geneva, Switzerland, 1994. Available online: https://www.iso.org/standard/16519.html (accessed on 20 May 2026).
- Shen, Z.; Brooks, A.L.; He, Y.; Shrestha, S.S.; Zhou, H. Evaluating Dynamic Thermal Performance of Building Envelope Components Using Small-Scale Calibrated Hot Box Tests. Energy Build. 2021, 251, 111342. [Google Scholar] [CrossRef] [Scilit]
- Carmona, C.; Muñoz, J.; Alorda-Ladaria, B. Ambient Hot Box: An Instrument for Thermal Characterization of Building Elements and Constructive Materials. Sensors 2023, 23, 1576. [Google Scholar] [CrossRef] [Scilit] [PubMed]
- García Cueto, R.; Ley García, J. Las ondas cálidas en Mexicali, Baja California, México: Morbilidad, mortalidad y vulnerabilidad al calor [Heat Waves in Mexicali, Baja California, Mexico: Morbidity, Mortality and Vulnerability to Heat]. Investig. Geogr. 2024, 114, e60848. [Google Scholar] [CrossRef] [Scilit]
- Servicio Meteorológico Nacional; Comisión Nacional del Agua. Normales Climatológicas por Estado: Baja California; Gobierno de México: Mexico City, Mexico. Available online: https://smn.conagua.gob.mx/es/climatologia/informacion-climatologica/normales-climatologicas-por-estado?estado=bc (accessed on 20 May 2026).
- ASTM E230/E230M-23a; Standard Specification for Temperature-Electromotive Force (emf) Tables for Standardized Thermocouples. ASTM International: West Conshohocken, PA, USA, 2023. Available online: https://www.astm.org/e0230_e0230m-23a.html (accessed on 20 May 2026).
- JCGM 100:2008(E); Joint Committee for Guides in Metrology. Evaluation of Measurement Data—Guide to the Expression of Uncertainty in Measurement. Bureau International des Poids et Mesures: Sèvres, France, 2008. [CrossRef] [Scilit]
- ISO 10456:2007; Building Materials and Products—Hygrothermal Properties—Tabulated Design Values and Procedures for Determining Declared and Design Thermal Values. International Organization for Standardization: Geneva, Switzerland, 2007. Available online: https://www.iso.org/standard/40966.html (accessed on 18 June 2026).
- ASHRAE. 2025 ASHRAE Handbook—Fundamentals; American Society of Heating, Refrigerating and Air-Conditioning Engineers: Peachtree Corners, GA, USA, 2025; Available online: https://www.ashrae.org/technical-resources/ashrae-handbook/description-2025-ashrae-handbook-fundamentals (accessed on 18 June 2026).
- Bergman, T.L.; Lavine, A.S.; Incropera, F.P.; DeWitt, D.P. Fundamentals of Heat and Mass Transfer, 8th ed.; Wiley: Hoboken, NJ, USA, 2017; ISBN 978-1-118-98917-3. [Google Scholar]
- Al-Yasiri, Q.; Alktranee, M.; Hamed, Y.; Aqeel, A.; Lafta, M.; Bencs, P.; Szabó, M. Experimental Analysis on the Effect of Cavity Shape on the Thermal and Mechanical Performance of Hollow Concrete Bricks. Results Eng. 2025, 28, 108212. [Google Scholar] [CrossRef] [Scilit]
- Xu, L.; Ding, Y.; Du, C. Thermal Performance Assessment of Exterior Building Walls under Intermittent Air-Conditioning Operation in China’s Hot Summer and Cold Winter Zone. J. Build. Eng. 2024, 95, 110204. [Google Scholar] [CrossRef] [Scilit]
- Ye, Q.; Ba, L.; Nguyen, G.T.M.; Absi, R.; Ledésert, B.A.; Dosseh, G.; Hebert, R.L. Experimental and Numerical Simulation Study on the Thermal Performance of Building Envelope Structures Incorporating the Solid–Solid Phase Change Material. Energy Build. 2025, 348, 116476. [Google Scholar] [CrossRef] [Scilit]
- Mohamad Zaidi, N.H.; Mohd Ashhar, M.Z.; Lim, C.H. Techno-Economic Analysis of Roof Insulation Strategies for Decarbonizing Commercial and Residential Buildings in Malaysia. Buildings 2024, 14, 3933. [Google Scholar] [CrossRef] [Scilit]
- Kheiri, F.; Haberl, J.S.; Baltazar, J.-C. Split-Degree Day Method: A Novel Degree Day Method for Improving Building Energy Performance Estimation. Energy Build. 2023, 289, 113034. [Google Scholar] [CrossRef] [Scilit]
- Han, Y.; Zhou, Z.; Li, W.; Feng, J.; Wang, C. Exploring Building Component Thermal Storage Performance for Optimizing Indoor Thermal Environment—A Case Study in Beijing. Energy Build. 2024, 304, 113834. [Google Scholar] [CrossRef] [Scilit]
- Cheng, R.; Zhang, N.; Zhang, W.; Sun, Y.; Yin, B.; Gao, W. Impact of Thermal Mass, Window Performance, and Window–Wall Ratio on Indoor Thermal Dynamics in Public Buildings. Buildings 2025, 15, 1757. [Google Scholar] [CrossRef] [Scilit]
- Liu, Z.-A.; Li, Y.; Hou, J.; Tian, L.; Wang, S.; Hu, W.; Zhang, L. Impact of Exterior Envelope Thermal Performance on Energy Demand and Optimization Strategies for University Teaching-Office Buildings. Sci. Rep. 2025, 15, 15171. [Google Scholar] [CrossRef] [Scilit] [PubMed]
- López Salazar, S.; Sun, L.; Yang, R.; Yuan, Z.; Zhu, L.; Li, D.; Wang, Y.; Zhang, C.; Hu, W. Integrated Thermal Performance Assessment (ITPA): A Unified Framework to Evaluate Thermal and Storage Efficiency in Passive Envelope Systems under Seasonal Loads. Appl. Therm. Eng. 2025, 280, 128428. [Google Scholar] [CrossRef] [Scilit]
- Ochoa de la Torre, J.M.; Marincic Lovriha, I.; Huelsz Lesbros, G.; Barrios del Valle, G. Transferencia Dinámica de Calor en Muros de Block Hueco en una Vivienda con Ventilación Natural [Dynamic Heat Transfer through a Hollow Block Wall in a Naturally Ventilated Dwelling]. Vivienda Comunidades Sustentables 2023, 14, 109–122. [Google Scholar] [CrossRef] [Scilit]
- Raygoza-Limón, M.E.; Jiménez-Sánchez, R.; Mercado-Herrara, A.; Murrieta-Rico, F.N. Management of Public and Fiscal Policies for the Energy Transition and Sustainable Development in Mexico. Rev. Cienc. Tecnol. 2023, 6, e290. [Google Scholar] [CrossRef] [Scilit]
- ISO 9972:2015; Thermal Performance of Buildings—Determination of Air Permeability of Buildings—Fan Pressurization Method. International Organization for Standardization: Geneva, Switzerland, 2015. Available online: https://www.iso.org/standard/55718.html (accessed on 18 June 2026).

Disclaimer/Publisher’s Note: The statements, opinions and data contained in all publications are solely those of the individual author(s) and contributor(s) and not of MDPI and/or the editor(s). MDPI and/or the editor(s) disclaim responsibility for any injury to people or property resulting from any ideas, methods, instructions or products referred to in the content. |
© 2026 by the authors. Licensee MDPI, Basel, Switzerland. This article is an open access article distributed under the terms and conditions of the Creative Commons Attribution (CC BY) license.