


Abstract
This study investigates the sampling sufficiency required for accurately characterizing the morphological properties of rigid polyurethane foams across three distinct regions: core, crown, and lateral edge. A total of 200 individual cells were analyzed from 30 SEM micrographs, enabling the quantification of cell length, cell width, anisotropy index, linear cell density, and shape index. Average cell length ranged from 715 to 763 μm, while cell width varied between 386 and 531 μm depending on the region. The anisotropy index increased from 0.186 in the core to 0.289 in the lateral edge, indicating progressively more elongated cells. Linear cell density showed a marked decrease from 0.062 in the core to 0.001 in the crown, reflecting differences in cellular packing. Shape index values remained relatively stable, confirming its lower sensitivity to structural variations. Monte Carlo simulations were employed to evaluate sampling sufficiency for sample sizes ranging from 2 to 30. Results demonstrated that optimal sample sizes varied with foam region and parameter: 16 cells were sufficient for core and lateral regions, whereas up to 22 cells were required for the crown to capture higher structural heterogeneity. For anisotropy and shape indices, sufficient sampling ranged between 13 and 20 cells depending on the region. The results confirm that the core exhibits lower variability (CoV for cell length: 29.1%) compared to the crown (36.4%) and lateral edge (34.9%), supporting its more homogeneous structure. However, exclusive sampling from the core may lead to biased characterization, as crown and lateral regions display significantly higher variability in both geometry and orientation. These findings establish quantitative guidelines for sampling strategies in polyurethane foam morphology, contributing to improved reproducibility and reliability in structure–property investigations of cellular materials.
1. Introduction
Polyurethane (PU) foams, constituting a substantial share of the PU market, play a crucial role in diverse applications. The two primary types of foams, flexible and rigid ones, exhibit distinct structures. The controlled manipulation of monomers, catalysts, surfactants, and blowing agents allows manufacturers to customize foam properties, influencing factors such as mechanical strength and thermal conductivity [1,2]. Flexible foams, characterized by an open-cell structure, are employed in everyday applications such as filters, automotive components, and furniture cushioning [3,4]. On the other hand, rigid foams, featuring a closed-cell structure, serve as thermal insulation in appliances, construction, and transport [5,6].
The prevalent free rise pouring method in polyurethane foam production contributes significantly to cutting waste. This waste includes the formation of a “crown” and “lateral edge” [7,8]. The crown comprises triangular or trapezoidal offcuts, while the lateral edge consists of thin strips removed during shaping processes. Anomalies in morphological characteristics often manifest in the crown and lateral edge regions. According to Delucis et al. [6], during the manufacturing process, especially in areas prone to geometric constraints, the flow of the liquid foam precursor may encounter restrictions and this can lead to non-uniform expansion and orientation of cells in these specific regions. Because of that, the cutting waste, particularly in the crown and lateral edge regions, poses multifaceted challenges for manufacturers. Anomalies in morphological characteristics contribute to material loss and increased landfill usage, necessitating optimized cutting patterns and recycling efforts to mitigate environmental and economic impacts [8,9].
This phenomenon stems from the intricate dynamics during the free rise pouring method [6]. As the liquid polymer expands, spherical gas bubbles form, gradually composing a denser system. When these bubbles touch each other, deformations create thin walls (edges) between them [10,11]. In the crown and lateral edge regions, where the foam interacts with the mold, variations in bubble formation and wall thickness can lead to anomalies in cell size, distribution, and overall morphology.
The cellular morphology of PU foams is intricately linked to their mechanical, thermal, and insulation properties, making it a focal point of scientific inquiry. For instance, smaller and more uniform cell sizes generally result in higher apparent density and better mechanical performance, while larger cells may contribute to increased flexibility and softness [12]. Indeed, closed-cell foams with tightly packed cells provide excellent thermal insulation, as they minimize the transfer of heat and, on the other hand, open-cell foams, with interconnected cells, may allow for better breathability but typically have lower thermal resistance [13,14]. Closed-cell foams, with sealed cells, are also less prone to water absorption compared to open-cell foams [15,16].
However, polyurethane foams can exhibit variations in morphological properties even within the same production batch. Therefore, a comprehensive understanding of the morphological properties of PU foams is vital for optimizing their performance. These properties encompass cell size and distribution, and may impact on several foam characteristics, including density, compressive strength, thermal insulation, stiffness, resilience, water absorption, as well processing and manufacturing techniques.
Sampling sufficiency emerges as a critical consideration in accurately representing the morphological properties of PU foams, especially when anomalies are prevalent [17]. Recognizing the variations between cells measured in the core, crown, and lateral regions becomes important for comprehensive morphological studies. A larger sample size provides a more representative portrayal of the entire foam batch. This allows for more consistent and reliable data, enabling researchers and manufacturers to draw meaningful conclusions about the foam’s morphological characteristics across different batches or production runs, maintaining product quality and consistency. Small sample sizes may not capture the diversity present in the foam, leading to skewed or unreliable results. In practical terms, understanding optimal sample sizes for distinct foam regions optimizes resource utilization. Researchers can allocate resources more efficiently by focusing on larger samples in complex regions and conserving resources in areas with more ordered structures. This tailored approach enhances the reproducibility and comparability of studies, contributing to the broader principles of effective sampling in materials science research.
In the context of PU foam morphology, the literature survey in Table 1 provides an overview of recent studies on morphological properties and their corresponding sample sizes. Most studies deal with optical microscopy and scanning electron microscopy to analyze the size, distribution, and orientation of the cellular elements. Other techniques such as atomic force microscopy and small-angle X-ray scattering have been used in an incipient way, probably due to operational difficulties or limitations related to the analysis of large cells and the need of complex mathematical data treatment [18].
Table 1.
Recent literature overview of measured morphological properties and respective sample sizes.
Although cellular morphology is routinely used to explain the mechanical, thermal, and hygroscopic performance of polyurethane foams, there is currently no consensus regarding the number of cells required to obtain representative morphological measurements. Most studies either do not report the number of analyzed cells or adopt arbitrary sample sizes without statistical justification. Consequently, the reliability, reproducibility, and comparability of morphological results remain uncertain across different investigations. Furthermore, existing studies on sampling sufficiency did not focus on polyurethane foam morphology, although the highly heterogeneous cellular architecture of these foams. Additionally, some regions, like crown and lateral, introduce additional variability that may not be adequately addressed by conventional sampling approaches.
Additionally, it is observed that many authors choose to assess only the cell size rather than both dimensions, thereby limiting the depth of analysis. This selective focus on cell size may result in an impoverished characterization of foam morphology. The survey emphasizes the need for comprehensive investigations into the relationships between sample size and morphological characterization to ensure the accuracy, reproducibility, and generalizability of results.
Resampling methods offer an alternative approach to determine sampling sufficiency, providing a means to estimate the accuracy of means, medians, variances, and percentiles by utilizing subsets of available data or generating new samplings. Methods such as Bootstrapping, Jackknifing, Permutation, and Cross-Validation, based on Monte Carlo simulations, have been applied across various fields, including anatomy, ecology, biomedicine, zoology, and genetics [17,50]. These methods, relying on randomness to solve problems in deterministic systems, encompass a large number of possible outcomes from the targeted sample. This study aimed to use Monte Carlo simulations to determine sampling sufficiency for morphological properties of three different regions (namely core, crown and lateral edge) of polyurethane foams.
2. Materials and Methods
2.1. Materials
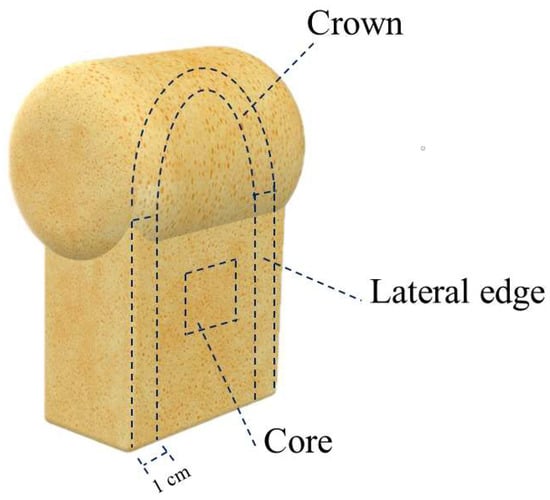
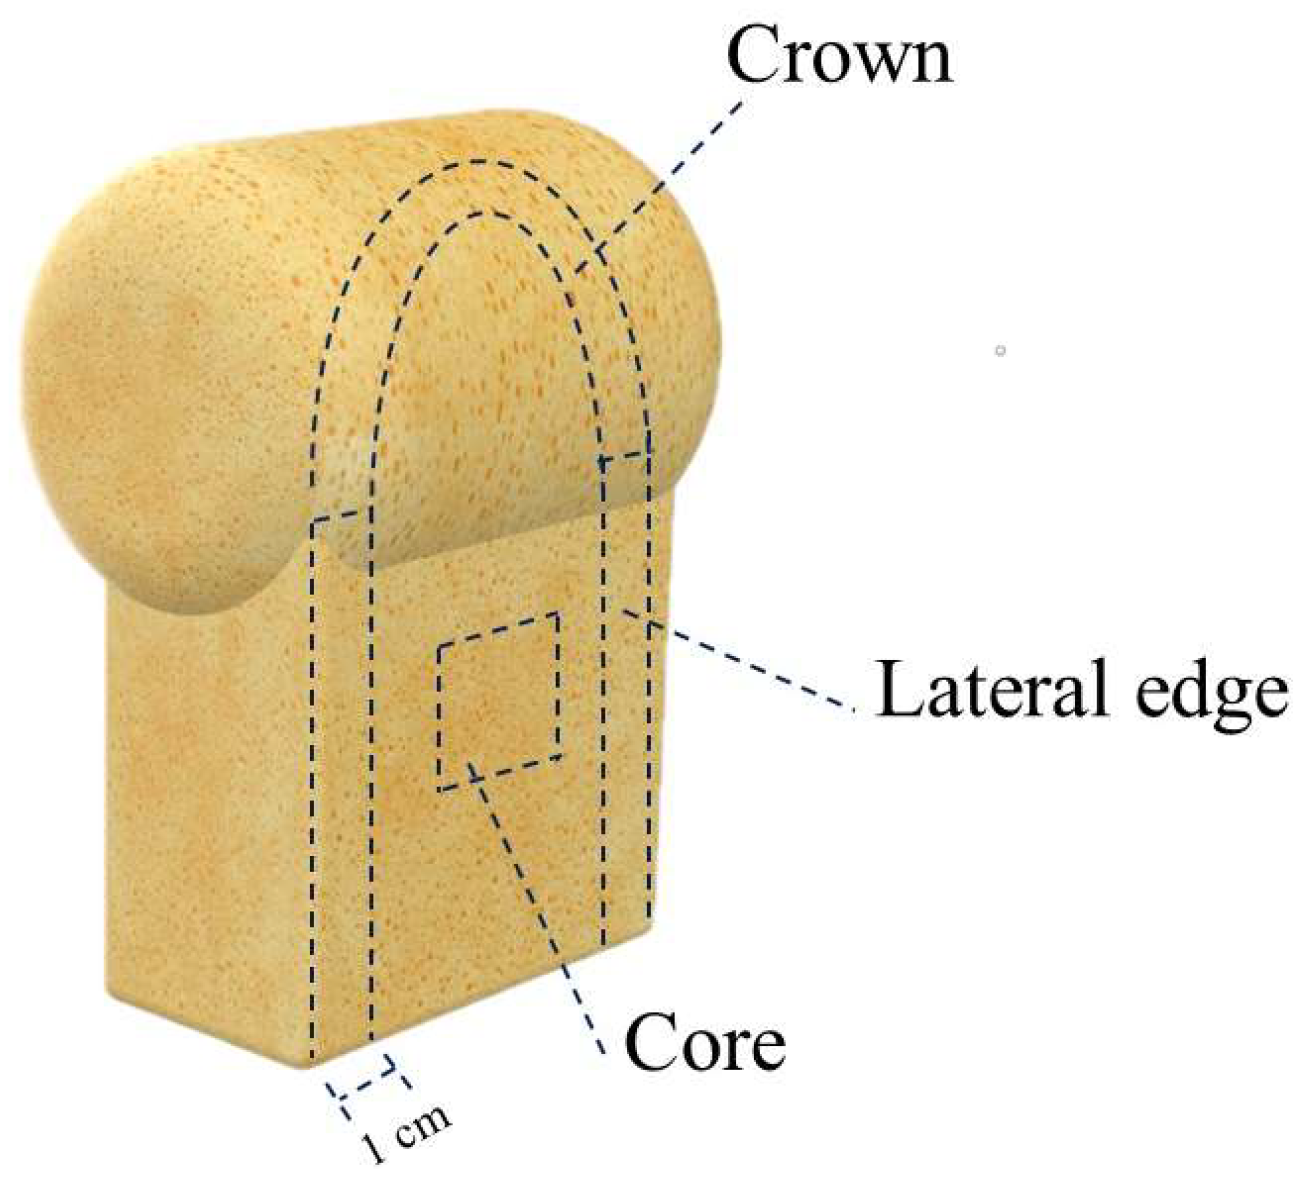
Rigid polyurethane foams under investigation were obtained using the free rise pouring method and single-shot technique. The foams were expanded in molds made of wood and coated with brown paper to facilitate demolding. The reagents and processing conditions employed were refined based on prior studies conducted by the research group [9,43,45]. Essentially, a bio-based polyol was synthesized through a straightforward blend of castor oil and glycerol in a 3:1 weight ratio. Isotane DM, a polymer methylene diphenyl diisocyanate (p-MDI), served as the NCO source. Additionally, polyethylene glycol (PEG-400), silicon oil, and dimethylbenzylamine were utilized as a chain extender, surfactant, and catalyst, respectively. For the manufacturing of rigid polyurethane foams, castor oil (24 parts/g), distilled water, glycerol (8 parts/g), PEG-400 (3.5 parts/g), silicon oil (1 part/g), and filler were mechanically mixed at 1000 rpm for 120 s. Subsequently, p-MDI (63 parts/g) and amine (0.4 parts/g) were incorporated into the mixture and mechanically stirred for an additional 60 s, maintaining a constant NCO/OH stoichiometric ratio of 1.2. Further details regarding the reagents and procedures can be found in the previously referenced studies. Referencing Figure 1, which provides an illustration of the different components under scrutiny (core, crown, and lateral edge), offers visual insights into the study’s focus.
Figure 1.
Illustration of analyzed components in the rigid polyurethane foams.
2.2. Determination of Morphological Properties
A comprehensive microstructural analysis of a representative polyurethane foam was conducted using a JEOL JSM-6060 scanning electron microscope (SEM), manufactured by JEOL Ltd., based in Akishima, Tokyo, Japan, equipped with energy dispersive spectroscopy (EDS). The selected foam sample, measuring 2 cm × 2 cm × 2 cm, was chosen to encapsulate the typical characteristics of this versatile material commonly employed in industrial applications. Samples were cut using a sharp blade perpendicular to the foam growth direction. Prior to SEM observation, the foam specimens were sectioned to expose the internal cellular structure and mounted on aluminum stubs using conductive carbon tape. The specimens were sputter-coated with a thin gold layer to improve surface conductivity and reduce charging effects. All images were acquired under identical SEM operating conditions and magnification levels.
Operational parameters for SEM analysis were adjusted to ensure an in-depth exploration of the foam’s microstructure. The accelerating voltage, a critical factor influencing both resolution and specimen penetration, was set to a typical value of 15 kV, striking a balance between imaging quality and depth of penetration. The working distance, representing the space between the final lens and the sample surface, was optimized within the range of 8 mm to 10 mm to achieve clear and detailed imaging. To capture a nuanced understanding of the foam’s microstructure at different scales, varied magnification levels were employed. Initial overviews were conducted at 30×, providing a macroscopic perspective.
Utilizing a dataset comprising 30 SEM images captured from the PU samples, a robust analysis was conducted employing the ImageJ software (1.5 version). The objective was to measure the characteristics of 200 individual cells within the foam microstructure, providing a comprehensive understanding of its morphological features. The software facilitated the measurement of key morphological parameters, including cell length, width, and shape. From these measurements, linear cell density (LCD), anisotropy index (AI), and shape index (SI) were calculated according to Equations (1), (2) and (3), respectively. It is pertinent to highlight that, for these calculations, the area of each cell was determined considering an elliptical shape. Shape index data was reported with six places after the decimal point due to the low magnitude of these numbers.
where: n is the number of cells in the image; M is the magnification factor; A is the area of the micrograph; A is the area of the cell and d is the equivalent diameter.
2.3. Sampling Sufficiency Using Monte Carlo Simulations
Evaluation of data normality through Shapiro-Wilk tests and determination of sampling sufficiency via confidence intervals constitute indispensable steps in ensuring the robustness of the statistical analysis employed for inferring morphological properties. This methodological approach closely aligns with established practices observed in various scientific domains, including anatomy, ecology, limnology, and phytotechny, as affirmed by Aramburu et al. [17].
To enhance comparability and bolster the reliability of findings, a fixed set of sample sizes (n = 200) and confidence levels (1 − α = 0.95) were uniformly applied across all morphological tests. This systematic approach ensures a robust foundation for statistical analyses, facilitating meaningful comparisons and interpretations. The original dataset composed of 200 measured cells was directly considered as the pseudo-population from which all resampling procedures were performed. This number of cells was considered a sufficiently large reference dataset for the Monte Carlo resampling procedure. The purpose of this initial dataset was not to define the final required sample size, but rather to create a pseudo-population capable of representing the natural variability of the cellular structure. This approach allowed the generation of a large number of resampling scenarios and ensured stable estimates of confidence intervals during the Monte Carlo simulations.
In the simulation procedure, an exploration was conducted, considering a range of sample sizes (ranging from 2 to 30) for each morphological property. Through 2000 resampling iterations, incorporating replacements from a pseudo-population derived from the original data points, a comprehensive exploration of the variability associated with different sample sizes was achieved. For each resampling iteration, the arithmetic mean of the selected cells was calculated and stored. The distribution of these 2000 means was subsequently used to estimate confidence intervals. Employing the Monte Carlo simulation technique, implemented through the R Development Core Team software (4.2.0 version), added an additional layer of statistical rigor, contributing to the reliability of the analyses.
The derivation of statistical parameters, encompassing the minimum, 2.5th percentile, mean, 97.5th percentile, and maximum, contributed to a nuanced understanding of the distributional characteristics of the morphological data. The determination of the confidence level for each sample size, defined as the difference between the 97.5th and 2.5th percentiles, further enriched the statistical insights. Sampling sufficiency was defined as the minimum sample size producing a confidence interval width within 5% of the minimum interval obtained at n = 30.
It’s noteworthy that sampling sufficiency was defined for cell length, cell width, anisotropy index, and shape index. However, a unique challenge emerged for linear cell density due to the inherent limitations imposed by the number of images collected. Each SEM image yielded a singular data point for linear cell density, preventing the attainment of the desired 200 data points for this specific property. This dataset served as the basis for generating the thousands of resampling scenarios and evaluating the stabilization of confidence intervals as sample size increased. Similar approaches have been employed in previous sampling sufficiency studies based on resampling methods [17]. Descriptive statistics were computed using Statgraphics Centurion (19 version), Monte Carlo simulations were conducted through the R Development Core Team, and graphical representations were crafted using Microsoft Excel.
3. Results and Discussion
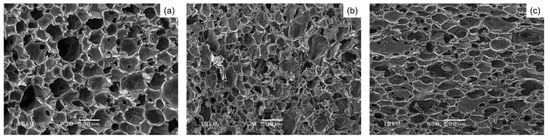
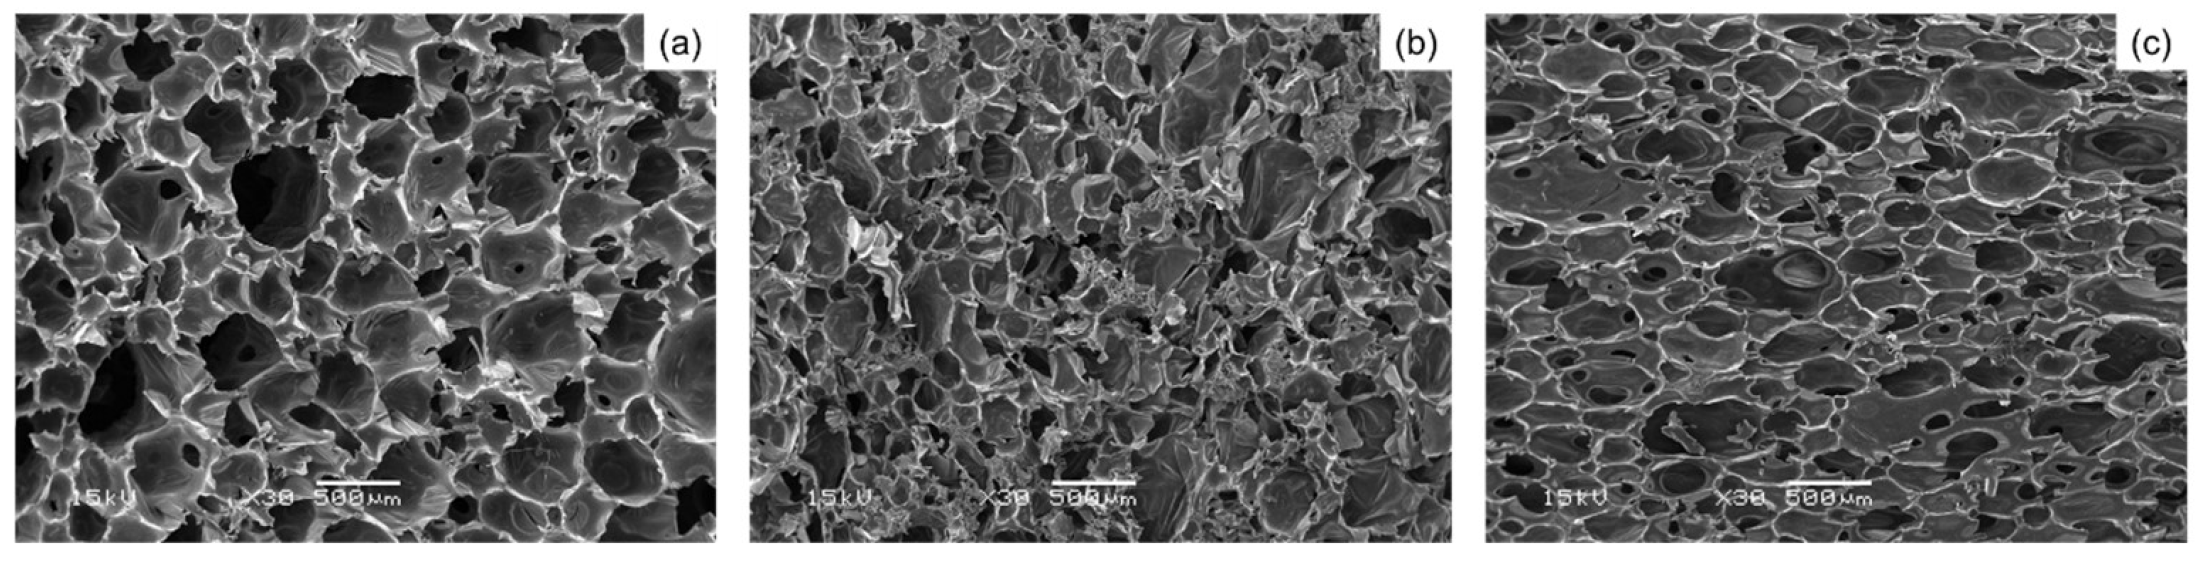
Figure 2 presents a captivating showcase of SEM images, capturing side views of the studied foams. These images provided a nuanced perspective, allowing us to visually dissect and analyze the foam’s complex cellular structure. In general, it was possible to observe a pattern of crown cells that is approximately elliptical and sometimes polygonal, with no preferential orientation. The lateral cells also exhibited a flattened pattern, with a significant portion aligned in the direction of foam expansion, coinciding with the mold wall’s orientation. On the other hand, the core cells displayed a distinctly more rounded pattern, likely attributable to the absence of constraints against the movement of the liquid polymer during the foam polymerization process in this case.
Figure 2.
SEM images taken on side view of the studied foams. Here: (a) is core; (b) is crown; (c) is lateral edge.
Besides, turning our attention to the analytical depth, Table 2 unfolds a wealth of descriptive statistics derived from the original sample size of 200 data points. This table serves as a comprehensive guide, offering key insights into the morphological properties under scrutiny. From cell dimensions to indices reflecting shape and anisotropy, each statistical measure contributes to a thorough understanding of the foam’s inherent characteristics.
Table 2.
Descriptive statistics of obtained results for the original sample size (n = 200).
A detailed examination of Table 2 reveals substantial differences in the morphological variability among the three foam regions. The core exhibited the largest average cell dimensions, with mean cell length and width values of 763.2 and 531.4 μm, respectively, whereas the crown and lateral edge showed progressively smaller widths, reaching 415.2 and 386.3 μm. This reduction in cell width, combined with relatively similar cell lengths, contributed to the increase in anisotropy index from 0.186 in the core to 0.262 and 0.289 in the crown and lateral edge, respectively, indicating a gradual transition from nearly isotropic to increasingly elongated cellular structures. The coefficient of variation (CoV) further highlights the distinct structural organization of each region. For cell length, the CoV increased from 29.1% in the core to 36.4% in the crown, while for cell width the values ranged from 32.5% to 36.4%. These results indicate that the crown region exhibits the greatest heterogeneity in cell dimensions, likely due to the more complex expansion dynamics occurring near the free-rising surface of the foam. In contrast, the lower CoV values observed in the core suggest a more uniform cellular architecture resulting from fewer geometrical constraints during foam growth.
Among all evaluated properties, the anisotropy index displayed the highest relative variability, with CoV values ranging from approximately 50% to 62%. This finding suggests that cell orientation and elongation are more sensitive to local expansion conditions than cell dimensions themselves. Conversely, the shape index exhibited the lowest variability, with CoV values below 10% for all regions, indicating that this parameter remained relatively stable despite the pronounced differences in cell size and orientation. Such behavior explains the limited sensitivity of the shape index for distinguishing morphological heterogeneity among foam regions. The linear cell density also varied markedly between regions. The core presented the highest average value (0.062), whereas the crown exhibited the lowest (0.001), representing a reduction of approximately 98%. This result reflects the more compact cellular arrangement in the core and the lower degree of cellular packing in the crown. The high CoV associated with linear cell density, particularly in the crown region (67.4%), further demonstrates the strong influence of local growth conditions on cell distribution and packing.
The cells within the core exhibited a noteworthy characteristic of being more rounded, which explains their low anisotropy index and intermediate shape index. This rounder cell shape contributes to a higher linear cell density. This high linear cell density in the core is a consequence of the compact and rounded cell arrangement, contributing to enhanced structural integrity [18,33]. The nearly isotropic pattern observed in the core cells aligns with the expected high CoV for the anisotropy index. Therefore, it seems that in nearly isotropic cells, where properties are expected to be uniform in all directions, any deviation from uniformity introduces variability. However, it is noteworthy that the readings of cell dimensions (length and width) in the core cells display the lowest CoV among all foam parts studied. This structural homogeneity is consistent with literature findings, where isotropic cellular structures often exhibit greater predictability in mechanical and thermal properties [8].
Contrastingly, cells in the crown and lateral regions present a flatter pattern, characterized by higher anisotropy indices, while their volumes remain relatively equal, as indicated by intermediate shape indices. Unlike flattened lateral cells reported in the literature, and even flattened core cells, crown cells lack a discernible growth-oriented alignment [6]. It becomes apparent that crown cells do not exhibit any preferential orientation. This cell shape, coupled with the lack of orientation, probably resulted in low linear cell density in this region. Also, the unique combination of flattened morphology and disorientation in crown cells may leads to distinct mechanical and thermal behaviors not entirely in line with existing theoretical frameworks.
To further support the interpretation of the descriptive statistics presented in Table 2 and verify whether the observed differences among foam regions were statistically significant, a one-way analysis of variance (ANOVA) was performed for each morphological parameter. The analysis compared the mean values obtained for the core, crown, and lateral edge regions, considering a significance level of 5% (α = 0.05). The results are presented in Table 3. Significant differences among regions were detected for cell width, anisotropy index, linear cell density, and shape index, whereas cell length did not show statistically significant differences. These findings corroborate the existence of distinct cellular morphologies across the analyzed regions and reinforce the need for region-specific considerations when establishing sampling sufficiency criteria.
Table 3.
One-way ANOVA results for the morphological properties of polyurethane foams from the core, crown, and lateral edge regions.
The absence of significant differences in cell length, combined with the highly significant differences observed for cell width, anisotropy index, linear cell density, and shape index, indicates that regional morphological variations are primarily associated with cell geometry and orientation rather than cell elongation itself.
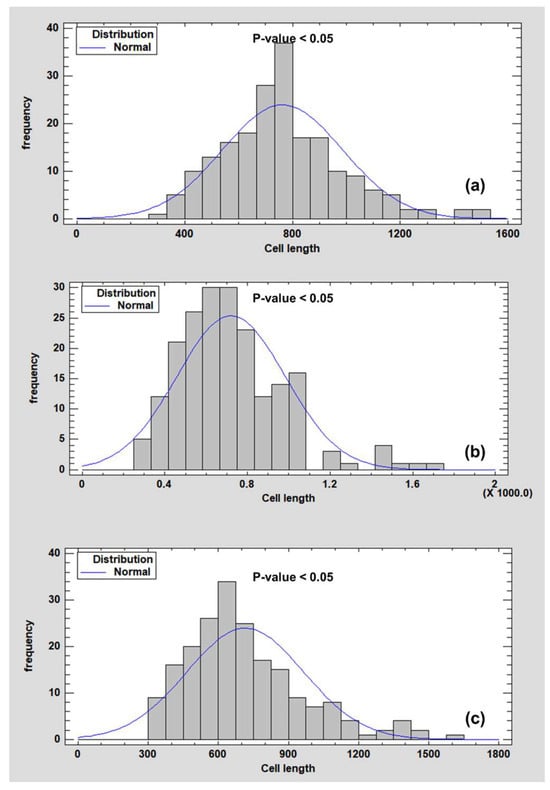
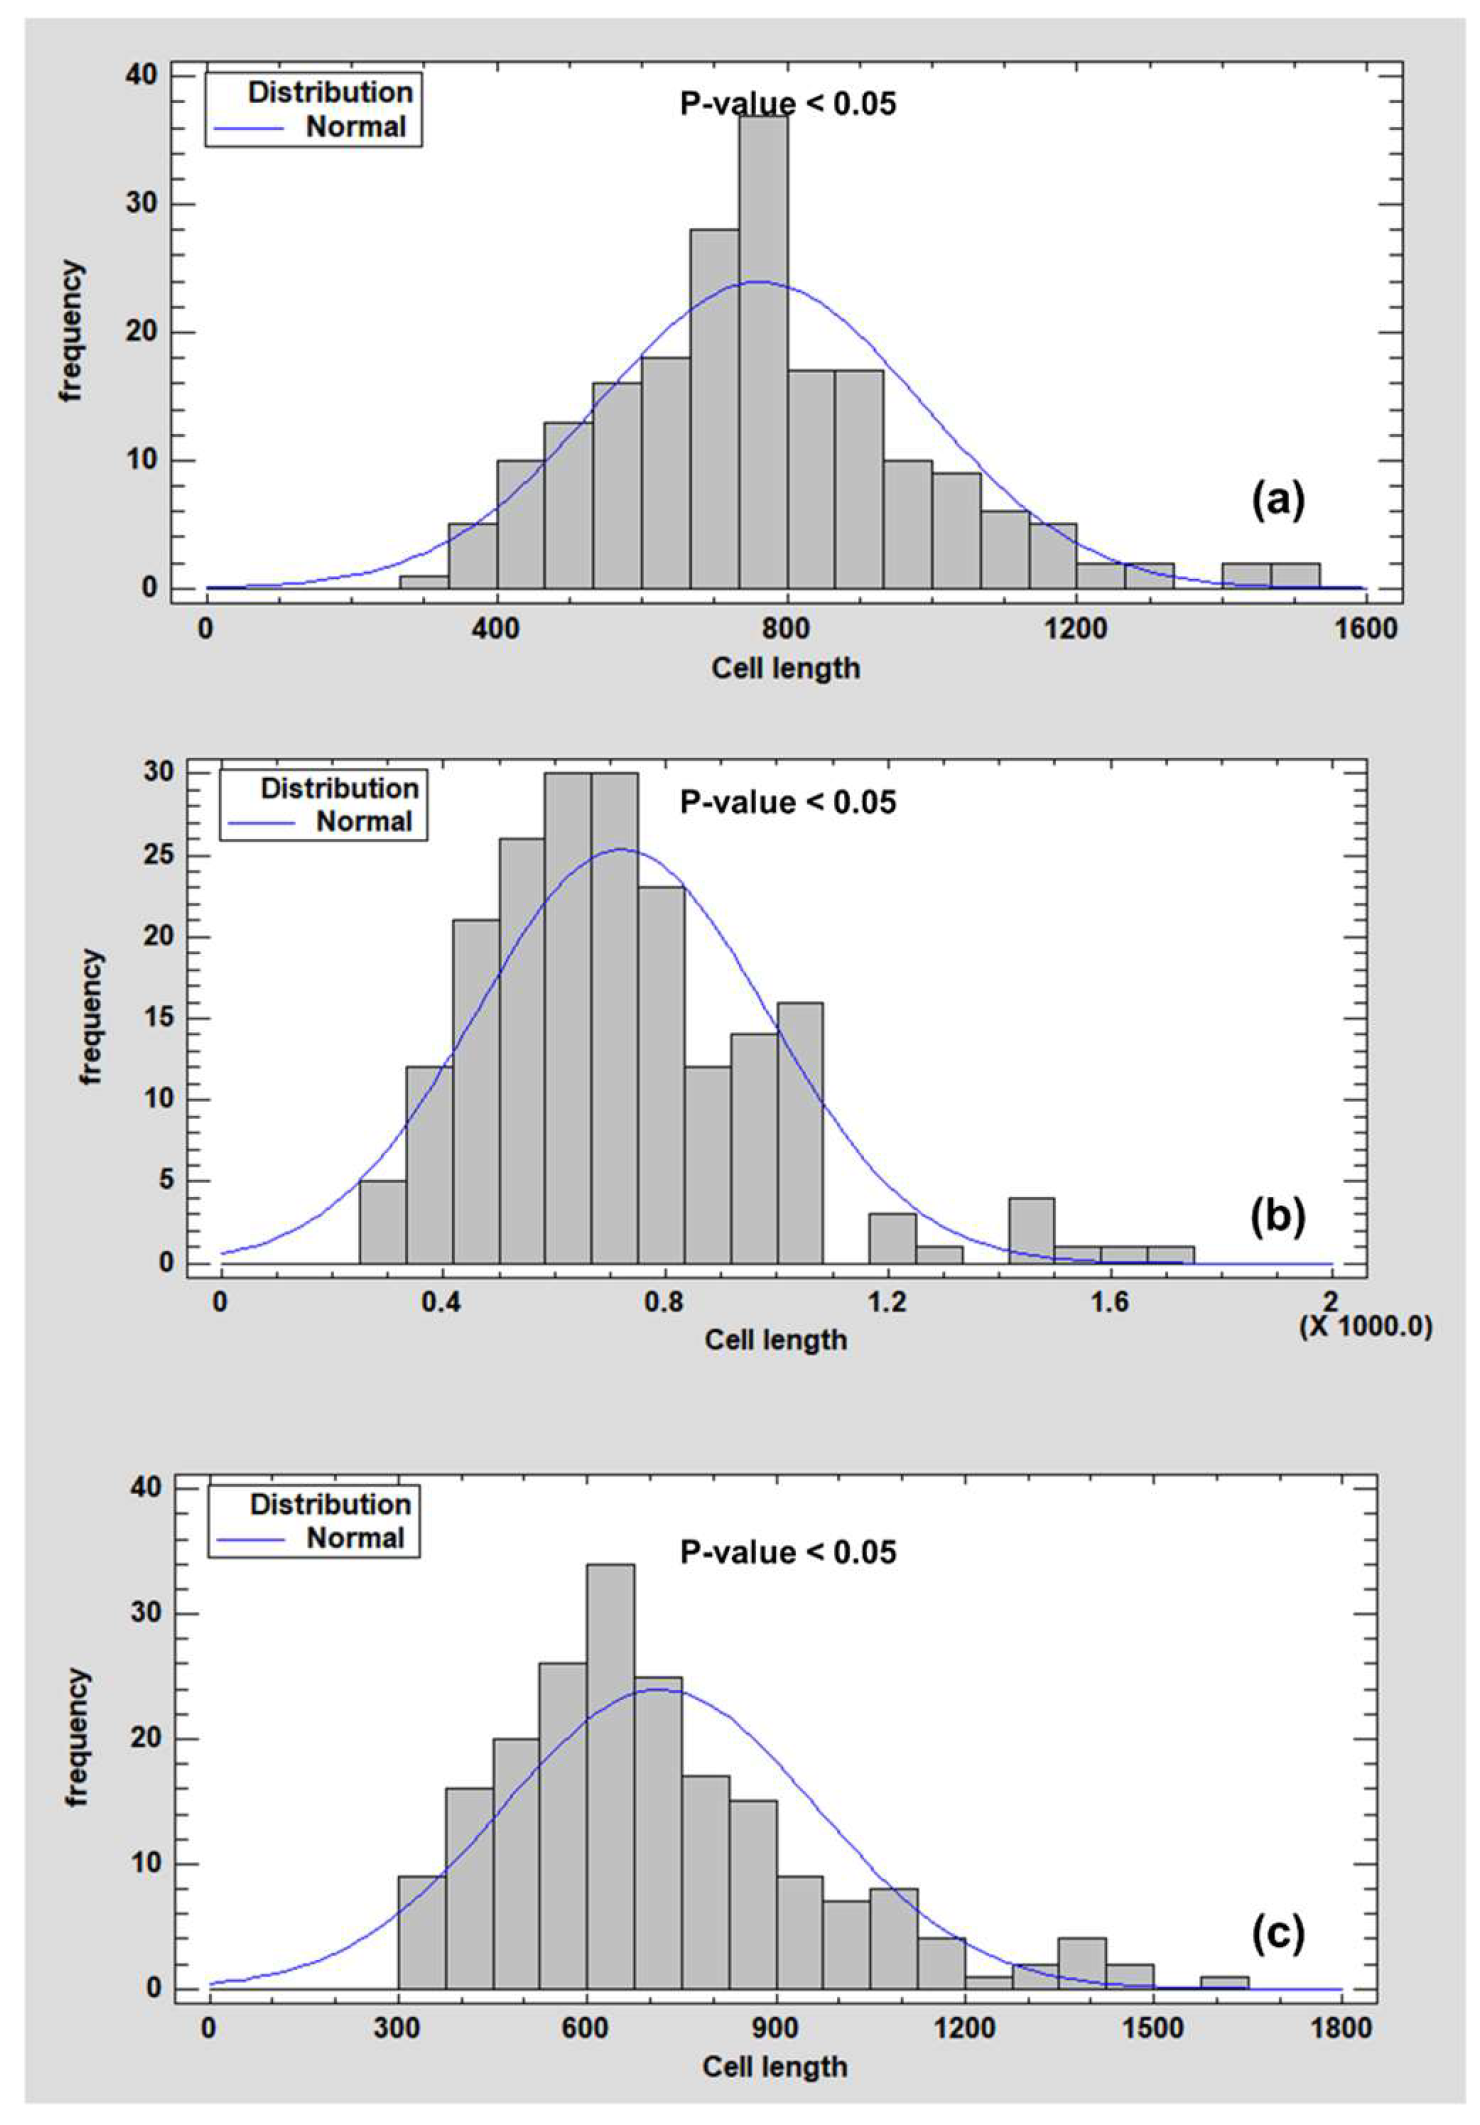
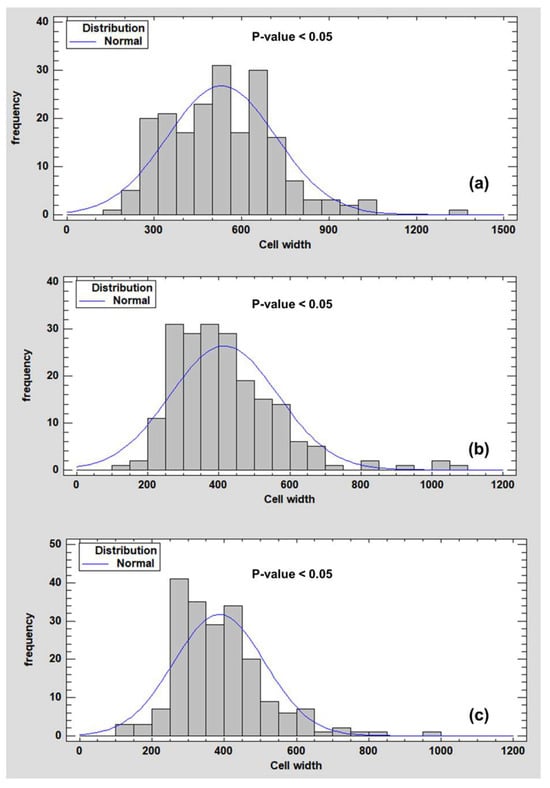
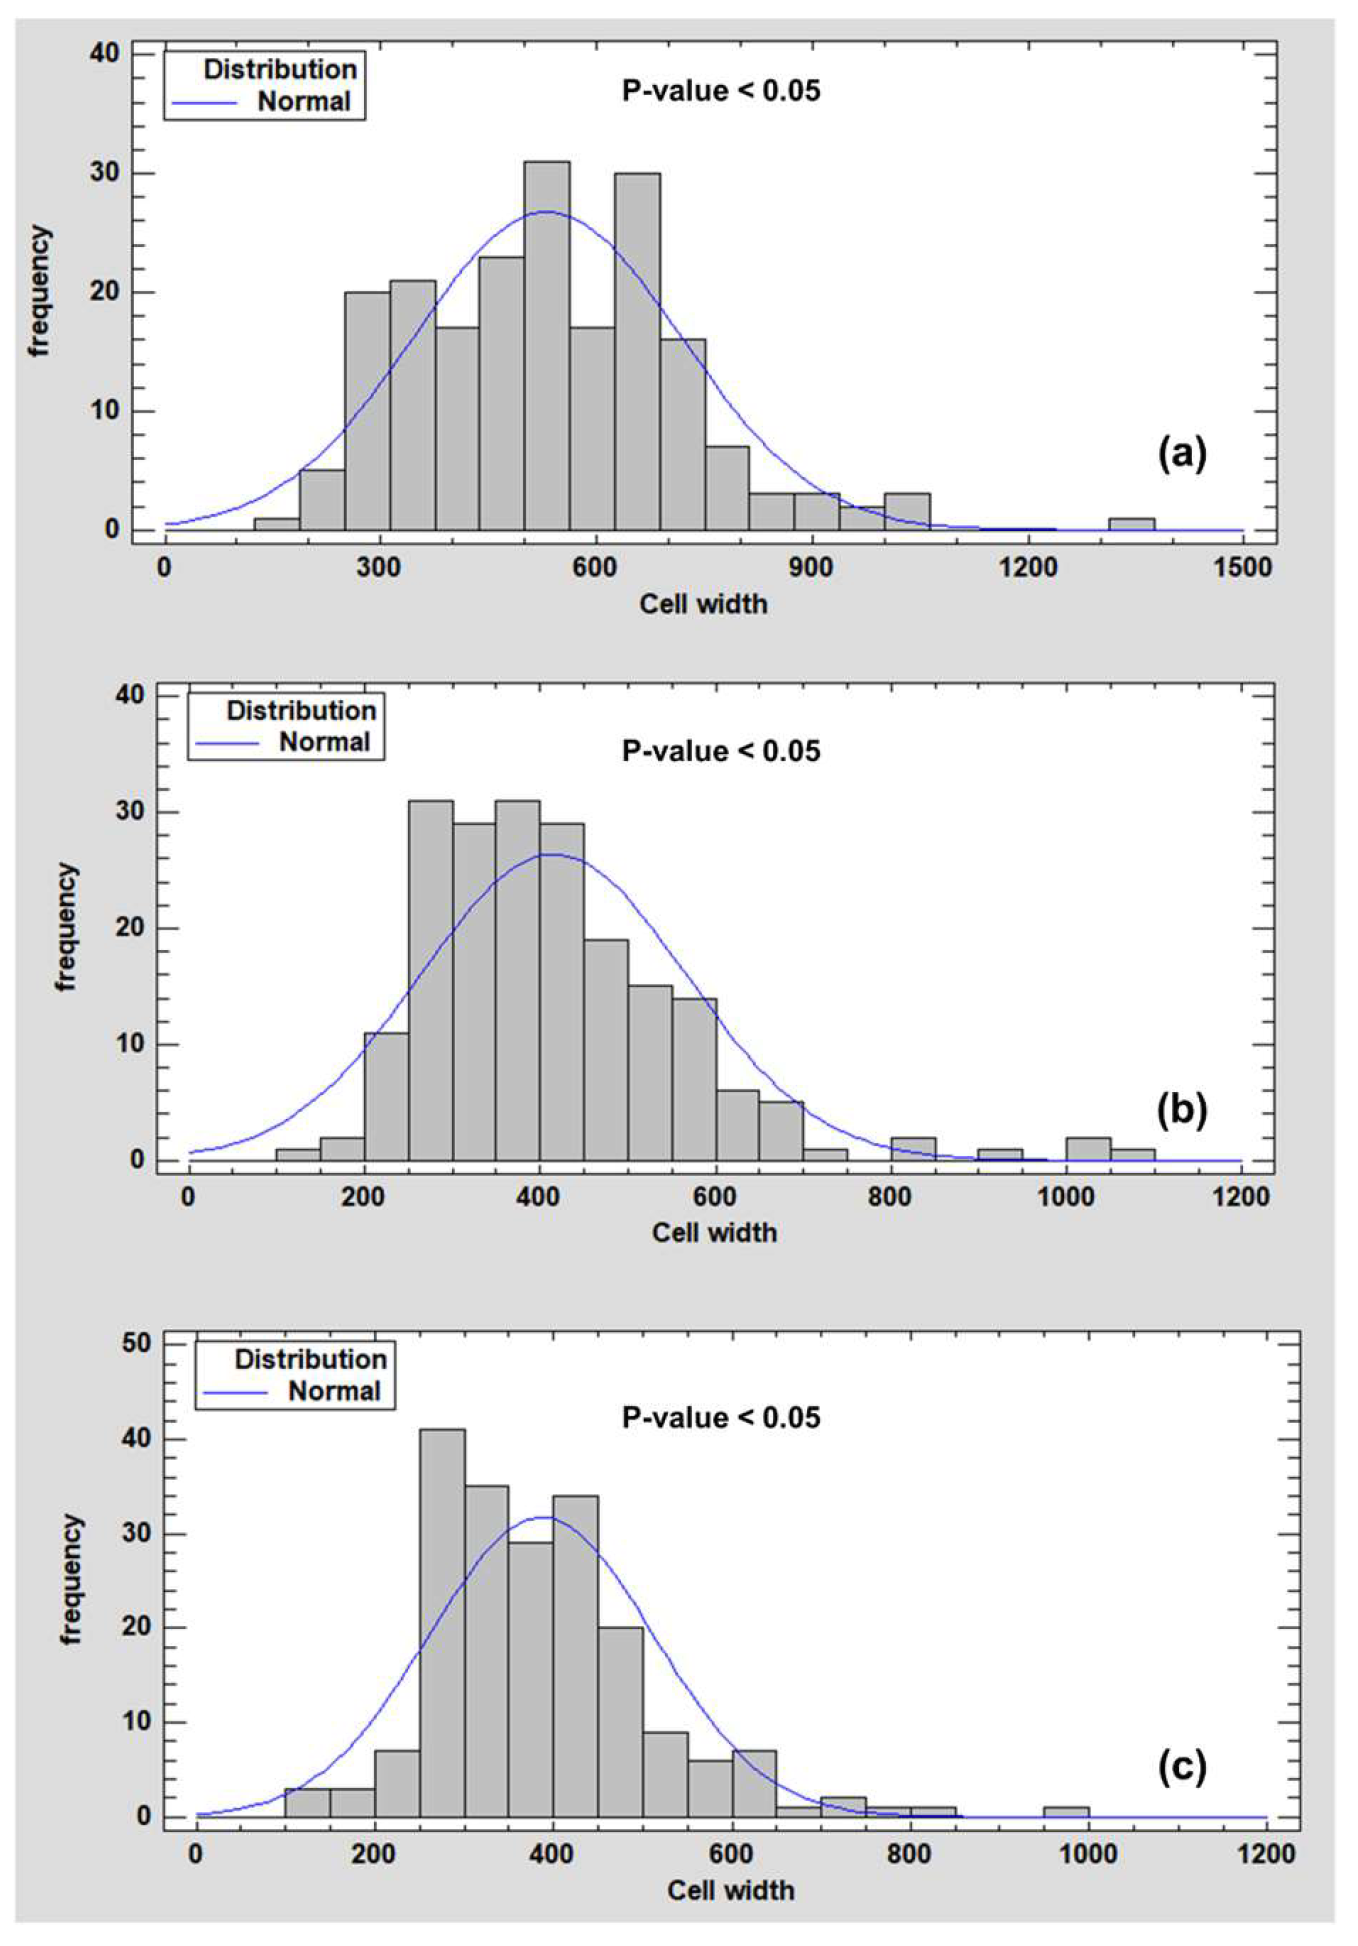
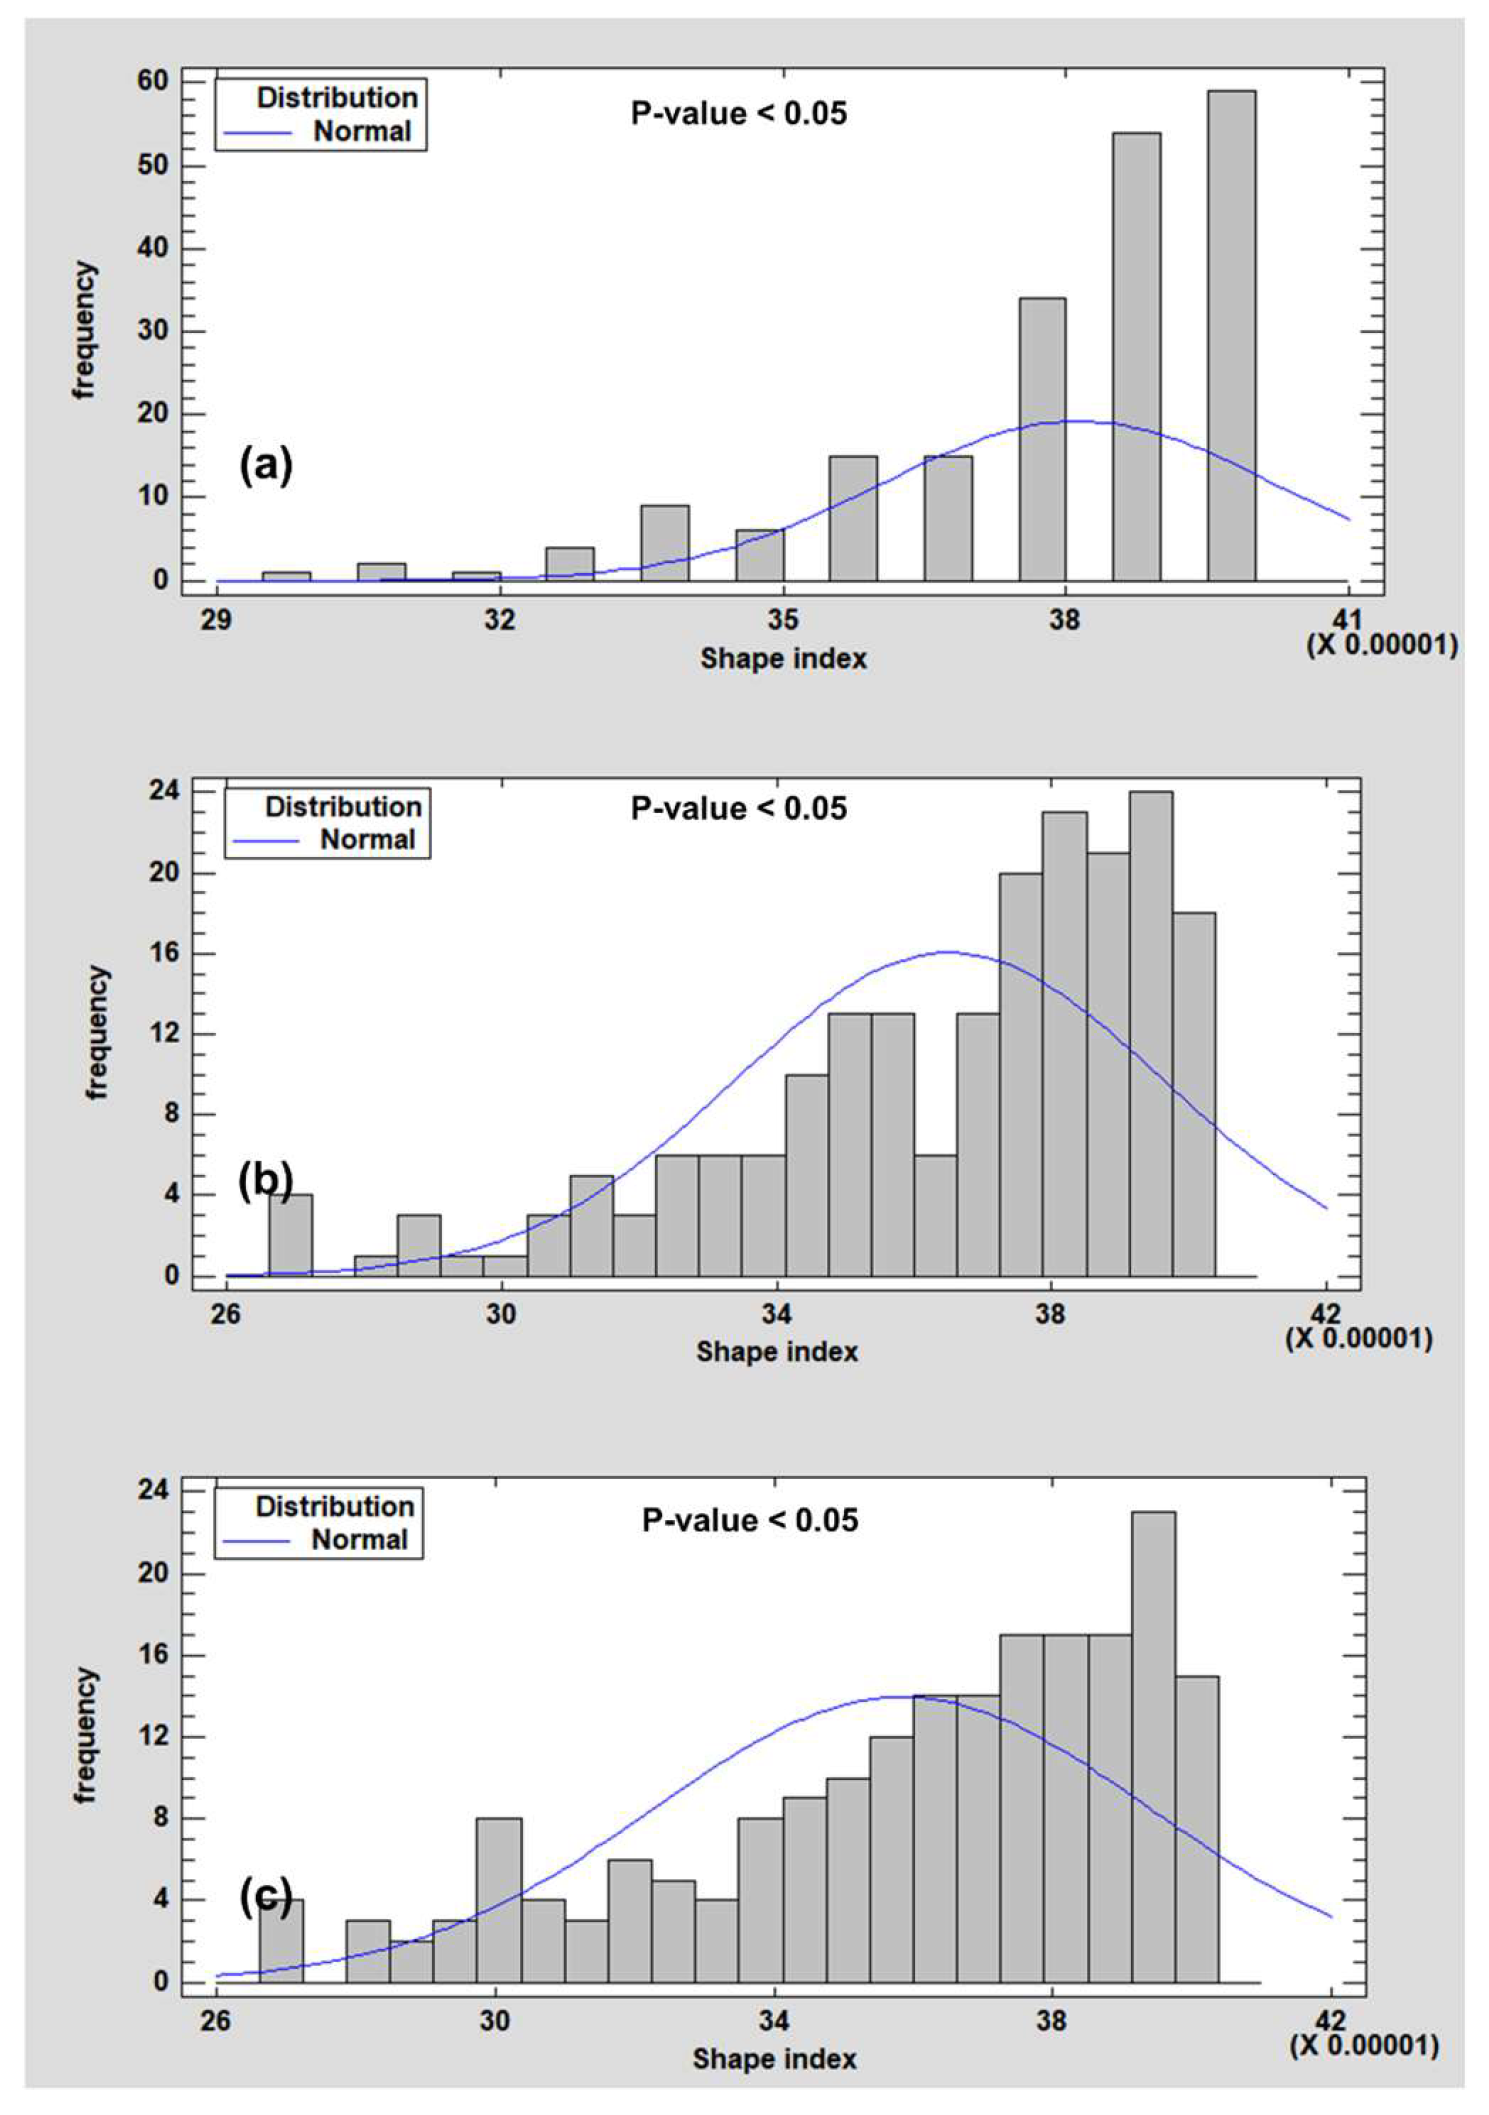
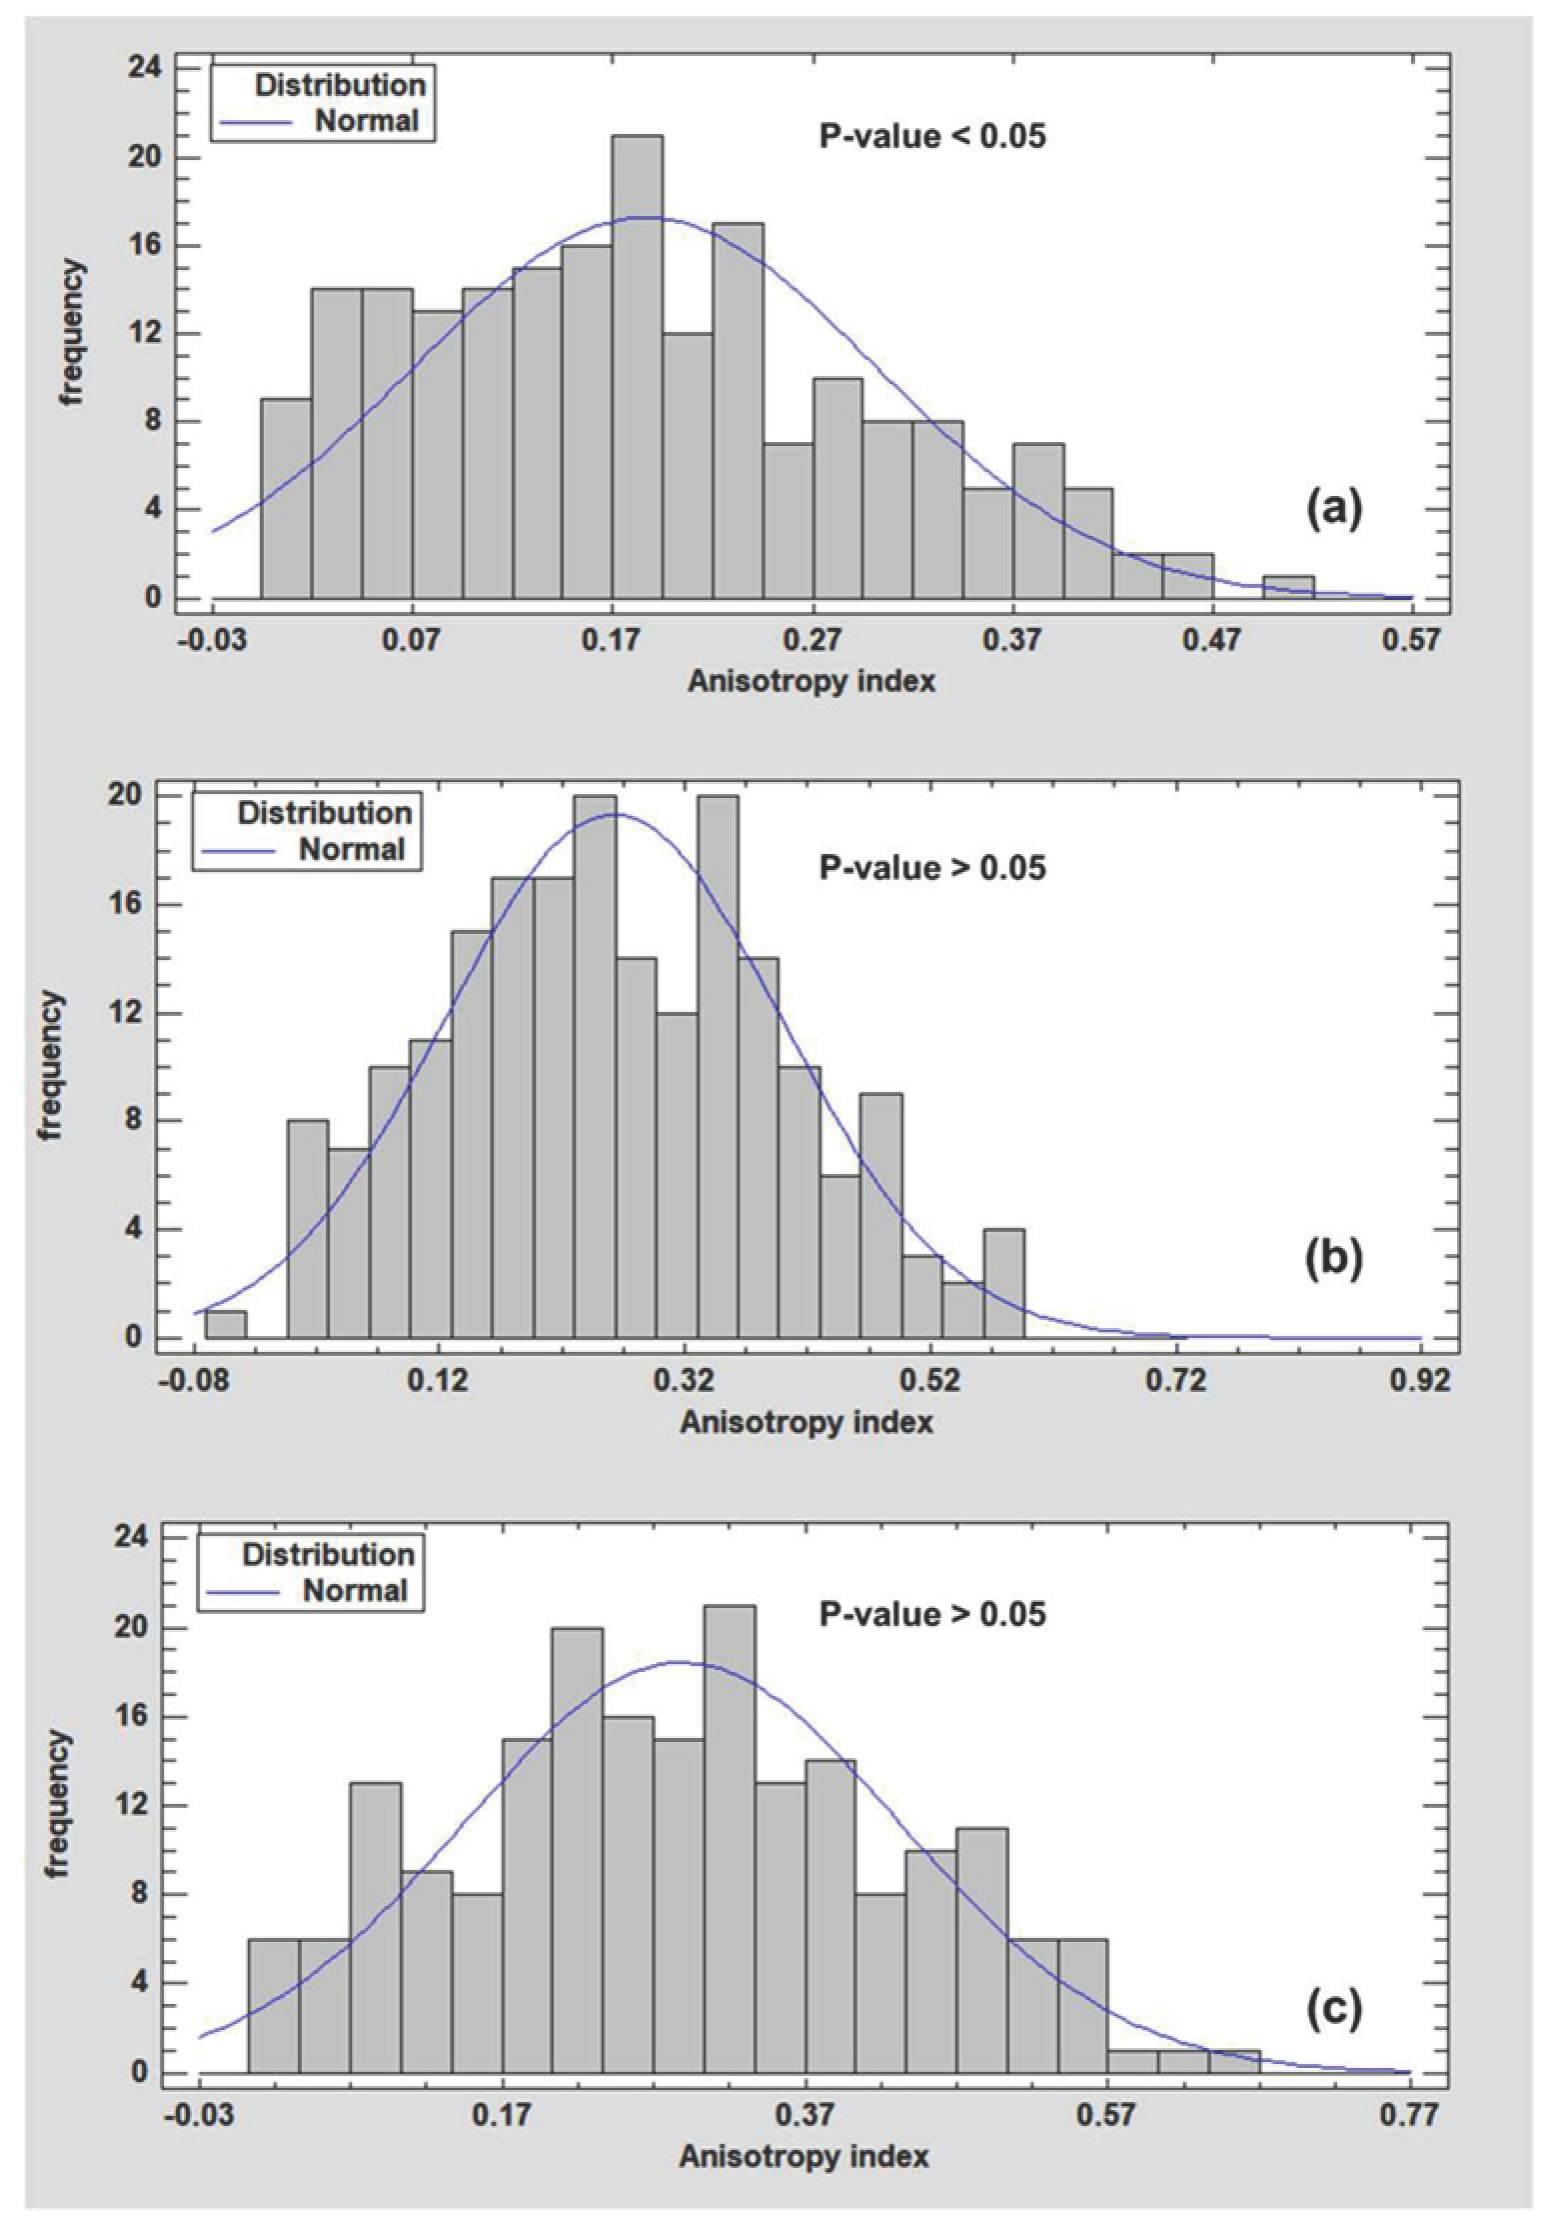
Histograms and bell curves for cell length and width (Figure 3 and Figure 4) exhibit a symmetrical distribution, confirming the Gaussian nature of these morphological features. This alignment with a Gaussian distribution suggests that these morphological features exhibit a typical and expected variability within the foam structure. A normal distribution is indicative of a balanced and symmetrical spread of data, emphasizing the inherent variability in cell length, width, and shape index. This conformity to a Gaussian pattern aligns with theoretical expectations, where cell dimensions are anticipated to exhibit a certain level of variability in a well-behaved foam structure. Similar distributions are observed for the shape index, further supporting the notion of typical and expected variability in cell shape Figure 5). In contrast, the anisotropy index data for the crown and lateral regions deviated from a Gaussian distribution (Figure 6). Notably, a markedly platykurtic character was observed in the concentration of data along the variation profile. The departure from a Gaussian distribution for anisotropy index in the crown and lateral regions suggests a distinct and non-uniform pattern in the orientation of cells within these areas. The platykurtic nature indicates a less concentrated distribution, emphasizing specific trends or behaviors in anisotropy.
Figure 3.
Histograms and bell curves for the obtained data for cell length. Here: (a) is core; (b) is crown; (c) is lateral edge.
Figure 4.
Histograms and bell curves for the obtained data for cell width. Here: (a) is core; (b) is crown; (c) is lateral edge.
Figure 5.
Histograms and bell curves for the obtained data for shape index. Here: (a) is core; (b) is crown; (c) is lateral edge.
Figure 6.
Histograms and bell curves for the obtained data for anisotropy index. Here (a) is core; (b) is crown; (c) is lateral edge.
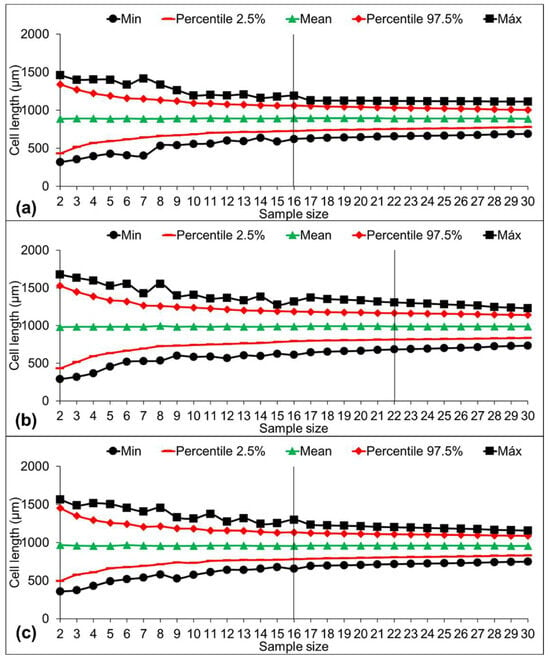
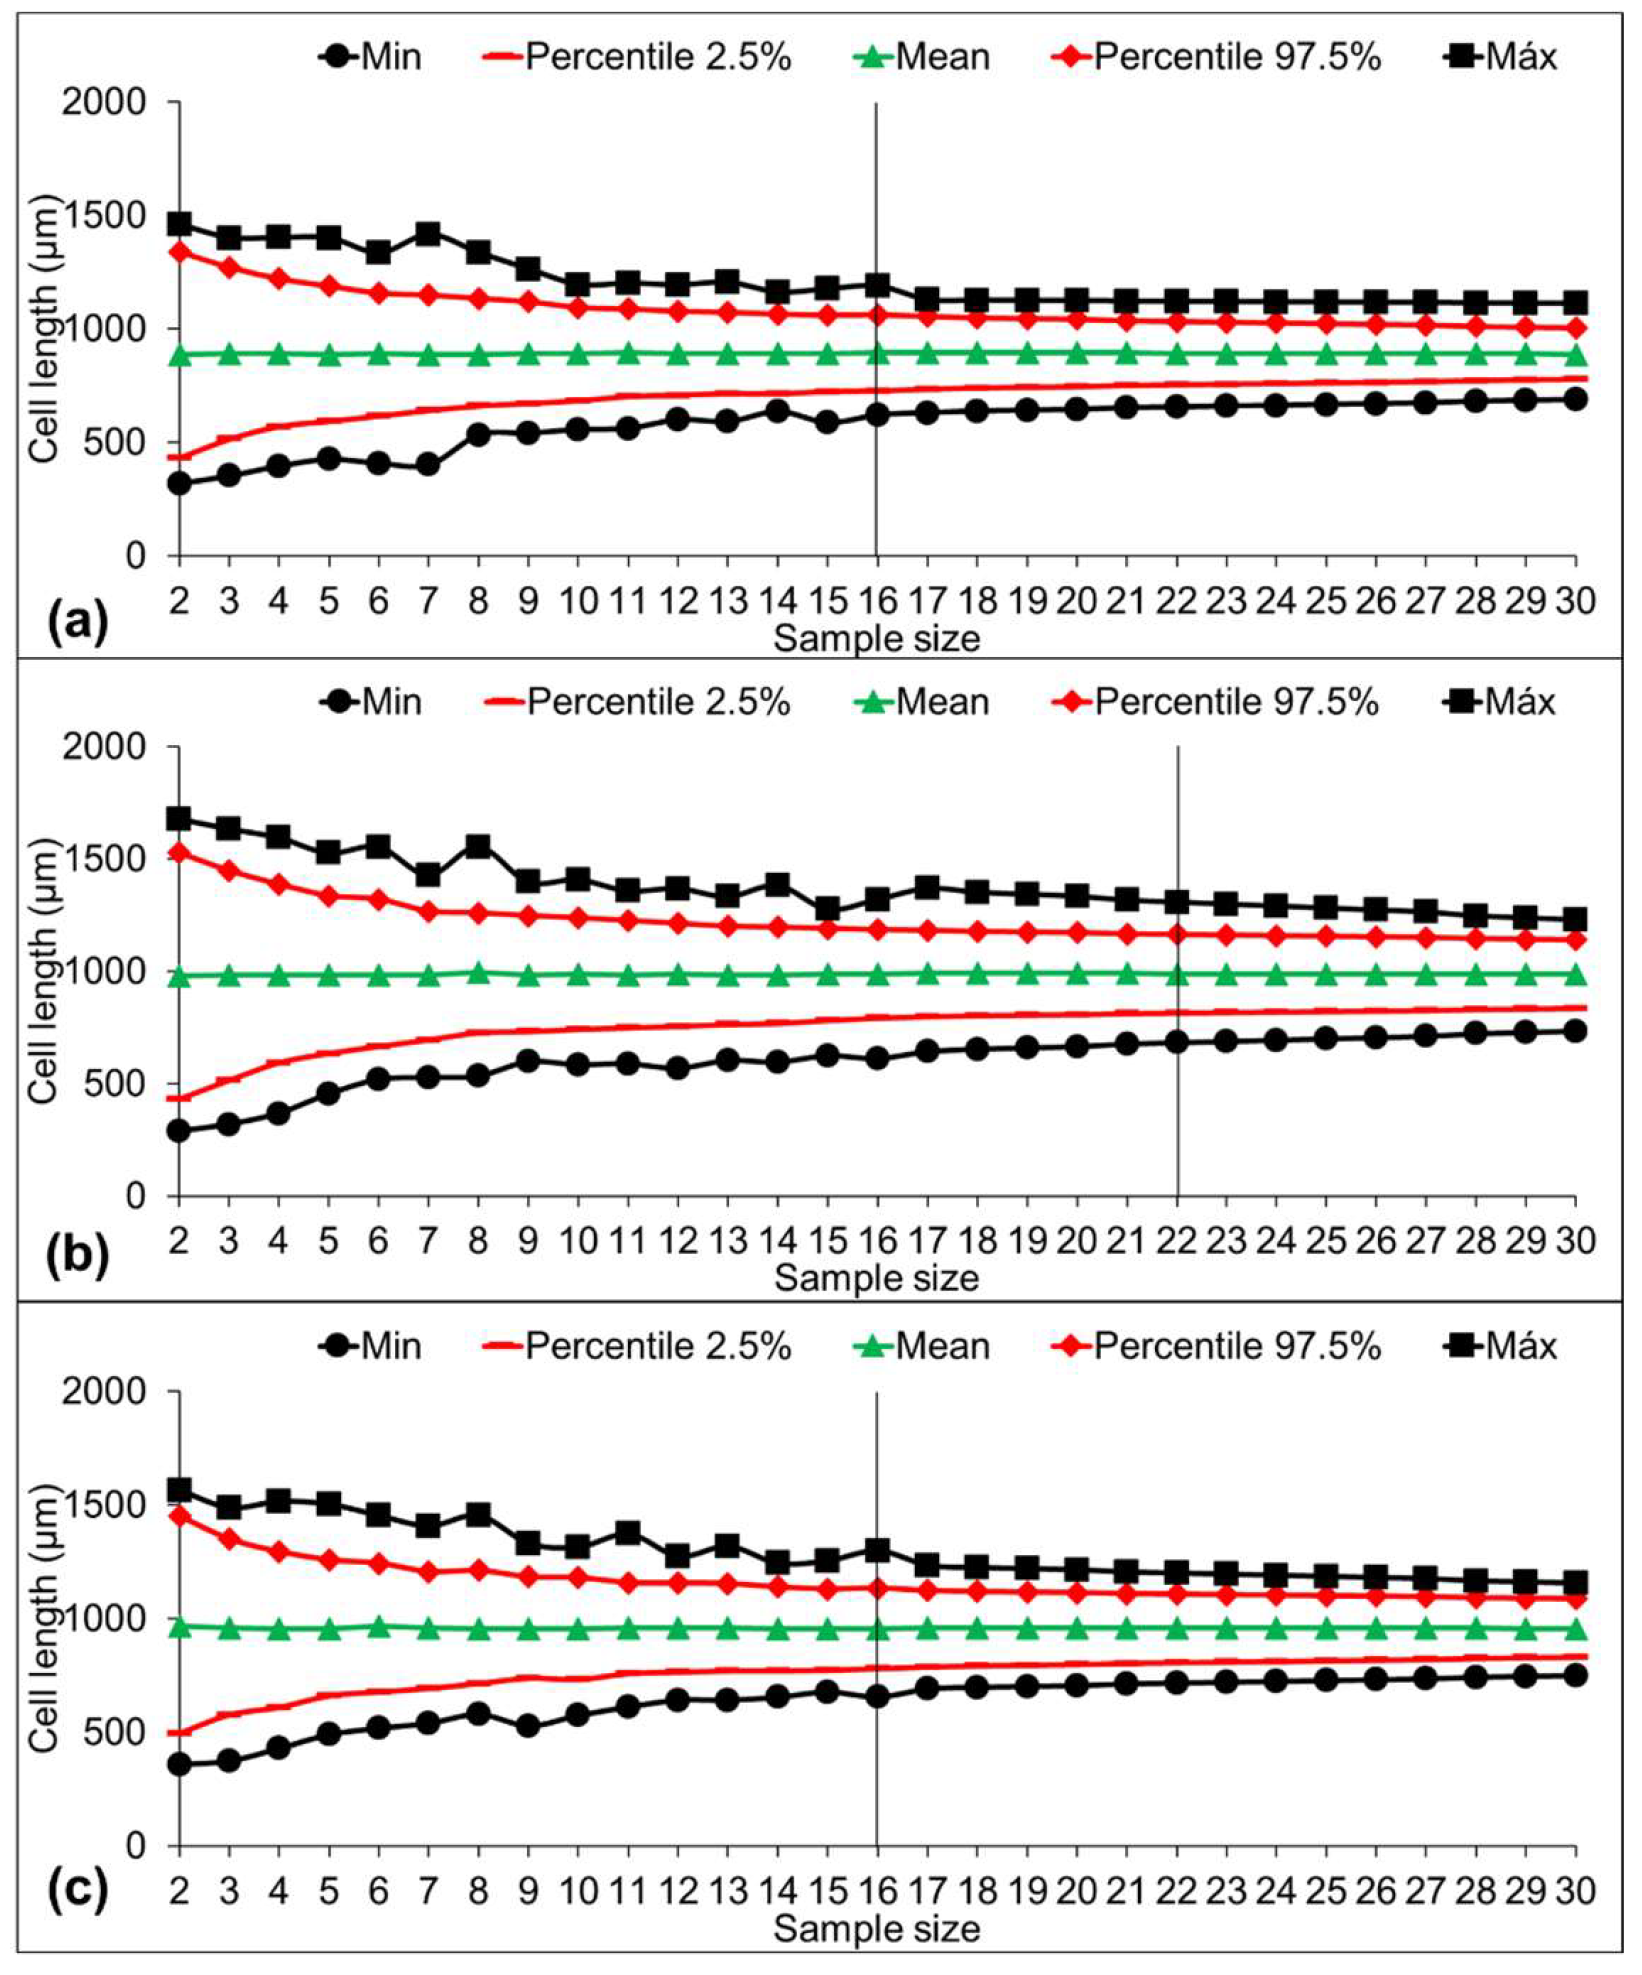
In assessing optimal sample sizes for cell length data, for the crown region, characterized by a disorderly and elliptical or flattened cell pattern, Figure 7 indicates that an optimal sample size of 22 cells ensures a comprehensive representation. This larger sample accommodates the diversity in cell shapes within the crown region, reflecting the need to capture the inherent variability introduced by irregular cell structures. In contrast, both the core and lateral regions exhibit more ordered and structured arrangements of cells. Here, a reduced sample size of 16 cells proves sufficient to capture the characteristic cell patterns. The regularity in cell shapes and the absence of significant disorder in these regions contribute to a diminished sample size requirement.
Figure 7.
Monte Carlo confidence intervals for means for cell length. Here: (a) is core; (b) is crown; (c) is lateral edge.
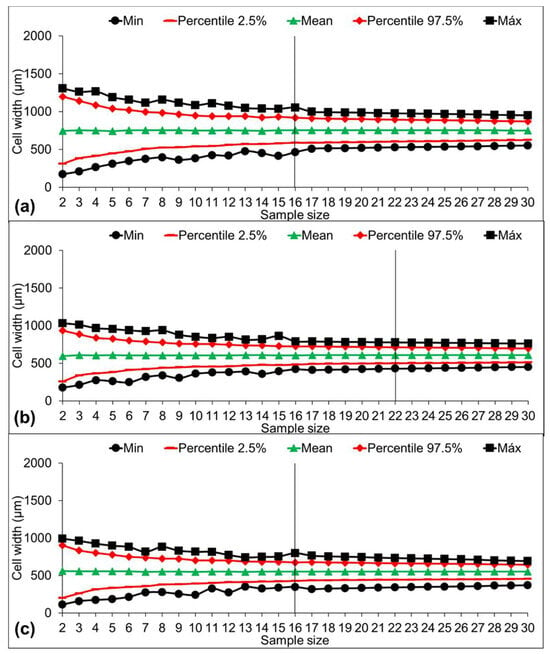
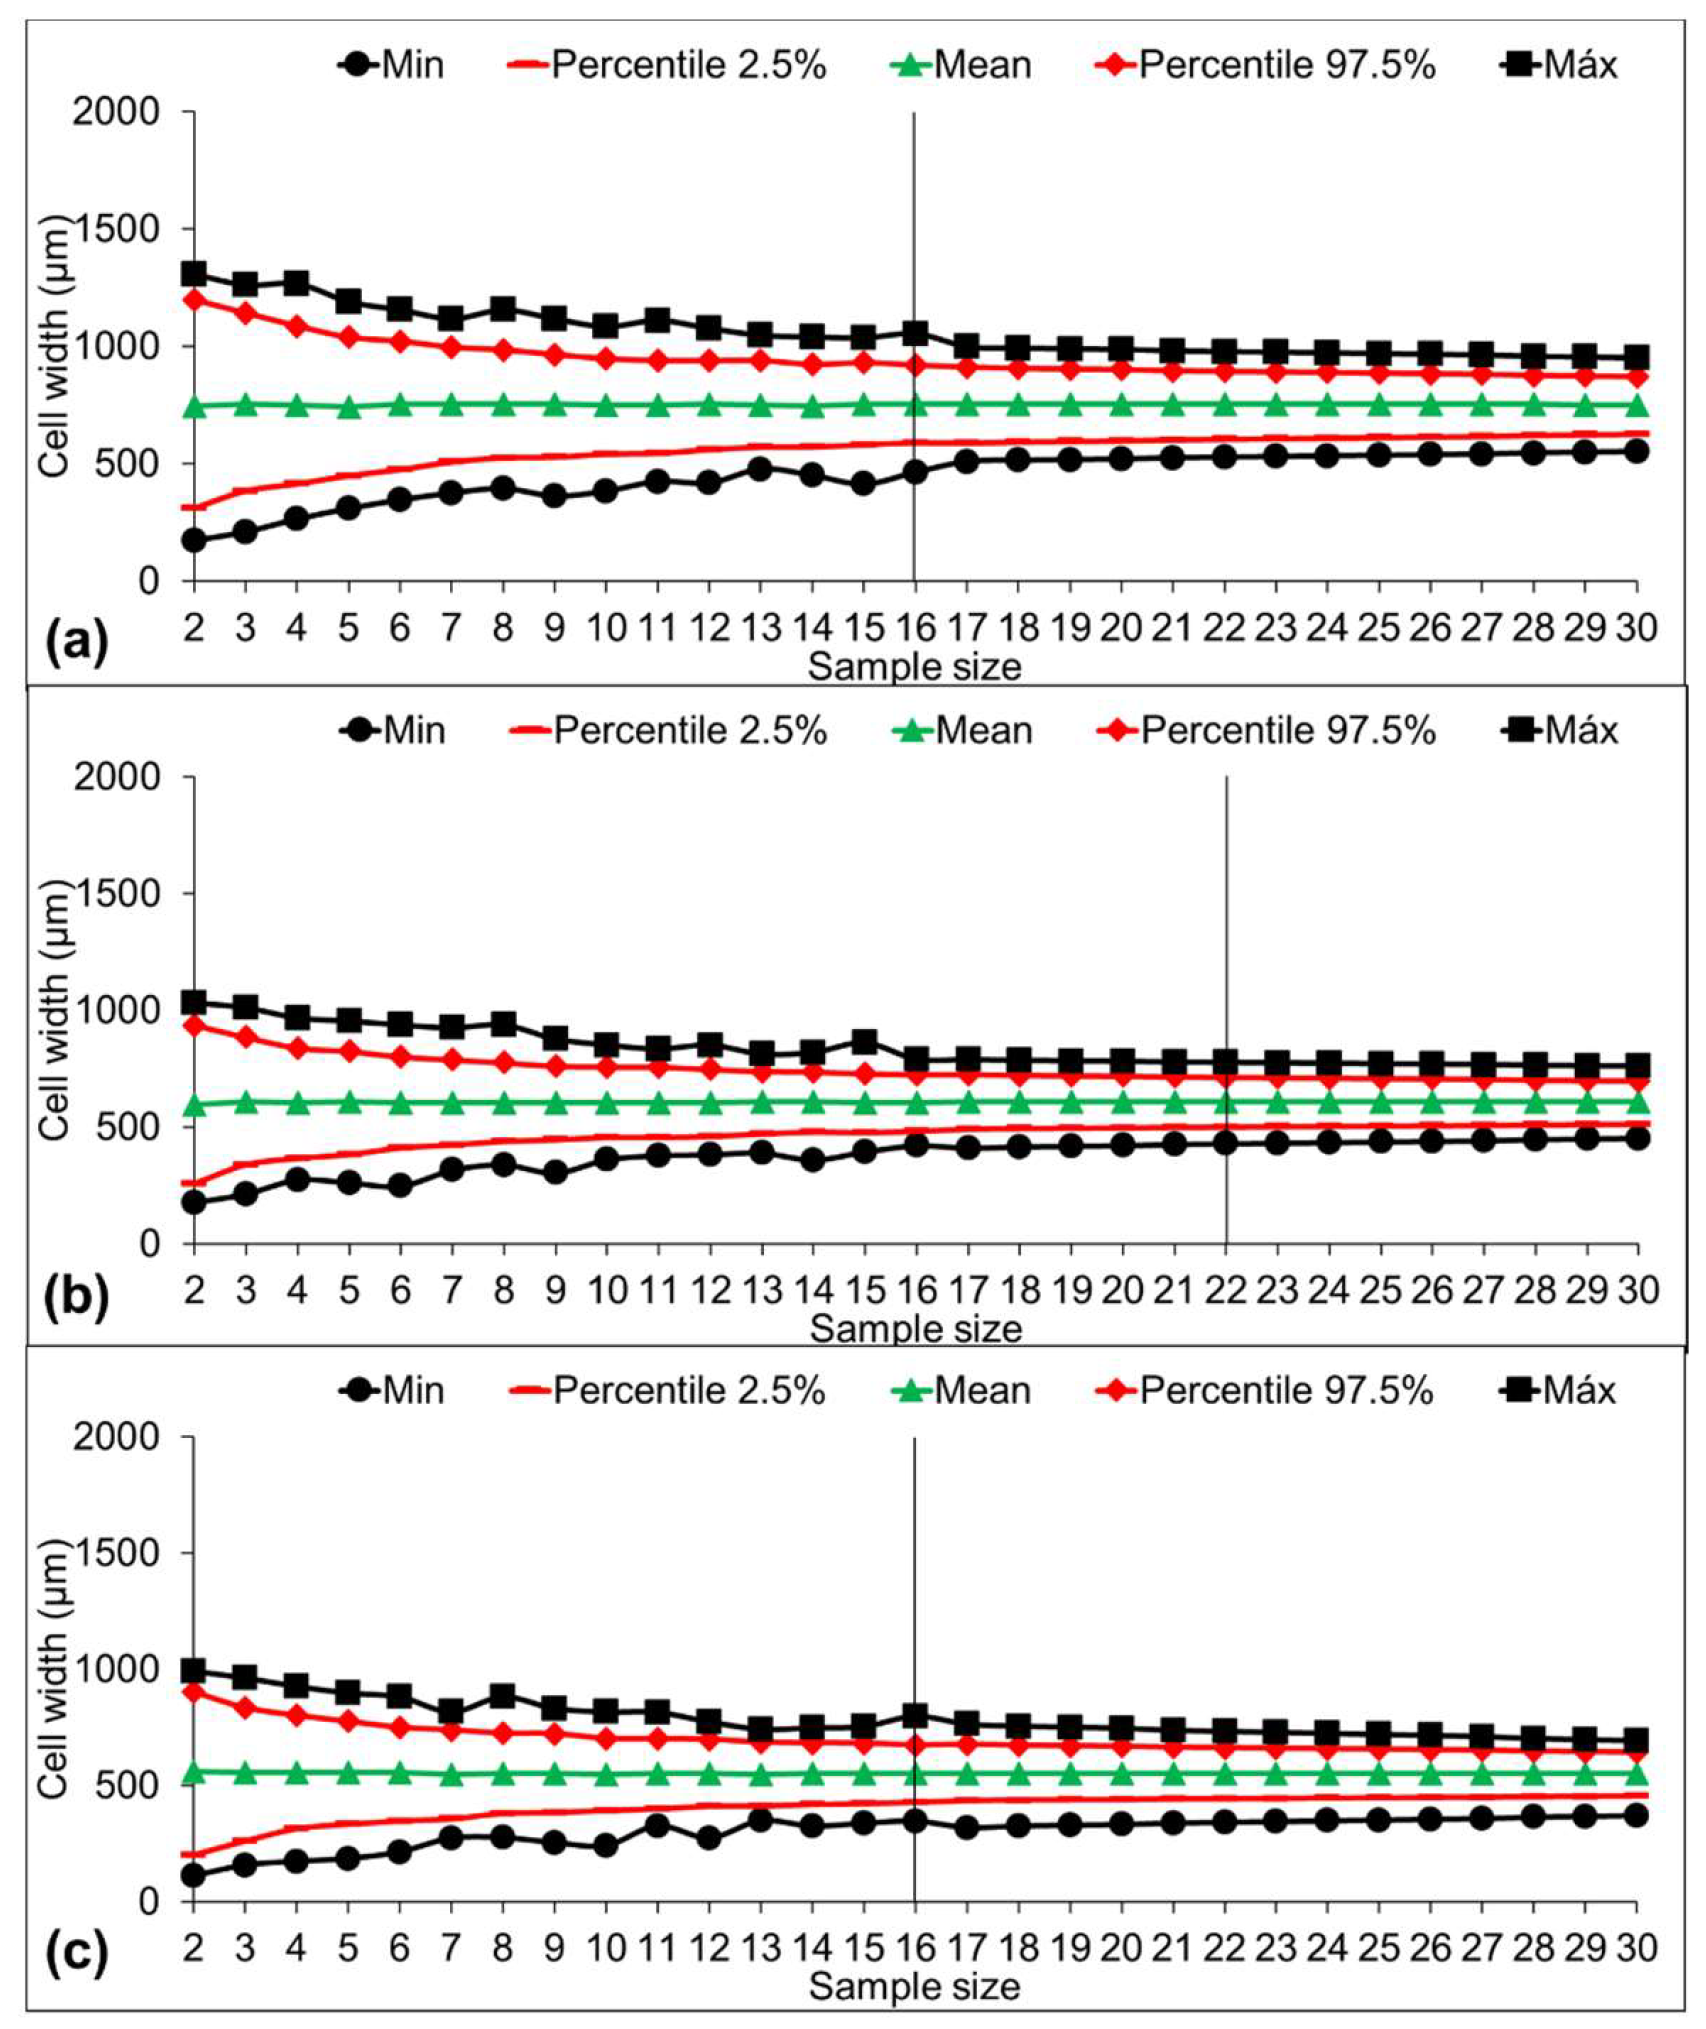
The investigation into cell width, as depicted in Figure 8, reveals that the core and lateral regions exhibited more homogeneity in cell size, as evidenced by the lower demand for cell measurements. The smaller sample sizes (n = 16) deemed sufficient for both core and lateral areas indicate a higher degree of consistency in cell width within these regions. This aligns with the aforementioned theoretical understanding that foam core and lateral cells, being less exposed to external constraints or irregularities, tend to display more uniform structural features. Contrastingly, the crown region presents a different scenario, necessitating a larger sample size (n = 22) for comprehensive measurements. This disparity in sample size requirements reaffirms the notion that the crown, characterized by irregular cell structures and a higher degree of disorder, demands a more extensive sampling approach.
Figure 8.
Monte Carlo confidence intervals for means for cell width. Here: (a) is core; (b) is crown; (c) is lateral edge.
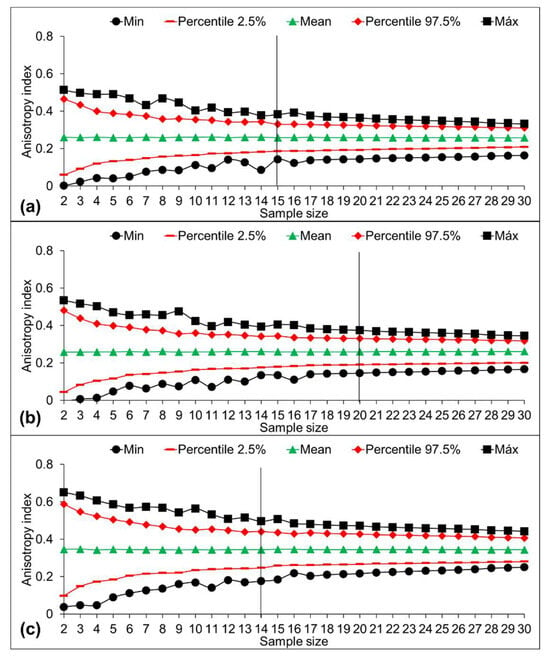
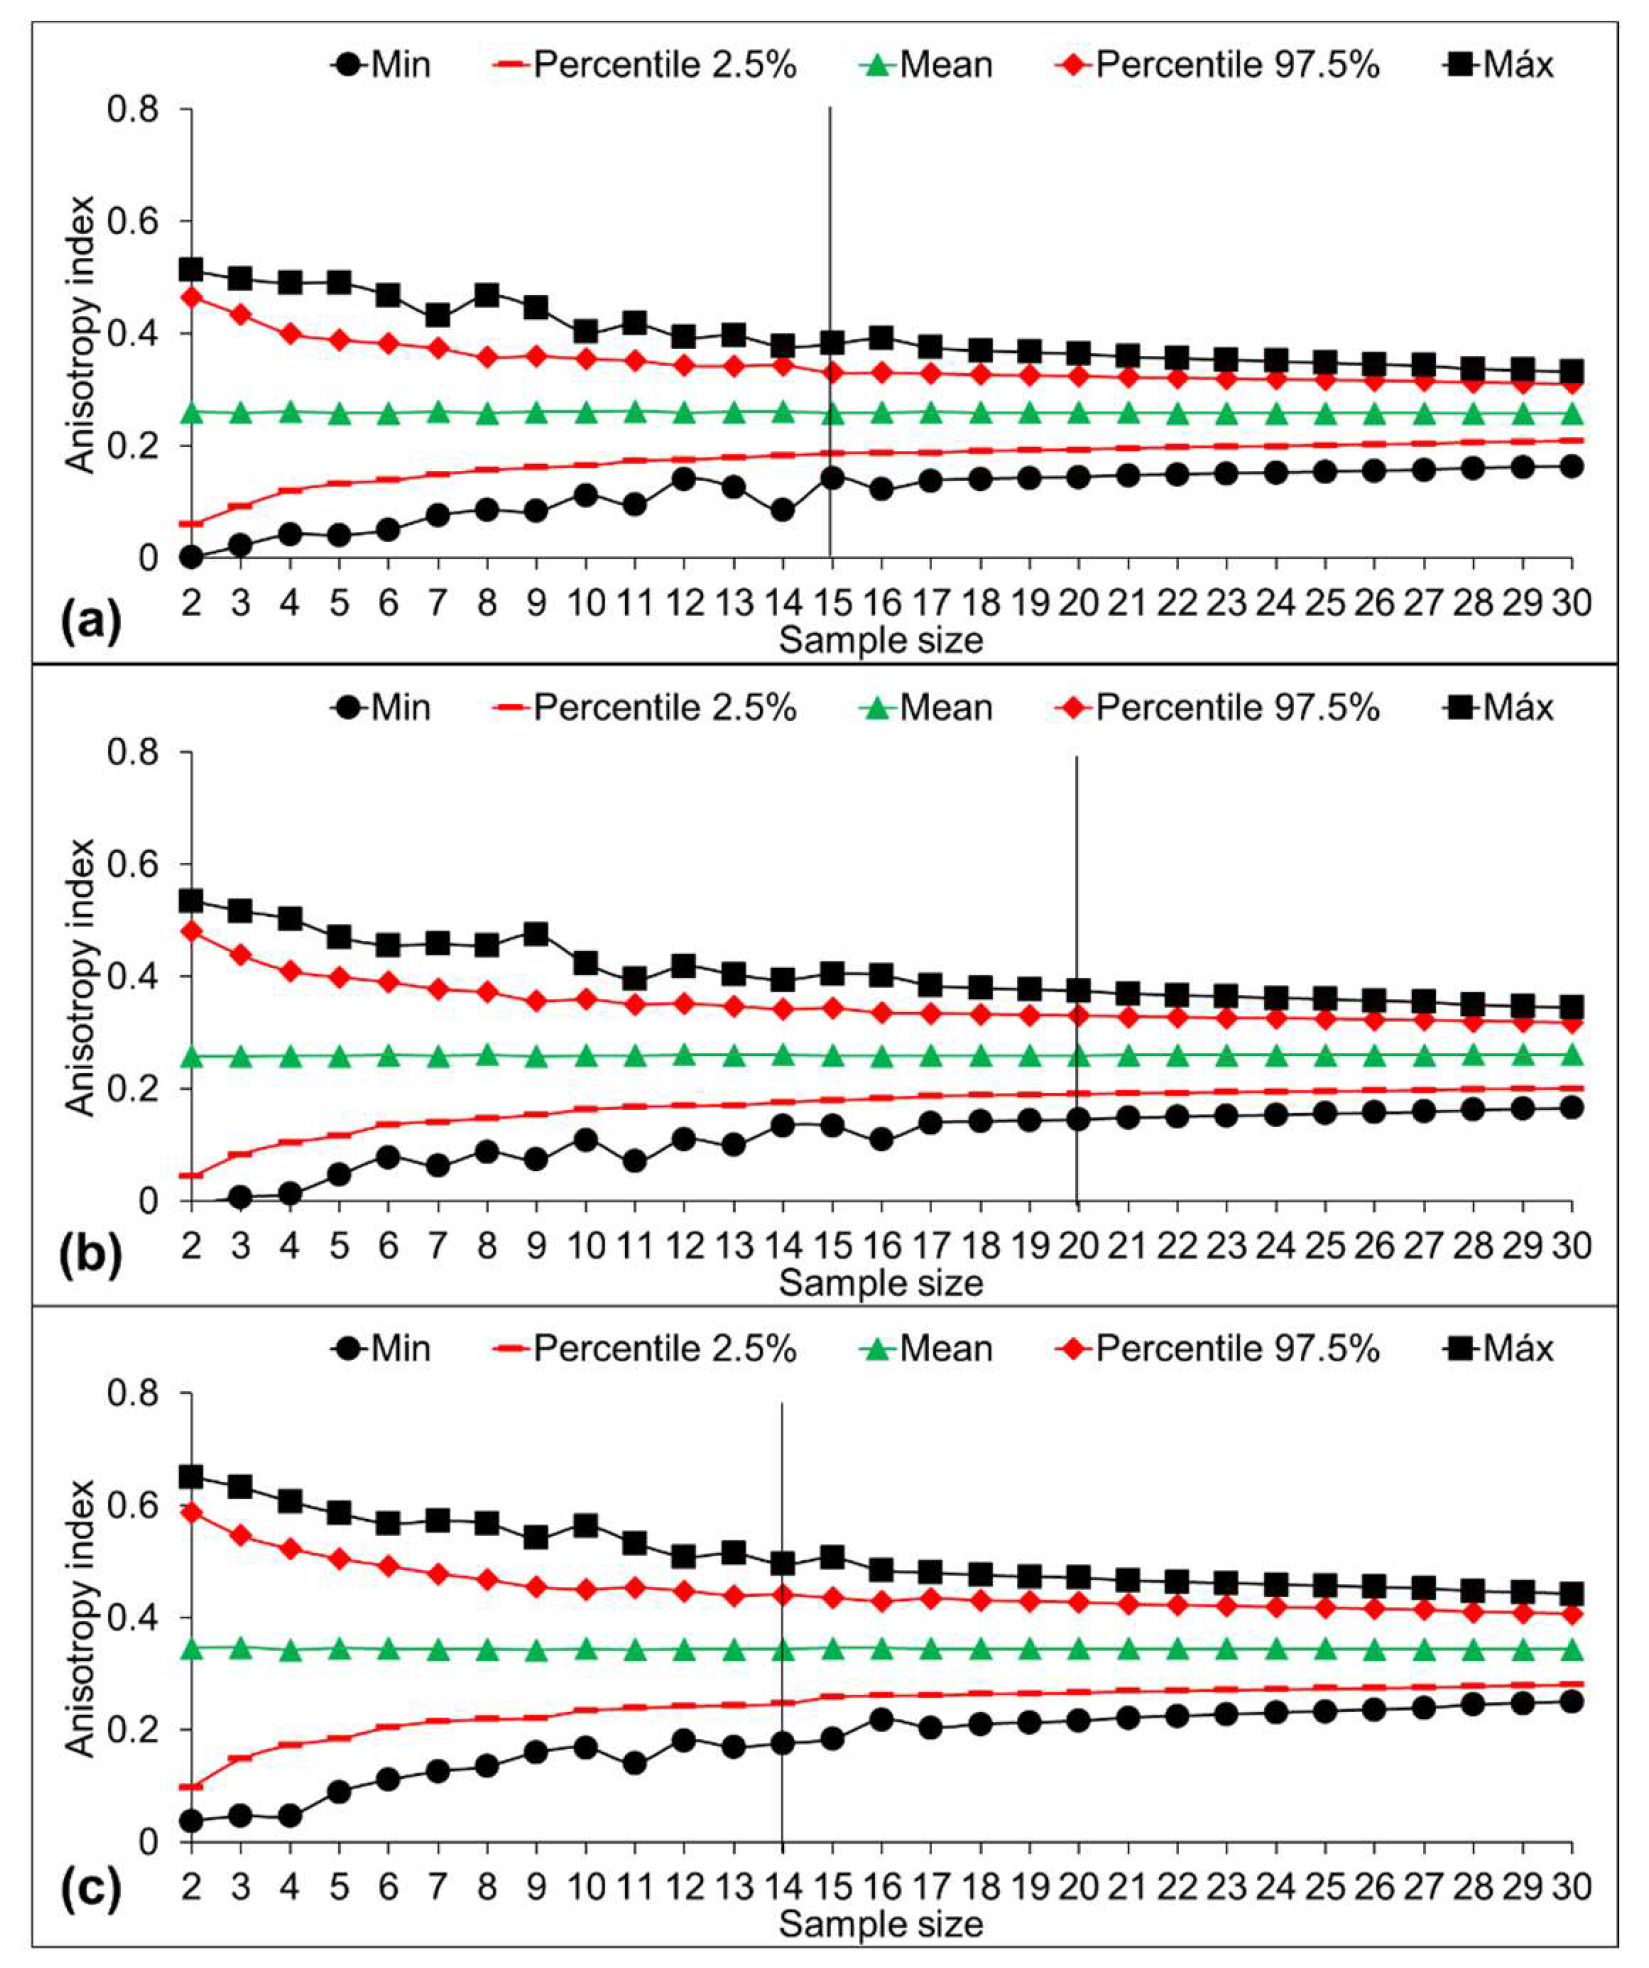
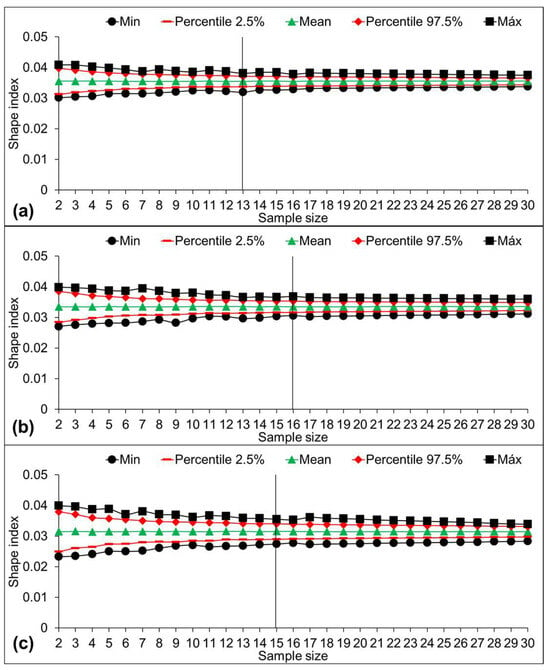
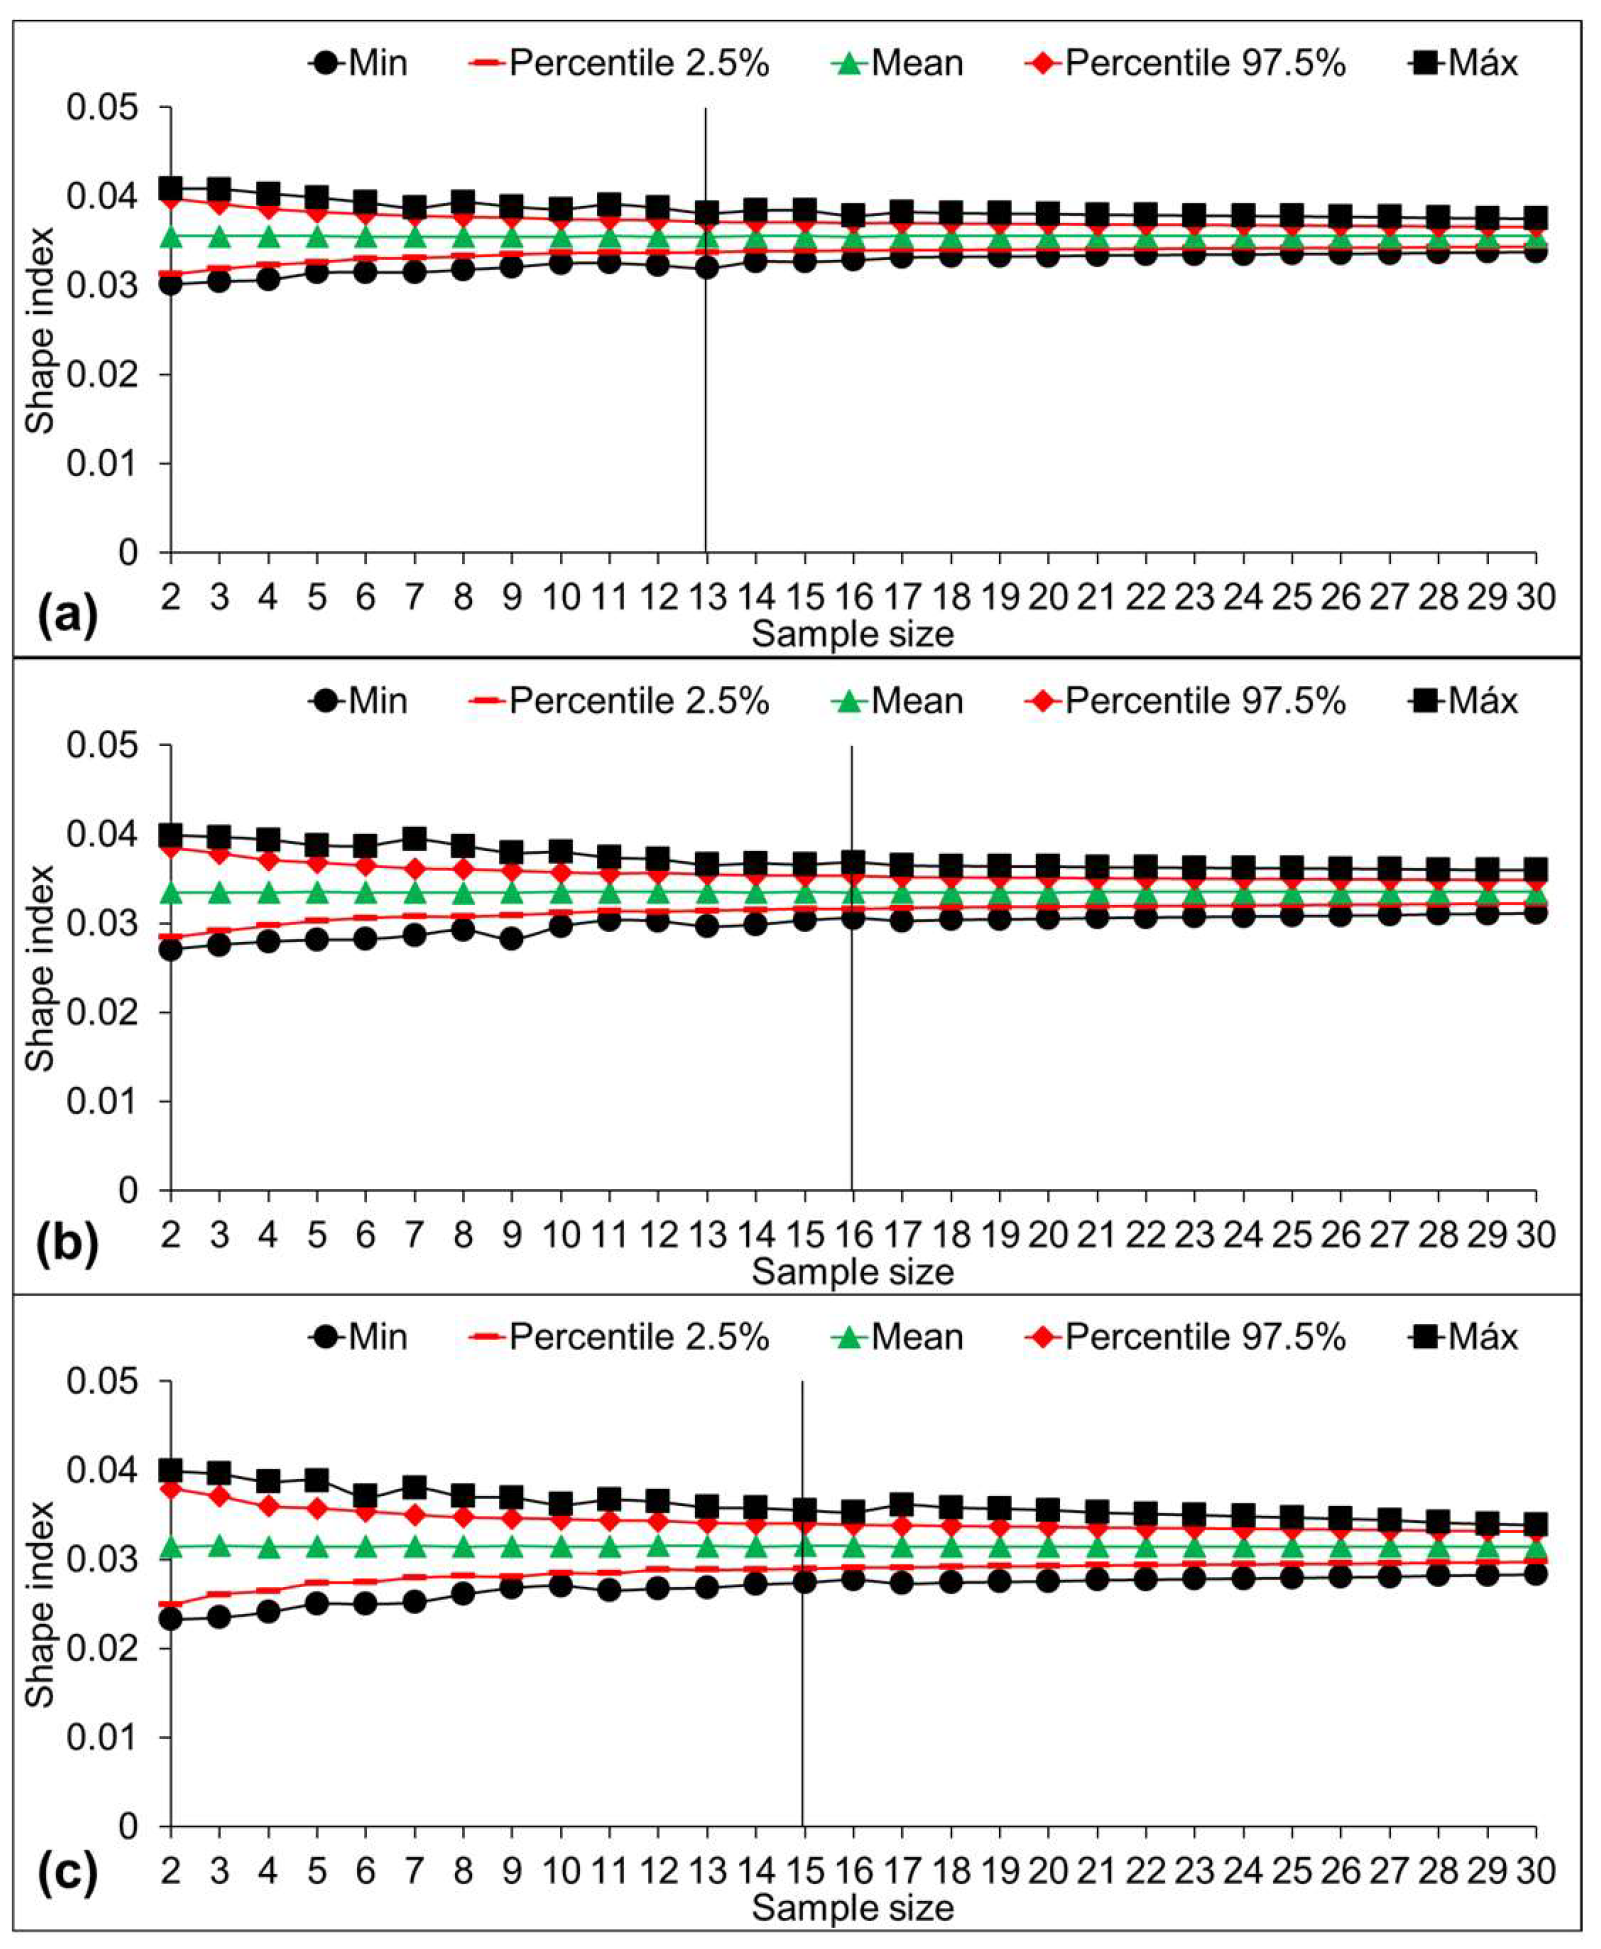
The examination of sample sufficiency for the anisotropy index (Figure 9) and shape index (Figure 10) provides further insights into the foam’s morphological characteristics, particularly focusing on dimensionless properties. These findings align with the trends observed in cell dimensions (length and width), emphasizing the importance of tailoring sampling strategies based on foam regions. In the context of the anisotropy index, which quantifies the degree of elongation or flattening of cells, the crown region again exhibited a higher demand for measurements. With a potential need for up to 20 samples in the worst-case scenario, the crown’s irregular and often elongated cell shapes contribute to the increased sample size requirements. Conversely, the core and lateral regions display a more consistent behavior, requiring fewer samples (ranging between 13 and 16) to achieve sample sufficiency for both the anisotropy and shape indexes.
Figure 9.
Monte Carlo confidence intervals for means for anisotropy index. Here: (a) is core; (b) is crown; (c) is lateral edge.
Figure 10.
Monte Carlo confidence intervals for means for shape index. Here: (a) is core; (b) is crown; (c) is lateral edge.
Among the morphological properties under investigation, the shape index exhibited the least variability, suggesting its potential limitation as a parameter for determining sample sufficiency. This can be attributed to the variables involved in its calculation, specifically the cell area (A) and the diameter squared (d2). This relationship implies that the shape index is less sensitive to changes in cell size, as both the numerator (A) and denominator (d2) involve dimensional properties. Consequently, variations in cell size may not strongly influence the shape index, contributing to its lower variability compared to other morphological parameters. Therefore, while the anisotropy index remains influenced by irregular cell shapes, the shape index proves less sensitive to changes in cell size, providing valuable insights into the limitations and strengths of different morphological parameters in foam studies.
4. Conclusions
The isotropic core cells, characterized by a nearly uniform and rounded shape, validate theoretical expectations of homogeneity and predictability. This homogeneity translates into lower variability and increased reliability in measurements, emphasizing the core’s potential as a region with more predictable foam properties. Conversely, the anisotropic and disoriented nature of crown and lateral cells introduces a higher degree of variability, impacting the predictability of foam properties. The complexities and variations in cell patterns within the crown region, in particular, necessitated a more extensive sampling approach. The crown’s considerably heterogeneous cell patterns confirm the different nucleation and growth conditions in this region. This observation aligns with broader statistical principles where increased variability demands larger sample sizes for robust and representative results. Among the morphological parameters studied, the shape index exhibited the least variability, suggesting its limited utility as a parameter for determining sample sufficiency. On the contrary, cell length and width emerged as crucial parameters, emphasizing the need for careful consideration of their variability in sampling protocols. However, it’s noteworthy that the observed differences in sample sufficiency are relatively small, and advancements in computational tools are expected to facilitate more precise and efficient cell measurements. For future studies, the recommended sample size of 22 cells, encompassing cell length, cell width, anisotropy index, and shape index, provides a robust foundation for morphological investigations across diverse polyurethane foams. Furthermore, future research avenues should explore the implications of sample sufficiency on mechanical and thermal properties, delving into the effects of observed morphological variations in the crown and lateral regions.
Author Contributions
Conceptualization, E.D.S.P., M.d.P.G. and R.d.A.D.; methodology, E.D.S.P. and M.d.P.G.; software, R.B.; validation, D.A.G., A.L.M. and R.d.A.D.; formal analysis, M.d.P.G., T.A.d.S. and R.d.P.N.; investigation, E.D.S.P., M.d.P.G., T.A.d.S. and R.d.P.N.; resources, R.B., D.A.G., A.L.M. and R.d.A.D.; data curation, E.D.S.P., M.d.P.G. and R.d.P.N.; writing—original draft preparation, E.D.S.P., M.d.P.G. and T.A.d.S.; writing—review and editing, R.B., D.A.G., A.L.M. and R.d.A.D.; visualization, T.A.d.S. and R.d.P.N.; supervision, D.A.G., A.L.M. and R.d.A.D.; project administration, R.d.A.D.; funding acquisition, R.B., D.A.G., A.L.M. and R.d.A.D. All authors have read and agreed to the published version of the manuscript.
Funding
This work was supported by the Coordination for the Improvement of Higher Education Personnel—CAPES (Finance Code 001), the National Council for Scientific and Technological Development—CNPq, and the Research Support Foundation of the State of Rio Grande do Sul—FAPERGS through the Programa Pesquisador Gaúcho (PqG), Call No. 09/2023 (Process No. 83240.812.19420.27032024).
Institutional Review Board Statement
Not applicable.
Informed Consent Statement
Not applicable.
Data Availability Statement
The original contributions presented in the study are included in the article, further inquiries can be directed to the corresponding author.
Acknowledgments
The authors would like to thank the Coordination for the Improvement of Higher-Level Education (CAPES) and the National Council for Scientific and Technological Development (CNPq) for the funding and financial support.
Conflicts of Interest
The authors declare no conflict of interest.
References
- Ivdre, A.; Abolins, A.; Volkovs, N.; Vevere, L.; Paze, A.; Makars, R.; Godina, D.; Rizikovs, J. Rigid Polyurethane Foams as Thermal Insulation Material from Novel Suberinic Acid-Based Polyols. Polymers 2023, 15, 3124. [Google Scholar] [CrossRef] [Scilit] [PubMed]
- Maiuolo, L.; Olivito, F.; Algieri, V.; Costanzo, P.; Jiritano, A.; Tallarida, M.A.; Tursi, A.; Sposato, C.; Feo, A.; De Nino, A. Synthesis, Characterization and Mechanical Properties of Novel Bio-Based Polyurethane Foams Using Cellulose-Derived Polyol for Chain Extension and Cellulose Citrate as a Thickener Additive. Polymers 2021, 13, 2802. [Google Scholar] [CrossRef] [Scilit] [PubMed]
- Kiss, G.; Rusu, G.; Bandur, G.; Hulka, I.; Romecki, D.; Péter, F. Advances in Low-Density Flexible Polyurethane Foams by Optimized Incorporation of High Amount of Recycled Polyol. Polymers 2021, 13, 1736. [Google Scholar] [CrossRef] [Scilit]
- Peyrton, J.; Avérous, L. Structure-Properties Relationships of Cellular Materials from Biobased Polyurethane Foams. Mater. Sci. Eng. R Rep. 2021, 145, 100608. [Google Scholar] [CrossRef] [Scilit]
- Andersons, J.; Kirpluks, M.; Cabulis, P.; Kalnins, K.; Cabulis, U. Bio-Based Rigid High-Density Polyurethane Foams as a Structural Thermal Break Material. Constr. Build. Mater. 2020, 260, 120471. [Google Scholar] [CrossRef] [Scilit]
- de Delucis, R.A.; Magalhães, W.L.E.; Petzhold, C.L.; Amico, S.C. Construction: Rigid Bio-Based Polyurethane Foams for Sandwich Panels. Encycl. Polym. Appl. 2018, 1–15. [Google Scholar] [CrossRef] [Scilit]
- Bhagavathula, K.B.; Meredith, C.S.; Ouellet, S.; Romanyk, D.L.; Hogan, J.D. Density, Strain Rate and Strain Effects on Mechanical Property Evolution in Polymeric Foams. Int. J. Impact Eng. 2022, 161, 104100. [Google Scholar] [CrossRef] [Scilit]
- Kerche, E.F.; de Delucis, R.A.; Petzhold, C.L.; Amico, S.C. Rigid Bio-Based Wood/Polyurethane Foam Composites Expanded under Confinement. J. Cell. Plast. 2021, 57, 757–768. [Google Scholar] [CrossRef] [Scilit]
- Acosta, A.P.; Otoni, C.G.; Missio, A.L.; Amico, S.C.; de Delucis, R.A. Rigid Polyurethane Biofoams Filled with Chemically Compatible Fruit Peels. Polymers 2022, 14, 4526. [Google Scholar] [CrossRef] [Scilit] [PubMed]
- Węgrzyk, G.; Grzęda, D.; Ryszkowska, J. The Effect of Mixing Pressure in a High-Pressure Machine on Morphological and Physical Properties of Free-Rising Rigid Polyurethane Foams—A Case Study. Materials 2023, 16, 857. [Google Scholar] [CrossRef] [Scilit]
- Beverte, I.; Cabulis, U.; Andersons, J.; Kirpluks, M.; Skruls, V.; Cabulis, P. Anisotropy and Mechanical Properties of Nanoclay Filled, Medium-Density Rigid Polyurethane Foams Produced in a Sealed Mold, from Renewable Resources. Polymers 2023, 15, 2582. [Google Scholar] [CrossRef] [Scilit] [PubMed]
- Ji, Y.; Chen, S.; Zhu, W. The Effect of Pore Numbers in the Cell Walls of Soybean Oil Polyurethane Foam on Sound Absorption Performance. Appl. Acoust. 2020, 157, 107010. [Google Scholar] [CrossRef] [Scilit]
- Polaczek, K.; Kurańska, M.; Malewska, E.; Czerwicka-Pach, M.; Prociak, A. From Bioresources to Thermal Insulation Materials: Synthesis and Properties of Two-Component Open-Cell Spray Polyurethane Foams Based on Bio-Polyols from Used Cooking Oil. Materials 2023, 16, 6139. [Google Scholar] [CrossRef] [Scilit]
- Andersons, J.; Grūbe, R.; Vēvere, L.; Cābulis, P.; Kirpluks, M. Anisotropic Thermal Expansion of Bio-Based Rigid Low-Density Closed-Cell Polyurethane Foams. J. Mater. Res. Technol. 2022, 16, 1517–1525. [Google Scholar] [CrossRef] [Scilit]
- Kairyte, A.; Kremensas, A.; Balčiunas, G.; Członka, S.; Strakowska, A. Closed Cell Rigid Polyurethane Foams Based on Low Functionality Polyols: Research of Dimensional Stability and Standardised Performance Properties. Materials 2020, 13, 1438. [Google Scholar] [CrossRef] [Scilit]
- Kurańska, M.; Ptak, M.; Malewska, E.; Prociak, A.; Barczewski, M.; Dymek, M.; Fernandes, F.A.O.; de Sousa, R.A.; Polaczek, K.; Studniarz, K.; et al. Cork Porous Biocomposites with Polyurethane Matrix Modified with Polyol Based on Used Cooking Oil. Materials 2023, 16, 3032. [Google Scholar] [CrossRef] [Scilit]
- Aramburu, A.B.; Gatto, D.A.; Beltrame, R.; Delucis, R.A. Sampling Sufficiency for Mechanical Properties of Wood. Maderas. Cienc. Tecnol. 2023, 25, 1–12. [Google Scholar] [CrossRef] [Scilit]
- El Hatka, H.; Hafidi, Y.; Ittobane, N. Exploring Urea Hard Segment Morphology and Phase Separation Behavior in Flexible Polyurethane Foam Formulations: Water, Lithium Chloride and Isocyanate Structure Effects. Polym. Polym. Compos. 2023, 31, 1–10. [Google Scholar] [CrossRef] [Scilit]
- Cimavilla-Román, P.; Pérez-Tamarit, S.; Santiago-Calvo, M.; Rodríguez-Pérez, M.Á. Influence of Silica Aerogel Particles on the Foaming Process and Cellular Structure of Rigid Polyurethane Foams. Eur. Polym. J. 2020, 135, 109884. [Google Scholar] [CrossRef] [Scilit]
- Marvi-Mashhadi, M.; Lopes, C.S.; LLorca, J. High Fidelity Simulation of the Mechanical Behavior of Closed-Cell Polyurethane Foams. J. Mech. Phys. Solids 2020, 135, 103814. [Google Scholar] [CrossRef] [Scilit]
- Xiao, Y.; Yin, J.; Zhang, X.; An, X.; Xiong, Y.; Sun, Y. Mechanical Performance and Cushioning Energy Absorption Characteristics of Rigid Polyurethane Foam at Low and High Strain Rates. Polym. Test. 2022, 109, 107531. [Google Scholar] [CrossRef] [Scilit]
- Kurańska, M.; Pinto, J.A.; Salach, K.; Barreiro, M.F.; Prociak, A. Synthesis of Thermal Insulating Polyurethane Foams from Lignin and Rapeseed Based Polyols: A Comparative Study. Ind. Crops Prod. 2020, 143, 111882. [Google Scholar] [CrossRef] [Scilit]
- Belda, R.; Palomar, M.; Marco, M.; Vercher-Martínez, A.; Giner, E. Open Cell Polyurethane Foam Compression Failure Characterization and Its Relationship to Morphometry. Mater. Sci. Eng. C 2021, 120, 111754. [Google Scholar] [CrossRef] [Scilit]
- Polaczek, K.; Kurańska, M.; Auguścik-Królikowska, M.; Prociak, A.; Ryszkowska, J. Open-Cell Polyurethane Foams of Very Low Density Modified with Various Palm Oil-Based Bio-Polyols in Accordance with Cleaner Production. J. Clean. Prod. 2021, 290, 125875. [Google Scholar] [CrossRef] [Scilit]
- Rahimidehgolan, F.; Altenhof, W. Compressive Behavior and Deformation Mechanisms of Rigid Polymeric Foams: A Review. Compos. Part B Eng. 2023, 253, 110513. [Google Scholar] [CrossRef] [Scilit]
- Jonjaroen, V.; Ummartyotin, S.; Chittapun, S. Algal Cellulose as a Reinforcement in Rigid Polyurethane Foam. Algal Res. 2020, 51, 102057. [Google Scholar] [CrossRef] [Scilit]
- Iqbal, N.; Mubashar, A.; Ahmed, S.; Arif, N.; Din, E.U. Investigating Relative Density Effects on Quasi-Static Response of High-Density Rigid Polyurethane Foam (RPUF). Mater. Today Commun. 2022, 31, 103320. [Google Scholar] [CrossRef] [Scilit]
- Hössinger-Kalteis, A.; Reiter, M.; Jerabek, M.; Major, Z. Overview and Comparison of Modelling Methods for Foams. J. Cell. Plast. 2021, 57, 951–1001. [Google Scholar] [CrossRef] [Scilit]
- Członka, S.; Kerche, E.F.; Neves, R.M.; Strakowska, A.; Strzelec, K. Bio-Based Rigid Polyurethane Foam Composites Reinforced with Bleached Curauá Fiber. Int. J. Mol. Sci. 2021, 22, 11203. [Google Scholar] [CrossRef] [Scilit]
- Zemła, M.; Prociak, A.; Michałowski, S.; Cabulis, U.; Kirpluks, M.; Simakovs, K. Thermal Insulating Rigid Polyurethane Foams with Bio-Polyol from Rapeseed Oil Modified by Phosphorus Additive and Reactive Flame Retardants. Int. J. Mol. Sci. 2022, 23, 12386. [Google Scholar] [CrossRef] [Scilit]
- Kerche, E.F.; da Silva, V.D.; da Silveira Jankee, G.; Schrekker, H.S.; de Avila Delucis, R.; Irulappasamy, S.; Amico, S.C. Aramid Pulp Treated with Imidazolium Ionic Liquids as a Filler in Rigid Polyurethane Bio-Foams. J. Appl. Polym. Sci. 2021, 138, 1–9. [Google Scholar] [CrossRef] [Scilit]
- Andersons, J.; Kirpluks, M.; Cabulis, U. Reinforcement Efficiency of Cellulose Microfibers for the Tensile Stiffness and Strength of Rigid Low-Density Polyurethane Foams. Materials 2020, 13, 2725. [Google Scholar] [CrossRef] [Scilit]
- Kurańska, M.; Beneš, H.; Sałasińska, K.; Prociak, A.; Malewska, E.; Polaczek, K. Development and Characterization of “Green Open-Cell Polyurethane Foams” with Reduced Flammability. Materials 2020, 13, 5459. [Google Scholar] [CrossRef] [Scilit] [PubMed]
- Uram, K.; Leszczyńska, M.; Prociak, A.; Czajka, A.; Gloc, M.; Leszczyński, M.K.; Michałowski, S.; Ryszkowska, J. Polyurethane Composite Foams Synthesized Using Bio-polyols and Cellulose Filler. Materials 2021, 14, 3474. [Google Scholar] [CrossRef] [Scilit]
- Uram, K.; Kurańska, M.; Andrzejewski, J.; Prociak, A. Rigid Polyurethane Foams Modified with Biochar. Materials 2021, 14, 5616. [Google Scholar] [CrossRef] [Scilit]
- Grzęda, D.; Węgrzyk, G.; Leszczyńska, M.; Szczepkowski, L.; Gloc, M.; Ryszkowska, J. Viscoelastic Polyurethane Foams for Use as Auxiliary Materials in Orthopedics. Materials 2022, 15, 133. [Google Scholar] [CrossRef] [Scilit]
- Kamińska, K.; Barczewski, M.; Kurańska, M.; Malewska, E.; Polaczek, K.; Prociak, A. The Effect of a Chemical Foaming Agent and the Isocyanate Index on the Properties of Open-Cell Polyurethane Foams. Materials 2022, 15, 6087. [Google Scholar] [CrossRef] [Scilit]
- Kurańska, M.; Leszczyńska, M.; Malewska, E.; Prociak, A.; Ryszkowska, J. Implementation of Circular Economy Principles in the Synthesis of Polyurethane Foams. Polymers 2020, 12, 2068. [Google Scholar] [CrossRef] [Scilit] [PubMed]
- Sture, B.; Vevere, L.; Kirpluks, M.; Godina, D.; Fridrihsone, A.; Cabulis, U. Polyurethane Foam Composites Reinforced with Renewable Fillers for Cryogenic Insulation. Polymers 2021, 13, 4089. [Google Scholar] [CrossRef] [Scilit]
- Uram, K.; Prociak, A.; Vevere, L.; Pomilovskis, R.; Cabulis, U.; Kirpluks, M. Natural Oil-Based Rigid Polyurethane Foam Thermal Insulation Applicable at Cryogenic Temperatures. Polymers 2021, 13, 4276. [Google Scholar] [CrossRef] [Scilit]
- Zemła, M.; Prociak, A.; Michałowski, S. Bio-Based Rigid Polyurethane Foams Modified with Phosphorus Flame Retardants. Polymers 2022, 14, 102. [Google Scholar] [CrossRef] [Scilit]
- Barczewski, M.; Kurańska, M.; Sałasińska, K.; Aniśko, J.; Szulc, J.; Szafraniak-Wiza, I.; Prociak, A.; Polaczek, K.; Uram, K.; Surmacz, K.; et al. Comprehensive Analysis of the Influence of Expanded Vermiculite on the Foaming Process and Selected Properties of Composite Rigid Polyurethane Foams. Polymers 2022, 14, 4967. [Google Scholar] [CrossRef] [Scilit]
- Acosta, A.; Aramburu, A.B.; Beltrame, R.; Gatto, D.A.; Amico, S.; Labidi, J.; Delucis, R.D.A. Wood Flour Modified by Poly(Furfuryl Alcohol) as a Filler in Rigid Polyurethane Foams: Effect on Water Uptake. Polymers 2022, 14, 5510. [Google Scholar] [CrossRef] [Scilit]
- Da Silva, E.H.P.; De Barros, S.; Vieira, A.F.C.; Da Costa, R.R.C.; Ribeiro, M.L. Accelerated Aging on the Compression Properties of a Green Polyurethane Foam: Experimental and Numerical Analysis. Polymers 2023, 15, 1784. [Google Scholar] [CrossRef] [Scilit]
- Acosta, A.P.; Kairytė, A.; Członka, S.; Miedzińska, K.; Aramburu, A.B.; Barbosa, K.T.; Amico, S.C.; de Delucis, R.A. Rigid Polyurethane Biofoams Filled with Pine Seed Shell and Yerba Mate Wastes. Polymers 2023, 15, 2194. [Google Scholar] [CrossRef] [Scilit]
- Prociak, A.; Kucała, M.; Kurańska, M.; Barczewski, M. Effect of Selected Bio-Components on the Cell Structure and Properties of Rigid Polyurethane Foams. Polymers 2023, 15, 3660. [Google Scholar] [CrossRef] [Scilit] [PubMed]
- Constantinescu, D.M.; Apostol, D.A. Performance and Efficiency of Polyurethane Foams under the Influence of Temperature and Strain Rate Variation. J. Mater. Eng. Perform. 2020, 29, 3016–3029. [Google Scholar] [CrossRef] [Scilit]
- Srihanum, A.; Tuan Noor, M.T.I.; Devi, K.P.P.; Hoong, S.S.; Ain, N.H.; Mohd, N.S.; Nek Mat Din, N.S.M.; Kian, Y.S. Low Density Rigid Polyurethane Foam Incorporated with Renewable Polyol as Sustainable Thermal Insulation Material. J. Cell. Plast. 2022, 58, 485–503. [Google Scholar] [CrossRef] [Scilit]
- Vlasov, R.; Ryabova, D.; Zeynalova, S.; Nazmutdinov, M.; Ryabov, S. Effect of Small Amount of Functionalized Multi-Walled Carbon Nanotubes on the Properties of Rigid Polyisocyanurate and Polyurethane Foam Composites. Cell. Polym. 2023, 42, 123–139. [Google Scholar] [CrossRef] [Scilit]
- Missio, A.L.; Bayer, F.M.; Gatto, D.A.; de Cademartori, P.H.G. Sampling Sufficiency of the Anatomical Characteristics of Brazilian Hardwood Using the Resampling Method. Acta Sci. Technol. 2014, 36, 413. [Google Scholar] [CrossRef] [Scilit]

Disclaimer/Publisher’s Note: The statements, opinions and data contained in all publications are solely those of the individual author(s) and contributor(s) and not of MDPI and/or the editor(s). MDPI and/or the editor(s) disclaim responsibility for any injury to people or property resulting from any ideas, methods, instructions or products referred to in the content. |
© 2026 by the authors. Licensee MDPI, Basel, Switzerland. This article is an open access article distributed under the terms and conditions of the Creative Commons Attribution (CC BY) license.