


Abstract
Ultra-high performance concrete (UHPC) is widely used for its excellent compactness and durability. However, steel fibers in UHPC may form conductive paths, affecting electrochemical testing of internal rebars. To assess the applicability of current testing standards in UHPC, specimens of UHPC, high-performance concrete (HPC), and normal concrete (NC) with different cover thicknesses are designed. Open circuit potential (OCP), linear polarization resistance (LPR), and Tafel polarization curves are adopted to compare the corrosion behavior during 180 days of chloride immersion. Results show that UHPC has the most negative OCP, followed by NC and HPC. According to ASTM C876, this would indicate the highest corrosion risk for UHPC, contradicting its well-known superior chloride resistance. Hence, ASTM C876 is not applicable to UHPC. Corrosion current density (Icorr) is smallest in UHPC, followed by HPC and NC, consistent with chloride resistance ranking, indicating good applicability of the linear polarization method to UHPC. The anodic Tafel slope is larger than the cathodic one for all specimens, showing anodic control, unaffected by steel fibers. Larger cover thickness leads to higher OCP, higher polarization resistance, and lower Icorr. At 30 mm cover, internal rebars in UHPC are essentially non-corroded.
1. Introduction
Ultra-high performance concrete (UHPC) is made by mixing Portland cement, high-performance water reducers, accelerators, steel fibers, ground quartz sand, fine sand, and other materials. Compared with ordinary concrete, UHPC has ultra-high strength [1,2,3,4,5,6,7]. The compressive strength of UHPC exceeds 150 MPa, which is 5–6 times that of normal concrete (NC) and 2–3 times that of high-performance concrete (HPC) [8,9,10]. Due to its low water-to-binder ratio and the micro-filling effect of fine powders, UHPC has lower porosity and a better pore structure [11,12,13]. The porosities of NC and HPC are 20–25% and 10–15%, respectively, while the porosity of UHPC is generally 2–6%, thus endowing UHPC with excellent durability [14,15].
In recent years, many studies on the chloride erosion resistance of UHPC have been carried out by domestic and foreign scholars. It was shown by Reju et al. [16] that UHPC has strong resistance to chloride and sulfate erosion. The chloride diffusion coefficient of UHPC was measured by Liu et al. [17] to be as low as 10−9 cm2/s. The chloride diffusion coefficients of UHPC and NC were compared by Yan [18], and it was found that the diffusion coefficient of UHPC is about 1/50 of that of NC. It was also found by Li et al. [19] that the chloride diffusion coefficient of UHPC is only 1/7 of that of HPC. Rapid chloride migration tests were conducted by Zohrevand et al. [20], and it was found that under the same conditions, the chloride penetration depths of UHPC, HPC, and NC were 1 mm, 8 mm, and 23 mm, respectively. It is consistently shown by existing studies that UHPC has extremely low permeability and excellent chloride erosion resistance, and its durability is far superior to that of ordinary concrete and high-strength concrete.
Although excellent chloride erosion resistance is possessed by UHPC itself, the steel fibers distributed on its surface are prone to corrosion in practical engineering applications [21,22,23]. Obvious corrosion traces of steel fibers have been found on the surface of UHPC components in many engineering cases. For example, on the first bridge repaired with UHPC in Switzerland, after one winter of deicing salt action, the steel fibers on the surface of the prefabricated UHPC curb beam corroded, and obvious rust traces were observed [24]. When the Bourg-les-Valence UHPC highway bridge in France was repaired after 11 years of operation, obvious corrosion traces of steel fibers were also found on the bottom surface of the beam end [25]. The corrosion traces of steel fibers can easily arouse public and engineering management concerns about the long-term safety of the structure [26]. Therefore, it is necessary to adopt scientific and reliable testing methods to regularly test the corrosion status of internal steel rebars in UHPC, so that the durability of the structure can be objectively evaluated and the social and management concerns can be addressed.
Currently, the detection of steel rebar corrosion inside concrete structures is mainly carried out by electrochemical testing methods such as open circuit potential and linear polarization resistance, and the corrosion state is evaluated according to relevant standards. However, a large amount of steel fibers is usually incorporated into UHPC mix proportions, and these steel fibers have good electrical conductivity [27,28,29,30,31]. In addition, UHPC components are generally thin. Potential conductive paths may be formed by the incorporated steel fibers, causing electrical connection between the internal steel rebars and the external environment. These factors may interfere with the applicability of current electrochemical testing methods in UHPC, affecting the accuracy of test results and the correct judgment of corrosion status. Whether the current electrochemical testing methods and evaluation criteria are applicable to UHPC structures with conductive steel fibers has not yet been systematically studied or fully verified. The applicability of existing testing standards in UHPC remains to be further explored.
In the present study, the applicability of current electrochemical testing standards in UHPC is investigated and discussed. Specimens of UHPC, HPC, and NC with different cover thicknesses are designed. Electrochemical testing methods, including open circuit potential (OCP), linear polarization resistance (LPR), and Tafel polarization curves, are adopted to compare and analyze the corrosion behavior of internal steel rebars in the three types of concrete during 180 days of chloride immersion. The applicability of current electrochemical testing standards in UHPC is emphatically discussed to provide theoretical and technical reference for the detection and evaluation of steel rebar corrosion in UHPC structures.
2. Experimental Tests
2.1. Specimen Design
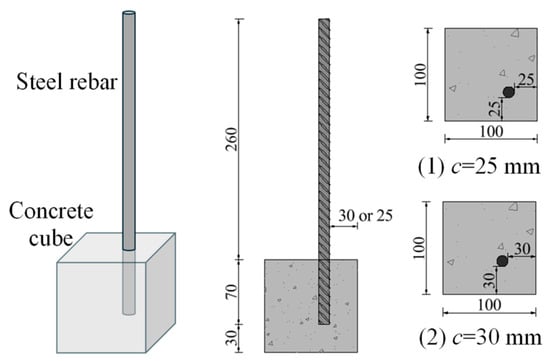
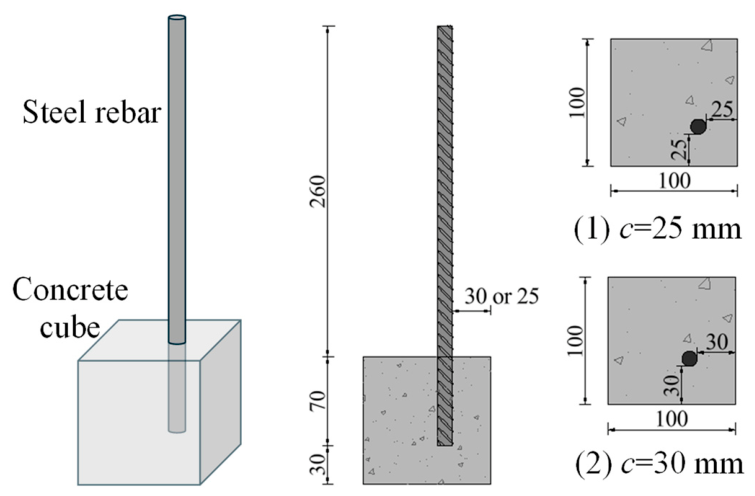
Reinforced concrete corrosion specimens are designed. The configuration and detailed dimensions of the specimens are shown in Figure 1. Each specimen is composed of a cubic concrete block and a steel rebar. The cubic concrete block has a side length of 100 mm. The steel rebar has a length of 330 mm and a diameter of 12 mm. The steel rebar is cast into the top corner of the concrete block, and the cover thicknesses from the rebar surface to the two adjacent sides of the top corner are set equal. Two concrete cover thicknesses are designed: 25 mm and 30 mm, which are determined based on the reference [32]. Although the difference is only 5 mm, this range is considered sufficient for UHPC due to its ultra-high strength (leading to generally thin members and small cover depths) and its extremely dense microstructure, in which even minor variations in cover thickness can influence chloride ingress and electrochemical responses. In all specimens, the cover thickness from the bottom surface of the steel rebar to the bottom surface of the concrete block is kept the same, i.e., 30 mm. HRB335 steel rebars are used, and the measured yield strength and ultimate strength are 389 MPa and 433 MPa, respectively.
Figure 1.
Geometry of the specimen (unit: mm).
Three types of concrete are also designed for casting the specimens in this test, i.e., UHPC, HPC, and NC. The mix proportion of UHPC used in the test is given in Table 1. The UHPC mixture is composed of cement, silica fume, and fly ash as active components, with a water-to-binder ratio of 0.18 and a superplasticizer dosage of 1%. Two types of steel fibers are incorporated into the UHPC. Steel fiber 1 has a diameter of 0.12 mm, a length of 8 mm, and a volume content of 1.5%; steel fiber 2 has a diameter of 0.2 mm, a length of 13 mm, and a volume content of 2.0%. After casting, the UHPC specimens are demolded 24 h later, then cured by steam for 48 h, followed by water curing for 28 days. The measured compressive strength of UHPC at 28 days is 144.3 MPa with a standard deviation of 5.0 MPa, based on three 100 mm cube specimens.
Table 1.
Mix proportion of UHPC (unit: kg/m3).
The mix proportions of NC and HPC used in the test are given in Table 2. For NC, P.O. 32.5 ordinary Portland cement is used. The fine aggregate is natural sand taken from the Xiangjiang River in China, with a fineness modulus of 2.55. The coarse aggregate is crushed stone, with a particle size ranging from 2.36 mm to 26.5 mm. For HPC, the same fine and coarse aggregates as those used in NC are used, but P.O. 52.5 ordinary Portland cement is adopted. In addition, a polycarboxylate-based high-performance water reducer with a water reduction rate of 25% is used in HPC, and the dosage of the water reducer is 1% by mass of cement. The NC and HPC specimens are demolded 24 h after casting and then cured by water spraying for 28 days before subsequent tests. The measured compressive strengths of NC and HPC at 28 days are 40.6 MPa and 80.1 MPa with standard deviations of 4.1 MPa and 5.5 MPa, respectively.
Table 2.
Mix proportions of NC and HPC (unit: kg/m3).
A total of six reinforced concrete corrosion specimens are fabricated in this test, including two UHPC specimens, two HPC specimens, and two NC specimens, with concrete cover thicknesses of 30 mm and 25 mm, respectively. The specimens are designated by a two-part naming system: the first part indicates the concrete type (UHPC, HPC, or NC), and the second part indicates the cover thickness (25 or 30 mm). For example, UHPC-30 denotes a specimen made of UHPC with a concrete cover thickness of 30 mm for the rebar.
2.2. Corrosion and Testing
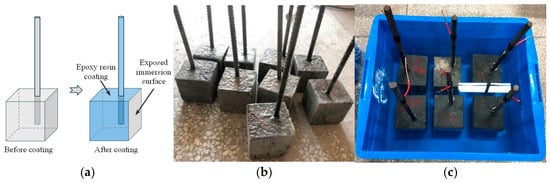
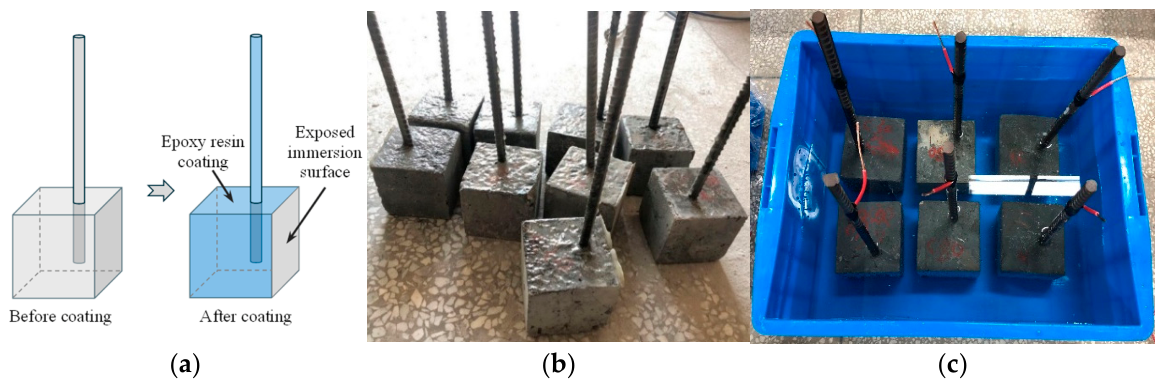
After curing, the specimens are immersed in a 5% NaCl solution for corrosion testing. During the immersion corrosion test, the NaCl solution is maintained at a level which is 80 mm above the top surface of the specimens, and the top of the immersion tank is covered with a transparent film to prevent excessive evaporation of the NaCl solution. The temperature of the laboratory and the immersion solution is stably maintained at approximately 20 °C, and the total immersion corrosion period is 180 days. To ensure one-dimensional chloride ingress into the concrete cube and to prevent corrosion of the exposed parts of the rebars, all exposed parts of steel rebar and the other five faces of the concrete cube not subjected to immersion erosion are coated with epoxy resin before the immersion corrosion test. The anti-corrosion isolation treatment on the specimen surfaces and the immersion corrosion setup is shown in Figure 2.
Figure 2.
Anti-corrosion isolation on specimen and immersion corrosion test. (a) Epoxy coating locations. (b) Specimen after epoxy coating (c) immersion corrosion test.
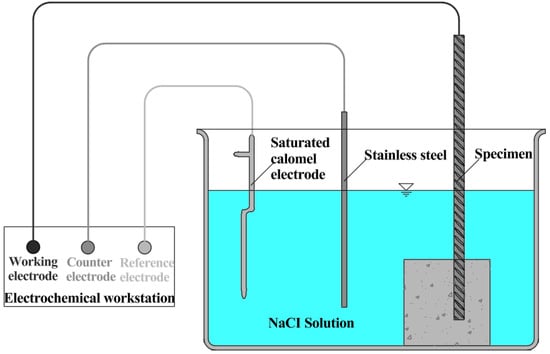
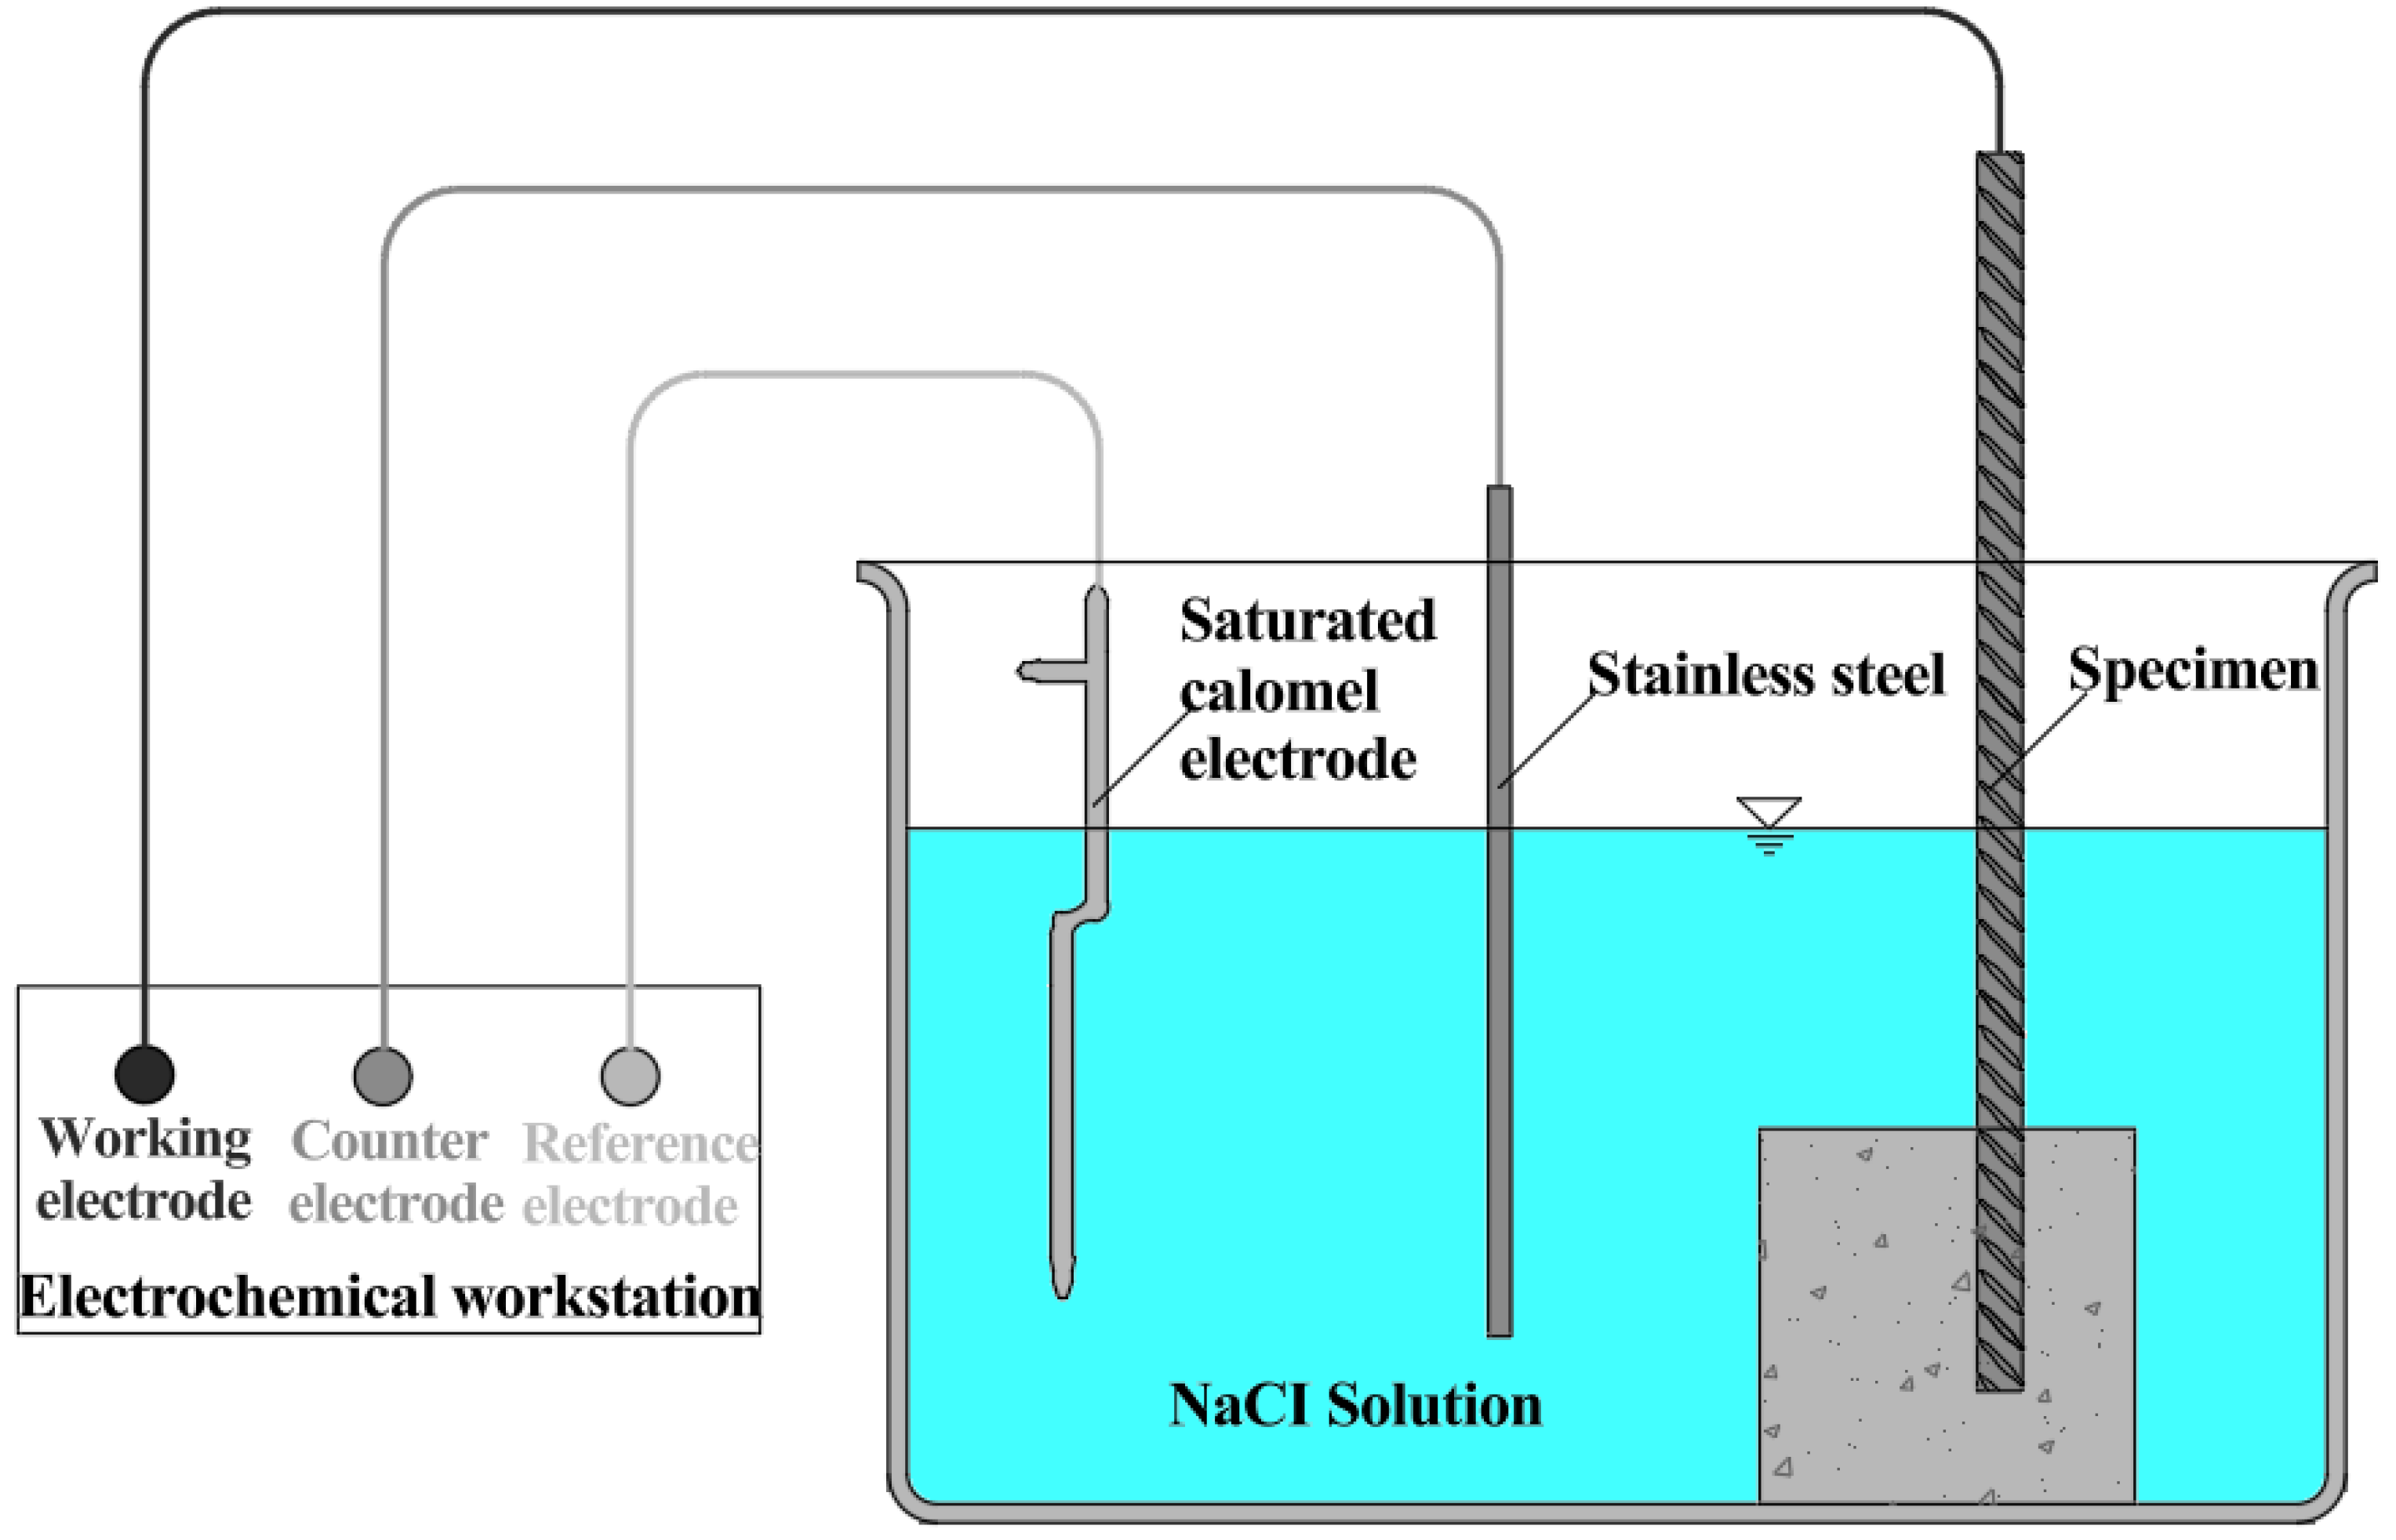
During the immersion corrosion process, the open circuit potential and linear polarization resistance of the steel rebars are measured. The measurements are carried out using a CS350/CS310 electrochemical workstation (Corrtest Instruments, Wuhan, China) and a three-electrode system, as shown in Figure 3. The working electrode is the rebar embedded in the specimen, the auxiliary electrode is a stainless-steel rod, and the reference electrode is a saturated calomel electrode. The scanning range is from −100 mV to +100 mV, and the scan rate is 2 mV/s. The polarization resistance is determined within the range of −50 mV to +50 mV. The open circuit potential is measured every 6 days, and the linear polarization resistance is measured every 36 days.
Figure 3.
Diagram of the test.
The selection of the −100 mV to +100 mV polarization range follows the linear polarization resistance theory established by Stern and Geary [33,34], which demonstrates that small overpotentials (typically ≤100 mV) yield a linear current-potential relationship around OCP, enabling reliable calculation of polarization resistance (Rp) and icorr via the Stern–Geary equation. Such small-amplitude perturbations induce only transient, reversible electrochemical responses at the steel–concrete interface and do not cause significant anodic dissolution of the rebar, as documented in numerous studies [35]. This is also explicitly stated in ASTM G59 [36], which characterizes LPR as a non-destructive technique for corrosion monitoring.
2.3. Existing Corrosion Evaluation Criteria
In this test, the corrosion state of the rebars is evaluated based on the results of OCP andLPR measurements. For OCP, the ASTM C876 standard [28] is referred to for evaluating the corrosion state of the rebars, as shown in Table 3.
Table 3.
ASTM C876 standard [28].
For LPR, a small-amplitude polarization potential is applied to the rebar during testing, and the polarization current is recorded. The polarization resistance Rp and the corrosion current density Icorr are calculated using the Stern–Geary equation. First, based on the open circuit potential data obtained from the test, the anodic Tafel slope (ba) and the cathodic Tafel slope (bc) are obtained by fitting the Tafel curves. Then, the Stern–Geary coefficient B is calculated as:
The polarization resistance Rp is determined from the slope of the polarization curve near the corrosion potential:
Finally, the corrosion current density Icorr is obtained from the Stern–Geary equation:
The evaluation of rebar corrosion using the linear polarization method can be performed according to the criteria given in Table 4.
Table 4.
Corrosion rate of rebar measured by linear polarization method [29,30,31].
It should be noted that the above evaluation criteria based on OCP and LPR are mainly established from test results on ordinary reinforced concrete structures. Whether they are applicable to the evaluation of corrosion of internal rebars in UHPC with steel fibers needs to be verified through the experimental study presented in this paper.
3. Electrochemical Test Results
To systematically evaluate the applicability of current electrochemical testing standards in UHPC, the variations in OCP, Tafel polarization curves, Rp, and Icorr of internal rebars in UHPC, HPC, and NC specimens during 180 days of immersion in 5% NaCl solution are compared and analyzed in this chapter. The main test results are summarized in Table 5.
Table 5.
The main test results of specimens.
3.1. Variation in Open Circuit Potential
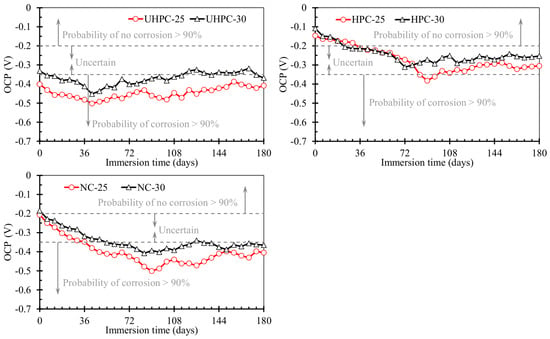
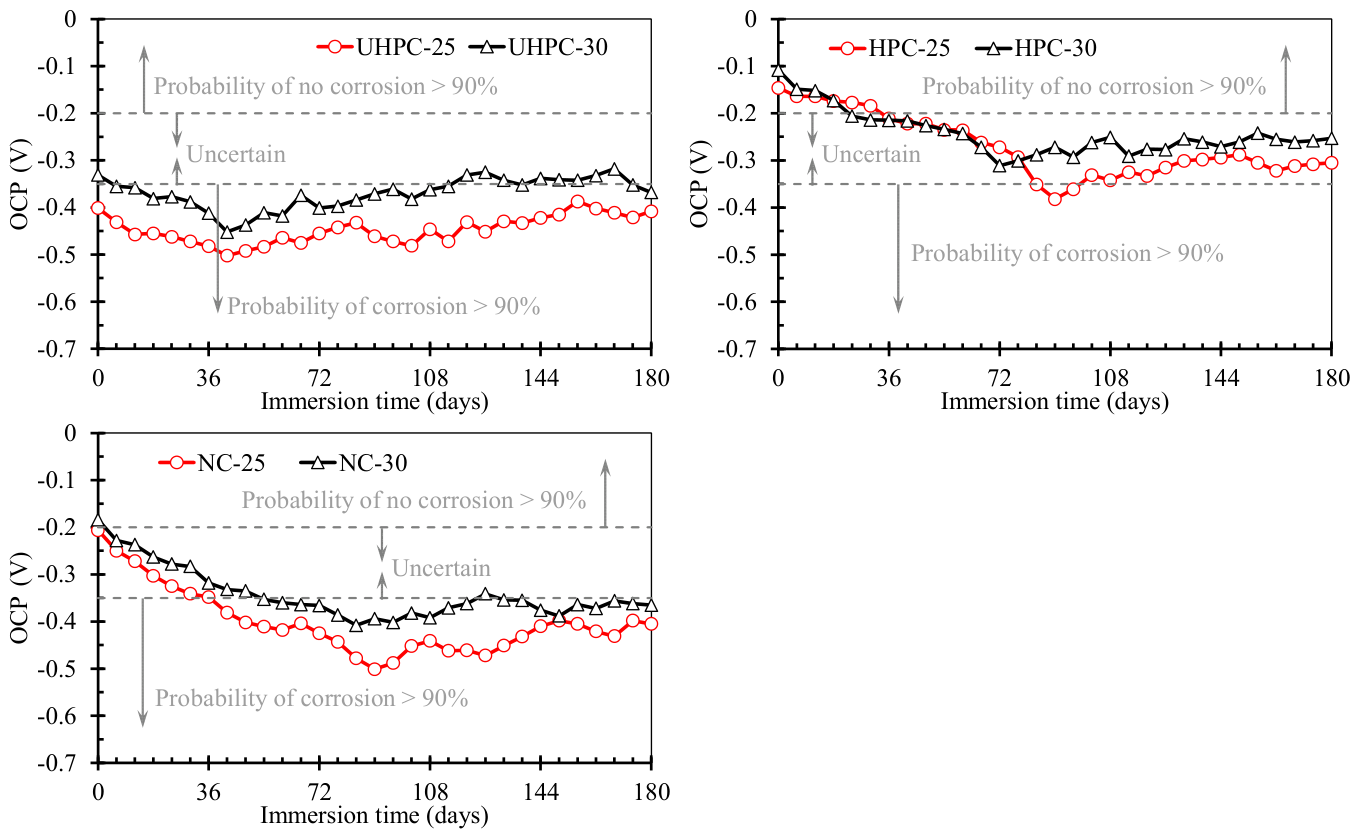
The OCP variations in internal rebars in UHPC, HPC, and NC specimens over time are shown in Figure 4. From the overall potential level, the OCP values of the three types of specimens are ordered as follows: UHPC specimens show the most negative values (ranging from −0.48 to −0.33 V), NC specimens take the middle values (ranging from −0.44 to −0.18 V), and HPC specimens show relatively larger values (ranging from −0.34 to −0.11 V). According to the ASTM C876 standard, a more negative OCP indicates a higher probability of rebar corrosion. Based on this, it would be concluded that UHPC has the highest corrosion probability, followed by NC, and HPC has the slowest. However, this conclusion contradicts widely reported experimental results—numerous studies have shown that UHPC has an extremely low chloride diffusion coefficient, and its chloride erosion resistance is far superior to that of HPC and NC; therefore, the actual corrosion risk of internal rebars in UHPC should be the lowest. Thus, the OCP-based criterion in the ASTM C876 standard is not applicable for directly judging the corrosion state of internal rebars in UHPC. In contrast, the relative OCP relationship between NC and HPC is consistent with the difference in their chloride erosion resistance, indicating that this standard has good applicability for HPC.
Figure 4.
Variation in open circuit potential of specimens.
From the perspective of dynamic OCP variation, the three types of specimens also exhibit different characteristics. The OCP of UHPC specimens is already at a relatively low level at the beginning of immersion (approximately −0.33 to −0.40 V), followed by only a slight and brief decrease, then gradually increases slowly and stabilizes. In contrast, the OCP of HPC and NC specimens has relatively high initial values (approximately −0.11 to −0.15 V for HPC, and −0.18 to −0.21 V for NC), then undergoes a prolonged continuous decrease before finally tending to slowly increase and stabilize. This difference reflects the different electrochemical mechanisms causing OCP changes in different concretes. For HPC and NC specimens, the high initial OCP indicates that the passive film on the rebar surface is intact, and the corrosion tendency is low. As the immersion time increases, chloride ions gradually penetrate to the rebar surface, destroy the passive film, and initiate the electrochemical reaction of the rebar itself, leading to a continuous decrease in OCP. When hydration products accumulate and block the pores at the rebar–concrete interface, the transport of chloride ions and oxygen is hindered, the corrosion tendency of the rebar surface slightly decreases, and the OCP tends to rise and stabilize. Therefore, their OCP variation shows the characteristics of “high initial value → long-term decrease → slow increase and stabilization”.
For UHPC specimens, the situation is different. Due to the extremely dense UHPC matrix, chloride ions are very difficult to penetrate to the surface of the internal rebar in a short time; therefore, the rebar itself is not the main cause of the low OCP. The low OCP of UHPC specimens at the initial stage is mainly attributed to the preferential corrosion of steel fibers on or near the surface of UHPC in the chloride environment. The electrochemical reaction of the steel fibers lowers the overall potential. At the same time, the conductivity of the steel fibers forms a local conductive network in the matrix, reducing the overall resistance of the test circuit and making the measured OCP more negative. The early OCP shows only a slight and brief decrease because the interfacial gap between the steel fibers and the UHPC matrix is very small, and the rates of chloride penetration and corrosion product accumulation are very fast. The gap is quickly blocked by the corrosion products, thereby inhibiting further corrosion of the steel fibers, causing the OCP to slowly increase and stabilize after a brief decrease. Therefore, the OCP variation in UHPC shows the characteristics of “low initial value → short-term slight decrease → slow increase and stabilization”.
The effect of cover thickness on the OCP of the three types of concrete specimens shows the same trend: throughout the corrosion process, the OCP of specimens with a cover thickness of 30 mm is generally slightly higher than that of specimens with 25 mm cover thickness, i.e., the greater the cover thickness, the higher the OCP. For HPC and NC specimens, a thinner cover thickness allows chloride ions to more easily penetrate the concrete layer and reach the rebar surface, accelerating the corrosion reaction of the rebar and resulting in a more negative potential. For UHPC specimens, a thinner cover thickness more easily allows the steel fibers on or near the surface to form a connected conductive network, enhancing the potential-lowering effect of steel fiber corrosion on the overall potential. Although the influencing mechanisms are different, increasing the cover thickness is beneficial for raising the OCP and reducing the corrosion risk.
3.2. Polarization Curve Characteristics
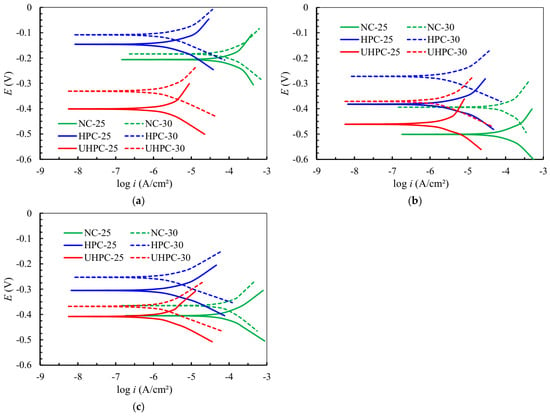
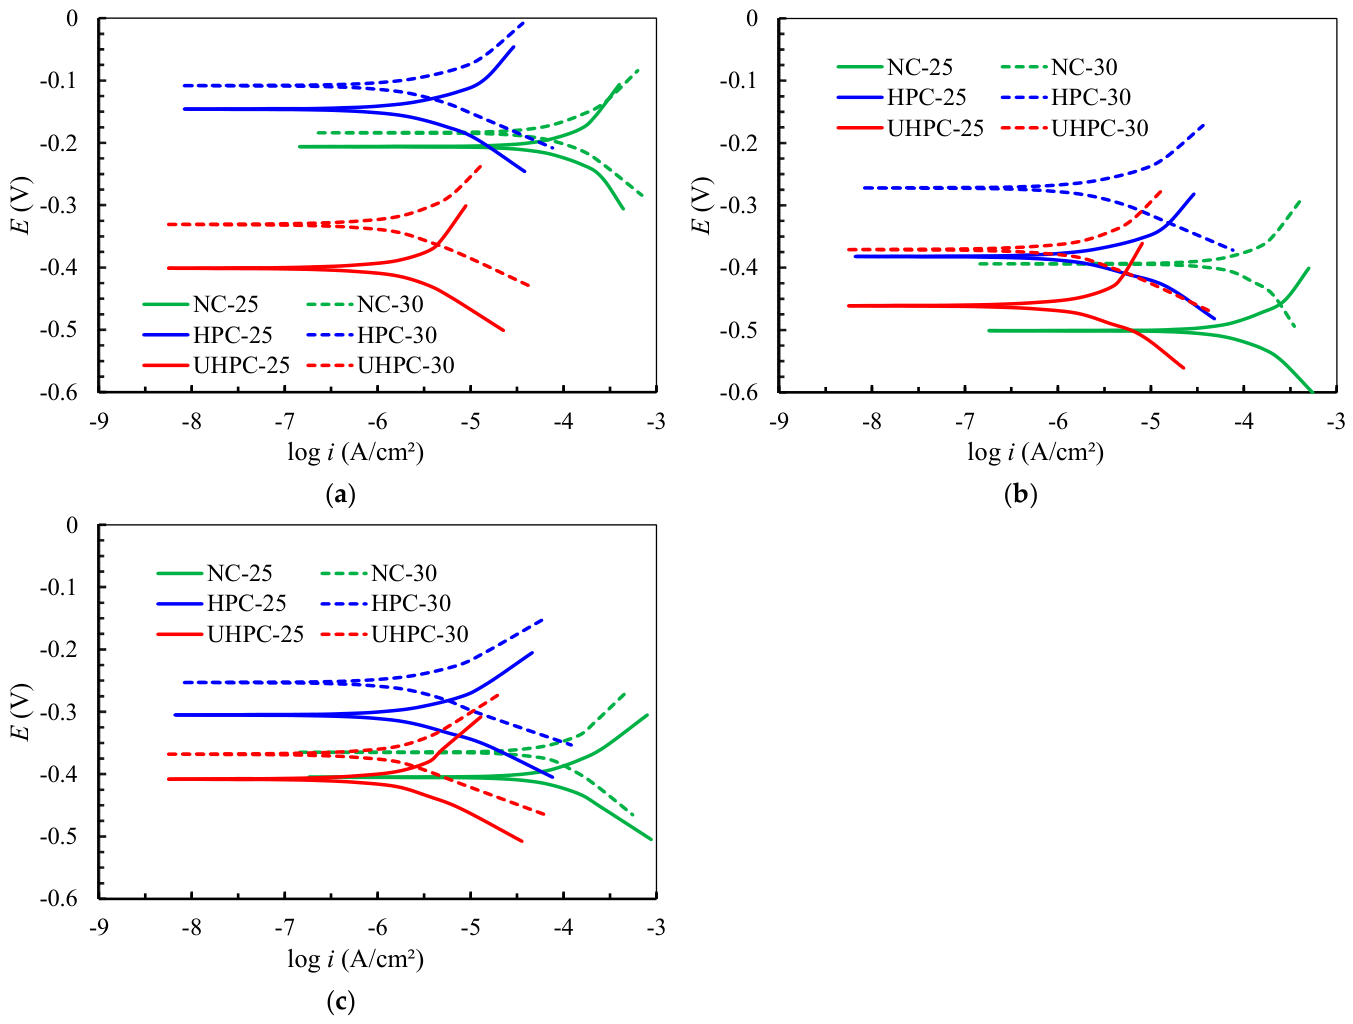
The Tafel polarization curves of the test specimens at 0 days, 90 days, and 180 days are shown in Figure 5. The tangents of the cathodic and anodic reaction curves of the Tafel polarization curves are obtained by linear fitting. The slopes of the tangents are the cathodic and anodic Tafel coefficients, and the corrosion current density is then calculated from the intersection of the two tangents at the open circuit potential. The calculated anodic Tafel coefficients (ba) and cathodic Tafel coefficients (bc) are summarized in Table 5. From the data in Table 5, it can be seen that the anodic Tafel slope (ba) of all specimens is greater than the cathodic Tafel slope (bc), indicating that the corrosion process of the rebar is mainly controlled by the anodic dissolution reaction. This rule holds true for UHPC, HPC, and NC, indicating that the incorporation of steel fibers does not change the control mechanism of the corrosion process.
Figure 5.
Tafel curves of different types of concrete specimens during immersion corrosion. (a) 0 days of immersion, (b) 90 days of immersion, (c) 180 days of immersion.
The average ba values of different concrete types are approximately 87–90 mV/dec for UHPC, 95–103 mV/dec for HPC, and 111–121 mV/dec for NC, i.e., ba (NC) > ba (HPC) >ba (UHPC). This indicates that the anodic reaction rate on the rebar surface is fastest in the NC specimens, followed by HPC, and slowest in UHPC, which is consistent with the order of their corrosion current densities. The cover thickness also has an effect on ba: the ba values of specimens with a cover thickness of 30 mm are generally larger than those of specimens with 25 mm cover thickness, indicating that the thicker the cover, the more significantly the anodic reaction is inhibited. The variation in the cathodic Tafel slope (bc) is more stable than that of ba. The average bc values of different concrete types are approximately 41–42 mV/dec for UHPC, 48–50 mV/dec for HPC, and 54–58 mV/dec for NC, i.e., bc (NC) > bc (HPC) > bc (UHPC). A larger bc value indicates a higher sensitivity of the cathodic reaction to potential.
The Stern–Geary coefficient B is calculated from ba and bc according to Equation (1), and the results are summarized in Table 5. The B values of UHPC specimens range from 11.40 to 13.36 mV (average approximately 12.3 mV); those of HPC specimens range from 12.72 to 15.67 mV (average approximately 14.2 mV); and those of NC specimens range from 15.22 to 17.56 mV (average approximately 16.4 mV), i.e., B(UHPC) < B(HPC) < B(NC). This indicates that the greater the corrosion rate of the internal rebar in the specimen, the larger the B value of the specimen. The effect of cover thickness on the B value is relatively small, but the overall trend is that the B value of specimens with a cover thickness of 30 mm is slightly higher than that of specimens with 25 mm cover thickness, which is consistent with the pattern that a thicker cover leads to greater inhibition of the anodic reaction and thus a larger ba.
3.3. Variation in Polarization Resistance
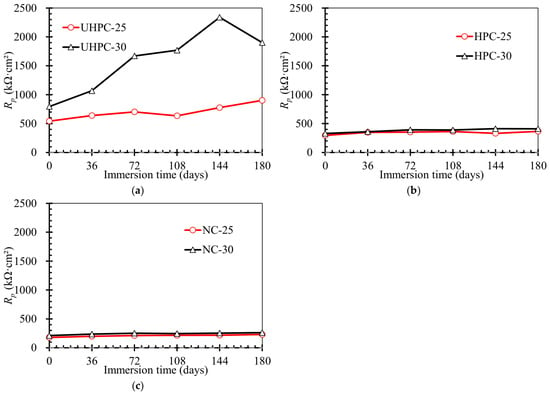
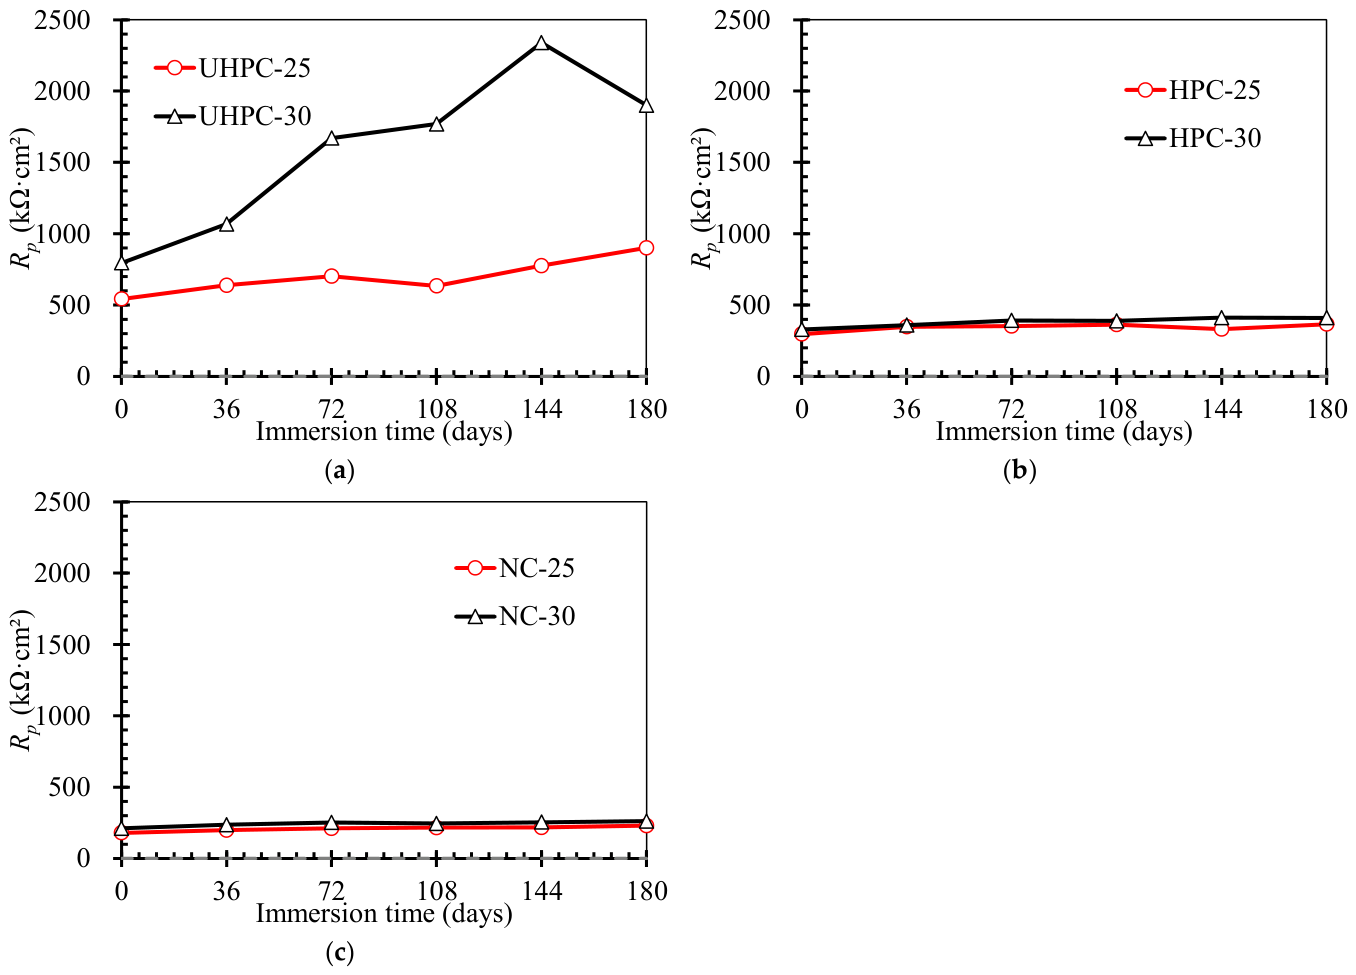
The variation in polarization resistance Rp of internal rebars in different concrete specimens over time is shown in Figure 6. From the overall numerical level, the Rp values of the three types of specimens are ordered as follows: UHPC specimens show the largest values (543–902 kΩ·cm2 for specimens with 25 mm cover thickness, and 796–2339 kΩ·cm2 for specimens with 30 mm cover thickness), HPC specimens take the middle values (297–412 kΩ·cm2), and NC specimens show the smallest values (181–262 kΩ·cm2), i.e., Rp (UHPC) > Rp (HPC) > Rp (NC). A larger Rp indicates a more tortuous path for ion migration on the rebar surface, greater resistance to the corrosion reaction, and thus a lower corrosion risk. This order is consistent with the ranking of chloride erosion resistance of the three types of concrete, indicating that polarization resistance can objectively reflect the protective effect of different concretes on the internal rebars.
Figure 6.
Variation in polarization resistance of specimens. (a) UHPC specimens. (b) HPC specimens. (c) NC specimens.
From the perspective of dynamic variation, the Rp of all three types of specimens increases with immersion time, and the increase is particularly more pronounced for UHPC specimens than for HPC and NC specimens. The general increase in Rp is mainly because the concrete continues to hydrate during immersion, and the hydration products fill the pores at the rebar–concrete interface, making the interfacial transition zone denser, hindering ion migration, and gradually increasing the polarization resistance. The more significant increase in Rp for UHPC reflects the higher later-age hydration activity of the UHPC matrix.
The effect of cover thickness on polarization resistance follows a consistent trend: the Rp of specimens with a cover thickness of 30 mm is always higher than that of specimens with 25 mm cover thickness. For NC and HPC, a thicker cover prolongs the path for chloride ions to reach the rebar surface and slows down the depassivation process. For UHPC, a thicker cover not only hinders chloride penetration but also reduces the interference of the conductive network formed by surface steel fibers on the electrochemical testing of the internal rebar, thereby maintaining a higher polarization resistance.
3.4. Variation in Corrosion Current Density
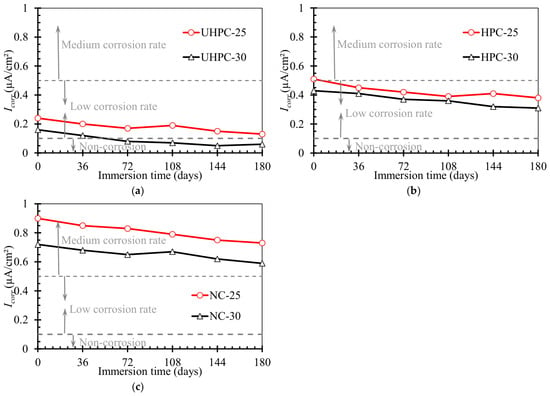
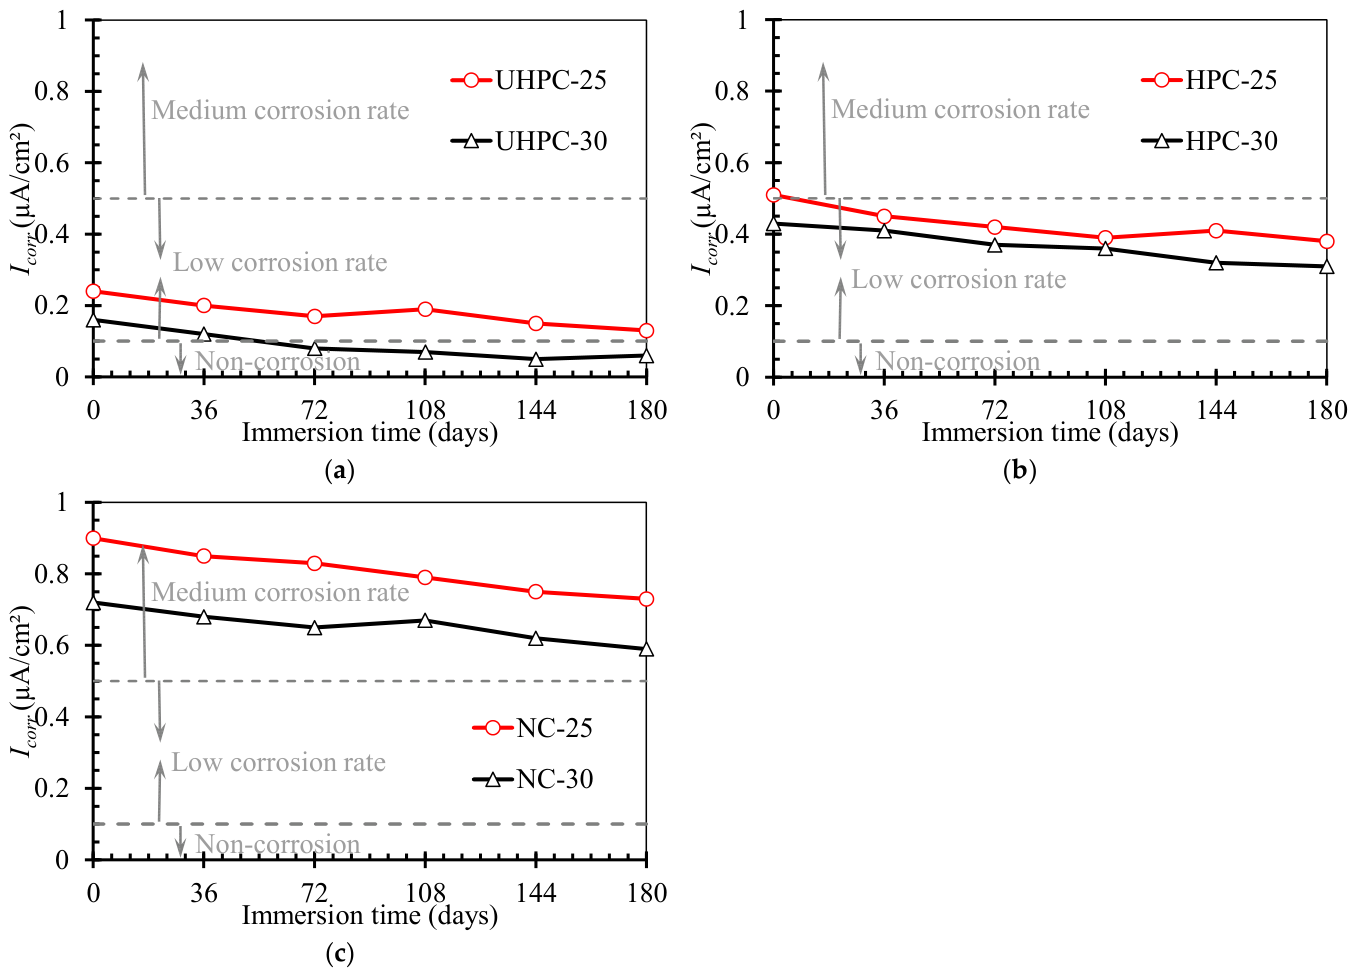
The variation in corrosion current density (Icorr) of internal rebars in different concrete specimens over time is shown in Figure 7. From the overall numerical level, the Icorr values of the three types of specimens are ordered as follows: UHPC specimens show the smallest values (0.13–0.24 μA/cm2 for specimens with 25 mm cover thickness, and 0.05–0.16 μA/cm2 for specimens with 30 mm cover thickness), HPC specimens take the middle values (0.31–0.51 μA/cm2), and NC specimens show the largest values (0.59–0.90 μA/cm2), i.e., Icorr (UHPC) < Icorr (HPC) < Icorr (NC). According to the criteria in Table 4, the Icorr of the UHPC-30 specimen is less than 0.1 μA/cm2, which falls into the “non-corroded” category; the Icorr of the UHPC-25 specimen is between 0.1 and 0.5 μA/cm2, which falls into the “low” corrosion rate category; the HPC specimens also fall into the “low” corrosion rate category; and the NC specimens fall into the “medium” corrosion rate category (0.5–1.0 μA/cm2). This order is completely consistent with the ranking of chloride erosion resistance of the three types of concrete, indicating that the corrosion current density can effectively reflect the actual protective effect of different concretes on the internal rebars.
Figure 7.
Variation in corrosion current density of specimens. (a) UHPC specimens. (b) HPC specimens. (c) NC specimens.
From the perspective of dynamic variation, the Icorr of all specimens shows a gradual decreasing trend with increasing immersion time. This is mainly because the concrete continues to hydrate during immersion, and the hydration products (such as calcium silicate hydrate (C-S-H) gel, CaSiO3, etc.) fill the pores at the rebar–concrete interface, blocking the transport channels for chloride ions and oxygen. At the same time, the passive film on the rebar surface gradually becomes stable, causing the corrosion reaction rate to continuously decrease. Among them, the decrease in Icorr is most significant for UHPC specimens (from 0.16 μA/cm2 to 0.05–0.06 μA/cm2 for the specimen with 30 mm cover thickness), reflecting the continuous optimization of the interfacial microstructure by the later-age hydration of the UHPC matrix.
The effect of cover thickness on corrosion current density follows a consistent trend: the Icorr of specimens with a cover thickness of 30 mm is always lower than that of specimens with 25 mm cover thickness. For NC and HPC, a thinner cover thickness allows chloride ions to reach the rebar surface earlier and in larger amounts, accelerating the destruction of the passive film and the initiation of the corrosion reaction. For UHPC, a thinner cover thickness more easily allows the surface steel fibers to form a connected conductive network, which may cause some interference in the electrochemical testing of the internal rebar, but the actual Icorr remains at a relatively low level.
4. Applicability Analysis of Existing Evaluation Criteria
Based on the electrochemical test results presented in Section 3, the applicability of the current ASTM C876 open circuit potential standard and the linear polarization resistance corrosion current density criterion in UHPC is compared and analyzed in this section.
4.1. Open Circuit Potential Evaluation Criterion
According to the ASTM C876 standard, the corrosion state of rebars is classified into three intervals based on the open circuit potential (OCP): OCP > −200 mV is classified as “non-corroded” (probability of no corrosion > 90%), −200 mV to −350 mV is classified as “uncertain”, and OCP < −350 mV is classified as “corroded” (probability of corrosion > 90%).
From the OCP test results presented in Section 3.1, the OCP values of the three types of specimens are ordered as follows: UHPC specimens show the most negative values (ranging from −0.48 to −0.33 V), NC specimens take the middle values (ranging from −0.44 to −0.18 V), and HPC specimens show relatively larger values (ranging from −0.34 to −0.11 V). According to the ASTM C876 standard, a more negative OCP indicates a higher probability of rebar corrosion. Based on this, it would be concluded that UHPC has the highest corrosion risk, followed by NC, and HPC has the lowest. However, numerous published studies have shown that UHPC has an extremely low chloride diffusion coefficient, and its chloride erosion resistance is far superior to that of HPC and NC; therefore, the actual corrosion risk of internal rebars in UHPC should be the lowest. The OCP test results obtained in this study clearly contradict this well-established conclusion, indicating that the OCP-based criterion in the ASTM C876 standard may not be applicable for directly judging the corrosion state of internal rebars in UHPC.
The fundamental reason for this deviation is that the ASTM C876 criterion is established based on ordinary concrete (porosity 20–25%), assuming an adequate oxygen supply, where a negative shift in potential mainly reflects the depassivation effect of chloride ions. In contrast, the UHPC matrix is extremely dense (porosity only 2–6%), and the diffusion of oxygen to the rebar surface is severely restricted over the long term, so the cathodic reaction is continuously inhibited, resulting in an abnormally low corrosion potential. In addition, the steel fibers incorporated into UHPC are preferentially corroded in the chloride environment, and their conductivity forms a local conductive network in the matrix, further lowering the measured OCP value. Therefore, the negative OCP value in UHPC does not directly correspond to a high corrosion probability, but rather is an electrochemical characteristic resulting from the combined effect of its unique microstructure and the conductivity of the steel fibers.
In contrast, the correspondence between OCP and Icorr for NC and HPC specimens is relatively reasonable: the OCP of NC specimens is below −350 mV, and Icorr is in the range of 0.59–0.90 μA/cm2 (medium corrosion); the OCP of HPC specimens is mostly in the “uncertain” range of −200 to −350 mV, and Icorr is in the range of 0.31–0.51 μA/cm2 (low corrosion). This indicates that the ASTM C876 standard has good applicability for NC and HPC but is not suitable for UHPC.
4.2. Corrosion Current Density Evaluation Criterion
According to the linear polarization method, the corrosion rate is classified into four levels based on the corrosion current density (Icorr): Icorr < 0.1 μA/cm2 is classified as “non-corroded”; 0.1–0.5 μA/cm2 is classified as “low”; 0.5–1.0 μA/cm2 is classified as “medium”; and >1.0 μA/cm2 is classified as “high”. Based on the Icorr test results presented in Section 3.4, these criteria are applied to the three types of specimens. The UHPC-30 specimen shows Icorr < 0.1 μA/cm2 and is classified as “non-corroded”. The UHPC-25 specimen shows Icorr = 0.13–0.24 μA/cm2 and is classified as “low” corrosion. The HPC specimens show Icorr = 0.31–0.51 μA/cm2 and are classified as “low” corrosion. The NC specimens show Icorr = 0.59–0.90 μA/cm2 and are classified as “medium” corrosion. These classification results are largely consistent with the ranking of chloride erosion resistance of the three types of concrete (UHPC best, HPC next, NC worst).
It is worth noting that the Stern–Geary coefficient B is required for the calculation of Icorr using the linear polarization method. The polarization curve results presented in Section 3.2 show that the B value of UHPC is approximately 11.4–13.4 mV, that of HPC is approximately 12.7–15.7 mV, and that of NC is approximately 15.2–17.6 mV, all of which are lower than the commonly used empirical value for ordinary concrete (26 mV). Therefore, when the linear polarization method is applied to detect UHPC structures, the actual B value must be obtained through Tafel fitting to ensure the accuracy of the Icorr calculation.
5. Conclusions
The following conclusions are drawn based on the present study:
- (1)
- The ASTM C876 open circuit potential standard is not applicable to UHPC. In this test, UHPC specimens show the most negative OCP values, while HPC specimens show the largest. According to the ASTM C876 standard, a more negative OCP indicates a higher corrosion probability, which would lead to the erroneous conclusion that UHPC has the highest corrosion risk. This contradicts the well-known fact that UHPC has far better chloride erosion resistance than HPC and NC. Hence, this standard is not suitable for UHPC.
- (2)
- The corrosion current density criterion of the linear polarization method has relatively good applicability to UHPC. In this test, UHPC specimens show the smallest Icorr values, followed by HPC, and NC shows the largest. These results are consistent with the superior chloride erosion resistance of UHPC, indicating that Icorr can effectively reflect the protective effect of different concretes on internal rebars. Thus, this criterion is applicable to UHPC.
- (3)
- The corrosion process of rebars in UHPC is controlled by the anode, and the addition of steel fibers does not change this control mechanism. The anodic Tafel slope (ba) of all specimens is greater than the cathodic Tafel slope (bc), indicating that the corrosion is dominated by the anodic dissolution reaction. This pattern is not altered by the incorporation of steel fibers, although the absolute values of electrochemical parameters, such as OCP and B, are affected.
- (4)
- The cover thickness has a significant effect on the test results. With increasing cover thickness, higher OCP, higher Rp, and lower Icorr are observed, indicating a lower corrosion risk. For all three types of concrete, a cover thickness of 30 mm is better than 25 mm. For UHPC, under a cover thickness of 30 mm, the internal rebar is basically non-corroded (Icorr < 0.1 μA/cm2). It is recommended that the cover thickness be reasonably designed according to the service environment in practical engineering.
It should be noted that the present study only addresses the applicability of the ASTM C876 open circuit potential standard and the linear polarization corrosion current density criterion for corrosion detection of internal rebars in UHPC. It is preliminarily concluded that the ASTM C876 standard is not applicable to UHPC and that the B value requires correction for the linear polarization method. However, specific correction values for UHPC are not provided in detail. Furthermore due to the exploratory nature of this study only one specimen is tested for each concrete type and cover thickness combination; therefore, confidence intervals for OCP, Rp, and Icorr could not be established. Future work should include multiple replicate specimens (e.g., three per condition) to enable statistical analysis and calculation of confidence intervals. Finally, further systematic tests under a wider range of conditions are needed to establish dedicated electrochemical evaluation criteria for UHPC structures.
Author Contributions
L.K.: Conceptualization, Methodology, Validation, Formal analysis, Investigation, Data curation, Writing—original draft, Writing—review and editing. G.L.: Data curation, Investigation, Validation, Formal analysis, Writing—original draft. A.: Data curation, Investigation, Validation, Formal analysis, Writing—original draft. X.H.: Data curation, Investigation, Validation, Formal analysis, Writing—original draft. Z.L.: Conceptualization, Methodology, Supervision, Writing—review and editing. X.Z.: Conceptualization, Methodology, Supervision, Writing—review and editing. All authors have read and agreed to the published version of the manuscript.
Funding
This work reported here was conducted with the financial supports from the Science and Technology Innovation Program of Hunan Province (Grant No. 2025RC3152), the Education Department Research Foundation of Hunan Province (Grant No. 24A0144), and the Natural Science Foundation of Hunan Province of China (Grant No. 2024JJ9076).
Institutional Review Board Statement
Not applicable.
Informed Consent Statement
Not applicable.
Data Availability Statement
All data generated or analyzed during this study are included in this article.
Conflicts of Interest
Author Linghai Kong is employed by CCCC Third Highway Engineering Co., Ltd., and CCCC Third Highway Engineering No. 3 Engineering Co., Ltd. Author Gen Li, Agudamu, and Xunlin He are employed by CCCC Third Highway Engineering No. 3 Engineering Co., Ltd. The remaining authors declare that the research was conducted in the absence of any commercial or financial relationships that could be construed as a potential conflict of interest.
References
- Cao, J.; Shao, X. Finite element analysis of headed studs embedded in thin UHPC. J. Constr. Steel Res. 2019, 161, 355–368. [Google Scholar] [CrossRef] [Scilit]
- Zhang, X.; Cheng, L.; Xu, F.; Yang, C.; Wang, L. A novel model for shear strength prediction of a steel-UHPC composite structure considering interface friction. J. Struct. Eng. 2024, 150, 04024100. [Google Scholar] [CrossRef] [Scilit]
- Zhang, X.; Yang, X.; Li, C.; Xu, F.; Wang, G. Friction affected fatigue behavior of steel-UHPC composite structures and the fatigue crack growth in studs. Int. J. Fatigue 2023, 177, 107949. [Google Scholar] [CrossRef] [Scilit]
- Anish, V.; Logeshwari, J. A review on ultra high-performance fibre-reinforced concrete with nanomaterials and its applications. J. Eng. Appl. Sci. 2024, 71, 25. [Google Scholar] [CrossRef] [Scilit]
- Du, J.; Meng, W.; Khayat, K.H.; Bao, Y.; Guo, P.; Lyu, Z.; Abu-obeidah, A.; Nassif, H.; Wang, H. New development of ultra-high-performance concrete (UHPC). Compos. Part B Eng. 2021, 224, 109220. [Google Scholar] [CrossRef] [Scilit]
- Amran, M.; Huang, S.-S.; Onaizi, A.M.; Makul, N.; Abdelgader, H.S.; Ozbakkaloglu, T. Recent trends in ultra-high performance concrete (UHPC): Current status, challenges, and future prospects. Constr. Build. Mater. 2022, 352, 129029. [Google Scholar] [CrossRef] [Scilit]
- Barbhuiya, S.; Das, B.B.; Rajput, A.; Katare, V.; Das, A.K. Structural performance and implementation challenges of next-generation concrete materials. Structures 2025, 81, 110169. [Google Scholar] [CrossRef] [Scilit]
- Gyawali, M.; Sennah, K.; Ahmed, M.; Hamoda, A. Experimental study of static and fatigue push-out test on headed stud shear connectors in UHPC composite steel beams. Structures 2024, 70, 107923. [Google Scholar] [CrossRef] [Scilit]
- Lin, Y.; Cao, M.; Mao, X.; Feng, M.; Sun, M. Push-out tests and theoretical models of steel-UHPC composite members considering interfacial bonding strength. Constr. Build. Mater. 2025, 472, 140856. [Google Scholar] [CrossRef] [Scilit]
- Huang, H.; Gao, X.; Khayat, K.H. Contribution of fiber alignment on flexural properties of UHPC and prediction using the Composite Theory. Cem. Concr. Compos. 2021, 118, 103971. [Google Scholar] [CrossRef] [Scilit]
- Ghafari, E.; Arezoumandi, M.; Costa, H.; Júlio, E. Influence of nano-silica addition on durability of UHPC. Constr. Build. Mater. 2015, 94, 181–188. [Google Scholar] [CrossRef] [Scilit]
- Huang, H.; Teng, L.; Gao, X.; Khayat, K.H.; Wang, F.; Liu, Z. Use of saturated lightweight sand to improve the mechanical and microstructural properties of UHPC with fiber alignment. Cem. Concr. Compos. 2022, 129, 104513. [Google Scholar] [CrossRef] [Scilit]
- Xie, T.; Fang, C.; Mohamad Ali, M.S.; Visintin, P. Characterizations of autogenous and drying shrinkage of ultra-high performance concrete (UHPC): An experimental study. Cem. Concr. Compos. 2018, 91, 156–173. [Google Scholar] [CrossRef] [Scilit]
- Wang, X.; Chen, H.; Liu, X.; Tian, W.; Zou, F.; Cao, W. Role of self-healing microcapsules on the structural evolution of pre-damaged UHPC: Synergistic improvement in self-healing and corrosion resistance behavior. Constr. Build. Mater. 2025, 493, 143109. [Google Scholar] [CrossRef] [Scilit]
- Wang, J.; Kim, Y.J. Evolutionary characteristics of microstructural hydration and chloride diffusion in UHPC. Mater. Des. 2023, 225, 111528. [Google Scholar] [CrossRef] [Scilit]
- Reju, R.; George, J.J. Investigations on the Chemical Durability Properties of Ultra High Performance Fibre Reinforced Concrete. In Proceedings of the 2012 International Conference on Green Technologies (ICGT); IEEE: New York, NY, USA, 2012; pp. 181–185. [Google Scholar]
- Liu, J.; Wand, D.; Song, S.; Huo, W. Research on Durability and Micro Structure of High Volume Fine Mineral Mixture of Reactive Powder Concrete. J. Wuhan Univ. Technol. 2008, 30, 54–55. [Google Scholar]
- Yan, P. Development and Current Status of Ultra-High Performance Concrete (UHPC). China Concr. 2010, 9, 36–41. [Google Scholar]
- Li, C.; An, M.; Du, Q. Fundamental Research on Engineering Application of Ultra-High Performance Structural Concrete Materials. China Concr. 2010, 3, 28–33. [Google Scholar]
- Zohrevand, P.; Mirmiran, A. Cyclic Behavior of Hybrid Columns Made of Ultra High Performance Concrete and Fiber Reinforced Polymers. J. Compos. Constr. 2012, 16, 91–99. [Google Scholar] [CrossRef] [Scilit]
- Fan, L.; Meng, W.; Teng, L.; Khayat, K.H. Effect of steel fibers with galvanized coatings on corrosion of steel bars embedded in UHPC. Compos. Part B Eng. 2019, 177, 107445. [Google Scholar] [CrossRef] [Scilit]
- Ghasemzadeh Mosavinejad, S.H.; Langaroudi, M.A.M.; Barandoust, J.; Ghanizadeh, A. Electrical and microstructural analysis of UHPC containing short PVA fibers. Constr. Build. Mater. 2020, 235, 117448. [Google Scholar] [CrossRef] [Scilit]
- Zhong, R.; Ai, X.; Pan, M.; Yao, Y.; Cheng, Z.; Peng, X.; Wang, J.; Zhou, W. Durability of micro-cracked UHPC subjected to coupled freeze-thaw and chloride salt attacks. Cem. Concr. Compos. 2024, 148, 105471. [Google Scholar] [CrossRef] [Scilit]
- Zhao, Y.; Lian, H.; Jin, J. A New Model of Steel-Concrete Composite- (Part III) Shrinkage and Cracking, High Temperature Resistance, Permeability and Durability, Design Guidelines of Ultra-High Performance Concrete (UHPC/UHPFRC). Concr. World 2013, 12, 60–71. [Google Scholar]
- Toutlemonde, F.; Roenelle, P.; Hajar, Z.; Simon, A.; Lapeyrère, R.; Martin, R.-P.; Ramanich, S.; Baron, L. Long-term material performance checked on world’s oldest UHPFRC road bridges at Bourg-Lès-Valence. In Proceedings of the RILEM-Fib-AFGC International Symposium on Ultra-High Performance Fibre-Reinforced Concrete; Toutlemonde, F., Resplendino, J., Eds.; RILEM Publications S.A.R.L: Bagneux, France, 2013; pp. 265–274. [Google Scholar]
- He, Z.; Jiang, J.; Zhang, Z.; Li, L.; Li, X.; Yang, J.; Zou, Y. Corrosion fatigue life and residual mechanical performance of stud connectors embedded in post-cast UHPC subjected to the effect of coupling. Constr. Build. Mater. 2025, 501, 144299. [Google Scholar] [CrossRef] [Scilit]
- Fan, L.; Meng, W.; Teng, L.; Khayat, K.H. Effects of lightweight sand and steel fiber contents on the corrosion performance of steel rebar embedded in UHPC. Constr. Build. Mater. 2020, 238, 117709. [Google Scholar] [CrossRef] [Scilit]
- ASTM C876-22b; Standard Test Method for Corrosion Potentials of Uncoated Reinforcing Steel in Concrete. ASTM International: West Conshohocken, PA, USA, 2022.
- Aperador, W.; Mejía de Gutiérrez, R.; Bastidas, D.M. Steel corrosion behaviour in carbonated alkali-activated slag concrete. Corros. Sci. 2009, 51, 2027–2033. [Google Scholar] [CrossRef] [Scilit]
- GB 50367-2013; Code for Design of Strengthening Concrete Structure. China Architecture & Building Press: Beijing, China, 2013.
- Feliú, S.; González, J.A.; Andrade, C. Electrochemical methods for on-site determinations of corrosion rates of rebars. In Techniques to Assess the Corrosion Activity of Steel Reinforced Concrete Structures; ASTM STP 1276; ASTM International: West Conshohocken, PA, USA, 1996; pp. 107–118. [Google Scholar]
- Guan, Y.; Wu, J.; Sun, R.; Ge, Z.; Bi, Y.; Zhu, D. Shear behavior of short headed studs in Steel-ECC composite structure. Eng. Struct. 2022, 250, 113423. [Google Scholar] [CrossRef] [Scilit]
- Stern, M. A method for determining corrosion rates from linear polarization data. Corrosion 1958, 14, 60–64. [Google Scholar] [CrossRef] [Scilit]
- Stern, M.; Geary, A.L. Electrochemical polarization: I. A theoretical analysis of the shape of polarization curves. J. Electrochem. Soc. 1957, 104, 56–63. [Google Scholar] [CrossRef] [Scilit]
- Scully, J.R. Polarization resistance method for determination of instantaneous corrosion rates. Corrosion 2000, 56, 199–218. [Google Scholar] [CrossRef] [Scilit]
- ASTM G59-97; Standard Test Method for Conducting Potentiodynamic Polarization Resistance Measurements. ASTM International: West Conshohocken, PA, USA, 2014.

Disclaimer/Publisher’s Note: The statements, opinions and data contained in all publications are solely those of the individual author(s) and contributor(s) and not of MDPI and/or the editor(s). MDPI and/or the editor(s) disclaim responsibility for any injury to people or property resulting from any ideas, methods, instructions or products referred to in the content. |
© 2026 by the authors. Licensee MDPI, Basel, Switzerland. This article is an open access article distributed under the terms and conditions of the Creative Commons Attribution (CC BY) license.