


Abstract
Large-diameter steel pipe piles (LDSPPs) are increasingly used for offshore wind turbines, marine terminals, long-span bridges, and other heavily loaded infrastructure. Their axial capacity is commonly estimated using design methods developed or calibrated mainly for smaller driven piles, and the extent to which those methods remain reliable at large diameters is not yet well established. This study compiles a database of 41 high-quality field static load tests from 21 sites, including 31 compression tests and 10 uplift tests, for piles with outer diameters of 0.8–3.0 m, embedded lengths of 9.86–100 m, and measured capacities of 1.21–71.56 MN. Associated cone penetration test (CPT/CPTU) profiles and geotechnical information were assembled to establish a consistent evaluation framework for eight axial capacity prediction methods, comprising six CPT-based methods (UWA, ICP, NGI, Fugro, Unified CPT, and Dutch CPT) and two conventional methods (API and MOT). Predictive performance was characterized using the mean and coefficient of variation (COV) of the calculated-to-measured capacity ratio and the root mean squared logarithmic error (RMSLE), with additional examination of pile geometry, effective stress, site conditions, pile age, and loading direction. Parameter sensitivity and site-cluster bootstrap frameworks were also introduced to assess uncertainties associated with geotechnical inputs and method rankings. The existing field-based comparison of the original six methods indicates that the four established CPT-based approaches (UWA, ICP, NGI, and Fugro) generally provide mean capacity ratios closer to unity (0.89–1.20) and lower COVs (0.42–0.51) than API (1.29 and 0.52, respectively). Shaft resistance was generally predicted more reliably than base resistance, whereas base-resistance predictions exhibited substantial scatter, potentially associated with uncertainties in soil plugging and internal shaft resistance. Prediction errors vary with pile geometry and stress conditions, although no consistent deterioration in accuracy with increasing pile diameter is evident within the investigated range. Apparent differences between offshore and onshore sites, pile ages, and loading directions remain subject to database imbalance and potential confounding factors. These findings highlight the importance of considering resistance components, plugging behavior, geotechnical input uncertainty, and statistical robustness when assessing the applicability of axial capacity prediction methods for LDSPPs.
1. Introduction
Large-diameter steel pipe piles (LDSPPs) have become a principal foundation solution for offshore wind turbines, fixed platforms, marine terminals, cross-sea bridges, and other structures that must transfer large vertical and lateral loads through weak near-surface deposits. Compared with conventional driven piles, these foundations are distinguished by their large outer diameter, relatively thin wall, open-ended geometry, long embedded length, and installation under demanding marine conditions. The increase in diameter raises the available shaft area and potential base area, but it also changes the installation response of the surrounding soil, the development of a soil plug, the distribution of residual stresses, and the displacement required to mobilize resistance. Consequently, simple geometric scaling of methods calibrated for smaller piles may not preserve either their accuracy or their safety margin.
The ultimate axial resistance of a driven pipe pile is normally represented as the sum of external shaft resistance, internal shaft resistance or soil-plug resistance, and annular toe resistance. In practice, these components are not independent. Installation changes radial effective stress around the shaft, repeated shearing causes friction fatigue with distance from the pile tip, and the degree of plugging controls whether the toe behaves closer to an unplugged annulus or to a closed-ended base. These mechanisms are affected by soil type, stress level, pile geometry, driving history, and elapsed time after installation. They are especially difficult to quantify for LDSPPs because full-scale instrumented tests are costly and because measured base resistance is often obtained indirectly as the difference between two much larger quantities.
A variety of methods have been developed to predict the axial bearing capacity of piles. For instance, RP2GEO [1] is one of the most widely adopted methods in engineering practice, which specifies calculation procedures for shaft resistance and base resistance. The Chinese Code for Design of Port Engineering Structures (MOT) provides empirical formulas for unit ultimate shaft resistance and unit ultimate base resistance to estimate the ultimate bearing capacity of single steel pipe piles [2]. In addition, cone penetration test (CPT)-based methods are widely used in practice owing to their proven reliability. API recommends four CPT-based methods: the University of Western Australia (UWA) method [3,4], the Imperial College Pile (ICP) method [5], the Norwegian Geotechnical Institute (NGI) method [6,7], and the Fugro method [8]. Another established CPT-based approach is the Dutch CPT method proposed by de Ruiter and Beringen [9], which was developed in the context of offshore pile foundation design and provides separate procedures for estimating shaft and base resistance in sand and clay. Its application to open-ended steel pipe piles makes it a relevant conventional CPT-based approach for comparison with more recently developed methods. More recently, considerable progress has been made in the development of CPT-based axial capacity prediction methods for driven piles. Building on the UWA, ICP, NGI, and Fugro approaches, Lehane et al. [10,11] developed Unified CPT-based methods for piles installed in sand and clay, respectively, incorporating key factors governing pile–soil interaction and axial resistance mobilization. These developments have improved the theoretical and empirical basis of CPT-based pile design. Nevertheless, uncertainties remain regarding their applicability to large-diameter open-ended piles, particularly in relation to soil plugging, installation-induced changes in soil conditions, and the mobilization of individual resistance components [10,11]. Although these methods have been developed or calibrated using different pile databases and geotechnical conditions, their relative predictive performance for LDSPPs has not yet been sufficiently established through a consistent comparative evaluation.
Static load tests are critical for model calibration, characterization of model uncertainty, and potential refinement of existing design methods. The applicability of different design methods can be assessed by comparing the measured bearing capacity of test piles with values calculated using each method. To date, numerous researchers [12,13,14,15,16,17] have utilized static load test databases to validate various calculation methods for the axial bearing capacity of pile foundations. Nevertheless, existing databases are dominated by small-diameter test piles, so their analytical conclusions cannot be directly applied to the design of LDSPPs. Yang et al. [18] established a comprehensive database of driven piles predominantly installed in sand and evaluated the reliability of various design approaches. Lehane et al. [13] further developed unified databases of driven piles in sand and clay to assess the uncertainties associated with offshore pile design methods. More recently, Rizk et al. [19] investigated the performance of eight design methods using 64 static load tests on large-diameter open-ended piles, highlighting the importance of capacity interpretation criteria and soil plugging assumptions.
Beyond these database-based evaluations, recent studies have also highlighted the complexities associated with the axial bearing behavior of large-diameter open-ended pipe piles. Rizk et al. [19] evaluated eight design methods using a database of large-diameter open-ended piles and demonstrated considerable variability in prediction accuracy, particularly under different assumptions regarding soil plugging. Similarly, Kodsy and Iskander [20] investigated the relationship between pile dimensions and plugging behavior, highlighting the importance of pile geometry in assessing the plugging condition. In addition, Duffy et al. [21] examined the influence of installation methods on shaft and base resistance mobilization through instrumented field tests. More recently, de Lange et al. [22] proposed a load-transfer formulation for the base resistance of large-diameter open-ended pipe piles in sand, while De Lange et al. [23] conducted full-scale compression tests on large open-ended steel pipe piles and compared the measured responses with predictions from the Unified CPT method. These studies highlight the complex effects of pile geometry, installation conditions, and soil plugging on axial resistance. They also indicate the continuing need to assess the reliability of existing capacity prediction methods using well-documented field load test data [24].
Despite these contributions, uncertainties remain regarding the relative performance of established design methods when applied to large-diameter steel pipe piles with different geometrical characteristics and soil conditions. In particular, differences in the prediction accuracy of total bearing capacity, shaft resistance, and base resistance require further investigation, as these components may be affected differently by pile geometry, soil properties, and the assumptions adopted in the calculation methods. Therefore, a focused evaluation using a database of large-diameter steel pipe piles with corresponding CPT/CPTU data are valuable for further examining the applicability and limitations of existing design methods. To address these issues, this study establishes a database containing 41 field static load tests, comprising 31 compression tests and 10 uplift tests, with associated CPT/CPTU and geotechnical information. Based on this database, the applicability of eight axial bearing capacity prediction methods is investigated, including six CPT-based methods (UWA, ICP, NGI, Fugro, Unified CPT, and Dutch CPT) and two conventional design methods (API and MOT). The predicted total bearing capacity, shaft resistance, and base resistance are compared with the corresponding measured values to assess the accuracy and variability of the investigated methods. Furthermore, the influences of pile geometry (diameter, length, slenderness ratio, and wall thickness), effective stress, pile age at testing, site location (onshore or offshore), soil type, and loading direction are examined to identify potential variations in prediction performance and provide guidance for the selection of suitable design methods for LDSPPs.
2. Static Load Test Database for Large-Diameter Steel Pipe Piles
2.1. Inclusion Criteria for the Database
The inclusion criteria for the LDSPP database in this study are specified as follows: (1) The test pile has an outer diameter (D) of no less than 800 mm and a circular cross-section, with complete information on outer diameter, embedded length, and wall thickness provided; (2) At the selected test pile location or in its vicinity, at least one set of CPT/CPTU test data should be provided, which must include cone tip resistance qc, and preferably also include sleeve friction fs and pore water pressure u; (3) Relatively complete geological data of the test site are available, including groundwater level, soil unit weight, relative density of sandy soil, undrained shear strength of cohesive soil, sensitivity of cohesive soil, plasticity index of cohesive soil, over-consolidation ratio of cohesive soil, and detailed soil stratification; (4) Each included test pile has undergone at least one of the following tests: vertical compressive static load test or vertical uplift static load test of a single pile. The test must be carried out to failure or until the pile tip displacement exceeds 0.1 D, with a complete load–displacement curve provided; (5) Shaft-mounted sensors are preferred during static load tests to obtain load transfer curves and separate shaft friction resistance from base resistance.
2.2. Overview of the Database
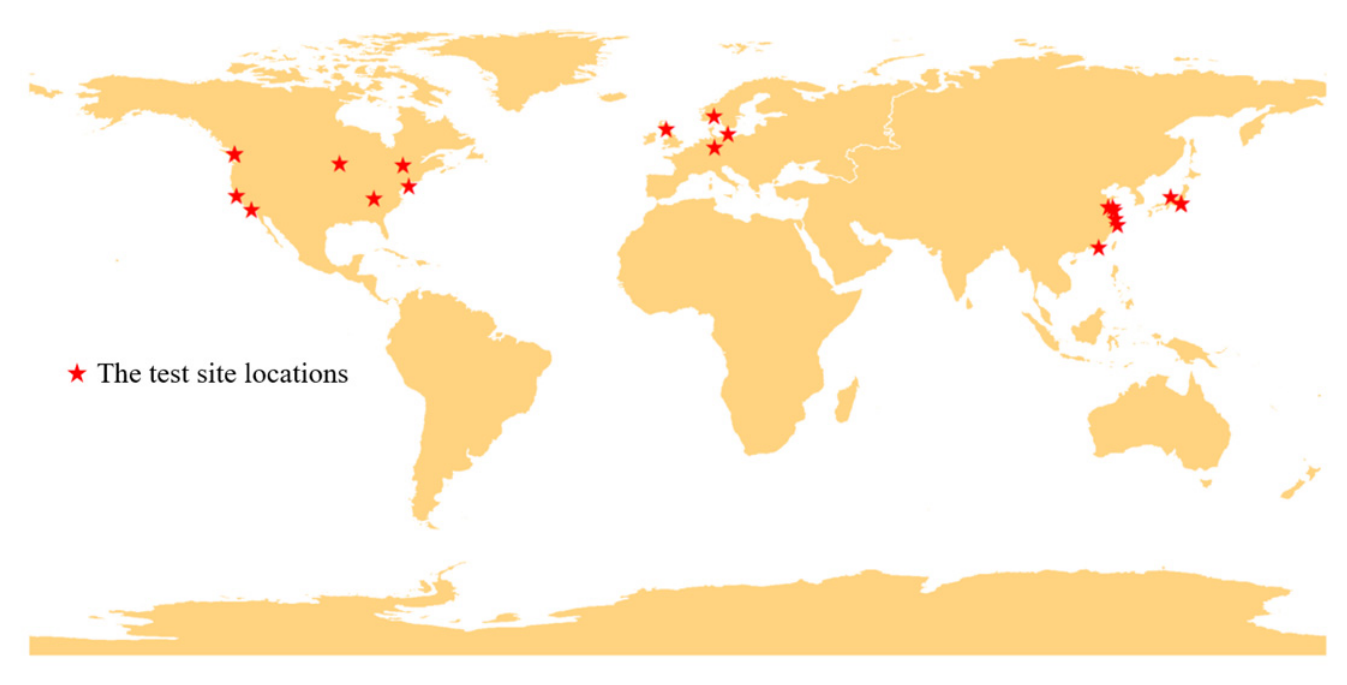
Based on the above criteria, 41 static load test records of LDSPPs from 21 sites were collected through literature review, engineering case collection, and database retrieval. Figure 1 shows the geographical distribution of the test sites. Table 1 summarizes the characteristics of the database, whereas Table 2 presents the individual pile test records, including site locations, pile diameters, wall thicknesses, embedded lengths, soil types, and data sources.
Figure 1.
Geographical distribution of pile testing sites.
Table 1.
Overview of the Large-Diameter Steel Pipe Pile Database.
Table 2.
Database of static load tests for large-diameter steel pipe piles.
The basic statistics of the database are summarized in Table 2. The database is dominated by compressive piles, and the test piles are categorized into offshore piles and onshore piles (piles for river-crossing bridges are classified as onshore piles). The pile diameter ranges from 800 mm to 3000 mm, and the pile length ranges from 9.86 m to 100 m. The bearing capacity varies widely from 1210 kN to 71,560 kN. Overall, offshore piles have larger diameters, longer lengths, and higher bearing capacities than onshore piles. Among the 41 static load tests, 29 allow separation of shaft friction resistance and base resistance, including 10 uplift pile tests. Of the 34 tests with recorded rest periods, over 70% have rest periods between 10 and 100 days, and only 4 have rest periods exceeding 100 days. It should be noted that several test piles originate from the same site or experimental program and may share similar geological conditions, CPT interpretations, and installation procedures. Therefore, the test records were grouped according to their respective sites during database processing, and potential within-site dependence was explicitly considered when interpreting the statistical results, rather than treating all 41 tests as fully independent observations.
2.3. Existing Calculation Methods for Vertical Bearing Capacity of LDSPPs
All six design methods evaluated (UWA, ICP, NGI, Fugro, API, and MOT) follow a similar total bearing capacity formulation, where total bearing capacity equals the sum of shaft resistance and base resistance. The general expression is given by:
where fpi is the unit ultimate shaft resistance of the i-th soil layer; Asi is the outer shaft surface area of the pile in the i-th soil layer; Ab denotes the cross-sectional area of the pile; qb is the unit base resistance. Both resistance components depend on pile geometry, physical and mechanical properties of the surrounding soil, and pile–soil interaction characteristics. In this study, each soil layer is classified as either sand or clay according to its properties, and corresponding formulas for sand and clay from each design method are applied for bearing capacity calculation.
Calculation of pile axial bearing capacity requires pile parameters, static load test results, and soil parameters obtained from field tests (e.g., CPT) or laboratory tests. In engineering practice, however, not all parameters are fully documented. Missing parameters are reasonably inferred from available data, and the estimation criteria for key parameters are listed in Table 3.
Table 3.
Estimation of key parameters.
Several geotechnical parameters required by the investigated design methods were estimated using empirical correlations because direct measurements were unavailable for some test cases. Although these correlations provide a consistent basis for the calculations, their applicability may vary with soil conditions, introducing uncertainty into the predicted pile capacities. Furthermore, different design methods may exhibit different sensitivities to the same input parameters. Therefore, a quantitative sensitivity analysis was conducted to evaluate the influence of the reconstructed parameters on the calculated capacities and the relative predictive performance of the investigated methods.
3. Applicability Analysis of Existing Bearing Capacity Calculation Methods
3.1. Sensitivity to Reconstructed Geotechnical Parameters
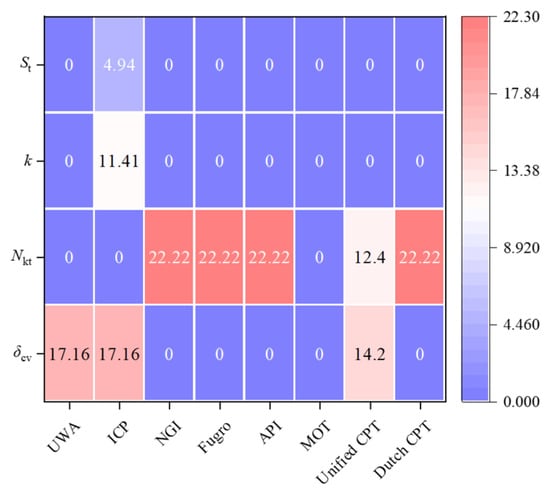
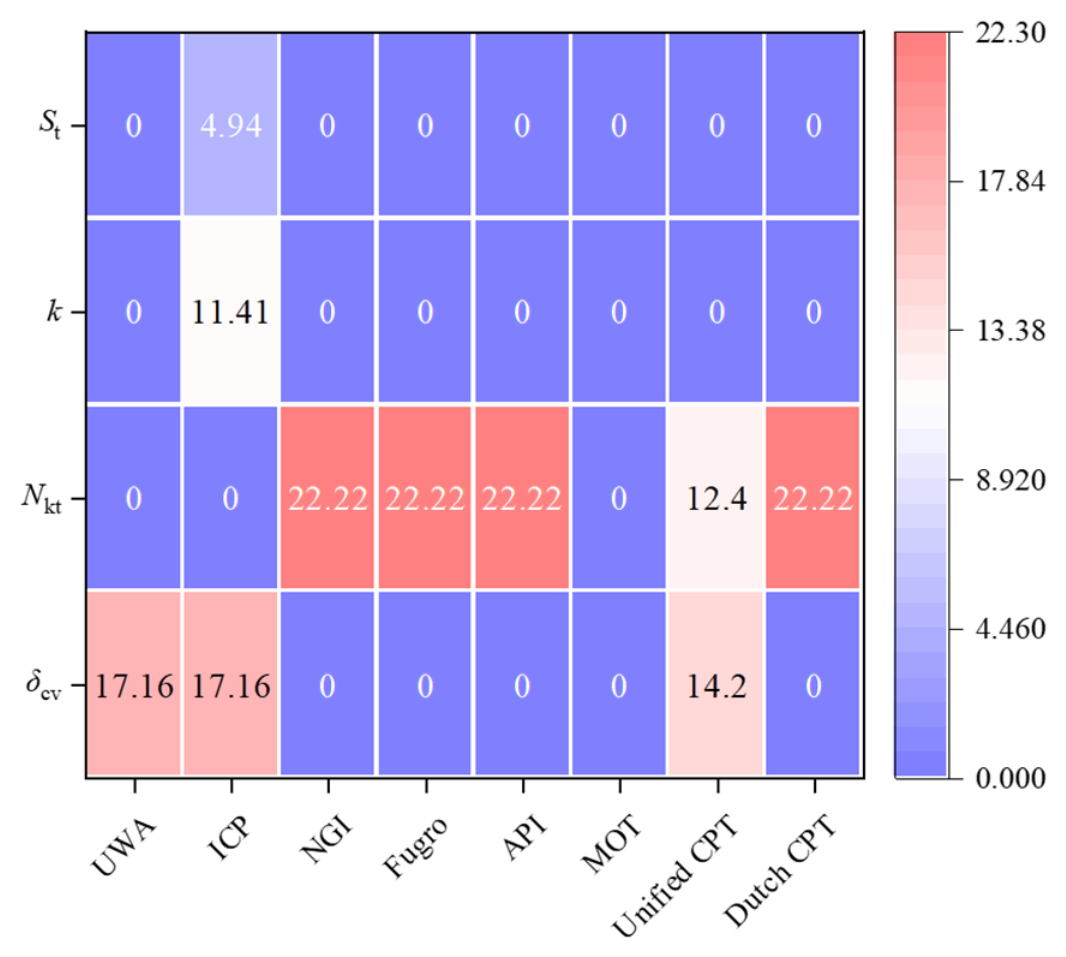
To quantify the influence of uncertainties in the reconstructed geotechnical parameters, a sensitivity analysis was performed by varying the selected parameters within the ranges specified in Table 4. The calculated capacities were updated for each parameter scenario, and the resulting prediction ratios and statistical performance indicators were compared with those obtained using the baseline parameter values. Particular attention was given to the sensitivity of the prediction errors and relative method rankings to the adopted parameter assumptions, as shown in Figure 2.
Table 4.
Parameter perturbation schemes adopted for the sensitivity analysis of reconstructed geotechnical parameters.
Figure 2.
Sensitivity of eight axial pile capacity prediction methods to variations in geotechnical input parameters.
The illustrative sensitivity heatmap reveals distinct responses of the eight design methods to variations in the selected geotechnical parameters. The cone factor (Nkt) exhibits relatively pronounced effects on the NGI, Fugro, API, and Dutch CPT methods, with maximum relative changes of 22.22% in the examined resistance components. Variations in the pile–soil interface friction angle (δcv) mainly affect the UWA, ICP, and Unified CPT methods, with corresponding sensitivities of 17.16%, 17.16%, and 14.20%, respectively. In contrast, the effects of the OCR correlation coefficient (k) and soil sensitivity (St) are concentrated in the ICP method, with relative changes of 11.41% and 4.94%, respectively. The MOT method shows no direct response to the four investigated parameters because these variables are not explicitly included in the adopted design expressions. Overall, the illustrative results indicate that parameter sensitivity is strongly dependent on the formulation of each design method. However, the effects on total bearing capacity and the robustness of the relative method rankings require further assessment using case-specific calculations.
3.2. Total Bearing Capacity Q
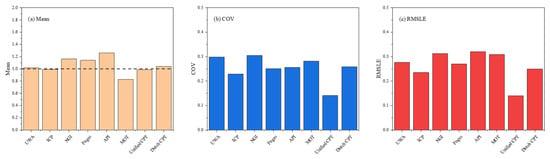
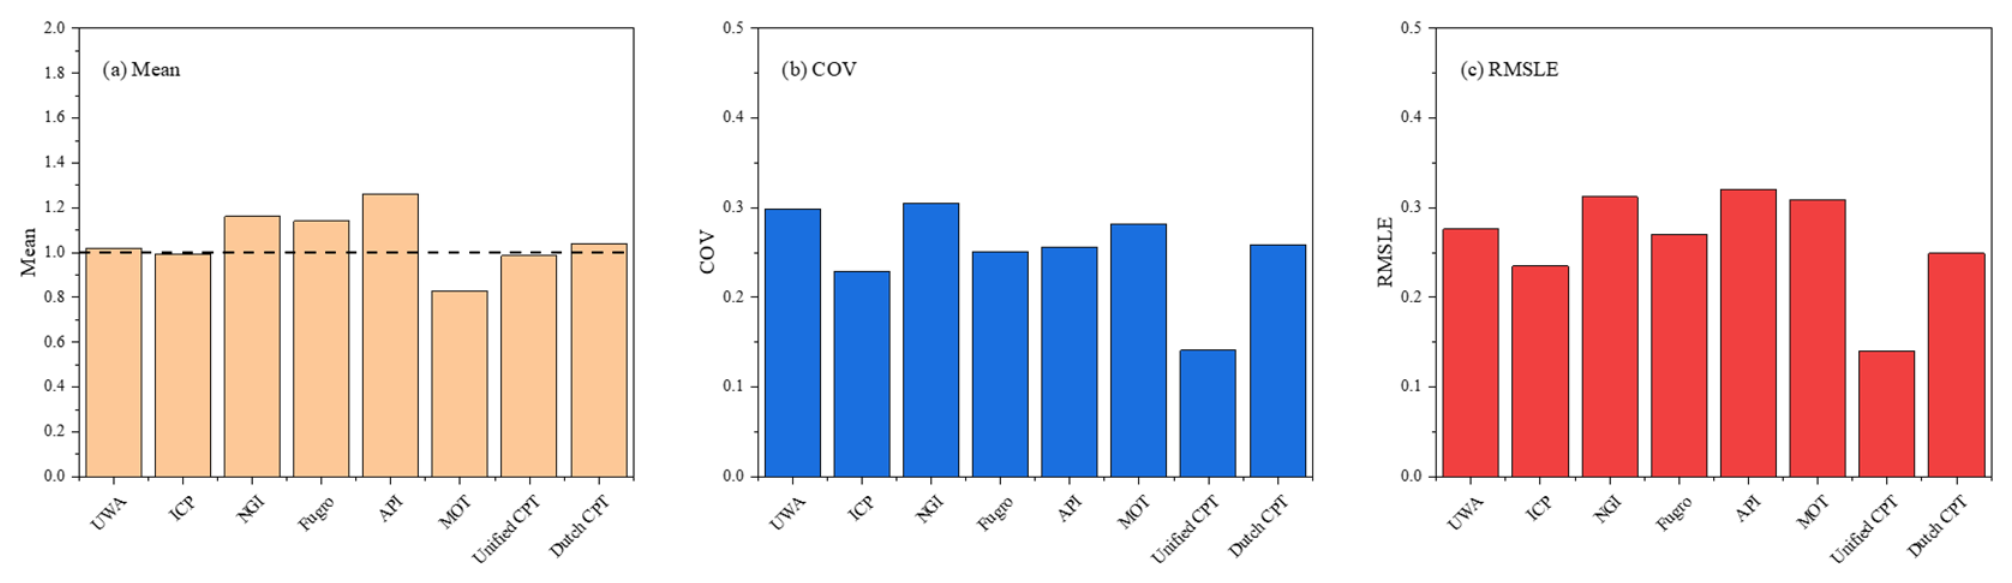
Figure 3 presents the evaluation results of the eight calculation methods based on the database. The mean value μ reflects the overall prediction bias: a value closer to 1 shows better agreement between the average calculated and measured capacities. A mean value greater than 1 means the method tends to overestimate bearing capacity (unconservative), while a value less than 1 indicates a conservative estimate. The coefficient of variation (COV) reflects result dispersion: a smaller COV means less scattered results. In addition, the root mean squared logarithmic error (RMSLE) provides a complementary measure of prediction accuracy by accounting for both overestimation and underestimation, with lower values indicating better overall agreement with measured capacities.
Figure 3.
Comparison of the mean calculated-to-measured total bearing capacity ratio, coefficient of variation (COV), and root mean squared logarithmic error (RMSLE) for eight design methods.
As shown in the figure, the UWA, NGI, Fugro, API, and Dutch CPT methods yield mean calculated-to-measured ratios greater than 1.0, indicating a tendency to overestimate the total vertical bearing capacity of LDSPPs. By contrast, the MOT method produces a mean ratio below 1.0, indicating a conservative prediction, whereas the ICP and Unified CPT methods yield mean ratios close to unity. Among the eight methods, the Unified CPT method exhibits the lowest COV (approximately 0.15) and RMSLE (approximately 0.14), indicating the smallest prediction dispersion and logarithmic error. The ICP method also demonstrates relatively favorable performance, with a mean ratio close to 1.0, a COV of approximately 0.23, and an RMSLE of approximately 0.23. In addition, the NGI, Fugro, and API methods exhibit relatively higher mean ratios, indicating greater tendencies toward overestimation, while the MOT method shows a more pronounced conservative bias. The Dutch CPT method provides relatively balanced predictions, with a mean ratio close to unity and moderate dispersion. Overall, the Unified CPT method exhibits the most favorable descriptive statistical performance among the eight methods, although the statistical significance of differences between competing methods requires further assessment using bootstrap confidence intervals and paired comparisons.
3.3. Shaft Resistance Qs
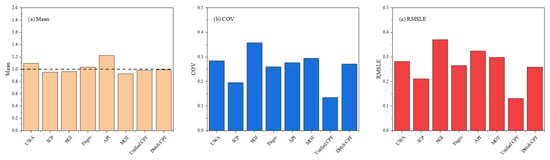
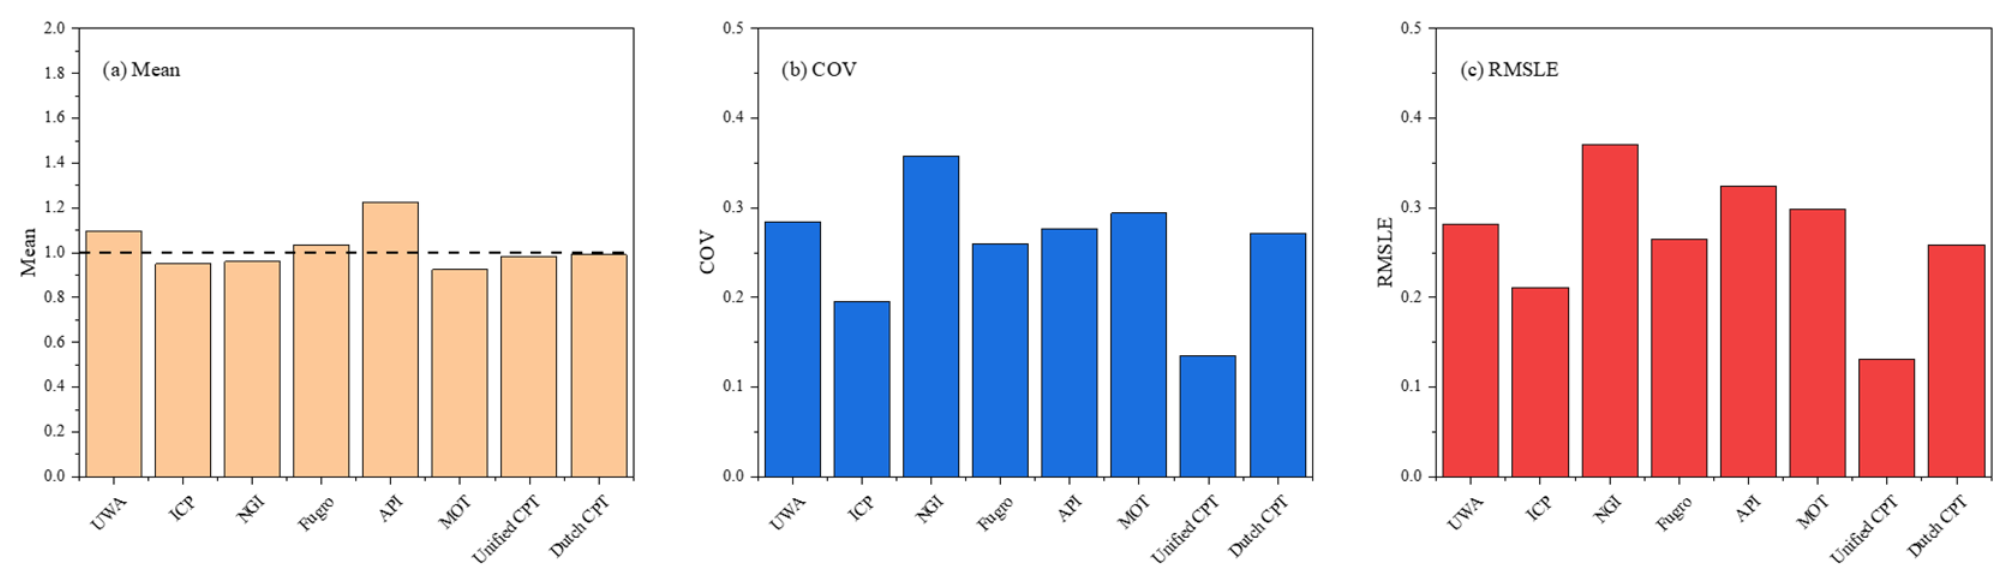
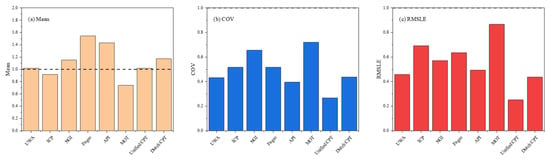
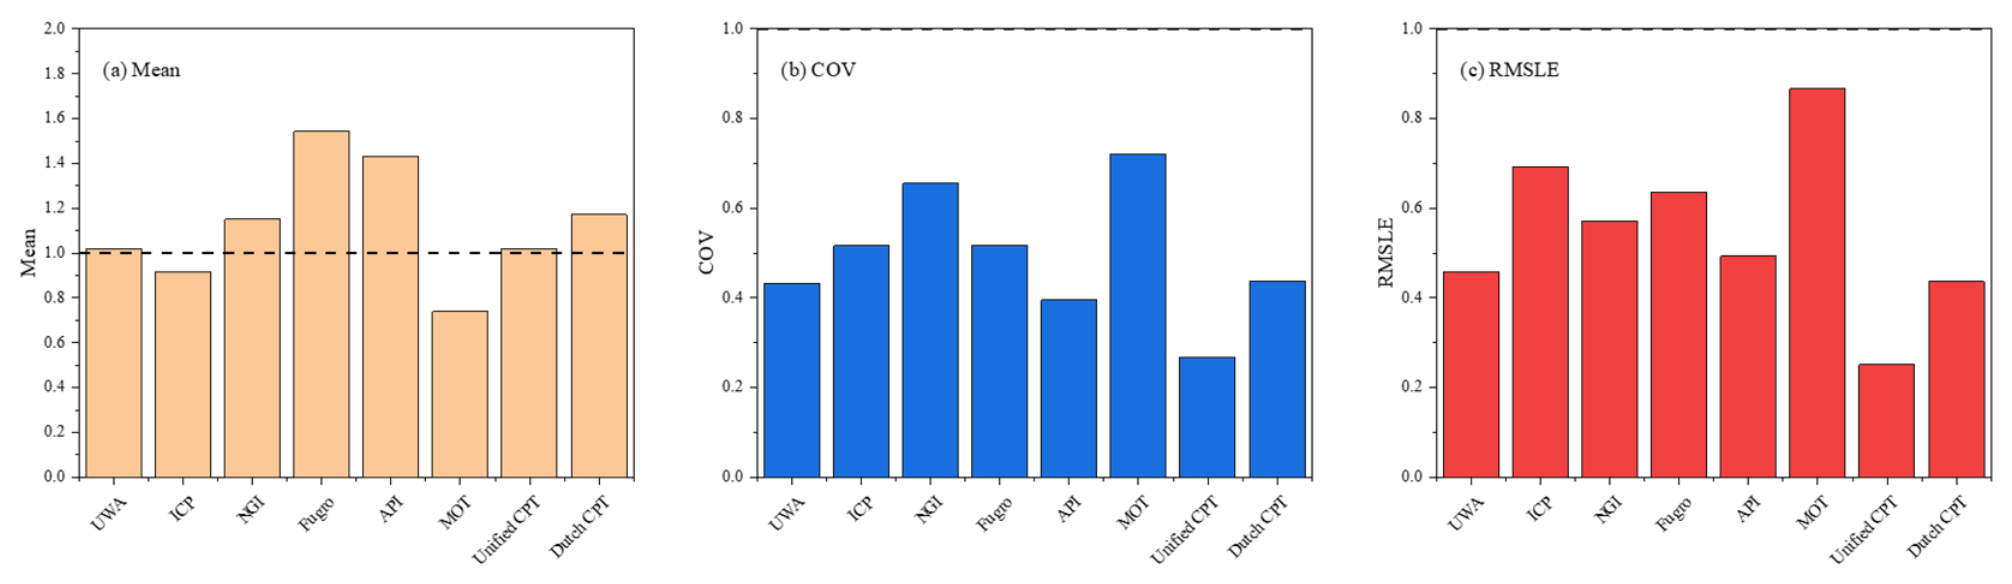
Figure 4 presents the mean, COV, and RMSLE of the calculated-to-measured shaft resistance ratio for each method. The ICP, NGI, MOT, Unified CPT, and Dutch CPT methods yield mean ratios below unity, indicating a tendency to underestimate shaft resistance, whereas the UWA, Fugro, and API methods exhibit varying degrees of overestimation. Among these methods, Fugro and Dutch CPT show mean ratios relatively close to unity, suggesting relatively small average prediction biases. Figure 4 also shows that the Unified CPT method exhibits the lowest COV (approximately 0.13) and RMSLE (approximately 0.13), indicating the smallest prediction dispersion and overall logarithmic error among the eight methods. The ICP method also demonstrates relatively favorable performance, with a COV of approximately 0.19 and an RMSLE of approximately 0.21. In contrast, the NGI method exhibits comparatively greater dispersion and prediction error, despite its mean ratio being relatively close to unity. The API method shows a more pronounced tendency to overestimate shaft resistance, while the MOT method remains conservative. Overall, the Unified CPT method exhibits the most favorable descriptive statistical performance for shaft resistance prediction, followed by the ICP method. However, the statistical significance of differences between competing methods should be further assessed using bootstrap confidence intervals and paired comparisons, particularly given the limited number of available shaft resistance measurements.
Figure 4.
Comparison of the mean calculated-to-measured shaft resistance, coefficient of variation (COV), and root mean squared logarithmic error (RMSLE) for eight design methods.
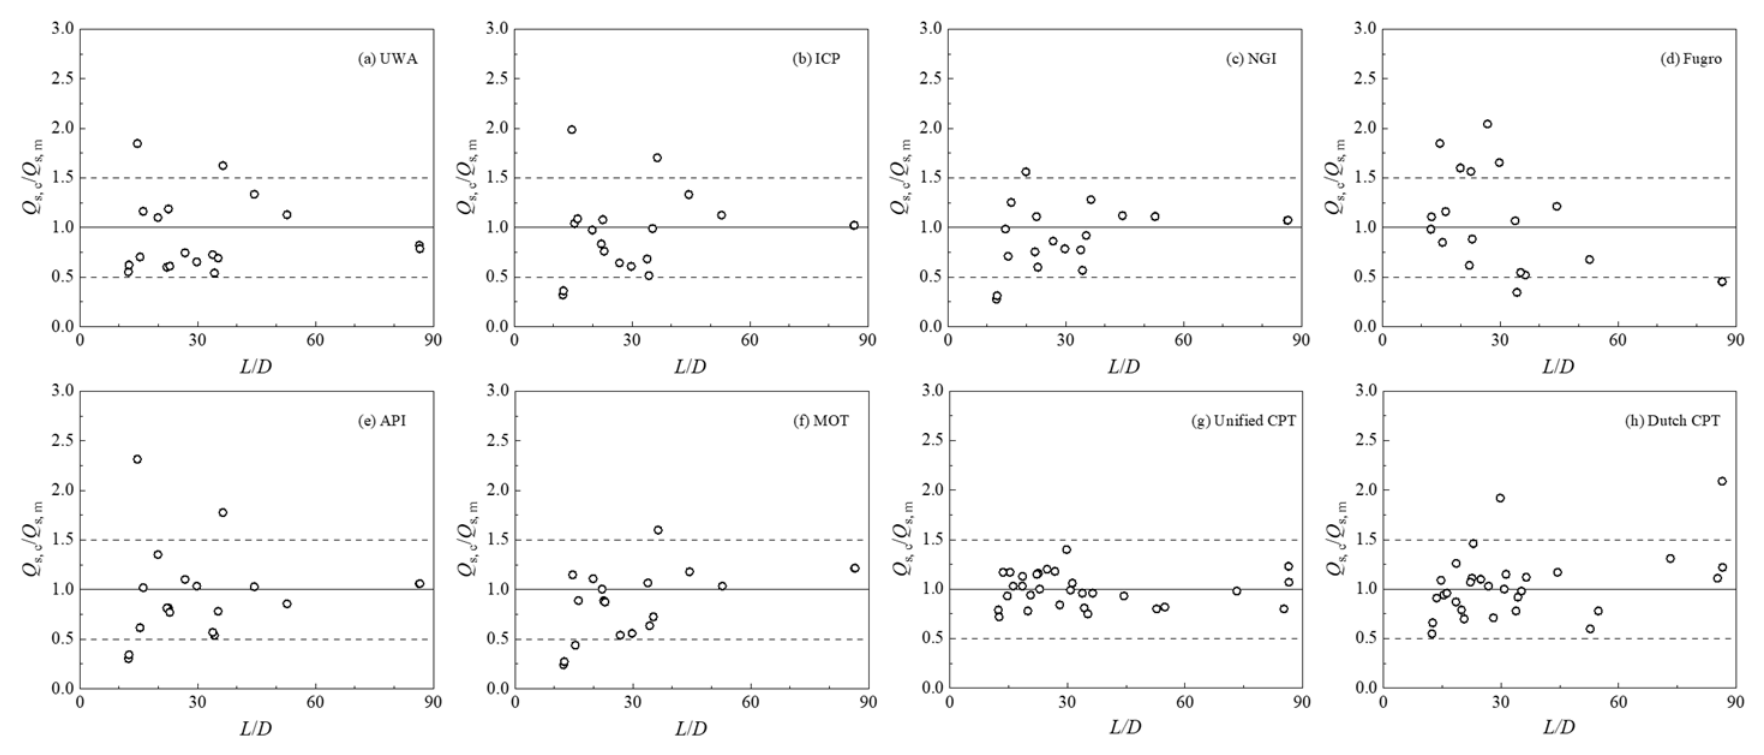
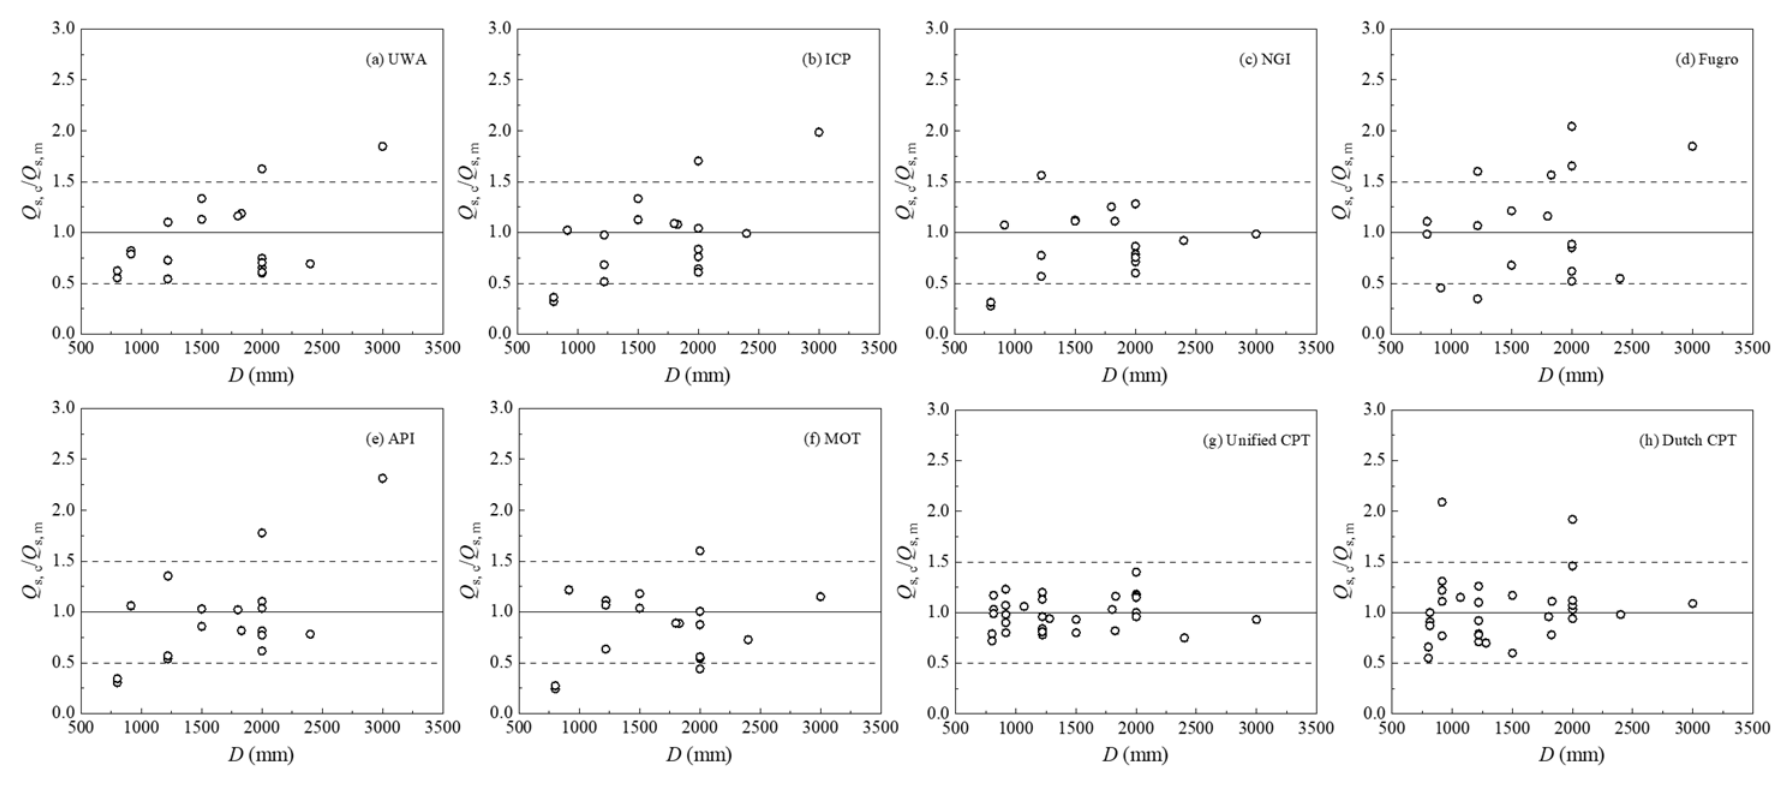
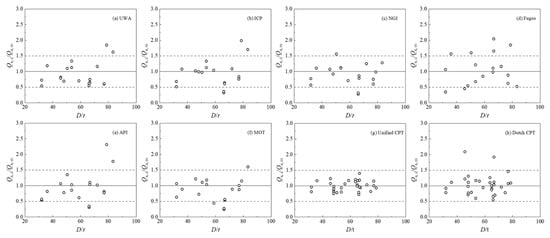
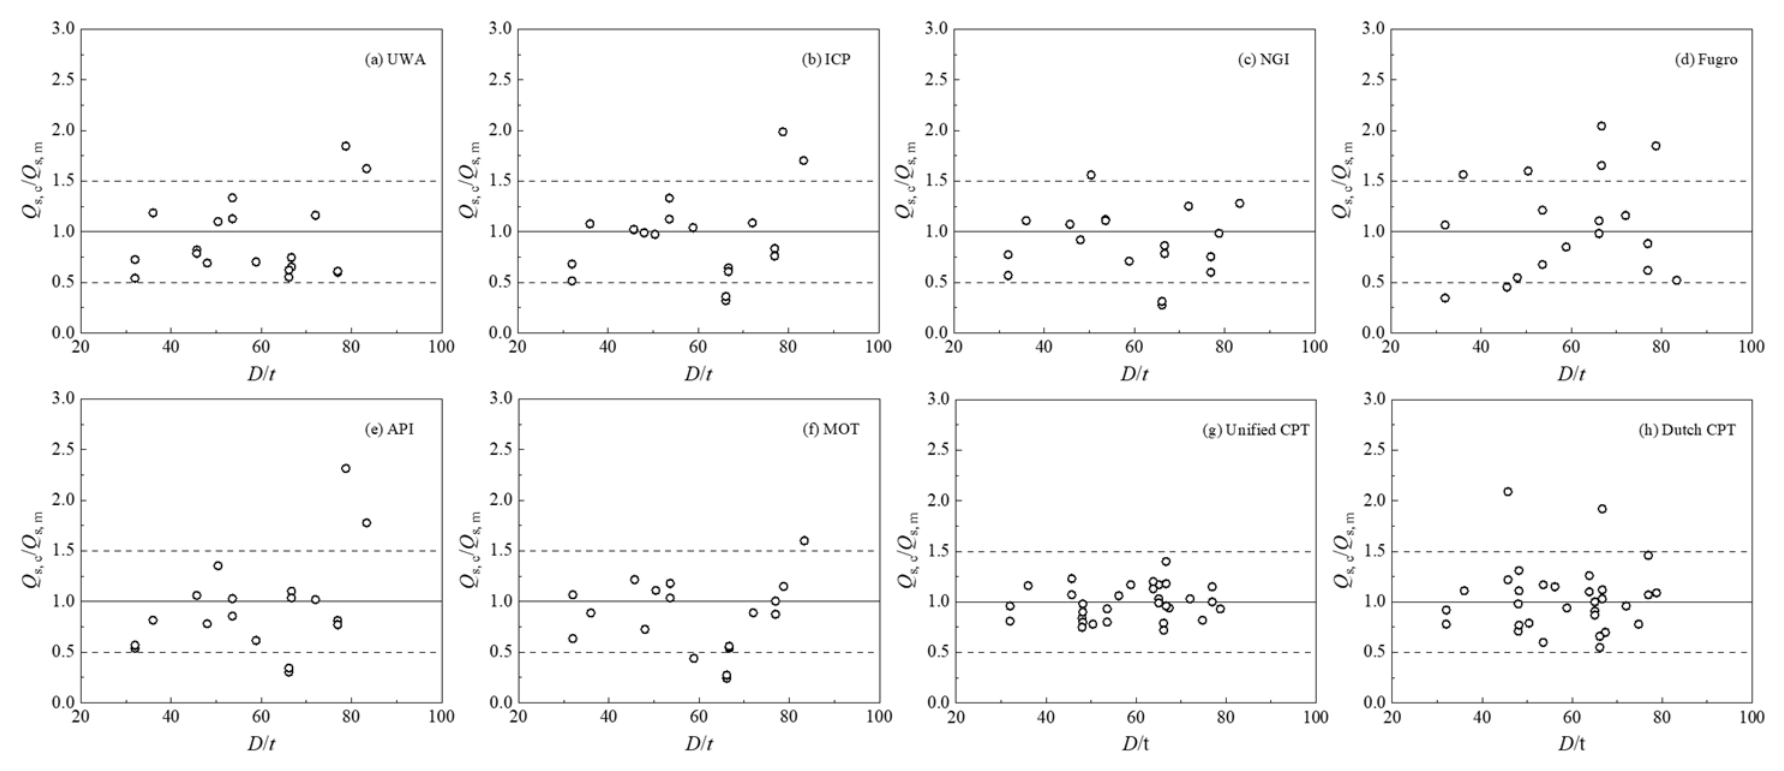
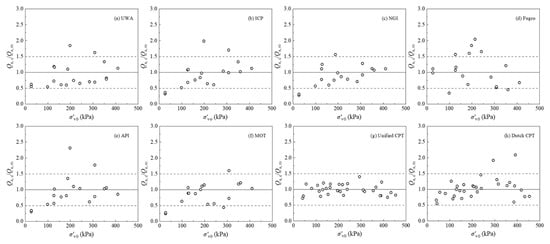
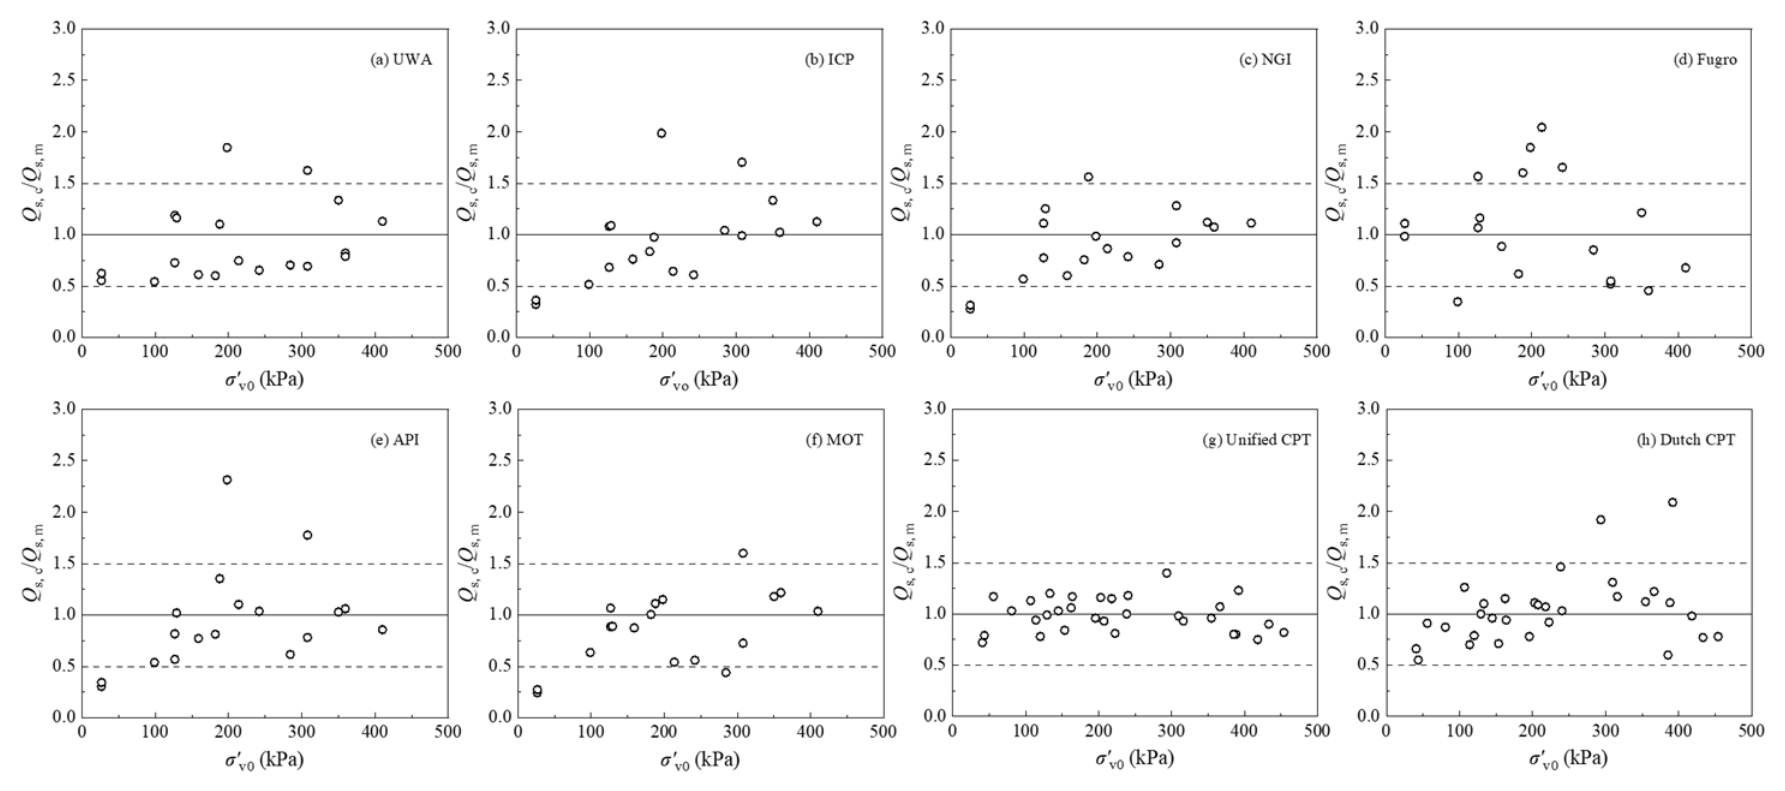
Figure 5, Figure 6, Figure 7 and Figure 8 plot the calculated-to-measured shaft resistance ratio (Qs,c/Qs,m) against L/D, D, D/t, and σ′v0/pa, respectively. The UWA, ICP, and MOT methods exhibit comparatively stable distributions, whereas the NGI, Fugro, and particularly API predictions contain several large deviations. The inclusion of the Unified CPT and Dutch CPT methods extends the comparison to more recently developed and conventional CPT-based approaches, respectively, allowing their responses to pile geometry and stress conditions to be examined within the same evaluation framework.
Figure 5.
Distribution of the ratio between calculated and measured values of lateral pile friction resistance versus pile length-to-diameter ratio.
Figure 6.
Distribution of the ratio between calculated and measured values of lateral pile friction resistance versus pile outer diameter.
Figure 7.
Distribution of the ratio between calculated and measured values of lateral pile friction resistance versus pile diameter-to-thickness ratio.
Figure 8.
Distribution of the ratio between calculated and measured values of pile-side friction resistance relative to the average effective stress.
For the originally evaluated methods, no clear or consistent monotonic trend with diameter alone is observed. No method shows a strong monotonic trend with diameter alone. This is important because it suggests that increasing D within the present 0.8–3.0 m range does not, by itself, produce a uniform loss of shaft-capacity accuracy. In contrast, trends with L/D and stress level are more visible, consistent with the role of friction fatigue, stress normalization, and the accumulated contribution of multiple layers along long piles.
3.4. Base Resistance Qb
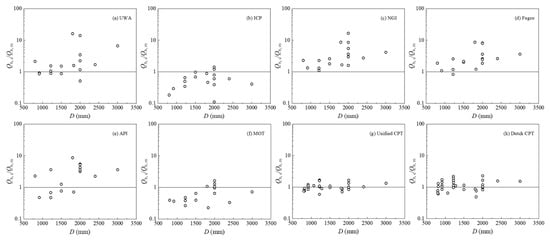
Only 18 tests in the database allow separation of base resistance (Qb). The limited sample size makes the analysis susceptible to the influence of individual outlier data points. Figure 9 shows the mean, COV, and RMSLE of the calculated-to-measured base resistance ratio (Qb,c/Qb,m) for the eight calculation methods. Compared with the results for total bearing capacity and shaft resistance, the base resistance predictions exhibit greater variability among different methods, particularly in terms of mean prediction bias and RMSLE. These differences indicate considerable uncertainty in the estimation of base resistance for LDSPPs. This deviation may be associated with two factors: (1) the high uncertainty in the plugging conditions developed during pipe pile penetration, which complicates base resistance calculation; (2) the difficulty in accurately measuring and calculating inner shaft resistance. In addition, uncertainties associated with the indirect determination of measured base resistance may contribute to the observed prediction scatter.
Figure 9.
Mean and coefficient of variation in the ratio between calculated and measured values of pile end resistance.
As shown in Figure 9, the MOT and ICP methods tend to underestimate base resistance, whereas the NGI, Fugro, API, and Dutch CPT methods generally exhibit varying degrees of overestimation. In contrast, the UWA and Unified CPT methods yield mean calculated-to-measured ratios relatively close to unity. Among the eight methods, the Unified CPT method exhibits the lowest COV and RMSLE, indicating comparatively small prediction dispersion and logarithmic error in the plotted results. The MOT method shows a relatively pronounced underestimation tendency and a higher RMSLE, suggesting greater discrepancies between calculated and measured base resistance. The conservative predictions obtained using the MOT and ICP methods may be partly related to differences in their treatment of pile toe resistance. In particular, the MOT method incorporates a bearing capacity reduction factor associated with pile geometry, whereas the ICP method accounts for the effective toe resistance of open-ended piles according to the adopted plugging assumptions. These differences in calculation procedures may contribute to their relatively low predicted base resistance.
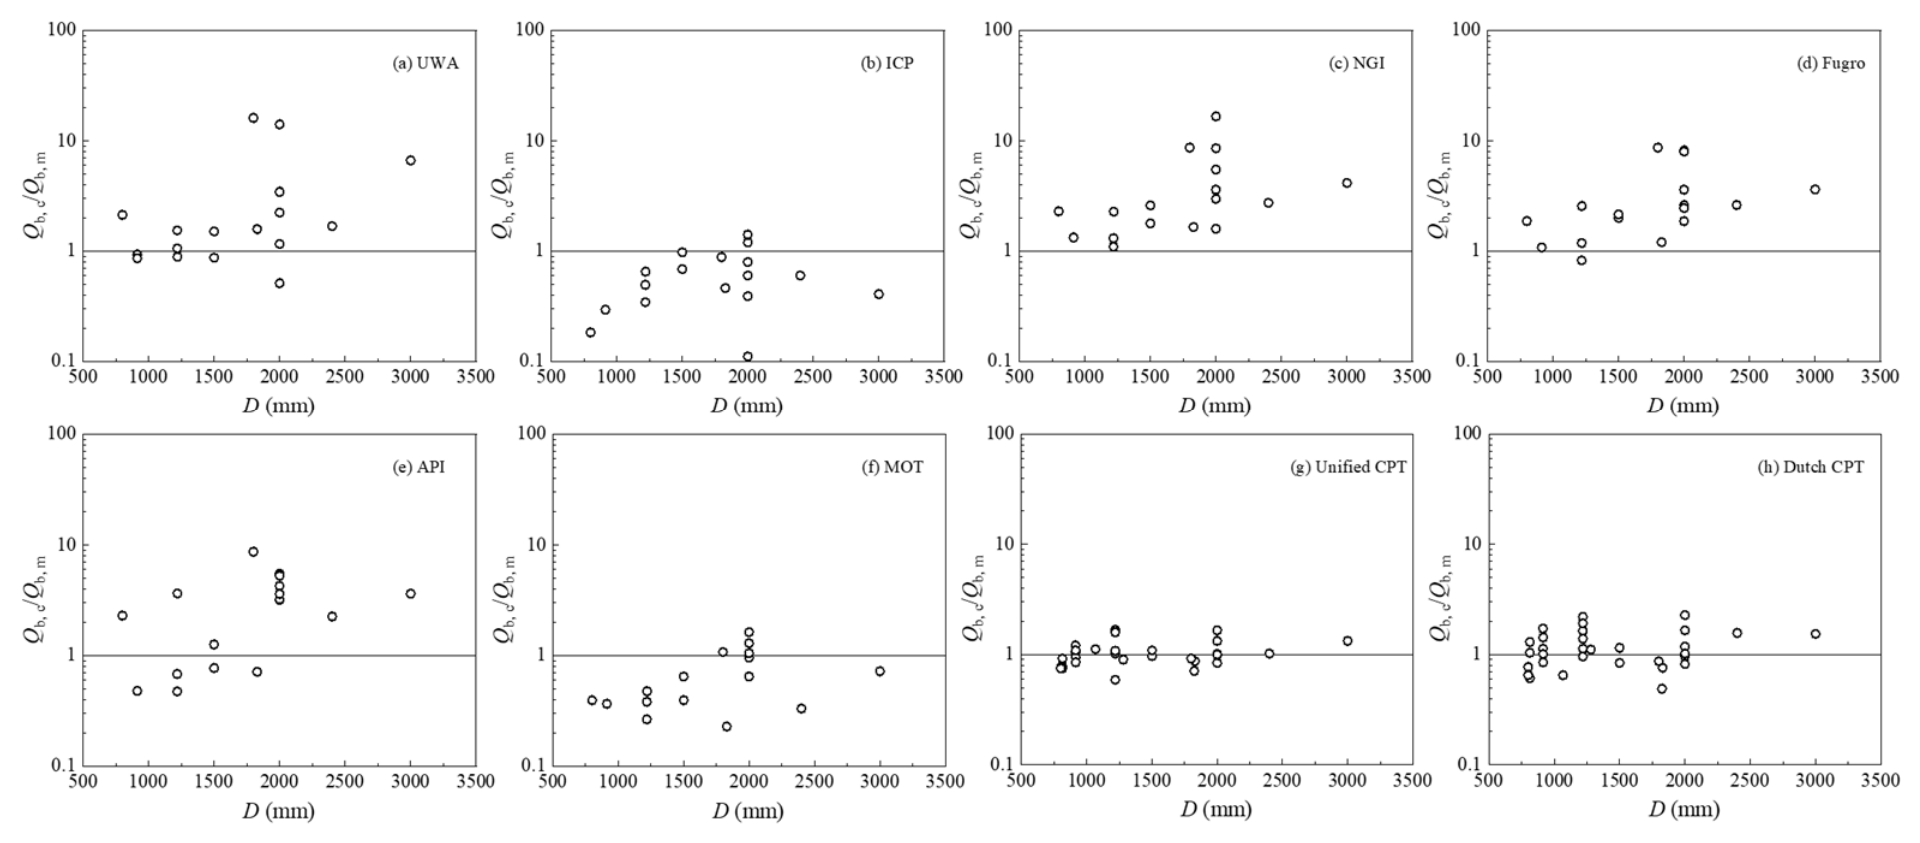
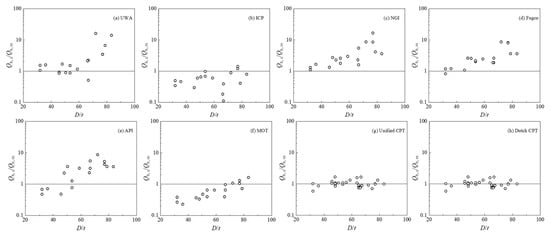
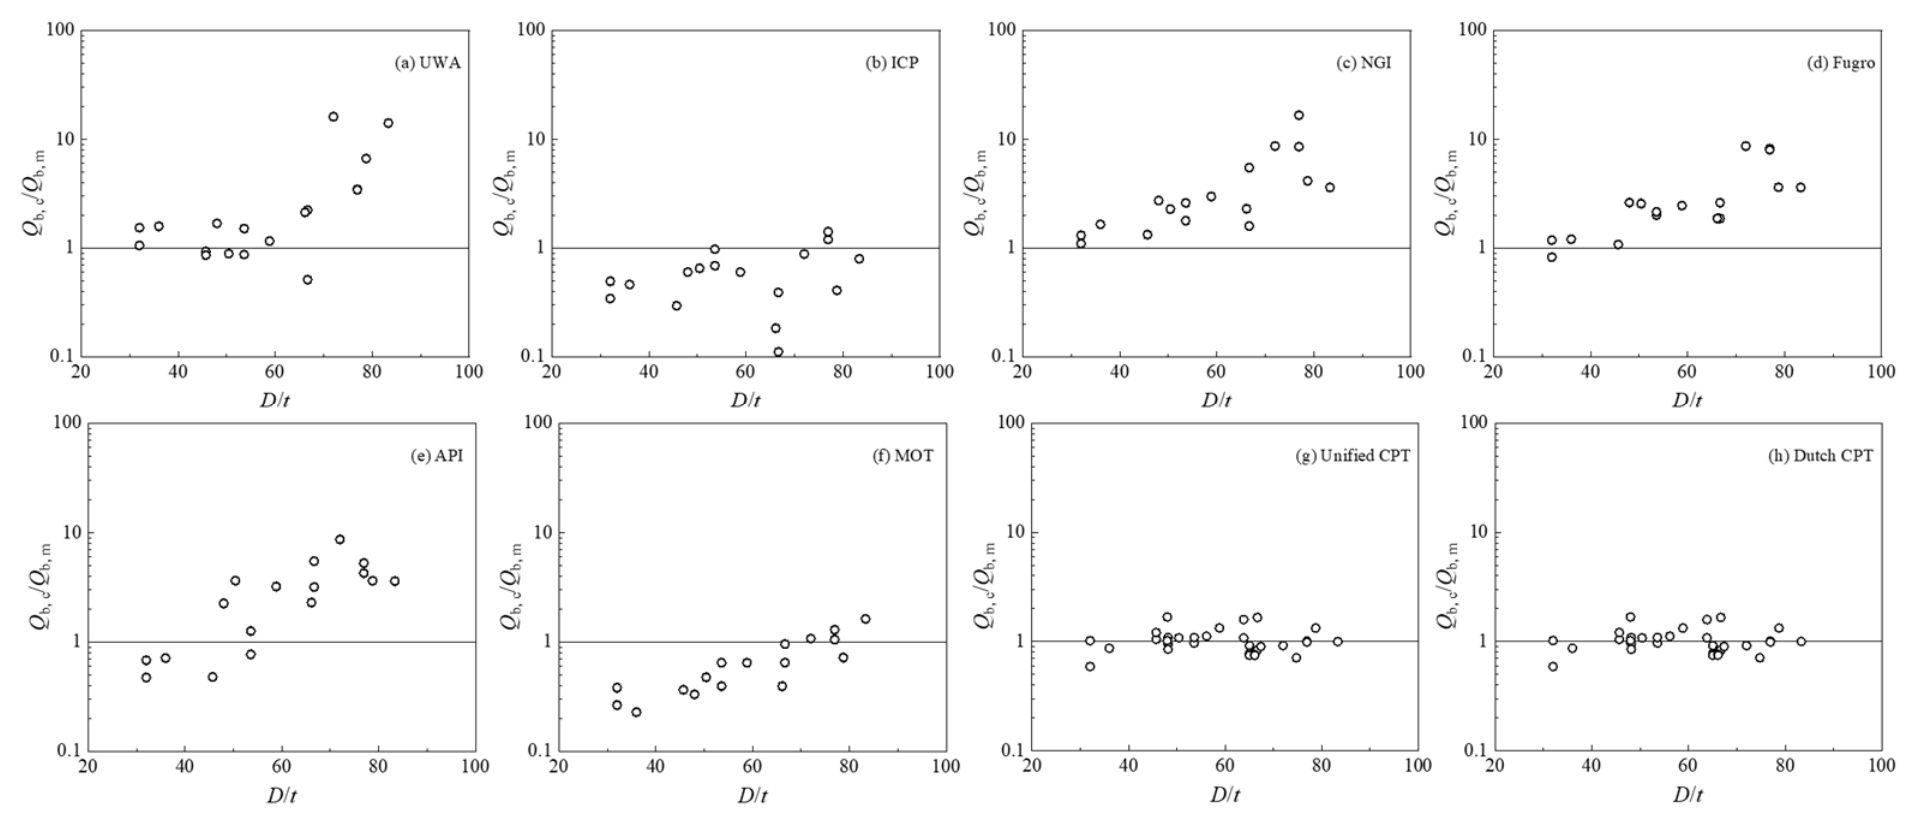
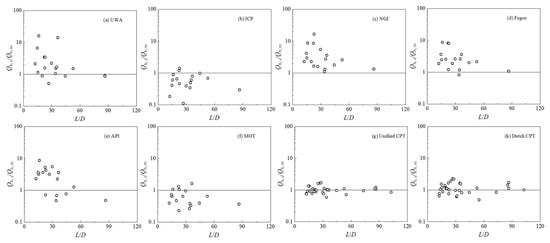
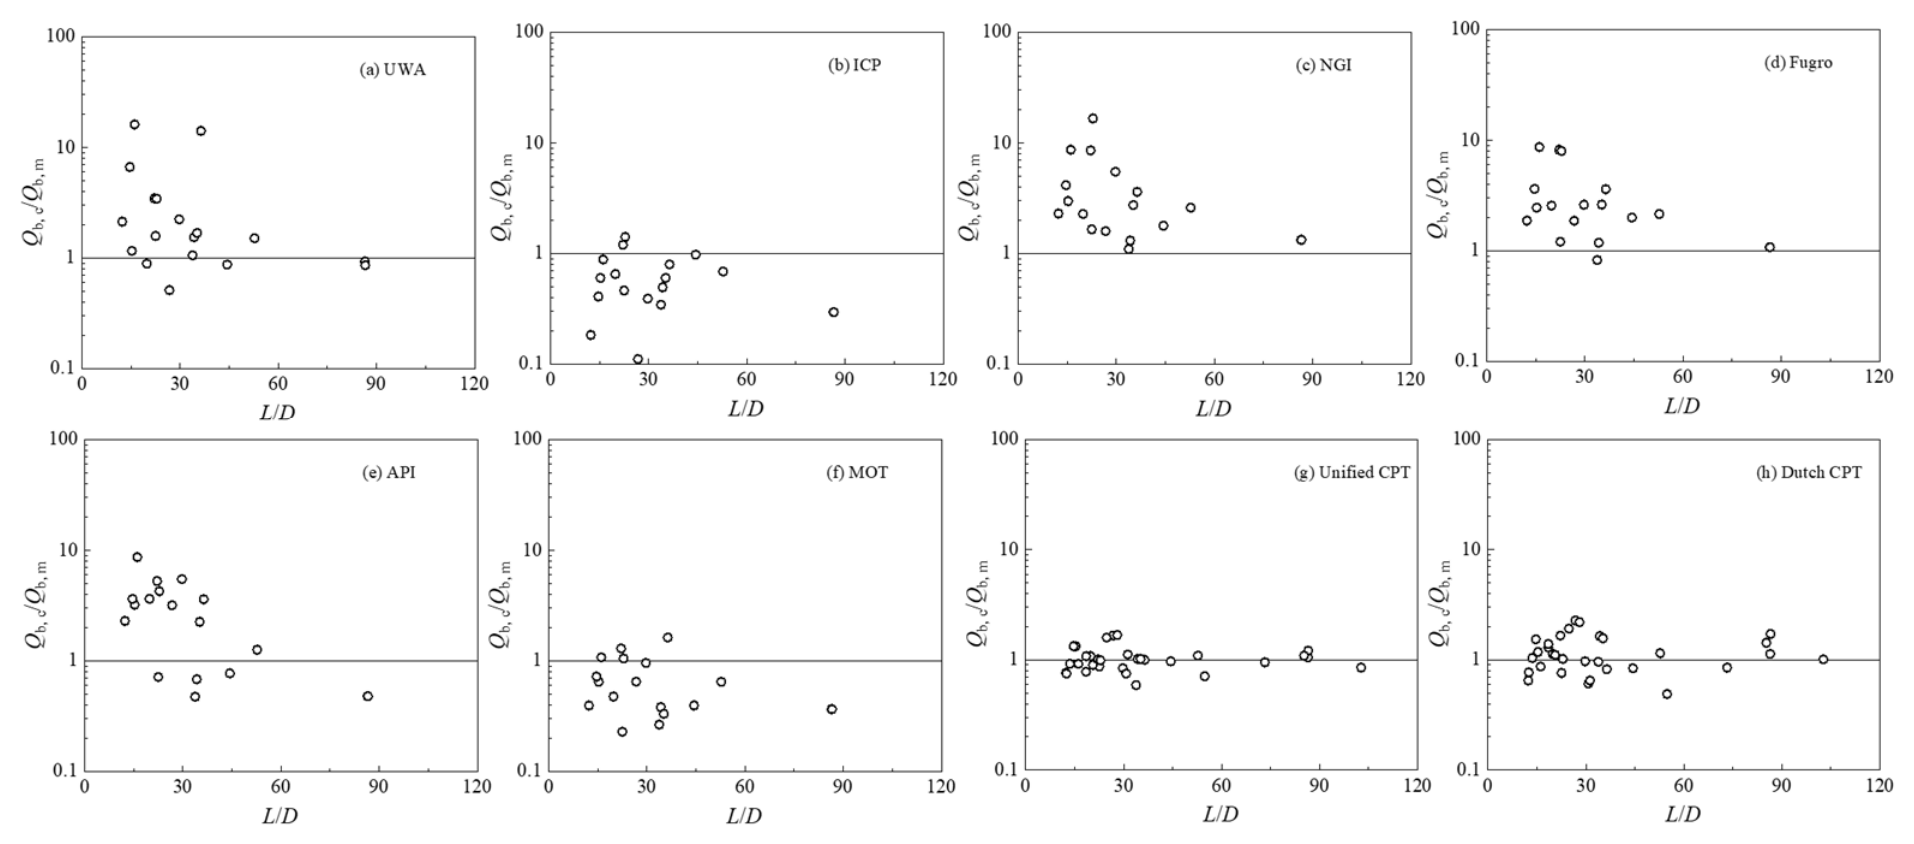
Figure 10, Figure 11 and Figure 12 illustrate the variations in the calculated-to-measured base resistance ratio with L/D, D, and D/t, respectively. The differences among the eight methods suggest that base resistance predictions are influenced by the assumptions adopted to represent pile geometry and soil–pile interaction. The trend lines suggest that the calculated-to-measured base resistance ratios generally increase with increasing D and D/t, indicating a possible dependence of prediction bias on pile geometry. However, these observed relationships should not be interpreted as direct evidence of a physical size effect or the dominance of soil-plug resistance. This is because pile geometry, soil conditions, installation characteristics, and plugging behavior are not independently controlled in the present database. Furthermore, the observed trends may partly reflect differences in the underlying assumptions of the design methods and uncertainties associated with the measured base resistance. Therefore, the relationships presented in Figure 9, Figure 10 and Figure 11 should be regarded as exploratory observations rather than definitive evidence of the mechanisms governing base resistance. Given the limited number of available base resistance measurements, further statistical verification is necessary before establishing the relative superiority of individual prediction methods.
Figure 10.
Distribution of the ratio between calculated and measured pile end resistance values versus pile length-to-diameter ratio.
Figure 11.
Distribution of the ratio between calculated and measured pile end resistance values versus pile outer diameter.
Figure 12.
Distribution of the ratio between calculated and measured values of pile end resistance versus pile diameter-to-thickness ratio.
3.5. Pile Bearing Capacity Under Different Influencing Factors
3.5.1. Comparison Between Offshore and Onshore Test Subsets
To further evaluate the applicability of the eight design methods under different site conditions, the static load test database was divided into offshore and onshore subsets according to the locations of the test sites. Of the 41 static load tests, 19 were conducted at offshore sites and 22 at onshore sites, with piles for river-crossing bridges classified as onshore piles. This classification was used to compare the predictive performance of the investigated methods across the two subsets rather than to assess the direct effects of offshore environmental loading on pile bearing capacity.
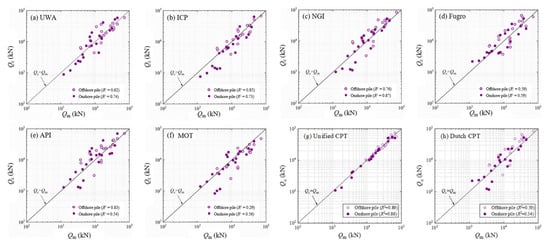
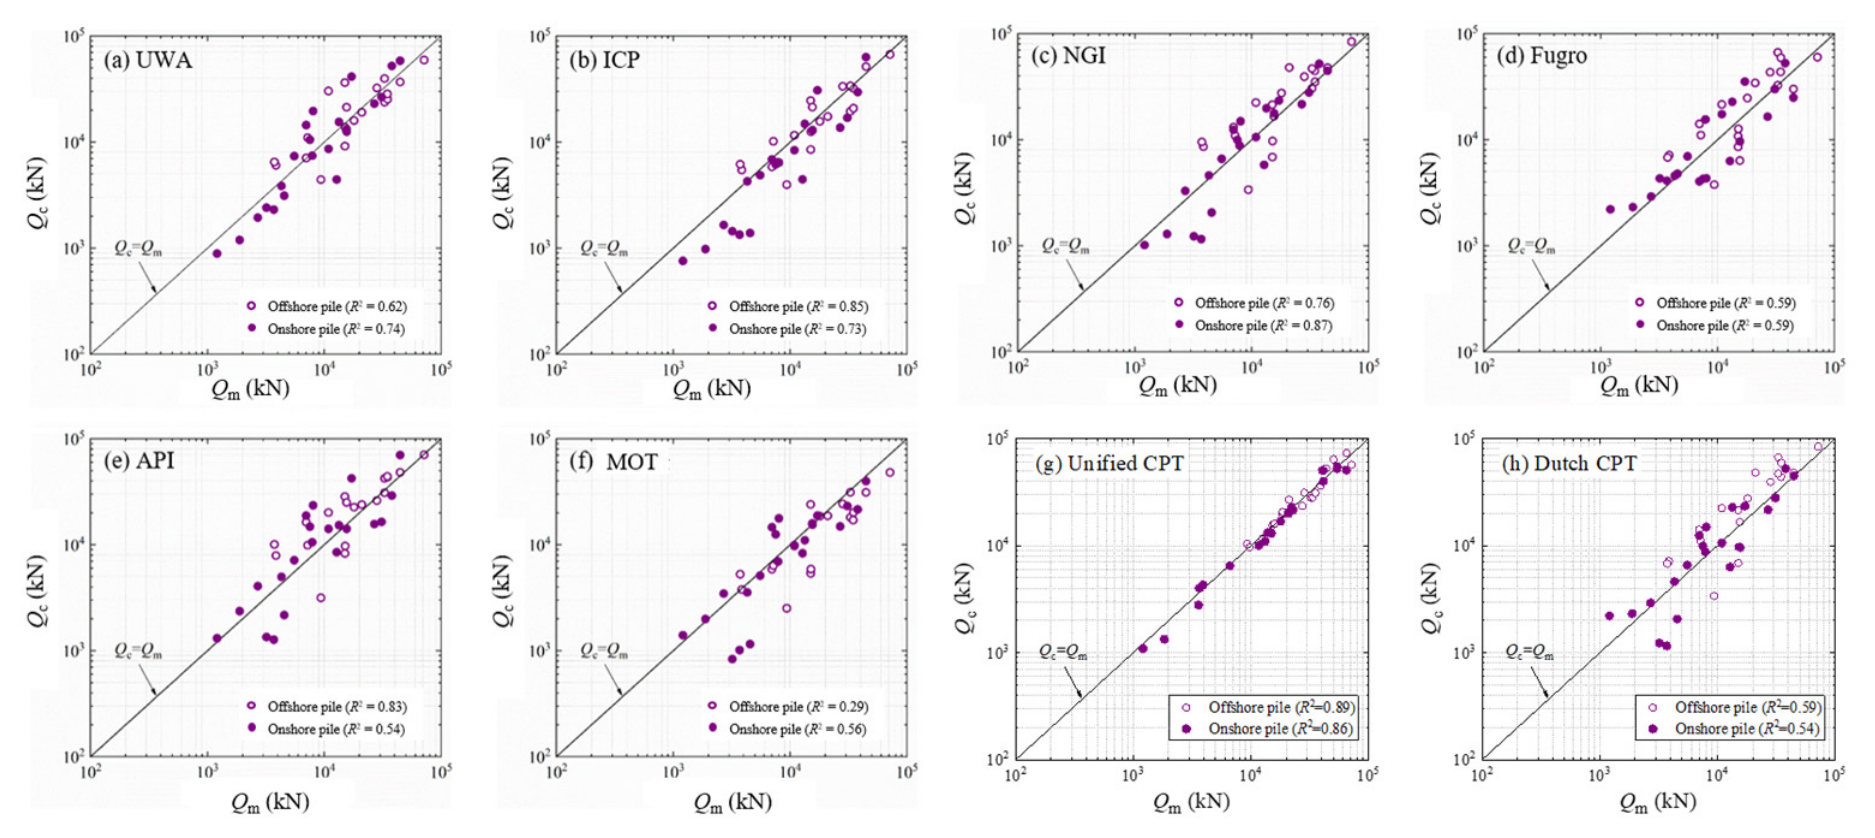
Figure 13 compares the calculated and measured total bearing capacities for the offshore and onshore subsets. The agreement between calculated and measured values is evaluated using the 1:1 reference line, while the coefficient of determination (R2) is used to describe the association between calculated and measured capacities. The UWA, NGI, and MOT methods exhibit higher R2 values for the onshore subset (0.74, 0.87, and 0.56, respectively) than for the offshore subset (0.62, 0.76, and 0.29, respectively), whereas the ICP and API methods show higher R2 values for the offshore subset (0.85 and 0.83, respectively) than for the onshore subset (0.73 and 0.54, respectively). The Fugro method exhibits similar performance in both subsets, with R2 values of 0.59 for both offshore and onshore piles. The illustrative Unified CPT results exhibit relatively high R2 values for both offshore (0.89) and onshore (0.86) subsets, whereas the Dutch CPT results show more moderate values of 0.59 and 0.54, respectively. However, these two additional panels are based on synthetic predictions and cannot be interpreted as independent validation results. Furthermore, a higher R2 value does not necessarily indicate smaller prediction bias or closer agreement with the 1:1 reference line. These differences should be interpreted with caution, as the two subsets differ in pile diameter, embedded length, soil conditions, installation procedures, and other relevant characteristics. Therefore, the observed variations in predictive performance cannot be attributed solely to offshore or onshore conditions. Instead, they reflect differences in the statistical performance of the investigated methods across the two subsets of the present database.
Figure 13.
Distribution of calculated and measured total bearing capacities for offshore pile foundations and onshore pile foundations.
3.5.2. Time Effect
Extensive studies have demonstrated the time-dependent nature of pile vertical bearing capacity. The time effect mainly manifests in shaft resistance, while base resistance generally exhibits a less pronounced time dependence. Chow et al. [38] attributed the time effect of shaft resistance to three mechanisms: (1) an increase in radial effective stress due to stress redistribution; (2) an increase in shaft resistance due to pile lateral expansion stress; (3) stress increase caused by physicochemical reactions between the pile shaft surface and surrounding soil.
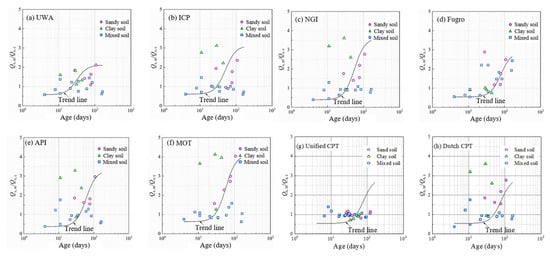
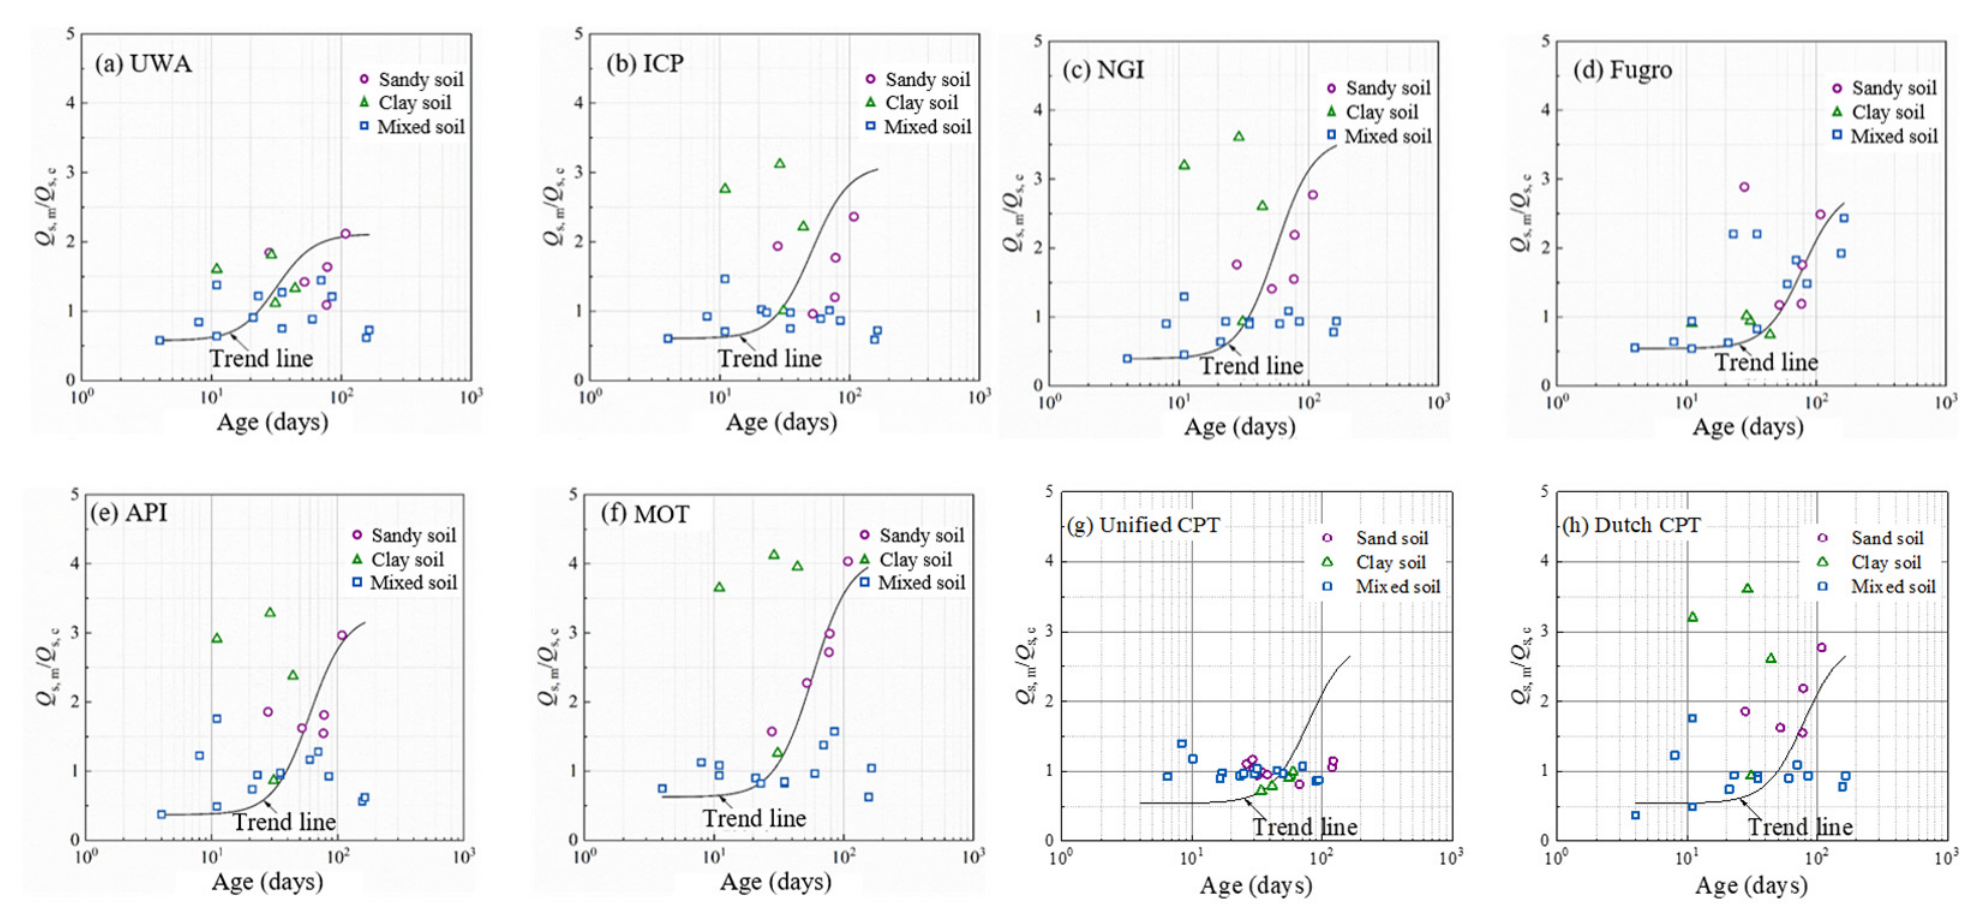
Of the 41 collected tests, 29 provide identifiable shaft resistance data, 34 have recorded rest periods, and 22 satisfy the requirements for examining the relationship between shaft resistance prediction and pile age. Figure 13 plots the measured-to-calculated shaft resistance ratio (Qs,m/Qs,c) against pile age for the eight design methods, with the available trend lines illustrating the observed relationships. It should be noted that this ratio reflects the discrepancy between measured and calculated shaft resistance rather than the directly measured growth of shaft resistance with time. For the UWA, ICP, NGI, Fugro, API, and MOT methods, the ratios generally exhibit an increasing tendency with pile age, particularly beyond approximately 20–30 days. However, this apparent trend may reflect not only time-dependent changes in shaft resistance but also systematic prediction biases and differences in soil conditions, pile geometry, and test sites. Therefore, the observed relationships should be interpreted as exploratory rather than direct evidence of pile aging effects.
Yang et al. [39], Haque et al. [40], Carroll et al. [41], and Buckley et al. [42] divided the time effect of shaft resistance into three stages: (1) Stage 1: an initial stage associated with nonlinear excess pore-water pressure dissipation and soil creep; (2) Stage 2: a period of continued shaft resistance development associated with stress redistribution and progressive consolidation; (3) Stage 3: a long-term stage characterized by a reduced rate of resistance growth. These stages provide a theoretical framework for understanding pile aging behavior. However, the present database does not provide sufficient evidence to independently identify these stages or quantify their durations. As shown in Figure 14, the trend lines for the established methods exhibit different rates of increase, suggesting method-dependent relationships between the measured-to-calculated shaft resistance ratio and pile age, which may partly reflect differences in the underlying prediction formulations rather than differences in the actual rate of shaft resistance development.
Figure 14.
Time-dependent effect of pile-side friction resistance.
The distribution of the data also varies with soil type. For mixed soils, the measured-to-calculated ratios are generally concentrated within a relatively narrow range, whereas sandy and clayey soils exhibit larger deviations at certain pile ages. In particular, several clayey-soil cases show relatively high ratios at intermediate rest periods, while some sandy-soil cases exhibit increasing ratios at longer rest periods. Nevertheless, these observations do not establish systematic differences in shaft resistance growth rates among soil types, because pile age, soil properties, pile geometry, and site conditions are not independently controlled. Differences in soil permeability, excess pore-water pressure dissipation, stress redistribution, and pile–soil interface behavior may contribute to the time-dependent development of shaft resistance, as suggested by previous studies [43], but their individual effects cannot be verified using the present dataset. Furthermore, because the available data represent different pile tests rather than repeated measurements of the same piles, the observed trends cannot independently establish the rate or stages of shaft resistance growth. The third stage cannot be reliably identified from the present database because long-term observations are limited and unevenly distributed. Therefore, the present analysis should be regarded as a preliminary assessment of age-related variations in prediction discrepancies rather than a quantitative evaluation of pile aging mechanisms. Further expansion of the database, especially for long rest periods and repeated measurements under comparable conditions, is needed for a more comprehensive study of the time effect on LDSPP bearing capacity.
3.5.3. Load Direction
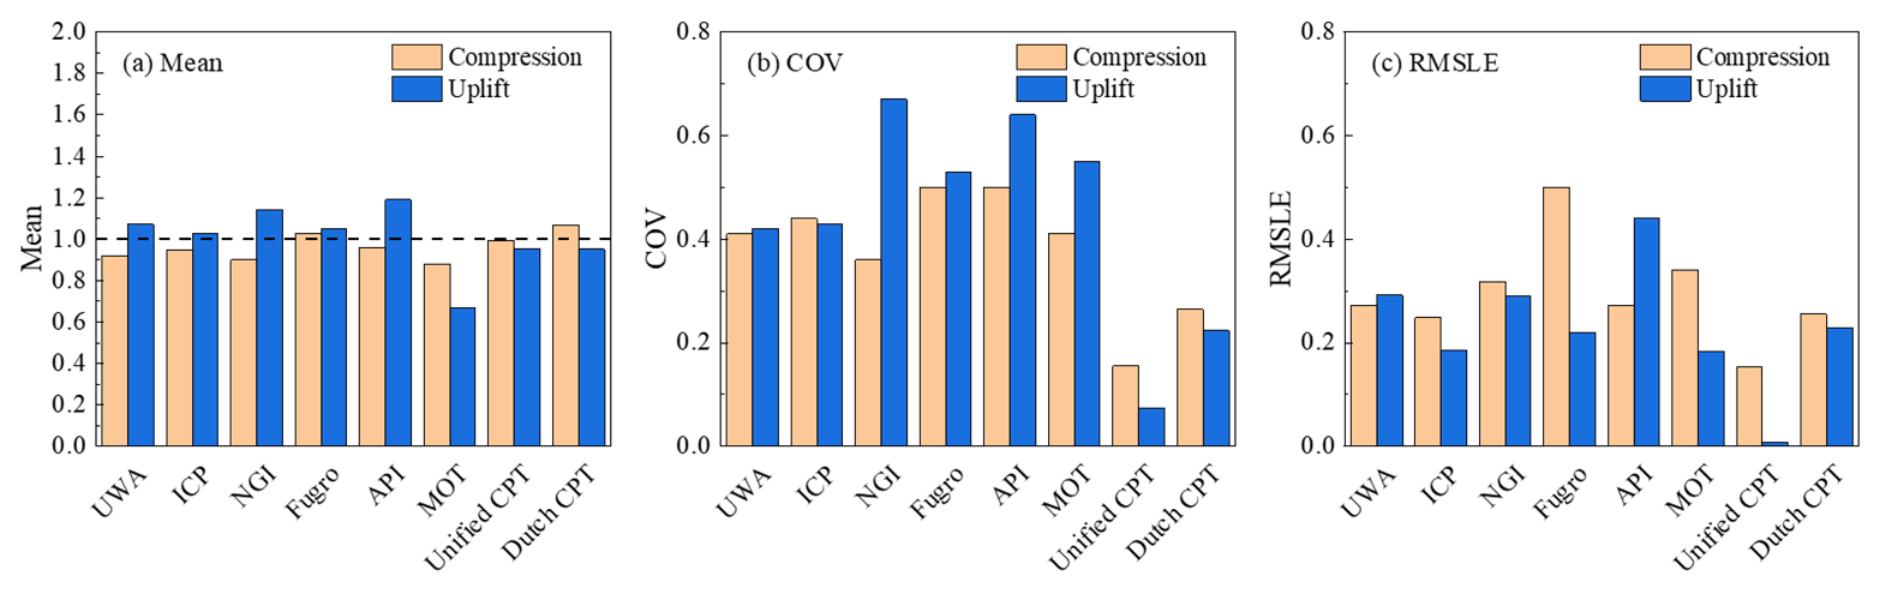
The mobilization of shaft resistance may differ between compression and uplift loading due to differences in stress paths and pile–soil interaction mechanisms. Accordingly, different design methods may adopt different reduction factors to account for the loading direction. Among the eight methods investigated, the API method does not explicitly distinguish between compression and uplift in the shaft resistance formulation adopted in this study, whereas several other methods incorporate loading-direction-dependent coefficients or reduction factors. In the present database, 19 compression tests and 10 uplift tests provide sufficient information for evaluating shaft resistance. Figure 14 compares the mean, COV, and RMSLE of the calculated-to-measured shaft resistance ratios for the two loading directions to examine the predictive performance of the eight methods and the applicability of the corresponding uplift reduction factors.
As shown in Figure 15, the UWA, ICP, NGI, Fugro, and API methods generally exhibit higher mean calculated-to-measured shaft resistance ratios for uplift piles than for compression piles, whereas the MOT, Unified CPT, and Dutch CPT methods show the opposite tendency. The MOT method produces mean ratios below unity for both loading directions, with a lower mean value for uplift piles, indicating a conservative tendency in the present database. This observation suggests that the uplift reduction factor adopted in the MOT method may warrant further evaluation. The Unified CPT method exhibits relatively small differences in mean ratios between compression and uplift loading, together with the lowest COV and RMSLE among the eight methods in the plotted results. The ICP method also shows relatively low prediction dispersion and logarithmic error, while the Dutch CPT method exhibits moderate variability under both loading conditions. In contrast, some of the established methods show more pronounced differences in COV and RMSLE between compression and uplift, indicating that their descriptive prediction performance may depend on loading direction.
Figure 15.
Comparison of (a) mean calculated-to-measured shaft resistance ratio, (b) coefficient of variation (COV), and (c) root mean squared logarithmic error (RMSLE) for eight design methods under compression and uplift loading.
The coefficients of variation for compression piles are generally comparable to or lower than those for uplift piles for several established methods, whereas the Unified CPT and Dutch CPT methods exhibit lower COV values for the uplift subset in the plotted results. Similarly, the RMSLE values show method-dependent differences between the two loading directions, indicating that changes in prediction bias and dispersion do not necessarily follow the same pattern. However, these differences should be interpreted with caution, as the compression and uplift tests were not conducted on identical piles or under matched soil conditions. Therefore, the observed differences in prediction accuracy may also be influenced by variations in soil properties, pile geometry, site characteristics, and method calibration. Given the limited number of uplift tests, the present results provide a preliminary assessment of the applicability of existing uplift reduction factors rather than definitive evidence of loading-direction effects on shaft resistance. Furthermore, bootstrap-based uncertainty assessment is necessary to establish whether the observed differences between methods and loading directions are statistically robust.
3.6. Statistical Uncertainty and Robustness of Method Rankings
To illustrate the statistical uncertainty associated with the comparative evaluation, a site-cluster bootstrap analysis was performed using the synthetic prediction dataset for the eight design methods. A total of 10,000 bootstrap replicates were generated by resampling site clusters with replacement. The mean calculated-to-reference capacity ratio, COV, and RMSLE were recalculated for each replicate, and their 95% confidence intervals (CIs) were obtained from the bootstrap distributions. The methods were ranked according to their RMSLE values, with lower values indicating smaller prediction errors.
The illustrative statistical results for total bearing capacity are summarized in Table 5. The Unified CPT method exhibits the lowest RMSLE of 0.140 (95% CI: 0.109–0.168), followed by ICP (0.235, 95% CI: 0.187–0.288) and Dutch CPT (0.249, 95% CI: 0.179–0.315). The Unified CPT method also shows a mean calculated-to-reference ratio of 0.985 and a COV of 0.141. Within the synthetic dataset, this method achieves the lowest RMSLE in 99.94% of the bootstrap replicates. The paired bootstrap difference in mean squared logarithmic error between ICP and Unified CPT is 0.0357 (95% CI: 0.0121–0.0650), indicating a difference in their illustrative error distributions.
Table 5.
Illustrative statistical performance, bootstrap confidence intervals, and ranking robustness of eight design methods for total bearing capacity.
Separate analyses were conducted for shaft resistance and base resistance using 29 and 18 synthetic cases, respectively. For shaft resistance, the Unified CPT method exhibits the lowest RMSLE of 0.131 (95% CI: 0.079–0.174), followed by ICP with an RMSLE of 0.211 (95% CI: 0.149–0.268). For base resistance, Unified CPT again exhibits the lowest RMSLE of 0.251 (95% CI: 0.172–0.313), followed by Dutch CPT with an RMSLE of 0.436 (95% CI: 0.344–0.535). The bootstrap first-rank frequencies of Unified CPT are 99.28% and 99.41% for shaft and base resistance, respectively.
The illustrative leave-one-site-out analysis indicates that Unified CPT retains the first position across all site-exclusion scenarios, whereas the rankings of several other methods vary. For total bearing capacity, the ICP ranking ranges from second to third, while Dutch CPT ranges from second to fourth. These results demonstrate how bootstrap resampling and site-exclusion analyses can be used to assess the robustness of comparative model rankings. However, because the present numerical demonstration is based on synthetic predictions, the observed ranking stability cannot be regarded as evidence of the actual superiority of any method. The corresponding conclusions for the field test database must be established using independently calculated pile capacities and measured test results.
4. Discussion
This study considers eight axial bearing capacity prediction methods (UWA, ICP, NGI, Fugro, API, MOT, Unified CPT, and Dutch CPT) based on a newly curated database of static load tests on LDSPPs. Compared with those used by Yang et al. [18], Lehane et al. [13], and Rizk et al. [19], the present database focuses on large-diameter piles with corresponding CPT/CPTU data. Differences in the performance of various design methods are anticipated due to the use of different databases. Moreover, empirical estimates of missing soil parameters may introduce additional uncertainty into the predicted capacities, which warrants further sensitivity analysis. To examine this issue, a parameter-perturbation framework was introduced to assess the influence of variations in pile–soil interface friction angle (δcv), cone factor (Nkt), OCR correlation coefficient (k), soil sensitivity (St), and cone penetration resistance (qc). The formulation-level sensitivity patterns indicate that the influence of these parameters depends on their roles in the corresponding resistance equations. However, such sensitivity estimates cannot independently establish the effects on total bearing capacity or the robustness of method rankings without case-specific recalculation.
The relatively large dispersion in base resistance predictions may be associated with the complex interaction between pile geometry, soil plugging, and the assumptions adopted in different design methods. For open-ended steel pipe piles, base resistance is influenced by annular toe resistance and the resistance mobilized through the soil plug. Because direct measurements of plugging and internal shaft resistance are unavailable for many tests, their contributions cannot be isolated. The relationships between prediction errors and pile diameter or diameter-to-thickness ratio may therefore reflect model assumptions and site-specific differences rather than a genuine physical size effect. This uncertainty is further compounded by the limited number of tests (n = 18) with separately identified base resistance. Consequently, apparent differences in base resistance prediction accuracy among methods should be interpreted cautiously, particularly when their statistical uncertainty has not been adequately resolved.
Several limitations of the present study should be acknowledged. The primary issue is that the database is rather limited both in quantity and distribution. In particular, the 41 tests originate from 21 sites, so observations from the same site may not be independent. To address this concern, a site-cluster bootstrap framework involving 10,000 resampling iterations was developed to estimate confidence intervals for the prediction statistics and assess the uncertainty in method rankings. Paired method comparisons and leave-one-site-out analyses were also incorporated into the statistical evaluation framework to examine whether apparent performance differences are robust to sampling variability and the influence of individual sites. The database is also imbalanced in terms of data features, including soil types, onshore/offshore conditions, pile geometry, ages, and loading directions (compression or tension). These factors, together with effective stress levels and installation characteristics, may covary, making it difficult to isolate their independent effects. The offshore/onshore comparison therefore provides only a descriptive assessment of predictive performance across different database subsets rather than evidence of direct environmental effects. Similarly, the limited number of uplift tests (n = 10) and the absence of paired tests under comparable conditions mean that the compression/uplift comparison can only provide a preliminary assessment of existing uplift reduction factors, rather than identify the physical origins of loading-direction effects. The statistical and sensitivity analyses provide a framework for distinguishing descriptive differences from robust method-performance conclusions; nevertheless, the limited database and uncertainties in reconstructed geotechnical parameters constrain the generalizability of the findings. Accordingly, the findings characterize prediction uncertainty within this database but do not demonstrate that existing CPT-based methods require modification for LDSPPs.
5. Conclusions
This paper considers eight design methods (UWA, ICP, NGI, Fugro, Unified CPT, Dutch CPT, API, and MOT) for the vertical bearing capacity of LDSPPs and systematically describes the establishment and data processing procedures of the LDSPP static load test database. Based on the database, the prediction performance of the investigated methods is examined for total bearing capacity, shaft resistance, and base resistance, and the influences of L/D, D, D/t, average vertical effective stress σ′v0, offshore environment, soil type, time effect, and load direction are analyzed. In addition, parameter sensitivity and statistical uncertainty assessment frameworks are introduced to examine the reliability of the comparative evaluation. The main conclusions are as follows:
- (1)
- A static load test database for LDSPPs was established, containing 41 test cases (31 compressive and 10 uplift). The database provides a solid basis for objective evaluation of the applicability of various LDSPP vertical bearing capacity calculation methods;
- (2)
- The field-based evaluation of the original six methods indicates that the UWA, NGI, Fugro, and API methods generally tend to overestimate total bearing capacity, whereas the ICP and MOT methods exhibit relatively conservative predictions. The ICP method shows comparatively favorable descriptive performance, but its superiority over competing methods cannot be established from mean ratios and COV values alone. The inclusion of Unified CPT and Dutch CPT broadens the comparison to more recent and conventional CPT-based formulations, respectively, although their relative predictive performance requires validation using actual field-based calculations. Base resistance calculations exhibit greater prediction bias and dispersion, with mean calculated-to-measured ratios of 0.58–3.82 and COV values of 0.52–1.27 for the original six methods, compared with 0.89–1.29 and 0.42–0.52 for total bearing capacity and 0.80–1.04 and 0.41–0.57 for shaft resistance, respectively. These differences highlight the uncertainty associated with soil plugging, internal shaft resistance, and the mobilization of pile toe resistance. Therefore, special caution should be exercised when applying the investigated methods to calculate the base resistance of LDSPPs;
- (3)
- The prediction errors exhibited variations with pile geometry and effective stress level, indicating that these factors may influence the applicability of existing bearing capacity calculation methods. No consistent deterioration in prediction accuracy with increasing pile diameter was identified within the investigated diameter range of 0.8–3.0 m, whereas variations associated with pile length, slenderness ratio, and effective stress were more apparent for certain methods. However, the observed relationships do not establish that introducing additional normalized parameters would necessarily reduce prediction dispersion. Moreover, the effects of pile geometry, soil conditions, installation characteristics, and plugging behavior cannot be independently distinguished using the present database. Further investigation using a larger and more comprehensive database is required to quantify these effects;
- (4)
- The formulation-level sensitivity assessment indicates that the influence of uncertain geotechnical parameters depends on the input variables and resistance mechanisms adopted in each design method. Variations in pile–soil interface friction angle (δcv), cone factor (Nkt), OCR correlation coefficient (k), soil sensitivity (St), and cone penetration resistance (qc) may affect the calculated resistance components to different extents. However, their effects on total bearing capacity and method rankings require case-specific verification. Furthermore, the proposed site-cluster bootstrap, paired comparison, and leave-one-site-out procedures provide a framework for quantifying confidence intervals and examining ranking robustness. Given the limited number of independent test sites and the relatively small shaft and base resistance subsets, differences in the descriptive performance indicators should not be interpreted as statistically established superiority without supporting uncertainty analyses.
Author Contributions
Conceptualization, X.L. and Z.C.; methodology, X.L. and F.C.; software, X.L. and F.C.; validation, X.L., F.C. and G.C.; formal analysis, X.L. and F.C.; investigation, X.L. and G.C.; resources, Z.C. and G.C.; data curation, X.L. and F.C.; writing—original draft preparation, X.L.; writing—review and editing, X.L., F.C., Z.C. and G.C.; visualization, X.L. and F.C.; supervision, Z.C.; project administration, Z.C.; funding acquisition, X.L. All authors have read and agreed to the published version of the manuscript.
Funding
The research reported in this paper was supported by Xiamen City University (Grant No. HXPT202404).
Data Availability Statement
Data will be made available from the corresponding author upon reasonable request.
Conflicts of Interest
The authors declare no conflicts of interest.
References
- American Petroleum Institute. Geotechnical and Foundation Design Considerations (API Recommended Practice 2GEO); American Petroleum Institute: Washington, DC, USA, 2011. [Google Scholar]
- JTS 167-2018; Design Code of Harbor Structures. Ministry of Transport of the People’s Republic of China: Beijing, China, 2018. (In Chinese)
- Lehane, B.M.; Schneider, J.; Xu, X. A Review of Design Methods for Offshore Driven Piles in Siliceous Sand; University of Western Australia: Crawley, Australia, 2005. [Google Scholar]
- Lehane, B.M.; Li, Y.N.; Williams, R. Shaft capacity of displacement piles in clay using the cone penetration test. J. Geotech. Geoenvironmental Eng. 2013, 139, 253–266. [Google Scholar] [CrossRef] [Scilit]
- Jardine, R.; Chow, F.; Overy, R.; Standing, J. ICP Design Methods for Driven Piles in Sands and Clays; Thomas Telford Publishing: London, UK, 2005. [Google Scholar]
- Clausen, C.J.F.; Aas, P.M.; Karlsrud, K. Bearing capacity of driven piles in sand: The NGI approach. In Proceedings of the International Symposium on Frontiers in Offshore Geotechnics; Balkema: Perth, Australia, 2005; pp. 574–580. [Google Scholar]
- Karlsrud, K.; Clausen, C.; Aas, P. Bearing capacity of driven piles in clay: The NGI approach. In Proceedings of the 1st International Symposium on Frontiers in Offshore Geotechnics; CRC Press: Boca Raton, FL, USA, 2005; pp. 677–681. [Google Scholar]
- Kolk, H.; van der Velde, E. A reliable method to determine friction capacity of piles driven into clays. In Proceedings of the Offshore Technology Conference, Houston, TX, USA, 6–9 May 1996; pp. 337–346. [Google Scholar]
- de Kuiter, J.; Beringen, F.L. Pile foundations for large North Sea structures. Mar. Geotechnol. 1979, 3, 267–314. [Google Scholar] [CrossRef] [Scilit]
- Lehane, B.M.; Liu, Z.; Bittar, E.; Nadim, F.; Lacasse, S.; Jardine, R.; Carotenuto, P.; Rattley, M.; Gavin, K. A new “unified” CPT-based axial pile capacity design method for driven piles in sand. In Proceedings of the 4th International Symposium on Frontiers in Offshore Geotechnics, Austin, TX, USA, 28–31 August 2022; pp. 462–477. [Google Scholar]
- Lehane, B.M.; Liu, Z.Q.; Bittar, E.; Nadim, F.; Lacasse, S.; Bozorgzadeh, N.; Jardine, R.; Ballard, J.-C.; Carotenuto, P.; Gavin, K.; et al. CPT-based axial capacity design method for driven piles in clay. J. Geotech. Geoenvironmental Eng. 2022, 148, 04022077. [Google Scholar] [CrossRef] [Scilit]
- Jardine, R.J.; Standing, J.R.; Chow, F.C. Some observations of the effects of time on the capacity of piles driven in sand. Géotechnique 2006, 56, 227–244. [Google Scholar] [CrossRef] [Scilit]
- Lehane, B.M.; Lim, J.K.; Carotenuto, P.; Nadim, F.; Lacasse, S.; Jardine, R.J.; van Dijk, B.F.J. Characteristics of unified databases for driven piles. In Proceedings of the 8th International Conference on Offshore Site Investigation and Geotechnics: Smart Solutions for Future Offshore Developments, London, UK, 12–14 September 2017; pp. 162–191. [Google Scholar]
- Tang, C.; Phoon, K.K. Statistics of model factors in reliability-based design of axially loaded driven piles in sand. Can. Geotech. J. 2018, 55, 1592–1610. [Google Scholar] [CrossRef] [Scilit]
- Tang, C.; Phoon, K.K. Characterization of model uncertainty in predicting axial resistance of piles driven into clay. Can. Geotech. J. 2019, 56, 1098–1118. [Google Scholar] [CrossRef] [Scilit]
- Yang, Z.X.; Guo, W.B.; Jardine, R.J.; Chow, F. Design method reliability assessment from an extended database of axial load tests on piles driven in sand. Can. Geotech. J. 2017, 54, 59–74. [Google Scholar] [CrossRef] [Scilit]
- Xu, D.S.; Liu, Z.W.; Chen, B.; Xu, X.-Y. Bearing capacity analysis of offshore pipe piles with CPTs by considering uncertainty. Comput. Geotech. 2020, 126, 103731. [Google Scholar] [CrossRef] [Scilit]
- Yang, Z.; Jardine, R.; Guo, W.; Chow, F. A Comprehensive Database of Tests on Axially Loaded Piles Driven in Sand; Zhejiang University Press: Zhejiang, China, 2015. [Google Scholar]
- Rizk, A.; Kodsy, A.; Iskander, M.; Machairas, N. Efficacy of design methods for predicting the capacity of large-diameter open-ended piles. J. Geotech. Geoenvironmental Eng. 2022, 148, 04022078. [Google Scholar] [CrossRef] [Scilit]
- Kodsy, A.; Iskander, M. Insights into plugging of pipe piles based on pile dimensions. Appl. Sci. 2022, 12, 2711. [Google Scholar] [CrossRef] [Scilit]
- Duffy, K.; Gavin, K.; Korff, M.; de Lange, D.; Roubos, A. Influence of installation method on the axial capacity of piles in very dense sand. J. Geotech. Geoenvironmental Eng. 2024, 150, 04024043. [Google Scholar] [CrossRef] [Scilit]
- de Lange, D.A.; Lengkeek, H.J.; Gavin, K.G. A General Load-Transfer Formulation for the Base Resistance of Large-Diameter Open-ended Pipe Piles Driven in Sand. In Proceedings of the ISFOG 2025; International Society for Soil Mechanics and Geotechnical Engineering: Nantes, France, 2025. [Google Scholar]
- De Lange, D.A.; Gavin, K.G.; Lengkeek, H.J.; Roubos, A.A. Compression load tests on large open-ended pipe piles in dense North Sea sand. Géotechnique 2026, 76, 425–436. [Google Scholar] [CrossRef] [Scilit]
- Chen, Z.; Chen, F.; Cao, G.; Lai, H.; Ding, X. Evaluation and correction of the axial bearing capacity design methods for large-diameter steel pipe piles. Acta Geotech. 2026. [Google Scholar] [CrossRef] [Scilit]
- Shioi, Y. Estimation of bearing capacity of steel pipe piles by static loading test and stress wave theory: Trans-Tokyo Bay Highway. In Proceedings of the International Conference on the Application of Stress-Wave Theory to Piles, The Hague, The Netherlands, 21–24 September 1992; pp. 325–330. [Google Scholar]
- Tveldt, G.; Fredriksen, F. N18 ny motorvegbru i Drammen: Prøvebelasting av peler. In Proceedings of the Rock and Blasting Geotechnics, Oslo, Norway, 20–21 November 2003. [Google Scholar]
- Pump, W.; Scott, J. Analysis of load capacity of deep test piles in Shanghai alluvium. In Proceedings of the 8th Australia–New Zealand Conference on Geomechanics: Consolidating Knowledge, Hobart, Australia, 15–17 February 1999; pp. 429–436. [Google Scholar]
- Federal Highway Administration. Deep Foundation Load Test Database (DFLTD) (Version 2.0); Federal Highway Administration: McLean, VA, USA, 2014.
- Shamshirgaran, A.; Ebrahimian, B. Evaluating in-situ and analytical pile bearing capacity estimation methods using well-documented piling records. In Proceedings of the 8th International Conference on Offshore Industries; Sharif University of Technology: Tehran, Iran, 2019. [Google Scholar]
- Hou, X.-Y.; Dai, G.-L.; Zhu, W.-B.; Gong, W.M.; Hu, T. CPT/CPTU-based calculation methods for the vertical bearing capacity of large-diameter open-ended steel pipe piles for offshore wind turbines. J. Southeast Univ. 2022, 52, 83–89. [Google Scholar]
- Zhu, B.; Qian, H.; Kong, D.; Li, W.; Xu, Y.; Xiong, G. Field trials on monotonic behaviour of a driven pile at an offshore wind farm in China. Mar. Georesources Geotechnol. 2019, 39, 322–332. [Google Scholar] [CrossRef] [Scilit]
- Matsumoto, T.; Michi, Y.; Hirano, T. Performance of axially loaded steel pipe piles driven in soft rock. J. Geotech. Eng. 1995, 121, 305–315. [Google Scholar] [CrossRef] [Scilit]
- Yan, Z.; Deng, L.F.; Zhang, H.Q. Vertical field behavior of a deep large-diameter driven pipe pile in multilayered soils. Ocean Eng. 2022, 247, 110782. [Google Scholar] [CrossRef] [Scilit]
- Buckley, R.M.; Jardine, R.J.; Kontoe, S.; Barbosa, P.; Schroeder, F.C. Full-scale observations of dynamic and static axial responses of offshore piles driven in chalk and tills. Géotechnique 2020, 70, 657–681. [Google Scholar] [CrossRef] [Scilit]
- Wu, R.-H.; Ye, J.-F.; Luo, G.-J.; Shen, X.L.; Zhang, Q. Experimental study on the bearing characteristics of steel pipe piles in the radial sandbars of Jiangsu Province. Ocean Eng. 2021, 39, 121–132. [Google Scholar]
- Robertson, P.K. Interpretation of Cone Penetration Tests—A unified approach. Can. Geotech. J. 2009, 46, 1337–1355. [Google Scholar] [CrossRef] [Scilit]
- Lunne, T.; Robertson, P.; Powell, J. Cone Penetration Testing; Blackie Academic and Professiona: London, UK, 1997. [Google Scholar]
- Chow, F.C.; Jardine, R.J.; Brucy, F.; Nauroy, J.F. Effects of time on the capacity of pipe piles in dense marine sand. J. Geotech. Geoenvironmental Eng. 1998, 124, 254–264. [Google Scholar] [CrossRef] [Scilit]
- Yang, S.; Liu, J.; Garg, A.; Zhang, M. Analytical solution for estimating bearing capacity of a closed soil plug: Verification using an On-Site static pile test. J. Mar. Sci. Eng. 2020, 8, 490. [Google Scholar] [CrossRef] [Scilit]
- Haque, M.N.; Abu-Farsakh, M.Y.; Zhang, Z.J. Evaluation of pile capacity from CPT and pile setup phenomenon. Int. J. Geotech. Eng. 2020, 14, 196–205. [Google Scholar] [CrossRef] [Scilit]
- Carroll, R.; Carotenuto, P.; Dano, C.; Salama, I.; Silva, M.; Rimoy, S.; Gavin, K.; Jardine, R. Field experiments at three sites to investigate the effects of age on steel piles driven in sand. Géotechnique 2020, 70, 469–489. [Google Scholar] [CrossRef] [Scilit]
- Buckley, R.M.; Jardine, R.J.; Kontoe, S.; Lehane, B. Effective stress regime around a jacked steel pile during installation, ageing, and load testing in chalk. Can. Geotech. J. 2018, 55, 1577–1591. [Google Scholar] [CrossRef] [Scilit]
- Haque, M.N.; Abu-Farsakh, M.Y.; Zhang, Z.; Okeil, A. Developing a model to estimate pile setup for individual soil layers on the basis of piezocone penetration test data. Transp. Res. Rec. 2016, 2579, 17–31. [Google Scholar] [CrossRef] [Scilit]

Disclaimer/Publisher’s Note: The statements, opinions and data contained in all publications are solely those of the individual author(s) and contributor(s) and not of MDPI and/or the editor(s). MDPI and/or the editor(s) disclaim responsibility for any injury to people or property resulting from any ideas, methods, instructions or products referred to in the content. |
© 2026 by the authors. Licensee MDPI, Basel, Switzerland. This article is an open access article distributed under the terms and conditions of the Creative Commons Attribution (CC BY) license.