


Abstract
Shale formations commonly develop bedding structures and micro-fractures and exhibit strong elastic anisotropy; however, existing wellbore breakdown pressure models are mostly based on isotropic assumptions. We hypothesize that the elastic modulus anisotropy ratio vE = Eh/Ev dominates wellbore breakdown pressure, while the Poisson’s ratio anisotropy ratio vν = νh/νv plays a secondary but non-negligible role through lateral-deformation coupling. To test this hypothesis, a three-dimensional wellbore stress model for transversely isotropic (VTI) shale is developed using VTI constitutive equations and the Lekhnitskii complex-variable framework. The model is combined with Biot poroelastic theory and the minimum principal stress tensile-failure criterion, and the breakdown pressure is solved by a numerical iterative method. The effects of vE and vν are then systematically analyzed. The results show that vE is the controlling factor: as vE increases from 0.1 to 3, the breakdown pressure evolves non-monotonically, first increasing and then decreasing, with a peak at vE = Eh/Ev = 0.3. Changing vE to 0.5 or 2 significantly shifts the magnitude and extreme-value region of the breakdown pressure. In contrast, under vE = 1, varying vν from 0.1 to 3 produces a slightly nonlinear monotonic decrease in breakdown pressure, with an absolute reduction of less than 10%, indicating that vν mainly redistributes tangential and axial stresses by modifying lateral deformation compatibility. Coupled vE–vν effects are synergistic or antagonistic: they increase the local gradient and asymmetry of the breakdown-pressure response surface and can cause nonlinear responses or trend reversals under extreme anisotropy. Elastic anisotropy also distorts the breakdown pressure versus deviation angle, creating local minima or abrupt changes and narrowing the safe drilling fluid density window. The research findings provide a theoretical basis for wellbore fracture pressure prediction, which can assist in determining the upper limit of the safe drilling fluid density window and provide some reference for wellbore trajectory optimization in shale formations.
1. Introduction
As global oil and gas exploration and development advances into deep, ultra-deep, and unconventional reservoirs, shale gas and other unconventional resources have emerged as crucial successors in the energy sector [1]. In the development of shale reservoirs, drilling long-horizontal-section horizontal wells and performing large-scale hydraulic fracturing are the core technologies for achieving commercial production capacity [1]. However, shale formations commonly develop pronounced bedding structures and micro-fractures, exhibiting strong anisotropic characteristics. During drilling and fracturing operations, the wellbore breakdown pressure serves as a key indicator for determining the upper limit of the safe drilling fluid density window and optimizing fracturing treatment parameters [2,3]. Traditional wellbore stability analyses generally assume the rock to be a homogeneous, isotropic, linear elastic material, and calculations are performed using the Kirsch equations or the Mohr–Coulomb criterion [4,5]. Nevertheless, extensive field practices and laboratory experiments have demonstrated that neglecting shale anisotropy leads to significant deviations in stress calculations around the wellbore, which in turn cause engineering problems such as lost circulation, stuck pipe, or difficulty in hydraulic fracture initiation [6,7]. Therefore, establishing a wellbore breakdown pressure prediction model that accounts for rock anisotropy holds considerable theoretical significance and engineering value for safeguarding drilling safety and enhancing stimulation effectiveness.
In recent years, scholars worldwide have conducted extensive research on the influence of shale anisotropy on wellbore stability, concentrating primarily on three aspects: strength anisotropy, multi-physics coupling, and parameter uncertainty analysis. In the domain of strength anisotropy, researchers have widely introduced the single plane of weakness (SPW) criterion, the patchy weak plane (PPW) model, and the transversely isotropic (VTI) constitutive model to analyze the effects of bedding plane inclination, weak-plane cohesion, and internal friction angle on wellbore collapse and fracture modes [8,9]. Regarding multi-physics coupling, researchers have successively developed thermal-hydraulic-mechanical-chemical (THMC) coupled models, revealing the dynamic evolution of pore pressure and effective stress fields around the wellbore under the influences of drilling fluid seepage, temperature gradients, and chemical osmosis [10,11,12]. Furthermore, in response to the uncertainty of deep formation parameters, some scholars have introduced Monte Carlo simulation and reliability theory to establish quantitative risk assessment and probabilistic prediction models for wellbore instability, effectively reducing engineering failure rates caused by parameter errors [13,14,15].
Although existing studies have yielded fruitful results in strength anisotropy and multi-physics coupling, systematic research on the influence mechanisms of elastic anisotropy—especially the directional differences in elastic modulus and Poisson’s ratio—on wellbore breakdown pressure remains insufficient. Elastic anisotropy in shale not only alters the degree of stress concentration in the near-wellbore region but also causes a redistribution of pore pressure through the anisotropic Skempton coefficients [16]. Studies have shown that elastic modulus anisotropy plays a more critical role than Poisson’s ratio anisotropy in determining stress distributions, directly affecting wellbore stability and drilling fluid optimization [17]; meanwhile, elastic anisotropy can lead to a significant increase in hoop stress, intensifying stress concentration on the wellbore wall [18]. Moreover, a circular wellbore in anisotropic formations deforms into an elliptical shape under in situ stresses, and this deformation further changes the magnitude of the fracture initiation pressure [19]. However, existing models mostly focus on qualitative analysis or single-parameter sensitivity evaluation, lacking an in-depth discussion on the evolution of breakdown pressure under the coupling effect of elastic modulus and Poisson’s ratio anisotropy. Additionally, the synergistic influence mechanism between the degree of elastic parameter anisotropy and the in situ stress difference coefficient under complex stress states remains unclear [20,21,22,23,24]. Considering these gaps, the present study focuses on the elastic anisotropy characteristics of shale and aims to systematically investigate the influence of elastic modulus and Poisson’s ratio on the magnitude of wellbore breakdown pressure. Based on the transversely isotropic (VTI) elastic constitutive equations, a three-dimensional stress distribution model around the wellbore that accounts for the anisotropy of elastic parameters is constructed. Combined with an appropriate rock fracture criterion, the sensitivity of the breakdown pressure to the degree of elastic modulus anisotropy, the degree of Poisson’s ratio anisotropy, and the bedding plane occurrence is quantitatively analyzed. Furthermore, the propagation mechanism of parameter uncertainties in breakdown pressure prediction is explored. The novelty of this work lies in three aspects. First, unlike previous studies that mainly address strength anisotropy, THMC coupling, or single-parameter sensitivity [25,26,27,28,29,30], a three-dimensional VTI borehole stress model is established that simultaneously incorporates the dual elastic anisotropy of modulus and Poisson’s ratio. Second, two dimensionless parameters, vE = Eh/Ev and vν = νh/νv, are introduced to decouple and quantify their independent and coupled effects on breakdown pressure. Third, the results quantitatively demonstrate that vE is the dominant factor, with breakdown pressure varying non-monotonically from vE = 0.1 to 3 and peaking at vE = 0.3, whereas vν changes breakdown pressure by less than 10% but significantly regulates stress coupling and the extreme-value location; synergistic and antagonistic vE–vν effects are also identified. This study aims to remedy the theoretical deficiencies of existing isotropic models and to provide a more accurate and reliable theoretical basis for the fine design of safe drilling fluid density windows, wellbore trajectory optimization, and hydraulic fracture initiation control in shale formations.
2. Theoretical Basis
2.1. Borehole Stress Model
Sedimentary rock formations such as shale, due to their well-developed bedding structures, exhibit significant anisotropy in mechanical properties. In rock mechanics and drilling engineering, they are typically simplified as transversely isotropic (TI) media. Such a medium possesses a plane of isotropy (usually the bedding plane), within which the elastic properties are identical in all directions, whereas the properties perpendicular to this plane differ. In the local coordinate system of the bedding plane [26], the elastic behavior of a TI medium is completely determined by five independent elastic constants: the Young’s modulus within the bedding plane Eh, the Young’s modulus perpendicular to the bedding plane Ev, the Poisson’s ratio within the bedding plane νh, the Poisson’s ratio perpendicular to the bedding plane νv, and the shear modulus perpendicular to the bedding plane Gv. According to the generalized Hooke’s law, the relationship between the strain vector and the stress vector in the material principal coordinate system can be expressed as shown in Equation (1):
where S′ is the compliance matrix in the material principal coordinate system, the expanded form of which is shown in Equation (2):
ε′ = S′σ′
To solve for the stress distribution around the wellbore, it is necessary to establish and transform between three coordinate systems: the in situ stress coordinate system (defined by the vertical principal stress σv, the maximum horizontal principal stress σH, the minimum horizontal principal stress σh, the borehole coordinate system (with the borehole axis as the z-axis, defined by the deviation angle and azimuth angle), and the bedding plane coordinate system (defined by the dip angle and dip direction of the bedding plane). The far-field in situ stress is transformed from the formation coordinate system to the borehole coordinate system via a coordinate rotation matrix [27],
where σ(ω) is the far-field stress tensor in the borehole coordinate system, Rω is the rotation matrix constructed from the deviation angle and azimuth angle, and σ(g) is the far-field stress tensor in the in situ stress coordinate system. Similarly, the compliance matrix of the TI medium also needs to be transformed from the bedding plane coordinate system to the borehole coordinate system. According to the tensor transformation rule, the compliance matrix in the borehole coordinate system is given by Equation (4):
where Tσ and Tε are the strain and stress transformation matrices determined by the spatial orientation of the bedding plane, respectively. After coordinate transformation, the compliance matrix S in the borehole coordinate system is generally a full matrix containing 36 non-zero elements, reflecting the mechanical coupling effect when the principal axes of material anisotropy do not coincide with the borehole axis.
For the borehole stress concentration problem in TI media, the classical isotropic Kirsch solution is no longer applicable. This study employs the analytical framework for anisotropic elasticity established by Lekhnitskii and Amadei to solve for the borehole stresses.
In the borehole coordinate system, a cylindrical coordinate system (r, θ, z) is introduced, where θ is the circumferential angle measured from the x-axis. According to the theory of anisotropic elasticity, the stress components at the borehole wall (r = R, where R is the borehole radius) can be expressed as a linear superposition of the far-field stresses and the wellbore fluid pressure pw [28]. The specific expression is given by Equation (5):
where are the far-field stress components in the borehole coordinate system, in MPa; is the additional stress correction term arising from TI elastic anisotropy. These correction terms are determined by the characteristic roots μk and their corresponding complex potential functions in the Lekhnitskii complex variable method. The characteristic roots μk are obtained from the characteristic equation formed by the elements of the compliance matrix. This equation has six roots, and the three roots with positive imaginary parts are selected for the subsequent stress calculations.
2.2. Solution of Wellbore Breakdown Pressure
According to Biot’s poroelastic theory, the deformation and failure of the wellbore rock are governed by the effective stress. Considering the influence of the formation pore pressure pp, the effective stress tensor at the wellbore wall is defined as shown in Equation (6):
where is the effective stress, in MPa; σij is the Biot effective stress coefficient; and δij is the Kronecker delta. At the wellbore wall (r = R), the radial effective stress is given by Equation (7):
Therefore, the stress state at the wellbore wall is determined by σr, σθ, σz and τθz. The three effective principal stresses on the wellbore wall can be obtained by solving for the eigenvalues of the stress tensor, as shown in Equation (8):
where are the effective normal stresses in the tangential and axial directions, respectively, in MPa; is the effective shear stress, in MPa. It is stipulated that tensile stress is negative and compressive stress is negative.
Wellbore breakdown belongs to the tensile failure mode. In this paper, the minimum principal stress criterion is adopted as the rock failure criterion, and the tensile strength of the rock is assumed to be an isotropic constant; when the maximum effective tensile stress on the wellbore wall reaches or exceeds the tensile strength T0 of the rock, wellbore breakdown occurs. Its mathematical expression is shown in Equation (9):
where is the minimum effective principal stress at the wellbore wall, in MPa; T0 is the macroscopic isotropic tensile strength of the rock, which can be determined through laboratory Brazilian splitting tests or point load tests.
By integrating the above transversely isotropic borehole stress model with the isotropic tensile strength criterion, the solution of the wellbore breakdown pressure pb reduces to finding the minimum wellbore fluid pressure that satisfies the following critical equation, as shown in Equation (10):
Because the expressions for the borehole stresses in TI media are relatively complex and the fracture initiation location θ is unknown, the equations cannot be solved directly to obtain an explicit analytical solution; a numerical iterative method must be employed. The specific solution steps are as follows,
Step 1: Input the formation parameters (in situ stresses, pore pressure, TI elastic parameters, tensile strength T0) and the wellbore trajectory parameters, and set an initial wellbore fluid pressure pw.
Step 2: Discretize the circumferential angle θ around the wellbore over the interval [0,2π) (e.g., with a step size of 1°).
Step 3: For each θ, calculate the stress components on the wellbore wall—σθ, σz, τθz—based on the TI borehole stress model.
Step 4: In conjunction with Biot’s effective stress principle, calculate the three effective principal stresses at each θ, and extract the minimum effective principal stress (θ).
Step 5: Traverse all θ to find the circumferential angle that minimizes (θ), and record the global minimum effective tensile stress = (θ).
Step 6: Calculate the discriminant function F(pw) = − T0. If ∣F(pw)∣ < ε (where ε is a prescribed convergence tolerance), then the current pw is the sought wellbore breakdown pressure pb.
Step 7: If convergence is not achieved, update pw using the bisection method or the Newton–Raphson method based on the sign of F(pw) and return to Step 3 to continue iteration until the convergence condition is satisfied.
Through the above model and algorithm, not only can the wellbore breakdown pressure pb in transversely isotropic formations be accurately predicted, but the fracture initiation position θcr of the hydraulic fracture on the wellbore wall can also be simultaneously determined.
The method presented in this paper is based on the following assumptions and conditions: the formation is simplified as a transversely isotropic (VTI), continuous, homogeneous, small-strain, linearly elastic medium; the bedding plane is the isotropic plane; and the medium is described by five independent elastic constants, Eh, Ev, νh, νv, and Gv, which are treated as constants independent of temperature, pressure, and salinity within the analysis range. The borehole is regularly circular and the borehole wall is intact; the explicit effects of natural fractures, weak planes, plasticity, and damage are ignored. The far-field in situ stresses are uniform and known. The stresses around the borehole are obtained by linear superposition of the far-field stresses and the wellbore fluid column pressure, and the well inclination, azimuth, and bedding orientation are accounted for through coordinate transformation. For the porous medium, Biot’s effective stress principle is adopted; the pore pressure acts on the borehole wall at a given value. For the time being, the effects of temperature gradient, thermal expansion, thermal stress, chemical osmosis, and salinity on the pore fluid and rock mechanical properties are not explicitly considered. Therefore, high-pressure conditions are represented by the far-field stresses and pore pressure, while harsh environments such as high temperature and high salinity are not included in the model. The failure criterion adopts the minimum effective principal stress criterion. The macroscopic tensile strength of the rock is taken as an isotropic constant T0, and tensile initiation occurs when the maximum effective tensile stress at the borehole wall reaches T0. The governing equations are the VTI generalized Hooke’s law, the compliance matrix after coordinate transformation, Lekhnitskii’s complex-variable stress solution, Biot’s effective stress equation, and the minimum principal stress failure criterion. The boundary conditions are the far-field stresses and the wellbore fluid column pressure. The problem is solved numerically by circumferential discretization and bisection/Newton iteration. Therefore, the present model is applicable to predicting the borehole wall fracture initiation pressure in VTI shale under isothermal, chemically stable conditions dominated by elastic anisotropy. To extend it to harsh subsurface environments such as high temperature, high pressure, and high salinity, it is necessary to further couple thermo-chemo-hydro-mechanical parameters and their effects on the elastic constants and strength.
3. Results and Discussions
3.1. Influence of Anisotropy on the Wellbore Breakdown Pressure Contour Map
To systematically elucidate the influence mechanisms of elastic parameter anisotropy in transversely isotropic (VTI) shale on the wellbore breakdown pressure contour map, this section, based on the borehole stress model and breakdown pressure solution algorithm, introduces two dimensionless parameters—the elastic modulus anisotropy ratio (vE = Eh/Ev) and the Poisson’s ratio anisotropy ratio (vν = νh/νv). By varying the combination of these values, the wellbore breakdown pressure distributions under different degrees of anisotropy are calculated, and the variation trend of breakdown pressure with deviation angle is further analyzed.
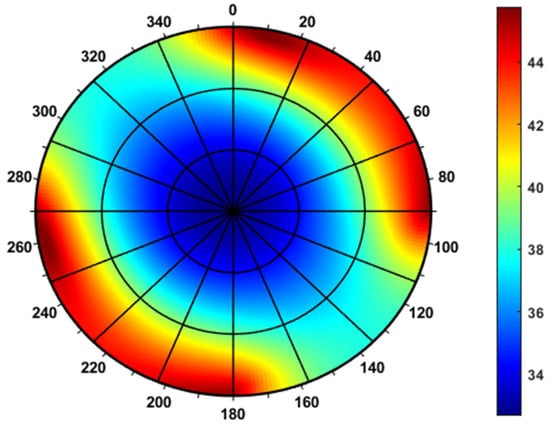
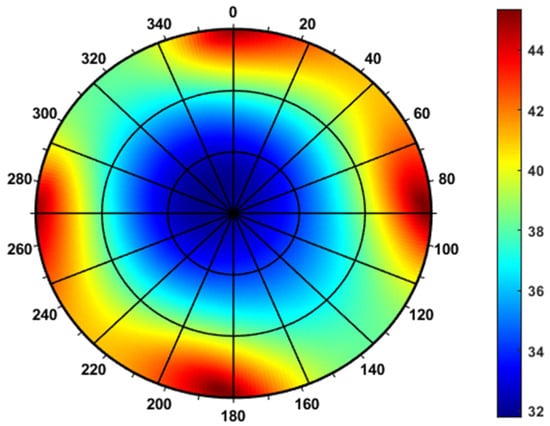
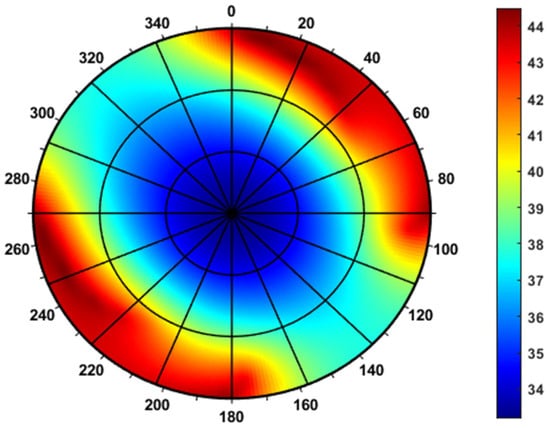
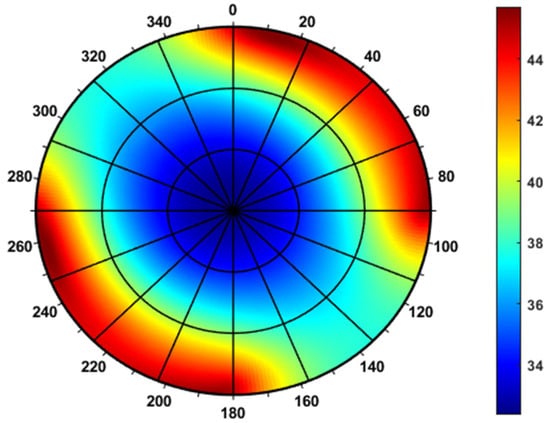
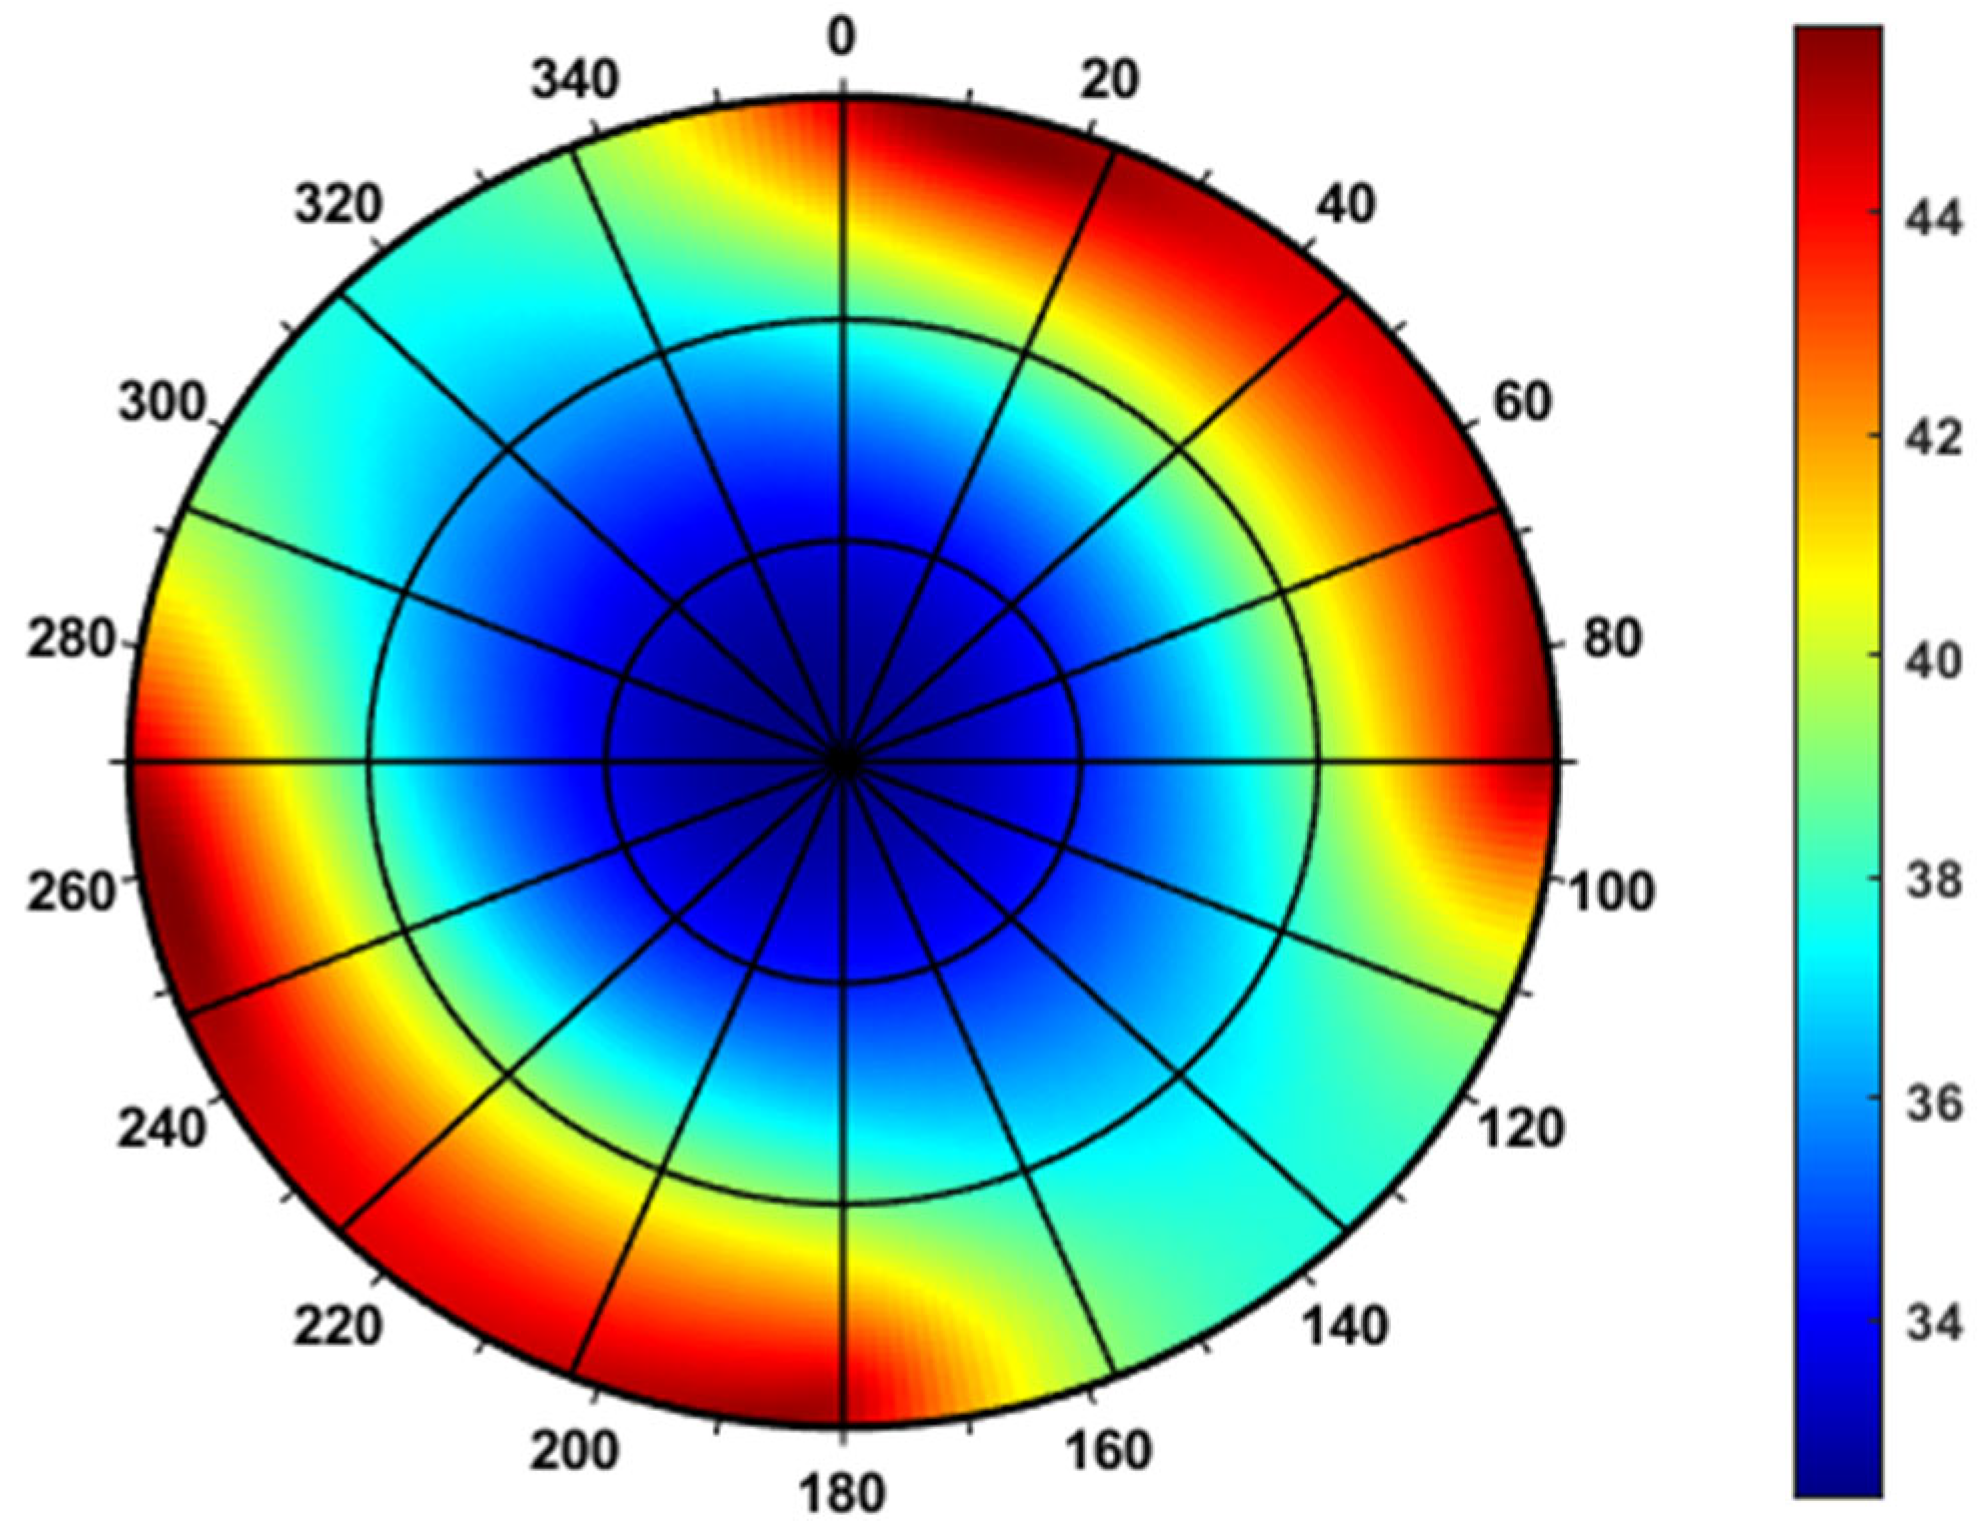
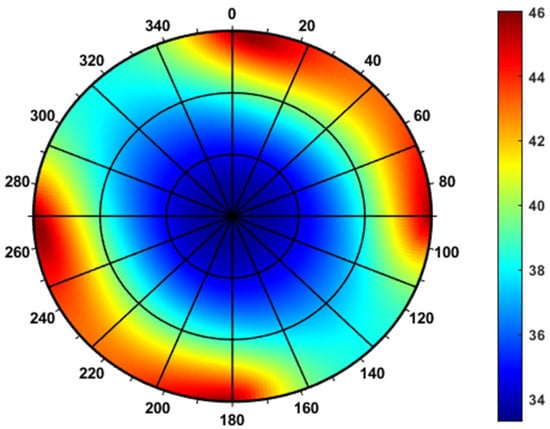
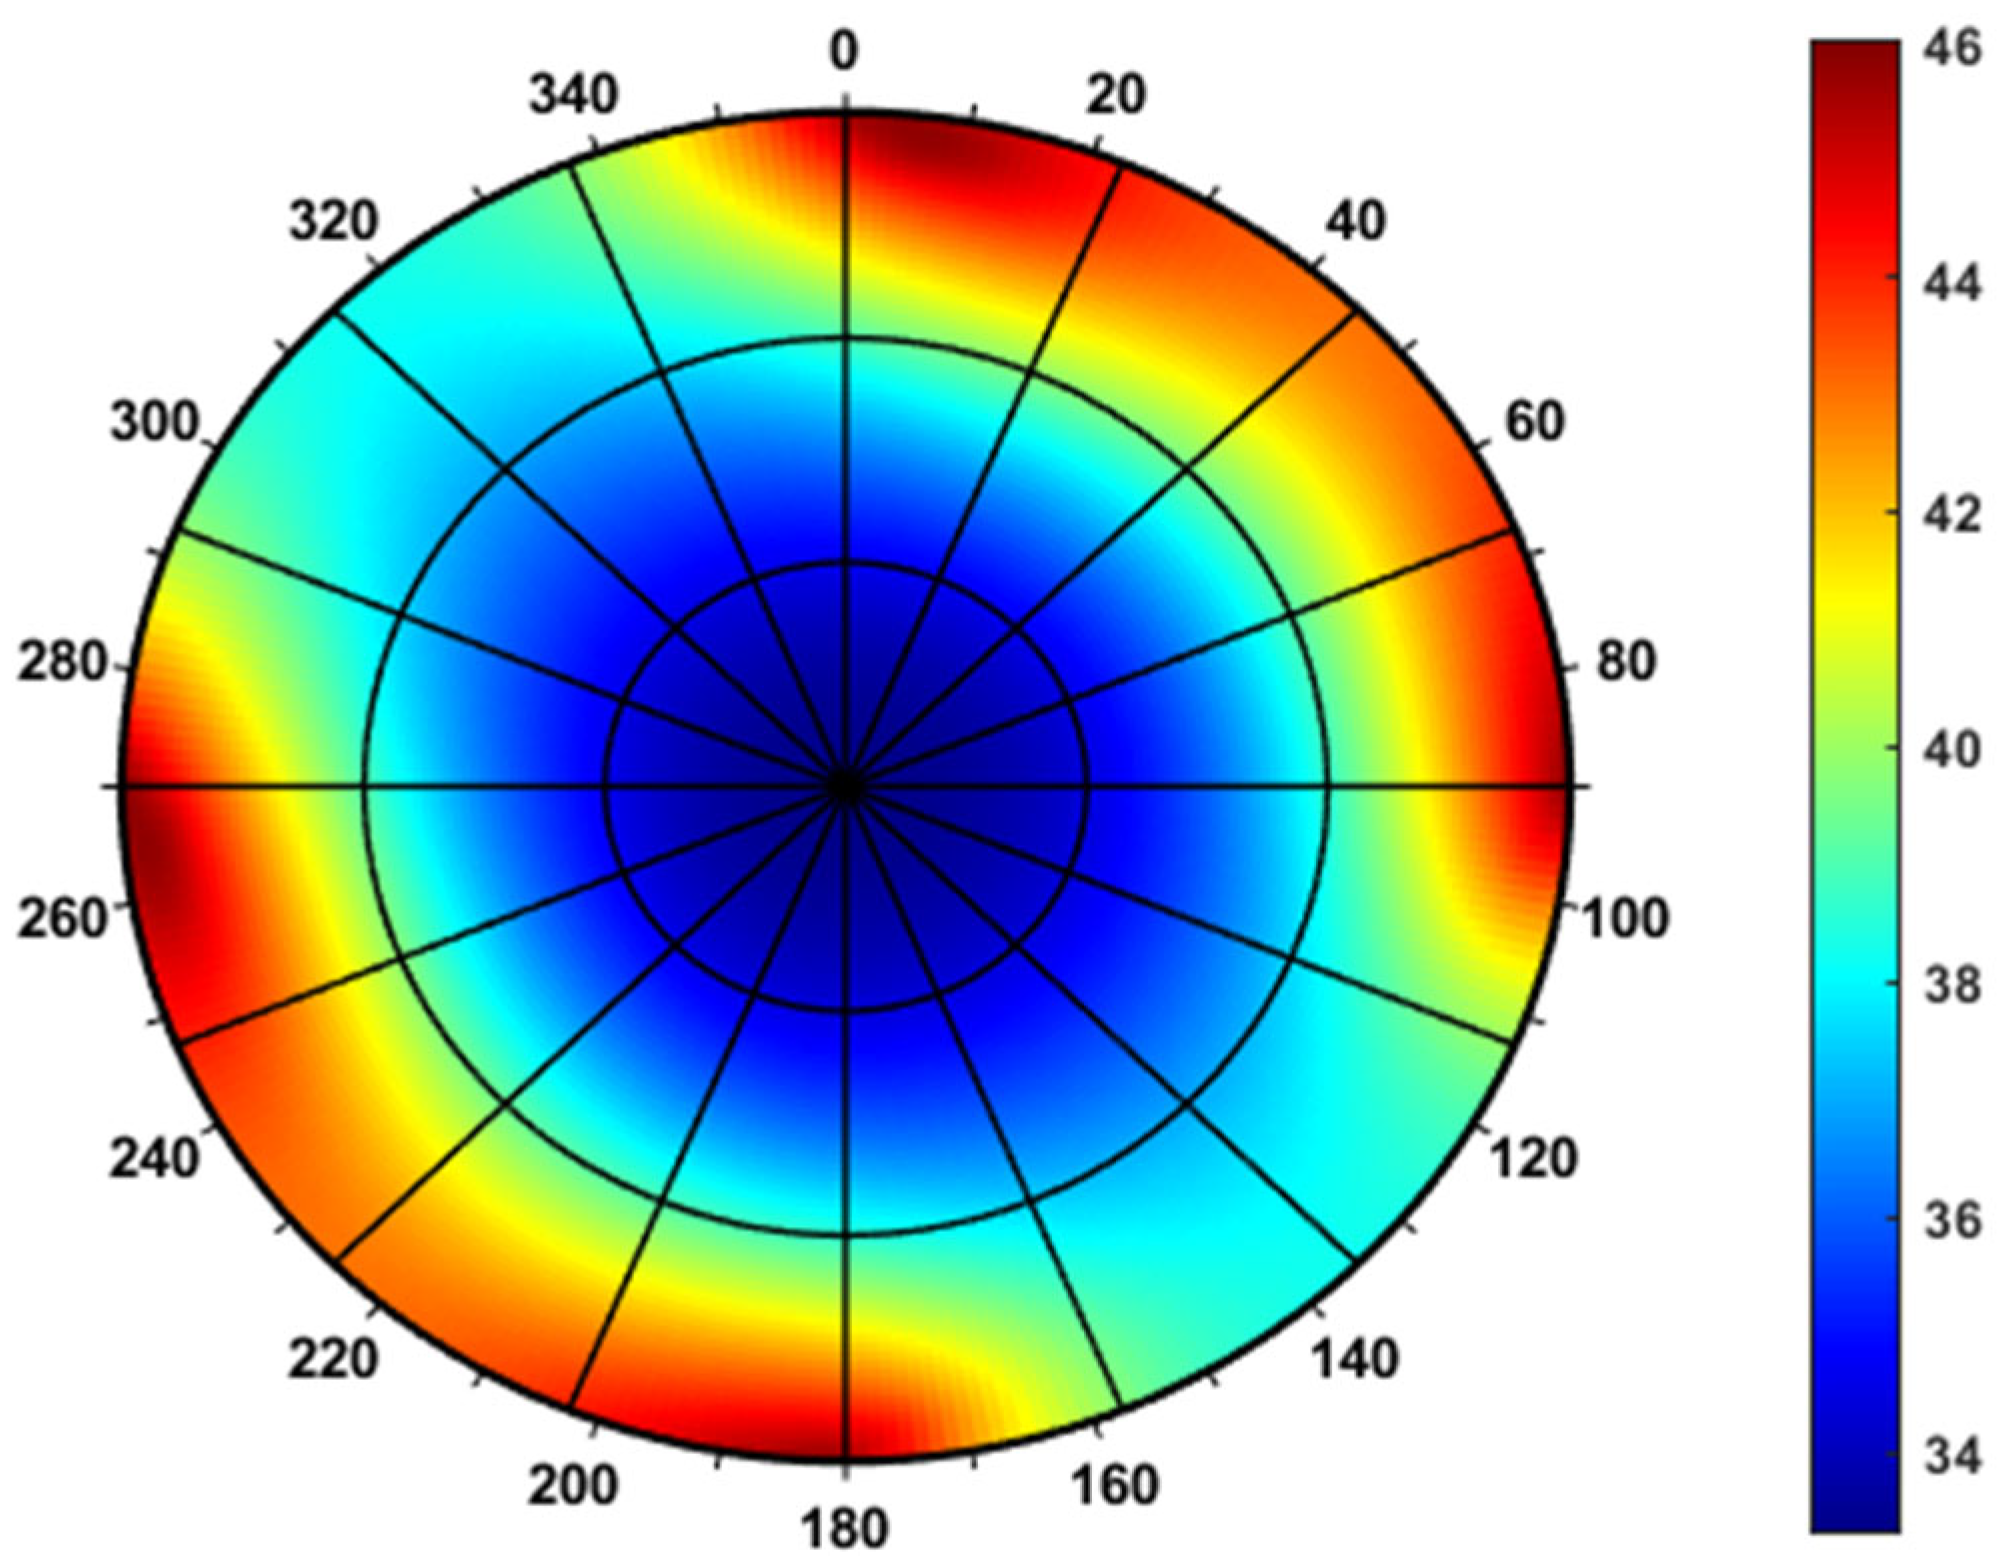
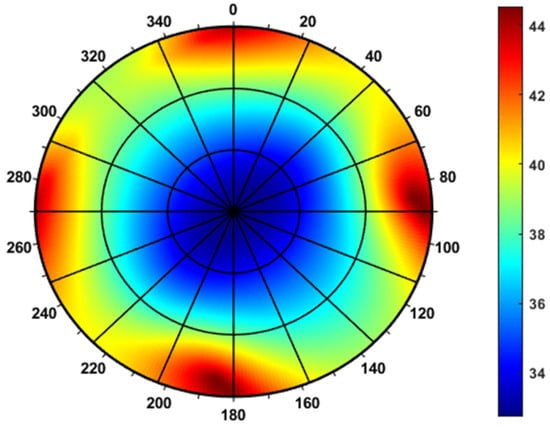
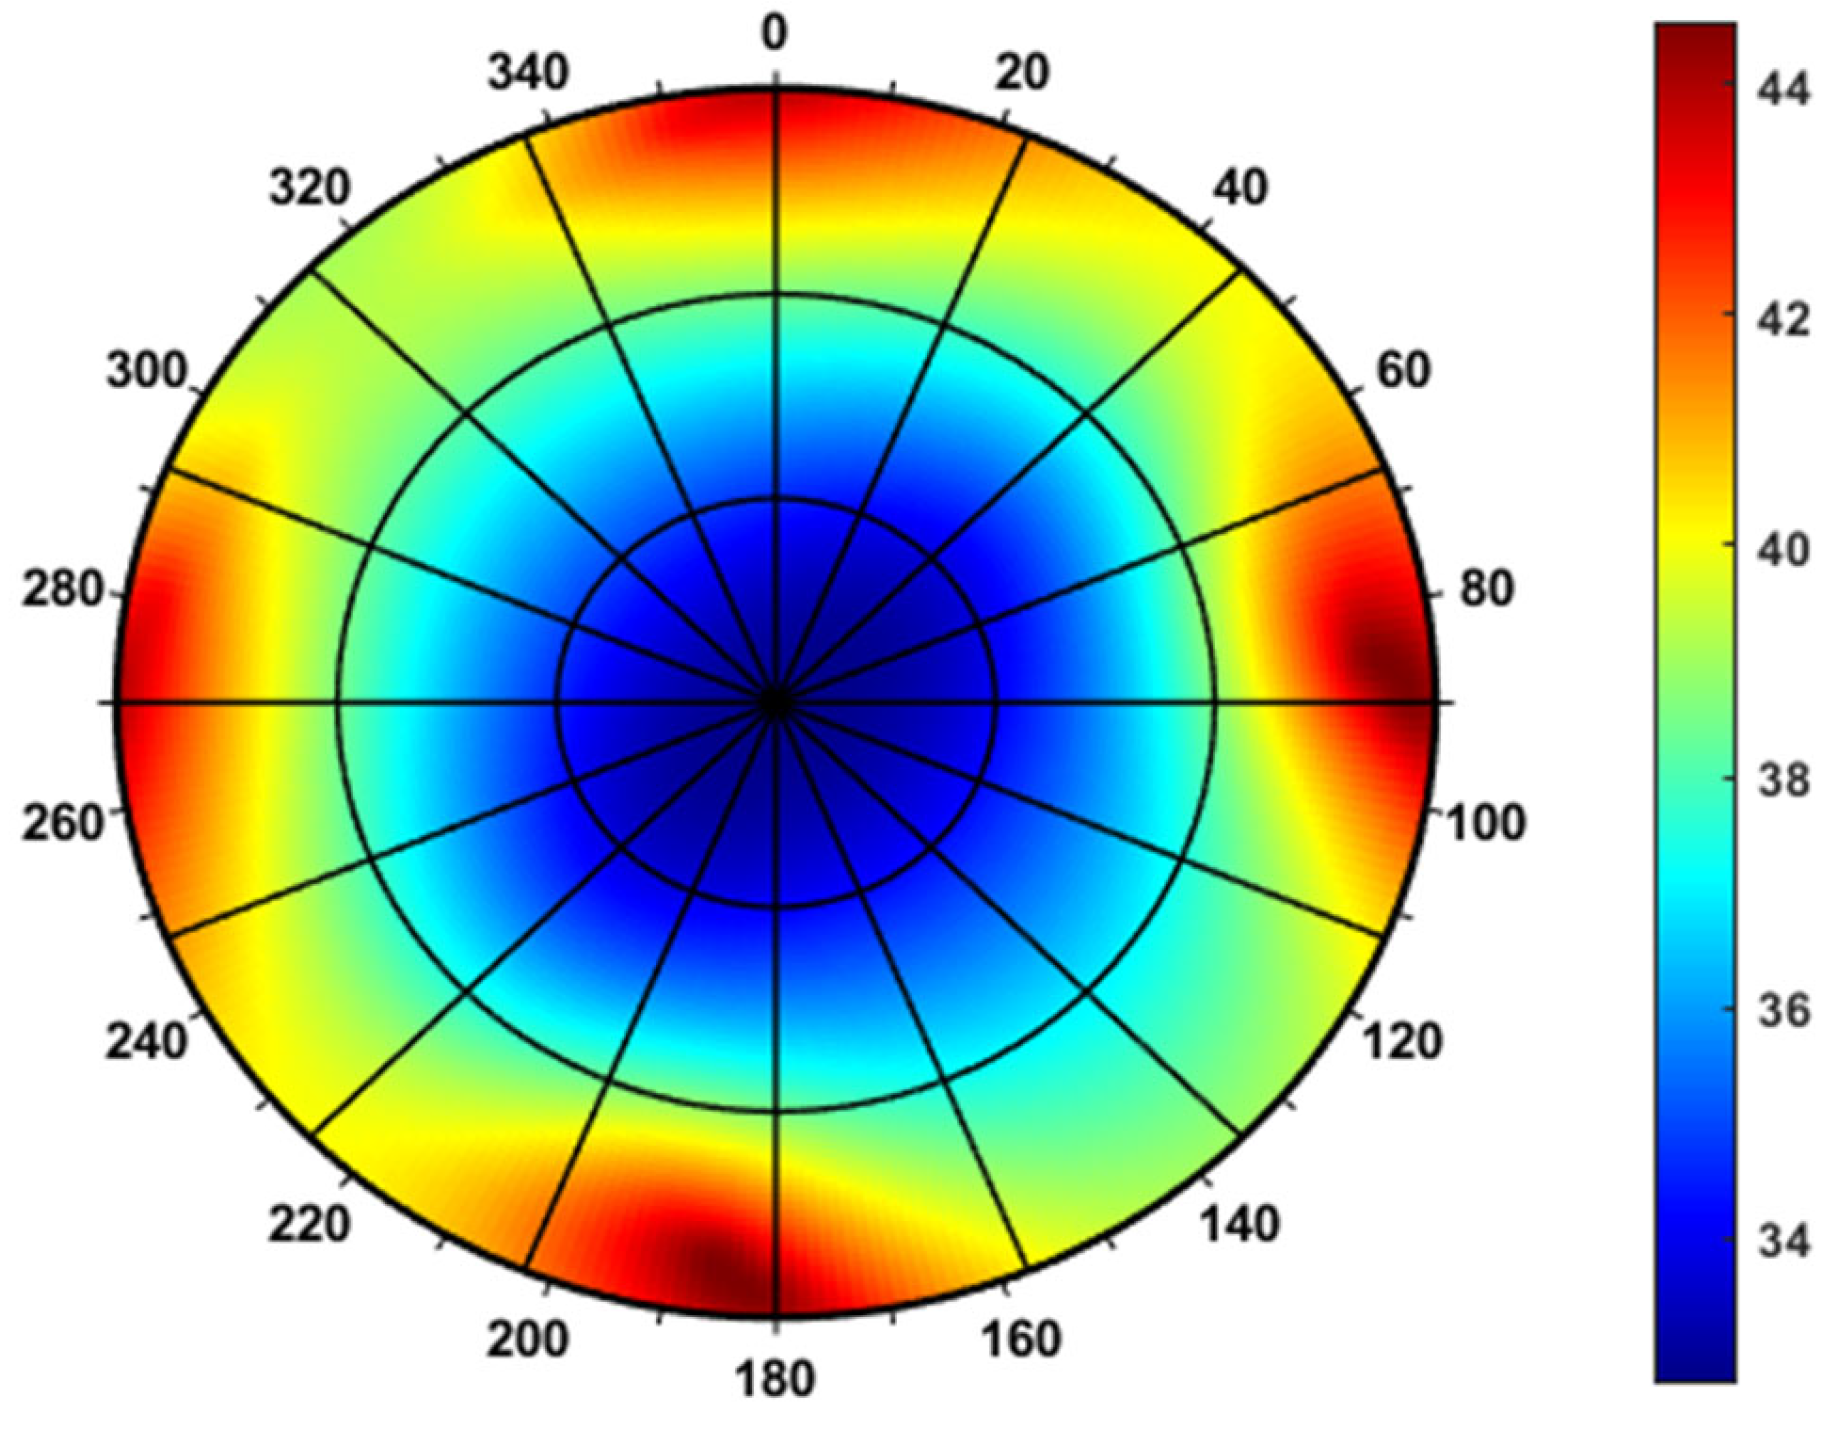
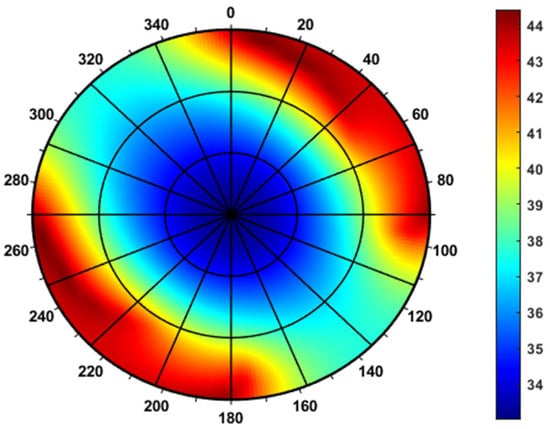
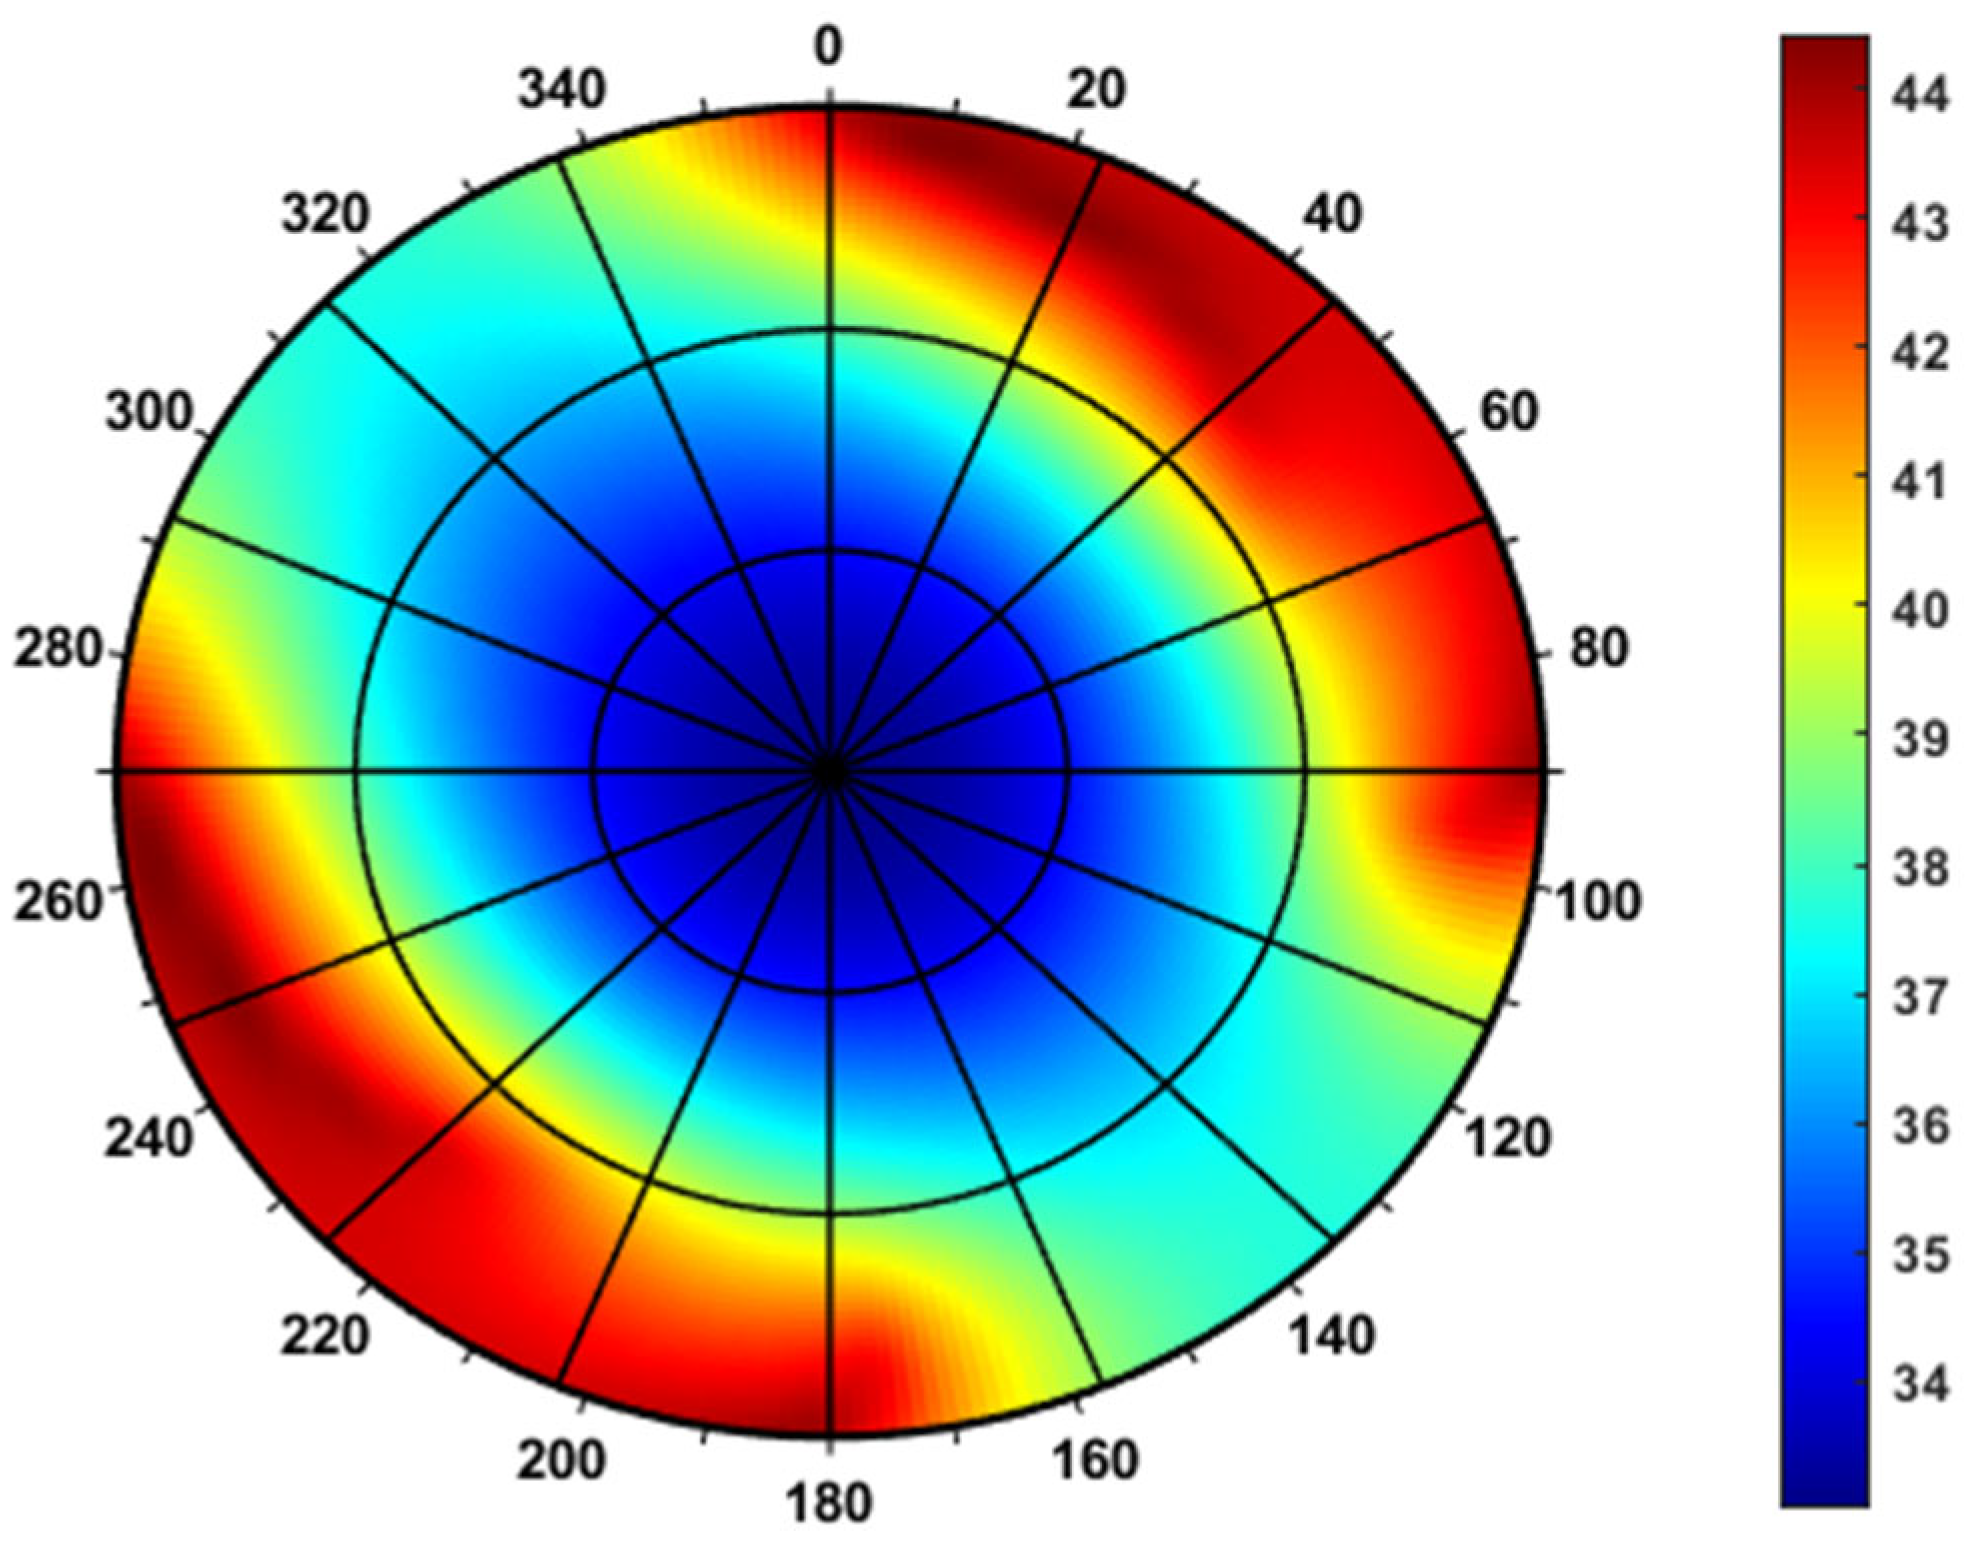
To investigate the effect of elastic modulus anisotropy on the magnitude of breakdown pressure, a comparison of the results for an isotropic formation (Figure 1) and the calculation under the condition of Poisson’s ratio isotropy (Figure 2 and Figure 3) reveals that elastic modulus anisotropy exerts a significant controlling effect on the magnitude of breakdown pressure. When vE = 0.5, i.e., stiffness perpendicular to the bedding plane is greater than that parallel to it, the overall magnitude of the wellbore breakdown pressure changes; when vE = 2, i.e., stiffness parallel to the bedding plane is dominant, the extreme-value region of the breakdown pressure shifts noticeably. This indicates that the directional variation in rock elastic stiffness directly alters the degree of stress concentration in the near-wellbore region. Neglecting elastic modulus anisotropy—that is, adopting the conventional isotropic assumption—can lead to considerable deviations in the predicted breakdown pressure, thereby compromising the accurate determination of the upper bound of the safe drilling fluid density window. Analyzing the effect of Poisson’s ratio anisotropy on the breakdown pressure magnitude, under the premise of elastic modulus isotropy, a comparison of the results for vν = 0.5 (Figure 4) and vν = 2 (Figure 5) shows that Poisson’s ratio anisotropy also alters the coupling effect of the borehole stresses. Although its sensitivity to the absolute value of breakdown pressure is slightly lower compared to that of the elastic modulus, by modifying the anisotropy in lateral deformation of the rock, it causes a redistribution of the tangential and axial stresses on the wellbore wall, thereby shifting the extremum point of the minimum effective principal stress, resulting in a marked non-uniformity in the breakdown pressure magnitude across different circumferential orientations around the wellbore.
Figure 1.
Wellbore breakdown pressure contour map for an isotropic formation.
Figure 2.
Wellbore breakdown pressure contour map at an anisotropy ratio of vE = 0.5, vν = 1.
Figure 3.
Wellbore breakdown pressure contour map at an anisotropy ratio of vE = 2, vν = 1.
Figure 4.
Wellbore breakdown pressure contour map at an anisotropy ratio of vE = 1, vν = 0.5.
Figure 5.
Wellbore breakdown pressure contour map at an anisotropy ratio of vE = 1, vν = 2.
Further comparison of the multi-parameter coupling conditions in Figure 6 and Figure 7 demonstrates that there is a significant synergistic or antagonistic effect between the elastic modulus and Poisson’s ratio anisotropy. When the anisotropic characteristics of these two parameters are superimposed, the local gradient in the magnitude of the wellbore breakdown pressure increases substantially, and the asymmetry of the extreme-value region is further intensified. This implies that in deep shale formations with complex in situ stress states and strong anisotropy, the coupling effects of E and ν must be considered simultaneously; otherwise, single-parameter corrections are insufficient to accurately characterize the actual breakdown behavior of the wellbore.
Figure 6.
Wellbore breakdown pressure contour map at an anisotropy ratio of vE = 0.5, vν = 2.
Figure 7.
Wellbore breakdown pressure contour map at an anisotropy ratio of vE = 2, vν = 0.5.
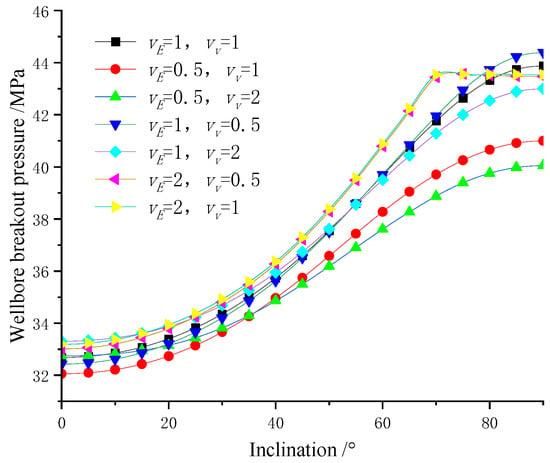
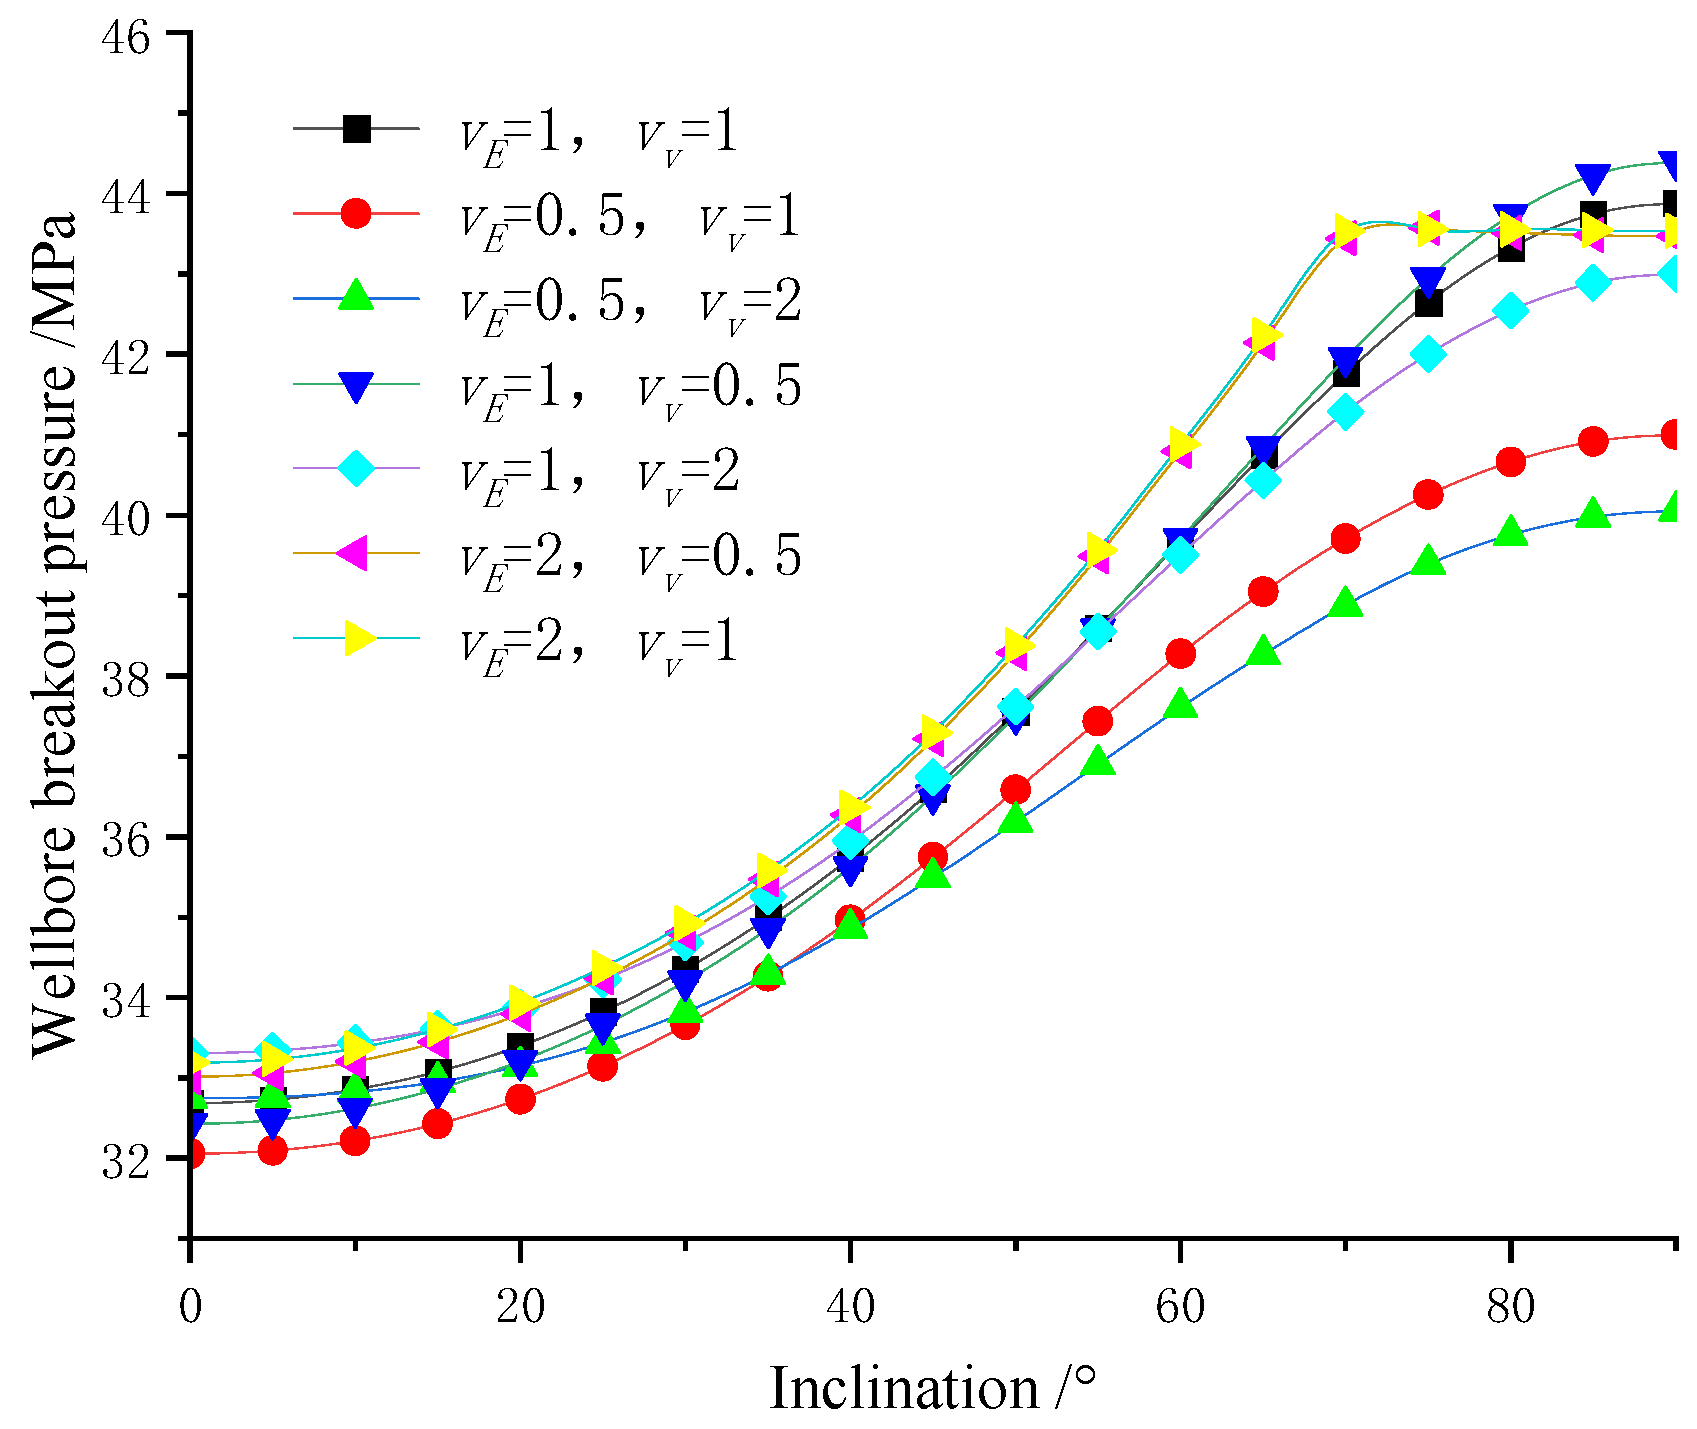
In practical drilling engineering, wellbore trajectory design directly governs wellbore stability. Figure 8 shows how the wellbore breakdown pressure varies with the deviation angle for a wellbore oriented along the minimum horizontal in situ stress direction under different anisotropy ratios. The results indicate that, in an isotropic formation, the breakdown pressure generally exhibits either a smooth monotonic decrease or a symmetric parabolic variation as the deviation angle increases. However, after incorporating anisotropy—especially under conditions of high vE or high vν values—the curve of breakdown pressure versus deviation angle becomes significantly distorted, and local minima or abrupt change points may appear within specific deviation angle intervals. As the degree of anisotropy increases, the difference in breakdown pressure between the high-angle section (e.g., a horizontal well section) and the vertical section is further amplified. This implies that during horizontal well drilling, anisotropy markedly narrows the safe drilling fluid density window, thereby increasing the risk of lost circulation. Furthermore, the evolution pattern revealed in Figure 8 also indicates that, by appropriately selecting a specific deviation angle interval, the low-breakdown-pressure zone induced by anisotropy can be effectively avoided. Therefore, when optimizing the wellbore trajectory in shale formations, the anisotropy of elastic parameters must be incorporated into the breakdown pressure prediction model to achieve simultaneous improvements in both drilling safety and reservoir stimulation effectiveness.
Figure 8.
Variation trend of wellbore breakdown pressure with deviation angle under different anisotropy ratios.
3.2. Influence of Anisotropy on Wellbore Breakdown Pressure
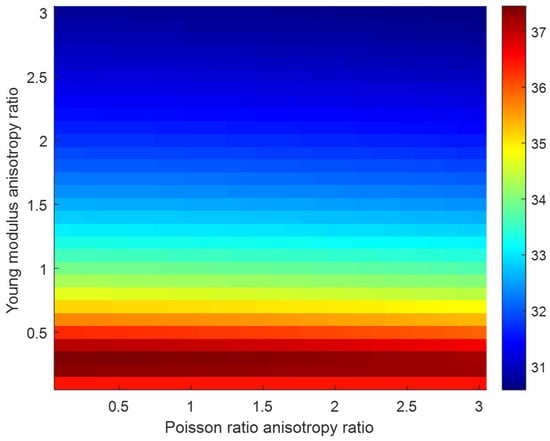
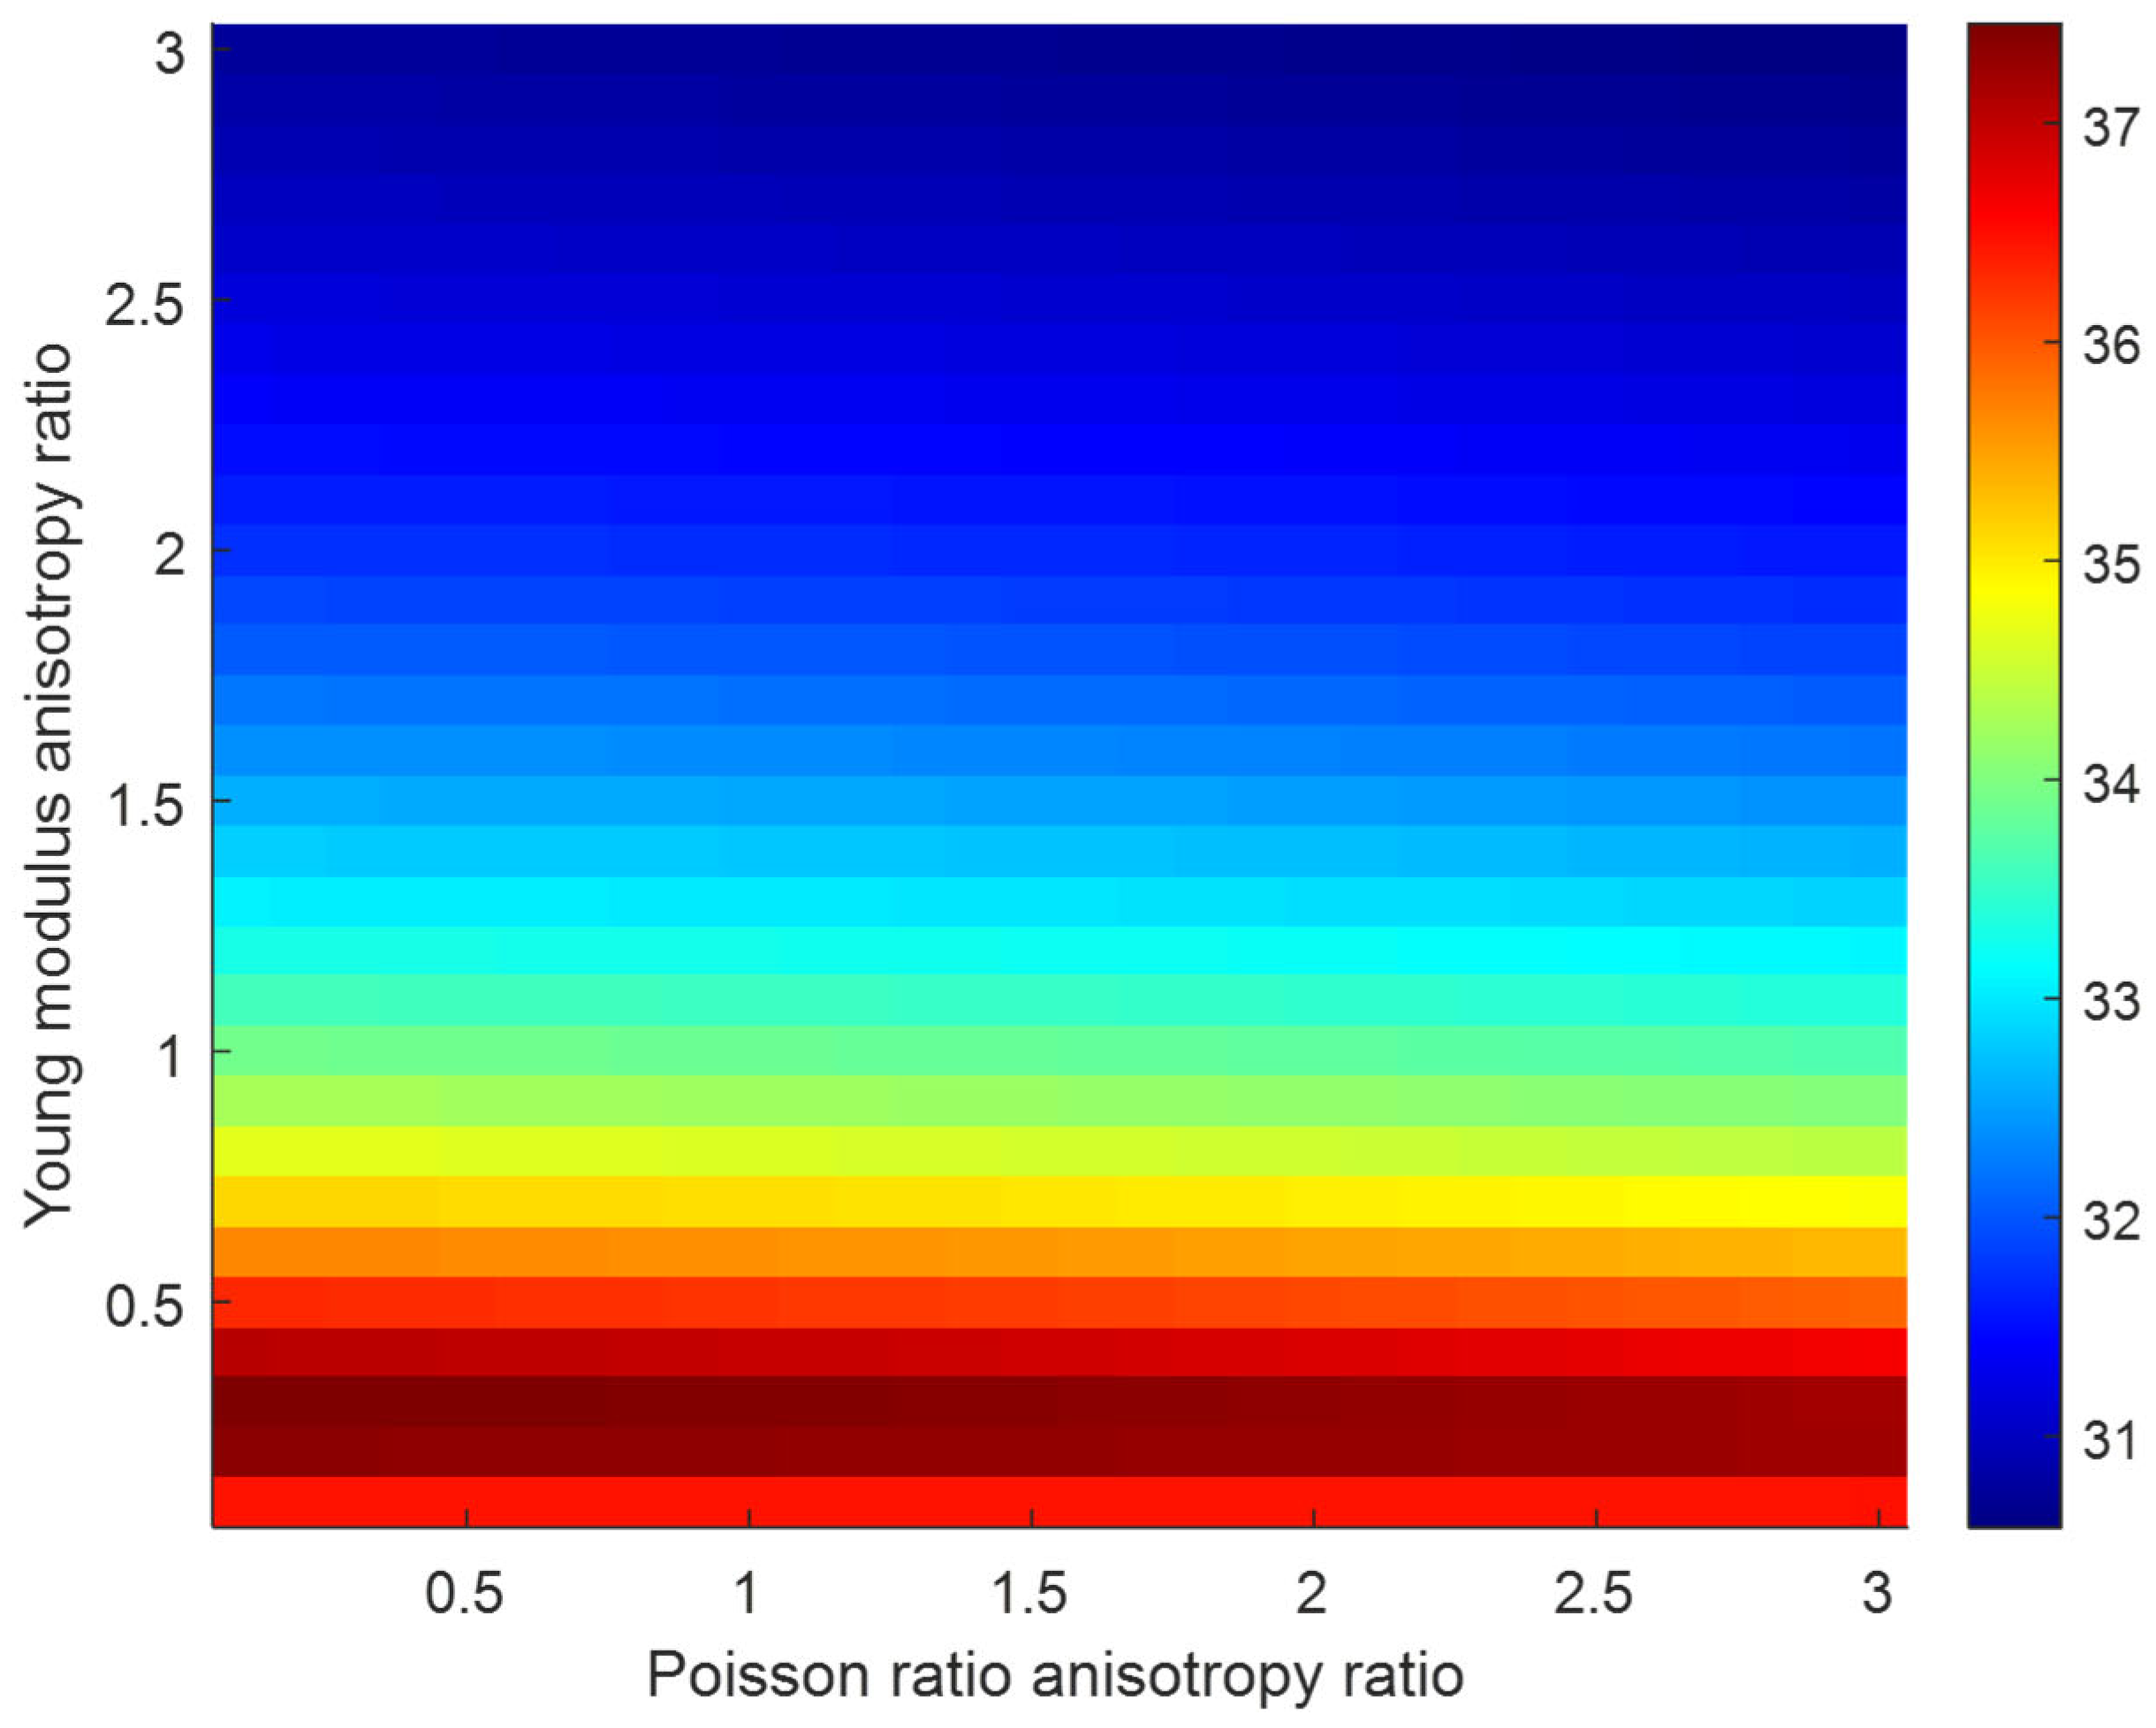
Based on the transversely isotropic (VTI) borehole stress model and the minimum principal stress fracture criterion, this section systematically and quantitatively reveals the independent mechanisms and complex coupling effects of the elastic modulus anisotropy ratio vE = Eh/Ev and the Poisson’s ratio anisotropy ratio vν = νh/νv on wellbore breakdown pressure. Figure 9 intuitively presents the complete spatial distribution characteristics of the breakdown pressure for a vertical well under the continuous variation in the two dimensionless parameters—the elastic modulus anisotropy ratio vE = Eh/Ev and the Poisson’s ratio anisotropy ratio vν = νh/νv—forming a projection of a three-dimensional response surface onto a two-dimensional plane. The contour map clearly reveals the overall trend of breakdown pressure as a function of vE: as vE gradually increases from 0.1 to 3, the breakdown pressure exhibits a relatively rapid decreasing trend; meanwhile, as vν gradually increases from 0.1 to 3, the breakdown pressure remains largely unchanged.
Figure 9.
Contour map of vertical well breakdown pressure versus elastic anisotropy ratios.
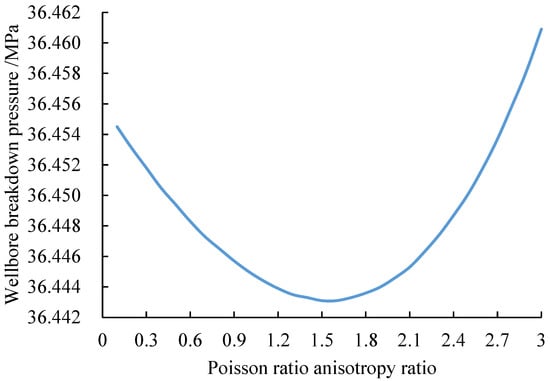
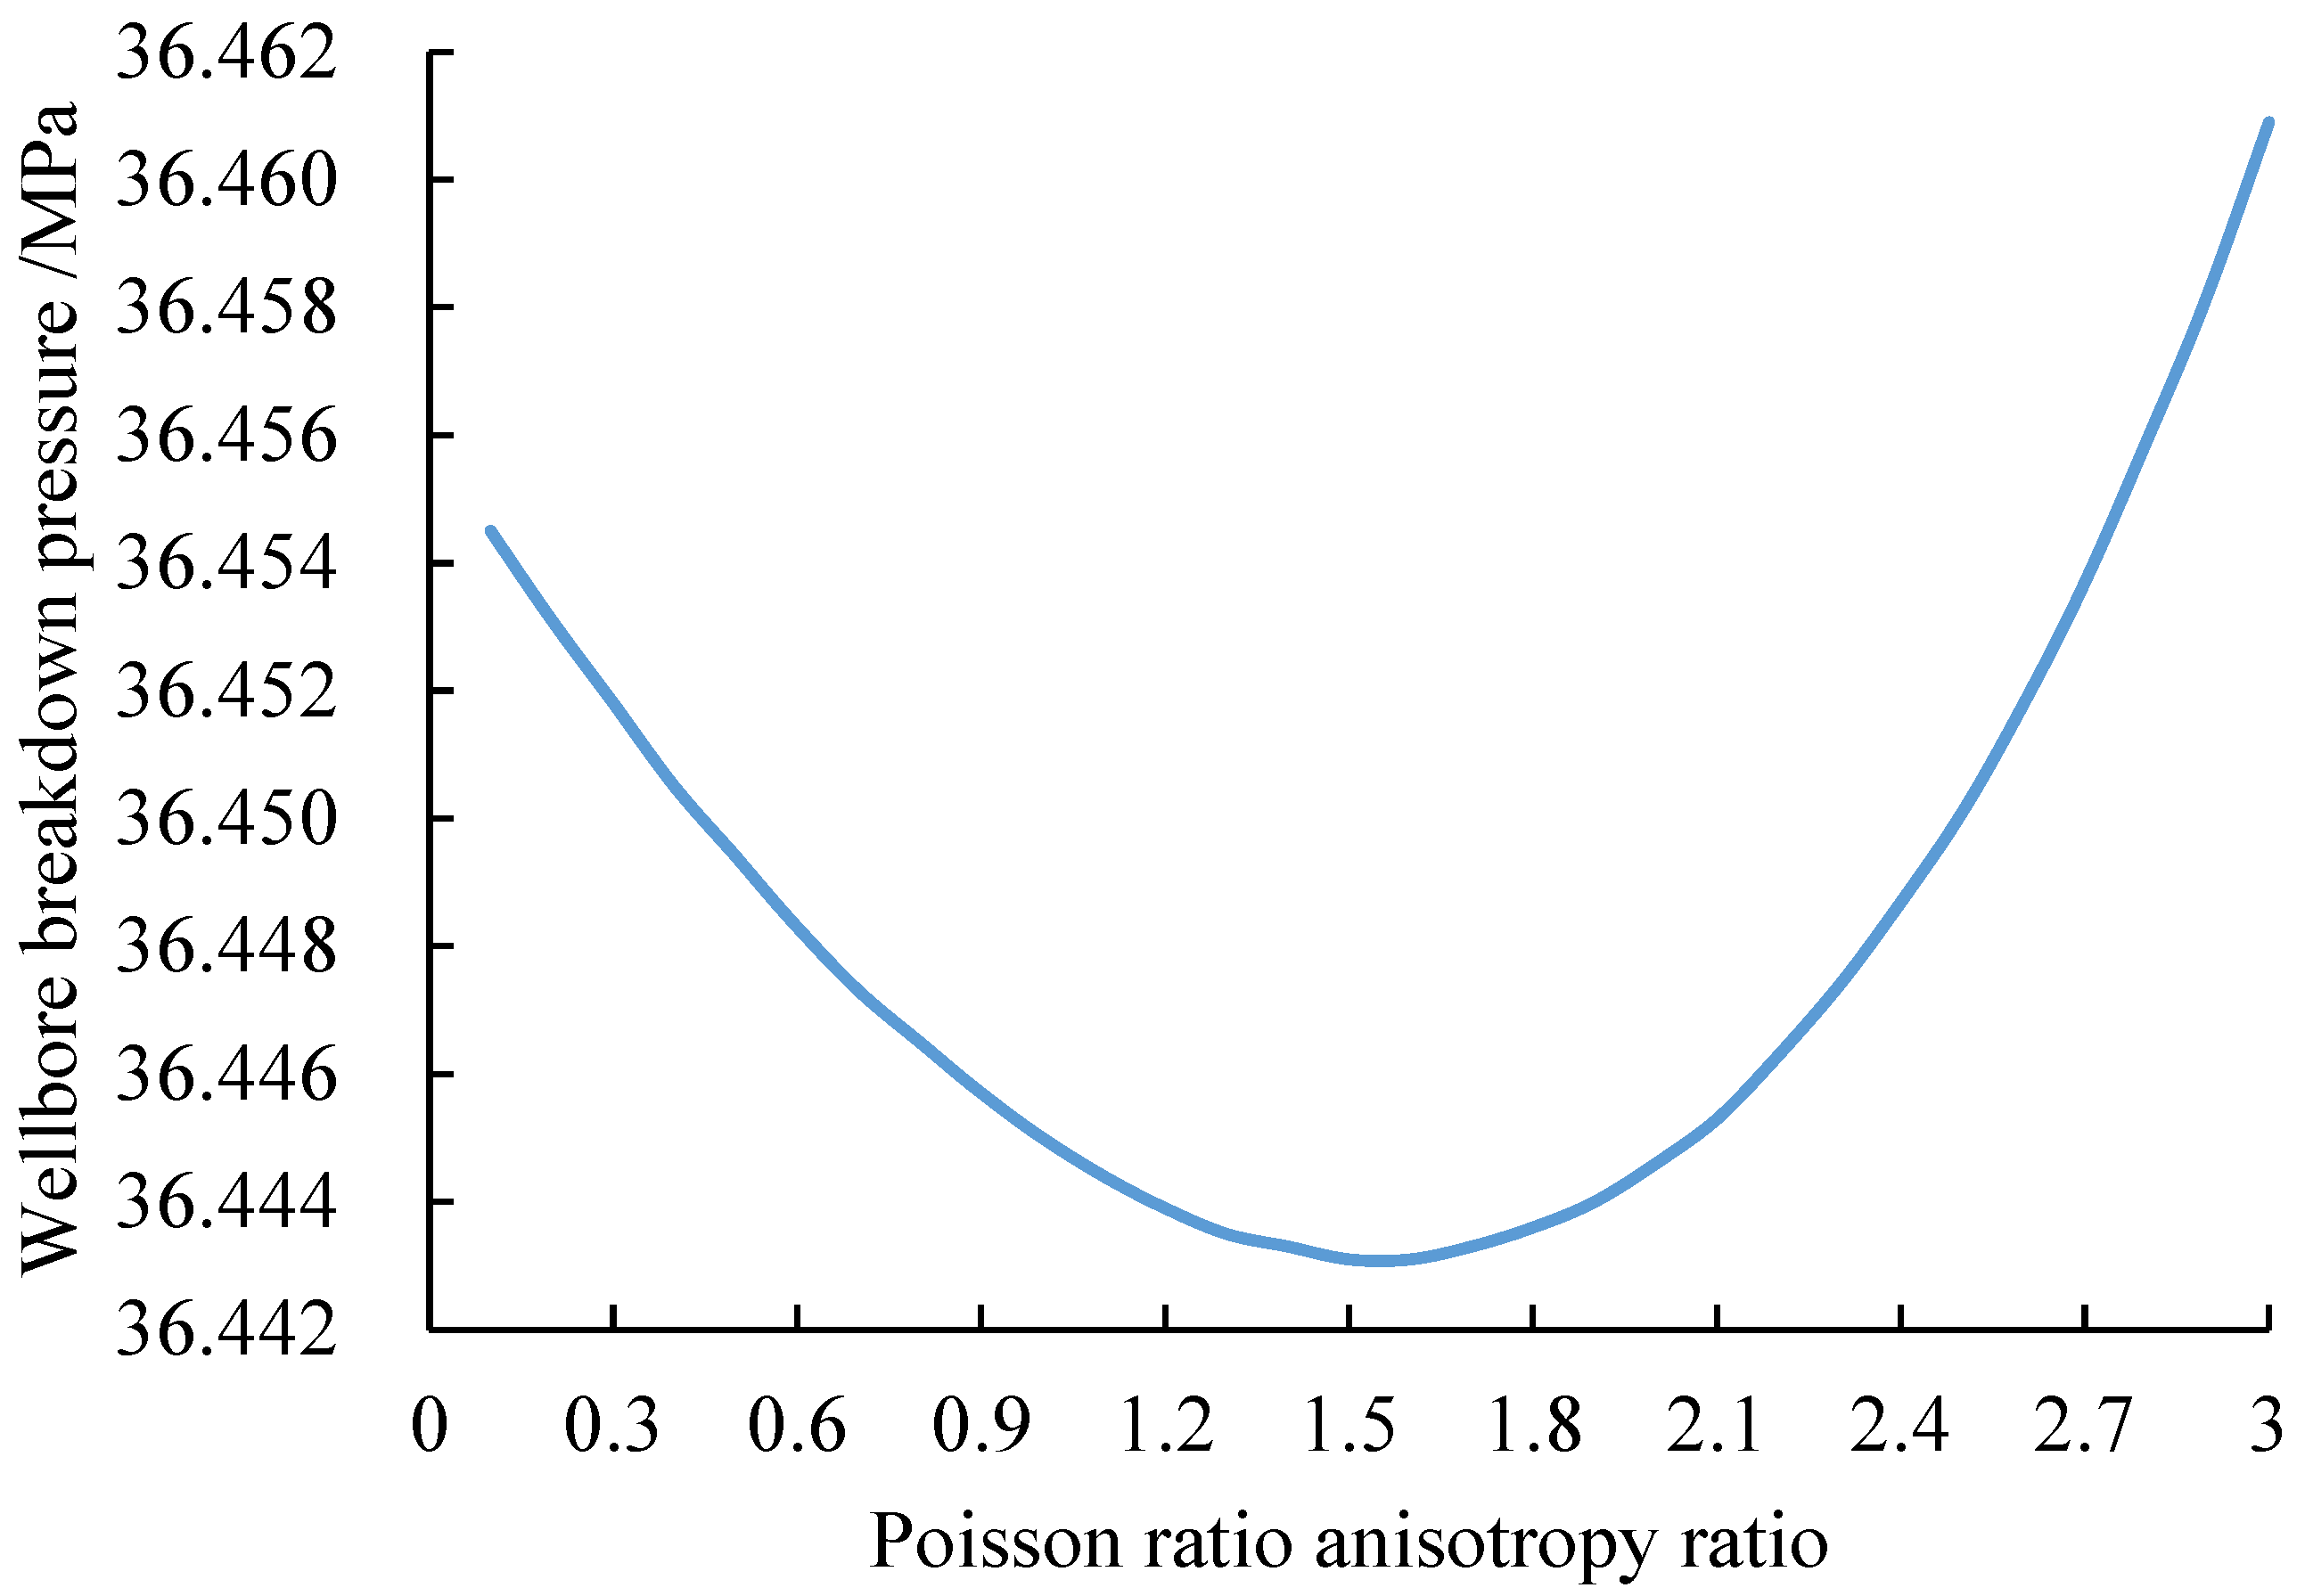
Under the strongly anisotropic condition of an elastic modulus anisotropy ratio vE = 0.1 (i.e., the vertical stiffness is far greater than the horizontal stiffness), as the Poisson’s ratio anisotropy ratio vν increases, the lateral expansion capacity of the rock within the horizontal bedding plane is enhanced, effectively alleviating the hoop stress concentration on the wellbore wall. This causes the breakdown pressure of the vertical well to exhibit a trend of first decreasing slowly, then leveling off, and subsequently gradually recovering. This pattern indicates that although Poisson’s ratio anisotropy can exert a certain stress-regulating effect by altering the lateral deformation capacity, its influence is limited by the stiffness field dominated by the extreme elastic modulus contrast and has an upper bound, rendering it incapable of fundamentally reversing the basic stress regime, as shown in Figure 10. This confirms that under strongly anisotropic conditions, the elastic modulus absolutely dominates the control of wellbore stability, while Poisson’s ratio plays only a secondary regulatory role.
Figure 10.
Trend of vertical well breakdown pressure with Poisson’s ratio anisotropy ratio at an elastic modulus anisotropy ratio of 0.1.
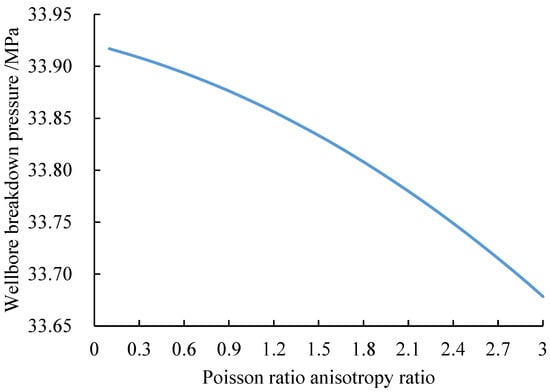
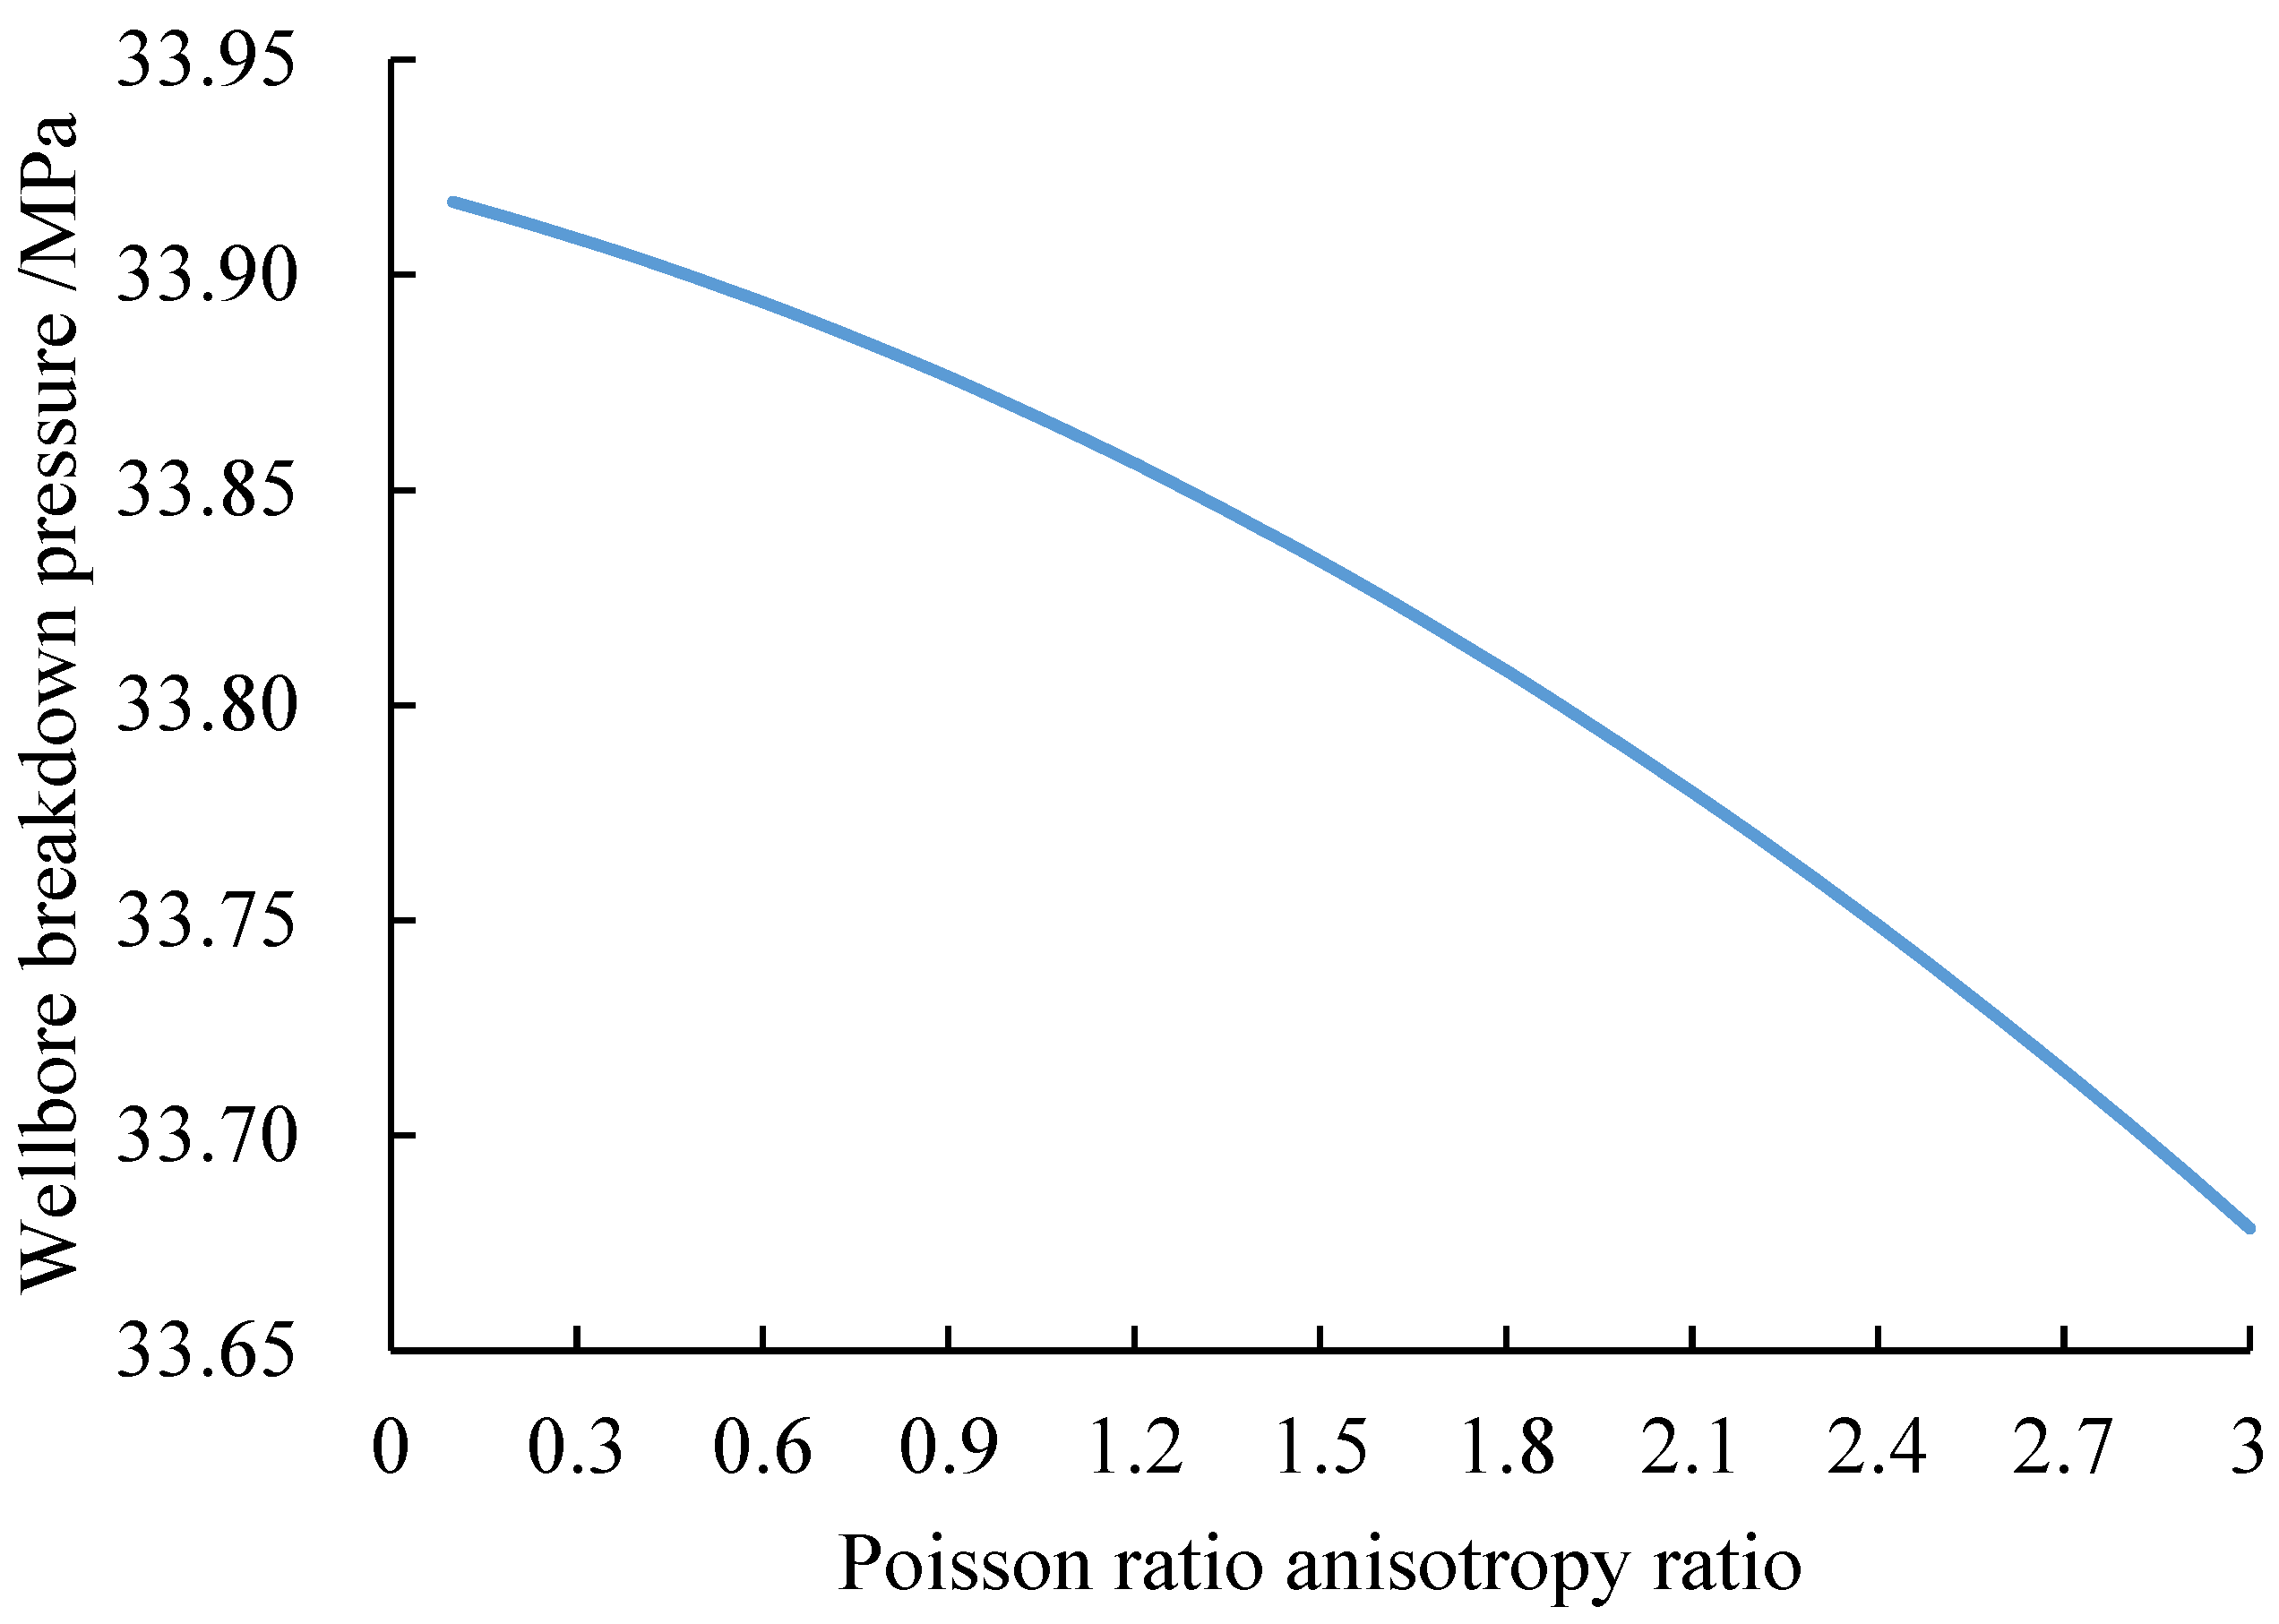
To precisely identify the independent influence of Poisson’s ratio anisotropy on wellbore breakdown pressure, this study sets the elastic modulus anisotropy ratio vE = Eh/Ev = 1, i.e., Eh = Ev, thereby eliminating the contribution of directional differences in elastic modulus, as shown in Figure 11. Under this condition, the rock possesses identical stiffness parallel and perpendicular to the bedding plane, and any variation in breakdown pressure can be attributed to the deformation coupling effect induced by the difference in the Poisson’s ratio anisotropy ratio vν = νh/νv. This analysis aims to evaluate the capacity of Poisson’s ratio anisotropy itself to regulate wellbore stability when the elastic modulus is isotropic. Figure 11 clearly demonstrates the variation in vertical well breakdown pressure with increasing Poisson’s ratio anisotropy ratio vν under the specific condition of vE = 1. The results show that as vν increases from 0.1 to 3, the breakdown pressure exhibits a slightly nonlinear, monotonic decreasing trend. This decreasing trend indicates that when νh > νv, the lateral expansion capacity of the rock within the bedding plane (horizontal direction) is enhanced relative to the vertical direction. Such deformation anisotropy modifies the coupling relationship between the axial and tangential stresses in the near-wellbore stress field. Specifically, the enhanced horizontal Poisson effect, in which a high νh causes the circumferential (tangential) contraction strain to be relatively reduced under the same axial compression, mitigates the tangential tensile stress concentration on the wellbore wall to a certain extent, thereby lowering the wellbore fluid pressure required for fracture initiation. However, the trend plot simultaneously reveals that within the entire range of vν variation, the absolute reduction in breakdown pressure is relatively small, typically less than 10%. This limited range of variation strongly demonstrates that the sensitivity of Poisson’s ratio anisotropy itself to the magnitude of breakdown pressure is significantly lower than that of the elastic modulus anisotropy. Although its effect is relatively weak, the clear and consistent trend shown in the figure confirms that Poisson’s ratio anisotropy modifies the deformation compatibility of the rock in three-dimensional space, thereby redistributing effective stress and consequently influencing both the location and magnitude of the extremum of the minimum effective principal stress. Therefore, even under the idealized assumption of elastic modulus isotropy, neglecting Poisson’s ratio anisotropy will still introduce systematic prediction errors, albeit potentially of limited magnitude. This analytical result validates the fundamental judgment that “Poisson’s ratio anisotropy plays a secondary regulatory role in wellbore breakdown pressure prediction” and emphasizes that when constructing an accurate transversely isotropic wellbore stability model, all five independent elastic constants, including the difference between νh and νv, must still be fully considered to comprehensively characterize the true mechanical response of the rock.
Figure 11.
Trend of vertical well breakdown pressure with Poisson’s ratio anisotropy ratio at an elastic modulus anisotropy ratio of 1.
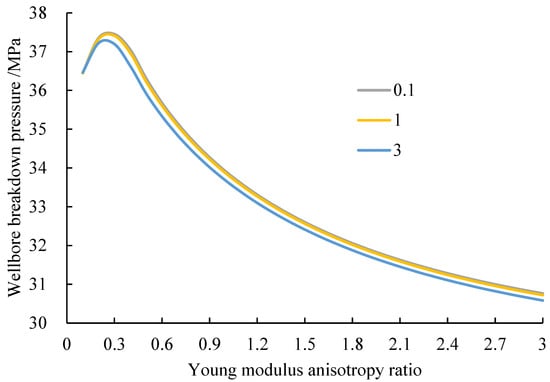
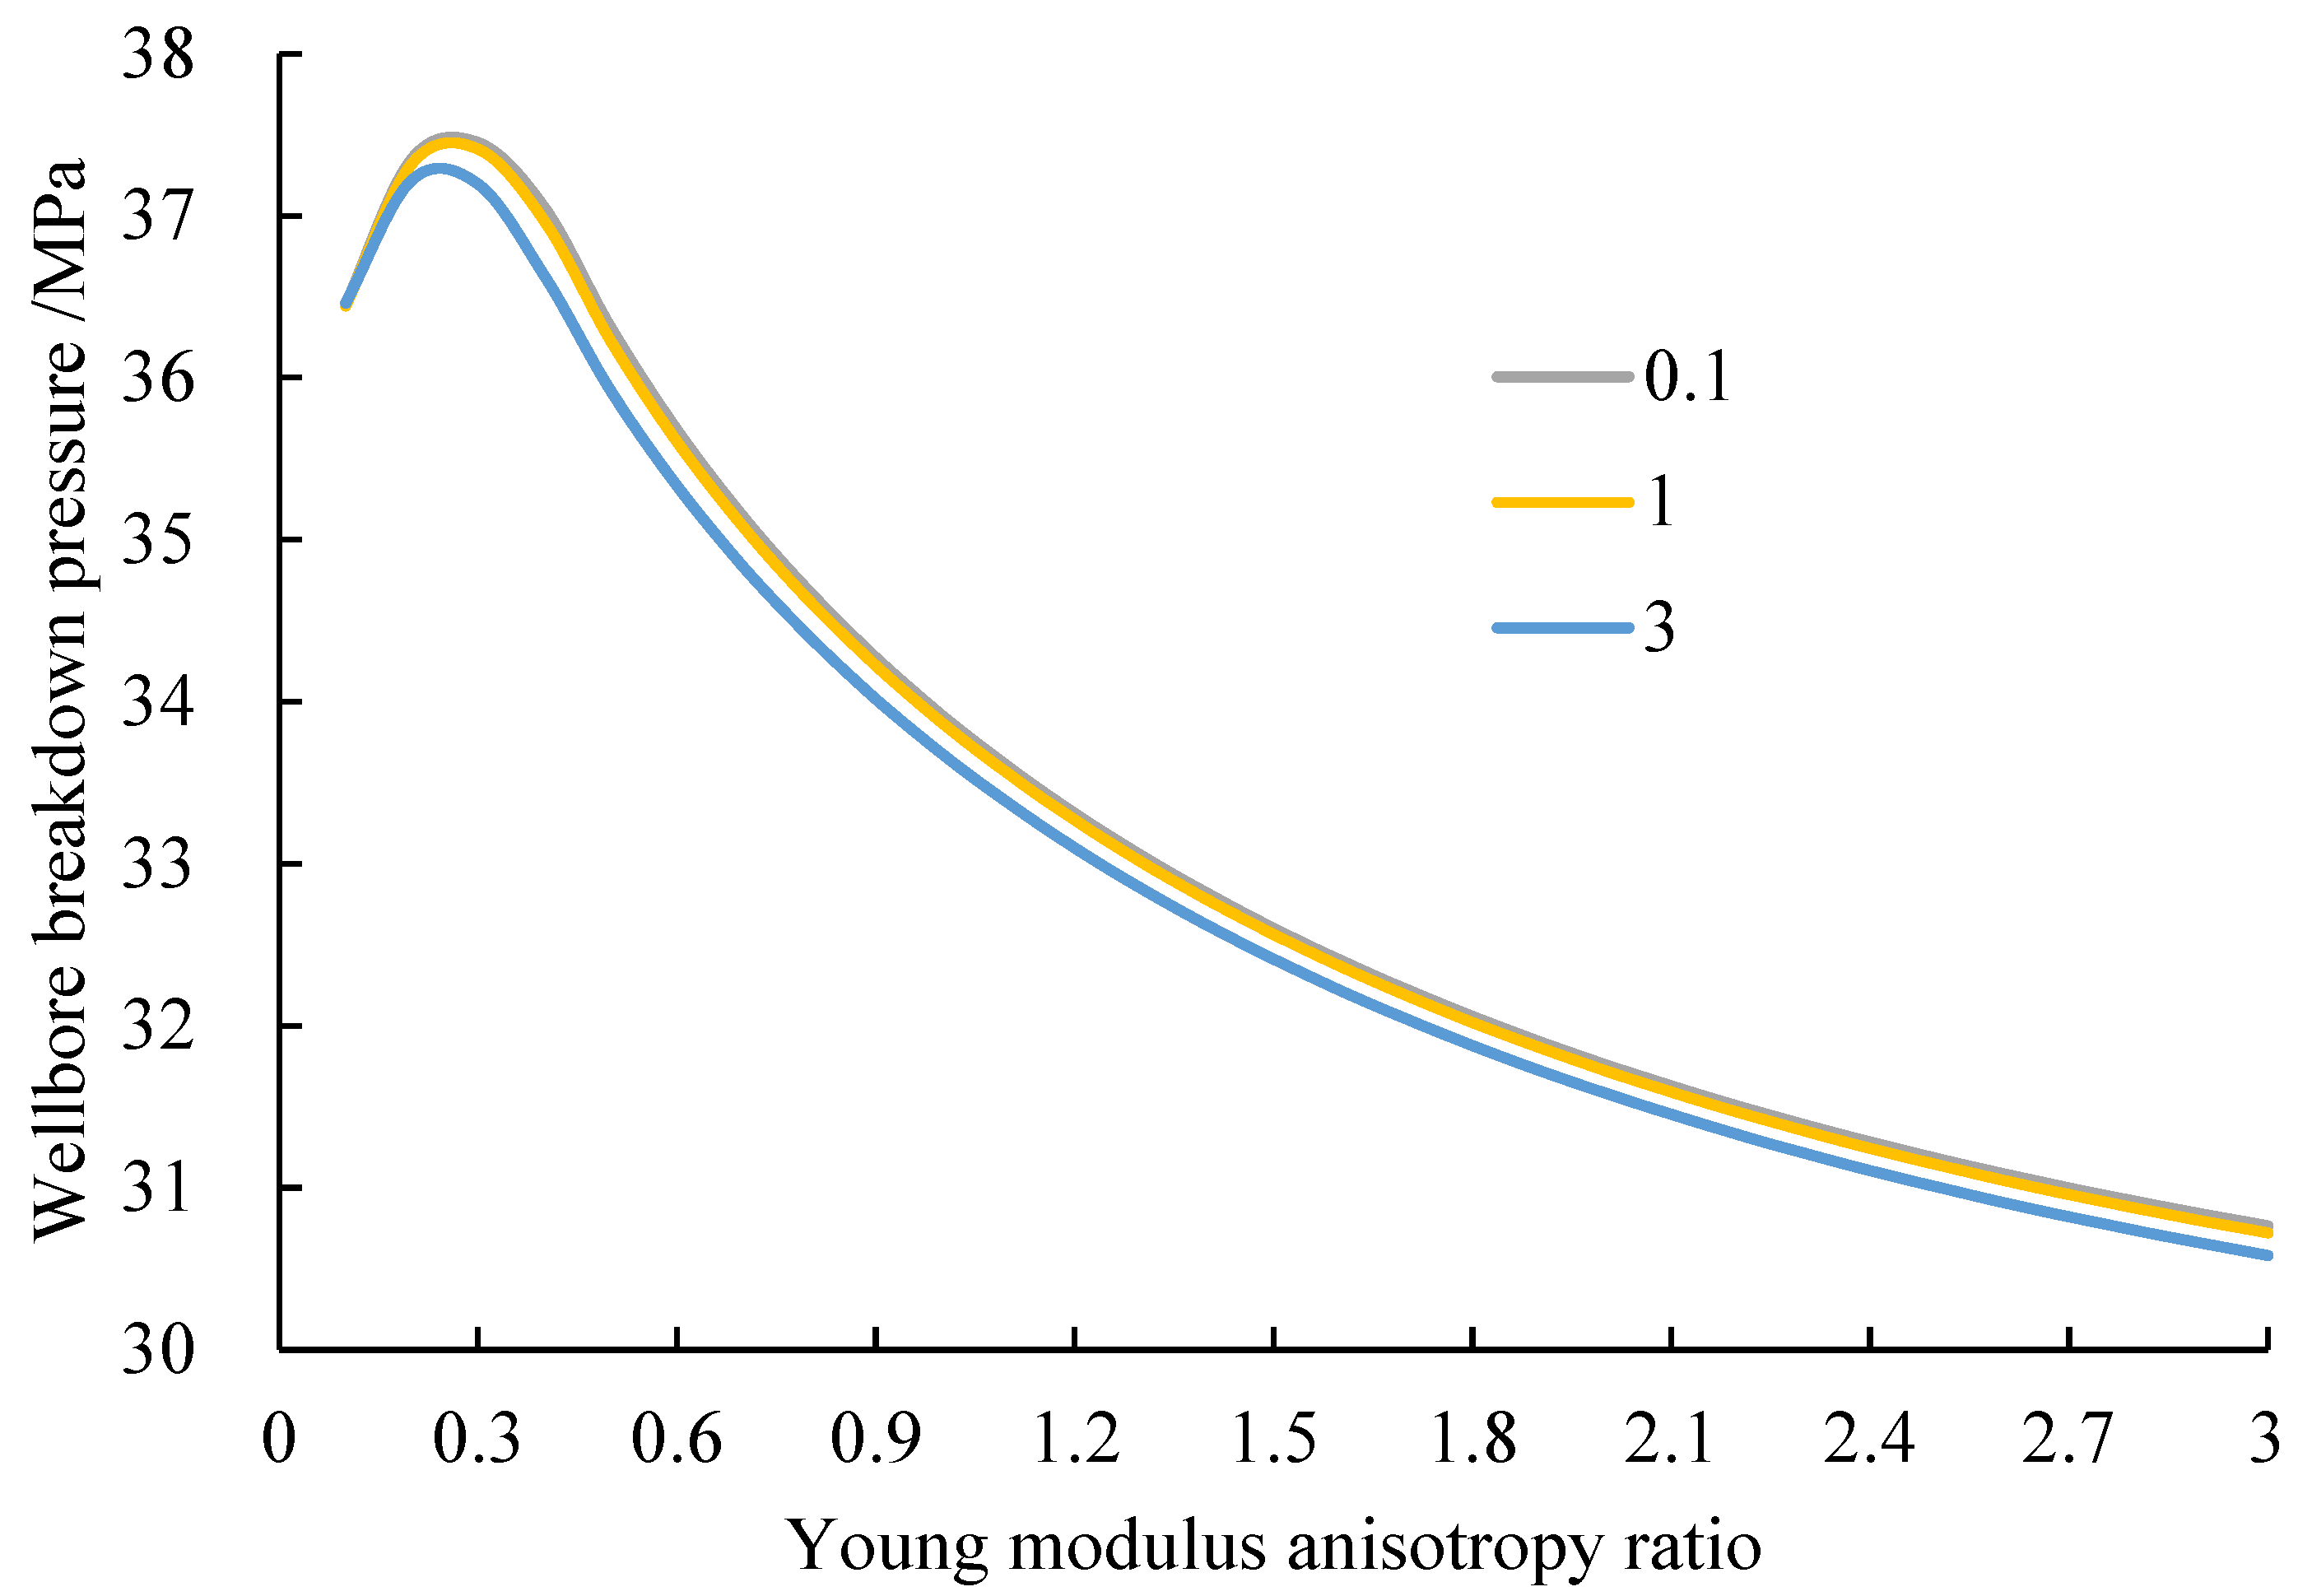
To systematically verify, from the reverse perspective, the central role of the elastic modulus anisotropy ratio in controlling wellbore breakdown pressure and to quantitatively assess the regulatory strength of the Poisson’s ratio anisotropy ratio, this study plots the variation in vertical-well breakdown pressure with vE under different fixed vν conditions, as shown in Figure 12. By superimposing multiple curves representing different vν values, this figure intuitively compares the offset in breakdown pressure caused by the difference in vν along the same vE variation path, thereby clearly distinguishing the dominant controlling factor from the secondary regulatory factor. The figure shows that regardless of the vν value, the overall trend of breakdown pressure with vE is highly consistent, all exhibiting an asymmetric “U”-shaped or “J”-shaped evolution characteristic. It presents the variation in wellbore breakdown pressure with the elastic modulus anisotropy ratio under different Poisson’s ratio anisotropy ratios vν = 0.1, 1, 3: all curves display a non-monotonic trend of first increasing and then decreasing, reaching a peak at Eh/Ev = 0.3, and the overall breakdown pressure level decreases significantly as vν increases. The underlying physical mechanism is as follows: when Eh/Ev is small (Ev ≫ Eh), the extremely high vertical stiffness suppresses axial deformation, leading to significant tangential tensile stress concentration and a high breakdown pressure; as Eh/Ev increases (horizontal stiffness increases), the lateral expansion capacity of the horizontal bedding plane is enhanced, effectively releasing the tangential stress on the wellbore wall and causing the breakdown pressure to decrease. However, when Eh/Ev is extremely low (approaching 0), the excessively “soft” horizontal direction instead weakens the support for the wellbore wall, resulting in a slight increase in breakdown pressure. The increase in vν (νh > νv) further enhances the lateral deformation capacity in the horizontal direction and, by more effectively dissipating the hoop stress concentration, shifts the overall breakdown pressure downward; however, it cannot alter the fundamental stress distribution pattern dominated by the elastic modulus. This confirms that in strongly anisotropic formations, the elastic modulus contrast is the core factor controlling wellbore stability, whereas Poisson’s ratio plays only an auxiliary regulatory role.
Figure 12.
Trend of vertical well breakdown pressure with elastic modulus anisotropy ratio under different Poisson’s ratio anisotropy ratios.
In summary, the above analysis demonstrates that the elastic modulus anisotropy ratio vE is the dominant factor influencing the breakdown pressure of a vertical well, directly determining the basic level of breakdown pressure by altering the degree of stress concentration in the near-wellbore zone. The Poisson’s ratio anisotropy ratio vν, although exerting a weaker effect on the absolute value of breakdown pressure, still plays a certain role—when vE is held constant, vν exhibits a significant regulatory capacity over the coupling effect between the circumferential and axial stresses around the wellbore by modifying the anisotropy in lateral deformation capacity, causing a redistribution of effective stress and thereby affecting the location and magnitude of the extremum of the minimum effective principal stress. More importantly, the anisotropies of the elastic modulus and Poisson’s ratio do not simply superimpose independently; instead, they exhibit a pronounced synergistic or antagonistic interaction. For example, under specific combinations of vE and vν, the local gradient of the breakdown pressure response surface can increase considerably, and the asymmetry of the extreme-value region is further intensified. Under extreme anisotropic combinations (e.g., vE ≪ 1 or vE ≫ 1), the variation in vν may even lead to nonlinear responses or trend reversals, fully embodying the complex nonlinear behavior caused by parameter coupling. Therefore, in the drilling design for deep formations with complex in situ stresses and strongly anisotropic shale, the traditional isotropic assumption must be abandoned, and a refined mechanical model that integrates the dual anisotropy of elastic modulus and Poisson’s ratio must be established. Any single-parameter correction is insufficient to accurately characterize the true breakdown behavior of the wellbore. Only in this way can the prediction accuracy of breakdown pressure be effectively improved, the safe drilling fluid density window be optimized, and efficient and safe operations under complex formation conditions be ensured.
These results are consistent with and further extend previous anisotropic wellbore-stability studies. The dominant control of vE on breakdown pressure agrees with [3] and [5], who demonstrated that neglecting bedding-related elastic anisotropy can substantially bias failure and mud-weight predictions, and with [18] and [19], who linked elastic contrast to hoop-stress concentration and breakout evolution. Physically, a low Eh/Ev produces a stiff vertical direction that restrains axial deformation and amplifies tangential tension, whereas a high Eh/Ev enhances lateral expansion and releases near-wellbore hoop stress; this stiffness-controlled mechanism explains the non-monotonic vE trend and the peak at Eh/Ev = 0.3. The secondary but non-negligible role of vv is supported by anisotropic poroelastic solutions [10,12], in which directional Poisson effects modify lateral deformation compatibility and effective-stress redistribution without changing the first-order stress regime. The vE–vv synergy/antagonism and the resulting local minima in breakdown pressure versus deviation angle also echo reliability and trajectory-optimization studies [7,13,23,24], implying that single-parameter corrections may underestimate the worst-case breakdown pressure and narrow the safe mud-weight window. Therefore, the present model provides a more defensible basis for coupling vE and vv in trajectory and mud-density design; however, it remains limited to isothermal, chemically stable VTI elasticity with isotropic tensile strength, and future work should incorporate strength anisotropy, natural fractures, and THMC coupling [10,11].
4. Conclusions
Addressing the insufficient understanding of the influence mechanisms of elastic anisotropy on wellbore breakdown pressure in shale formations, this study systematically investigates the independent effects and coupling mechanisms of the elastic modulus anisotropy ratio and the Poisson’s ratio anisotropy ratio on breakdown pressure, based on transversely isotropic elasticity theory and the minimum principal stress fracture criterion. The main conclusions are as follows:
- (1)
- The elastic modulus anisotropy ratio vE = Eh/Ev is the dominant factor affecting wellbore breakdown pressure. As vE increases from 0.1 to 3, the breakdown pressure exhibits a non-monotonic evolution, first increasing and then decreasing, reaching a peak at Eh/Ev = 0.3. For vv = 0.1, 1, and 3, this peak remains at Eh/Ev = 0.3. Neglecting this anisotropy can cause prediction deviations much larger than those caused by vv.
- (2)
- The Poisson’s ratio anisotropy ratio vv = vh/vv plays a secondary role in influencing wellbore breakdown pressure. Under the condition of elastic modulus isotropy (vE = 1), when vv varies from 0.1 to 3, the breakdown pressure decreases from approximately 33.92 MPa to 33.68 MPa, i.e., by about 0.24 MPa or ∼0.7%, which is less than 10%. Nevertheless, Poisson’s ratio anisotropy modifies the deformation compatibility of the rock in three-dimensional space, causing a redistribution of effective stress and affecting the location and magnitude of the extremum of the minimum effective principal stress.
- (3)
- Significant synergistic or antagonistic coupling effects exist between the elastic modulus anisotropy and Poisson’s ratio anisotropy. For example, at vE = 1, vv = 2 (Figure 5), the breakdown pressure reaches about 46 MPa, whereas at vE = 1, vv = 0.5 (Figure 4), the upper breakdown-pressure range is about 44 MPa; at vE = 0.5, vv = 2 (Figure 3) and vE = 2, vv = 0.5 (Figure 6), the response surface shows stronger local gradients and asymmetry. Under extreme anisotropic conditions (vE ≪ 1 or vE ≫ 1), variations in vv may even lead to nonlinear responses or trend reversals.
- (4)
- Elastic anisotropy has an important impact on wellbore trajectory design. For deviation angles from 0° to 90°, the breakdown pressure varies approximately from 32 to 44 MPa (Figure 8), and the difference between the high-angle section and the vertical section widens with increasing anisotropy. Local minima or abrupt change points may appear within certain deviation angle intervals, narrowing the safe drilling fluid density window. By optimizing the deviation angle interval, the low-breakdown-pressure zone induced by anisotropy can be effectively avoided.
In summary, for the drilling design of deep, strongly anisotropic shale formations, the traditional isotropic assumption must be abandoned, and a refined mechanical model that integrates the dual anisotropy of elastic modulus and Poisson’s ratio should be established. This approach will effectively enhance the prediction accuracy of breakdown pressure and ensure efficient and safe operations under complex formation conditions.
Author Contributions
Conceptualization, Z.L.; methodology, J.Y. and T.W.; software, W.Q.; validation, X.L., Y.L. and G.W.; formal analysis, Y.L.; investigation, Z.L.; resources, J.Y. and T.W.; data curation, W.Q.; writing—original draft preparation, X.L. and G.W.; writing—review and editing, Y.L. and T.W.; visualization, Z.L.; supervision, J.Y.; project administration, W.Q. and G.W.; funding acquisition, X.L. All authors have read and agreed to the published version of the manuscript.
Funding
This work was supported by the Key Project “Research on Large-Scale Reserve Growth and Production Ramp-up and Exploration and Development Technologies for Marine Carbonate Oil and Gas” [of China National Petroleum Corporation/Sinopec/CNOOC], Subproject 5 “Research on Key Technologies for Well Engineering Acceleration and Production Enhancement in Ultra-Deep Tight Marine Carbonate Formations” (Grant No. 2023ZZ16-05).
Institutional Review Board Statement
Not applicable.
Informed Consent Statement
Not applicable.
Data Availability Statement
The data and materials used in this study are available upon request. Please contact lizheng2020@petrochina.com.cn to inquire about the availability of the data and materials, including any restrictions that may apply due to privacy or confidentiality concerns.
Acknowledgments
The authors would like to thank the editors and anonymous reviewers for their constructive comments and suggestions.
Conflicts of Interest
Zheng Li, Jian Yang, Wenlong Qi, Xiaofeng Lu, and Yafeng Lu were employed by PetroChina Southwest Oil and Gas Field Company. The remaining authors declare that the research was conducted in the absence of any commercial or financial relationships that could be construed as potential conflicts of interest.
References
- Wu, J.; Li, Q.; Li, Q.; Wang, F.; Cheng, Y.; Yan, C. Design and optimization of bottom-hole temperature–pressure combinations in gas production from gas hydrates via carbon dioxide replacement strategy. Energies 2026, 19, 3536. [Google Scholar] [CrossRef] [Scilit]
- Gao, X.; Wang, M.; Shi, X.; Dai, P.; Zhang, M.; Ramezanzadeh, A. Effect of anisotropy on wellbore stability based on transversely isotropic strength criteria in shale formation. Geophysics 2025, 90, D101–D110. [Google Scholar] [CrossRef] [Scilit]
- Zhang, Y.; Du, X.; Jiang, D. Evaluating water-induced wellbore instability in shale formations: A comparative analysis of transversely isotropic strength criteria. Front. Earth Sci. 2025, 13, 1550266. [Google Scholar] [CrossRef] [Scilit]
- Gao, X.; Wang, M.; Shi, X.; Dai, P.; Zhang, M. Wellbore stability research based on transversely isotropic strength criteria in shale formation. Soils Found. 2024, 64, 101541. [Google Scholar] [CrossRef] [Scilit]
- Lu, Y.; Li, W.; Jin, Y.; Chen, M.; Pang, H.; Zhou, W. Short- and long-term wellbore stability analysis for a horizontal well in a transversely isotropic poroelastic formation. Rock Mech. Rock Eng. 2025, 58, 767–786. [Google Scholar] [CrossRef] [Scilit]
- Qiu, Y.; Ma, T.; Liu, J.; Fadhel, A.M.; Peng, N.; Xu, H.; Ranjith, P.G. Thermal-hydro-mechanical coupled dual-medium model of inclined wellbore in fractured anisotropic formations. Geoenergy Sci. Eng. 2025, 249, 213782. [Google Scholar] [CrossRef] [Scilit]
- Abdi, H.A.; Alward, W. Wellbore stability analysis in laminated shaly formations through anisotropic geomechanics and advanced sonic measurements. In Proceedings of the GOTECH, Dubai, United Arab Emirates, 7–9 May 2024. Paper Number: SPE-219356-MS. [Google Scholar] [CrossRef] [Scilit]
- Ma, T.; Chen, P.; Yang, C.; Zhao, J. Wellbore stability analysis and well path optimization based on the breakout width model and Mogi–Coulomb criterion. J. Pet. Sci. Eng. 2015, 135, 678–701. [Google Scholar] [CrossRef] [Scilit]
- Jaeger, J.C. Shear failure of anistropic rocks. Geol. Mag. 1960, 97, 65–72. [Google Scholar] [CrossRef] [Scilit]
- Ding, L.; Wang, Z.; Wang, Y.; Liu, B. Thermo-poro-elastic analysis: The effects of anisotropic thermal and hydraulic conductivity on borehole stability in bedding formations. J. Pet. Sci. Eng. 2020, 190, 107051. [Google Scholar] [CrossRef] [Scilit]
- Li, Y.; Cheng, Y.; Yan, C.; Liu, L.; Tian, H.; Ren, W. Mechanical study on the wellbore stability of horizontal wells in natural gas hydrate reservoirs. J. Nat. Gas Sci. Eng. 2020, 79, 103359. [Google Scholar] [CrossRef] [Scilit]
- Do, D.-P.; Tran, N.-H.; Dang, H.-L.; Hoxha, D. Closed-form solution of stress state and stability analysis of wellbore in anisotropic permeable rocks. Int. J. Rock Mech. Min. Sci. 2019, 113, 11–23. [Google Scholar] [CrossRef] [Scilit]
- Ma, T.; Tang, T.; Chen, P.; Yang, C. Uncertainty evaluation of safe mud weight window utilizing the reliability assessment method. Energies 2019, 12, 942. [Google Scholar] [CrossRef] [Scilit]
- Huang, L.; Yu, Y.; Ren, G.; Meng, W.; Zheng, W. Probability of wellbore instability and parameter sensitivity analysis in open-hole testing. Oil Drill. Prod. Technol. 2023, 45, 143–150. [Google Scholar] [CrossRef]
- Setiawan, N.B.; Zimmerman, R.W. Wellbore breakout prediction in transversely isotropic rocks using true-triaxial failure criteria. Int. J. Rock Mech. Min. Sci. 2018, 112, 313–322. [Google Scholar] [CrossRef] [Scilit]
- Saeidi, O.; Rasouli, V.; Vaneghi, R.G.; Gholami, R.; Torabi, S.R. A modified failure criterion for transversely isotropic rocks. Geosci. Front. 2014, 5, 215–225. [Google Scholar] [CrossRef] [Scilit]
- Shi, X.; Zhuo, X.; Xiao, Y.; Guo, B.; Zhu, C.; Li, J. Wellbore stability in layered rocks: A comparative study of strength criteria. ASME J. Energy Resour. Technol. 2020, 142, 063006. [Google Scholar] [CrossRef] [Scilit]
- Dresen, G.; Stanchits, S.; Rybacki, E. Borehole breakout evolution through acoustic emission location analysis. Int. J. Rock Mech. Min. Sci. 2010, 47, 426–435. [Google Scholar] [CrossRef] [Scilit]
- Meier, T.; Rybacki, E.; Reinicke, A.; Dresen, G. Influence of borehole diameter on the formation of borehole breakouts in black shale. Int. J. Rock Mech. Min. Sci. 2013, 62, 74–85. [Google Scholar] [CrossRef] [Scilit]
- Zhao, X.; Wang, J.; Mei, Y. Analytical model of wellbore stability of fractured coal seam considering the effect of cleat filler. Appl. Sci. 2020, 10, 1169. [Google Scholar] [CrossRef] [Scilit]
- Ghalambor, A.; Asadi, M. A study of relevant parameters to predict sand production in gas wells. SPE Drill. Complet. 2002, 17, 88–99. [Google Scholar] [CrossRef] [Scilit]
- Zhang, L.; Cao, P.; Radha, K.C. Evaluation of rock strength criteria for wellbore stability analysis. Int. J. Rock Mech. Min. Sci. 2010, 47, 1304–1316. [Google Scholar] [CrossRef] [Scilit]
- Willson, S.M.; Edwards, S.T.; Crook, A.; Bere, A.; Moos, D.; Peska, P. Assuring stability in extended-reach wells: Analyses, practices, and mitigations. In Proceedings of the SPE/IADC Drilling Conference, Amsterdam, The Netherlands, 20–22 February 2007. [Google Scholar] [CrossRef]
- Kadyrov, T.; Tutuncu, A.N. Integrated wellbore stability analysis for well trajectory optimization and field development in the West Kazakhstan Field. In Proceedings of the 46th U.S. Rock Mechanics/Geomechanics Symposium, Chicago, IL, USA, 24–27 June 2012. [Google Scholar]
- Fuh, G.F.; Nozaki, M. Completion design using sand management approach based on sanding prediction analysis for HPHT gas wells. In Proceedings of the SPE Annual Technical Conference and Exhibition, Amsterdam, The Netherlands, 27–29 October 2014. [Google Scholar] [CrossRef] [Scilit]
- Abulsayen, A.; Enneamy, A.; Qiu, K.; Marsden, R.; Alexander, J.; Safdar, M. Sanding-Not as It First Appeared. In Proceedings of the International Oil & Gas Conference and Exhibition in China, Beijing, China, 5–7 December 2006. [Google Scholar] [CrossRef]
- Shen, X.; Hu, X.; Zheng, X.; Standifird, W. Integrated 3-D method for prediction of mud-weight window for subsalt well sections. In Proceedings of the SPE/IADC Drilling Conference and Exhibition, London, UK, 17–19 March 2015. [Google Scholar] [CrossRef] [Scilit]
- Xie, S.; Ren, Y.; Chen, Z. Establishment of a sand production prediction model for inclined casing perforated well. In Proceedings of the International Oil and Gas Conference and Exhibition in China, Beijing, China, 8–10 June 2010. [Google Scholar] [CrossRef]
- Li, Q.; Li, Y.; Cheng, Y.; Li, Q.; Wang, F.; Wei, J.; Liu, Y.; Zhang, C.; Song, B.; Yan, C.; et al. Numerical simulation of fracture reorientation during hydraulic fracturing in perforated horizontal well in shale reservoirs. Energy Sources Part A Recovery Util. Environ. Eff. 2018, 40, 1807–1813. [Google Scholar] [CrossRef] [Scilit]
- Li, Q.; Cheng, Y.; Zhang, H.; Yan, C.; Liu, Y. Simulating the effect of hydrate dissociation on wellhead stability during oil and gas development in deepwater. J. Ocean Univ. China 2018, 17, 35–45. [Google Scholar] [CrossRef] [Scilit]
Disclaimer/Publisher’s Note: The statements, opinions and data contained in all publications are solely those of the individual author(s) and contributor(s) and not of MDPI and/or the editor(s). MDPI and/or the editor(s) disclaim responsibility for any injury to people or property resulting from any ideas, methods, instructions or products referred to in the content. |
© 2026 by the authors. Licensee MDPI, Basel, Switzerland. This article is an open access article distributed under the terms and conditions of the Creative Commons Attribution (CC BY) license.