


Abstract
The integration of Lean and Agile manufacturing has gained increasing attention; however, empirical evidence remains limited regarding standardized implementation, safety integration, and applicability within resource-constrained mechanical workshops in developing economies. This study developed and empirically evaluated a customized Leagile manufacturing framework in an industrial mechanical workshop, assessing its impact on safety, quality, workflow efficiency, cost-effectiveness and overall business performance. The proposed framework integrates Lean and Agile principles through a structured deployment strategy, using 5S as the foundational enabler for restoring the workshop’s basic conditions and incorporating Reliability-Centered Maintenance (RCM), Single-Minute Exchange of Dies (SMED), and digital Kanban to support responsive, data-driven operations aligned with Industry 4.0. A quantitative approach was adopted, with performance evaluated using standardized KPIs covering safety, quality, workflow efficiency, and cost-effectiveness, monitored through real-time digital dashboards. Within the scope of this single workshop study, the Leagile integration was associated with improvements in effectively bridging the gap between operational performance and efficiency where demand alternates between stable and highly volatile requirements, enabling organizations to maintain cost efficiency while remaining responsive to rapid changes. Production quality improved to 91%, availability to 95%, and production achievement rate (as an indicator of performance) to 95%, collectively increasing Overall Equipment Effectiveness (OEE) from 51% to 82%. Safety compliance improved to 90% with injury-free operations. An increase in machine availability through RCM and improved effective utilization through SMED and resource utilization led to an increase in conformance to schedule and in turn enhanced business performance through higher throughput, leading to greater profitability and cost saving. The digital Kanban system eliminated communication delays and reduced maintenance-related disruptions, providing empirical evidence that a standardized, safety-centered Leagile framework delivers substantial performance gains in developing-economy mechanical workshops.
1. Introduction
Manufacturing organizations are increasingly required to deliver high-quality products at low cost while maintaining flexibility, safety, and rapid responsiveness to changing customer demands. In mechanical production environments, these requirements are further complicated by high product variability, complex workflows, equipment reliability constraints, and workforce safety considerations. Traditional manufacturing approaches often struggle to balance efficiency and adaptability, leading organizations to explore integrative operational frameworks that combine complementary paradigms. The integration of Lean and Agile manufacturing, referred to as Leagile manufacturing, has gained growing attention as a pathway to operational excellence and competitiveness [1].
Lean manufacturing emphasizes waste elimination, standardization, and flow optimization, while Agile manufacturing focuses on flexibility, responsiveness, and rapid adaptation to uncertainty. Their integration enables organizations to achieve cost efficiency without sacrificing responsiveness, particularly in dynamic production environments [2]. This integration is closely aligned with the principles of Industry 4.0, where digital technologies, real-time data, and intelligent systems support adaptive, data-driven manufacturing operations [3]. Despite the theoretical promise of Leagile systems, three key gaps in the Leagile manufacturing literature have been identified. First, most Leagile implementations have been reported in high-income countries, leaving little evidence from developing and resource-constrained environments. While safety is often treated as a secondary or compliance-related outcome in Leagile studies, this research considers it a core performance measure alongside quality, workflow efficiency, and cost-effectiveness. Safety is assessed directly using a dedicated scoring system before and after implementation. Finally, the lack of standardized performance metrics has made comparisons across studies difficult. To address this, the present study applies a consistent KPI framework, including first-pass yield (FYP), availability, performance, and Overall Equipment Effectiveness (OEE), using the same measurement methods before and after implementation to ensure reliable comparison of results. The proposed framework when positioned against recent Leagile implementation models clarifies its distinguishing features.
A study by [4], developed and validated a Lean 4.0 implementation framework in a sugar company, identifying synergy elements and critical success factors for integrating Industry 4.0 with Lean practices. This case, like most Lean 4.0 literature, does not treat safety as a co-equal outcome measure. In a study to review metrics and develop a framework for measuring the Leagile supply chain, [5], proposed a framework for measuring Leagile performance by combining Lean and Agile indicators. However, this framework remains conceptual and supply-chain-level, without empirical validation at the individual workshop level. Ref. [6] provides a broad literature survey of Lean, Agile and Leagile tool adoption but offer no original empirical validation. In contrast, the framework developed in this study combines empirical pre/post validation, a developing-economy mechanical workshop setting, safety treated as a co-equal measured KPI rather than a secondary outcome, and real-time digital integration through dashboards and a digital Kanban system, a combination not present as a complete set in any of the models reviewed above.
Safety, quality, workflow and cost efficiency form the core pillars of effective mechanical production systems and are deeply interdependent. Safety remains the foremost priority, encompassing human well-being, machine integrity, and environmental protection [7]. Inadequate safety practices can result in injuries, equipment damage, and production disruptions, undermining both productivity and profitability [8]. Effective safety management therefore requires not only formal procedures but also workforce awareness, compliance, and a strong safety culture, which has been shown to enhance operational reliability, product quality and employee morale [9].
The adoption of structured quality standards and condition-based monitoring enables early detection of deviations, tool wear, and equipment anomalies, thereby reducing downtime and improving process reliability [10].
Well-organized workflows act as the integrating mechanism between safety and quality. Standardized and clearly defined workflows reduce delays, eliminate redundant activities, and optimize resource allocation, leading to improved productivity without compromising safety or quality standards [11]. Research highlights that the use of standard operating procedures (SOPs) and parallel task execution enhances consistency [6], supports compliance and facilitates effective workforce training in manufacturing settings.
Within Lean manufacturing, 5S is widely recognized as a foundational enabler for sustainable improvement. By promoting organization, cleanliness, and discipline, 5S establishes baseline conditions that support higher-level Lean and Agile practices [12]. Empirical evidence shows that early adoption of 5S reduces waste, improves layout efficiency, enhances safety, and lowers operational costs by minimizing unnecessary motion and search time [13].
Strong safety cultures and standardized processes not only reduce incident rates but also deliver financial benefits through lower downtime, absenteeism, and incident-related costs [14]. To support scalability and agility, this study also draws on principles from the Scaled Agile Framework (SAFe), which has been increasingly adapted for manufacturing to enable flow-based delivery, decentralized decision-making, and cross-functional collaboration through synchronized planning and Kanban systems [15].
The present study was conducted in a modern mechanical manufacturing workshop located in Johannesburg, South Africa, equipped with advanced CNC machining technologies including a Computerized Numerical Control lathe (Goodway GLS 2800), JohnFord milling machine and automated horizontal cutter, characterized by high product variability and batch production. Despite its technological capabilities, the workshop faces persistent challenges, including inconsistent quality, frequent equipment breakdowns, inefficient workflows, limited digital performance monitoring, and high levels of production waste. These issues result in increased costs, rework, delivery delays, and reduced customer confidence, highlighting the need for an integrated operational framework capable of addressing both technical and human factors.
Against this backdrop, the objective of this study is to evaluate the effectiveness of an integrated Lean–Agile (Leagile) framework in improving safety, quality, workflow efficiency, operational performance, and cost-effectiveness within a mechanical manufacturing workshop. It employed a quantitative research approach, utilizing production records, maintenance data, OEE evaluation, 5S audit results, and observational performance indicators to assess pre- and post-implementation performance. By empirically examining the interdependencies between key performance indicators and the impact of structured Lean–Agile integration, this research addresses a critical gap in the literature and provides practical guidance for mechanical production environments seeking sustainable operational excellence.
2. Literature Review
Lean manufacturing is founded on the systematic application of interdependent tools aimed at waste elimination, cost reduction, and process stabilization. Its effectiveness depends on coordinated implementation, as illustrated by the strong interrelationship between Total Productive Maintenance (TPM) and Overall Equipment Effectiveness (OEE), where poor maintenance execution directly undermines equipment performance [16]. While Lean manufacturing excels in efficiency and cost control, it has been criticized for limited responsiveness in volatile markets. Agile manufacturing emerged to address this limitation by prioritizing flexibility, speed, and responsiveness, yet it often lacks the cost discipline inherent in Lean systems. These complementary strengths and weaknesses have led to the development of the Lean–Agile paradigm, which integrates efficiency with adaptability [17].
Recent literature emphasizes that Leagile manufacturing is increasingly enabled by Industry 4.0 technologies. Ref. [2], identified a bidirectional relationship between Lean manufacturing, Agile manufacturing, and Industry 4.0, demonstrating that Lean manufacturing facilitates digital adoption while digital technologies strengthen both Lean efficiency and Agile flexibility. Similarly, ref. [18], highlighted three dominant perspectives in the literature—Lean Six Sigma (LSS) as a foundation for Industry 4.0, Industry 4.0 as an enabler of LSS, and their complementary coexistence—although further empirical validation remains necessary. Empirical studies on Leagile tool adoption indicate that Just-in-Time (JIT), Total Quality Management (TQM), and TPM remain the most widely applied tools, while practices such as Poka-Yoke and rapid prototyping are less frequently adopted, particularly in developing economies [6].
Strategic alignment plays a significant role in Leagile success. Ref. [19], found that cost–leadership strategies promote Lean and Agile adoption. Empirical case studies further demonstrate measurable performance improvements from Lean tools such as Value Stream Mapping (VSM), including reductions in cycle time and lead time exceeding 50% in low-technology manufacturing environments [20]. Comparable findings were reported in OEM case studies in Africa, where Lean Production System (LPS) implementations yielded improved quality, reduced waste, and increased profitability.
Researchers [4] developed and validated a Lean 4.0 implementation framework in a sugar company, identifying synergy elements and critical success factors for integrating Industry 4.0 with Lean practices. Globally, safety culture research emphasizes leadership commitment, learning from near-misses, and behavioral change rather than punitive enforcement [21]. However, persistent challenges remain in manufacturing workshops, particularly regarding machinery hazards, chemical exposure, and inconsistent compliance, as highlighted by major industrial incidents in South Africa.
Industry 4.0 technologies are increasingly integrated into safety management through smart sensors, wearable devices, and AI-based vision systems that monitor ergonomics, PPE compliance, and fatigue [22]. These technologies support a transition toward predictive safety systems that reduce human–machine interaction risks and align with zero-harm objectives. SMEs continue to face barriers related to training quality and maintenance practices [23].
Quality management has similarly evolved through the integration of Lean Six Sigma and Industry 4.0. Studies indicate that combining DMAIC methodologies with IoT-based monitoring improves defect detection and sigma-level performance in sectors such as automotive and medical device manufacturing [24].
Integrated frameworks such as Safety–Quality–Stewardship (SQS), supported by Kaizen and PDCA tools, demonstrate the benefits of simultaneously addressing safety, quality, and operational discipline. Case studies show rapid improvements in housekeeping, defect reduction, and safety compliance following implementation, reinforcing the value of integrated rather than siloed initiatives [25].
Workflow optimization is a central outcome of Leagile implementation. South African SMEs increasingly adopt hybrid production models that combine Lean tools with selective automation, such as sensors, AGVs, and ERP systems, resulting in reduced lead times and fewer manual errors [26]. Globally, IIoT-enabled “lighthouse” factories demonstrate throughput improvements of 10–30% through real-time bottleneck identification and adaptive scheduling [27].
Cost-effectiveness has been reinforced by both macro-economic factors and technological adoption. Declining production costs in South Africa during 2024 enabled reinvestment in process optimization and digitalization, improving operational sustainability [28]. Empirical studies confirm that IoT-enabled smart manufacturing reduces material waste, downtime, and unit costs through real-time analytics and predictive maintenance [29]. Globally, hybrid Lean Industry 4.0 models enable mass customization with minimal cost penalties, although SMEs continue to face financial and infrastructural constraints.
The reviewed literature demonstrates that Leagile manufacturing, particularly when integrated with Industry 4.0 technologies, delivers measurable improvements in cost efficiency, workflow performance, quality, and safety. Lean manufacturing provides operational stability and waste reduction, while Agile manufacturing enhances responsiveness and flexibility. However, empirical evidence from developing economies remains limited, especially at the mechanical workshop level. Challenges related to SME adoption, workforce skills, standardized performance metrics, and safety integration persist. These gaps underscore the need for context-specific, empirically validated Leagile frameworks tailored to resource-constrained manufacturing environments.
3. Methodology
This study adopted an applied, intervention-based research methodology to design, implement, and evaluate a Lean–Agile transformation within a mechanical manufacturing workshop. The methodology followed a structured yet adaptive approach that balanced Lean efficiency principles with Agile responsiveness while embedding continuous improvement as a core operational philosophy. The overall implementation was guided by the Plan–Do–Check–Act (PDCA) cycle (Table 1) to ensure systematic execution, iterative refinement, and long-term sustainability.
Table 1.
PDCA visualization.
The process commenced with a comprehensive diagnostic assessment of the workshop to establish a baseline understanding of existing conditions. This assessment focused on layout configuration, workflow efficiency, safety performance, equipment condition, and organizational readiness for change. Both physical infrastructure and human factors were evaluated to identify sources of waste, operational bottlenecks, safety risks, and demand-driven variability. Concurrently, the organization’s digital maturity and workforce willingness to adopt new practices were assessed to ensure feasibility and alignment with transformation objectives.
Following the assessment phase, clear implementation objectives and measurable key performance indicators (KPIs) were defined. These KPIs covered four primary dimensions aligned with the study aims: safety, quality, workflow efficiency, and cost-effectiveness. Establishing these metrics at the outset enabled objective evaluation of post-implementation performance and ensured that improvements could be quantitatively attributed to the Leagile intervention. OEE, which measures the percentage of productive time, was considered a major indicator, and all its essential elements, i.e., quality, availability, and performance, were included. Quality measures product yield by tracking the percentage of good, defect-free units produced out of the total count. To obtain the quality value, scraps and reworks were eliminated from the total quantity of products actually produced. Availability measures uptime by comparing actual operating time to planned production time (accounting for breakdowns and setups). But due to equipment unavailability, only downtime was considered to evaluate availability. Performance measures speed efficiency by assessing how fast the equipment runs compared to its designed maximum speed (accounting for minor stops and slow cycles). In the absence of line speed data, the performance was evaluated in terms of ‘Production Achievement Rate’ computed by dividing actual production (also eliminating defect-free products) by targeted production.
A foundational step in the methodology was the application or enhancement of the 5S system across the workshop. This step was critical in stabilizing operations by creating a clean, organized, and standardized working environment. The improved workplace visibility enabled unbiased observation of processes, facilitated accurate data collection, and supported effective identification of improvement opportunities before introducing more advanced Lean, Agile, or digital interventions.
Once operational stability was achieved, workshop functions were segmented based on their sensitivity to demand variability. Processes characterized by stable, forecast-driven demand were optimized using Lean practices to improve efficiency, reduce waste, and standardize operations. In contrast, functions exposed to fluctuating customer demand or high product variability were managed using Agile principles to enhance flexibility, responsiveness, and rapid decision-making. These approaches were unified through an integrative Leagile framework that incorporated strategically defined decoupling points to balance efficiency with responsiveness and reduce operational risk.
Digital technologies were selectively introduced to support real-time monitoring, coordination, and decision-making without requiring full-scale automation. Tools such as digital Kanban systems, sensor-based monitoring, and performance dashboards were implemented to enable visibility across workflows, track KPIs continuously, and support rapid corrective action. These technologies reinforced both Lean discipline and Agile adaptability while remaining accessible to a resource-constrained workshop environment.
Employee onboarding and training formed a critical enabler of the methodology. Targeted training sessions were based on employees’ specific roles and focused on helping them understand and apply the new Leagile practices aligned with their role. The training covered 5S workplace organization; autonomous maintenance activities such as cleaning, lubrication, and testing; safety requirements, SMED changeover techniques; digital Kanban usage for all; and standard operating procedures. This helped employees understand not only what changes were being introduced, but also their role in maintaining and sustaining the improvements.
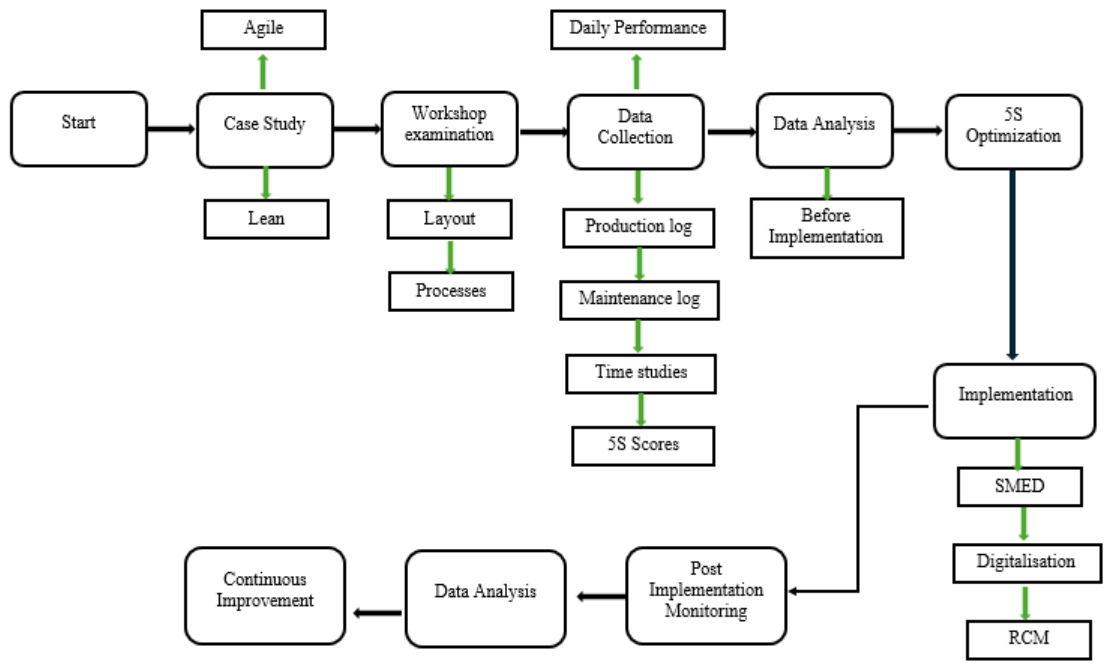
Training was structured to minimize production disruption and promote ownership, engagement, and compliance. Safety was treated as a non-negotiable priority throughout implementation, with daily safety rules, audits, and behavioral reinforcement embedded across all stages of the transformation. Figure 1 outlines the sequence from the start all the way to post-implementation and continuous improvement.
Figure 1.
Methodology and sequence of steps followed in the present work.
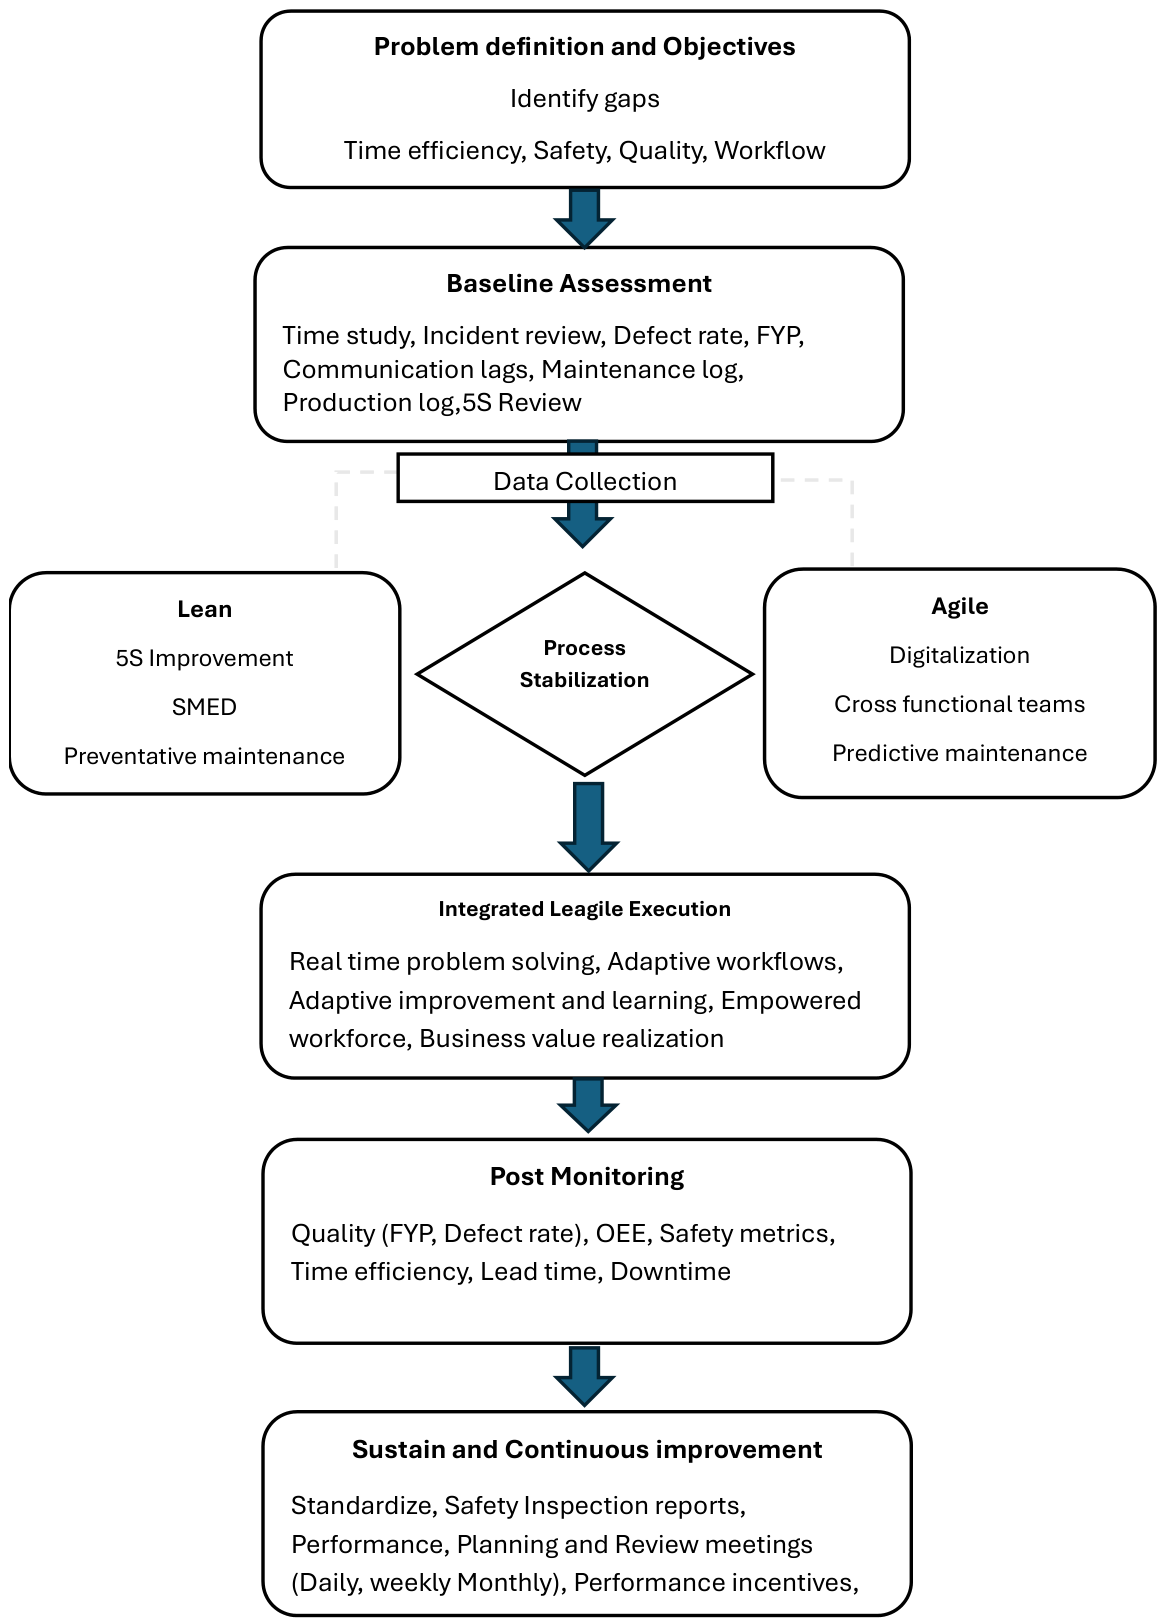
The full deployment phase shown in Figure 2 involved executing the integrated Leagile strategy across the production system, including standardized work procedures, digital tools, and revised operational practices. Performance was continuously monitored using defined KPIs, safety audits, quality checks, and employee feedback mechanisms. Data collected during this phase informed iterative adjustments and supported evidence-based decision-making.
Figure 2.
Leagile deployment overview model.
Post-implementation activities focused on sustaining and improving gains achieved through the transformation. Successful practices were standardized, while underperforming processes were refined using continuous improvement and Kaizen principles. Digital dashboards and structured feedback loops ensured ongoing learning and responsiveness to emerging issues. The methodology also emphasized scalability, encouraging evaluation of opportunities to extend the Leagile model to additional operational areas to maximize organizational impact.
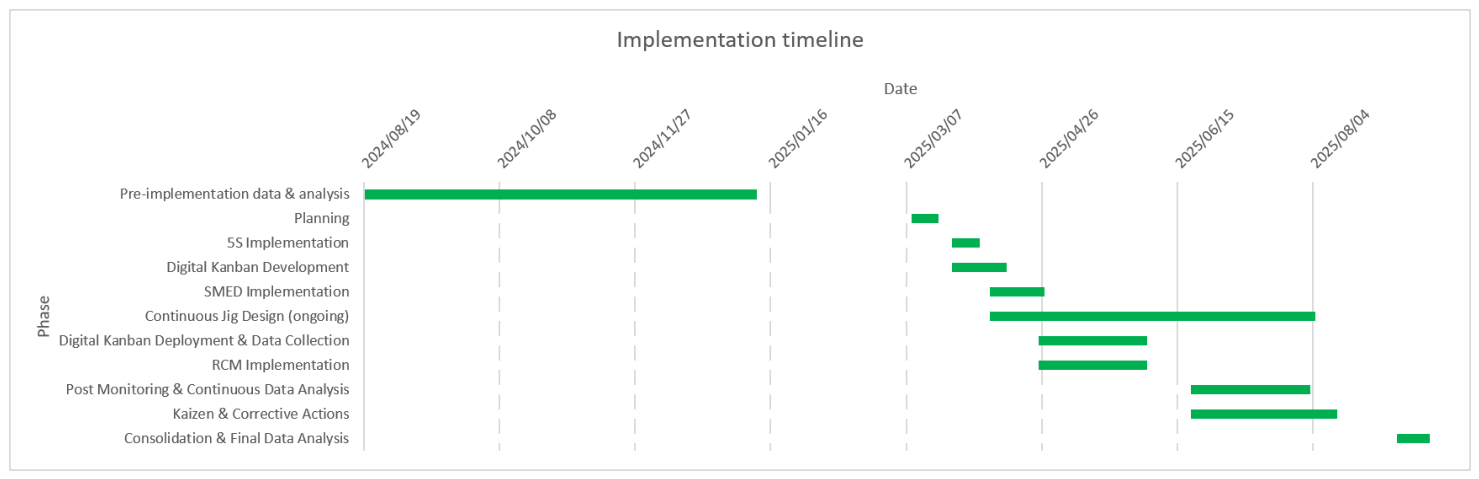
Overall, this methodology enabled a controlled yet flexible Leagile transformation, integrating Lean stability with Agile responsiveness and digital support. The PDCA-driven approach ensured that improvements were not only achieved but embedded into daily operations, establishing a resilient, data-informed, and continuously improving manufacturing system. The implementation timeline is summarized in Table 2 and Figure 3.
Table 2.
Details of implementation timeline.
Figure 3.
Implementation timeline.
Table 3 shows all available routine production records; the pre-implementation (145 days) and post-implementation (133 days) periods were included, and no sampling was performed. The dataset comprised production job cards, machine logs, quality inspection records, safety reports and cost records. KPI data were aggregated at workshop level, with safety measured from daily records, quality from unit inspections, workflow efficiency from production orders, and production effectiveness from daily production data. Data consistency was verified through cross-checking production quantities, machine utilization records and quality reports.
Table 3.
Production data used for observations.
4. Results and Discussion
Throughout the implementation period, potential external influences were actively managed to ensure that the observed performance improvements were linked to the changes implemented in the mechanical workshop. Factors such as product mix were managed through coordinated machine availability planning. For example, the milling and turning operations were scheduled concurrently so that when a milling machine was engaged, a lathe was simultaneously processing a different product; this sequencing minimized clashes as parts moved between machines and prevented avoidable machine idling. The complexity of jobs produced post-implementation was also compared against that of jobs completed prior to implementation to reduce bias in the results. The jobs carried out remained largely consistent across both periods, with the primary difference being the improved ways of working introduced during implementation rather than a shift toward simpler or less demanding jobs. Fluctuations in production volume were managed by evaluating performance relative to output levels, ensuring that improvement assessments were not skewed by changes in throughput. Workforce composition remained unchanged throughout the implementation period and providing standardized training in Leagile principles, supplemented by additional training tailored to individual skill levels and operational areas. The availability of maintenance resources, including spare parts and change parts, was monitored and regulated relative to both actual and planned production volumes to prevent shortages that could otherwise have affected outcomes independently of the implemented changes. In essence, everything about the workshop was kept the same except the implemented changes to ensure that changes measured were from Leagile implementations. Because the interventions were implemented as an integrated Leagile package, the independent contribution of each intervention could not be isolated or quantified. Therefore, the roles of 5S, RCM, SMED, digital Kanban, and Kaizen should be interpreted as qualitative explanations of the observed improvements rather than as individually verified causal effects.
4.1. Pre-Implementation Results
The study investigated the initial performance parameters with the workshop before the implementation of Leagile manufacturing, and the results are as follows.
4.1.1. Quality Analysis
Quality performance in the manufacturing workshop was evaluated using daily production records of manufactured components. The assessment was based on key quality indicators, including scrap classification, identification of machines and operations associated with elevated defect rates, and computation of an overall quality performance index. This quality analysis formed a core KPI for evaluating the effectiveness of the study.
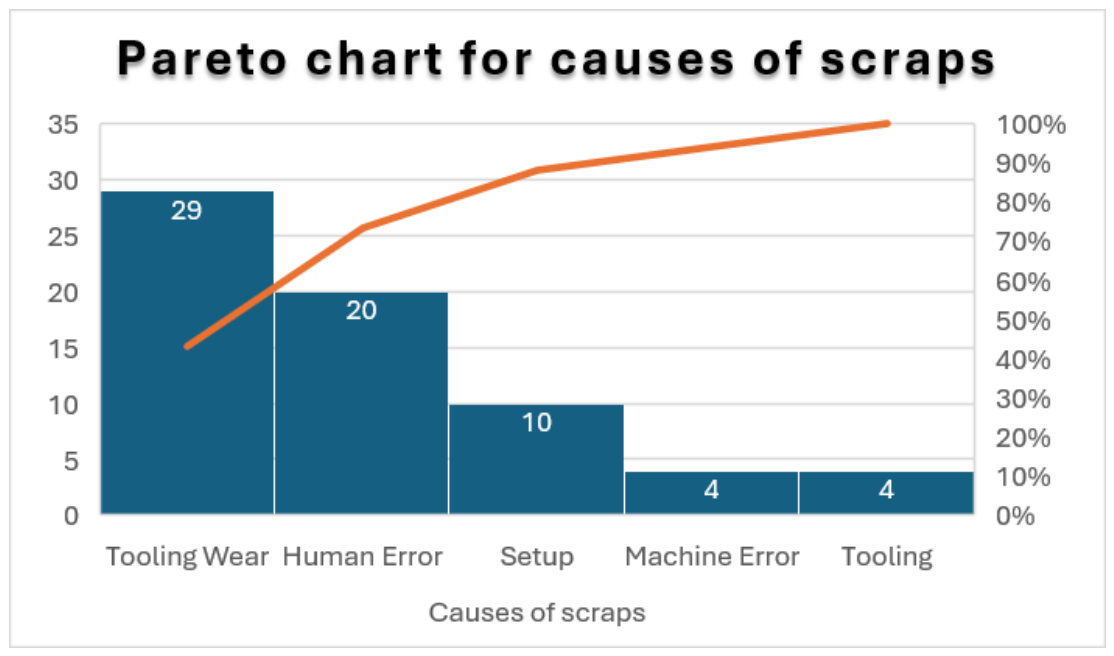
Pareto analysis shown in Figure 4 revealed that tool wear and tooling errors were the dominant contributors to scrap generation, indicating that addressing these two factors could eliminate approximately 80% of quality-related losses. Further investigation showed that several minor scrap categories were indirectly linked to tool wear mechanisms. Inaccurate machine setup was found to accelerate tool degradation and increase the risk of equipment damage, while incorrect tool selection resulted in premature wear and higher defect rates.
Figure 4.
Pareto analysis for scrap causes.
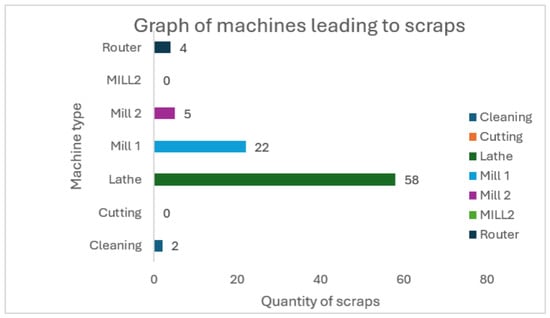
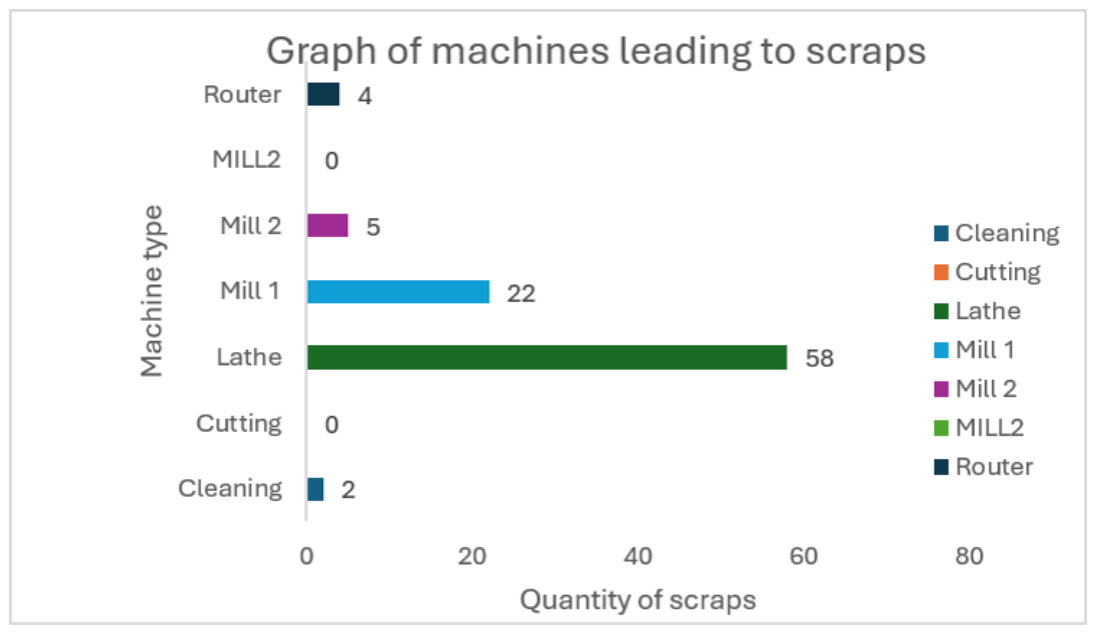
Further analysis as depicted in Figure 5 indicated that the lathe accounted for the highest defect rate, contributing to over 65% of the total recorded scrap across all machines. This outcome is largely attributable to the lathe being predominantly used for initial machining operations, where material condition and setup accuracy have a significant influence on downstream quality. Inadequate material handling or incorrect setup parameters at this stage resulted in elevated scrap volumes and accelerated tool wear. Compared with other machines, the lathe’s operating parameters offer greater opportunities for adjustment and optimization using process data, enabling targeted interventions to reduce defect generation.
Figure 5.
Graph of machines responsible for scrap quantities.
Table 4 shows the operations associated with elevated scrap rates, clearly indicating that initial operations generate the highest proportion of scrap. This finding aligns with the machine-based scrap analysis discussed earlier, which showed that most first-stage operations are performed on the lathe. Machines constitute sequential stages within the machining process, where components progress from initial material removal through successive operations to final finishing and cleaning, with each machine performing a specific function within the overall production sequence.
Table 4.
Count of machines leading to scraps.
The overall production quality is 86% as calculated from parameters in Table 5 using the total parts produced against the total number of products that passed the first-pass yield (FYP) where the reworks and scraps were eliminated.
Table 5.
Overall quality matrix.
- Total quantity, i.e., total number of units produced—4195.
- Total scraps, i.e., total number of defective units discarded and unrecoverable—91.
- Total reworks, i.e., total number of units requiring rework to meet quality specifications—499.
4.1.2. Availability Calculations
The important data is presented in Table 6. The calculated availability rate was 72% with the focus only on downtime because of equipment unavailability.
Table 6.
Availability data.
Availability is calculated in terms of production time before implementation:
This sparked huge concern in terms of equipment maintenance and calibration, with 28% of scheduled maintenance and calibration being lost out of 6.42 h. This means that an average of 3.38 h out of a possible 8 h shift was lost, including planned downtime. A lower availability of workforce signals a machine that is not operating under basic conditions. Table 6 shows a breakdown of how time was spent throughout the period in analysis.
4.1.3. Performance Calculations
As line speed data of the machining lines were unavailable, the traditional OEE ‘Performance’ component was replaced by a ‘Production Achievement Rate’ component, calculated as actual good (defect-free) production divided by target production. As the data on Table 6 and Table 7 visually shows, the team failed to produce the desired target within the planned time. This occurred in the majority of the manufacturing projects. Issues such as long planned downtime and frequent breakdown, leading to more downtime, led to this result. Another issue to note was a lack of quality, low first-pass yield and improper workflow and access to information and cross-functional communication, leading to misalignments between the manufacturing and design teams and resulting in delays in operations.
Table 7.
Parameters for pre-implementation production achievement rate.
Production achievement rate was calculated as
OEE = 86%×72%×83%=51.39%
≈51%
≈51%
A desirable OEE is 85%+, while the manufacturing average is between 60 and 65%. The workshop only reaches 50% of its potential, which is not a positive statistic. The root cause of this was identified as downtime and time inefficiencies, which is what inspired the implementation of RCM and SMED in this workshop.
This root cause directly shaped the design of the RCM and SMED interventions. RCM was deployed through two complementary strategies. First, a preventive maintenance strategy was established as autonomous, operator-led routine maintenance following a fixed daily sequence, Clean, Inspect, Lubricate, chosen specifically because it required no external servicing cost and integrated directly into existing shift routines. A predictive maintenance approach was layered, combining weekly maintenance audits with real-time machine data such as pressure, temperature, and power consumption to identify potential issues before they resulted in equipment failure. Instead of responding to breakdowns after they occurred, maintenance activities could be planned and carried out proactively, minimizing unexpected downtime. Together, these initiatives transformed the workshop from a reactive maintenance environment to a proactive one, directly addressing the root causes of downtime and improving equipment reliability. The RCM implementation followed four key steps: (1) identification of critical machines using downtime records, (2) operator-led autonomous maintenance consisting of routine cleaning, lubrication, and testing, (3) condition-based monitoring to detect wear, leaks, and abnormal operating conditions with reference to OEM standards, and (4) proactive maintenance interventions before equipment failure occurred.
SMED was implemented to address the time-inefficiency component, targeting the changeover process specifically. Changeovers were redesigned around purpose-built jigs that externalized internal (machine-stopped) setup steps into external (machine-running) steps: a nylon jig fitted with spoil boards protected tooling from damage during over-travel and enabled a single setup to produce 18 units per cycle in place of the prior single-item cycle, while a matching engraved locating pattern allowed the workpiece to be positioned and reused without realignment. Both solutions eliminated the dimensional drift caused by the original manual setup method loosening over repeated cycles, addressing the low-first-pass-yield and late-delivery effects noted as consequences of the original process. For SMED deployment three steps were followed: (1) Setup processes were analyzed to identify opportunities to reduce machine stoppages through external setup. (2) Multi-purpose jigs and fixtures were designed based on frequently produced parts and were designed to accommodate different components. (3) Standardized setup procedures were ensured for consistency among operators.
4.1.4. Safety Performance
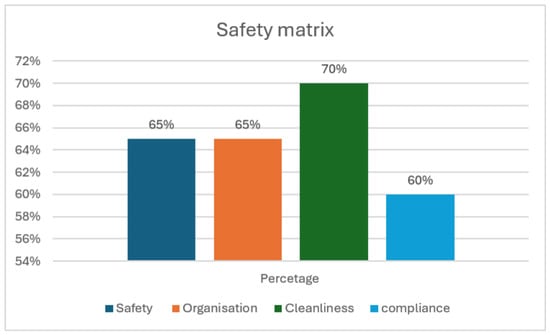
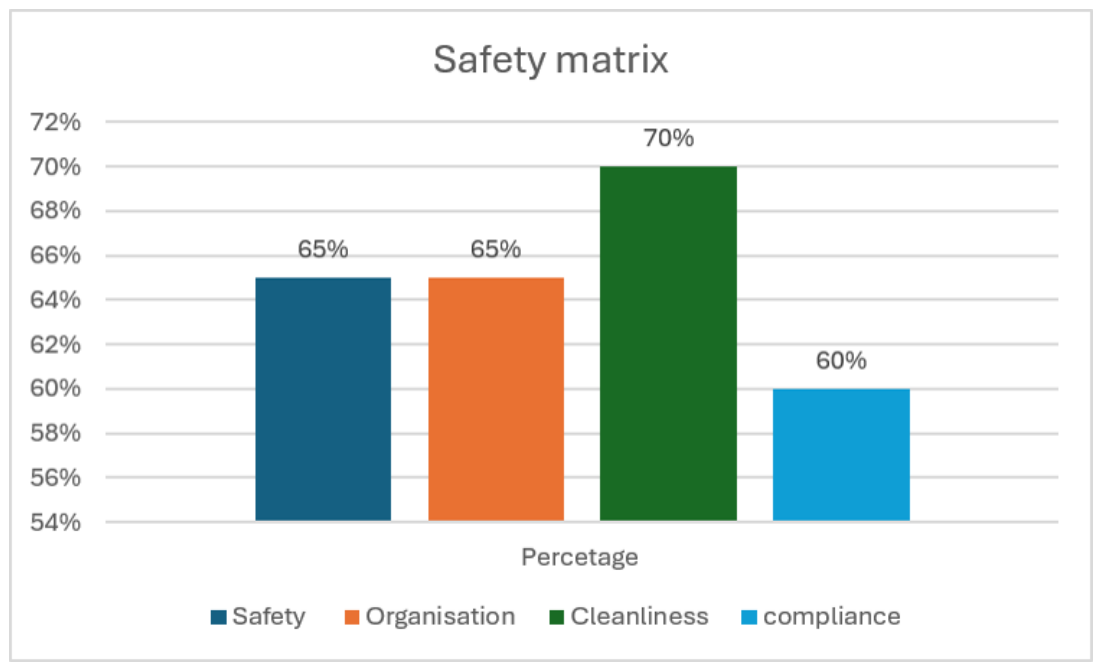
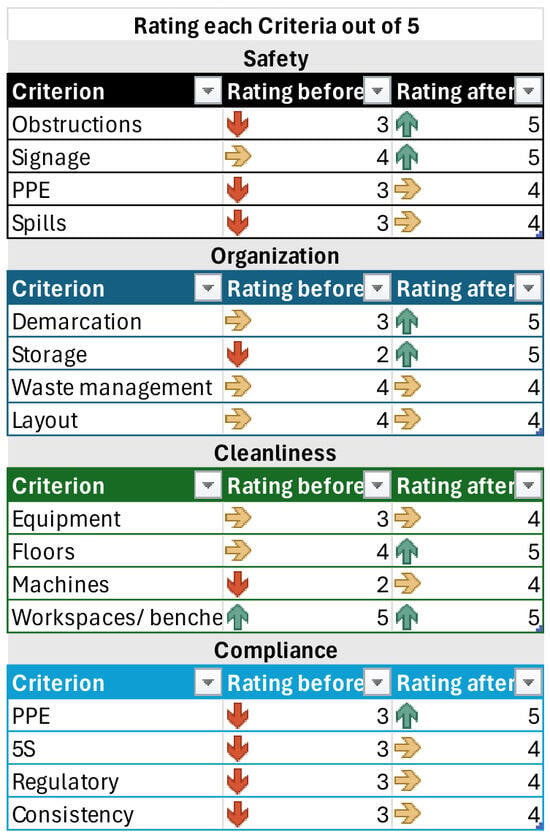
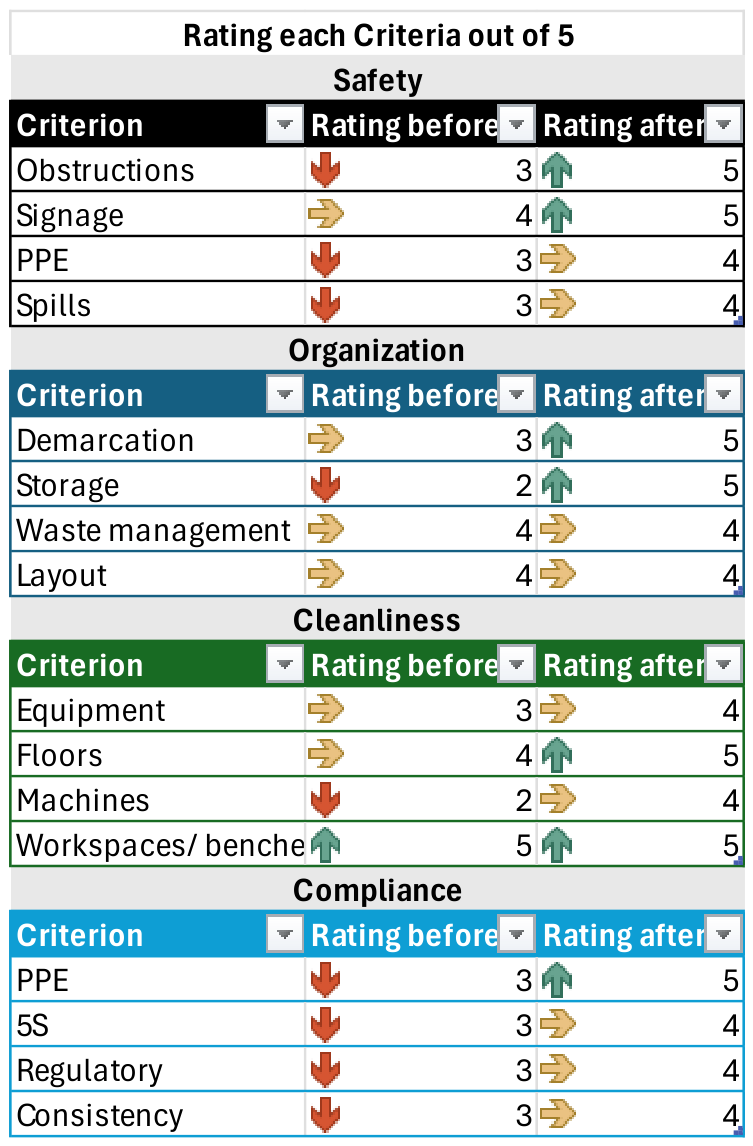
Overall safety was scored through the matrix shown in Table 8 and is summarized in Figure 6; a state to note is “spills”, which is caused by frequent machinery leakages. The lack of awareness and motivation from the workforce leads to ignorance of such problems. Further investigations showed that these issues are only reported through word of mouth, and the employees do not follow up through formal channels. This prompted a need for an Agile response and mode of communication to ensure transparency, accountability and results. PPE compliance is also a result of workforce negligence, as signage and training were ensured during onboarding.
Table 8.
Safety performance analysis parameters.
Figure 6.
Safety rating matrices.
Workshop organization is hindered by outdated and unclear demarcation, with mixed storage of materials and products; the layout largely suits existing assets but is strained by newly introduced machinery. Cleanliness practices are inconsistent, with poor post-operation equipment cleaning creating safety risks, particularly around rotating machinery, despite generally clean floors. Metallic debris and fluid leakages remain recurring hazards, although individual workbench ownership promotes localized accountability. Overall compliance is moderate and primarily influenced by organizational culture, training effectiveness, and employee engagement. Safety was scored through an audit score which was based on a checklist for each category. Safety, organization, cleanliness and compliance each had a checklist to score them under, and the total combined would make the score for those categories. For example, cleanliness is scored based on equipment cleanliness, floor cleanliness, workbenches cleanliness and machine cleanliness, each rated out of 5, and the total is summed up.
4.1.5. Business (Efficiency and Effectiveness)
This section analyzes the impacts of effectiveness and efficiency, including time effectiveness, on growth and sustaining the business. Business growth in this study is measured based on client satisfaction and retention, which are factors driven by parameters such as on time delivery, rapid response to changes and quality delivered to customers. Table 9 depicts a breakdown analysis carried out on time effectiveness. Time efficiency is proportional to cost efficiency.
Table 9.
Time effectiveness scores.
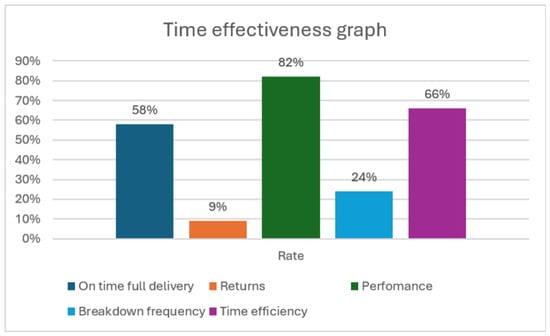
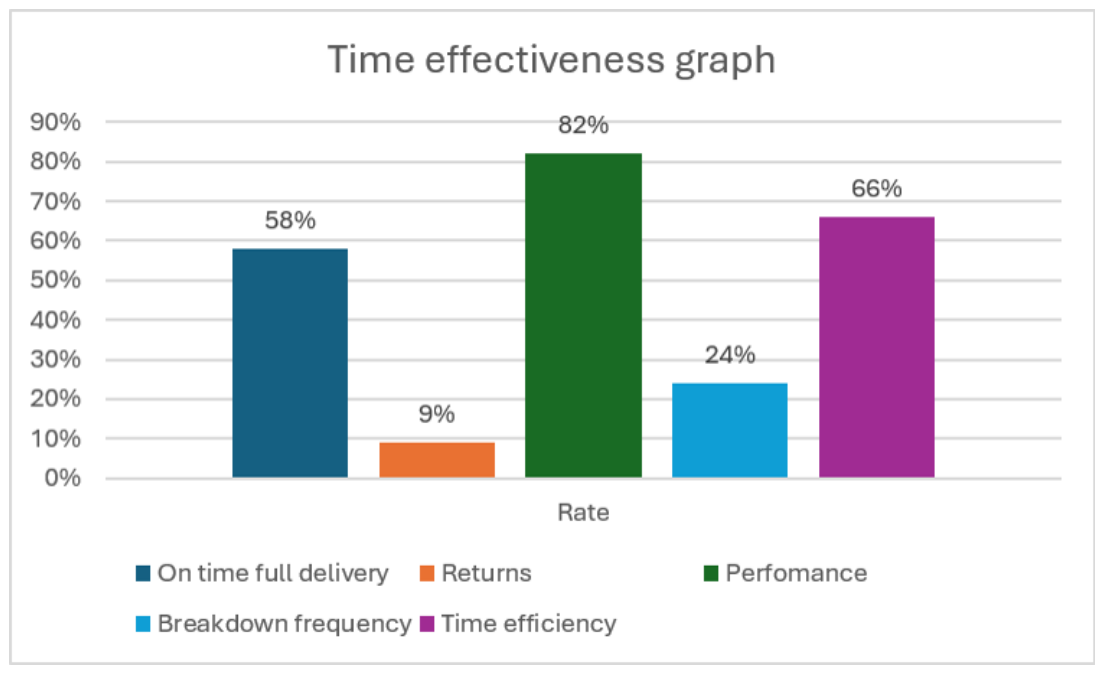
Figure 7 shows the average effective time utilization within the workshop. This raised concern from the business and operation perspective as less time is spent on operations, which contributes to low time delivery rate. The on-time full delivery rate is 58%, which forces errors when employees are under pressure.
Figure 7.
Time effectiveness graph.
A major factor in effective use of time was operational setup methods. Prior to implementation, a dedicated jig had to be assembled and reinforced for each new job and production cycle. This increased setup times, left machines idle for longer periods and required additional operator effort, making it difficult to respond quickly to changing production needs.
4.2. Post-Implementation Results
4.2.1. Quality
The data in Table 10 shows a substantial overall decrease of 90%. A key contributor to this improvement was regular inspections of the condition of machinery and equipment for tools and bearing wear, which helped prevent defects linked to equipment issues. Additionally, effective research and development, proper setup and adherence to standard operating procedures played a vital role.
Table 10.
Overall quality results in machining after implementation.
Overall quality calculations were performed and are visualized in Figure 8, comparing machine scraps pre- and post-implementation.
Figure 8.
Analysis of scrap causes pre- and post-implementation.
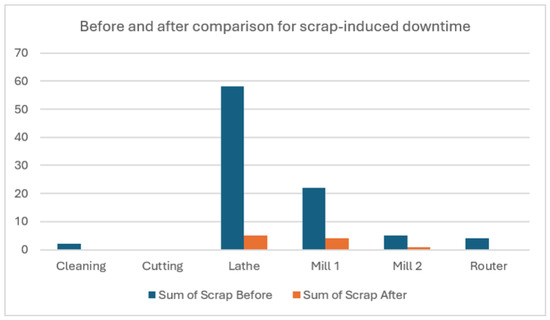
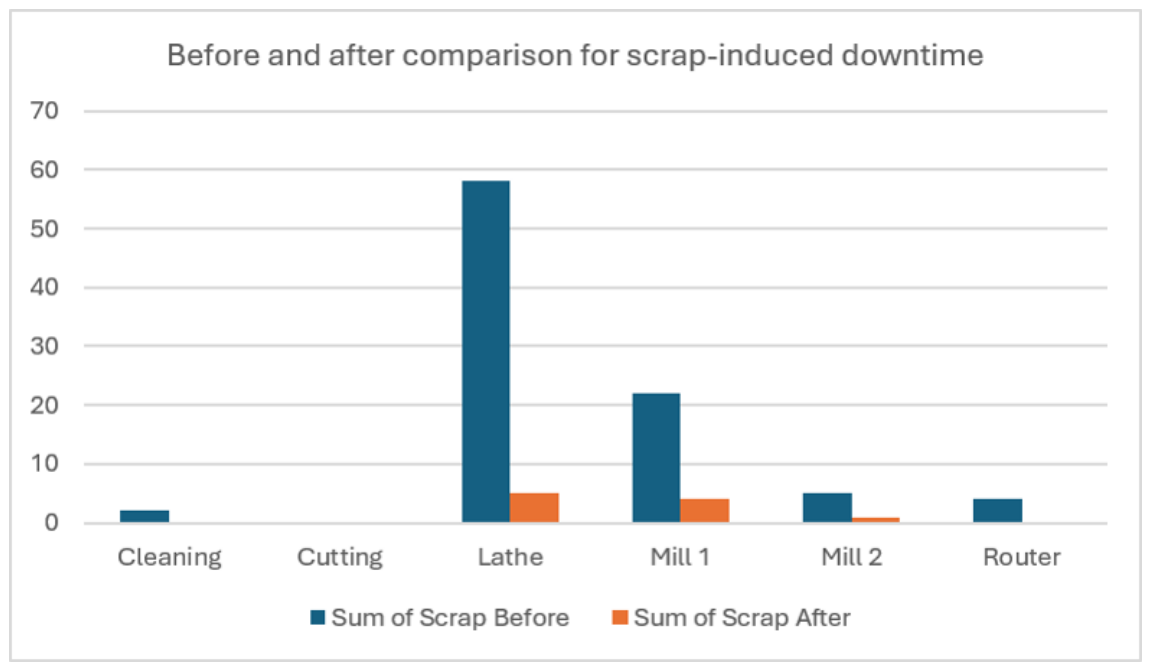
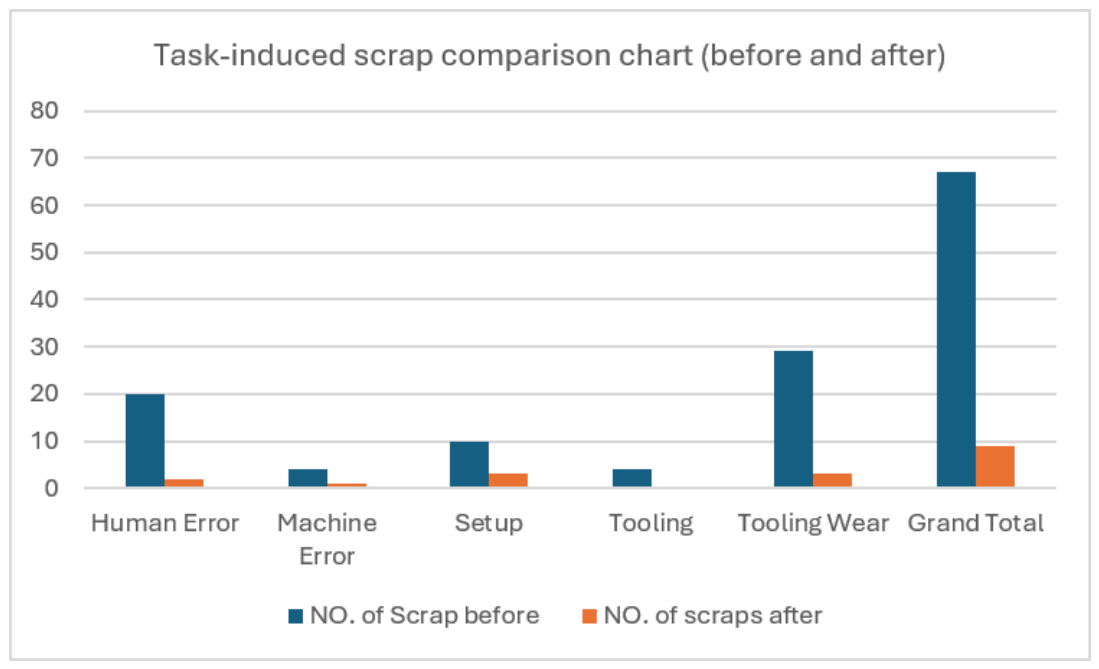
The preventative maintenance and quality audits contributed to an overall reduction in scraps induced by tool wear, while SOPs and streamlining of workflow reduced the high amount of human error. This increased quality output to 91%. This change shows the impact of good machine maintenance in reducing operational errors that affect quality. Figure 9 shows the differences in scrap by activity and event, pre- and post-implementation.
Figure 9.
Analysis of task-induced scraps pre- and post-implementation.
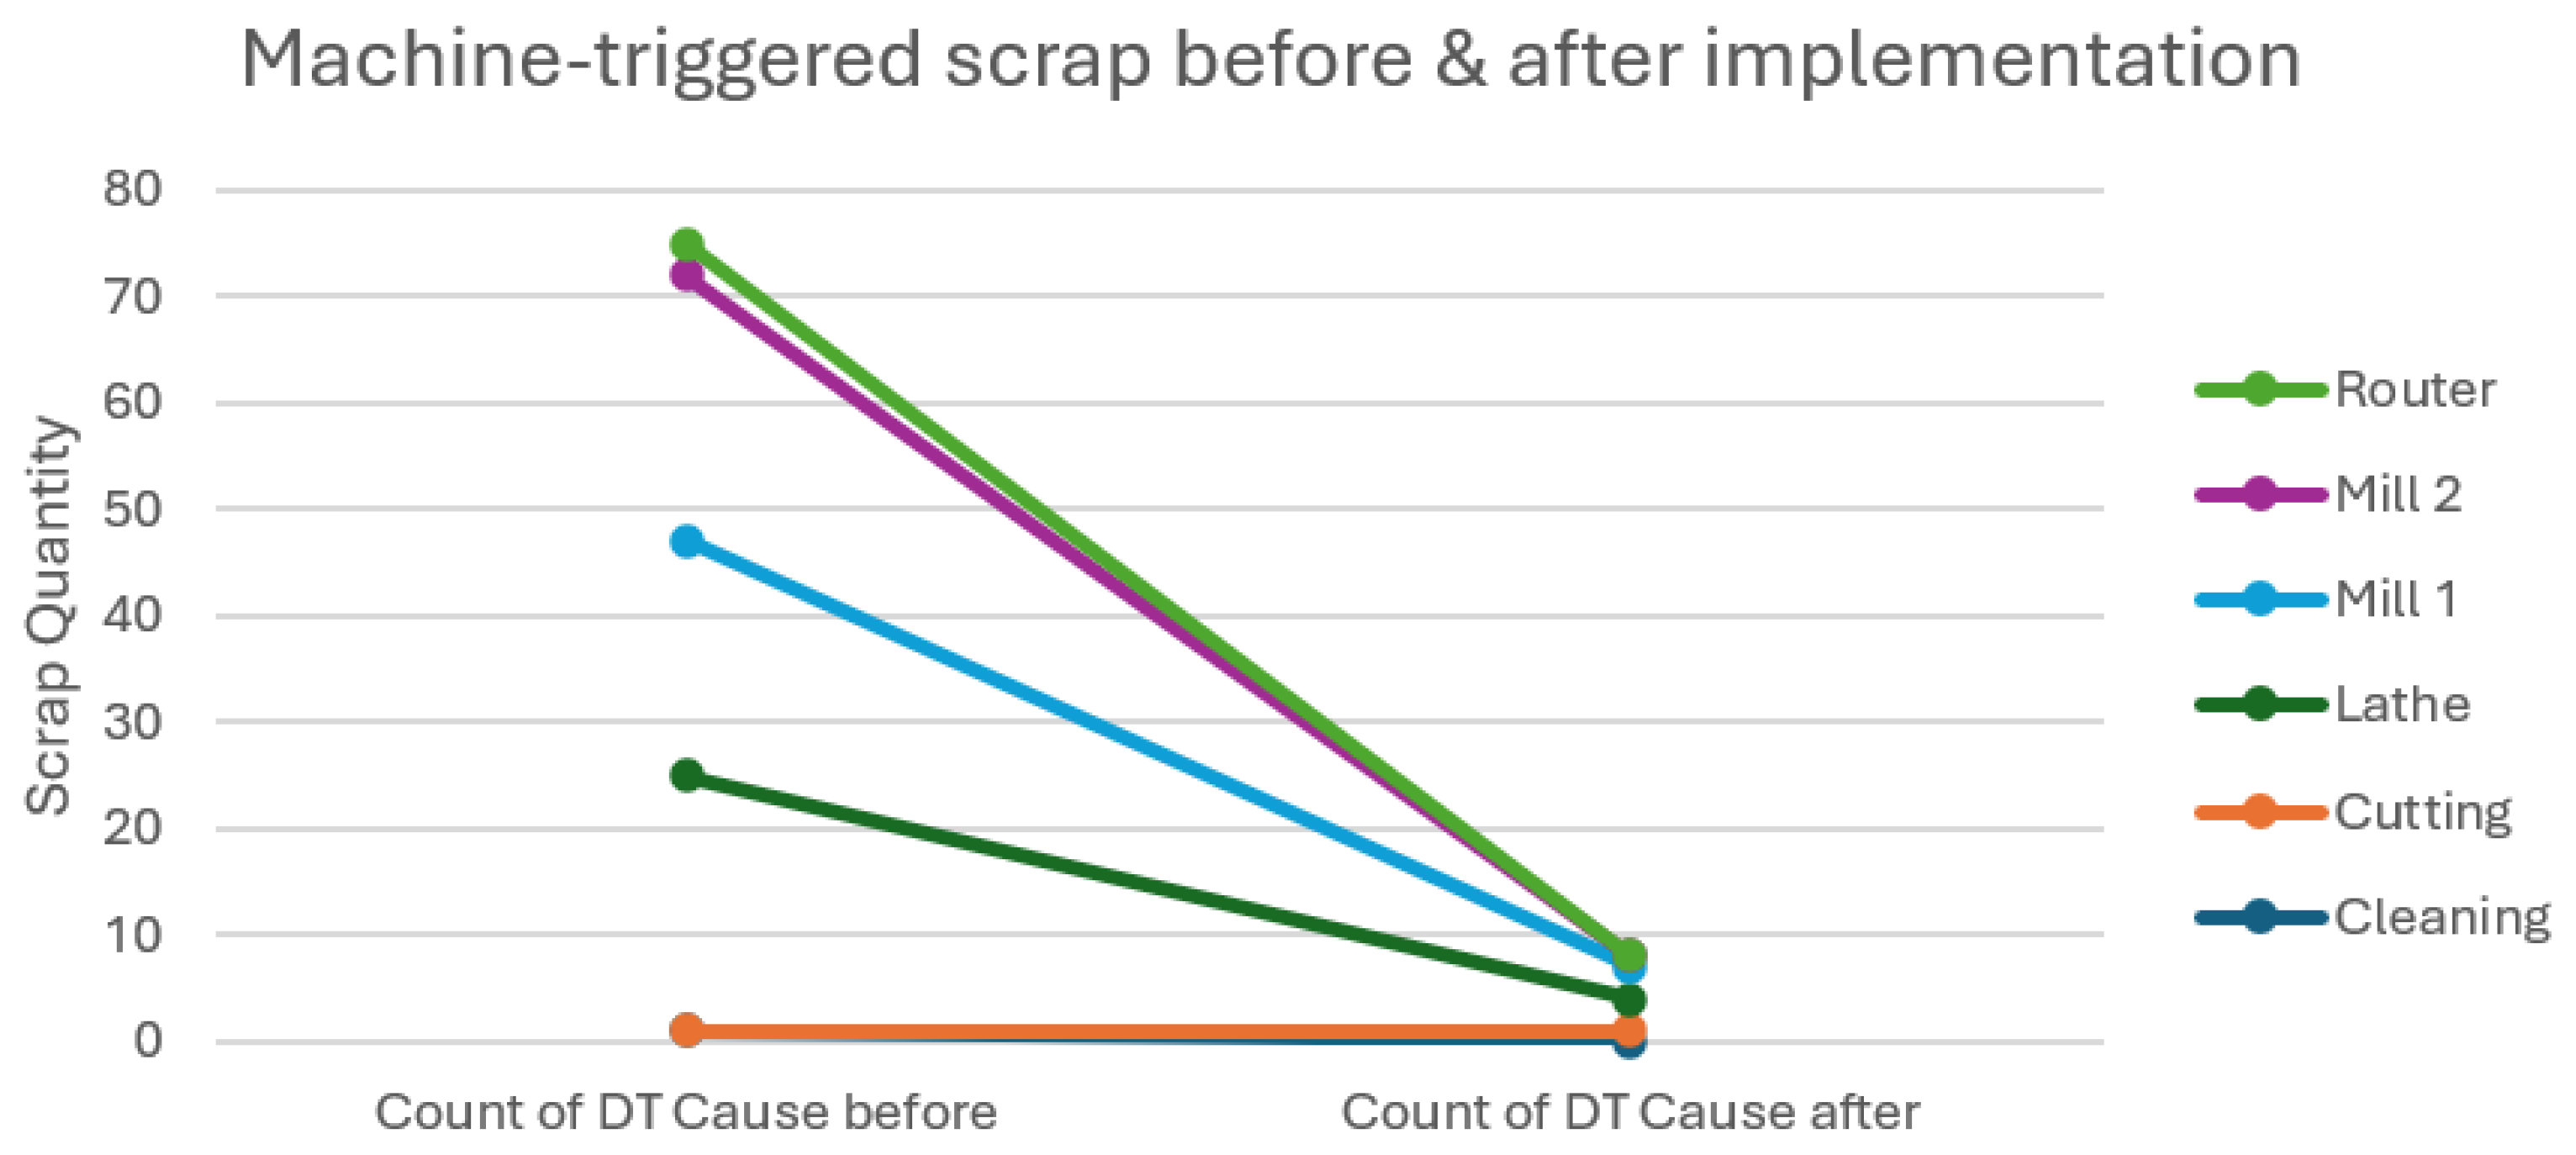
Machine downtime was substantially reduced to 89.33%. This is evidence that RCM was indeed effective for preventative and predictive maintenance, as Figure 10 shows substantial drops in all machine-triggered scraps.
Figure 10.
Machine-type-triggered scraps pre- and post-implementation.
4.2.2. Availability
Table 11 summarizes the available time and how it was distributed to maximize machine availability and utilization, and it is aided by the calculations that follow as it shows that availability was improved to 95%. An increase in machine availability and an improved effective time utilization improved production productivity by maximizing the utilization of available production time, while also promoting consistent process execution, which enhances product quality. Improved management of effective time further reduces production order variance by ensuring closer alignment between planned and actual production output. These improvements collectively contribute to overall business performance through higher throughput, lower operational costs, improved customer satisfaction, better resource utilization, and increased profitability. This addition strengthens the linkage between operational KPIs and broader business outcomes, ensuring that overall business performance is adequately addressed within the study. Availability was measured as a single pre/post aggregate, rendering it not suitable for significance testing, such as the Wilcoxon test.
Table 11.
Availability data.
Availability is calculated in terms of production time after implementation:
4.2.3. Performance
Table 12 shows the recorded results for performance in terms of production achievement rate after implementation of Leagile manufacturing.
Table 12.
Parameters for post-implementation production achievement rate.
The following calculation shows the performance in terms of production achievement rate post Legile manufacturing implementation:
OEE = 91%×95%×95%
=82.13%
≈82%
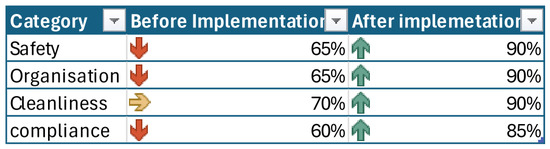
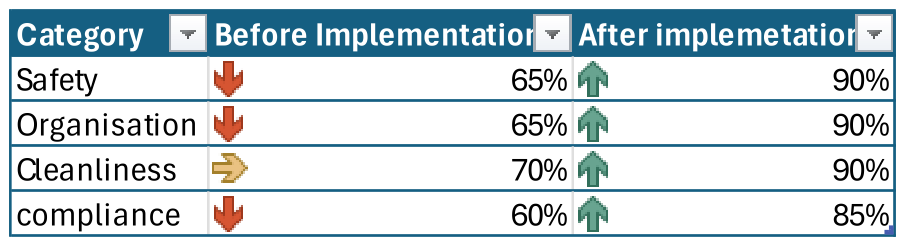
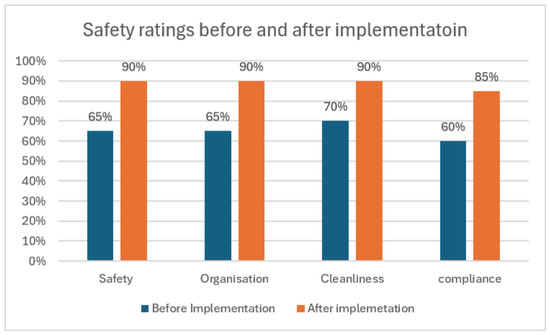
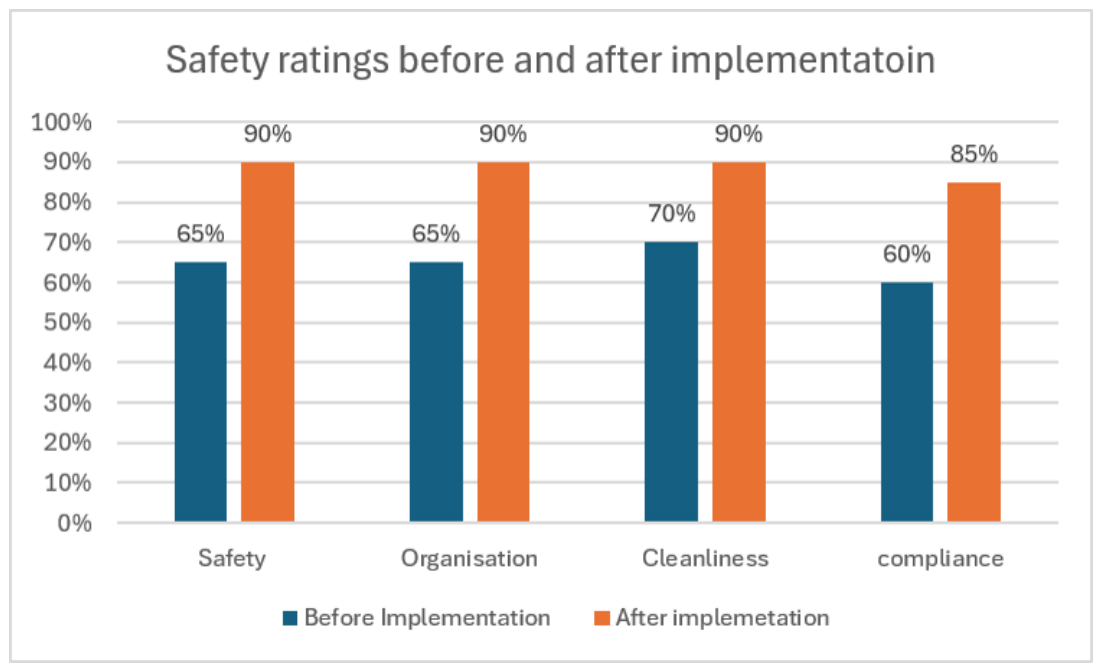
Figure 11 compares the safety rating criteria before and after implementation to give a full overview of the effectiveness of the solutions established. Further, as per Figure 12 and Figure 13, safety KPIs have substantially improved. This highlights the importance of employee engagement in daily meetings, proactive safety inspections and audits. The results from Figure 12 were ran through a paired t-test and Wilcoxon test for comparison, yielding a statistical improvement of t (15) = 5.69 (Wilcoxon: p < 0.001), with a 95% confidence interval, and showed true improvement between 0.74 and 1.63.
Figure 11.
Safety matrix scores before and after implementation.
Figure 12.
Overall safety matrix scores before and after implementation.
Figure 13.
Safety score before and after implementation.
4.2.4. Business Results Analysis
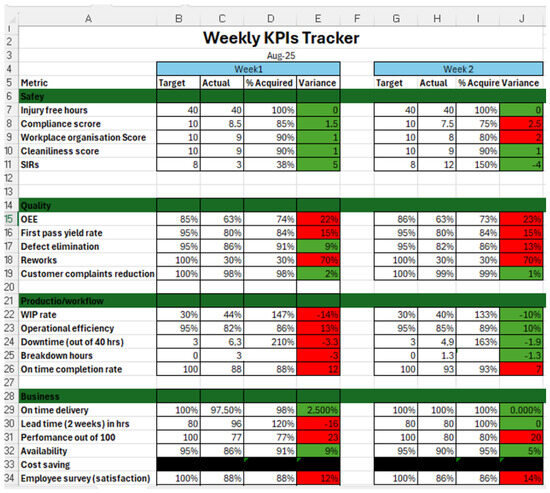
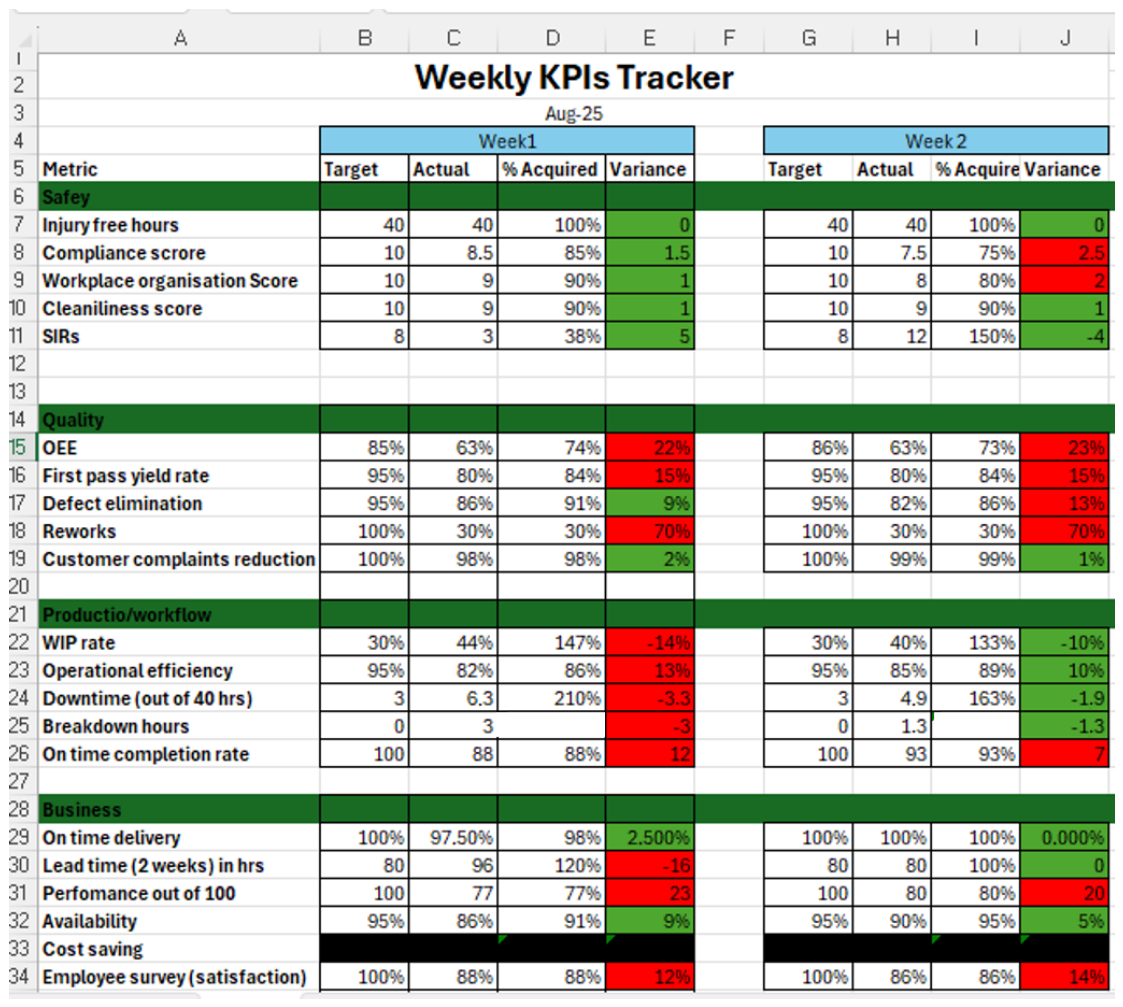
The chart presented in Figure 14 was a weekly KPI tracker utilized to monitor progression during the implementation stage. It served as a visual tool to highlight both achievements and shortcomings as the project advanced. By tracking these elements, the chart provided early insights into areas requiring adjustment. This proactive approach allowed the team to make necessary changes before issues became entrenched. The chart also functioned as a benchmark for measuring success against planned objectives. In doing so, it ensured that progress was not only recorded but critically evaluated. The identification of shortfalls helped prevent delays and resource misallocation. At the same time, recognizing areas of success reinforced effective strategies and practices. This dual focus created a balanced view of performance throughout the implementation phase. Ultimately, the chart was a vital mechanism for guiding decision-making and sustaining continuous improvement.
Figure 14.
Weekly KPI tracker after implementation.
As can be seen from the data collected in the first two weeks of implementation, there were both positive and negative impacts. However, it can be noted that there was practical improvement in the KPIs. Areas highlighted in red needed attention, while areas highlighted in green were on track. Some areas went from good to bad; this highlights the confusion in the workshop in the early stages of implementing the solution. It also highlights a compliance issue associated with resistance to change and lack of mindset or culture for change. Furthermore, time effectiveness improved substantially from lead time and downtime to on-time delivery, prompting a better rate of customer satisfaction and customers continuing their business with the workshop. The progression further proves the effectiveness of these solutions with integration of training and consistent meetings, as highlighted in the Kaizen methodology.
SMED intervention successfully applied Leagile principles to improve both efficiency and flexibility. Before implementation, the jig had to be rebuilt and adjusted for every new job, resulting in longer setup times, wasted effort and a greater risk of dimensional inconsistencies caused by repeated reassembly. After implementation, the new jig and tombstone design incorporated the range of commonly produced job sizes into a single reusable fixture with dedicated locating holes, allowing setup activities to be prepared in advance and substantially reducing machine downtime. From a Lean perspective, the solution eliminated unnecessary setup activities, motion, and rework, improving operational efficiency. From an Agile perspective, the same fixture could accommodate multiple product specifications without requiring a new design or lengthy changeovers, enabling the workshop to respond quickly to varying customer requirements. By combining standardization with flexibility, the intervention created the Leagile advantage that drove the observed reductions in changeover time and improvements in first-pass yield.
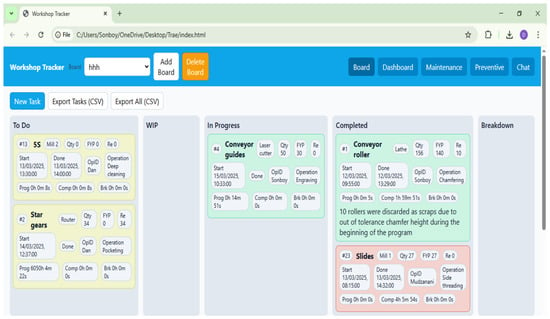
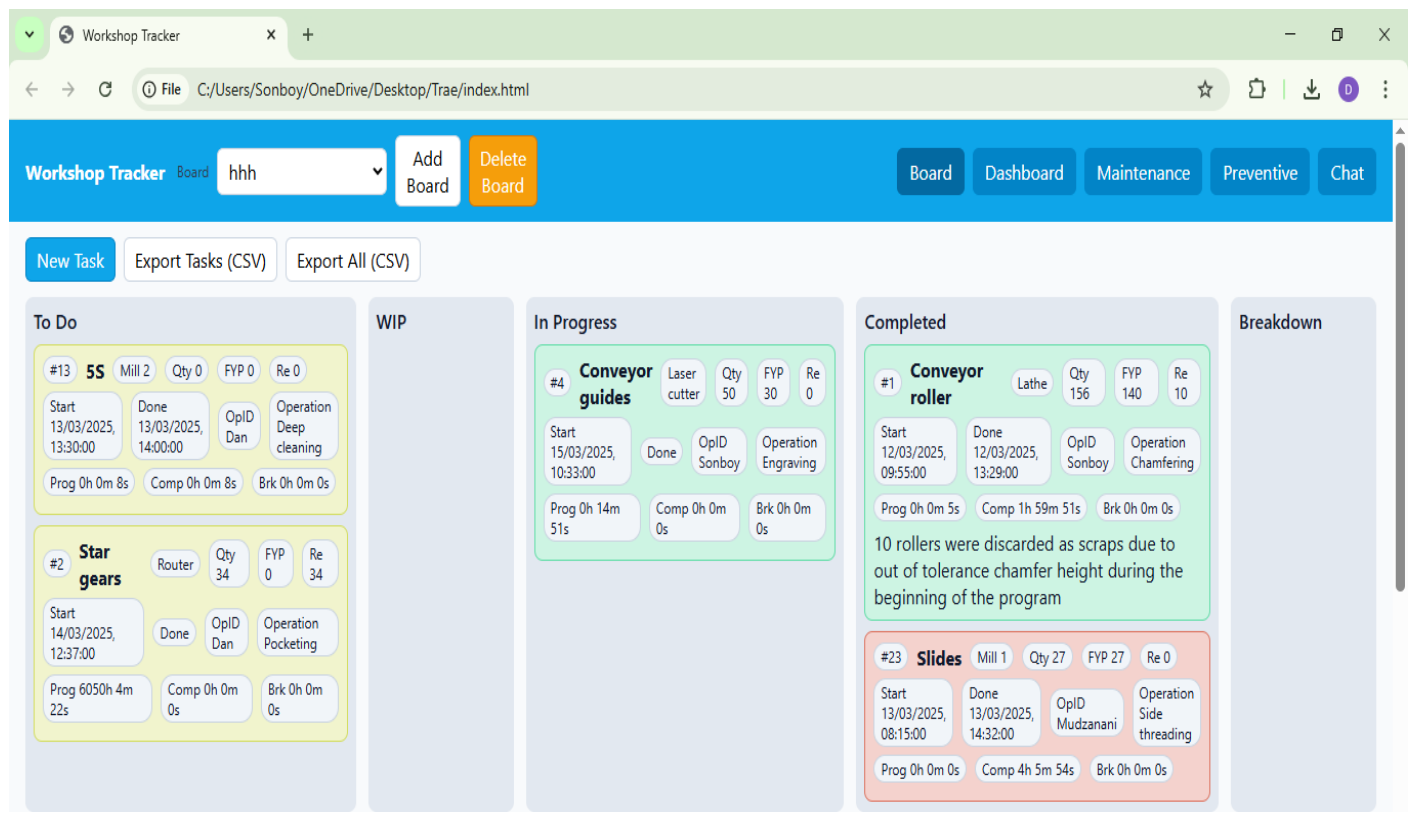
An important implementation that enhanced process visibility, accelerated job initiation, and supported cross-functional communication was the deployment of a digital Kanban board, as shown on Figure 15. The system enabled remote performance monitoring, real-time maintenance logging, and live dashboard tracking, facilitating rapid responses to process deviations and equipment failures. Its accessibility beyond the workshop environment allowed managers to analyze operational data and make informed decisions promptly, without reliance on physical presence or manual review of traditional Kanban boards. Production data, including machine downtime, setup and changeover times, output, scrap, rework, maintenance activities, safety observations, and delivery performance, were collected from daily production records, maintenance logs, quality inspections, and digital monitoring systems. The data were stored and analyzed using Microsoft Azure cloud services, enabling real-time dashboards and KPI tracking. This allowed supervisors and management to monitor OEE, quality, equipment reliability, workflow efficiency and safety performance while supporting timely, data-driven decision-making and corrective actions.
Figure 15.
Digital Kanban board pc overview.
5. Conclusions
This study evaluated the effectiveness of integrating Lean and Agile methodologies within a manufacturing workshop to enhance safety, quality, workflow efficiency, and overall business performance. A structured Leagile model, supported by an implementation framework, assessment tools and continuous improvement mechanisms, was successfully developed and applied. Substantial safety improvements were achieved through employee engagement and proactive risk identification, resulting in injury-free operations and reinforcing the principle of “safety first, quality, then production.” Product quality challenges identified during the initial assessment were addressed through the introduction of Reliability-Centered Maintenance, combining preventive, routine, and predictive maintenance approaches to improve machine reliability and reduce defects. Operational and time efficiency improved markedly through the application of SMED, enabling faster changeovers, reduced lead times, and consistent on-time delivery while maintaining quality standards. The implementation of a digital Kanban system with real-time analytics eliminated communication delays, enhanced cross-functional collaboration, and enabled rapid decision-making. Supporting practices such as 5S and Kaizen played a critical role in establishing baseline discipline and sustaining continuous improvement.
The improvements achieved in this study compare very favorably with those reported for individual Lean tools in recent manufacturing research. For example, while [20] reported cycle-time and lead-time reductions of more than 50% using Value Stream Mapping, and [27] found throughput improvements of 10–30% in IIoT-enabled factories, the integrated Leagile framework implemented in this workshop delivered substantially greater overall benefits. The intervention resulted in a 34% reduction in quality-related defects, an improvement in OEE from approximately 51% to 82%, and a safety compliance level of 90% with no recorded injuries. These outcomes suggest that the significant performance gains were not driven by a single tool, but rather by the combined and reinforcing effects of 5S, RCM, SMED, digital Kanban, and Kaizen working together. The magnitude of the changes observed through the integrated Leagile approach is comparable to isolated Lean or Agile initiatives and in this case exceeds it, particularly when safety, quality, and operational performance are addressed simultaneously.
The safety performance achieved during the study was also noteworthy when compared with broader industry benchmarks. The workshop reached a safety index of 90% while maintaining injury-free operations throughout the implementation period. This achievement is particularly significant given that SMEs often face challenges related to training, maintenance practices, and resource limitations that can hinder safety performance. The results therefore indicate that a structured, safety-focused Leagile implementation can help smaller organizations achieve safety outcomes comparable to, or even exceeding, those typically associated with larger enterprises. Similarly, the gains in equipment effectiveness highlight the impact of the framework. Before implementation, the workshop’s OEE stood at approximately 51%, which was well below the commonly reported manufacturing average of 60–65%. Following implementation, OEE increased to 82%, surpassing typical industry performance and approaching world-class standards of 85%. These results demonstrate that the framework produced more than incremental improvements. Instead, it enabled the workshop to transition from below-average operational performance to a level approaching world-class manufacturing standards within the duration of the study.
6. Recommendations and Future Work
The findings of this study support the continued integration of Lean and Agile methodologies as an effective strategy for improving operational efficiency, asset reliability, and responsiveness to variability in manufacturing workshops. Sustained application of core Lean practices, particularly 5S, is recommended to ensure consistency, improved housekeeping, and enhanced occupational health and safety. Daily quality tracking at operator and job levels is further recommended, as it enables targeted skill development, early identification of high-defect operations, and data-driven continuous improvement initiatives. Strengthening predictive maintenance practices is also critical, as it contributes not only to extended machine life and reduced downtime but also to improved product quality and service reliability.
The proposed Leagile framework can be applied by other manufacturing organizations by following a structured approach that combines both Lean and Agile principles. To begin with, organizations should evaluate their current operations and gather process data to identify areas where inefficiencies exist. Lean practices can then be introduced in the early stages of the process to reduce waste and improve overall efficiency using tools such as Pareto analysis to focus on the most critical issues and graphical methods to focus on other gaps. A clear decoupling point should be defined to separate stable processes from those that require flexibility, allowing for a smooth transition to Agile practices in the later stages. The Agile component enables the organization to respond quickly and effectively to changes in operational conditions. Continuous monitoring supported by graphical analysis helps ensure that these improvements are maintained over time. Through adopting this approach, organizations can strike a balance between efficiency and flexibility, leading to better overall performance.
7. Study Limitations
This study has some limitations. First, findings are based on a single mechanical workshop, limiting generalizability across sectors or firm sizes. Second, the observation period covered only pre- and post-implementation, which may not capture longer-term sustainability of gains or seasonal demand effects. Contextual organizational factors such as management commitment, workforce composition, and existing digital maturity may have influenced outcomes and were not isolated as independent variables. Finally in adoption, workforce competency after training was not quantified as technical results; this is a future gap to address as competency is one of the important factors in adoption and deployment success. Due to the aggregated nature of the available pre- and post-implementation data, statistical significance testing could not be validly performed for the operational performance indicators. Therefore, the reported improvements in quality, availability, performance, downtime, and OEE should be interpreted as descriptive evidence of operational enhancement rather than statistically validated effects.
Author Contributions
Conceptualization, S.M. and K.G.; methodology, S.M. and K.G.; software, S.M.; validation, S.M.; formal analysis, S.M. and K.G.; investigation, S.M.; resources, S.M.; data curation, S.M.; writing—original draft preparation, S.M.; writing—review and editing, K.G.; visualization, S.M. and K.G.; supervision, K.G.; project administration, S.M.; funding acquisition, S.M. and K.G. All authors have read and agreed to the published version of the manuscript.
Funding
This research received no external funding.
Institutional Review Board Statement
Not applicable.
Informed Consent Statement
Not applicable.
Data Availability Statement
Data will be made available on request.
Conflicts of Interest
The authors declare no conflict of interest.
References
- Skalli, D.; Charkaoui, A.; Cherrafi, A.; Garza-Reyes, J.A.; Antony, J.; Shokri, A. Industry 4.0 and Lean Six Sigma integration in manufacturing: A literature review, an integrated framework and proposed research perspectives. Qual. Manag. J. 2023, 30, 16–40. [Google Scholar] [CrossRef] [Scilit]
- Ding, B.; Hernández, X.F.; Jané, N.A. Combining lean and agile manufacturing competitive advantages through Industry 4.0 technologies: An integrative approach. Prod. Plan. Control 2023, 34, 442–458. [Google Scholar] [CrossRef] [Scilit]
- da Costa Reis Moreira, T.; de Mattos Nascimento, D.L.; Smirnova, Y.; de Souza Gomes dos Santos, A.C. Lean six sigma 4.0 methodology for optimizing occupational exams in operations management. Int. J. Lean Six Sigma 2024, 15, 93–119. [Google Scholar] [CrossRef] [Scilit]
- Bueno, A.; Goyannes Gusmão Caiado, R.; Guedes de Oliveira, T.L.; Scavarda, L.F.; Filho, M.G.; Tortorella, G.L. Lean 4.0 implementation framework: Proposition using a multi-method research approach. Int. J. Prod. Econ. 2023, 264, 108988. [Google Scholar] [CrossRef] [Scilit]
- Piotrowicz, W.D.; Ryciuk, U.; Szymczak, M. Lean and agile metrics. Literature review and framework for measuring leagile supply chain. Int. J. Product. Perform. Manag. 2023, 72, 1560–1583. [Google Scholar] [CrossRef] [Scilit]
- Wahid, M.K.A.; Dawood, L.M. Lean, agile, leagile manufacturing systems pros and cons: A literature survey. AIP Conf. Proc. 2024, 3079, 060023. [Google Scholar] [CrossRef] [Scilit]
- Achumie, G.O.; Oyegbade, I.K.; Igwe, A.N.; Ofodile, O.C.; Azubuike, C. A Conceptual Model for Reducing Occupational Ex-posure Risks in High-Risk Manufacturing and Petrochemical Industries through Industrial Hygiene Practices. Int. J. Soc. Sci. Except. Res. 2022, 1, 26–37. [Google Scholar] [CrossRef] [Scilit]
- Goyal, S.; Singh, S.K.; Bhunia, H. Occupational hazards and safety in secondary steelmaking industry: A review. Saf. Extrem. Environ. 2024, 6, 219–234. [Google Scholar] [CrossRef] [Scilit]
- Rahman, N.A.; Basir, I.M. Safety practices in the mechanical engineering workshop politeknik merlimau. Southeast Asian J. Technol. Sci. 2024, 5, 13–17. [Google Scholar]
- Limón-Romero, J.; García-Alcaraz, J.L.; Sanchez-Lizarraga, M.A.; Gastelum-Acosta, C.; Báez-López, Y.; Tlapa, D. Implementing a Quality Management System Based on ISO 9001:2015 Standard: Modeling the Enablers’ Relationships. IEEE Access 2024, 12, 195174–195187. [Google Scholar] [CrossRef] [Scilit]
- Serrano-Ruiz, J.C.; Mula, J.; Poler, R. Smart manufacturing scheduling: A literature review. J. Manuf. Syst. 2021, 61, 265–287. [Google Scholar] [CrossRef] [Scilit]
- Akram, M.W.; Abbas, A.; Khan, I.A.; Ahmad, M.F. The Impact of Effective Implementation of the 5S Concept on Company Performance: A Case Study of a Manufacturing Company. NICE Res. J. 2023, 16, 119–140. [Google Scholar] [CrossRef] [Scilit]
- Mazur, M.; Korenko, M.; Žitňák, M.; Shchur, T.; Kiełbasa, P.; Dostál, P.; Dzhidzhora, O.; Idzikowski, A. Implementation and Benefits of the 5S Method in Improving Workplace Organisation—A Case Study. Manag. Syst. Prod. Eng. 2024, 32, 498–507. [Google Scholar] [CrossRef] [Scilit]
- Chang, R. The Impact of Employees’ Health and Well-being on Job Performance. J. Educ. Humanit. Soc. Sci. 2024, 29, 372–378. [Google Scholar] [CrossRef] [Scilit]
- Hassani, Y.; Ceauşu, I.; Iordache, A. Lean and Agile model implementation for managing the supply chain. Proc. Int. Conf. Bus. Excell. 2020, 14, 847–858. [Google Scholar] [CrossRef] [Scilit]
- Díaz-Reza, J.R.; García-Alcaraz, J.L.; Figueroa, L.J.M.; Vidal, R.P.I.; Muro, J.C.S.D. Relationship between lean manufacturing tools and their sustainable economic benefits. Int. J. Adv. Manuf. Technol. 2022, 123, 1269–1284. [Google Scholar] [CrossRef] [Scilit]
- Rashad, W.; Nedelko, Z. Global sourcing strategies: A framework for lean, agile, and leagile. Sustainability 2020, 12, 7199. [Google Scholar] [CrossRef] [Scilit]
- Shenawy ASEl Khourshed, N.F.; Ragheb, M.A.; Beshr, M.H. Integration of Industry 4.0 and Lean Six Sigma: Critical Success Factors for Overcoming Socioeconomic Challenges in the Telecommunication Sector. SocioEconomic Chall. 2025, 9, 80–100. [Google Scholar] [CrossRef] [Scilit]
- Nawanir, G.; Moshood, T.D. The drivers of lean, agile and green principles towards business competitiveness among manu-facturing firms in Malaysia. Int. J. Qual. Reliab. Manag. 2025, 42, 1793–1821. [Google Scholar] [CrossRef] [Scilit]
- Reda, H.; Dvivedi, A. Application of value stream mapping (VSM) in low-level technology organizations: A case study. Int. J. Product. Perform. Manag. 2022, 71, 2393–2409. [Google Scholar] [CrossRef] [Scilit]
- Cooper, M.D. The Safety Culture Construct: Theory and Practice; Springer: Berlin/Heidelberg, Germany, 2018; pp. 47–61. [Google Scholar] [CrossRef] [Scilit]
- El-Helaly, M. Artificial Intelligence and Occupational Health and Safety, Benefits and Drawbacks. La Med. Del Lav. 2024, 115, e2024014. [Google Scholar] [CrossRef] [Scilit]
- Kunodzia, R.; Bikitsha, L.S.; Haldenwang, R. Perceived Factors Affecting the Implementation of Occupational Health and Safety Management Systems in the South African Construction Industry. Safety 2024, 10, 5. [Google Scholar] [CrossRef] [Scilit]
- Rane, S.B.; Wavhal, S.; Potdar, P.R. Integration of Lean Six Sigma with Internet of Things (IoT) for productivity improvement: A case study of contactor manufacturing industry. Int. J. Syst. Assur. Eng. Manag. 2023, 14, 1990–2018. [Google Scholar] [CrossRef] [Scilit]
- Phalane, M.D.; Gupta, K. An integrated framework for improving safety, quality, and stewardship standards in manufacturing: A case study. Rep. Mech. Eng. 2023, 4, 213–224. [Google Scholar] [CrossRef] [Scilit]
- Mabotja, T. Impact of automated picking systems on operational efficiency in South Africa’s manufacturing warehouses. Int. J. Res. Bus. Soc. Sci. 2025, 14, 18–29. [Google Scholar] [CrossRef] [Scilit]
- Subramanian, S. IoT and Edge Computing for Smart Manufacturing: Architecture and Future Trends. Int. J. Eng. Comput. Sci. 2024, 13, 26504–26522. [Google Scholar] [CrossRef] [Scilit]
- Kahn, A. The Conversation: South African Companies Aren’t Innovating Enough: Why Support During Tough Economic Times Matters. 2025. Available online: https://hsrc.ac.za/news/rdsi/the-conversation-south-African-companies-arent-innovating-enough-why-support-during-tough-economic-times-matters/ (accessed on 1 March 2026).
- van Wyk, L.; Kajimo-Shakantu, K.; Opawole, A. Adoption of innovative technologies in the South African construction industry. Int. J. Build. Pathol. Adapt. 2024, 42, 410–429. [Google Scholar] [CrossRef] [Scilit]

Disclaimer/Publisher’s Note: The statements, opinions and data contained in all publications are solely those of the individual author(s) and contributor(s) and not of MDPI and/or the editor(s). MDPI and/or the editor(s) disclaim responsibility for any injury to people or property resulting from any ideas, methods, instructions or products referred to in the content. |
© 2026 by the authors. Licensee MDPI, Basel, Switzerland. This article is an open access article distributed under the terms and conditions of the Creative Commons Attribution (CC BY) license.