


Abstract
Background: Automotive safety-component suppliers often must add capacity at short notice, and automation is common. This study quantifies the capacity, equipment-effectiveness, process-capability and nonconformity effects of integrating an automated screw-fastening machine (OP8) into an assembly line. Methods: An Action-Research DMAIC study combined 2024 monthly capacity, OEE and nonconformity records with ordered 100-part series of fastening torque and nut height from the original equipment (OP6/OP7) and OP8 for two product variants, analyzed with I-MR charts, resolution-aware Anderson-Darling tests, normal and Weibull capability indices with confidence intervals, and Brown-Forsythe, Hodges-Lehmann, Cliff’s delta and Welch tests. Results: Rated capacity rose from 117 to 153 parts/h (+30.8%), of which 8 parts/h (22% of the gain) is attributable to OP8; OEE remained at 88.0–91.7%. Torque standard deviation on OP8 was 2.3–3.0 times that on OP6 (Brown-Forsythe p < 0.001), whereas nut-height spread was 11–23% lower. Poor screw-fastening reached 0.66% of OP8 output in June, July and September, about 21 times the OP6 rate, although no logged reading was out of specification. Conclusions: Capacity increased, but capability indices computed from machine-logged, apparently screened data neither explained nor predicted the attribute defect rate, and the defect reduction cannot yet be credited to the improvement actions.
1. Introduction
Manufacturing companies that operate in the automotive supply chain are subject to continuous pressure to reinvent their processes, reduce costs and, increasingly, to respond to short-notice changes in customer demand [1]. Lean Manufacturing (LM), originally developed at the Toyota Motor Corporation, addresses this pressure by increasing productivity and eliminating waste associated with waiting times, setup times and work-in-process inventory through the efficient management of resources [2]. Six Sigma (SS), introduced by Motorola in the 1980s, pursues a complementary objective: the reduction in process variability through statistical tools, so that products and services are delivered with a near-zero defect rate [3,4]. The combination of both approaches, known as Lean Six Sigma (LSS), integrates waste elimination with variation reduction and has become a widely adopted strategy for continuous improvement in production and management activities across manufacturing sectors, including the automotive industry [1,5,6,7].
Within LSS, Overall Equipment Effectiveness (OEE) is a long-established metric, originating from Total Productive Maintenance, that quantifies equipment performance as the product of availability, performance and quality, and is widely used both to benchmark equipment and to focus continuous-improvement effort on the losses with the greatest impact [8,9,10]. The DMAIC cycle (Define, Measure, Analyze, Improve, Control) provides the structured problem-solving framework most commonly associated with LSS deployments in industry, and has been applied to assembly-process quality improvement in the automotive sector [11,12,13].
Automating a previously manual or semi-automatic assembly operation is a common strategy for increasing the production capacity of an existing line without a full line redesign. However, the literature also indicates that the introduction of automated equipment does not, by itself, guarantee an improvement in quality: a period of adaptation is typically required, during which the equipment’s inability to absorb the variability inherent to upstream manual operations may produce new categories of nonconformity, so that capacity and quality gains need to be pursued and quantified jointly rather than assumed [1]. Quality is usually demonstrated in this setting with process-capability indices (Cp, Cpk, Pp, Ppk), which relate the spread of a monitored variable to its specification limits [14,15,16]. Their use is subject to well-known conditions: statistical control, an adequate measurement system, and a distributional model appropriate to the data, with percentile-based methods being the usual route for non-normal data [17,18,19,20]. For threaded fasteners, VDI/VDE 2645-2 prescribes a dedicated machine-capability study for fastening machines [21], and ISO 5393 specifies how the torque repeatability of power tools and the precision of a tool’s built-in torque measurement are to be verified [22]; torque alone is also known to be an indirect indicator of the clamp load actually achieved [23].
This case study was carried out at an automotive safety-components manufacturer operating in Portugal, specializing in the production of safety modules for the automotive industry. During 2024, a change in vehicle-safety legislation made the mandatory inclusion of the safety module referred to throughout this article as “part XYZ” a requirement for every vehicle produced by one of the company’s automotive customers, which resulted in a customer demand increase above the volume originally forecast for the production line. The line, as configured at the start of the study, had a rated capacity of 117 parts/h, i.e., 2808 units per working day of three eight-hour shifts and 14,040 units per week of five working days. The revised customer forecast of approximately 14,000 units per week, compared with approximately 10,000 units per week originally contracted, would therefore have required the line to run at practically its nominal rate with no allowance for losses (Section 3.1). The engineering solution adopted consisted of replacing two semi-automatic machines—one performing the screw-fastening of two retention nuts (OP6) and a second verifying nut height (OP7)—with a single, fully automated machine (OP8) that merges both operations.
Although automation case studies are common, to the authors’ knowledge few (i) separate the capacity gain attributable to the new machine from that of concurrent organizational changes, and (ii) confront machine-capability indices with the attribute defect rate observed in series production for the same station. This is the research gap addressed here. The general aim of this study is to describe and statistically quantify the capacity gains obtained from the introduction of the automated fastening equipment into the production line of part XYZ, and to evaluate the resulting effect on process stability, process capability and product quality. The following research questions and hypotheses were formulated: RQ1: How does replacing the semi-automatic OP6/OP7 stations with the automated OP8 machine affect the hourly production capacity of the part XYZ line? RQ2: How do the fastening torque and nut height produced by OP8 compare, in location and in spread, with those of OP6/OP7? RQ3: How do the capability indices of these characteristics relate to the nonconformity rate observed in series production? H1: The location of fastening torque and of nut height on OP8 differs from that on OP6/OP7. H2: The variability (standard deviation) of fastening torque and of nut height is lower on OP8 than on OP6/OP7. Each hypothesis is tested separately for every characteristic, bolt and product variant, and the Ppk/Cpk ≥ 1.33 capability reference is reported descriptively rather than as part of H1. The specific objectives were to (i) analyze methods and cycle times along the production line, (ii) carry out capability studies comparing the original and the new equipment over the same production period, (iii) identify the root causes of the process variations observed after the introduction of the new equipment, (iv) perform the corresponding statistical hypothesis tests and (v) formulate and implement improvement actions to consolidate the capacity gain without compromising product quality.
2. Materials and Methods
2.1. Company and Production System
The company is certified to ISO 14001:2015 [24] (environmental management) and IATF 16949:2016 [25] (automotive quality management systems), the latter being the reference standard under which special characteristics and Production Part Approval Process (PPAP) requirements are normally defined for safety-related automotive components. The company is an automotive safety-components manufacturing unit dedicated to the production of safety modules for the automotive industry. The production line studied manufactures part XYZ, a fabric-based safety module also comprising metallic and other functional components, in a U-shaped assembly-cell layout typical of medium-to-high volume automotive component manufacturing, which favors linear product flow, process stability and ease of mutual support between operators. Before the intervention described in this study, the line comprised seven workstations (OP1 to OP7) operated by six operators, and the screw-fastening sub-process consisted of two sequential semi-automatic machines: OP6, which applied two retention nuts to the metallic bracket of the subassembly at a fastening torque of 9 ± 1 Nm, and OP7, which verified the resulting nut height with two potentiometers before the part was released for final labeling and packaging. Each part is traced through every station, so that a component can be assembled only once and each operation is recorded against the part. Under this configuration the line had a rated capacity of 117 parts/h, the nominal hourly output established from the line’s production history and the method-and-time studies carried out in the Define phase; it does not include availability, performance or quality losses.
In response to the increase in customer demand described in Section 1, the company’s process-engineering team selected a single, fully automated machine (designated OP8) to replace OP6 and OP7. OP8 merges the fastening of the two retention nuts and the verification of nut height into a single automated cycle. The cycle has four phases, controlled through the screwdriver’s torque and speed parameters, in which “left” and “right” denote the direction of rotation of the screwdriver tip: pre-fastening to the left (the tip advances rotating to the left, so that the thread start of the self-locking nut engages the bolt thread), pre-fastening to the right (tightening starts at reduced speed), final pre-fastening to the right (speed and power are increased gradually) and final fastening to the right at higher speed until the programmed fastening torque is reached. The first phase therefore differs from the other three by design, and the naming is not a typographical asymmetry. As in the original configuration, the fastening torque is enforced by the screwdriver controller and the nut height by potentiometers.
2.2. Research Design
This study followed an Action-Research strategy, considered appropriate whenever a project requires the systematic collection and analysis of production data, methods and cycle times, followed by the implementation and validation of improvement actions within the same real-world industrial setting [26]. The research was structured according to the five phases of the DMAIC cycle, summarized in Table 1 together with the corresponding activities carried out in this study.
Table 1.
DMAIC phases and corresponding activities carried out in this study.
2.3. Data Collection and Statistical Analysis
The two quality characteristics compared between the original (OP6/OP7) and the new (OP8) equipment are the fastening torque and the nut height, each measured for the two retention bolts. Each machine logs both characteristics for every part, with a time stamp. The fastening torque is the value reported by the screwdriver controller of each machine, recorded in steps of 0.01 Nm, and the nut height is the displacement measured by the machine’s potentiometers, recorded in steps of 0.01 mm (the field labels in the plant’s data system are “Par de Aperto” and “Altura de Porca”). For the original configuration, torque is logged by OP6 and nut height by OP7; in the tables these streams are identified as OP6 and OP7, respectively. The specification for fastening torque is 9 ± 1 Nm (i.e., 8–10 Nm) for both bolts. The specification for nut height is 6.2 ± 1.5 mm (4.7–7.7 mm) for bolt 1 and 5.3 ± 1.5 mm (3.8–6.8 mm) for bolt 2. Both parameters are enforced by the equipment itself, independently of the statistical analysis performed here: the screwdriver controller enforces the torque and the potentiometers enforce the nut height. The logs for September 2024 (2–30 September) cover two product variants, designated 16K and 17K, and hold 27,210 parts for OP6/OP7 and 14,447 parts for OP8. For each variant and machine, the first 100 consecutive records of 2 September were analyzed, giving 16 series of 100 values (2 variants × 2 characteristics × 2 bolts × 2 machines). The OP6/OP7 and OP8 samples are independent, concurrent samples: the machines processed different parts at the same time, and no subassembly was measured on both. The design is therefore a concurrent comparison, not a matched or paired one. The ordered series are identical to the worksheet of the Minitab project in which the original analysis was carried out.
Statistical stability was assessed first, with individuals and moving-range (I-MR) charts (center line at the sample mean, limits at ±2.66 times the average moving range for the individuals and 3.267 times for the moving range [27]), the lag-1 autocorrelation coefficient with its normal-approximation p-value, and the Wald-Wolfowitz runs test about the median [28]. Second, normality was assessed with the Anderson-Darling (AD) test with Stephens’ p-value approximation [29]. Because the logged values are rounded, which inflates the AD statistic, a resolution-aware p-value was also obtained by Monte Carlo simulation (2000 normal samples of n = 100 with parameters re-estimated in each replicate and values rounded to 0.01); a resolution-aware p-value that is no longer significant indicates that the rejection of normality may be an artifact of coarse recording. Third, capability was evaluated with a single, explicit set of indices applied to every group. Overall indices use the sample standard deviation σo and within indices use σw = /1.128 estimated from the average moving range, with the specification limits LSL and USL and the mean μ, as in Equations (1) and (2) [14,27]; approximate 95% confidence intervals follow Bissell [30]. For fastening torque, normal-theory Ppk and the percentile-based Ppk of Equation (3) [17,19] are reported side by side for all eight groups, with a two-parameter Weibull model fitted by maximum likelihood, its fit tested with an AD statistic whose p-value was obtained by parametric bootstrap (600 replicates, refitted and rounded), and the 95% interval of the Weibull Ppk from 400 bootstrap resamples. The target-sensitive index Cpmk (Equation (4)) was computed with T = 9 Nm, the nominal value of the specification. The Ppk/Cpk ≥ 1.33 value was adopted as the generic reference for a capable process; the Ppk ≥ 1.67 value that customers commonly require for initial process studies of special characteristics under PPAP [31] is mentioned for context only, because the documentation of the project does not state whether torque or nut height is a special characteristic of part XYZ or which threshold applies (Section 4).
Ppk = min[(USL − μ), (μ − LSL)]/(3σo); Pp = (USL − LSL)/(6σo)
Cpk = min[(USL − μ), (μ − LSL)]/(3σw); Cp = (USL − LSL)/(6σw)
PpkW = min[(USL − x0.5)/(x0.99865 − x0.5), (x0.5 − LSL)/(x0.5 − x0.00135)]
Cpmk = min[(USL − μ), (μ − LSL)]/(3√(σo2 + (μ − T)2))
Machines were then compared as follows (differences are always OP8 minus OP6/OP7). Spread was compared with the Brown-Forsythe test (Levene’s test with deviations from the median), which is robust to non-normality [32]; the classical F ratio of variances and its confidence interval are reported only as the standard-deviation ratio. Location was compared with the Mann–Whitney test, interpreted as a test of stochastic dominance because the spreads differ, together with the Hodges-Lehmann shift estimate and its 95% confidence interval [33] and Cliff’s delta with a percentile bootstrap interval [34], and with Welch’s unequal-variance t-test [35]. All tests are two-sided at α = 0.05 and no multiplicity adjustment was made for the eight machine comparisons; where this matters it is stated. Computations were carried out in Python 3.13 with NumPy 2.5, SciPy 1.18 and pandas 3.0 using code written for this study (Minitab 21 was used in the original analysis; the statistics reported here were recomputed from the ordered series).
In addition to the equipment-capability study, monthly production-capacity, Overall Equipment Effectiveness (OEE) and nonconformity data were collected from the company’s production databases and quality records for the period January–November 2024, and analyzed descriptively to quantify the productivity gain associated with each improvement stage and the evolution of quality indicators following the introduction of OP8. Nonconformity rates are pooled rates (total nonconforming parts divided by total parts produced over the window stated) with Wilson 95% confidence intervals [36]; the rates on OP8 and OP6 separately was obtained by multiplying the monthly output by the OP8 share of output read from the output-share chart of Section 3.2 (integer percentages, June, July, September; August, the holiday month, is not available), which carries a rounding uncertainty of about ±1.6% (relative) at a 32% share. Monthly rates were additionally plotted on a p-chart whose center line and 3-sigma limits were computed from the January–May baseline. OEE was computed as the product of availability, performance and quality, following the standard formulation of Equations (5)–(8) [8,9]:
where planned time refers to the scheduled production time, downtime comprises stoppages caused by failures, setups and adjustments, operating time is planned time minus downtime, and the ideal cycle time is the theoretical time required to produce one part at full equipment speed. The company’s OEE values were available as monthly aggregates; the planned time and ideal cycle time behind them were not retained in the project records, so OEE is used here as reported.
OEE (%) = Availability × Performance × Quality
Availability = (Planned Time − Downtime)/Planned Time
Performance = (Parts Produced × Ideal Cycle Time)/Operating Time
Quality = (Total Parts Produced − Defective Parts)/Total Parts Produced
3. Results
Results are presented following the same sequence in which they were obtained along the DMAIC cycle: the baseline capacity constraint that motivated the project (Define), the production-capacity gains (Measure/Analyze), the comparison of the original and the new machine in stability, capability and spread, and its relation to the nonconformities observed (Measure/Analyze), the nonconformities and their economic impact (Measure/Analyze), the improvement actions implemented (Improve) and the consolidated results at the end of the study period (Control).
3.1. Problem Definition and Baseline Capacity
Before the intervention, the production line for part XYZ operated with the configuration summarized in Section 2.1, with a rated capacity of 117 parts/h. Considering three eight-hour shifts over five working days (120 of the 168 h in a calendar week), this corresponds to 2808 units/day and 14,040 units/week, or about 60,800 units per month. The customer forecast rose from approximately 10,000 units/week, as originally contracted, to approximately 14,000 units/week, a figure taken from the project documentation. The rated rate is a nominal rate that excludes availability, performance and quality losses. With the monthly OEE of the line at 88.0–91.7% in January–May (Section 3.2), the original line could be expected to deliver about 12,400–12,900 units/week, i.e., 8–12% below the revised forecast; at the post-intervention rated capacity of 18,360 units/week and the OEE of June–November (88.7–91.4%) the corresponding figure is about 16,300–16,800 units/week, 16–20% above it. This is an order-of-magnitude argument, because the planned time and ideal cycle time behind the OEE values were not retained (Section 2.3) and because actual monthly output followed orders rather than capacity (Section 3.2), but it shows that the motivation for the investment was the absence of any margin between forecast demand and the nominal rate of the original line, not a gap between the two figures taken at face value. Method-and-time studies of the existing line confirmed that the configuration in place at the start of the project would not have sufficient capacity to meet the increased volume with a reasonable margin, which justified the replacement of the two semi-automatic fastening/verification machines (OP6, OP7) with the single automated machine OP8, described in Section 2.1.
3.2. Production Capacity Gains
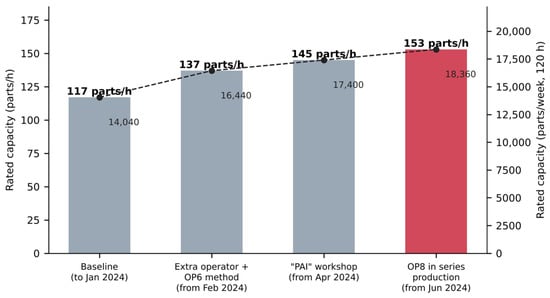
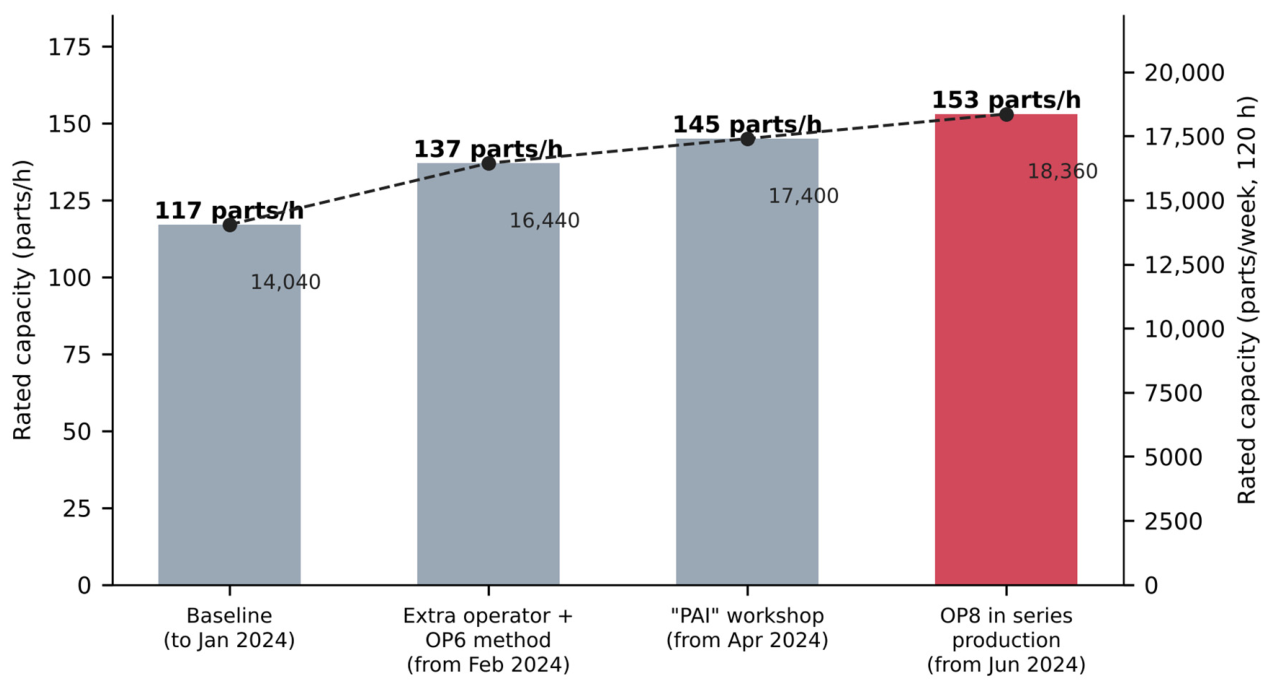
Table 2 summarizes the incremental improvement actions implemented on the line between January and November 2024 and their individual contribution to rated hourly capacity; each stage is listed with the month from which it applied (exact dates were not recorded in the project report). Starting from the original 117 parts/h, the addition of an extra operator together with a redefinition of the work method at OP6 raised capacity to 137 parts/h; a subsequent “PAI” improvement workshop, which redefined the layout and work method along the line, added a further 8 parts/h (145 parts/h); and the integration of the new OP8 equipment contributed a final increase of 8 parts/h, raising the line to its current rated capacity of 153 parts/h, as shown in Figure 1. In weekly terms, the same evolution corresponds to an increase from 14,040 to 18,360 parts/week (+4320 parts/week, +30.8%), shown on the secondary axis of Figure 1.
Table 2.
Incremental production-capacity improvement actions implemented on the part XYZ line, January–November 2024. Months give the start of each stage; exact dates were not recorded.
Figure 1.
Rated production capacity of the part XYZ line, January–November 2024: parts per hour (bars, left axis) and parts per week of 120 h (line, right axis).
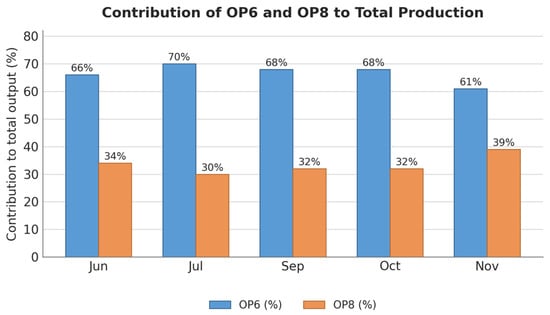
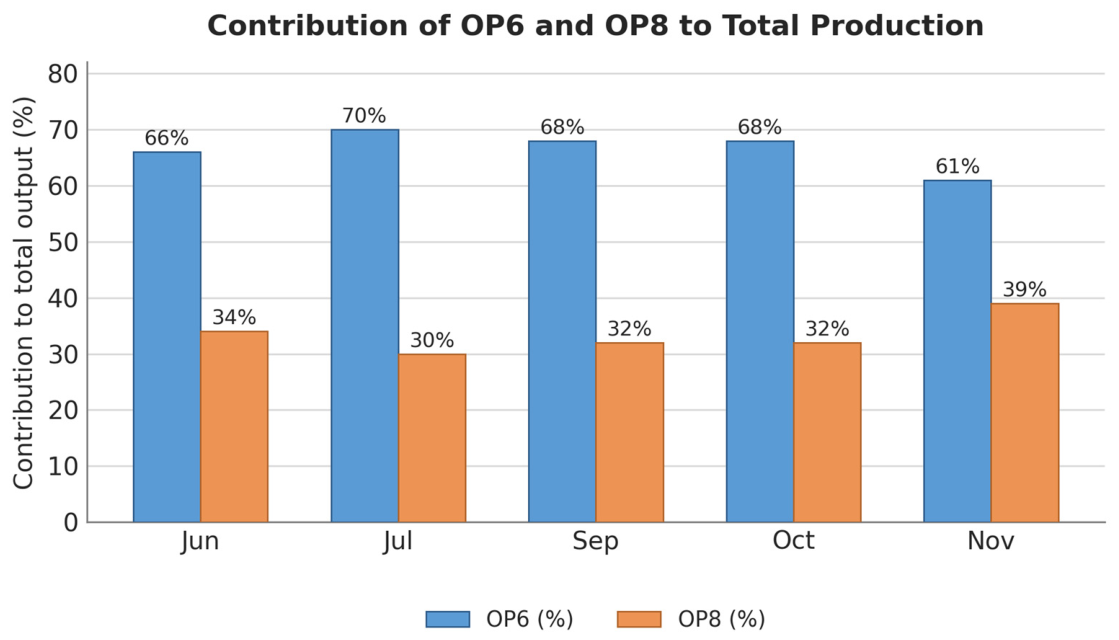
Isolating the contribution of the new equipment specifically, the net increase in rated capacity associated with OP8 was 8 parts/h (from 145 to 153 parts/h), equivalent to 64 additional parts per eight-hour shift and approximately 960 additional parts per week, i.e., 22% of the total 36 parts/h gain between January and November 2024 (Table 2). This increment is the difference between the rated capacities before and after OP8 entered series production according to the method-and-time study; it was not measured on OP8 in isolation. At the time of the study, it had not yet been possible to concentrate all production on OP8, which therefore operated in parallel with OP6 and contributed on average 33% of total output (range 30–39%) in June, July, September, October and November (August, the holiday month, is excluded), reaching 39% in November, as shown in Figure 2. The reason why production could not be concentrated on OP8 is not documented in the project records (Section 4). In addition to the direct increase in rated throughput, the parallel operation reduced saturation on the rest of the line, giving operators more flexibility to support one another across workstations.
Figure 2.
Relative contribution of OP6 and OP8 to total monthly output, June–November 2024 (August, holiday month, not available).
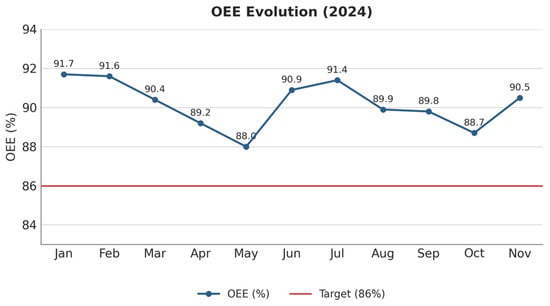
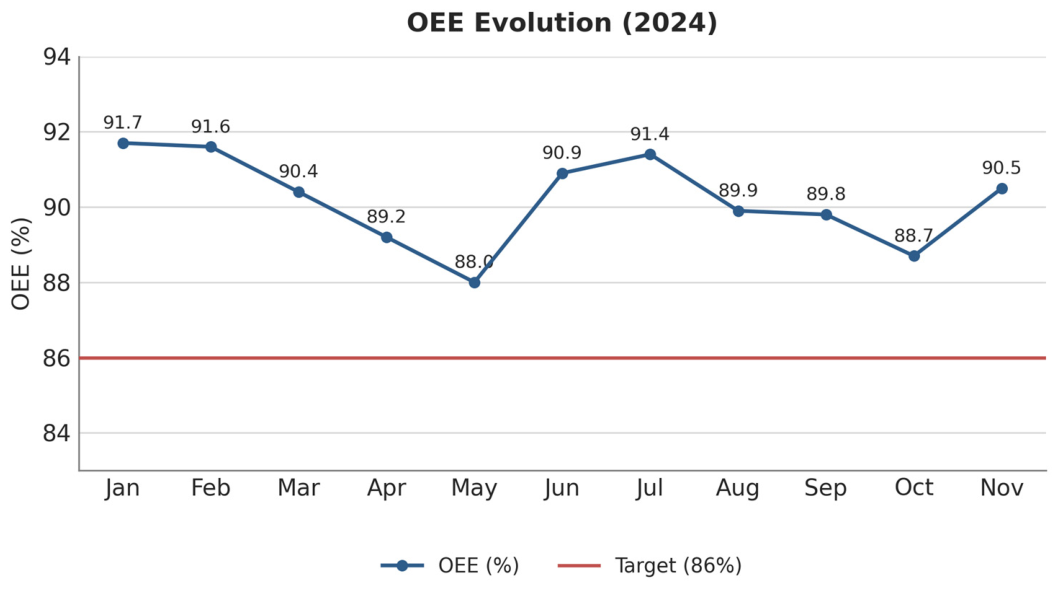
Against a company target of 86%, the monthly OEE for the part XYZ line remained above target throughout 2024, ranging between a minimum of 88.0% in May and a maximum of 91.7% in January, as shown in Figure 3. The 86% target is close to the 85% generally cited as a world-class benchmark for OEE (for example, availability of 90%, performance of 95% and quality of 99.9%) [8]. The May minimum coincides with the sharpest month-on-month rise in volume and cannot be attributed to the quality component: with a fastening-related rejection rate of 0.04% (23 nonconformities in 57,312 parts, Table A1), the quality factor was 99.96%. The company’s OEE records were not decomposed into availability, performance and quality, so the cause of the dip cannot be established. OEE also cannot be reconciled with output without the planned production time: an OEE of 91.7% in January on a 24 h, five-day schedule would imply about 56,000 parts, whereas 43,854 were produced (72% of the nominal 60,800), which indicates that planned production time was shorter than the calendar loading assumed in the rated capacity. OEE is therefore interpreted here only as an indicator of efficiency during planned time, not of utilization of available time; it is not used to infer capacity.
Figure 3.
Monthly Overall Equipment Effectiveness (OEE) of the part XYZ line versus the 86% company target, 2024.
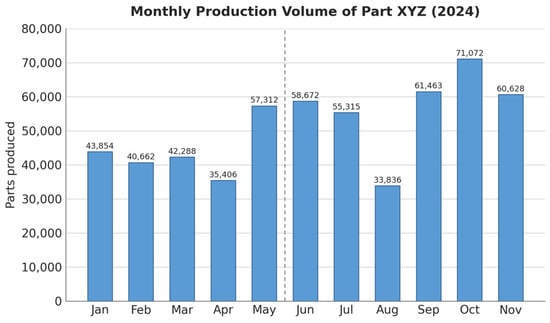
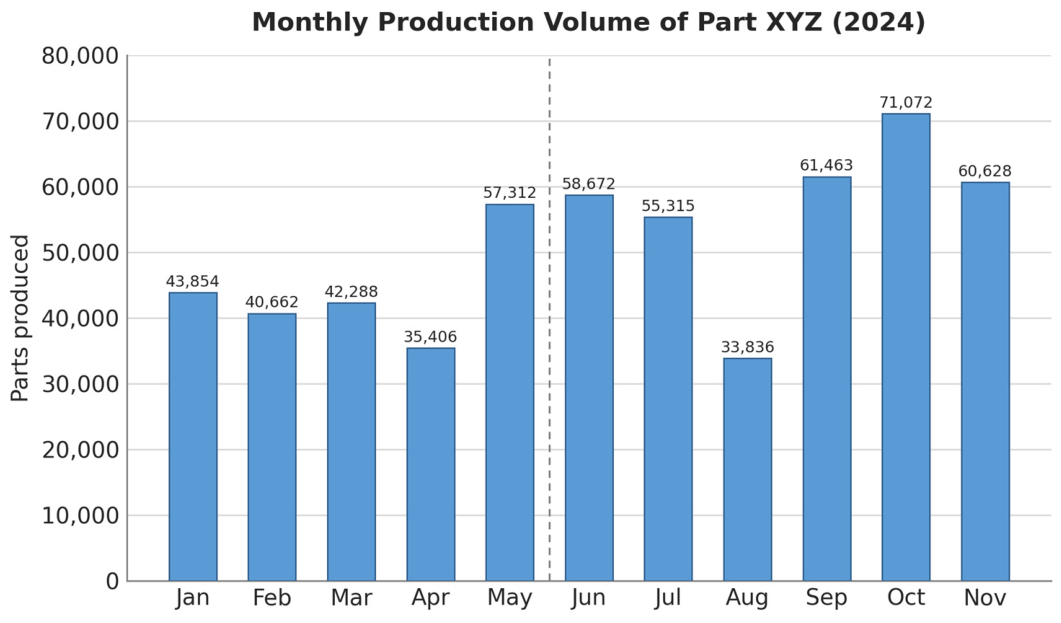
The monthly production volume of part XYZ is shown in Figure 4. Average monthly output rose from 43,904 parts/month in the January–May period (before OP8 entered series production) to 56,831 parts/month between June and November, an increase of 12,927 parts/month. This increase should not be read as a measure of capacity gained: the original configuration had a nominal capacity of about 60,800 parts/month, above the June–November average, and only October (71,072 parts) exceeded it; March and April output (42,288 and 35,406 parts, respectively) remained below January’s (43,854 parts) although the rated capacity had by then risen to 137 parts/h. Monthly output therefore followed customer orders rather than capacity, and the value of the added capacity lies in the margin it provided for peaks such as October, and in the headroom for operating below full loading.
Figure 4.
Monthly production volume of part XYZ, 2024. The dashed line separates the period before (January–May) and after (June–November) OP8 entered series production.
3.3. Machine Capability and Performance Analysis
To compare the original semi-automatic equipment (OP6/OP7) with the new automated machine (OP8), and to test hypotheses H1 and H2, 100 consecutive records of fastening torque and nut height were analyzed for each machine, bolt and product variant, as described in Section 2.3. Results are presented as follows: the recording resolution and the screening of the logged data (Section 3.3.1), the fastening torque (Section 3.3.2), the nut height (Section 3.3.3), the synthesis of H1 and H2 (Section 3.3.4), and the interpretation of logged torque, process centring and the gap between capability and observed nonconformity rate (Section 3.3.5).
3.3.1. Recording Resolution and Screening of the Logged Data
Fastening torque was recorded in steps of 0.01 Nm and nut height in steps of 0.01 mm. For torque, this leaves few distinct values per series: 7–10 for OP6 and 17–20 for OP8 (Table 3). The standard deviations of 0.015–0.018 Nm for OP6 and 0.040–0.047 Nm for OP8 correspond to only 1.5–4.7 recording steps, so rounding is not negligible and affects the Anderson-Darling test (Section 3.3.2). For nut height, there are 39–47 distinct values per series and the effect is minor.
Table 3.
Fastening-torque series (n = 100 per row): recording resolution, normality and serial dependence. AD p: Anderson-Darling p-value for the normal distribution (Stephens); resolution-aware p: Monte Carlo p-value that accounts for rounding to 0.01 Nm; r1: lag-1 autocorrelation; runs p: Wald-Wolfowitz runs test. Torque is the value logged by the controller of OP6 or OP8.
Two features of the complete September logs bear on how the series should be read. First, none of the 41,657 logged parts (83,314 torque readings and as many nut-height readings) lies outside the specification limits, for either bolt, characteristic, variant or machine, although OP8 itself rejected 152 parts for poor screw-fastening in September (Section 3.4). The logs therefore appear to contain only parts accepted by the machine, and the 100-part samples are drawn from this accepted population; the logs hold about 65% (OP6/OP7) and 73% (OP8) of the parts estimated to have been produced on each machine in September (Section 3.4). Second, torque has a hard lower bound: the lowest logged value is exactly 8.50 Nm in seven of the eight variant/machine/bolt streams (8.38 Nm in the eighth); 3.4–4.9% of the OP6 readings and 0.7–1.3% of the OP8 readings equal 8.50 Nm, and 0–8 of the 100 values of each series do so (Table 3). This bound lies 0.5 Nm inside the 8 Nm specification limit. Together with the fact that OP8 detects a missing nut because the controller then fails to reach the programmed torque (Section 3.4), it is what would be expected if the logged torque is the screwdriver controller’s own reading at shut-off, with a programmed setpoint close to 8.5 Nm, rather than an independent measurement of the joint. The programmed setpoint is not documented in the project records (Section 4), so this reading is an inference from the data.
3.3.2. Fastening Torque: Stability, Distribution, Capability and Comparison of Machines
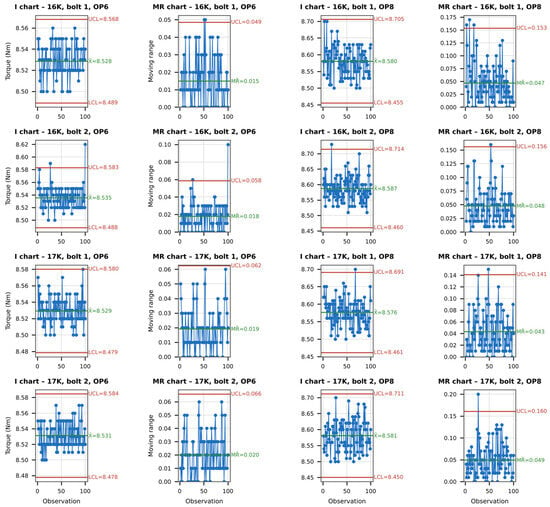
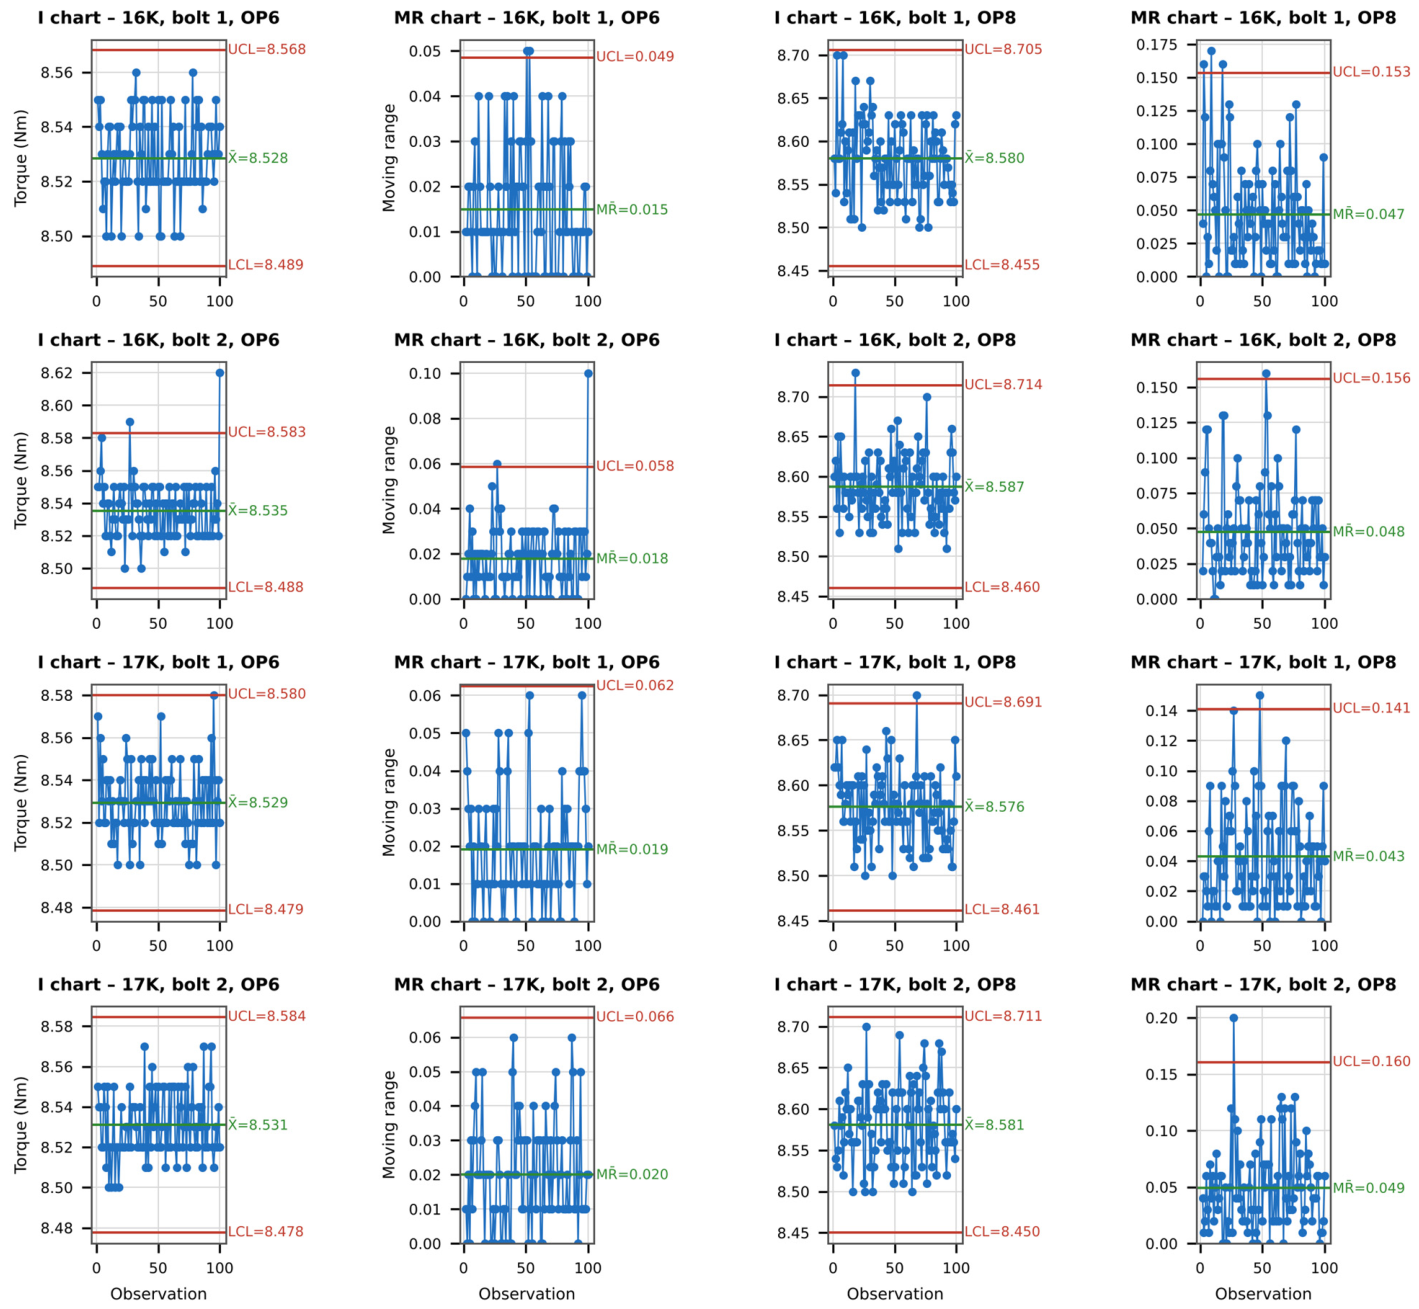
Table 3 summarizes the 100-part torque series. The I-MR charts (Figure 5) show 4 of 800 individual values and 10 of 792 moving ranges beyond their limits, and the lag-1 autocorrelation coefficients lie between −0.17 and 0.12, none significantly different from zero (smallest p = 0.09). The runs test is significant only for variant 17K, bolt 2, OP8 (p = 0.03), which does not survive correction for 16 series (Bonferroni threshold p = 0.003). Within the 100 consecutive parts studied, there is thus no evidence of instability or serial dependence, although this says nothing about stability over longer periods.
Figure 5.
Individuals and moving-range charts of fastening torque for variants 16K and 17K, bolts 1 and 2, OP6 and OP8 (Minitab-style charts; red lines: control limits, green: center line; limits estimated from the moving range of each series).
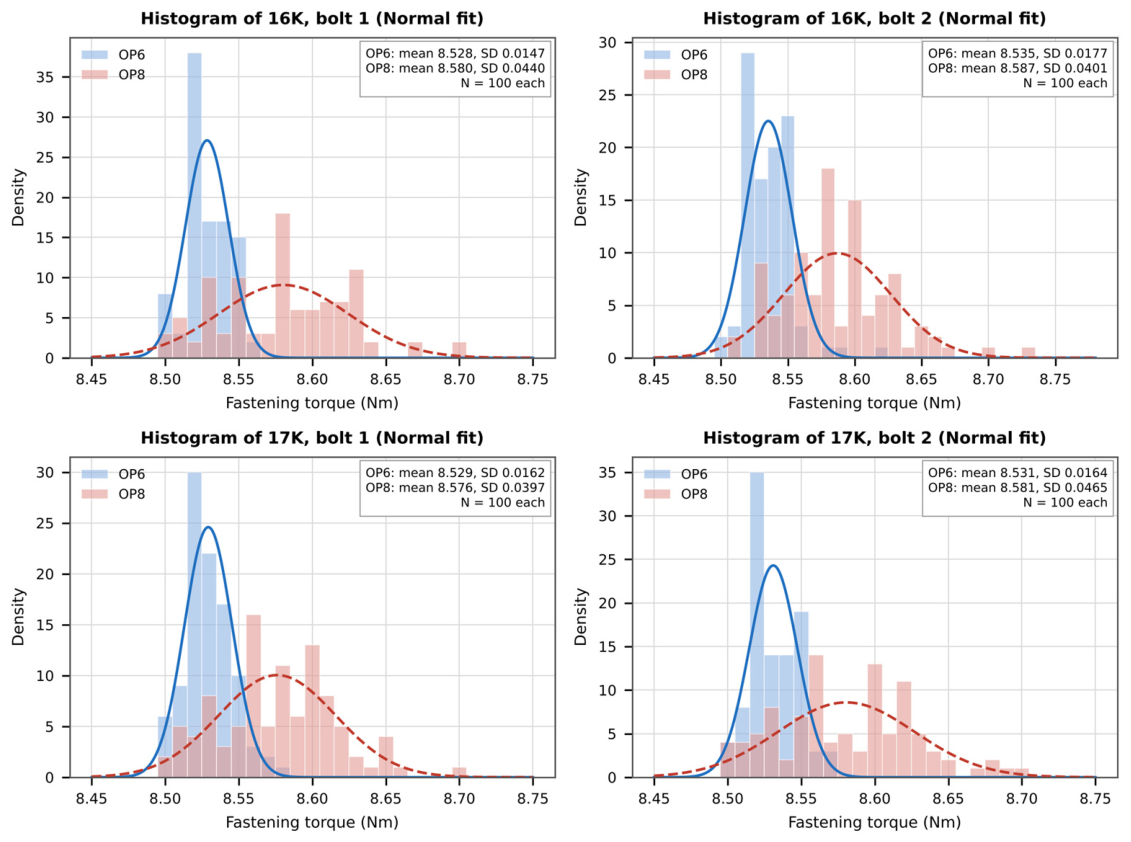
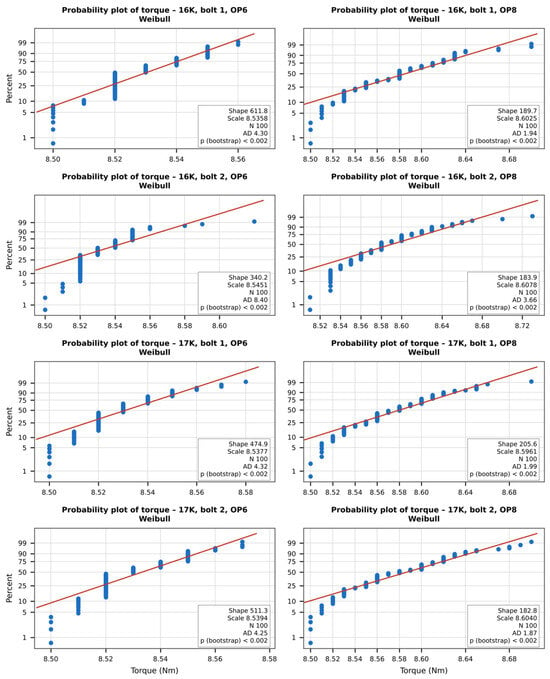
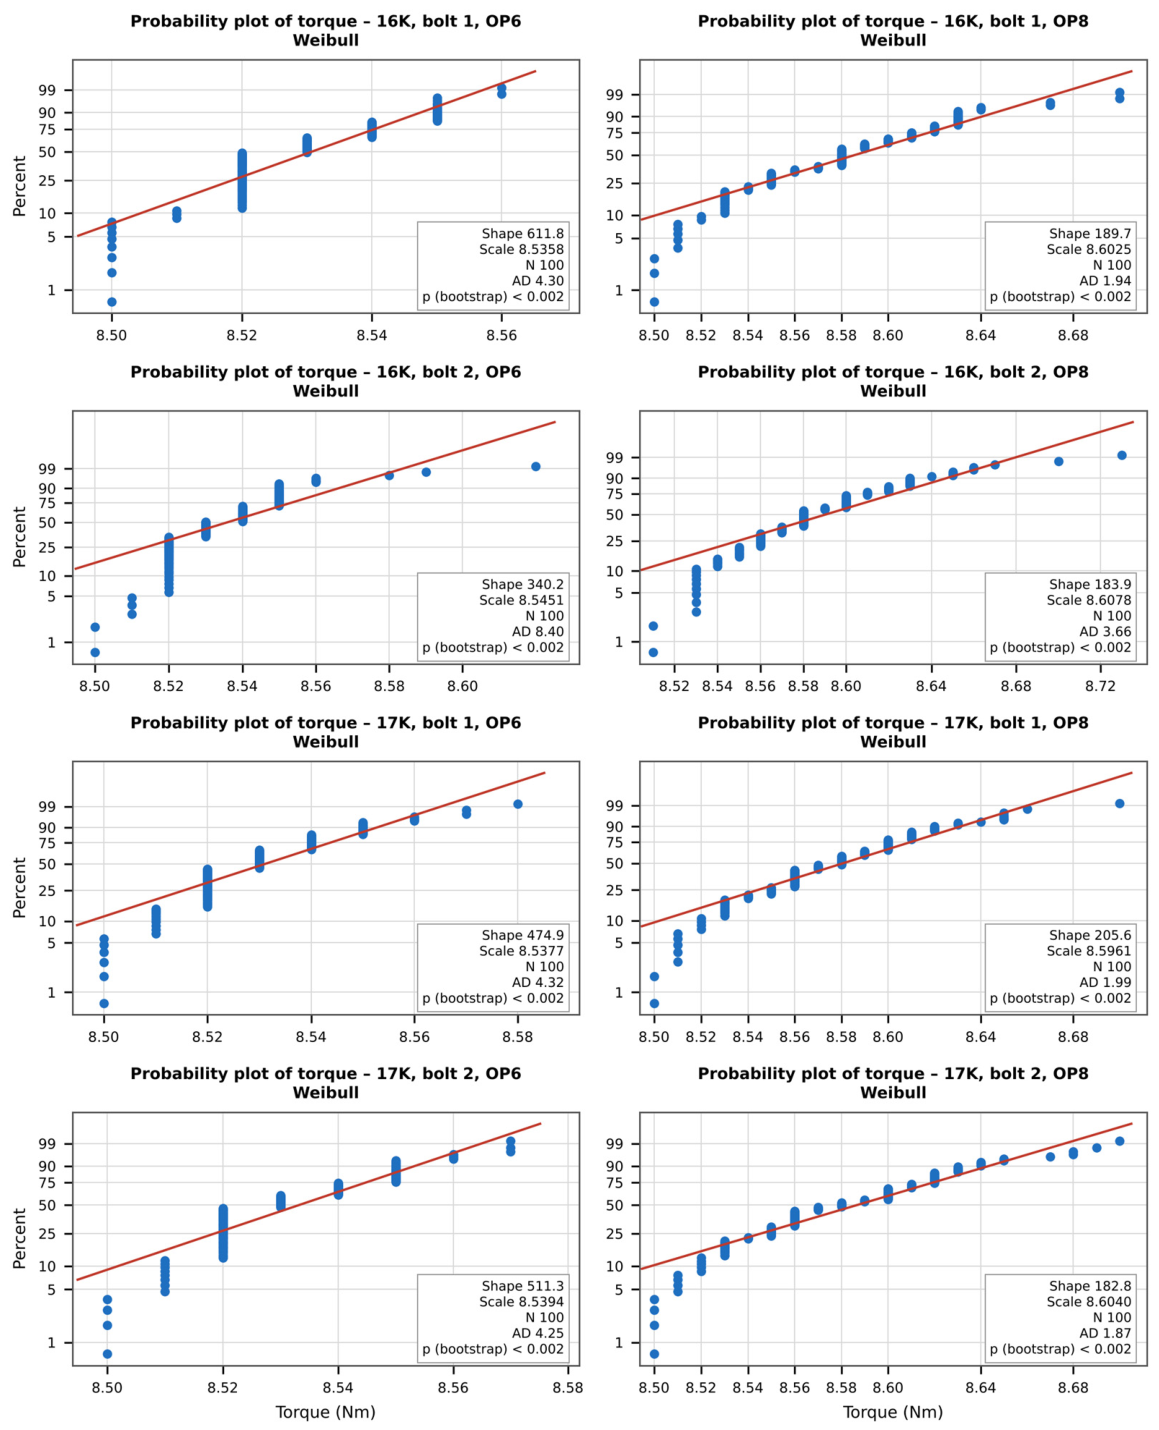
Normality was rejected (AD, p < 0.05) for all four OP6 series and for three of the four OP8 series (Table 3). When the rounding of the data is taken into account, normality is no longer rejected for any OP8 series (resolution-aware p = 0.088–0.454) nor for variant 17K, bolt 1, OP6 (p = 0.127), but it is still rejected for the other three OP6 series (p ≤ 0.006). The OP6 distributions are piled up against the lower bound described in Section 3.3.1 (Figure 6 and Figure 7), so their non-normality reflects the bounded lower tail and not only the rounding. A two-parameter Weibull model, the usual choice for skewed data, is rejected for all eight series (bootstrap p < 0.002; Table 4), and the probability plots (Figure 8) show the fitted lines departing from the discrete data. Neither model therefore describes the data, and the capability indices of Table 4 are to be read as descriptive statistics, not as estimates of a nonconforming fraction.
Figure 6.
Histograms of fastening torque for OP6 and OP8, by product variant and bolt (bin width 0.01 Nm; density scale; curves: fitted normal distributions, solid for OP6 and dashed for OP8, shown for descriptive comparison only because normality is rejected for most series).
Figure 7.
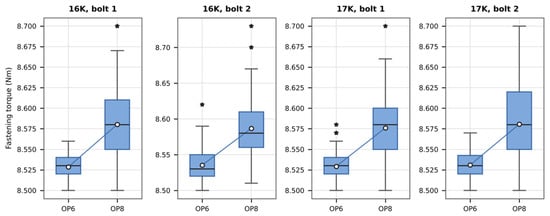
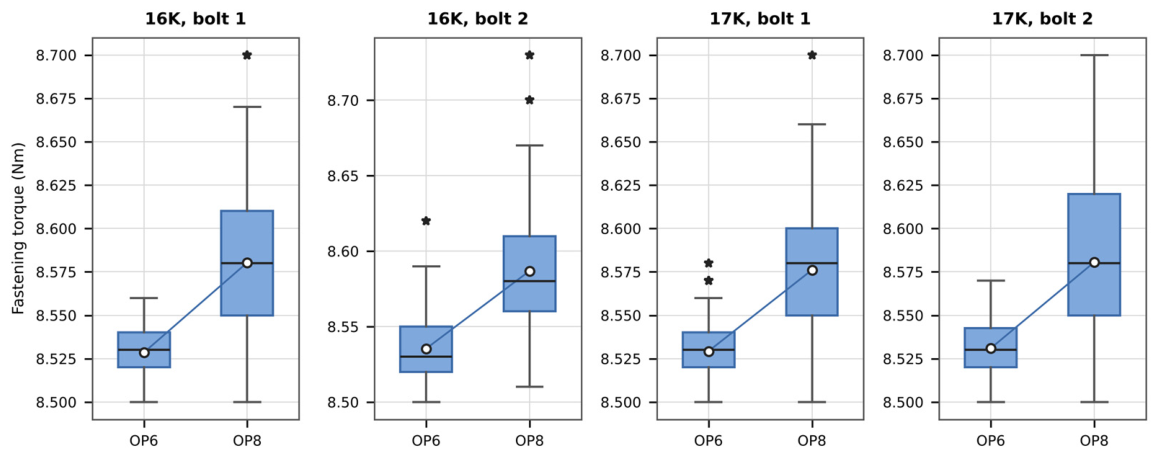
Boxplots of fastening torque for OP6 and OP8, by product variant and bolt (open circle: mean, joined by a line; asterisks: outlying values).
Table 4.
Capability indices for fastening torque (LSL = 8 Nm, USL = 10 Nm), computed identically for all series. Normal Ppk: overall standard deviation, approximate 95% interval after Bissell; Weibull: maximum-likelihood shape k and scale c (Nm), Weibull AD p: parametric-bootstrap p-value of the fit, Weibull Ppk: percentile method (Equation (3)) with bootstrap 95% interval; Cpmk: target T = 9 Nm.
Figure 8.
Weibull probability plots of fastening torque (maximum-likelihood fit, two parameters); shape, scale and the Anderson-Darling statistic of the fit are given in each panel; the fit is rejected for all eight series.
Capability indices for fastening torque are given in Table 4, computed with one method for all eight series, in normal-theory and Weibull-percentile form. Normal-theory Ppk is 10.1–12.0 for OP6 and 4.2–4.9 for OP8; Weibull-percentile Ppk is 3.5–6.1 for OP6 and 2.0–2.3 for OP8. Both methods give the same ranking: the OP6 index is higher than the OP8 index in every variant/bolt combination, by a factor of 2.1–2.7 (normal) or 1.7–2.9 (Weibull). All lower confidence limits exceed 1.33, but the intervals are wide (for example, 2.8–6.6 for the Weibull Ppk of OP6, variant 16K, bolt 2). These values are large because the nearest specification limit (8 Nm) lies about 0.5–0.6 Nm, i.e., 12–36 standard deviations, below the mean, and they extrapolate into a lower tail that the data show to be bounded at 8.50 Nm; they should not be read as quality levels. The target-sensitive index Cpmk, referred to the 9 Nm nominal value, is 0.37–0.47 for all series (Section 3.3.5).
The two machines differ clearly in torque. OP8 values are higher by a Hodges-Lehmann shift of +0.05 Nm in all four variant/bolt combinations (95% CI +0.04 to +0.06 Nm), i.e., 5% of the 1 Nm tolerance half-width, with Cliff’s delta between 0.66 and 0.78; a randomly chosen OP8 torque exceeds a randomly chosen OP6 torque with probability (1 + δ)/2 = 0.83–0.89. Because the spreads differ, the Mann–Whitney result is interpreted as stochastic dominance and not as a difference in medians. The spread of OP8 is 2.3–3.0 times that of OP6 (Brown-Forsythe p < 0.001 in all four combinations; the classical F test gives the same conclusion). Both differences replicate in the complete September logs (OP8 standard deviation 2.5 times that of OP6 in all four streams, mean difference 0.049–0.051 Nm; 14,447 versus 27,210 parts), and across the two product variants.
3.3.3. Nut Height
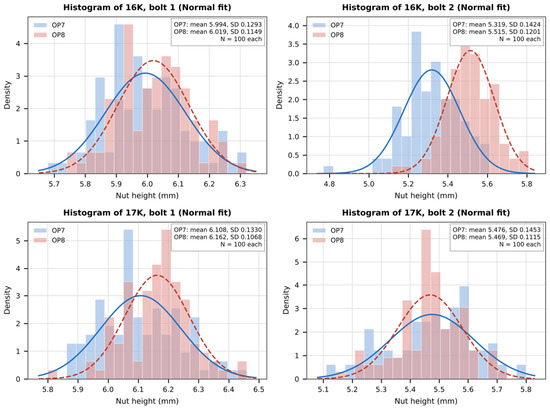
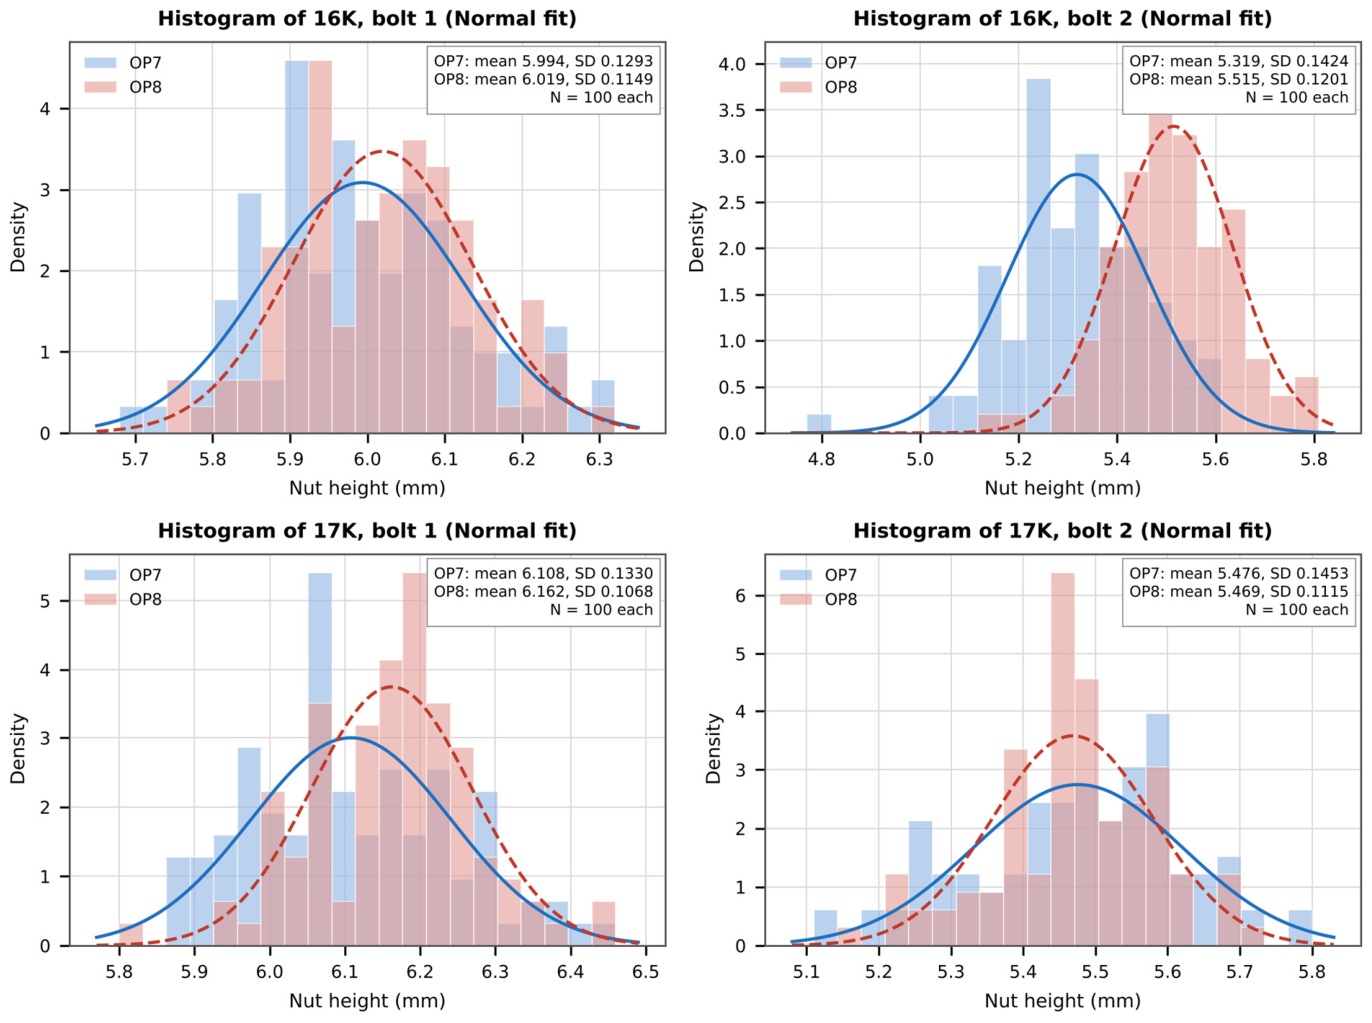
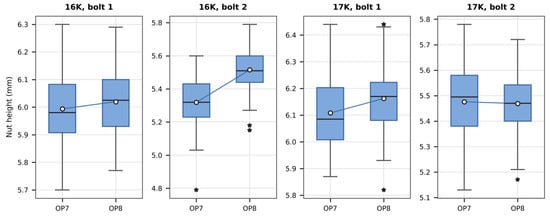
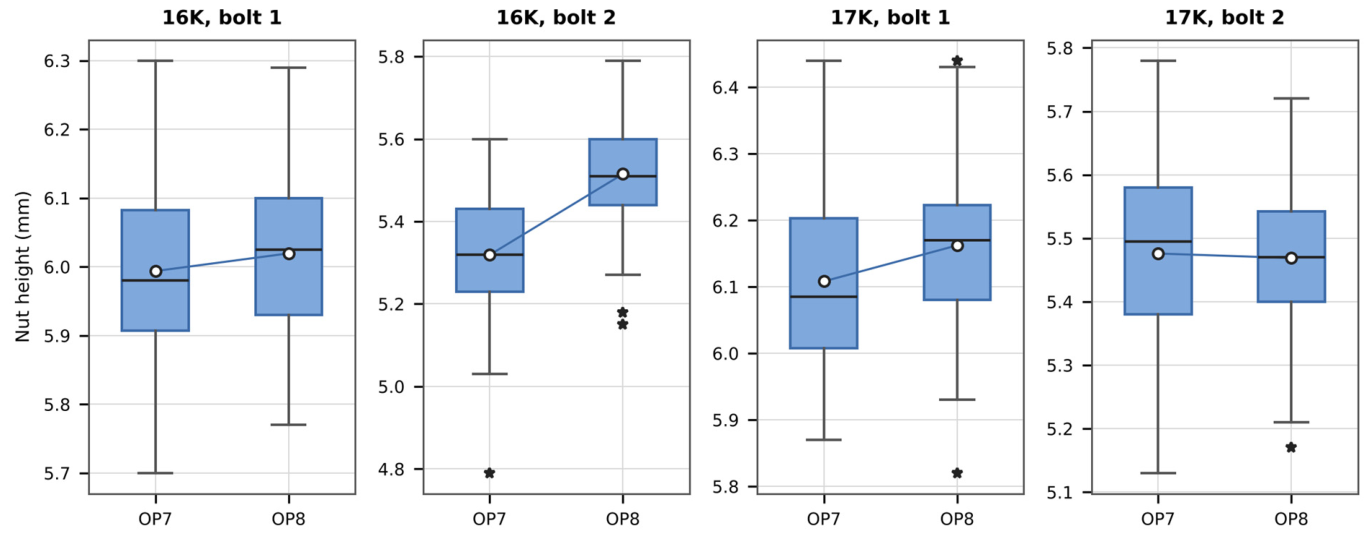
Nut-height series are summarized in Table 5. Their distributions and boxplots are shown in Figure 9 and Figure 10. Normality is rejected in one of eight series (variant 17K, bolt 2, OP7; AD p = 0.043, resolution-aware p = 0.048), which is unremarkable among 16 normality tests. The I-MR charts show 3 of 800 individual values and 6 of 792 moving ranges beyond their limits, and none of the lag-1 coefficients (from −0.04 to 0.14) is significant. Cpk and Ppk are reported together with the within and overall standard deviations: Ppk is 3.0–4.6 and Cpk 3.1–4.5, with 95% intervals of roughly ±0.4–0.7. The within standard deviation exceeds the overall one in three of eight series (variant 16K, OP7, bolt 2; variant 16K, OP8, bolt 1; variant 17K, OP8, bolt 1), but by at most 4%, with lag-1 coefficients of 0.01–0.03; this is within the sampling variability of a standard deviation estimated from 100 values (about ±7%) and does not indicate negative autocorrelation or over-adjustment. Differences of 0.1–0.5 between indices of different machines are within the confidence intervals of Table 5 and are not interpreted.
Table 5.
Nut-height series (n = 100 per row; OP7 is the nut-height station of the original configuration): mean, overall standard deviation (SD), within standard deviation (SDw = /1.128), overall and within capability indices with approximate 95% intervals, normal AD p-value and lag-1 autocorrelation (r1). Specification: 4.7–7.7 mm (bolt 1), 3.8–6.8 mm (bolt 2).
Figure 9.
Histograms of nut height for OP7 and OP8, by product variant and bolt (density scale; curves: fitted normal distributions, solid for OP7 and dashed for OP8).
Figure 10.
Boxplots of nut height for OP7 and OP8, by product variant and bolt (open circle: mean, joined by a line; asterisks: outlying values).
The OP8 nut-height standard deviation is lower than that of OP7 in all four combinations (ratio 0.77–0.89), significantly so only for variant 17K (Brown-Forsythe p = 0.019 and 0.004); after a Bonferroni correction for the eight comparisons (threshold p = 0.006) only the 17K bolt 2 difference remains. The location differences (Table 6, which also gives the torque comparison) are not systematic: the shift in OP8 relative to OP7 is +0.03 mm (not significant) for variant 16K bolt 1, +0.20 mm for 16K bolt 2, +0.06 mm for 17K bolt 1 and −0.01 mm (not significant) for 17K bolt 2, and in the complete September logs it is −0.04, +0.16, +0.13 and −0.08 mm, respectively, i.e., it changes sign between the 100-part and the full-month data in one of four cases (16K bolt 1, where the 100-part shift was not significant). The torque shift, by contrast, is the same (+0.05 Nm) for both bolts and variants. A torque effect therefore cannot account for the nut-height differences, and a calibration or reference offset between the potentiometers of OP7 and OP8, or fixture and variant effects, is at least as plausible; these cannot be separated without a measurement system analysis (Section 4). Nut-height means lie within 0.21 mm of nominal (at most 14% of the 1.5 mm half-width): −0.21 and −0.18 mm (OP7, OP8; 16K bolt 1), +0.02 and +0.21 mm (16K bolt 2), −0.09 and −0.04 mm (17K bolt 1) and +0.18 and +0.17 mm (17K bolt 2); bolt 2 therefore runs consistently above its nominal and bolt 1 below it in variant 16K, so the process is within specification but not centered.
Table 6.
Comparison of OP8 with OP6 (torque) or OP7 (nut height). Differences are OP8 minus original equipment. SD ratio: OP8/original, with F-based 95% interval; BF p: Brown-Forsythe test of equal spread; HL: Hodges-Lehmann shift (Nm for torque, mm for nut height) with 95% interval; Cliff’s δ with bootstrap 95% interval; MW p: Mann–Whitney; Welch p: Welch t-test.
3.3.4. Synthesis: Research Hypotheses H1 and H2
Regarding H1 (location differs on OP8), torque differs in all four variant/bolt combinations and nut height in two of four (16K bolt 2 and 17K bolt 1); H1 is therefore supported in six of eight comparisons, and the direction of the nut-height differences is not consistent (Table 6). Regarding H2 (lower variability on OP8), it is rejected for torque in every combination, since the OP8 standard deviation is 2.3–3.0 times higher (Brown-Forsythe p < 0.001); for nut height the OP8 spread is lower in all four combinations but significantly so in only two (one after Bonferroni correction), so H2 receives no overall support. All capability indices computed exceed the 1.33 reference (Table 4 and Table 5), but for torque this is a descriptive statement only, for the reasons given in Section 3.3.2 and Section 3.3.5.
3.3.5. Logged Torque, Process Centring and the Capability–Defect Gap
Torque means are 8.53–8.54 Nm for OP6 and 8.58–8.59 Nm for OP8, i.e., 0.41–0.47 Nm below the 9 Nm nominal, which is why Cpmk (0.37–0.47) is far below Ppk. Whether 9 Nm is also the programmed target is not documented (Section 4); if the setpoint is about 8.5 Nm, as the lower bound in the data suggests (Section 3.3.1), the quantity actually described by the series is the overshoot of the controller beyond its setpoint (on average 0.03–0.09 Nm), which is larger and more variable on OP8, and Cpmk relative to 9 Nm is not a meaningful measure. In either case the logged torque is the machine’s own end-point value, and the indices computed from it describe how repeatably the controller reaches its own threshold, not how well the joint is tightened. VDI/VDE 2645-2 prescribes a machine-capability study for this purpose [21], and ISO 5393 describes the verification of the torque repeatability of the tool and of the precision of its built-in torque measurement [22]; neither was carried out in this project. Torque-angle monitoring, which is able to flag a skewed or cross-threaded nut that nevertheless reaches the target torque, would also address the defect more directly than final torque alone [23].
The gap between capability and defects must be stated precisely. A Ppk of 2.0–2.3, the Weibull values for OP8, corresponds to a model-implied out-of-specification fraction below 0.001 ppm; this is the expected value of a model, because a sample of 100 parts can only show 0 or a multiple of 10,000 ppm. The attribute rate observed in series production is of a different kind. In June, July and September, for which the OP8 share of output is available, OP8 produced about 56,200 parts and 370 of them were rejected for poor screw-fastening, a rate of 0.66% (95% CI 0.59–0.73%), and 0.77% (0.66–0.91%) in September, whereas OP6 had 38 rejects in about 119,200 parts (0.032%; 0.023–0.044%), about 21 times lower (Table 7). At a true rate of 0.77% a 100-part sample is free of defects with probability 0.46, so a clean 100-part sample is not surprising and the discrepancy is between the tail extrapolation of a model and a real attribute rate, not between two observed rates.
Table 7.
Poor screw-fastening rejects by machine in the months for which the OP8 share of output is available. OP8 and OP6 outputs are estimated from the monthly total and the share read from Figure 2; rates in % with Wilson 95% intervals.
The way in which the defect is defined narrows the explanations. Poor screw-fastening is a nut-height nonconformity, i.e., a bolt that reaches the target torque but whose nut does not reach the specified height, and it is detected by the machine’s own nut-height check (Section 3.4). Nut-height Cpk values of 3.1–4.5 are incompatible with an out-of-specification rate of 0.6–0.8% if the same readings were used. The resolution is the screening of Section 3.3.1: not one of the 14,447 parts logged by OP8 in September is outside the nut-height or torque limits, whereas 0.77% of them (about 112) would be expected to be if rejected parts were logged. The logs, and with them, the capability samples, therefore describe the population that has passed the machine’s own limits, a truncated distribution from which neither the nonconforming fraction nor the capability of the process can be estimated. This weakens the alternative that torque and nut height are simply not the drivers of the defect (the root causes found in Section 3.4 concern alignment and feeding), and leaves the absence of an independent measurement system as a third, untested contribution. Resolving the gap requires a study that logs all parts including rejected ones, an independent torque and height measurements and a gage study [37,38].
3.4. Nonconformity Analysis and Economic Impact
The increase in production speed and the automation of the fastening process were accompanied by an increase in nonconforming parts. Two nonconformity categories, both detected at OP8 and, for poor screw-fastening, also at OP6, were identified during the project: “poor screw-fastening” (bolts reaching the target torque while remaining misaligned or skewed, so that the specified nut height is not achieved) and “missing nut” (the screwdriver tip loses the nut before it reaches the bracket pin, so that only one of the two nuts is fastened). Both defect types are detected by the torque and nut-height checks integrated into the machines, which prevents these parts from continuing in the normal flow; the effectiveness of this detection was not verified independently, and the project records do not show whether any affected part was shipped before the “missing nut” defect was identified in October (Section 4).
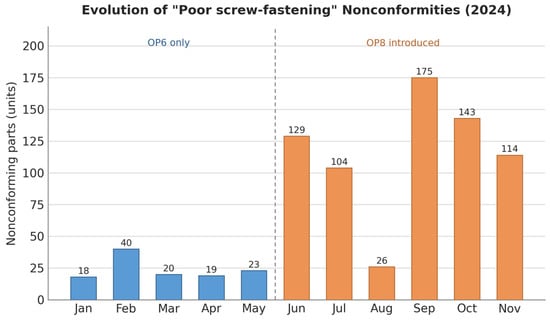
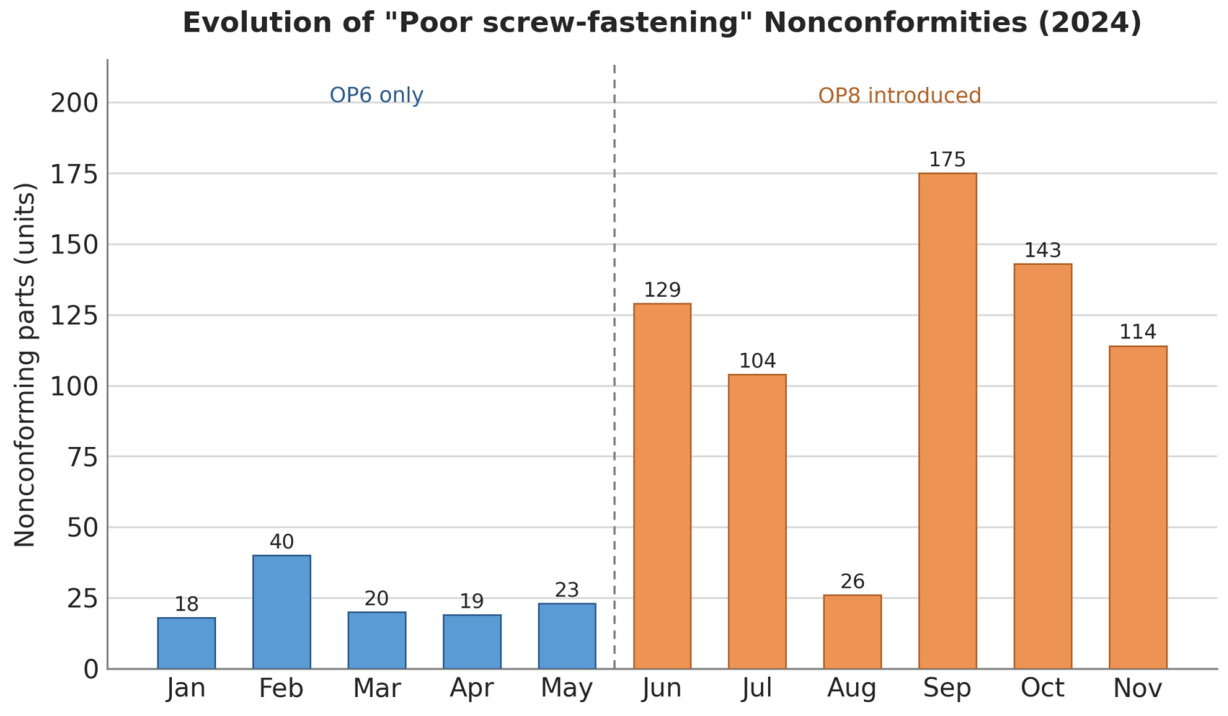
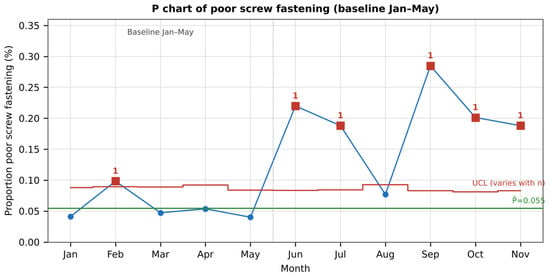
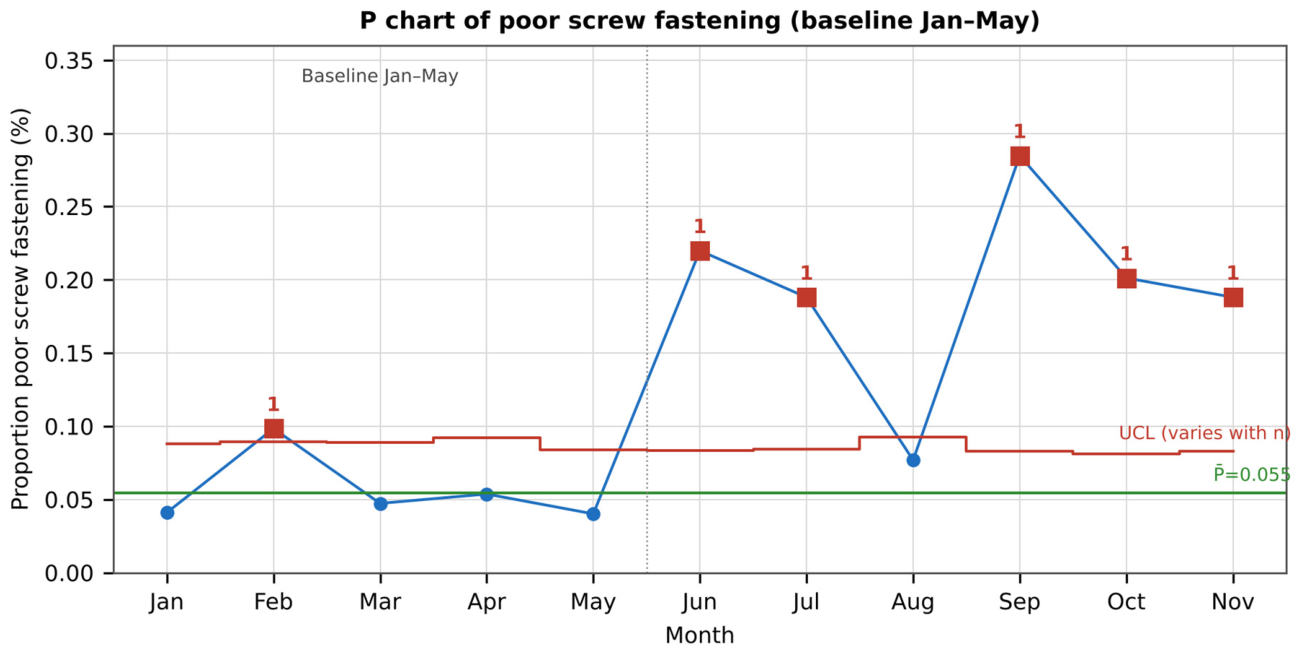
Figure 11 shows the monthly evolution of “poor screw-fastening” nonconformities throughout 2024. Between January and May, while the line still operated exclusively with OP6, an average of 24 parts/month were rejected for this defect (120 in 219,522 parts, 0.055%; 95% CI 0.046–0.065%). From June 2024, when OP8 entered series production, the count averaged 108.5 parts/month in June–September (434 in 209,286 parts, 0.207%) and 115.2 parts/month over the whole June–November window (691 in 6 months), peaking at 175 parts in September (0.285%; 0.246–0.330%). The pooled rate in June–September is 3.8 times the January–May baseline, a smaller multiple than that of the counts because monthly output also rose (Section 3.2). On a p-chart with baseline limits, five of the six months from June to November (all except August, the holiday month) lie above the upper control limit; February (0.098%, upper limit 0.089%) also exceeds the limit within the baseline period itself, a single point that is much closer to the limit than any month after May.
Figure 11.
Monthly evolution of “poor screw-fastening” nonconformities, 2024.
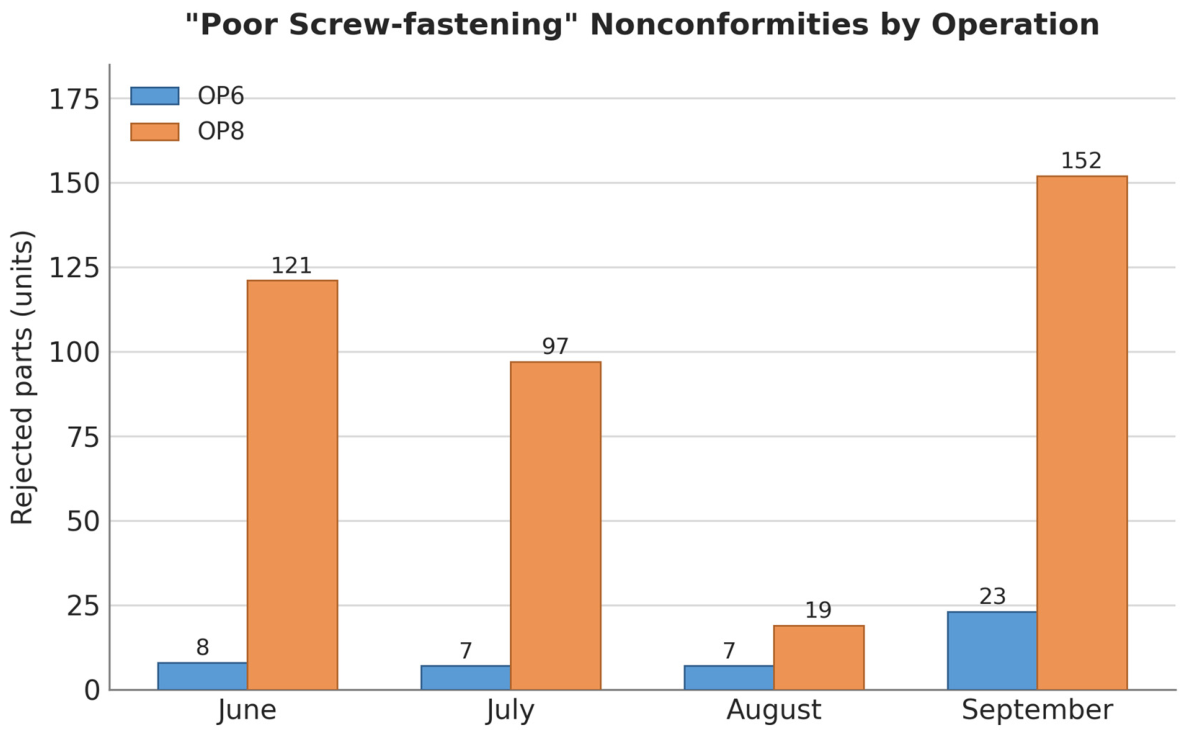
Figure 12 breaks down these nonconformities by originating operation for the June–September 2024 period: of 434 rejects, 389 (90%) originated from OP8 (121, 97, 19 and 152 in June to September) and 45 from OP6 (8, 7, 7 and 23). OP8 therefore accounts for most, but not all, of the increase, and OP6 itself recorded 23 rejects in September, its highest of the period; OP8’s share of rejects (87% in September) is far above its share of output (32%).
Figure 12.
“Poor screw-fastening” nonconformities by originating operation, June–September 2024.
Relative to total output, the pooled rejection rate rose from 0.055% (January–May) to 0.207% (June–September) and was 0.195% in October–November (257 in 131,700 parts), as shown in Figure 13. The October–November rate is not different from that of June–September (Fisher’s exact test, p = 0.46) and remains 3.6 times the baseline. The increase in nonconformities attributable to OP8 remained a small fraction of total production (0.66% of OP8 output in June, July and September, Table 7) throughout the period analyzed.
Figure 13.
p-chart of the monthly rate of “poor screw-fastening” nonconformities, 2024: baseline (January–May) center line (green) and 3-sigma upper limit (red step line, varying with monthly output; points beyond it in red) applied to all months.
Root-cause analysis of the “poor screw-fastening” defect, using an Ishikawa (cause-and-effect) diagram structured around the 6M framework (Material, Method, Measurement, Manpower, Machine, Environment) complemented by a 5-Whys analysis (Figure A1 and Figure A2, Appendix B), identified the following main contributing factors: (i) manpower/method—the manual handling and positioning of the folded subassembly at the upstream OP3 operation, and inconsistent alignment of the component bracket pins when the subassembly was placed on the OP8 base; (ii) machine—insufficient physical retention in the original OP8 base design, which did not reliably guarantee pin alignment; and (iii) material—minor perpendicularity deviations of the metallic bracket, associated with tool wear in the supplier’s stamping process, although measurements and the material certificate confirmed that the nuts themselves remained within the specified deformation tolerance (9.78–10.00 mm). This tolerance is the dimension of the deformed (self-locking) section of the nut as supplied, specified on the nut drawing as 10 mm with a lower deviation of −0.22 mm; it is distinct from the nut height measured after fastening (Section 3.3.3). No cause was identified in the Environment branch, and the Measurement branch could not be investigated beyond the machine’s own checks.
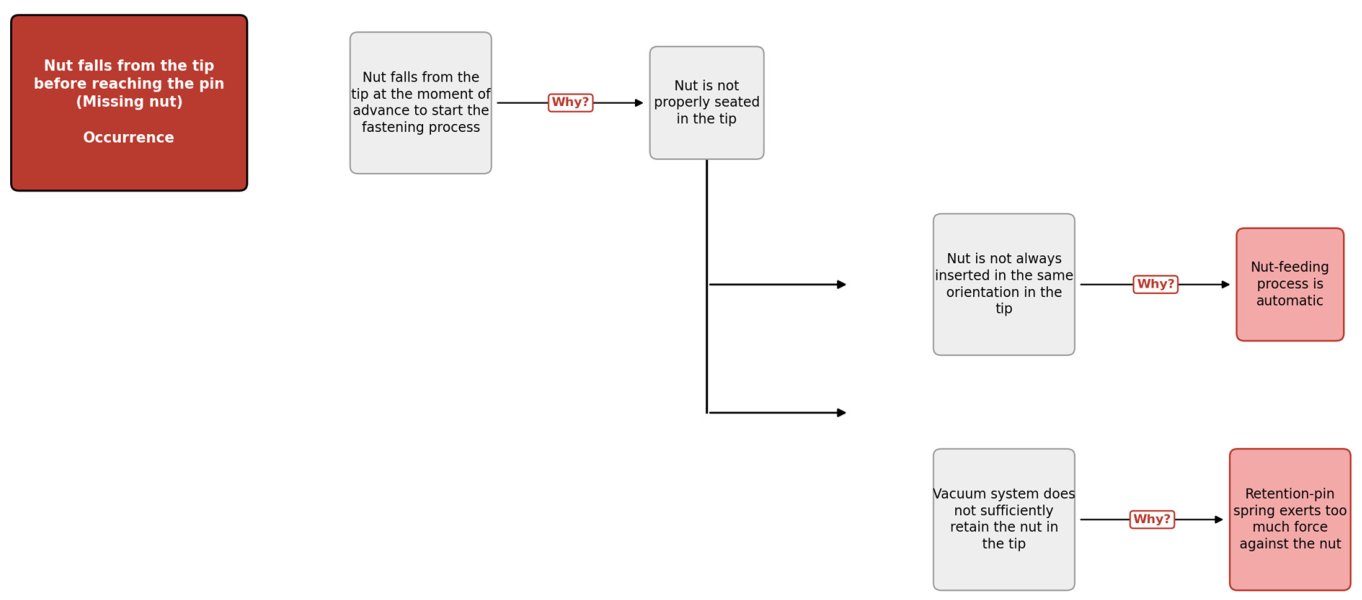
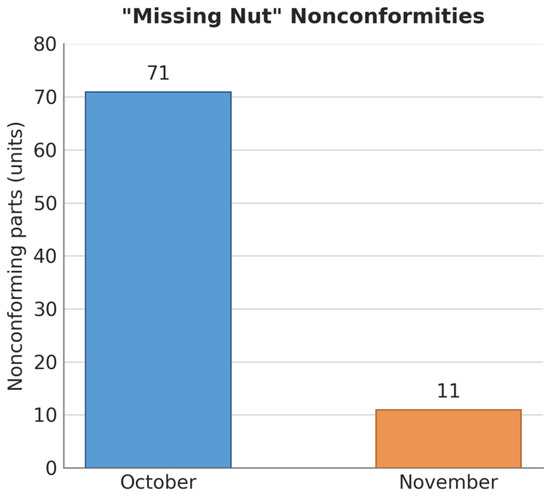
A second, initially unmonitored defect—“missing nut”—became apparent in early October 2024, when the automated feeding tip was found to occasionally lose a nut before it reached the bracket pin, causing a fastening-torque error at the point of verification. During October, 71 parts were rejected for this defect (0.100% of 71,072 parts; Figure 14). 5-Whys analysis (Figure A3, Appendix B) traced the root cause to the retention spring of the feeding tip, which pressed against the nut with enough force to overcome the vacuum system intended to hold it in place during the advance movement of the tip.
Figure 14.
“Missing nut” nonconformities, October–November 2024.
The increase in nonconforming parts also had a measurable economic impact through the rework process. Once validated by the customer for inclusion in the company’s existing rework circuit, nonconforming parts with the “poor screw-fastening” defect were reworked by unscrewing and reapplying both nuts. The unit rework cost, combining labor time and the cost of the two discarded nuts (€0.0298 per pair), is €0.113 per part (Equation (9)). Between June and November 2024, 626 parts of part XYZ originating from OP8 were recovered through this process, corresponding to a total rework cost of approximately €70.8 (Equation (10); the project report gives €70.61 because it rounds the labor cost per part to €0.083 before multiplying; note that the report writes the rework time in its formula as 1.50 min, whereas its result of €0.083 corresponds to 0.50 min at €9.99 per hour, the value used here, so the rework time per part should be confirmed with the company). This estimate reflects only rework labor and material cost; it excludes the capital cost of OP8, installation and validation, engineering hours, line downtime during industrialization and the cost of the additional operator added in February 2024 (Table 2), so it should not be read as a payback or ROI analysis. The 626 reworked parts refer to poor screw-fastening only. The 691 poor screw-fastening rejects of June–November include 45 from OP6 in June–September (Figure 12) and an OP6 share in October–November that is not itemized, so at most 646 are known to be OP8 parts; the difference of at most 20 parts (3%) from the 626 reworked is not itemized in the records. The 82 “missing nut” parts (71 in October, 11 in November) are a separate category and are not part of this rework count, so the total of 773 recorded defects (691 + 82) is not comparable with the 626 reworked parts.
Unit rework cost = (Labor rate/60) × Rework time + Nut pair cost = (9.99/60) × 0.50 + 0.0298 = 0.113 €/part
Total rework cost = Unit rework cost × Parts reworked = 0.113 × 626 ≈ 70.8 €
3.5. Improvement Actions Implemented
Based on the root-cause analysis described in Section 3.4, five improvement actions were implemented to address the “poor screw-fastening” defect, and two additional actions were implemented to address the “missing nut” defect. Table 8 summarizes these actions together with the root cause each one addresses. Their implementation dates were not recorded in the project documentation; the only timing documented is a 4-day trial, across the production shifts, of the first insertion method before the second method was adopted. The first action changed three parameters of the fastening cycle: in the pre-fastening phase to the left, the time was increased from 1 s to 1.5 s and the speed and power were reduced from 5% to 3% and from 10% to 5%, respectively and in the final pre-fastening phase to the right, speed was reduced from 20% to 10% and power increased from 30% to 40%.
Table 8.
Improvement actions implemented during the Improve phase of the DMAIC cycle.
3.6. Consolidated Results (Control)
Figure 11 and the p-chart of Figure 13 show the monthly evolution of the “poor screw-fastening” defect after the improvement actions: after peaking at 175 parts in September, monthly rejections fell to 143 in October and 114 in November (a 35% decrease in counts), and the rate declined from 0.285% in September to 0.201% in October and 0.188% in November. These rates are at the level of the June–September pooled rate (0.207%) and remain 3.4–3.7 times the baseline, and October and November remain above the upper control limit. Because the implementation dates are unknown, because monthly data cover only two months after a single peak and because some regression towards the mean is to be expected after an extreme month, the reduction cannot be credited to the actions. For the “missing nut” defect the rejections fell from 71 parts in October (0.100%) to 11 in November (0.018%; Fisher’s exact test, p < 0.001), a change that is consistent with the effect expected from removing the retention spring and from the PLC logic that reapplies a nut when the target torque is not reached, but whose timing relative to the actions is likewise not documented.
Overall, by the end of the study period (November 2024) the production line for part XYZ combined a rated capacity increase of 36 parts/h (30.8%) and 4320 parts/week (30.8%) relative to the January 2024 baseline, of which 8 parts/h (22%) is associated with OP8 itself, an OEE above the 86% company target, and fastening torque and nut-height processes within the specification limits on both machines, although with a torque spread 2.3–3.0 times larger on OP8 than on OP6 and an attribute defect rate on OP8 that is about 21 times that of OP6. The rate of poor screw-fastening in November (0.188%) was 3.4 times the pre-OP8 baseline.
4. Discussion
The results illustrate a pattern already suggested in the literature: automating a manual or semi-automatic assembly operation can deliver a substantial capacity gain, but this gain is not automatically accompanied by an equivalent quality gain, and may in fact coincide with a temporary deterioration in quality if the automated equipment is not able to absorb the variability inherent to upstream manual operations [1,7]. In this study, the 30.8% increase in rated capacity (Section 3.2)—of which OP8 itself accounts for only 8 of the 36 parts/h gained—was accompanied by a 3.8-fold increase in the pooled rate of “poor screw-fastening” nonconformities (0.055% to 0.207%, June–September), concentrated on OP8 (0.66% of its output, about 21 times the OP6 rate). The machine-logged measurements do not show a comparable deterioration: OP8 torque is more dispersed than OP6 torque by a factor of 2.3–3.0, but all logged values are within specification and the capability indices, whatever method is used, are far above 1.33. The gap between this capability picture and the observed defect rate is the capability–defect gap of Section 3.3.5.
The gap has a more mundane reading than a failure of capability analysis. Capability indices computed from the readings that pass a machine’s own limits describe a truncated population and cannot, by construction, reflect the parts the machine rejects; and an index of a single monitored variable cannot predict an attribute defect driven by something else, here alignment of the pins and feeding of the nuts. What the data do show is that the new machine is not demonstrably more capable than the equipment it replaced: its torque spread is larger, its nut-height spread is somewhat smaller (significantly so in one of two variants), and its defect rate is higher; the nonconformities were more plausibly attributable to the machine’s sensitivity to upstream variability in manual subassembly handling and to an initially unrefined base design and work method, both better addressed through Lean-type actions (standardized work, poka-yoke-oriented fixture redesign) than through statistical process adjustment [3,6]. This is consistent with the Lean Six Sigma premise that capacity and quality objectives may compete in the short run and that a structured approach such as DMAIC helps to manage the tension explicitly [11,13]. The reduction in defects after the improvement actions cannot be credited to them with the data available (Section 3.6).
From an OEE standpoint, the monthly indicator remained above the 86% target throughout 2024, including during the months of highest nonconformity incidence. Since the rejection rate is below 0.3% of output, its direct effect on the quality factor of OEE is below 0.3 percentage points, which explains why OEE did not register the quality problem; OEE aggregated at the line level is not sensitive to a defect of this size, and the planned time and ideal cycle time were not available to decompose it (Section 2.3). The unit rework cost is small (€0.113 per part), but a complete economic assessment of OP8, including capital, installation, validation and additional labor costs, was outside the scope of the data available and would be required before a payback period or return on investment can be stated.
Compared with previous Lean Six Sigma case studies in automotive component manufacturing [1,12,39,40], this study contributes a concurrent comparison of the original and the replacement machine on the same days (Section 2.3), with each hypothesis tested per characteristic, bolt and product variant, rather than a before/after comparison confounded by other simultaneous changes on the line. The concurrent design limits confounding by time-varying factors but does not remove differences between the parts, operators and positions served by each machine, since the samples are independent and not matched. More broadly, the statistical framework follows established capability-analysis practice [14,15,27], extended with the percentile-based treatment of non-normal data [17,18,19,20]. That the capability of one monitored variable does not predict an attribute defect driven by another is known to quality practitioners; the contribution here is to document the gap with data for a newly automated station, to show that screening of the logged data and the nature of the logged torque are the leading explanations, and to indicate the studies needed to close it (a machine-capability study according to VDI/VDE 2645-2 [21], an independent measurement-system analysis [37,38] and logging of rejected parts).
The main limitations are the following. (1) The capability comparison rests on 100 consecutive parts per variant and machine from a single day, so it describes short-term performance only, and the comparison is concurrent but not matched. (2) The logged values appear to contain only accepted parts, the logged torque appears to be the controller’s own shut-off value, and no independent measurement system analysis or machine-capability study was carried out; the capability indices are therefore descriptive. (3) The programmed torque setpoint, the reason why production could not be concentrated on OP8, whether torque or nut height is a special characteristic of part XYZ with a customer-specified Ppk threshold, the effectiveness of detection of affected parts before October 2024 and the dates on which the improvement actions took effect are not documented in the project records. (4) OEE values are monthly aggregates without their planned time and ideal cycle time, and the OP8 share of output is known only as an integer percentage for five months. (5) The economic analysis covers only rework labor and material. (6) The study concerns one product on one line of one company, and the effect of the actions is observed over two months after a single peak.
5. Conclusions
This study quantified the capacity gain, and critically re-examined the capability results, of integrating a new automated screw-fastening machine into a safety-module assembly line at an automotive safety-components manufacturer, using an Action-Research strategy structured around the Lean Six Sigma DMAIC cycle. Rated hourly production capacity increased by 30.8%, from 117 to 153 parts/h, of which 8 parts/h (22%) is associated with the new equipment—the remainder resulting from an added operator and work-method redefinition (20 parts/h) and a layout-improvement workshop (8 parts/h)—while OEE remained above the company’s 86% target throughout 2024.
Regarding the research questions posed in Section 1, the capacity of the line increased, mainly through organizational and workflow changes rather than through the automated machine itself (RQ1); OP8 produced a higher torque (by 0.05 Nm) with a spread 2.3–3.0 times larger than OP6, a lower nut-height spread that was significant in only one product variant, and nut-height location differences that were inconsistent between bolts and variants (RQ2); hypothesis H1 is supported in six of eight comparisons and H2 is rejected for torque and unsupported for nut height. Capability indices computed from the machine-logged data are far above 1.33 but, because the logged data appear to contain accepted parts only and the torque appears to be the controller’s own end-point value, they do not explain or predict the 0.66% rate of poor screw-fastening observed on OP8 (about 21 times that of OP6) (RQ3). The reduction in rejections after the improvement actions cannot yet be credited to them.
The main lessons learned relate to the value of structuring an industrial capacity-increase project around the DMAIC cycle: the Define phase ensured that the project scope and objectives were clearly established before data collection began; the joint Measure/Analyze phase concentrated improvement effort on the highest-impact problems within a limited project timeframe; and the Improve phase translated root-cause findings into concrete equipment, fixture and method changes. The project also shows that capability studies of automated stations should be based on independent measurements and on data that include rejected parts, and that improvement actions should be dated so that their effect can be assessed with a control chart. Sustaining the capacity gain required an explicit balance between productivity and quality objectives, since measures that are beneficial from a quality standpoint—such as a slower, more controlled fastening cycle—are not always aligned with the drive to reduce cycle time and increase throughput.
Future work should, in order of priority: (i) carry out a machine-capability study of the fastening machines according to VDI/VDE 2645-2 and ISO 5393, with an independent torque transducer and, in parallel, a measurement system analysis of the nut-height potentiometers; (ii) log all parts, including those rejected, and add torque-angle monitoring to the fastening cycle, so that capability and the attribute defect rate can be related; (iii) repeat the comparison over a longer, multi-shift sampling window with control charts and with dated improvement actions; (iv) complete an economic analysis of the OP8 investment that includes capital, installation and labor costs; (v) evaluate a redesigned assembly sequence that introduces a dedicated nut pre-positioning station upstream of OP8, analogous to the one already used on OP6, to reduce reliance on the automated nut-feeding mechanism identified as the root cause of the “missing nut” defect; and (vi) pursue the elimination of one of the operations currently performed at OP1 as the next step toward further increasing the capacity of this production line.
Author Contributions
Conceptualization, E.T.; methodology, E.T.; validation, A.R. and F.C.; formal analysis, A.R. and F.C.; investigation, E.T.; resources, E.T.; data curation, E.T.; writing—original draft, E.T.; writing—review and editing, E.T. and A.R.; supervision, A.R. and F.C.; project administration, A.R. and F.C. All authors have read and agreed to the published version of the manuscript.
Funding
This paper was funded by national funds and FCT/MCTES (PIDDAC), through the Foundation for Science and Technology, I. P. (FCT) under the scope of the project UID/05549/2025 (https://doi.org/10.54499/UID/05549/2025), LASI-LA/P/0104/2020 (https://doi.org/10.54499/LA/P/0050/2020) and project 2023.13382.PEX Fábrica para Pessoas, Processos e Tecnologia (https://doi.org/10.54499/2023.13382.PEX).
Institutional Review Board Statement
Not applicable.
Informed Consent Statement
Not applicable.
Data Availability Statement
The original contributions presented in this study are included in the article. Further inquiries can be directed to the corresponding author.
Conflicts of Interest
The authors declare no conflicts of interest.
Abbreviations
The following abbreviations are used in this manuscript:
| AD | Anderson-Darling |
| BF | Brown-Forsythe |
| CI | Confidence interval |
| Cp, Cpk | Process capability indices (within standard deviation) |
| Cpm, Cpmk | Target-sensitive capability indices |
| DMAIC | Define, Measure, Analyze, Improve, Control |
| HL | Hodges-Lehmann |
| IATF | International Automotive Task Force |
| I-MR | Individuals and moving range (chart) |
| LM | Lean Manufacturing |
| LSL, USL | Lower and upper specification limits |
| LSS | Lean Six Sigma |
| MR | Moving range |
| MSA | Measurement system analysis |
| OEE | Overall Equipment Effectiveness |
| PAI | Process Analysis & Improvement |
| PLC | Programmable Logic Controller |
| Pp, Ppk | Process performance indices (overall standard deviation) |
| PPAP | Production Part Approval Process |
| ppm | Parts per million |
| SD | Standard deviation |
| SS | Six Sigma |
Appendix A
Table A1.
Monthly production volume, “poor screw-fastening” nonconformities and rejection rate, 2024.
Appendix B
The following supplementary figures, produced during the underlying project, are included as support for the root-cause discussion in Section 3.4: the Ishikawa diagram and 5-Whys analyses. A post-intervention line-layout figure and a Project Charter figure were also produced during the project but are not reproduced here for company confidentiality reasons.
Figure A1.
Ishikawa (cause-and-effect) diagram for the “poor screw-fastening” defect, structured around the 6M framework, referenced in Section 3.4.
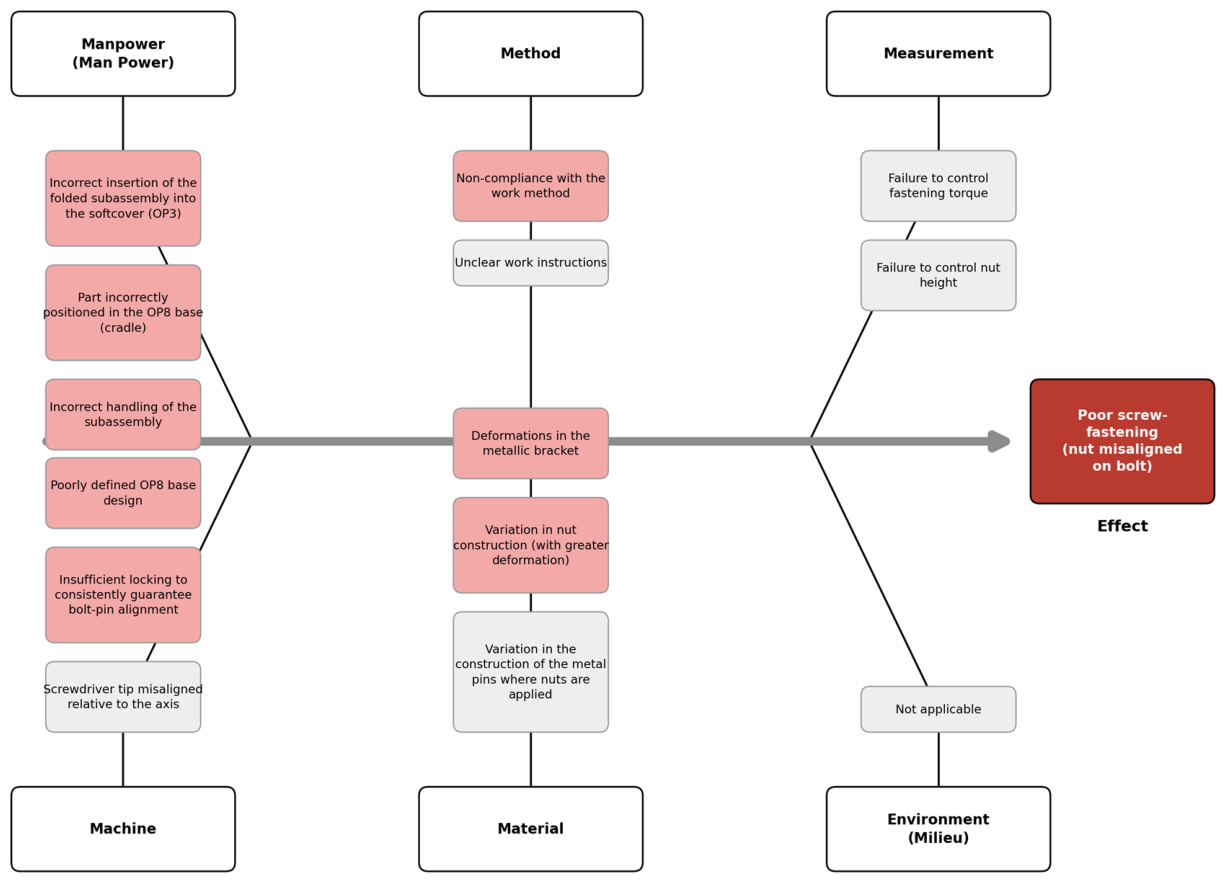
Figure A2.
5-Whys root-cause analysis for the “poor screw-fastening” defect, complementing the Ishikawa diagram in Figure A1.
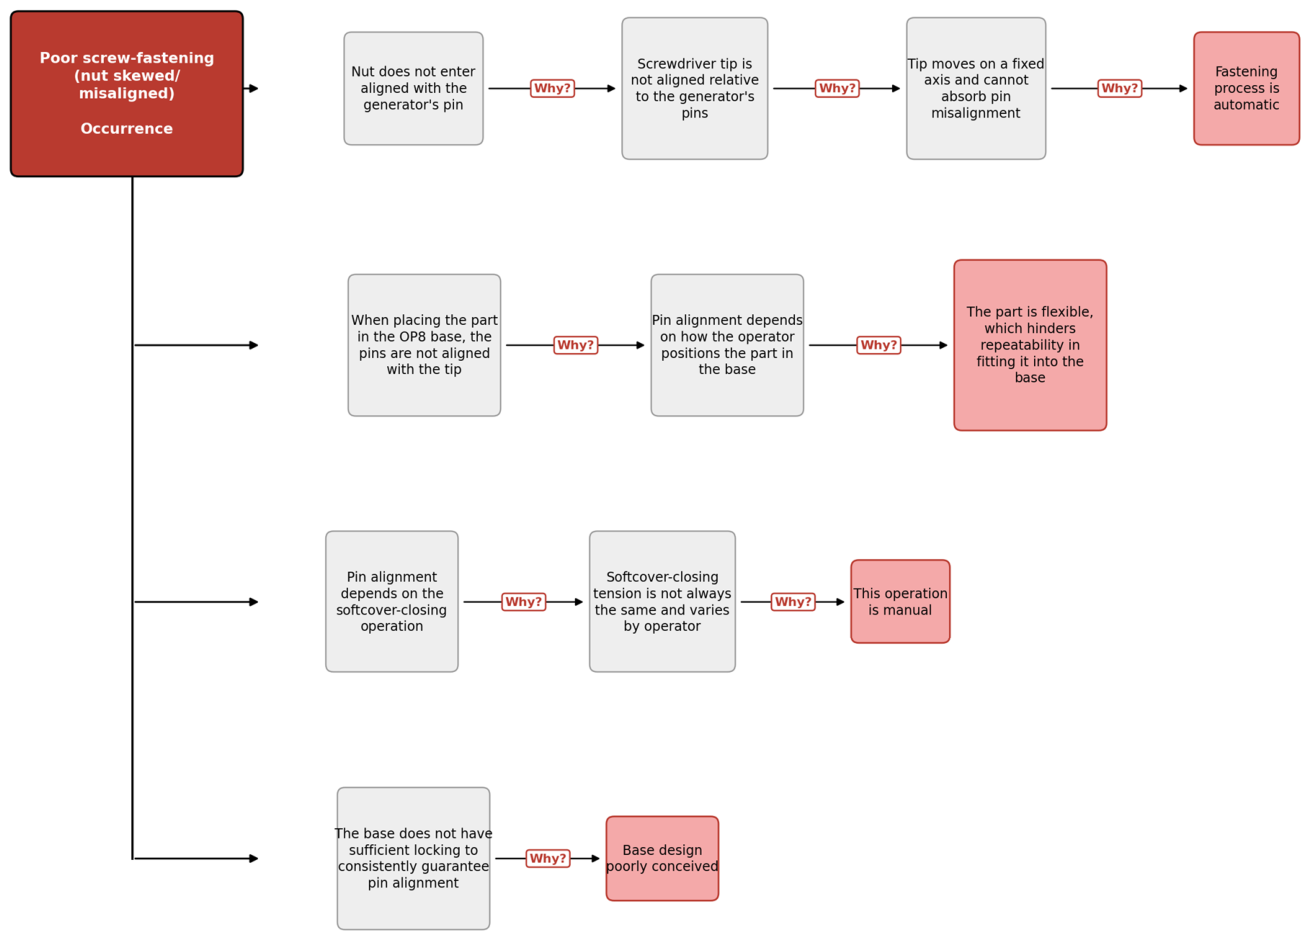
Figure A3.
5-Whys root-cause analysis for the “missing nut” defect, referenced in Section 3.4.
References
- Sharma, A.; Chouhan, A.; Pavithran, L.; Chadha, U.; Selvaraj, S.K. Implementation of LSS framework in automotive component manufacturing: A review, current scenario and future directions. Mater. Today Proc. 2021, 46, 7815–7824. [Google Scholar] [CrossRef] [Scilit]
- Das, B.; Venkatadri, U.; Pandey, P. Applying lean manufacturing system to improving productivity of air conditioning coil manufacturing. Int. J. Adv. Manuf. Technol. 2013, 71, 307–323. [Google Scholar] [CrossRef] [Scilit]
- Ikumapayi, O.M.; Akinlabi, E.T.; Mwema, F.M.; Ogbonna, O.S. Six sigma versus lean manufacturing—An overview. Mater. Today Proc. 2020, 26, 3275–3281. [Google Scholar] [CrossRef] [Scilit]
- Olanrewaju, F.; Uzorh, A.C.; Nnanna, I. Lean Six Sigma methodology and its application in the manufacturing industry—A review. Am. J. Mech. Ind. Eng. 2019, 4, 40–44. [Google Scholar] [CrossRef] [Scilit]
- Antony, J.; Snee, R.; Hoerl, R. Lean Six Sigma: Yesterday, today and tomorrow. Int. J. Qual. Reliab. Manag. 2017, 34, 1073–1093. [Google Scholar] [CrossRef] [Scilit]
- Valamede, L.S.; Akkari, A.C.S. Lean 4.0: A new holistic approach for the integration of lean manufacturing tools and digital technologies. Int. J. Math. Eng. Manag. Sci. 2020, 5, 851–868. [Google Scholar] [CrossRef] [Scilit]
- Palange, A.; Dhatrak, P. Lean manufacturing a vital tool to enhance productivity in manufacturing. Mater. Today Proc. 2021, 38, 729–736. [Google Scholar] [CrossRef] [Scilit]
- Nakajima, S. Introduction to TPM: Total Productive Maintenance; Productivity Press: Cambridge, MA, USA, 1988. [Google Scholar]
- Muchiri, P.; Pintelon, L. Performance measurement using overall equipment effectiveness (OEE): Literature review and practical application discussion. Int. J. Prod. Res. 2008, 46, 3517–3535. [Google Scholar] [CrossRef] [Scilit]
- Almeanazel, O.T.R. Total productive maintenance review and overall equipment effectiveness measurement. Jordan J. Mech. Ind. Eng. 2010, 4, 517–522. [Google Scholar]
- Pugna, A.; Negrea, R.; Miclea, S. Using Six Sigma methodology to improve the assembly process in an automotive company. Procedia. Soc. Behav. Sci. 2016, 221, 308–316. [Google Scholar] [CrossRef] [Scilit]
- Costa, J.; Lopes, I.; Brito, J.P. Six Sigma application for quality improvement of the pin insertion process. Procedia Manuf. 2019, 38, 1592–1599. [Google Scholar] [CrossRef] [Scilit]
- de Mast, J.; Lokkerbol, J. An analysis of the Six Sigma DMAIC method from the perspective of problem solving. Int. J. Prod. Econ. 2012, 139, 604–614. [Google Scholar] [CrossRef] [Scilit]
- Kane, V.E. Process capability indices. J. Qual. Technol. 1986, 18, 41–52. [Google Scholar] [CrossRef] [Scilit]
- Kotz, S.; Johnson, N.L. Process capability indices—A review, 1992–2000. J. Qual. Technol. 2002, 34, 2–19. [Google Scholar] [CrossRef] [Scilit]
- Pearn, W.L.; Kotz, S. Encyclopedia and Handbook of Process Capability Indices; World Scientific: Singapore, 2006. [Google Scholar]
- Clements, J.A. Process capability calculations for non-normal distributions. Qual. Prog. 1989, 22, 95–100. [Google Scholar]
- Somerville, S.E.; Montgomery, D.C. Process capability indices and non-normal distributions. Qual. Eng. 1996, 9, 305–316. [Google Scholar] [CrossRef] [Scilit]
- ISO 22514-4:2016; Statistical Methods in Process Management—Capability and Performance—Part 4: Process Capability Estimates and Performance Measures. International Organization for Standardization: Geneva, Switzerland, 2016.
- Borucka, A.; Kozłowski, E.; Antosz, K.; Parczewski, R. A New Approach to Production Process Capability Assessment for Non-Normal Data. Appl. Sci. 2023, 13, 6721. [Google Scholar] [CrossRef] [Scilit]
- VDI/VDE 2645 Part 2:2014-09; Fähigkeitsuntersuchung von Maschinen der Schraubtechnik—Maschinenfähigkeitsuntersuchung (MFU) [Capability Analysis of Fastening-Technology Machines—Machine Capability Study]. Verein Deutscher Ingenieure: Düsseldorf, Germany, 2014.
- ISO 5393:2017; Rotary Tools for Threaded Fasteners—Performance Test Method. International Organization for Standardization: Geneva, Switzerland, 2017.
- Bickford, J.H. Introduction to the Design and Behavior of Bolted Joints, 4th ed.; CRC Press: Boca Raton, FL, USA, 2007. [Google Scholar]
- ISO 14001:2015; Environmental Management Systems—Requirements with Guidance for Use. International Organization for Standardization: Geneva, Switzerland, 2015.
- IATF 16949:2016; Quality Management System Requirements for Automotive Production and Relevant Service Parts Organizations. International Automotive Task Force (IATF): Brussels, Belgium, 2016.
- Coughlan, P.; Coghlan, D. Action research for operations management. Int. J. Oper. Prod. Manag. 2002, 22, 220–240. [Google Scholar] [CrossRef] [Scilit]
- Montgomery, D.C. Introduction to Statistical Quality Control, 8th ed.; Wiley: Hoboken, NJ, USA, 2019. [Google Scholar]
- Wald, A.; Wolfowitz, J. On a test whether two samples are from the same population. Ann. Math. Stat. 1940, 11, 147–162. [Google Scholar] [CrossRef] [Scilit]
- Stephens, M.A. EDF statistics for goodness of fit and some comparisons. J. Am. Stat. Assoc. 1974, 69, 730–737. [Google Scholar] [CrossRef]
- Bissell, A.F. How reliable is your capability index? J. R. Stat. Soc. Ser. C Appl. Stat. 1990, 39, 331–340. [Google Scholar] [CrossRef] [Scilit]
- Automotive Industry Action Group (AIAG). Production Part Approval Process (PPAP), 4th ed.; AIAG: Southfield, MI, USA, 2006. [Google Scholar]
- Brown, M.B.; Forsythe, A.B. Robust tests for the equality of variances. J. Am. Stat. Assoc. 1974, 69, 364–367. [Google Scholar] [CrossRef]
- Hodges, J.L., Jr.; Lehmann, E.L. Estimates of location based on rank tests. Ann. Math. Stat. 1963, 34, 598–611. [Google Scholar] [CrossRef] [Scilit]
- Cliff, N. Dominance statistics: Ordinal analyses to answer ordinal questions. Psychol. Bull. 1993, 114, 494–509. [Google Scholar] [CrossRef]
- Delacre, M.; Lakens, D.; Leys, C. Why psychologists should by default use Welch’s t-test instead of Student’s t-test. Int. Rev. Soc. Psychol. 2017, 30, 92–101. [Google Scholar] [CrossRef] [Scilit]
- Wilson, E.B. Probable inference, the law of succession, and statistical inference. J. Am. Stat. Assoc. 1927, 22, 209–212. [Google Scholar] [CrossRef]
- Automotive Industry Action Group (AIAG). Measurement Systems Analysis (MSA) Reference Manual, 4th ed.; AIAG: Southfield, MI, USA, 2010. [Google Scholar]
- de Oliveira Silva Soares, W.; Peruchi, R.S.; Ventura Silva, R.A.; Rotella Junior, P. Gage R&R studies in measurement system analysis: A systematic literature review. Qual. Eng. 2022, 34, 382–403. [Google Scholar] [CrossRef] [Scilit]
- Nandakumar, N.; Saleeshya, P.G.; Harikumar, P. Bottleneck identification and process improvement by lean six sigma DMAIC methodology. Mater. Today Proc. 2020, 24, 1217–1224. [Google Scholar] [CrossRef] [Scilit]
- Guleria, P.; Pathania, A.; Sharma, S.; Sá, J.C. Lean six-sigma implementation in an automobile axle manufacturing industry: A case study. Mater. Today Proc. 2022, 50, 1739–1746. [Google Scholar] [CrossRef] [Scilit]

Disclaimer/Publisher’s Note: The statements, opinions and data contained in all publications are solely those of the individual author(s) and contributor(s) and not of MDPI and/or the editor(s). MDPI and/or the editor(s) disclaim responsibility for any injury to people or property resulting from any ideas, methods, instructions or products referred to in the content. |
© 2026 by the authors. Licensee MDPI, Basel, Switzerland. This article is an open access article distributed under the terms and conditions of the Creative Commons Attribution (CC BY) license.