


Abstract
The object of the study is the process of copper-sulfide ore flotation in a mechanical flotation machine. The problem of increasing the stability of the process with changing power characteristics and the limited information content of standard measuring channels was addressed. A method of supervisory control of air and flotation-reagent flow rates is proposed, combining technological parameters and visual characteristics of the froth layer. A two-channel dynamic model, a froth-state index and an algorithm for limited correction of the setpoints of local PID controllers were developed, taking into account the dead zone and amplitude and rate limits. A distinctive feature of the method is the verification of the reliability of video data and the transition to control based on technological parameters in the event of loss of the visual channel. The study is a simulation-based demonstration on a generic model of a flotation cell; no industrial data were used. The efficiency was evaluated in 50 simulation runs with stepwise, random, and combined disturbances, measurement noise, transport delays, and a temporary loss of the video signal. Compared with PID control at constant setpoints, the multimodal supervisor reduced the integral absolute error of the froth state by 66.5%, the error of the conditional (simulated) concentrate quality indicator by 48.1%, the integral squared error by 84.6%, and the standard deviations of these indicators by 49.1% and 22.3%, respectively. The reductions are relative to fixed-setpoint PID in simulation; acceptance criteria for production must be defined on industrial data. The effect is explained by the combined use of visual and technological feedback. The results were obtained by simulation; the method is designed to be integrated into a PLC–SCADA structure without replacing local circuits, and its industrial validation is the next step.
Keywords:
flotation; copper-sulfide ore; supervisory control; froth; aeration; reagents; computer vision; SCADA; simulation 1. Introduction
Flotation is the most complex part of the process of copper-sulfide ore beneficiation, because its results are influenced by a large number of factors, namely the mineral composition of the feed, the size of the particles in the pulp, the density of the pulp, reagent consumption, aeration, and froth hydrodynamics. To maintain a constant production regime, changes in the feed composition and flow rate have to be assessed continuously [1].
In practice, control of the main variables, i.e., aeration and reagents (collectors and frothers) in a flotation circuit, involves a tradeoff. An increase in aeration results in an increase in bubble number and in the transfer of mineralized particles; however, there is a danger of destabilizing the “stable” froth, which in turn leads to a decrease in selectivity [2]. For reagents, an increase in the dosage of collectors increases recovery, while an increase in the dosage of frothers increases operating cost and may contaminate the concentrate [3].
Typical control of the flotation process is carried out by PID or cascade controllers, which set constant setpoints for air flow, pulp level in the flotation cells, and reagent flow rates [4]. The plant operator may change setpoints based on experience, but in most cases this is done subjectively, based on personal judgment, and with some delay because of the time required for laboratory analysis [3]. Often the same set of setpoints is used for different types of ore, i.e., under different operating conditions.
Information on the operation of the flotation process can be obtained from the surface of the formed froth. The number, form, size, and density of bubbles, the velocity of froth movement, the uniformity of its texture, and the intensity of its overflow contain information on the current state of the process. These features can be measured by computer vision [5]; however, the extracted visual features are affected by factors such as illumination, optics contamination, and glare [6,7]. Therefore, control commands cannot be formed directly from the video stream.
A supervisory structure is an acceptable option for an upper level of computation. It assesses the state of the flotation froth and, within specified bounds, issues corrections to the setpoints of local controllers. The air and reagent valves continue to be operated by the PLC in the normal manner via the setpoints of the local controllers, and the rest of the standard control is left intact.
Modern research on flotation management is developing in the direction of dynamic models that account for the relationship between the pulp and foam phases. In ref. [1], models designed for flotation control are systematized, showing that the use of predictive regulators is limited by the accuracy with which the dynamics of the foam layer are described. In ref. [8], a physically interpretable dynamic model of a flotation machine was developed, including foam characteristics and suitable for predictive control. Calibration and verification of this model were performed in [9]; however, its practical use requires identification of a significant number of parameters. In ref. [10], a dynamic model was proposed for evaluating process characteristics that are not directly measurable, based on operational technological data. These approaches provide a basis for model-based control but do not involve the combined use of visual foam features and process variables to correct air flow and reagent dosing. The limitations of control actions are considered in the adaptive optimal controller of [11], which accounts for the nonlinearity of the object and the permissible ranges of input variables; however, its use requires model identification and does not provide for monitoring the reliability of visual data. The economic predictive control proposed in [2] coordinates air flow and pulp level, taking concentrate quality into account, but does not include a reagent-dosing channel or visual feedback. State and parameter estimation of a dynamic flotation model on industrial data was investigated in [12]. The approach in [13] uses Gaussian processes and nonlinear predictive control with incomplete observability, but requires significant computational resources and a specialized optimizer. An experimental implementation of centralized economic model-predictive control (MPC) for a flotation bank is presented in [14]; it does not address fault-tolerant use of the video channel or joint air and reagent correction with regular PID controllers. Study [4], outside flotation, compares a regulator designed on a simplified dynamic model with classical PID control.
A generalization of modern automation tools for flotation equipment and methods for intelligent extraction of froth features was performed in [5]. In the review [15], machine learning models for predicting extraction, concentrate quality, and technological conditions were considered, noting the dependence of the results on the composition and representativeness of the training data. The analysis of deep learning methods in [16] shows a transition from processing individual images to analyzing time sequences and multimodal data; nevertheless, most of the solutions considered are intended for monitoring, recognition, or forecasting rather than for the direct formation of safe control actions. For operational forecasting of product quality, ref. [17] used a Convolutional Long Short-Term Memory (ConvLSTM) network that extracts spatiotemporal features from the video stream of the froth layer. The proposed method provides a continuous assessment of concentrate indicators but does not convert the forecast into limited adjustments of regulator settings. The two-stream model in [18] combines static and dynamic visual characteristics of froth and increases the information content of the soft sensor, but remains a monitoring tool. A solution closer to closed-loop control is presented in [19], where deep learning features are used to generate setpoints for optimal flotation control; its limitations relative to the problem under consideration are the lack of an explicitly formulated redundancy mode for image degradation and insufficient integration with existing local PID loops.
Multiscale feature extraction and classification of lead–zinc flotation modes were investigated in [20]. This approach distinguishes between process states but the discrete mode class does not determine the amount of air or reagent correction required. In ref. [21], visual and technological data are combined in a graph model to evaluate the effectiveness of various flotation modes. A multimodal temporal hypergraph network [22] takes into account complex relationships between dynamic features of a video sequence, but its result is also state recognition. In ref. [23], visual and acoustic information are combined using a bimodal autoencoder, which increases the reliability of mode identification but does not form control commands. The method in [24] uses data from several flotation cells and technological parameters to recognize the state of coal flotation; despite the expanded information base, transferring the model to copper-sulfide raw material and including its outputs in a closed loop requires separate justification. The problem of insufficient labeled data is considered in [25], where a soft sensor is proposed that can be trained on a limited sample. In ref. [26], concentrate quality is assessed by joint analysis of feed composition and non-overlapping fragments of froth images. The dynamic hypergraph network in [27] takes into account the group and temporal relationships of visual features and improves the accuracy of state recognition. In ref. [28], a froth-layer segmentation network was developed that accounts for global context, making it possible to distinguish bubble boundaries under dense froth structure. These methods increase measurement and diagnostic accuracy but do not establish rules for converting the estimates obtained into consistent, technologically limited settings for the two execution channels.
Industrial application of computer vision is further limited by the instability of shooting conditions. It was shown in [6] that algorithms that reliably determine bubble size in laboratory images can produce systematic errors when processing industrial frames. The method in [29] estimates the average bubble size without preliminary segmentation; however, its result depends on the composition of the training sample and the geometry of image acquisition. In ref. [7], multiscale enhancement of froth images under low and uneven illumination was proposed, but image enhancement alone does not provide process control. A critical review [30] highlights common obstacles to the industrial implementation of deep learning: limited portability of models, insufficient interpretability of results, and a lack of representative open datasets. In ref. [31], neural networks were used to obtain indicators from froth images suitable for the supervisory control level; however, the results were obtained for a specialized flotation plant with electromagnetic regrinding and do not cover the joint, limited correction of air and reagent flow rates in the event of video-channel failure.
Thus, the task of safely integrating visual froth assessment into the current hierarchical control system remains unresolved, where the setpoints for air flow and flotation reagent are adjusted simultaneously, local PID controllers are maintained, the amplitude and rate of control actions are limited, and operability is maintained even when the reliability of the video signal is reduced.
The aim of the study is to develop and simulate a method for supervising the control of air and flotation reagents during copper-sulfide ore flotation, based on the combined use of technological parameters and visual characteristics of the froth layer.
To achieve this aim, the following tasks were addressed:
- Analyze existing flotation management methods and formulate requirements for the supervisory system;
- Develop a two-channel dynamic model describing the effect of air and reagent flow rates on the froth-layer state and the concentrate quality indicator;
- Determine informative visual and technological parameters and form a froth-state index;
- Develop an algorithm for limited supervisory correction of air and reagent flow-rate settings, taking into account the reliability of video data;
- Conduct simulation studies with typical disturbances, noise, delays, and loss of the video signal, and compare the developed method with PID control at constant setpoints and with a supervisor based on technological data alone.
The contribution of this study is the development and simulation-based evaluation of an integrated multimodal supervisory-control method for coordinated correction of air and reagent flow-rate setpoints. The method combines technological measurements with a five-feature froth-state index, incorporates video-signal reliability assessment and fallback to process-data-based control, and preserves the existing local PID control architecture. Its distinguishing characteristic is the integration of these functions within a single supervisory algorithm subject to amplitude and rate constraints. The simulation study evaluates control performance under disturbances, measurement noise, temporary video-signal degradation, and parametric model uncertainty. Industrial and experimental validation remain subjects for further research.
The chemistry and selection of flotation reagents are advancing along a separate, complementary line of research, including the development of environmentally friendlier reagents [32] and the surface chemistry of reagent adsorption [33]. The present study does not address reagent design or selection; it addresses the correction of the flow-rate setpoints of already-selected reagents and of air within an existing PLC–SCADA structure.
2. Materials and Methods
The object of the study is the process of copper-sulfide ore flotation in a mechanical flotation machine. The subject of the study is a method for supervisory control of the air flow-rate and flotation-reagent flow-rate setpoints, based on process variables and the visual characteristics of the froth layer.
2.1. Simulation Environment and Software Modules
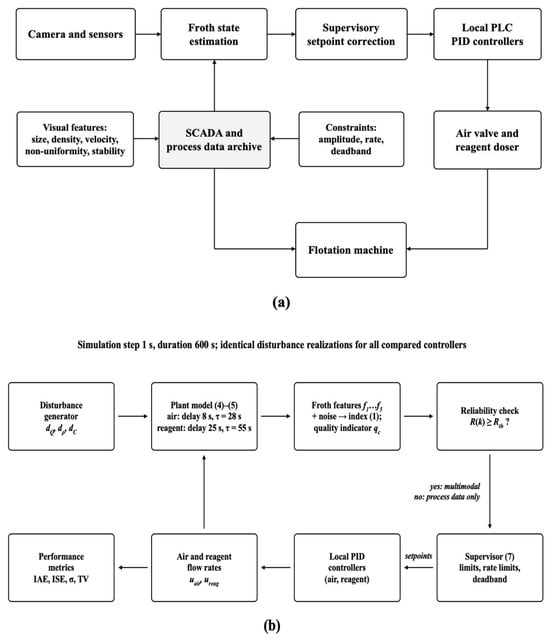
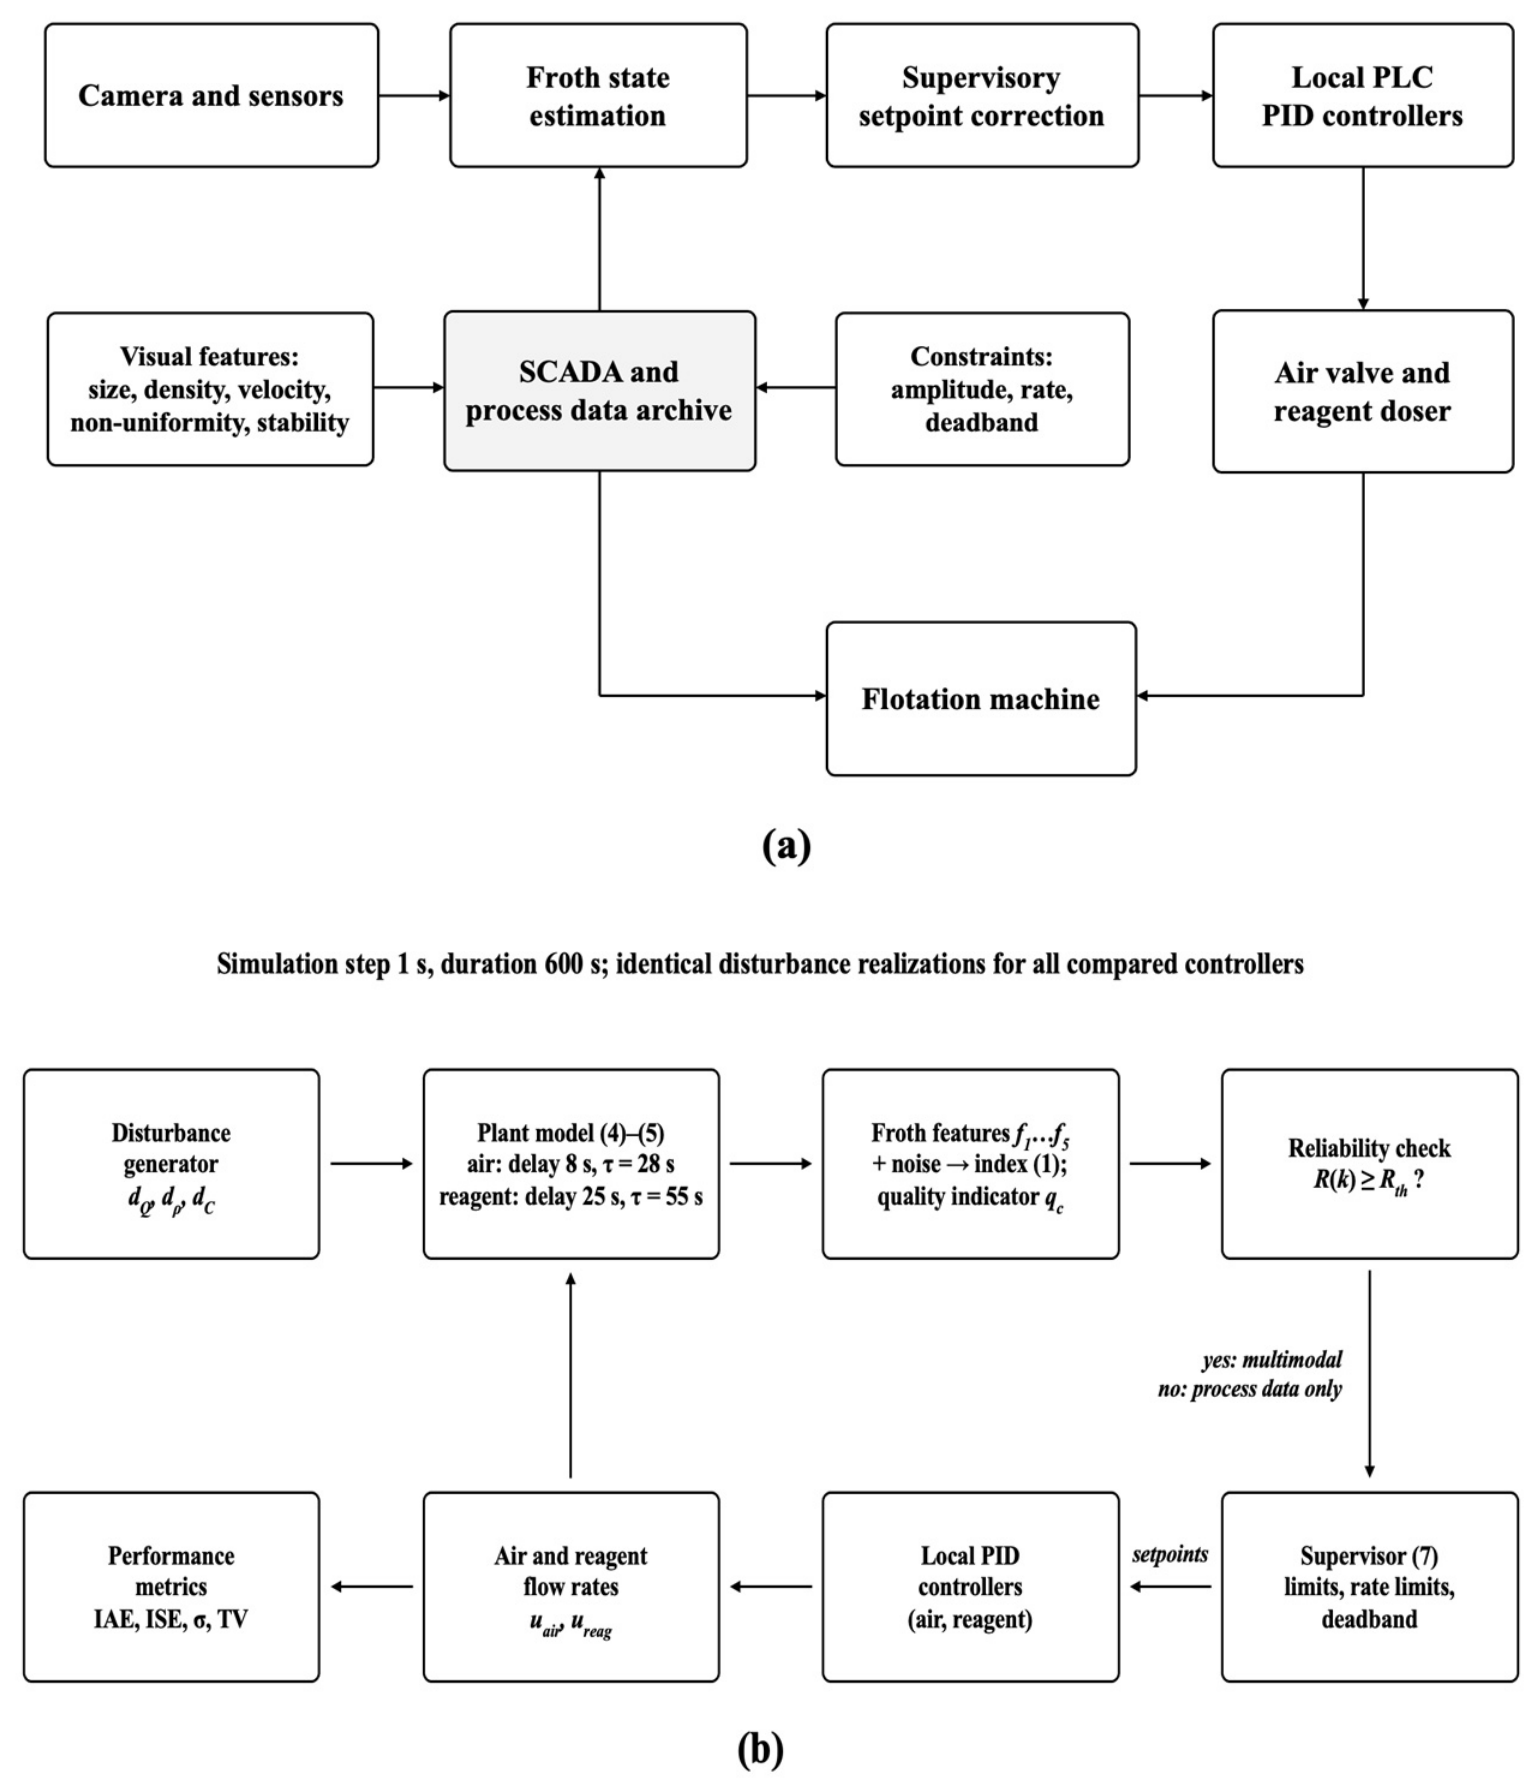
The study is entirely computational; no physical materials, ore samples or laboratory experiments were used. The simulation was implemented in Python 3.12 (Python Software Foundation, Wilmington, DE, USA) with NumPy 2.4 and SciPy 1.17 (figures: Matplotlib 3.10) and runs at a discrete step of 1 s. The self-developed modules are: (i) the two-channel plant model; (ii) the disturbance generator; (iii) the froth-feature generator and the froth-state index calculation; (iv) the video reliability monitor; (v) the supervisory correction algorithm with limits and deadband; (vi) the local PID controllers; and (vii) the calculation of performance metrics. The simulation workflow is shown in Figure 1b. The simulation code is provided as Supplementary Material S1.
Figure 1.
(a) Structure of the developed supervisory control; (b) block diagram of the simulation workflow.
The variables of the stud y are of four types (Appendix A, Table A5): measured in SCADA in a real plant (air and reagent flow rates, pulp density, pulp level, power consumption); estimated from video in a real plant (the five visual features, which are simulated indicators in this study); constructed (the froth-state index If, the video reliability index R and the concentrate quality indicator qc); and simulated inputs (the disturbances dQ, dρ and dC).
2.2. Visual Features of the Froth Layer
At the measurement level, the air flow rate, reagent dosages, pulp level, feed rate, and pulp density are measured by sensors. The surface of the froth is recorded by a camera, from which a video sequence of images is obtained; the average bubble size, bubble density, froth movement velocity, and the non-uniformity and stability of the froth are determined from this sequence by computer vision. At the supervisory level, the computational supervisor computes the setpoints for the air flow rate and flotation-reagent dosages, while the local PID controllers at the control level directly control the actuators. In this study, the visual features are not computed from images but simulated, as described below.
To describe the froth-layer state, an integral index is formed, as shown in expression (1):
If(k) = w1Db(k) + w2ρb(k) + w3Vf(k) + w4Hf(k) + w5Sf(k).
Here, Db is the average bubble size, ρb is the froth-layer coverage density, Vf is the froth movement velocity, Hf is the image non-uniformity, and Sf is the stability index. The weighting coefficients wi are normalized so that their sum equals 1. The features are pre-scaled to the range 0 to 1.
The five features are defined as follows. The average bubble size is Db = (1/N)Σdi, where di = 2(Ai/π)1/2 is the equivalent diameter of the i-th of N segmented bubbles with area Ai; the coverage density ρb = Abub/Atot is the share of the frame area occupied by segmented bubbles; the froth velocity Vf = (1/M)Σ‖vj‖ is the mean magnitude of the M optical-flow vectors vj between consecutive frames; the non-uniformity Hf = −Σpilog2pi is the Shannon entropy of the grayscale histogram of the frame; and the stability Sf = 1 − σ(Abub)/mean(Abub) is computed over a 10 s sliding window.
In this study, the features are simulated rather than computed from images: image acquisition, segmentation and optical-flow computation were not performed, and the formulas above specify what each feature is intended to measure in a future implementation on real froth video. In the simulation, each feature is generated from the state of the plant model as fi(k) = sat [0,1](fi,0 + aiIf(k) + ei(k)), where fi,0 is the nominal value of the feature, the sign of ai corresponds to the direction of influence given in Appendix A, Table A3, and ei(k) is independent measurement noise (Appendix A, Table A3). The supervisor does not receive the model state If(k) of Equation (4) directly, but the index recomputed from the noisy features by Equation (1), referenced to its nominal value Σwifi,0 and divided by the calibration factor Σwiai computed with the nominal weights, and then filtered with a time constant of 5 s; the weights wi therefore act on the controller through this index. When the reliability of the video channel decreases, the noise standard deviation of each feature grows as σe,i [1 + 5(1 − R(k))]. For the target application, the video-analysis system of the project uses IP cameras above the flotation machines (1920 × 1080 pixels, 10–30 frames/s) with bubble detection and tracking [34]; Db and ρb correspond directly to its aggregated outputs, whereas Vf, Hf and Sf are proposed here as the basis for their future implementation.
The simulated visual features are generated directly in the normalized range [0, 1], so no physical reference minimum and maximum apply to them; for real video, each feature will be scaled as (x − xmin)/(xmax − xmin) with reference ranges determined from plant data. Process variables are expressed as relative deviations from their nominal setpoints, xrel = (x − xnom)/xnom, consistent with the relative units used throughout the model (Section 3.2).
Terminology used throughout the paper: the froth-state index If is the integral index of the five visual features (Equation (1)); the froth stability Sf is one of these features; the video reliability index R characterizes the quality of the video channel (Section 3.4); and the concentrate quality indicator qc is the conditional simulated variable of Equation (5). The word “index” is used only for If and R, and “indicator” only for qc.
2.3. Plant Model
The plant dynamics are approximated by interconnected aperiodic first-order elements with transport delay. The input variables of the model are the air flow rate Qair and the reagent flow rate Qreag. Disturbances are changes in the feed rate, pulp density, and conditional content of the valuable component in the feed. The model is a generic simulation representation of a mechanical flotation cell. Its structure, first-order lags with transport delay, is a standard approximation of flotation dynamics [1,8,9,10,12]. All numerical values are assumptions chosen to reproduce the qualitative relations that the froth surface responds faster than concentrate quality and that the reagent effect is slower than the air effect; no ore characteristics, mineralogical information, plant measurements or experimental data were used to develop or parameterize the model. The term “copper-sulfide” indicates the target application context: a concentrator with pneumomechanical flotation machines (45 m3 and 8.5 m3 cells; 16 m3 cells in the cleaner and scavenger stages) and xanthate collector and frother feeding [34,35,36]. The model is therefore not an ore-specific or circuit-specific validation.
2.4. Supervisory Correction the Supervisor Calculates Corrections to the Base Setpoints, as Shown in Expressions (2) and (3):
Setpoint corrections for the process-controlled variables are calculated on the basis of deviations of the froth-state index from a specified range. The process-parameter supervisor accounts for a deadband, limits on the rate and magnitude of setpoint changes, and filtered noise in the measured variables. In the event of loss of the video signal, the correction is computed from process data only (Section 3.4).
2.5. Simulation Experiments and Performance Metrics
The results of the simulations for step, random, and combined disturbances of the controlled process in the closed-loop system are compared for PID control with constant setpoints (base values), a process-parameter supervisor, and the multimodal video-based supervisor. The performance of the closed-loop system is evaluated using the integral absolute error (IAE), the integral squared error (ISE), the standard deviations of the controlled variables, and the total variation of the control actions as a proxy of actuator activity.
In addition to the nominal comparison, the study includes a paired statistical comparison of the controllers, a sensitivity analysis with respect to the feature weights, a gradual video-degradation scenario with different values of the reliability threshold, and a robustness analysis with perturbed model parameters (Section 3.5). All compared controllers are evaluated on identical disturbance realizations.
3. Results
3.1. Results of the Analysis of Control Methods and Formation of Requirements
Local PID control, model-predictive control, computer vision for froth-quality monitoring (classification and/or prediction), and data-driven learning for prediction and intelligent process control are currently used for different fragments of the control problem. However, they do not by themselves form a safe control system for the overall flotation process, which would need to control both air flow and reagent additions while not interfering with the standard PLC control program. Local PID control is a well-proven, stable, and robust method, but relies on a fixed setpoint. Model-predictive control accounts for the dynamic behavior and constraints of the process but requires a reliable process model. Computer vision is used for froth-quality classification and/or prediction, but the direct relationship between the visual assessment and the resulting control action (a constrained setpoint change) is often not transparent.
Table 1 outlines the advantages and limitations of five solution classes and their relevance to the objectives of the proposed supervisory control system.
Table 1.
Comparative characteristics of flotation process control methods.
Based on the mandatory and additional functionalities considered during development, a total of five mandatory functionalities of the solution were specified: the solution processes both visual and process data; it retains local PID loops; the range and rate of setpoint changes are restricted; visual correction is not used when video data are unreliable; and supervisor decisions are logged in SCADA. The resulting solution structure is depicted in Figure 1.
Figure 1a shows the structure for the control of a flotation cell. There are two levels of control: the supervisor monitors the surface froth and sets the setpoints of the process controllers, and the process controllers then control the air valve and the reagent dozer for the flotation cell, implemented as two PID controllers in the local PLC. Figure 1b shows the workflow of the simulation used in this study: disturbance generator → plant model → froth features, froth-state index and quality indicator → reliability check → supervisor → local PID controllers → plant.
The structure shown in Figure 1 reflects the two-level organization of the developed supervisory control method for the flotation process. At the lower level, the regular local PID controllers are maintained, directly controlling the actuators for air supply and flotation reagents; this arrangement leaves the basic PLC logic, existing technological interlocks, and equipment-protection algorithms unchanged. The upper level assesses the current state of the process and forms limited corrections to the setpoints for air and reagent flow rates.
The supervisor’s information base consists of two groups of data. The first includes technological parameters: power consumption, pulp density, current air and reagent consumption, pulp level, and other available SCADA signals. The second is formed by the video sequence of the froth-layer surface (simulated in this study, Section 2.2) and contains the average bubble size, surface coverage density, froth movement speed, texture heterogeneity, and an indicator of structural stability. After filtering and normalization, the data are combined to calculate the froth-state index.
The supervisor does not act directly on the air-supply valve or the reagent dispenser, but adjusts the settings of the local regulators within established limits. The reliability of the video channel is monitored separately; if image quality deteriorates, the visual component is excluded and control continues based on technological parameters alone. This architecture provides fault tolerance, interpretability of control decisions, and the ability to integrate the method into the existing PLC–SCADA structure without replacing existing control circuits.
3.2. Results of Building the Dynamic Model of the Control Object
A two-channel dynamic model was developed for the normalized deviations of air and reagent flow rates and for the two state indices, the froth-state index and the concentrate quality indicator. Three types of disturbances are considered: feed rate, pulp density, and valuable-component content. The air and reagent channels have different inertia; therefore, transport delays of 8 s for air and 25 s for reagent were implemented in the model. The time constant for the froth-state index is shorter than that for the concentrate quality indicator, which is readily understandable, since a change in the froth surface can be recognized immediately by a human observer, whereas the change in the output product (concentrate quality indicator) forms slowly.
The discrete dynamic model of the change in the froth-state index is given by expression (4):
where If(k) and If(k + 1) are the deviations of the froth-state index at the current and subsequent instants; uair and ureag are the normalized corrections of air and reagent flow rates; dQ, dρ, and dC are the disturbances in feed rate, pulp density, and valuable-component content; k is the discrete step number; and 8 and 25 are the channel delays at a simulation step of 1 s.
If(k + 1) = 0.964If(k) + 0.036[0.85uair(k − 8) − 0.35ureag(k − 25) + 0.55dQ(k) + 0.30dρ(k) − 0.20dC(k)],
The discrete dynamic model of the change in the concentrate quality indicator is given by expression (5):
where qc(k) and qc(k + 1) are the deviations of the concentrate quality indicator at the current and subsequent instants; uair and ureag are the control corrections; dQ, dρ, and dC are the process disturbances; k is the step number; and the coefficients 0.982 and 0.018 characterize the inertia of the quality channel at a time constant of 55 s.
qc(k + 1) = 0.982qc(k) + 0.018[0.25uair(k − 8) + 0.70ureag(k − 25) − 0.35dQ(k) − 0.20dρ(k) + 0.50dC(k)],
The concentrate quality indicator qc is a dimensionless simulation variable: the deviation of a conditional quality variable from its nominal value (qc = 0 in the nominal regime), expressed in relative units. It is not a measured concentrate grade or recovery, and no quantitative relation to metallurgical performance is claimed; it is used only to compare the controllers under identical simulated conditions.
The coefficients of models (4) and (5) are given in relative units for the purpose of verifying the algorithm and are not identified parameters of a specific industrial flotation machine. The factors 0.964 and 0.982 correspond to time constants of 28 s and 55 s at a step of 1 s, and the bracketed coefficients are the steady-state gains of the channels (Appendix A, Table A1). The time constants and delays are illustrative and are not claimed to be representative of industrial flotation dynamics. The cross-coupling coefficients are assumptions made for the simulation: the reagent dosage changes bubble size, froth stability and particle hydrophobicity, so both outputs respond to both inputs, with different signs and rates; their magnitudes were not identified from plant data.
Table 2 details the time constants, transport delays, and admissible corrections for both control channels.
Table 2.
Parameters of the dynamic model of the flotation process control object.
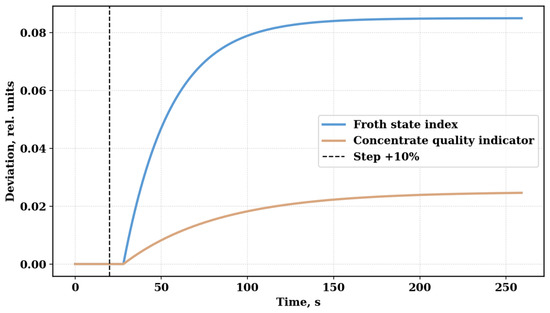
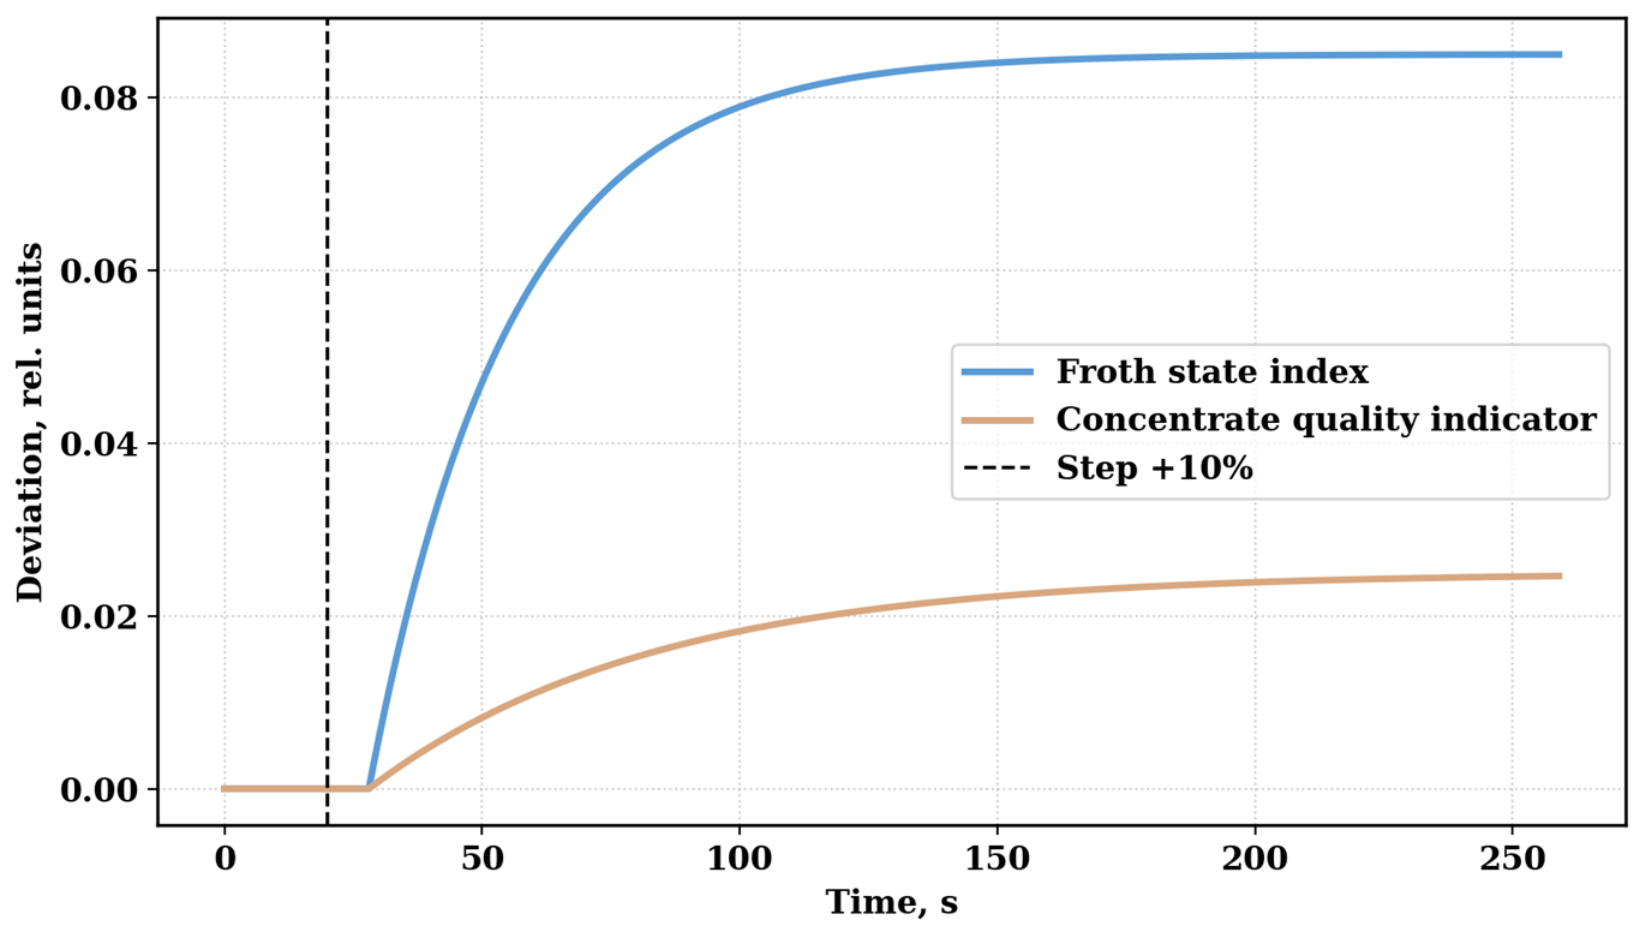
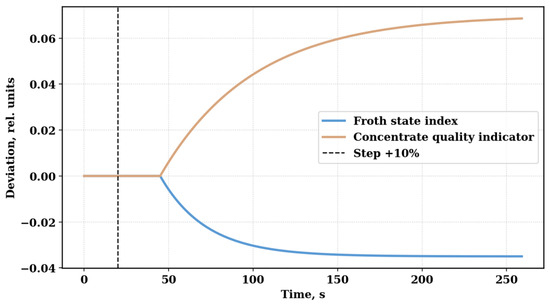
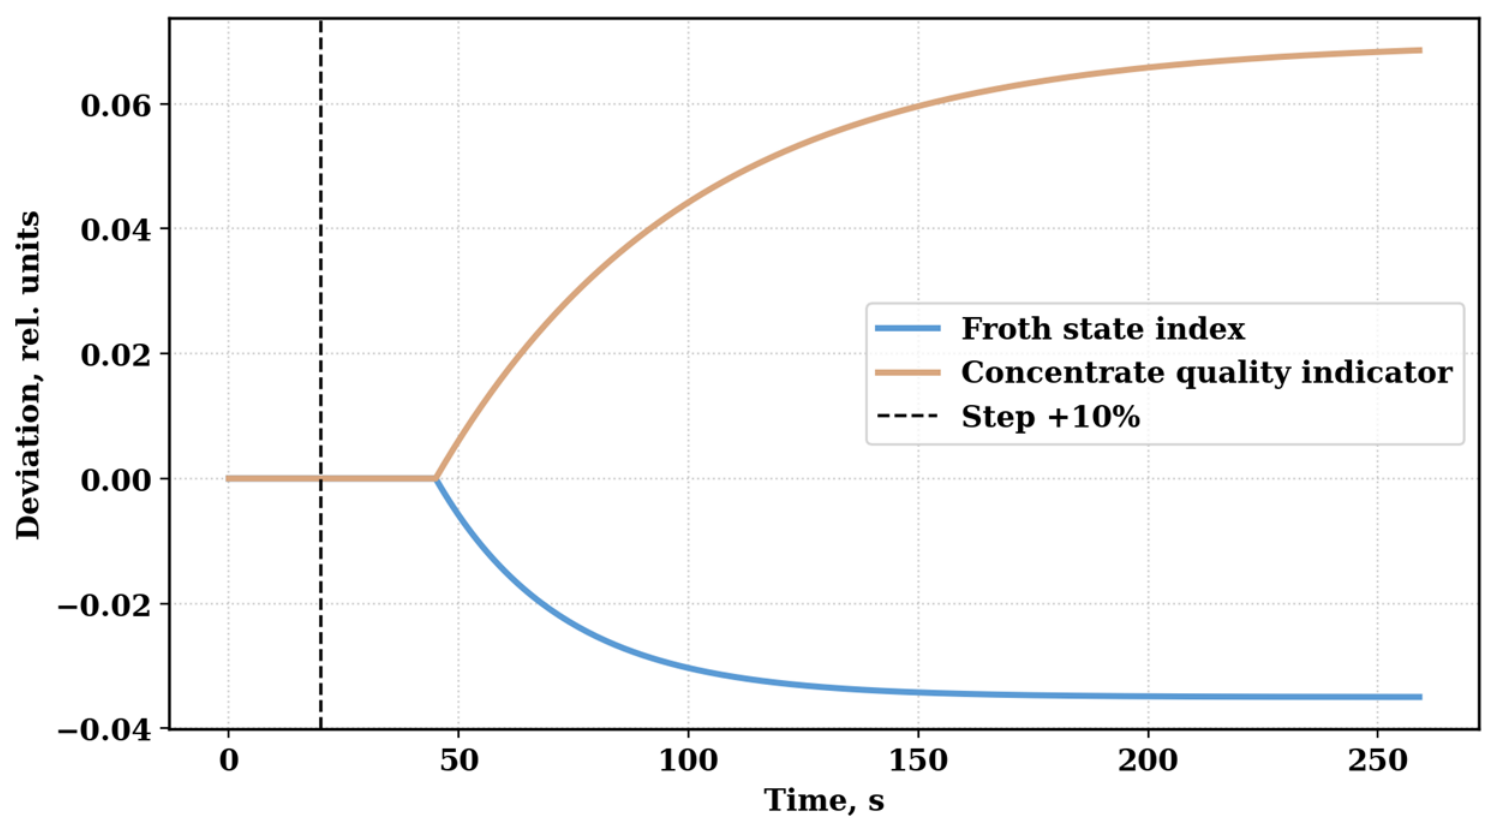
The interaction of the two channels was checked by means of a 10% step input into the air flow rate and reagent flow rate. An increase in the air flow rate of 10% increases the froth-state index (steady-state deviation of about +0.085) and the quality indicator (about +0.025) (Figure 2). A 10% increase in the reagent flow rate decreases the froth-state index (about −0.035) and increases the quality indicator (about +0.07); its effect on quality is about three times as large as that of air, and its effect on the froth-state index has the opposite sign (Figure 3). Thus, the two correction actions interact rather than acting independently.
Figure 2.
Model response to a 10% increase in air flow rate.
Figure 3.
Model response to a 10% increase in reagent flow rate.
Figure 2 shows the transient processes of the froth-state index and the concentrate quality indicator after a step increase in air flow rate of 10%.
Figure 3 shows the model’s response to a stepwise increase in reagent consumption of 10% relative to the nominal value.
The change in the reagent channel is accompanied by a more pronounced transport delay and greater inertia than the air channel. The froth-state index decreases gradually, reflecting a change in froth structure and stability, while the concentrate quality indicator changes more slowly but reaches a more significant steady-state deviation. These dynamics illustrate, in the simulation, the difference in the time characteristics of the two output parameters and the need to separately limit the rate of correction of the air and reagent settings in the supervisory algorithm.
3.3. Results of Identifying Informative Visual and Process Parameters
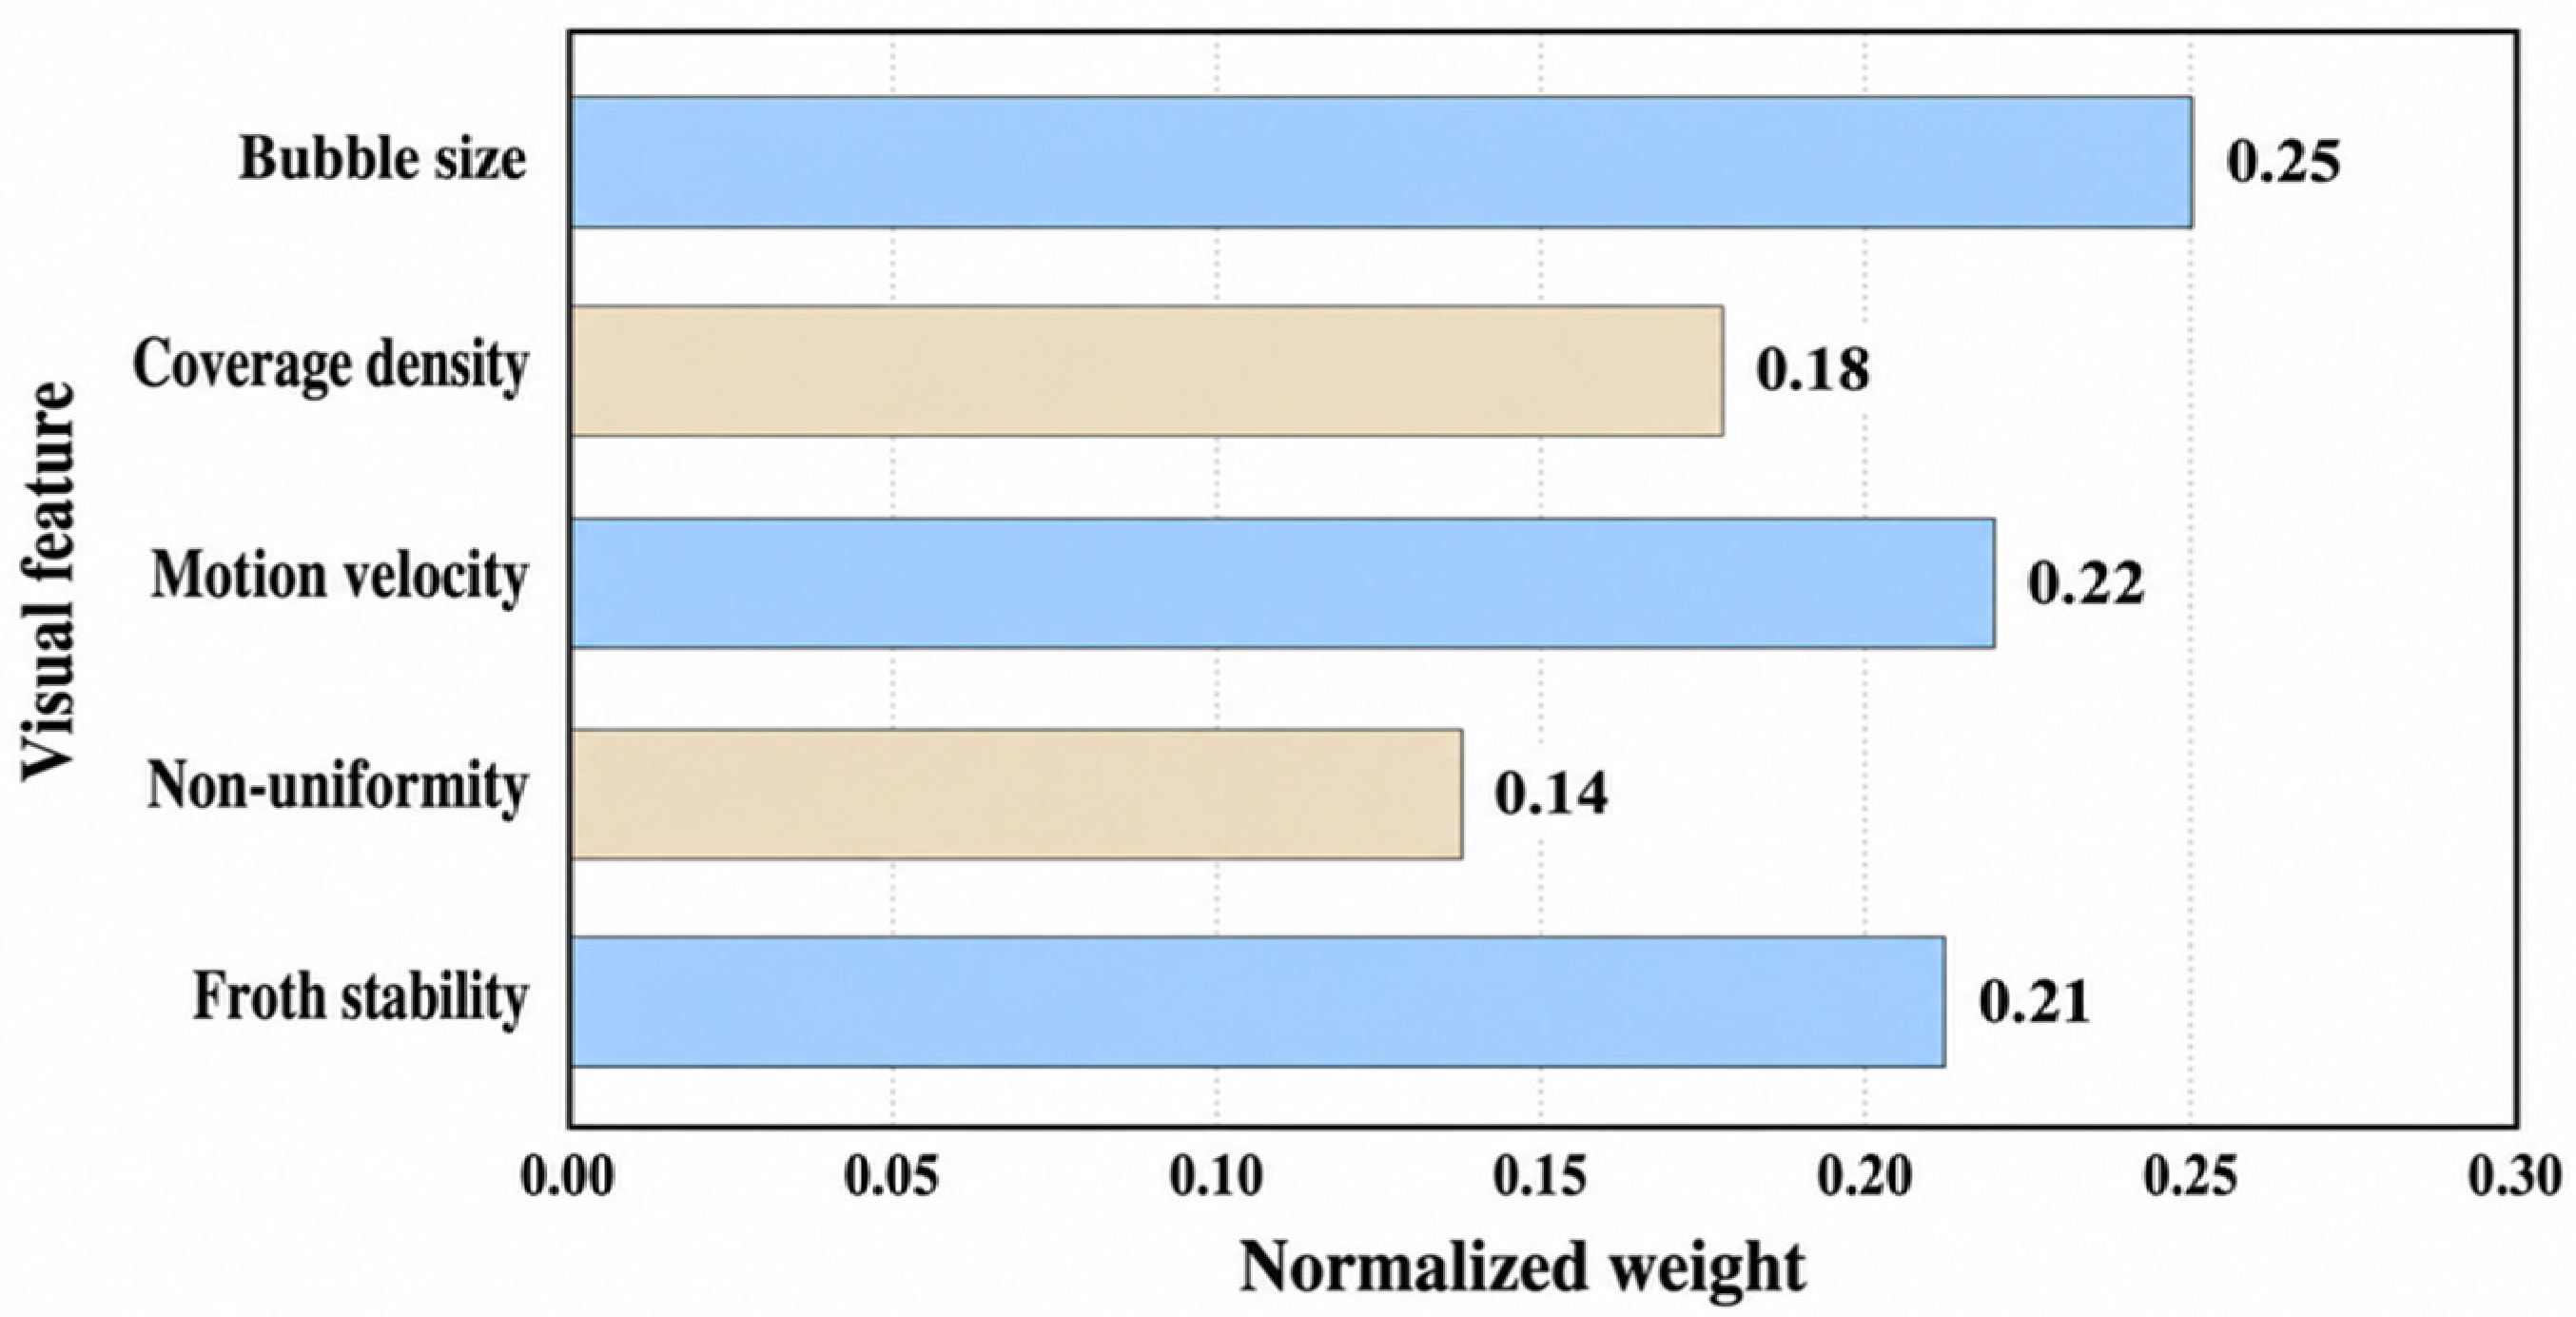
A set of readily interpretable features was generated and normalized to the range 0–1. Weights for these features were determined by simulation, analyzing the sensitivity of the index to changes in individual features. The features to which the index is more sensitive received larger weights, and the weights were normalized to sum to 1. The weights are design parameters of the index; they are kept fixed in all nominal experiments, are not claimed to be optimal, and the sensitivity of the results to them is examined in Section 3.5. As expected, the largest weights belong to average bubble size, froth movement velocity, and froth-layer stability. A much smaller, but still included, weight is assigned to the texture non-uniformity feature, since local structural deviations not described by average bubble size cause large variations in the index.
Normalized visual features are used to quantitatively assess the state of the froth layer in an integral index, as shown in expression (6):
where If(k) is the integral froth-state index; Db(k) is the normalized average bubble size; ρb(k) is the surface coverage density; Vf(k) is the froth movement velocity; Hf(k) is the texture non-uniformity; Sf(k) is the froth-layer stability; and the coefficients 0.25, 0.18, 0.22, 0.14, and 0.21 are the normalized feature weights, the sum of which equals unity.
If(k) = 0.25Db(k) + 0.18ρb(k) + 0.22Vf(k) + 0.14Hf(k) + 0.21Sf(k),
Table 3 presents a more detailed list of the five features, including their physical meaning, normalized weights, and direction of influence.
Table 3.
Visual features and weighting coefficients of the froth-layer state integral index.
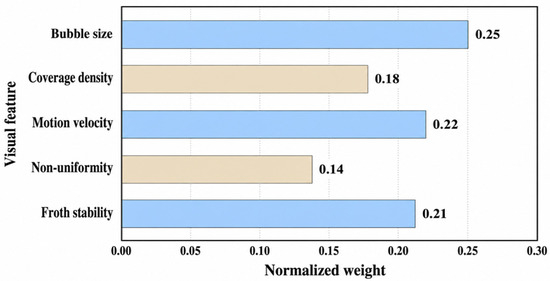
Figure 4 visualizes the ratio of feature weights: bubble size, froth movement velocity, and froth-layer stability make the greatest contribution to the index. Although texture non-uniformity has a much smaller weight than the other three, it is retained, because even average values of bubble size do not indicate possible local deviations from the average in the texture.
Figure 4.
Normalized weights of the visual features of froth-layer state.
In addition to the features derived from the froth-surface image, process variables such as feed rate, valuable-component content in the feed, air flow rate, and reagent flow rate are used to correct for process disturbances and for errors in the visual index. The visual index is used to correct errors not accounted for by the process variables. If the image is unreliable, the features based on that image are excluded from the calculation, but local control is not disabled.
3.4. Results of Developing the Algorithm for Supervisory Setpoint Correction
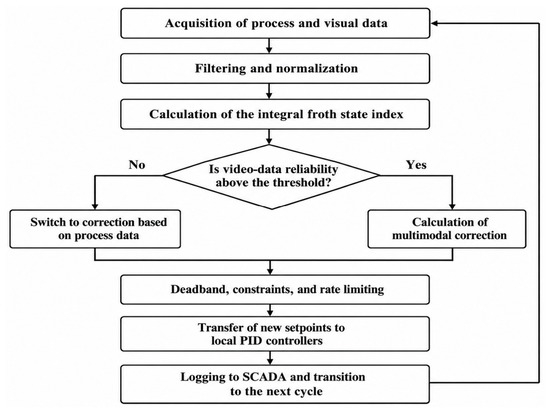
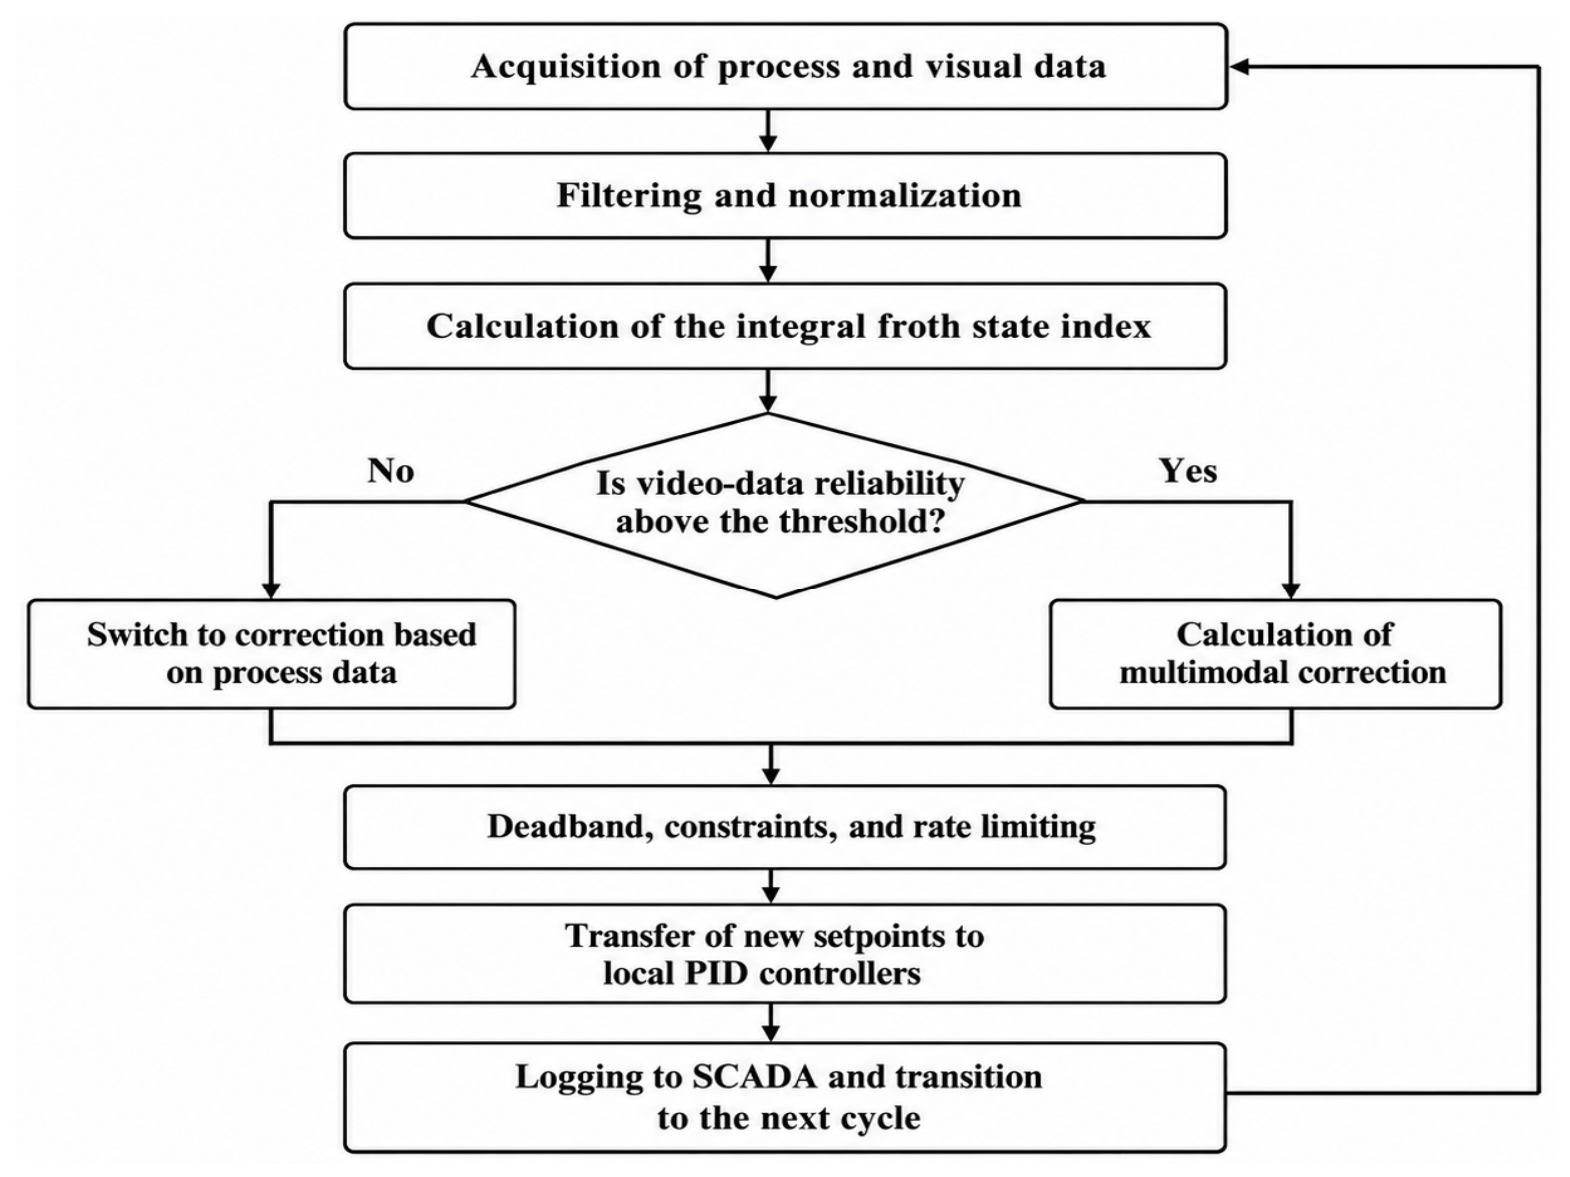
A cyclic algorithm was developed that does not act directly on the actuators. The stepwise algorithm proceeds through filtering of the measured values, calculation of the froth-state index, checking the reliability of the video signal, a preliminary calculation of the correction, checking the constraints, and, finally, updating the setpoints and transferring them to the local PID controllers. If the image is lost, the correction is made on the basis of process parameters alone. If the measured variables remain within admissible limits, the current setpoints are retained.
To form the control action, the supervisor calculates the corrections to the air and reagent flow-rate setpoints using formula (7):
where Δusp(k) is the vector of corrections to the air and reagent flow-rate setpoints; uff(k) is the feedforward correction based on process disturbances; Kp and Ki are the matrices of proportional and integral coefficients; ef(k) is the vector of errors of the controlled indicators; Σef(k) is the accumulated error; and sat{·} is the correction amplitude-saturation operator.
Δusp(k) = sat{uff(k) − Kpef(k) − KiΣef(k)}.
The numerical values of Kp and Ki (Appendix A, Table A2) were obtained analytically rather than by trial and error. After the two correction channels are decoupled through the inverse of the steady-state gain matrix of Equations (4) and (5), each loop is tuned as a first-order-plus-dead-time process by the IMC (λ-tuning) rule Kc = τ/(λ + θ), Ti = τ with λ = θ, using the time constants and delays of Table 2. This gives Kp,f ≈ 1.75 and Ki,f ≈ 0.063 s−1 for the froth channel and Kp,q ≈ 1.10 and Ki,q ≈ 0.020 s−1 for the quality channel. The gains were not fitted to the evaluation runs, so the tuning is independent of the random-disturbance data on which the controllers are compared (Section 3.5).
Both supervisors use a nominal copy of models (4) and (5), driven by the measured flow rates and by the measured feed-rate and pulp-density disturbances (filtered with a time constant of 3 s), to estimate the two controlled indicators; the feedforward term is uff = −Gu−1Gd, where Gu and Gd are the steady-state gain matrices of Equations (4) and (5). The process-data supervisor has no information on the valuable-component content ( = 0). In the multimodal supervisor, the froth-state index from the video channel is compared with its model estimate If,m, and the difference is used to estimate the unmeasured content disturbance, (k + 1) = (k) + γ[(k) − If,m(k)]/bfC, with γ = 0.02 and bfC = −0.20, where Îf is the filtered froth-state index computed from the video channel (Section 2.2); the froth-state error ef is taken from the measured index. When the video channel is unreliable, is frozen and ef is taken from the model estimate. The quality error eq is always the model estimate, because concentrate quality is not measured online. The integral terms use conditional integration to prevent windup, and the local flow PI loops are tuned by the same IMC rule for first-order flow dynamics with τ = 3 s (air) and 5 s (reagent) and a one-step delay (Table A2).
The operator sat{·} limits the amplitude of the correction, and an additional rate limiter excludes abrupt changes in the setpoints. The deadband, applied to both errors (|ef|, |eq| < 0.015), prevents frequent setpoint changes under small deviations and measurement noise. As a result, the developed supervisor performs a coordination function, while the stability of the inner loops is ensured by the existing PID controllers.
The video reliability index R(k) ∈ [0, 1] characterizes the quality of the video channel. In a real system it is intended to be computed from frame-quality measures (sharpness, exposure, share of successfully segmented area). Since no real video was used in this study, R(k) is a scenario signal: R(k) = 0 during the staged video loss (320–380 s) and R(k) = 1 otherwise, including all 50 random-disturbance runs. The switching rule is as follows: multimodal correction if R(k) ≥ Rth, otherwise correction from process data only, with Rth = 0.70. With a binary R(k), any threshold between 0 and 1 gives identical behavior; the influence of Rth is therefore examined in a separate gradual-degradation scenario (Section 3.5). The value 0.70 is a design parameter and is not derived from statistical data.
Table 4 systematizes the constraints of the supervisory algorithm for the air and reagent channels, as well as the purpose of each protective mechanism.
Table 4.
Parameters and constraints of supervisory correction of the air and reagent flow-rate setpoints.
The correction ranges limit the setpoint deviation to ±35% (air) and ±25% (reagent) of the nominal value, so that the setpoints stay inside a conservative operating window. The deadband of 0.015 exceeds the measurement-noise level of the simulation and prevents setpoint changes caused by noise. The maximum rates (0.018 and 0.010 per s) are set so that the supervisor cannot change the setpoint faster than the process can respond, considering the time constants (28 s and 55 s) and delays (8 s and 25 s); the reagent rate is lower because this channel is slower. These values are design choices for the simulation and must be re-selected for a real plant. For comparison, the control rules of the target project limit the automatic correction of the air flow to ±15% per 10 min with a rate of at most 1% per 10 s and of the collector dose to ±20% per 30 min with a rate of at most 2% per min; these limits are stricter than the values in Table 4 and must be used in an industrial implementation.
The algorithm of the supervisory flotation process control system is shown in Figure 5. The algorithm operates in closed loop: process data and froth-layer state data are acquired, processed, and used to assess the state, form the corrective action, and transfer new setpoints to the local PID controllers.
Figure 5.
Algorithm of supervisory setpoint correction.
In the first stage, the air flow rate, reagent dosages, and pulp parameters are obtained from SCADA, and the visual features of the froth are obtained from the video camera; noise filtering and normalization of the parameters follow, and the froth-state index is determined from the processed elements.
An essential part of the algorithm is testing the reliability of the video data. As long as image quality is sufficient, multimodal correction is determined from both visual and process parameters; as reliability declines, the system switches to correction based on process data alone.
The output of the control action is passed through a block implementing amplitude constraints, rate-of-change constraints, and a deadband. This ensures that the actuators do not exceed their operating range, that setpoints do not change too rapidly, and that unnecessary minor switching operations are avoided.
The corrected setpoints are then sent to the local PID controllers, and the parameters and operating mode are recorded in SCADA before the next control cycle begins.
3.5. Results of the Simulation Study Under Typical Disturbances
Within this simulation-based demonstration, four sets of experiments were performed. In the first scenario, the feed rate, pulp density, and valuable-component content were varied sequentially. In the second, correlated random disturbances and step offsets were applied. In the third, loss of the video signal for a duration of 60 s was simulated. In the fourth, a gradual degradation and recovery of the video channel was simulated with different values of the reliability threshold. The process-data supervisor and the developed multimodal supervisor were compared with PID control at fixed setpoints for each variant. The disturbance ranges, experiment durations, and evaluated results for the four scenarios are summarized in Table 5.
Table 5.
Scenarios and parameters of the simulation study of the supervisory control system.
The local PID controllers of the inner loops are identical in all three configurations; the configurations differ only in the setpoint layer. The gains were obtained analytically from the time constants and delays of the model (Section 3.4), not by manual adjustment or by fitting to the evaluation data, so the tuning is independent of the 50 random-disturbance runs used for the statistical comparison. All configurations are evaluated with the same criteria (IAE, ISE, standard deviation, total variation of the control actions). The fixed-setpoint PID is a baseline representing the current practice described in the Introduction (constant setpoints), and the reported percentages should be read as improvements over this baseline.
The random component of the disturbances is modeled as AR(1)-correlated noise with the coefficient ρ = 0.90 at a 1 s step (correlation time ≈ 9.5 s, of the same order as the air-channel delay); its standard deviation is set to half of the midpoint of the corresponding step range in Table 5: σQ = 7.5% for the feed rate, σρ = 5.0% for the pulp density and σC = 6.0% for the valuable-component content. Random step offsets and measurement noise are added as specified in Appendix A, Table A4, and all three controllers are run on the same 50 disturbance realizations (identical random seeds). The disturbance ranges were chosen as plausible magnitudes of feed variations and were not derived from plant records; the scenarios are therefore robustness tests of the algorithm and not a realistic process validation.
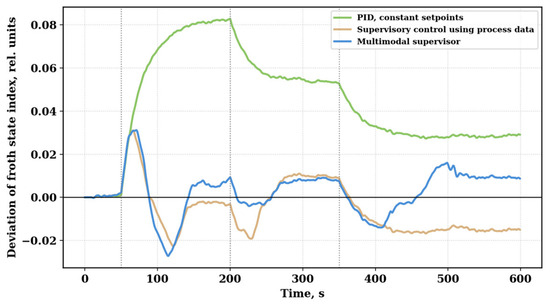
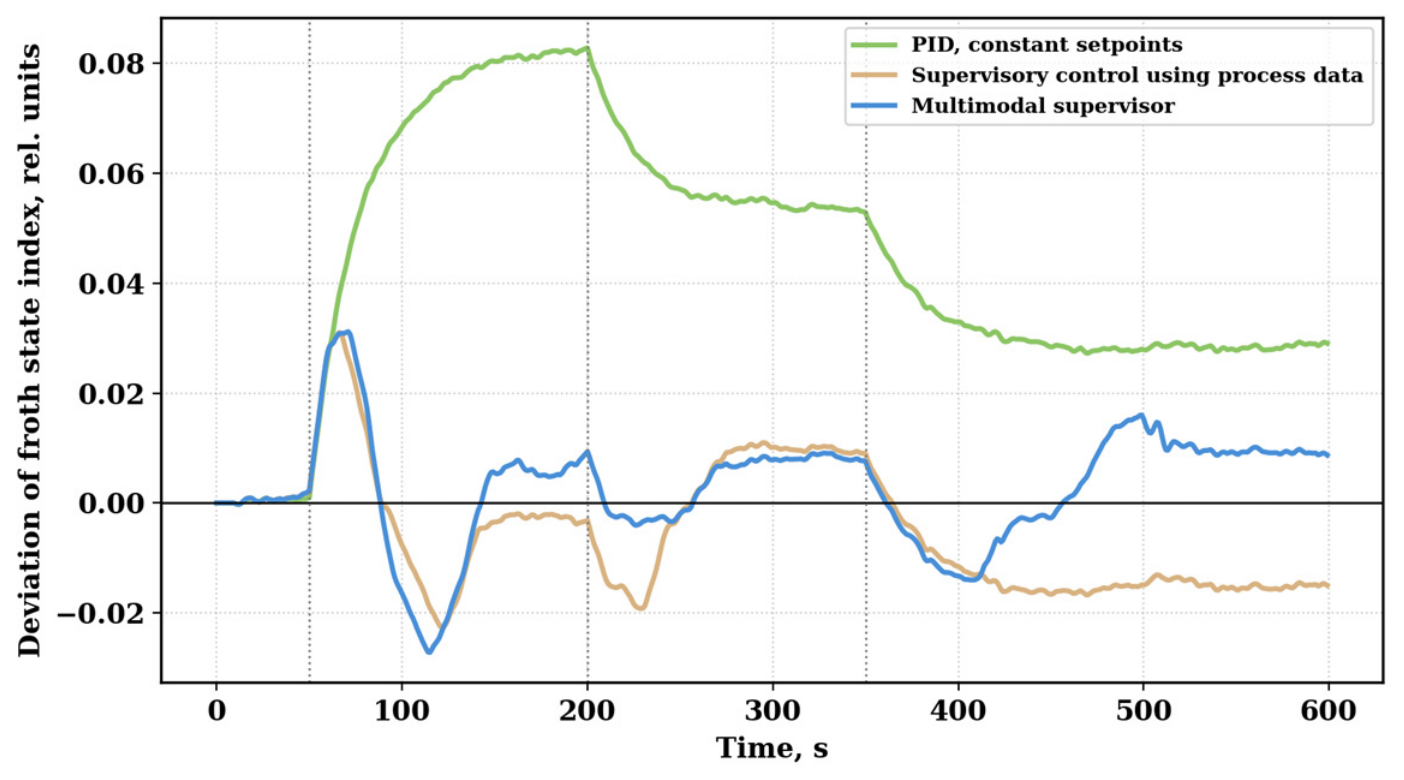
The froth state reaches equilibrium with the feed changes and remains so until the next disturbance. The process-parameter supervisor makes a clear step towards reducing the deviation, but does not fully compensate for the change in valuable-component content, which is not part of its correction channel. The multimodal supervisor also uses the actual froth state and achieves a smaller integral error after switching regimes (Figure 6).
Figure 6.
Change in the froth-state index under sequential disturbances.
Figure 6 plots the froth-state index against time for fixed setpoints, the process supervisor, and the multimodal supervisor, all subject to the same sequence of disturbances.
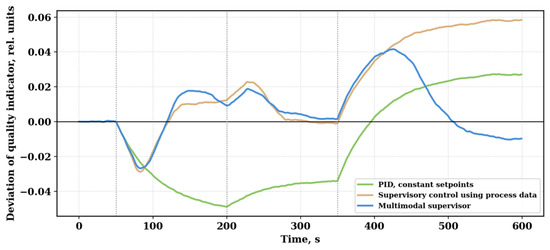
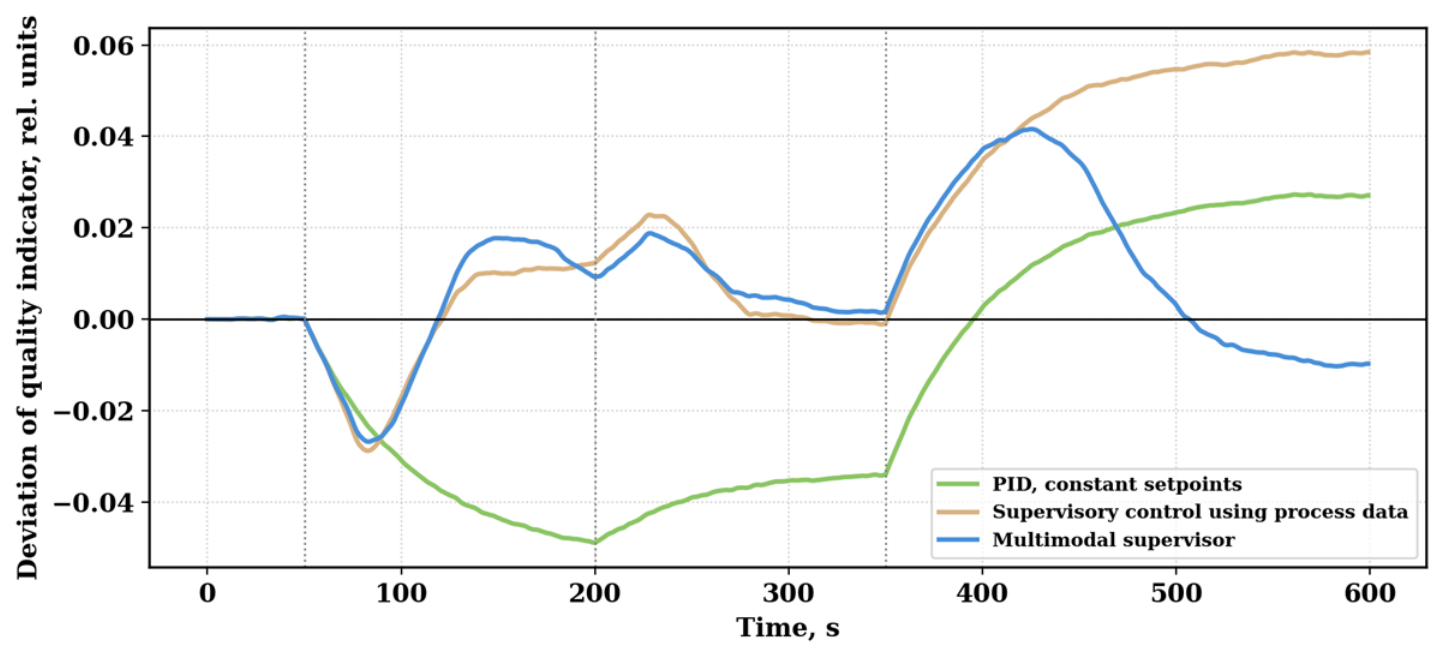
In terms of concentrate quality (in normalized units of the quality indicator), up to 350 s, almost identical trends are observed for the two supervisors (Figure 7); the discussion above regarding the use of visual feedback to compensate for parts of the process deviations that cannot be predicted, e.g., due to model uncertainty, applies here as well. For the multimodal variant, the advantage is most pronounced after 350 s, when the unmeasured content disturbance is compensated through the froth channel.
Figure 7.
Change in the concentrate quality indicator under sequential disturbances.
The same trend is obtained for the concentrate quality indicator. Figure 7 shows the deviations in the normalized concentrate quality indicator relative to its steady-state value, illustrating the disturbances relative to steady state and the efficiency of compensation.
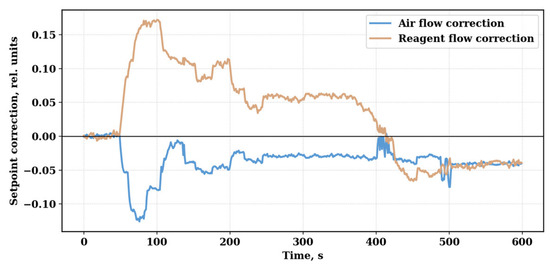
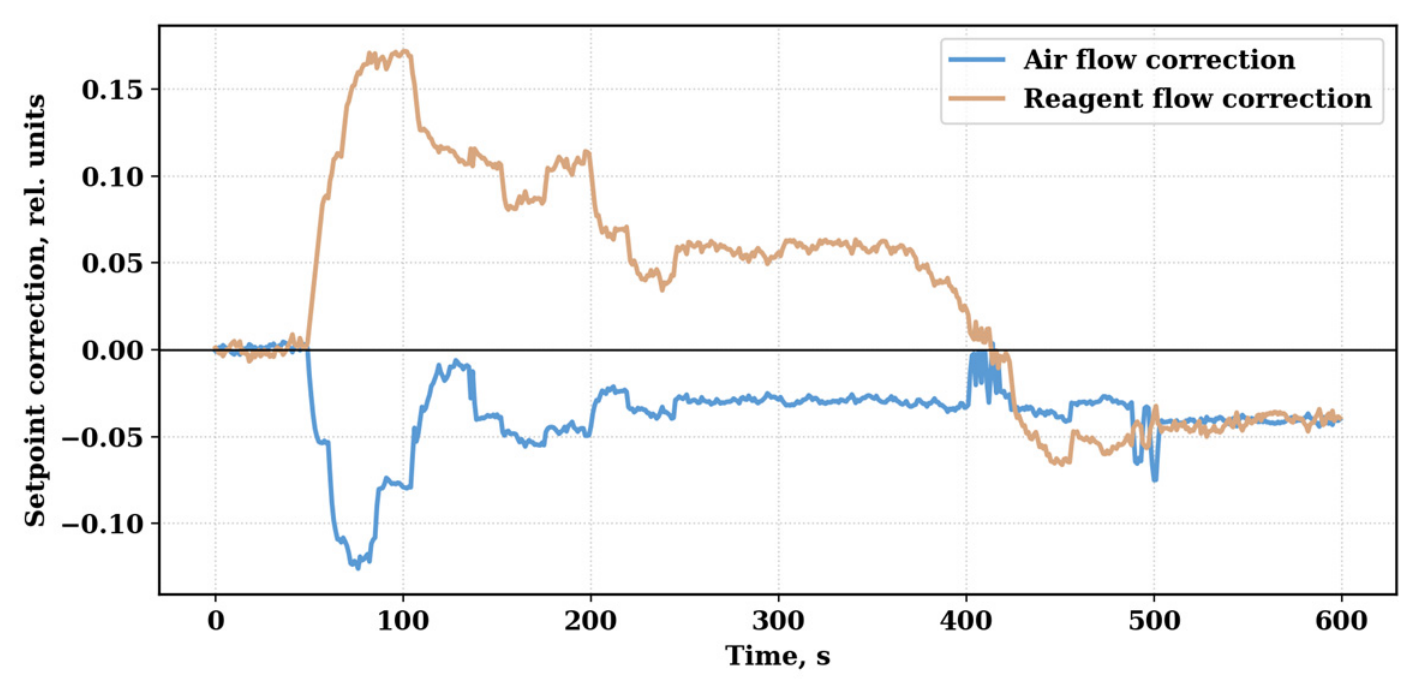
Even for the largest deviations, the process corrections remain within the desired limits. On the reagent channel, the transport delay is greater than on the air channel, meaning the air channel changes faster than the reagent channel, which prevents excessive dosing. Figure 8 shows no step-like jumps, because the rate limiters smooth the setpoint changes; small oscillations of the reagent correction at about 400–410 s occur when the error is close to the deadband. Changes in the air and reagent setpoints computed by the supervisor are presented in Figure 8 and demonstrate the implementation of amplitude and rate-of-change constraints.
Figure 8.
Corrections to the air and reagent setpoints by the multimodal supervisor.
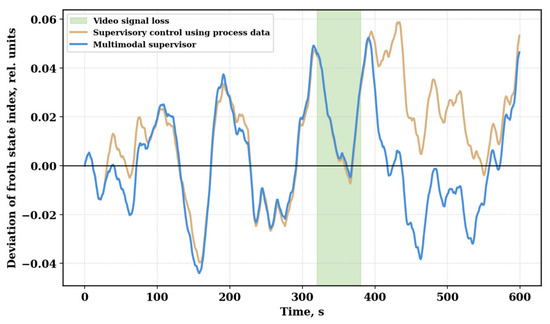
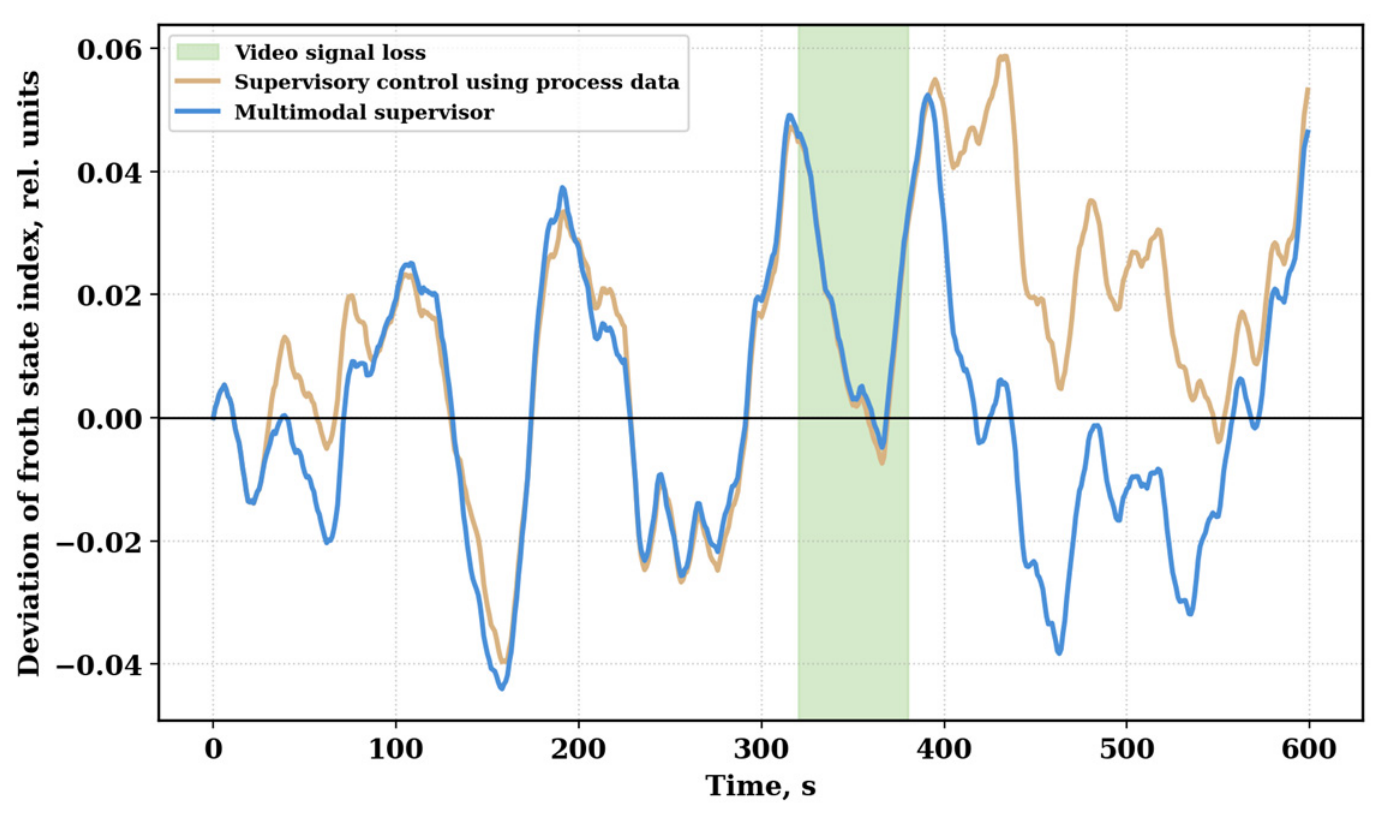
If the video signal from the camera is lost, the multimodal system automatically switches to correction based on process data. Although the visual component is not updated from 320 s to 380 s, the froth-state index remains within bounds; once the image returns to the operating range, no abrupt control jumps are seen in the measurements (Figure 9). The simulation therefore illustrates the operation of the fallback mode for a single 60 s interruption, although in an industrial implementation, hardware diagnostics and monitoring of image quality would also be required.
Figure 9.
Supervisor operation during a temporary loss of the video signal.
Figure 9 shows the behavior of the system for the period between the loss of the video signal at 320 s and the return to multimodal correction when the froth image returns to the operating range at 380 s.
After the reliability of the image decreases, visual features are excluded from the calculation, and correction of the settings continues according to technological parameters; during this period, the froth-state index remains within acceptable limits, illustrating that controllability is preserved in the simulation. Once the video channel is restored, multimodal correction resumes without abrupt changes in settings or in the adjustable variables. This result illustrates the fallback mode for a single interruption; however, for industrial applications, the algorithm should be supplemented with camera diagnostics, optical-contamination control, and image-quality assessment.
In the gradual-degradation scenario (Table 5), the reliability index decreases slowly, so the error of the froth features grows in proportion to 1 − R(k), the switch to process-data correction occurs when R(k) crosses the threshold, and the return to multimodal correction occurs during the recovery of the image signal. For Rth = 0.5–0.9, exactly two mode switches occurred in every run (one during degradation and one during recovery), the setpoint change at switching did not exceed the rate limit (0.018 per s for air), and the mean froth-state IAE of the multimodal supervisor varied only from 10.65 to 10.80 (quality IAE from 12.46 to 12.65). No chattering near the threshold was observed, because R(k) changes monotonically in this scenario; with a noisy reliability index, hysteresis or a minimum dwell time would be required (Section 4).
Statistical analysis was performed over 50 random-disturbance runs. For each run, the integral absolute error of the froth state (IAE_f), the integral absolute error of the quality indicator (IAE_q), the total squared error (ISE), the standard deviations of the controlled variables, and the total variation of the control actions were calculated.
The control-quality criteria are calculated by Formulas (8)–(10).
where IAEf is the integral absolute error of the froth-layer state; IAEq is the integral absolute error of the concentrate quality indicator; ISE is the total integral squared error; ef(k) and eq(k) are the errors of the corresponding output variables at step k; Δt is the simulation step, equal to 1 s; and Σ denotes summation over the entire duration of the experiment.
IAEf = Σ|ef(k)|Δt;
IAEq = Σ|eq(k)|Δt;
ISE = Σ[ef2(k) + eq2(k)]Δt.
The mean values and 95% confidence intervals (CIs) of the control-quality criteria for 50 runs of random disturbances are shown in Table 6.
Table 6.
Comparative performance indicators of the studied flotation process control methods. Values were recomputed with the documented simulation (Appendix A).
All three controllers were run on the same 50 disturbance realizations, so the comparison is paired. For each indicator, the per-run differences between the controllers were tested with the paired t-test and, as a distribution-free check, with the Wilcoxon signed-rank test; the effect size is reported as Cohen’s dz (mean of the paired differences divided by their standard deviation). The results are given in Table 7. The 95% confidence intervals in Table 6 do not overlap between the two supervisors for the froth IAE, the quality IAE, the ISE and the standard deviation of the quality indicator, whereas for the standard deviation of the froth state they overlap (0.0226 ± 0.0009 vs. 0.0222 ± 0.0007); according to the paired test, this difference is not significant (p = 0.22).
Table 7.
Paired comparison of the controllers over 50 identical disturbance realizations.
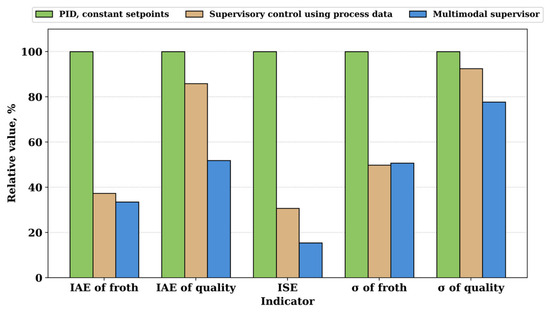
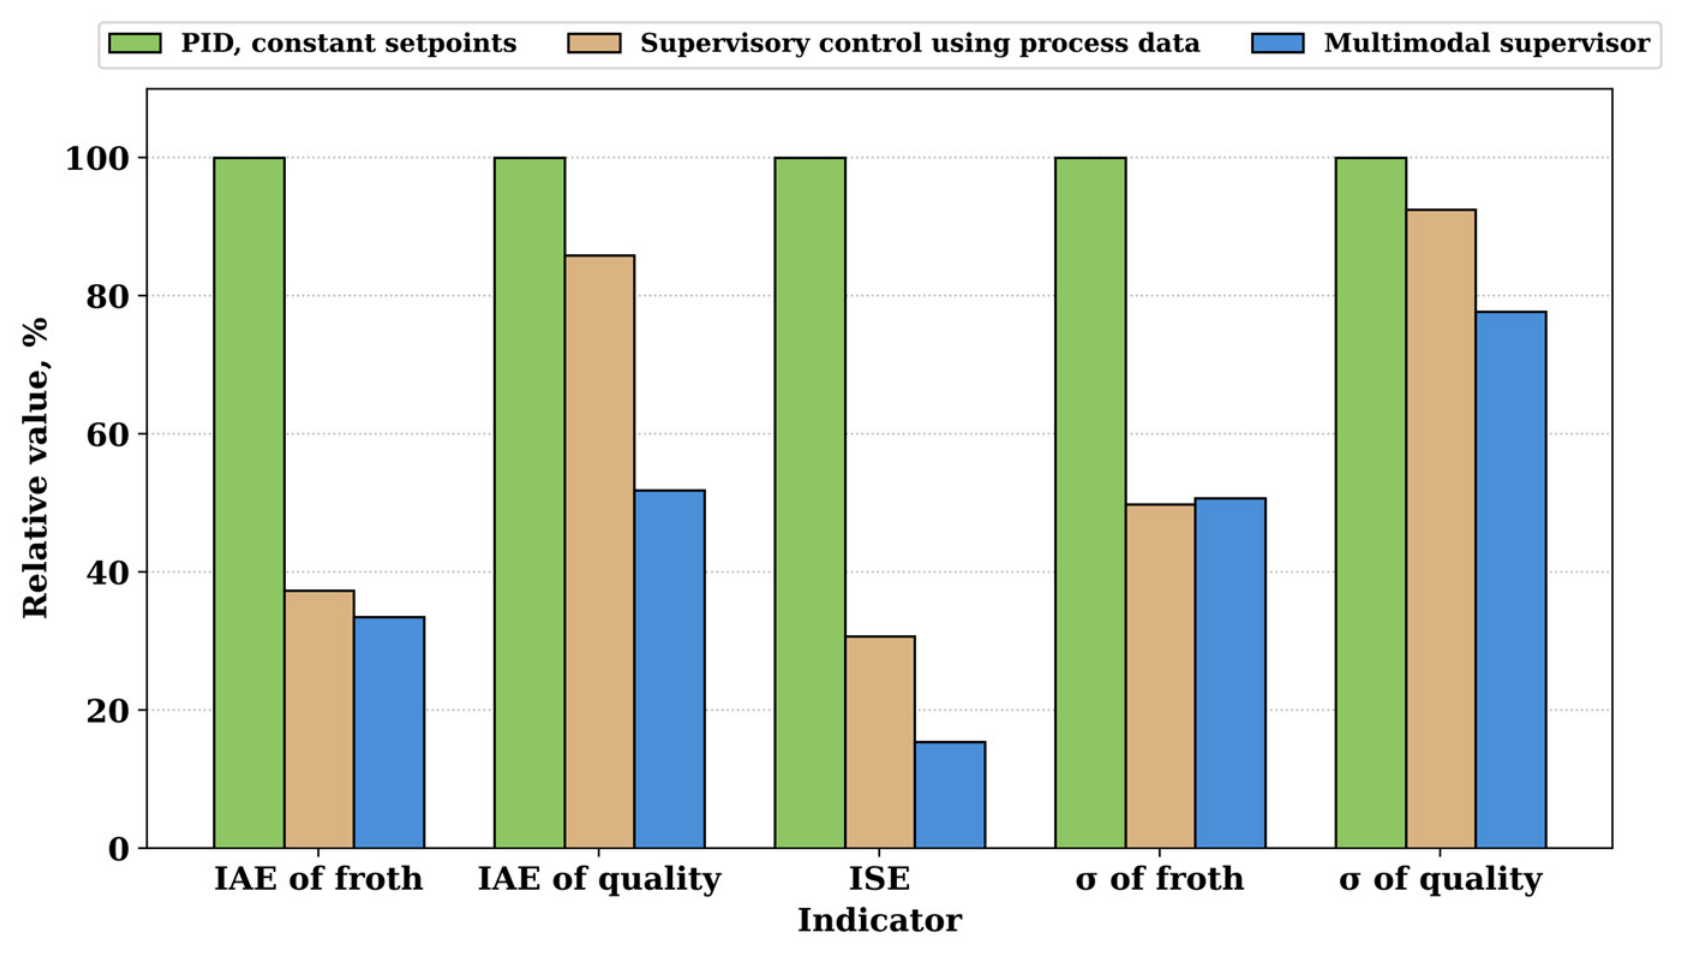
The process-data supervisor reduced the IAE of the froth state by 62.6% compared with PID control at fixed setpoints, while the IAE of quality was reduced by only 14.1%. Using the developed multimodal supervisor, the total ISE decreased by 84.6%, the froth-state IAE by 66.5%, and the IAE of the conditional (simulated) quality indicator by 48.1%. The standard deviation of the froth state decreased by 49.1%, and that of the quality indicator by 22.3%. The relative comparison of these indicators, with the PID variant taken as the 100% baseline, is shown in Figure 10.
Figure 10.
Relative control-quality indicators based on the results of 50 runs.
For the total variation of the control actions, the multimodal supervisor gives 3.53 relative units for the air correction and 3.80 for the reagent correction, compared with 3.45 and 4.06 for the process-data supervisor (+2.4% and −6.5%, respectively); the total variation is used as a proxy of actuator activity and wear. The better control quality is therefore not achieved at the cost of markedly higher actuator activity: the multimodal supervisor moves the air setpoint slightly more and the reagent setpoint slightly less than the process-data supervisor. Energy use, reagent consumption in physical units and operating cost cannot be quantified in a model with relative units; their assessment on plant data is part of future work. As before, the amplitudes and rates of the control actions were limited in all cases.
The sensitivity of the results to the feature weights was examined in two ways: each weight was changed in turn by ±20% with the other weights renormalized so that Σwi = 1, and 200 random weight vectors were drawn from a Dirichlet distribution centered on the nominal weights (concentration 100wi, mean standard deviation of the weights 0.038). For every weight set, the same 50 disturbance realizations were repeated. The froth-state IAE of the multimodal supervisor changed by at most 1.0% (one weight at a time) and 5.3% (random weights) relative to the nominal weights, and the quality IAE by at most 0.6% and 2.1%, respectively; both remained lower than those of the process-data supervisor for all 10 and all 200 weight sets.
Robustness to model uncertainty was examined on 200 perturbed plant models: each steady-state gain and coupling coefficient of Equations (4) and (5) and each time constant was multiplied by an independent factor drawn uniformly from [0.7, 1.3], and each delay by a factor from [0.8, 1.2]. The controllers were kept at their nominal tuning (Appendix A, Table A2), i.e., tuned on the nominal model and evaluated on the perturbed ones, and for each perturbed model the same 50 disturbance realizations were repeated. For all 200 perturbed plant models, the maximum absolute deviation of either output remained below the predefined threshold of 0.5 during the simulated time horizon; the largest observed deviation was 0.23. The mean froth-state IAE and quality IAE of the multimodal supervisor were lower than those of the process-data supervisor for 176 and 158 of the 200 models, respectively. This finite-horizon result does not constitute a formal stability proof or establish robustness to structural model uncertainty. Model mismatch degrades mainly the quality channel: the median quality IAE of the multimodal supervisor increased from 12.32 on the nominal model to 17.70 (process-data supervisor: 21.16), because the estimate of the content disturbance is obtained through the nominal model. Table 8 summarizes these analyses together with the gradual-degradation scenario.
Table 8.
Sensitivity of the multimodal (MM) supervisor to the feature weights, the reliability threshold and the model parameters (ranges of the mean IAE over 50 runs; for model parameters, median and 5–95% range over models). Nominal values: MM 10.84 and 12.32, PD 12.11 and 20.40.
Overall, the results of the five tasks fall within the boundaries set by the shortcomings of the respective approaches considered in the literature review. The dynamic model accounts well for the different inertia of the two channels. A visual index was designed and implemented that is both meaningful and computationally feasible. The safety of the correction algorithm for air and reagent flow was demonstrated in the simulation. The implemented approach allows a human operator to remain in control under a variety of disturbances, including loss of the video signal. The statistical advantages of the multimodal variant over the two baseline variants, except for the froth-state standard deviation relative to the process-data supervisor (Table 7), are consistent with the objectives of the implemented approach.
4. Discussion
The resulting improvement in control quality is explained by the combined use of technological parameters and visual characteristics of the froth layer within a single supervisory loop. Dynamic models (4) and (5) take into account the difference in the inertia of the air and reagent channels, as well as the slower formation of the concentrate quality indicator compared with the change in froth state; this is illustrated in the simulation by the transient responses in Figure 2 and Figure 3 and the model parameters in Table 2. The presence of transport delays of 8 s for air and 25 s for reagent necessitated a separate limitation of the rate of change of the corresponding settings.
The froth-state index (6) combines average bubble size, coating density, froth movement speed, texture heterogeneity, and structural stability. The distribution of coefficients in Table 3 and Figure 4 shows that the largest contribution to the assessment of process state comes from bubble size, movement speed, and froth stability. Taking these characteristics into account jointly provides a more complete assessment of the process than a single visual feature, so a multimodal supervisor more effectively compensates for disturbances not fully reflected by standard technological sensors.
Algorithm (7) generates limited corrections to the settings without directly affecting the actuators. The amplitude limits, deadband, and rate limiters shown in Table 4 prevent sudden changes in air and reagent flow rates. Verification of the reliability of the video signal, presented in the algorithm in Figure 5, makes it possible to exclude unreliable visual data and continue control according to technological parameters; the operability of this switch is illustrated by the results in Figure 9, where the system remains controllable during the loss of the video signal, and restoration of the multimodal mode is not accompanied by abrupt changes in settings.
The contribution of the proposed method should be distinguished from the individual technologies incorporated into its architecture. Model-based and predictive control [1,2,8,9,13,14], froth-image analysis for monitoring, forecasting and state recognition [5,15,16,17,18,20,21,22,23,24,25,26,27,28], vision-based setpoint generation [19], and the limited reliability of froth imaging under industrial conditions [6,7,29,30] have been investigated in previous studies. The present work integrates these functions into a single supervisory algorithm for coordinated correction of air and reagent flow-rate setpoints while retaining the existing local PID controllers. Unlike approaches focused primarily on monitoring or predicting flotation conditions, the proposed algorithm generates constrained setpoint corrections and provides a fallback mechanism when visual-channel reliability decreases. In ref. [19], visual features are also used to form setpoints; the present method additionally includes video-reliability monitoring, a fallback mode, and rate limits for the control actions. Table 9 compares these characteristics with those reported in representative previous studies. The demonstrated contribution is limited to the investigated simulation scenarios; industrial performance requires experimental validation.
Table 9.
Comparison of the proposed approach with representative prior works.
Table 9 compares the proposed approach with representative works discussed in the Introduction with respect to the use of froth video, joint correction of air and reagent, reliability monitoring with fallback, and preservation of local PID controllers.
The quantitative results in Table 6 and Figure 10 are consistent with the advantage of multimodal feedback in the simulation. Compared with PID control at constant settings, the integral absolute error of the froth state decreased by 66.5%, the error of the conditional (simulated) concentrate quality indicator by 48.1%, and the integral squared error by 84.6%; the standard deviations of the froth state and the quality indicator decreased by 49.1% and 22.3%, respectively. These reductions are stated relative to the PID baseline; relative to the process-data supervisor, the difference in the froth-state standard deviation is not significant (Table 7). Most of the reduction in the froth-state error relative to PID is already achieved by the process-data supervisor (62.6%) through feedforward compensation of the measured disturbances; the main contribution of the visual channel is to the quality channel (quality IAE 12.32 vs. 20.40), because it allows the unmeasured content disturbance to be estimated and compensated. The increase in control quality is not accompanied by a notable increase in the total variation of the control actions, and their amplitude and rate remain within the limits set in Table 4. At the target plant, the copper content of the feed and of the concentrate is determined from hourly samples and from the shift chemical analysis; the simulated quality indicator, with a time constant of 55 s, therefore has no measured counterpart on this time scale.
There is no generally accepted numerical criterion of acceptable performance for supervisory flotation control: the admissible error depends on the plant and on the metallurgical target, which the simulation does not include. The reported reductions are therefore relative to fixed-setpoint PID in simulation, and acceptance criteria for production must be defined on industrial data.
The limitations of the study are determined by the conditions of the simulation test. The coefficients of models (4) and (5) are given in relative units and are not the result of identifying a specific industrial flotation machine. The indicators obtained are reproducible for the disturbance ranges, experiment durations, and constraints given in Table 5. The scope of applicability of the method is limited to mechanical flotation machines equipped with a PLC, SCADA, sensors for technological parameters, and a video camera; the stability of the visual assessment depends on lighting, optical contamination, camera position, and video-stream quality, consistent with the findings of [6,7,29,30].
Limitations. The study is simulation-based. No industrial data, experimental validation, hardware-in-the-loop testing or measured metallurgical quantities (concentrate grade, recovery) were used; the quality indicator is a conditional surrogate; the model is generic and not identified; the visual features are simulated indicators and were not validated on plant video. The advantage of the multimodal supervisor is partly built into the simulation: the visual features are generated from the true froth state with additive noise, so the multimodal supervisor receives a noisy but direct measurement of the state, which the process-data supervisor does not have, and the content observer uses the nominal gain of the content disturbance on the froth state. The results therefore quantify the value of such a measurement under the assumed noise level and feature–state relation, not the performance of real image processing; in practice, froth features depend on the froth state nonlinearly and are affected by illumination, camera position and ore type, which may reduce or remove the advantage. The sensitivity to the feature weights, the reliability threshold and parametric model errors were examined only within the ranges given in Section 3.5; robustness to structural model mismatch (higher-order dynamics or nonlinearity of a real flotation cell) was not analyzed. The fallback was tested for one continuous loss and one gradual degradation of the video signal; intermittent degradation, repeated switching, simultaneous loss of video and process disturbance, and the need for hysteresis or a minimum dwell time to prevent chattering near the threshold were not studied and are the next step before any practical use. The PID baseline is a fixed-setpoint baseline. The time scale of the model (seconds) is much shorter than the flotation time of about 18 min and the hourly assay interval of the target plant. The reported percentages are valid only for the simulated conditions. These limitations could be addressed by generating an industrial set of synchronized data, identifying parameters by operating mode, adapting the weighting settings, and testing in hardware-in-the-loop mode.
Further development of the study relates to industrial verification of the method, the inclusion of data from online composition analyzers, adaptation of supervisor parameters to ore type, and assessment of the effect of control on extraction, concentrate quality, and specific reagent consumption and the definition of plant-specific acceptance criteria. The main difficulties will be synchronizing video data and technological signals while accounting for variable delays, ensuring stability when switching modes, accumulating representative data on rare disturbances, and safely implementing the algorithm without violating existing protections and interlocks.
5. Conclusions
- A flotation supervisory management structure has been formed that preserves the standard local PID circuits and supplements them with an upper level of setpoint correction. Unlike solutions focused primarily on monitoring or on replacing the current control system, the proposed structure combines visual and technological data, limits control actions, monitors the reliability of the video channel, and logs decisions in SCADA. The structure is designed for compatibility with existing PLC–SCADA automation; its industrial applicability remains to be verified.
- A generic two-channel dynamic simulation model was formulated to study the effects of air and reagent flow-rate corrections on the froth-state index and a conditional concentrate quality indicator. The assumed time constants are 28 s and 55 s, and the transport delays for the air and reagent channels are 8 s and 25 s, respectively. The model includes the cross-coupling of both control inputs and both outputs. Its coefficients were not identified from industrial measurements, and the assumed dynamics should not be interpreted as validated characteristics of a specific flotation unit.
- An interpretable froth-state index has been developed, combining five normalized visual features. The highest weights are assigned to average bubble size (0.25), froth velocity (0.22), and structural stability (0.21); coating density and texture heterogeneity have weights of 0.18 and 0.14, respectively. Unlike the use of a single visual parameter, this indicator characterizes the froth condition comprehensively, because the various features reflect the complementary properties of gas dispersion, product transfer, and froth-layer stability.
- An algorithm for supervisory correction of air-flow and reagent settings has been proposed, with a deadband of 0.015, amplitude limits of ±0.35 and ±0.25, maximum rates of change of 0.018 and 0.010 per second, and a video-data reliability threshold of 0.70. When image quality decreases, the system automatically switches to correction based on technological parameters. Unlike direct actuator control based on computer-vision results, the proposed algorithm adjusts the local controller setpoints within specified amplitude and rate limits. The fallback mechanism was evaluated for the investigated video-loss and gradual-degradation scenarios; its performance under repeated switching and combined failures requires further assessment.
- In the simulation study, according to the results of 50 simulation runs, the multimodal supervisor, compared with PID control at constant settings, reduced the integral absolute error of the froth state by 66.5%, the error of the conditional (simulated) concentrate quality indicator by 48.1%, the integral squared error by 84.6%, the standard deviation of the froth state by 49.1%, and that of the quality indicator by 22.3%. The advantage of the method is explained by a more complete assessment of the current state of the process through the combination of visual and technological feedback. The values obtained relate to the simulation model and require subsequent verification on industrially identified data.
Supplementary Materials
The following supporting information can be downloaded at: https://www.mdpi.com/article/10.3390/eng7100535/s1, Supplementary Material S1: Python source code of the simulation.
Author Contributions
Conceptualization, K.A.; methodology, K.A.; software, K.A.; validation, N.T., O.A. and A.S.; formal analysis, L.A.; investigation, N.T.; resources, N.T.; data curation, N.T.; writing—original draft preparation, K.A.; writing—review and editing, N.T.; visualization, L.A.; supervision, N.T.; project administration, N.T. O.A. and A.S. contributed to the collection and screening of literature sources and assisted in verifying the calculations of the dynamic model and the simulation results. All authors have read and agreed to the published version of the manuscript.
Funding
This research was funded by the Science Committee of the Ministry of Science and Higher Education of the Republic of Kazakhstan under targeted programme financing, project No. BR28713037, “Development of a hardware-software complex based on artificial intelligence technologies for flotation process control at mining and processing enterprises”.
Data Availability Statement
The complete set of model equations and parameters is given in Appendix A; the simulation code is provided as Supplementary Material S1.
Conflicts of Interest
The authors declare no conflicts of interest.
Appendix A
This appendix collects the parameters needed to reproduce the simulations. The reliability rule, thresholds, correction limits and rate limits are given in Section 3.4 (Table 4); the simulation step is 1 s and the duration of each run is 600 s.
Table A1.
Coefficients of the plant model, Equations (4) and (5).
Table A2.
Controller parameters (IMC/λ-tuning with λ = θ after static decoupling).
Table A3.
Weights and generation parameters of the simulated visual features.
Table A4.
Disturbance generator.
Table A5.
Classification of variables.
References
- Quintanilla, P.; Neethling, S.J.; Brito-Parada, P.R. Modelling for froth flotation control: A review. Miner. Eng. 2021, 162, 106718. [Google Scholar] [CrossRef] [Scilit]
- Quintanilla, P.; Navia, D.; Neethling, S.J.; Brito-Parada, P.R. Economic model predictive control for a rougher froth flotation cell using physics-based models. Miner. Eng. 2023, 196, 108050. [Google Scholar] [CrossRef] [Scilit]
- Wills, B.A.; Finch, J.A. Wills’ Mineral Processing Technology, 8th ed.; Butterworth-Heinemann: Oxford, UK, 2016. [Google Scholar]
- Kulinchenko, H.; Zhurba, V.; Panych, A.; Leontiev, P. Development of the method of constructing the expander turbine rotation speed regulator. East.-Eur. J. Enterp. Technol. 2023, 2, 44–52. [Google Scholar] [CrossRef] [Scilit]
- Dong, H.; Wang, F.; He, D.; Liu, Y. Flotation equipment automation and intelligent froth feature extraction in flotation process: A review. Rev. Chem. Eng. 2025, 41, 225–239. [Google Scholar] [CrossRef] [Scilit]
- Vinnett, L. A discussion on the limitations of image analysis for determining bubble size in industrial flotation when using algorithms successfully tested from idealized images. Physicochem. Probl. Miner. Process. 2023, 59, 174474. [Google Scholar] [CrossRef] [Scilit]
- Huang, X.; Wang, Y.; Zhu, Z.; Shang, H.; Cao, Z. Coal slurry foam image enhancement based on multiscale convolutional network. Physicochem. Probl. Miner. Process. 2024, 60, 188277. [Google Scholar] [CrossRef] [Scilit]
- Quintanilla, P.; Neethling, S.J.; Navia, D.; Brito-Parada, P.R. A dynamic flotation model for predictive control incorporating froth physics. Part I: Model development. Miner. Eng. 2021, 173, 107192. [Google Scholar] [CrossRef] [Scilit]
- Quintanilla, P.; Neethling, S.J.; Mesa, D.; Navia, D.; Brito-Parada, P.R. A dynamic flotation model for predictive control incorporating froth physics. Part II: Model calibration and validation. Miner. Eng. 2021, 173, 107190. [Google Scholar] [CrossRef] [Scilit]
- Oosthuizen, D.J.; Le Roux, J.D.; Craig, I.K. A dynamic flotation model to infer process characteristics from online measurements. Miner. Eng. 2021, 167, 106878. [Google Scholar] [CrossRef] [Scilit]
- Li, Z.; Huang, M.; Zhu, J.; Gui, W.; Jiang, Z.; Du, W. Learning-based adaptive optimal control for flotation processes subject to input constraints. IEEE Trans. Control Syst. Technol. 2023, 31, 252–264. [Google Scholar] [CrossRef] [Scilit]
- Venter, J.-L.; Le Roux, J.D.; Craig, I.K. State and parameter estimation of a dynamic froth flotation model using industrial data. Miner. Eng. 2024, 219, 109059. [Google Scholar] [CrossRef] [Scilit]
- Wang, Y.; del Río-Chanona, E.A.; Quintanilla, P. Gaussian process nonlinear model predictive control for online partially observable systems: An application to froth flotation. Ind. Eng. Chem. Res. 2025, 64, 13307–13322. [Google Scholar] [CrossRef] [Scilit]
- Quintanilla, P.; Navia, D.; Neethling, S.J.; Brito-Parada, P.R. Centralised economic model predictive control of froth flotation banks with experimental implementation. Chem. Eng. Res. Des. 2025, 224, 467–481. [Google Scholar] [CrossRef] [Scilit]
- Szmigiel, A.; Apel, D.B.; Skrzypkowski, K.; Wojtecki, Ł.; Pu, Y. Advancements in machine learning for optimal performance in flotation processes: A review. Minerals 2024, 14, 331. [Google Scholar] [CrossRef] [Scilit]
- Chen, X.; Liu, D.; Yu, L.; Shao, P.; An, M.; Wen, S. Recent advances in flotation froth image analysis via deep learning. Eng. Appl. Artif. Intell. 2025, 147, 110283. [Google Scholar] [CrossRef] [Scilit]
- Bendaouia, A.; Qassimi, S.; Boussetta, A.; Benzakour, I.; Amar, O.; Hasidi, O. Artificial intelligence for enhanced flotation monitoring in the mining industry: A ConvLSTM-based approach. Comput. Chem. Eng. 2024, 180, 108476. [Google Scholar] [CrossRef] [Scilit]
- Ai, M.; Xie, Y.; Tang, Z.; Zhang, J.; Gui, W. Two-stream deep feature-based froth flotation monitoring using visual attention clues. IEEE Trans. Instrum. Meas. 2021, 70, 1–14. [Google Scholar] [CrossRef] [Scilit]
- Ai, M.; Xie, Y.; Tang, Z.; Zhang, J.; Gui, W. Deep learning feature-based setpoint generation and optimal control for flotation processes. Inf. Sci. 2021, 578, 644–658. [Google Scholar] [CrossRef] [Scilit]
- Jiang, X.; Zhao, H.; Liu, J.; Ma, S.; Hu, M. Research on multi-scale feature extraction and working condition classification algorithm of lead-zinc ore flotation foam. Appl. Sci. 2023, 13, 4028. [Google Scholar] [CrossRef] [Scilit]
- Lu, D.; Wang, F.; Wang, S.; Bu, K.; Li, K.; Ma, X. Multimode froth flotation process operating performance assessment based on deep embedded graph clustering network. IEEE Trans. Ind. Inform. 2024, 20, 9445–9454. [Google Scholar] [CrossRef] [Scilit]
- Fan, Z.; Feng, Y.; Wang, K.; Li, X. Multi-modal temporal hypergraph neural network for flotation condition recognition. Entropy 2024, 26, 239. [Google Scholar] [CrossRef] [Scilit] [PubMed]
- Liu, C.; Wang, Y.; Fang, Y.; Yang, C.; Gui, W. Operating condition recognition of industrial flotation processes using visual and acoustic bimodal autoencoder with manifold learning. IEEE Trans. Ind. Inform. 2024, 20, 7428–7439. [Google Scholar] [CrossRef] [Scilit]
- Fan, Y.; Lv, Z.; Chen, S.; Cui, Y.; Wu, Y.; Zhao, X.; Xu, Z.; Wang, W. Condition recognition based on multi-source heterogeneous data and residual temporal network in coal flotation process. Meas. Sci. Technol. 2025, 36, 036002. [Google Scholar] [CrossRef] [Scilit]
- Zhang, J.; Ai, M.; Tang, Z.; Xie, Y.; Wu, J.; Ma, J. Data-efficient soft sensing learning for flotation process monitoring. IEEE Trans. Instrum. Meas. 2025, 74, 1–10. [Google Scholar] [CrossRef] [Scilit]
- Zhang, H.; Yang, M.; Tang, Z.; Xie, Y.; Zheng, Z.; Gui, W. Flotation grade monitoring using feed grade refined embedding and nonoverlapped patch encoding. IEEE Trans. Ind. Inform. 2025, 21, 8779–8790. [Google Scholar] [CrossRef] [Scilit]
- Wang, S.; Wang, K.; Li, X. Dynamic hypergraph neural networks for flotation condition recognition based on group-view composite features. IEEE Trans. Instrum. Meas. 2025, 74, 1–13. [Google Scholar] [CrossRef] [Scilit]
- Zhu, P.; Jiang, Z.; Peng, Z.; Cai, G. GC-FSegNet: A flotation froth segmentation network with integrated global context awareness. Minerals 2025, 15, 1301. [Google Scholar] [CrossRef] [Scilit]
- Vinnett, L.; León, R.; Mesa, D. Artificial neural network modelling to estimate bubble size from macroscopic image and object features. Physicochem. Probl. Miner. Process. 2023, 59, 185759. [Google Scholar] [CrossRef] [Scilit]
- Azhari, F.; Sennersten, C.C.; Lindley, C.A.; Sellers, E. Deep learning implementations in mining applications: A compact critical review. Artif. Intell. Rev. 2023, 56, 14367–14402. [Google Scholar] [CrossRef] [Scilit]
- Ogonowski, S.; Wójtowicz, P. Convolutional neural networks for froth imaging in a flotation machine with electromagnetic regrinding impeller. Arch. Control Sci. 2025, 35, 771–792. [Google Scholar] [CrossRef] [Scilit]
- Budemberg, G.; Jolsterå, R.; Karlkvist, T.; Chehreh Chelgani, S. Shades of green: The path to flotation reagents development. Green Chem. 2026, 28, 6152–6168. [Google Scholar] [CrossRef] [Scilit]
- Mohammadi-Jam, S. Surface chemistry and reagents in flotation. Minerals 2026, 16, 128. [Google Scholar] [CrossRef] [Scilit]
- Akishev, K.; Podvalov, A.; Zeynullin, A.; Aibuldinov, Y.; Ospanova, M.; Nurmaganbetov, A.; Chagay, M.; Aitiyeva, M.; Khussainova, S.; Toktar, N. Development of a hardware and software complex for controlling the flotation process at a processing plant. Vestn. KazUTB 2026, 2, 1378. [Google Scholar] [CrossRef] [Scilit]
- Akishev, K.; Podvalov, A.; Zeynullin, A.; Aibuldinov, Y.; Nurmaganbetov, A.; Ospanova, M.; Chagay, M.; Aitiyeva, M.; Khussainova, S.; Toktar, N. The effect of the chemical composition of the pulp on the efficiency of flotation during automated parameter control. Vestn. KazUTB 2026, 2, 1394. [Google Scholar] [CrossRef] [Scilit]
- Akishev, K.; Podvalov, A.; Zeynullin, A.; Aibuldinov, Y.; Ospanova, M.; Nurmaganbetov, A.; Chagay, M.; Aitiyeva, M.; Khussainova, S.; Toktar, N. Computer vision control of ore material distribution in bunkers. Vestn. KazUTB 2026, 2, 1413. [Google Scholar] [CrossRef]

Disclaimer/Publisher’s Note: The statements, opinions and data contained in all publications are solely those of the individual author(s) and contributor(s) and not of MDPI and/or the editor(s). MDPI and/or the editor(s) disclaim responsibility for any injury to people or property resulting from any ideas, methods, instructions or products referred to in the content. |
© 2026 by the authors. Licensee MDPI, Basel, Switzerland. This article is an open access article distributed under the terms and conditions of the Creative Commons Attribution (CC BY) license.