


Abstract
When extracting features for activity recognition, applying a fixed-length sliding window without considering activity transition timing may result in multiple activities being included within a single window, potentially degrading recognition performance. To address this issue, we propose an activity segmentation framework centered on a foot-pressure-based segmentation method (FP). The framework further incorporates multiple segmentation strategies by combining the proposed foot-pressure-based method with a conventional spectral transition measure-based method (STM), and investigates their effects on subsequent activity recognition. Experimental results show that the FP and STM methods exhibit different activity-boundary detection characteristics. FP achieves higher precision, whereas STM provides higher recall, and combining the two methods increases boundary coverage. Activity recognition experiments further show that the effect of segmentation depends on the evaluation setting, and that adding foot-pressure features to the recognition model does not consistently improve recognition performance. These results demonstrate the potential of foot-pressure signals to provide boundary information that differs from inertial sensing and highlight the importance of evaluating their role in activity segmentation rather than simply treating foot-pressure data as additional recognition features.
1. Introduction
Human activity recognition (HAR) aims to classify human activities from sensor data and is widely applied in fields such as rehabilitation, sports analysis, and human–computer interaction. To achieve accurate recognition, long sequences of sensor data must be transformed into representations from which discriminative features can be extracted for model training.
Among existing approaches, the sliding-window method (SW) has been widely adopted in HAR studies [1,2]. This approach extracts features from continuous sensor data using fixed-length (often overlapping) time windows, without explicitly identifying activity boundaries. Therefore, it is generally regarded as a window-based feature extraction strategy rather than a segmentation method.
However, a known limitation of this window-based approach is that a single window may contain multiple activities, particularly when activity transitions do not align with window boundaries. This results in mixed or noisy feature representations, which can degrade recognition performance.
To address this issue, segmentation-based approaches have been proposed to explicitly detect activity change points. Among them, the spectral transition measure (STM) has been widely studied as a method that identifies transition points based on changes in acceleration signals [3]. However, STM-based methods are often sensitive to sensor placement and measurement noise, leading to unstable segmentation performance across different activities and participants.
In our previous work [4], we proposed a Foot-Pressure-based Segmentation (FP) method based on foot-pressure sensors and compared it with an existing Spectral Transition Measure (STM)-based segmentation method. The results showed that FP and STM exhibit different segmentation characteristics and provide complementary advantages depending on the type of activity transition.
Building on these findings, this study proposes a cross-modal activity segmentation framework that integrates the complementary characteristics of FP and STM. Rather than treating FP and STM as competing segmentation methods, the proposed framework explores how their complementary boundary detection characteristics can be combined through different segmentation strategies. Specifically, candidate segmentation points are independently detected using the FP and STM methods, and six segmentation strategies are constructed based on different combinations and selection criteria of these candidate points. In addition, an Adaptive strategy is introduced to select an appropriate segmentation method according to the activity.
The effectiveness of these segmentation strategies is evaluated from both segmentation and activity recognition perspectives. Following the evaluation protocol used in our previous work, both within-participant and inter-participant evaluations based on Leave-One-Participant-Out (LOPO) cross-validation are conducted. The effects of the different segmentation strategies on segmentation performance and subsequent activity recognition performance are systematically compared. Furthermore, a boundary-proximity analysis is performed to investigate the boundary detection characteristics of each segmentation method and to examine how the detected segmentation points are distributed around the ground-truth activity transitions.
Through these experiments, this study investigates the complementary characteristics of FP- and STM-based segmentation and examines how different combinations of their segmentation cues affect segmentation and activity recognition performance. The results provide insights into how segmentation strategies can be selected or combined according to activity transition characteristics.
The structure of this paper is as follows. Section 2 introduces related work. Section 3 describes the segmentation methods investigated in this study. Section 4 presents the experimental setup. Section 5 discusses the experimental results. Finally, Section 6 concludes the paper.
This paper substantially extends our preliminary conference proceeding [4]. That study introduced the basic foot-pressure-based segmentation method, whereas this work further investigates cross-modal fusion with STM, multiple boundary combination strategies, participant-independent activity recognition, and transition-dependent adaptive segmentation.
2. Related Work
2.1. Human Activity Recognition
Human activity recognition has traditionally been studied using either vision-based or sensor-based approaches. However, vision-based methods often raise privacy concerns, require substantial computational resources, and are constrained by limited recognition range, leading to a growing preference for sensor-based alternatives.
Among the various sensors employed in HAR, two types of wearable sensors are particularly common. The first is inertial measurement unit (IMU) sensors, such as accelerometers and gyroscopes. These sensors are capable of capturing dynamic full-body movements and transitional activities with high temporal resolution. Due to their compact size and ease of integration, they are widely embedded in smartphones and wearable devices.
The second type is foot pressure sensors, which are typically installed in insoles or socks. These sensors offer robust measurement of foot–ground contact patterns and are relatively unaffected by upper-body movement noise. This makes them especially effective for recognizing repetitive lower-limb activities, such as walking, running, or stair climbing.
Many studies have achieved high recognition accuracy using these sensors. For instance, Lara et al. [5] combined a chest-mounted accelerometer with biometric data, reaching 95.7% accuracy. Bao et al. [6] used multiple biaxial accelerometers placed on different body parts to classify daily activities. Tsukamoto et al. [7] embedded hundreds of IMUs in garments, showing that optimal placement improves accuracy. Similarly, foot pressure sensors have enabled accurate recognition: Sugimoto et al. [8] reported nearly 100% accuracy for lower-limb activities; Fukabori et al. [9] achieved 99.4% with sock-type sensors; and Ohnishi et al. [10] recognized 22 activities using high-resolution in-shoe sensors. Moreover, Hegde et al. [11] combined IMUs and pressure sensors to achieve over 94% accuracy.
However, most prior works have not explicitly addressed the challenge of automatic segmentation of continuous activity data. Accurate segmentation is essential: if windows contain mixed activities, feature extraction and recognition performance degrade significantly.
In this study, we propose a method that combines the complementary strengths of IMU and foot pressure sensors for HAR. Crucially, we also tackle the segmentation problem by extracting structural features from foot pressure data to automatically identify activity boundaries. This approach aims to improve recognition accuracy and robustness, particularly around transitions where conventional fixed-window methods often fail.
2.2. Research on Segmentation Methods
2.2.1. Conventional Segmentation Approaches
In HAR, early studies often relied on manual segmentation, where activity boundaries were annotated using synchronized video or metadata. While manual segmentation yields accurate boundaries, it is time-consuming, labor-intensive, and participant to human bias.
Many HAR studies have instead adopted sliding-window techniques [1,2], which divide continuous sensor data into fixed-length or variable-length windows for feature extraction and classification. However, it is important to note that sliding-window schemes are not segmentation methods per se; they do not explicitly identify activity boundaries but process the data in chunks without ensuring alignment with actual transitions.
To overcome these limitations, recent studies have focused on automatic activity segmentation using change-point detection (CPD) techniques. Early statistical approaches detect activity boundaries by monitoring changes in the statistical properties of multivariate sensor signals. For example, MOCA (Multivariate Online Change DetectionAlgorithm) [12,13,14] employs statistical hypothesis testing to identify significant distribution changes in streaming sensor data, enabling low-latency online segmentation suitable for real-time activity recognition. Similarly, SEP (Separation Change Point Detection) [15] estimates density ratios between adjacent temporal windows and detects change points from peaks in the resulting change scores. These methods are computationally efficient and suitable for online applications but are often sensitive to noise and require careful threshold selection.
More recent studies have incorporated machine learning techniques to improve change-point detection. Autoencoder-based CPD [16] learns time-invariant latent representations of time-series data and detects activity transitions by measuring differences between consecutive latent features. Although this approach can capture complex nonlinear temporal patterns, it requires model training and incurs relatively high computational cost. Adaptive Change-Point Detection [17] further combines short-time Fourier transform (STFT) features with kernel-based change-point detection and PELT optimization to improve segmentation accuracy. However, the reliance on future observations limits its applicability to real-time systems.
To address online activity recognition, OCPD (Online Change Point Detection) [18] introduces a hypothesis-and-verification framework, in which candidate change points are first generated and subsequently verified using a small amount of future data. This verification mechanism effectively reduces false detections but inevitably introduces detection latency. Another line of research investigates adaptive segmentation strategies based on event relationships rather than continuous sensor values. For example, sensor event correlation and temporal correlation have been employed to dynamically determine activity boundaries in smart-home environments, allowing segmentation windows to adapt to incoming events instead of using predefined window lengths [19]. While effective for event-driven sensor networks, these methods are not directly applicable to continuous wearable sensor signals such as IMUs or plantar-pressure sensors.
Spectral-analysis-based methods have also been investigated for activity segmentation by exploiting changes in the frequency characteristics of sensor signals. Unlike statistical approaches that focus on distributional changes or learning-based approaches that require model training, spectral methods detect activity transitions by analyzing variations in signal frequency components. Among these methods, the Spectral Transition Measure (STM) identifies activity boundaries by measuring temporal changes in the spectral characteristics of consecutive signal windows. Due to its computational efficiency and capability for online processing, STM has been widely adopted as a representative baseline for wearable sensor-based activity segmentation. Since STM is employed as the primary comparison method in this study, its principle and implementation are described in detail in the following subsection.
Overall, existing segmentation methods mainly rely on statistical changes, learned feature representations, spectral characteristics, or event correlations to detect activity transitions. Although these approaches have demonstrated promising performance, they generally do not exploit biomechanical characteristics of human movement. Consequently, their segmentation accuracy may degrade for continuous locomotion activities, where changes in gait patterns provide more direct and reliable cues for identifying activity boundaries.
2.2.2. Spectral Transition Measure-Based Segmentation
Among spectral-analysis-based segmentation approaches, the Spectral Transition Measure (STM) has been widely used for detecting transition points in time-series signals. The underlying assumption of STM is that activity transitions are accompanied by changes in the frequency characteristics of sensor signals, which can be detected through spectral analysis.
STM was originally proposed for speech segmentation [20,21], where it was used to quantify temporal variations in spectral features. Murao et al. [3] introduced STM into human activity recognition by applying it to acceleration data for automatic activity segmentation. Their results showed that STM values remain relatively low during periods of consistent activity, while significant increases occur around activity transition points, enabling automatic detection of segment boundaries.
In this study, STM is adopted as a baseline segmentation method for acceleration data. Its performance is compared with the proposed foot-pressure-based method to investigate the complementary characteristics of acceleration-based and biomechanical-signal-based segmentation approaches.
The STM value at time t is computed as:
Here, p is the number of cepstral coefficients, and represents the temporal change of the ith coefficient, computed as:
Here, denotes the i-th cepstral coefficient at time t, obtained from the log spectrum of the signal. M represents the window size used to compute temporal derivatives, and p is the number of cepstral coefficients retained, typically the lower-order coefficients.
3. Proposed Method
This section describes the proposed framework for activity segmentation and recognition. First, activity boundaries are detected using the proposed segmentation framework. The resulting activity segments are then processed by the activity recognition module to predict activity labels.
Conventional segmentation methods based on acceleration data, such as STM, are often affected by sensor placement, as acceleration signals are sensitive to body position and orientation. These methods may also fail to detect subtle or slow lower-body movements, and their performance tends to degrade in non-periodic or complex activities where acceleration features are ambiguous. In contrast, foot pressure sensors provide stable, position-insensitive measurements that directly reflect foot–ground interaction and gait phases. Motivated by this, we propose a segmentation approach based on foot pressure data.
3.1. Automatic Activity Segmentation
We propose an automatic segmentation method that leverages the cyclical nature of foot–ground contact to divide continuous data into meaningful activity units. The process consists of three stages, illustrated in Figure 1.
Figure 1.
Three-step procedure of the proposed method for detecting activity change points.
- Step 1: Peak and Valley Detection
In the FP segmentation method used in this study, the pressure signals from the right forefoot and heel sensors are directly summed at each time point to obtain a single composite foot-pressure signal. Local peaks are then identified from the normalized composite foot-pressure signal using the scipy.signal.find_peaks function. A prominence threshold of 0.12, determined empirically based on preliminary experiments, is used to suppress minor fluctuations.
For each pair of adjacent peaks, the corresponding local minimum is extracted as a valley point. These valley points are used as initial candidate segmentation points, representing potential transitions between consecutive motion cycles.
- Step 2: Refinement
During walking and stair-related activities, we observed the presence of abrupt downward fluctuations between adjacent valleys (Figure 1). These fluctuations are primarily caused by transient pressure changes during heel-to-forefoot transitions.
Since the objective is to detect stable foot–ground contact events rather than short transient spikes, we refine the detected valleys by evaluating the local slope around each candidate point. Specifically, the slope is computed between each valley and the points located six samples before and after it. If both slopes exceed a predefined threshold (0.002), the point is regarded as a transient spike and removed.
In addition, to further suppress false detections near peak regions, we remove valley points that do not satisfy a local minimum condition; i.e., both neighboring points must have higher values than the current valley. After these refinement steps, a more robust set of contact points is obtained.
- Step 3: Similarity-Based Merging
To determine whether two adjacent segments and should be merged, we compute the Sliding Normalized Cross-Correlation (SNCC):
where x is the shorter segment and y is the longer segment. Both signals are mean-centered before computing cosine similarity over sliding windows of equal length.
The merging procedure is defined as follows:
- Compute SNCC between each pair of adjacent segments and .
- If SNCC , the two segments are considered similar and are merged.
- Otherwise, the boundary between segments is preserved.
The threshold is empirically set to 0.75 to balance over-segmentation and under-segmentation, ensuring that each segment maintains consistent activity characteristics.
3.2. Label Correction
After the automatic segmentation step, the data is further divided into overlapping windows for feature extraction using a sliding-window of size 100 samples and a step size of 1 sample.
As illustrated in Figure 2, the top panel shows the conventional sliding-window approach, which applies fixed-length windows across the entire time series without considering activity boundaries. In this case, some windows span multiple activities, resulting in mixed labels and inconsistent feature representations that may degrade recognition performance. In the figure, these problematic windows are highlighted in red.
Figure 2.
Comparison of label assignment using conventional sliding-window method (top) and the proposed segmentation method (bottom).
In contrast, the bottom panel of Figure 2 illustrates the proposed segmentation-aware approach. The red dashed lines indicate segmentation points, and sliding windows are restricted within each segment. This ensures that each window contains data from a single activity, leading to more coherent feature extraction and improved classification performance.
Although the step size is set to 1 sample, ensuring dense window coverage over the entire sequence, a label alignment issue occurs at the beginning of each segmented region due to the window initialization process. Specifically, the first valid sliding-window within each segment requires 100 samples of context, and therefore the first 99 samples of the segment do not directly correspond to a fully defined window position.
To resolve this, we assign the predicted label of the first valid window to all preceding samples within the same segment. In other words, the label of the first window is propagated backward to fill the initial 99 samples, ensuring temporal label consistency across the entire segment.
The label of the first complete window was propagated backward to the preceding 99 samples to assign labels to the initial samples. Since this procedure uses samples from a subsequent window, it is non-causal and requires future data. Therefore, the proposed pipeline is designed for offline processing rather than real-time operation.
Finally, to evaluate segmentation effectiveness, we compare the reconstructed predicted labels with the ground-truth at known activity boundaries. A correct segmentation is indicated when predicted labels change consistently at true activity transition points. By reducing cross-activity contamination within windows and improving temporal alignment with activity boundaries, the proposed segmentation-aware strategy enhances overall recognition robustness.
3.3. Activity Recognition
After activity segmentation, each resulting segment is processed by the activity recognition module. Feature vectors are extracted from each segment and used as the input of a machine learning classifier to predict the activity label. To improve the robustness of activity recognition, the proposed framework incorporates multiple segmentation strategies based on foot-pressure information and its combination with the conventional STM-based method. Depending on the selected strategy, different sets of activity segments are generated and subsequently processed by the same feature extraction and classification pipeline. The segmentation strategies included in the proposed framework are described as follows:
- 1.
- FP: Segments are generated using the proposed foot-pressure-based method of segmentation.
- 2.
- STM+FP: Segments are generated using the union of all segmentation points independently detected by the STM-based method and the proposed FP-based method.
- 3.
- Both: Segments are generated using only Both points. A Both point is defined as the midpoint between a pair of segmentation points detected by the STM-based method and the proposed FP-based method, provided that the distance between the two detected points is no greater than 100 samples. Pairs satisfying this condition are regarded as detecting the same activity transition.
- 4.
- STM-only: Segments are generated using segmentation points detected exclusively by the STM-based method.
- 5.
- FP-only: Segments are generated using segmentation points detected exclusively by the proposed FP-based method.
- 6.
- STM-only+FP-only: Segments are generated by combining segmentation points uniquely detected by STM and FP.
- 7.
- STM-only+FP-only+Both: Segments are generated using STM-only points, FP-only points, and Both points. A Both point is defined as the midpoint between a pair of corresponding segmentation points detected by both the STM-based method and the proposed FP-based method. Consequently, each Both point replaces two nearby segmentation points in the STM+FP setting, resulting in fewer total segmentation points.
- 8.
- Adaptive:Training Phase (Construction of the Adaptive Segmentation Table): The Adaptive strategy is evaluated using Leave-One-Participant-Out (LOPO) cross-validation. In each fold, all data from one participant are excluded from the training data and reserved for testing, while the data from the remaining participants are used to construct the Adaptive Segmentation Table.For each activity, the seven segmentation methods described above, together with the STM method adopted from previous research, are applied to the training data, resulting in eight existing segmentation methods in total. Candidate segmentation points are obtained using each method and compared with the ground-truth segmentation points, and the F1-score is calculated for each method. The method achieving the highest F1-score for each activity is selected as the best-performing method for that activity. Based on these results, an Adaptive Segmentation Table is constructed for each LOPO fold.Testing Phase (Adaptive Segmentation): For the excluded participant, a fixed-length sliding-window-based activity recognition model (SW) is first applied to estimate the activity labels. Activity transitions are then estimated from changes in the predicted activity labels. For each predicted activity, the corresponding segmentation method is selected from the Adaptive Segmentation Table constructed using the training participants. The selected segmentation method is then applied to the corresponding data to obtain the final segmentation points.The sensor data are subsequently divided into activity intervals based on the obtained segmentation points, and the resulting segments are used for the final activity recognition evaluation.
Regardless of the segmentation strategy, all generated segments are processed using the same feature extraction and activity recognition pipeline. The implementation details of feature extraction, classifier configuration, and evaluation settings are presented in Section 4.
4. Evaluation Experiment
4.1. Participants
The participants’ demographic information is summarized as follows. The study included ten participants (nine males and one female). Nine participants were in their 20 s, and one was in their 30 s. The participants had an average height of , an average weight of , and an average BMI of .
4.2. Sensor Configuration
As shown in Figure 3, five nine-axis IMU sensors (TSND151, ATR-Promotion [22], Japan) were used to collect motion data. Sensors were attached to both wrists, both ankles, and the lower abdomen using elastic bandages to reduce motion artifacts. Among the available sensor modalities, only tri-axial acceleration and tri-axial angular velocity were used in this study.
Figure 3.
System configuration and sensor position.
In addition, four pressure sensors (Model A201, FlexiForce, Tekscan, Inc., South Norwood, MA, USA [23]) were attached to the forefoot and heel of each foot, following the design of Ohnishi et al. [10]. Each sensor has an active area of approximately 0.72 cm2 and can measure forces up to 440 N, covering about 0.8% of the foot surface. Before each data collection session, the zero point of each foot-pressure sensor was checked under an unloaded condition, and zero-point correction was performed when necessary. No correction based on the participant’s body weight or additional compensation for sensor drift was applied.
IMU data were transmitted via Bluetooth, and pressure sensor data were sent through cables connected to the ankle-mounted IMUs. Both data streams were synchronized and recorded using Altima software, Version 3.0.0 [24]. A webcam connected to the PC simultaneously recorded video, which was synchronized with the sensor data to enable manual annotation of activity boundaries.
This experiment was conducted with the approval of the Research Ethics Review Committee for Human Research Directly Involving the Graduate School of Engineering, Kobe University (approval number 06–27).
4.3. Parameter Settings
Since human daily activities are usually lower than 20 Hz, the Nyquist frequency sampling definition allows recording data of daily activities as long as the frequency is 40 Hz or higher. Therefore, the sampling frequency of the sensor is set to 100 Hz in this study. In addition, since the range of acceleration in human daily activities usually does not exceed ±4 G, the range of acceleration is set to ±8 G in this study.
4.4. Experimental Protocol
Existing wearable activity recognition datasets feature different types of activities depending on their research objectives. Datasets that combine inertial sensors and plantar-pressure sensors mainly focus on gait analysis and rehabilitation. Typical activities include standing, sitting, walking, running, turning, sit-to-stand transitions, and Timed Up and Go (TUG), and are widely used for gait assessment, elderly monitoring, and Parkinson’s disease studies [25,26,27]. Consequently, these datasets emphasize locomotion-related movements and provide limited activity diversity.
Public datasets based solely on IMU sensors generally cover a broader range of daily activities. Typical activities include standing, sitting, lying, walking, jogging or running, ascending and descending stairs, cycling, vacuum cleaning, ironing, rope jumping, and various transportation modes such as traveling by car, bus, train, or subway [28,29,30]. These datasets are primarily designed to evaluate activity recognition algorithms rather than activity segmentation, and therefore usually contain relatively long periods of individual activities.
In contrast, activity segmentation studies commonly construct continuous activity sequences that contain frequent transitions between different activities. Representative datasets include household activities such as cooking, eating, washing dishes, bathing, working, relaxing, sleeping, entering or leaving home, and bed-to-toilet transitions [19,31]. These datasets are intended to evaluate the accuracy of detecting activity boundaries under realistic daily living conditions.
Based on these observations, the dataset used in this study was designed to include both locomotion activities and daily living activities. The selected 16 activities cover representative movements commonly adopted in gait analysis datasets, IMU-based HAR datasets, and activity segmentation studies, while intentionally incorporating frequent transitions between different activity types. The selected 16 activities are summarized in Table 1. This design enables comprehensive evaluation of both segmentation performance and subsequent activity recognition.
Table 1.
Collection of 16 activities.
The participants were divided into two groups of five participants. One group performed the 16 daily activities in Sequence 1 (original order), while the other group performed the same activities in Sequence 2 (reversed order). Each participant completed the assigned sequence twice, resulting in a total of 20 datasets.
Sequence 1 (original order): Participants began by sitting quietly on a chair for one minute, then stood up to pick up two four-kilogram objects and held them while standing still for another minute. They walked around the room carrying the objects for one minute, set them down, squatted for one minute, and stood still again for one minute. Next, they cleaned the room with a vacuum cleaner for one minute, ran on a treadmill at eight km/h for one minute, and cycled on a stationary bike (resistance level five) for one minute. Afterward, they jumped and threw a ball upward with both hands ten times, kicked a ball with the dominant foot ten times, and lay flat on a mattress for one minute. Finally, they opened the door, exited the room, descended two floors, walked about 30 m, returned via the same route, and sat back on the chair—opening four doors on each round trip.
Sequence 2 (reversed order): Participants began by exiting the room, walking through a hallway and stairs (opening four doors each way), then performed kicking ball and throwing ball tasks (ten times each). This was followed by one-minute sessions of cycling, running, lying down, and vacuuming. Participants then held two objects while standing, walked while carrying them, squatted, stood still, and finally sat quietly on a chair.
To provide a detailed view of the dynamic variations within the reversed paradigm, the chronological sequence of activities and their micro-transitions is summarized in Table 2.
Table 2.
Compact Motion Transition Tables with Core Transitions.
As illustrated in Table 2, the protocol follows a “stable-to-stable” transition paradigm, in which each primary dynamic activity is preceded and followed by a stable state (e.g., standing still, sitting, or lying flat). This design isolates activity transitions, including postural adjustments (dismounting, bending, or squatting), gait initiation, and task-switching behaviors, while minimizing temporal overlap between consecutive dynamic activities. It therefore provides well-defined activity boundaries for evaluating segmentation methods based on foot pressure signals.
Definition of the Transition class: The “Transition” class and the transition boundaries used for segmentation represent two distinct concepts in this study. The “Transition” class is one of the 16 activity classes defined in Table 2 and represents the transitional movement performed while a participant moves from one activity to another. Thus, the “Transition” class corresponds to a temporal interval during which the transitional movement occurs, rather than to a single boundary point. During manual annotation, the interval in which the transitional movement occurred was assigned the “Transition” label. In contrast, the starting point of the “Transition” interval, corresponding to the change from the preceding activity to the transitional movement, was treated as a segmentation boundary and used for segmentation and segmentation-performance evaluation. The end point of the “Transition” interval was not treated as a segmentation boundary. Therefore, the “Transition” activity class and the segmentation boundary represent different concepts in the annotation and evaluation procedures.
Procedure details: In the throwing and kicking tasks, the ball was retrieved and returned to the participants by assistants. During door-opening actions, participants used their naturally preferred hand. For the cycling task, no restrictions were imposed on pedaling speed, but the resistance level was fixed across all trials.
4.5. Preprocessing
Figure 4 shows a portion of the synchronized sensor data from Sequence 1 described in Section 4.4. The figure shows the complete sensor data collected during the experiment. Sequence 2 consists of the same set of activities as Sequence 1, performed in reverse order. The five IMU sensors were worn so that their X axes were oriented vertically upward, and each sensor was placed in a consistent orientation and position across all participants. Background colors are used to visually distinguish different activity segments. Note that similar colors do not imply identical activity labels; the color scheme is intended for visual clarity only.
Figure 4.
Sensor data collected from seven body locations during Sequence 1.
4.6. Data Segmentation Setup
In this study, we implemented the STM-based segmentation method using a window size of 200 samples, a step size of 1 sample, and a 256-point FFT. Since the sensor sampling rate was 100 Hz, the STM value was recalculated every sample, corresponding to a temporal resolution of 0.01 s. The peak detection threshold for STM was set to the mean plus 0.5 times the standard deviation of the STM values.
In the method proposed by Murao et al. [3], STM values were computed separately for each acceleration axis and analyzed independently. In contrast, to reduce computational complexity, we calculated STM using the average resultant acceleration obtained from the five IMU sensors.
The ground-truth segmentation points were manually annotated by three experienced annotators who routinely process sensor data. Each annotator independently labeled the activity transition points, and the final ground-truth boundary for each transition was determined by averaging the annotated time points across the three annotators. To quantify the temporal agreement among the annotations, the absolute temporal difference between each annotator’s boundary timestamp and the averaged ground-truth timestamp was calculated. Across all valid activity boundaries in the 20 datasets, the mean absolute temporal difference was 0.47 ± 0.56 s (MAE ± SD), with a median of 0.33 s.
To evaluate segmentation performance, a detected segmentation point was regarded as a candidate match if it was located within samples (2.5 s) of a manually annotated ground-truth boundary. The correspondence between detected segmentation points and ground-truth boundaries was determined based on temporal distance. For each ground-truth boundary, the closest detected segmentation point within the matching range was selected as the matched point. Two evaluation criteria were considered to examine the effect of the matching strategy on segmentation performance. The primary evaluation used a grouping-based criterion, in which multiple detected points located within the matching range of the same ground-truth boundary were regarded as detections of the same activity transition. After the closest detected point was selected as the matched point, additional detected points within the matching range of the same ground-truth boundary were treated as redundant detections and were not counted as false positives. This criterion is consistent with the boundary-merging process used in the proposed segmentation strategies, where multiple methods may detect the same activity transition at slightly different temporal positions.
Under the grouping-based criterion, true positives (TP) were defined as the number of correctly matched ground-truth boundaries, with each ground-truth boundary counted at most once. False negatives (FN) were defined as the number of ground-truth boundaries without any corresponding detected segmentation point.
False positive candidates were defined as detected segmentation points that were not matched to any ground-truth boundary. To avoid overestimating false positives caused by temporally adjacent erroneous detections, FP grouping was applied to these unmatched points. The FP candidates were first sorted according to their temporal positions. The first FP candidate was used as the representative point (anchor) of the first FP group. For each subsequent FP candidate, the distance from the anchor point of the current group was calculated. If the distance was within 250 samples, the candidate was assigned to the current FP group; otherwise, a new FP group was created, and the candidate became the anchor point of the new group. Finally, each FP group was counted as a single false positive.
In addition to the primary grouping-based evaluation, a strict one-to-one matching criterion was also used. Under this criterion, each ground-truth boundary could be matched to at most one detected segmentation point. The closest detected point within the matching range was selected as the matched point, and any additional detected points within the matching range that were not selected as the matched point were counted individually as false positives. Thus, unlike the grouping-based criterion, additional detected points associated with the same ground-truth boundary were not treated as redundant detections. This stricter criterion was used to assess the effect of allowing multiple detected points around the same ground-truth boundary on Precision.
For both evaluation criteria, Precision, recall, and F1-score were calculated based on TP, FP, and FN as follows:
4.7. Activity Recognition Setup
To evaluate the effectiveness of the proposed segmentation framework, activity recognition experiments were conducted using the segmentation strategies described in Section 3.3. For comparison, a sliding-window baseline and the conventional STM-based segmentation method were also included.
After segmentation, all resulting segments, as well as the raw sequence in the baseline method, were further divided into overlapping windows of 100 samples, corresponding to approximately 1 s, with a step size of 1 sample. One of the objectives of this study is to analyze the behavior of segmentation methods around ground-truth activity boundaries at a fine temporal scale. Therefore, the 1-sample step size was selected to preserve the temporal resolution of the original sensor data. Since the sensor sampling rate was 100 Hz, this configuration allows activity labels to be estimated at the same temporal resolution of 0.01 s as the original sensor data and enables fine-grained examination of segmentation behavior around activity boundaries. The 1-sample step size was therefore selected for detailed offline analysis rather than for minimizing computational cost or improving recognition performance.
The 1-sample step results in a 99% overlap between consecutive windows and consequently introduces substantial temporal correlation and computational redundancy. To avoid data leakage caused by such overlapping windows, the training and test data were separated at the participant level for the cross-participant evaluation and at the experimental-session level for the within-participant evaluation, rather than randomly splitting individual windows. Therefore, highly overlapping windows from the same participant or experimental session were not directly shared between the training and test sets. Nevertheless, the high temporal correlation among consecutive windows within the same experimental session remains an inherent characteristic of the window-based evaluation.
From each window, we extracted six time-domain features: maximum, minimum, mean, standard deviation, root mean square, and absolute mean rate of change. Windows shorter than the defined size were also included to ensure full data utilization.
Feature extraction was performed using signals from five IMUs (each providing three-axis acceleration and angular velocity) and foot pressure sensors located at the forefoot and heel of both feet, resulting in a 204-dimensional feature vector per window. All features were normalized using Min–Max scaling for consistency.
For classification, we employed a Random Forest model. The Random Forest classifier was configured with 500 trees, no maximum depth constraint, and the remaining hyperparameters were set to the default values of scikit-learn version 1.6.1. The random seed was fixed at 2019 for reproducibility.
Precision, Recall, and F1-score were calculated using macro averaging across all activity classes. Specifically, average=’macro’ was used for all three metrics, such that each activity class contributed equally to the final score.
Two evaluation protocols were adopted. For within-participant evaluation, data collected from the same participant in one recording session were used for training, while data collected from the other session were used for testing. The roles of the two sessions were then reversed, and the results from both directions were averaged. This protocol evaluates the robustness of the model to temporal variations within the same participant. Due to incomplete recordings from four participants, an additional within-participant evaluation using the remaining six participants was conducted. The results obtained from the remaining six participants were also calculated and reported separately.
For cross-participant evaluation, we adopted a leave-one-participant-out cross-validation scheme, where models were trained on manually segmented data from nine participants and tested on the remaining participant. The trained models were then evaluated using test data segmented by the STM-based method, the unsegmented baseline, and all proposed segmentation methods described in Section 3.3.
For both within-participant and cross-participant evaluations, the recognition models were trained using manually segmented data. In the test phase, the models were evaluated using data processed by the corresponding segmentation strategy, including the unsegmented sliding-window baseline and the proposed automatic segmentation methods. Thus, the training data provide cleanly annotated samples, whereas the test data reflect the actual segmentation conditions being evaluated. This design enables the effect of segmentation quality on subsequent activity recognition performance to be examined directly.
However, using manually segmented data for training and automatically segmented data for testing may introduce a domain mismatch between the training and test data. In particular, segmentation errors in the test data may alter the feature distributions of the resulting windows relative to those of the manually segmented training data, potentially affecting recognition performance. This potential domain mismatch should therefore be considered when interpreting the activity recognition results.
To mitigate class imbalance in the training set, we applied the Synthetic Minority Over-sampling Technique (SMOTE) for underrepresented activities [32], and randomly downsampled overrepresented classes (e.g., walking) to 200 instances per class. This ensured a balanced and representative dataset for training.
This experimental procedure allows for a fair comparison of the segmentation strategies and demonstrates the effectiveness of the proposed pressure-based method in improving recognition performance, especially around activity transitions.
5. Results and Discussion
5.1. Segmentation Results
As shown in Table 3, the FP-based and STM-based methods exhibited different boundary detection characteristics. Across 20 datasets with 1950 manually labeled segmentation points, the STM-based method detected 2272 segmentation points, whereas the FP-based method detected 1518 points. To ensure a fair comparison, both methods were applied to the same data sequences. Figure 5 illustrates their segmentation results: blue curves represent the input signals (average IMU acceleration for STM and combined foot pressure for FP), green lines indicate ground-truth boundaries, and red dashed lines show automatically detected segmentation points. The boundary detection characteristics of the two methods were further examined in terms of precision and recall. STM achieved a Precision of 0.737 and a Recall of 0.773, whereas FP achieved a higher Precision of 0.820 but a lower Recall of 0.527. Thus, FP detected fewer boundaries overall, but the detected boundaries were more likely to correspond to ground-truth boundaries. In contrast, STM detected a larger proportion of the ground-truth boundaries, but with lower precision. The complementary characteristics of the two methods were also observed when their detected boundaries were combined. When the detection points from STM and FP were combined in the STM+FP condition, the Recall increased to 0.915. In contrast, when only boundaries detected sufficiently closely by both methods were considered in the Both condition, the Precision increased to 0.886. These results indicate that STM and FP provide different boundary detection characteristics rather than exhibiting a simple superiority relationship. In particular, FP provides relatively precise boundary information but misses a larger proportion of activity boundaries, whereas STM provides broader boundary coverage. The combination of the two methods can therefore increase boundary coverage, while their agreement can provide highly precise boundary detections.
Table 3.
Comparison of Segmentation Performance Using Grouped Detected Points.
Figure 5.
Comparison of manual segmentation points and segmentation points obtained by the eight automatic segmentation methods.
Both methods successfully avoided generating excessive segmentation points during stationary periods, indicating robustness under low-activity conditions. However, their segmentation behaviors differed depending on the characteristics of the activities. The STM-based method exhibited higher sensitivity to short-duration dynamic activities such as jumping and kicking the ball, resulting in a larger number of detected segmentation points. This behavior enables STM to capture rapid motion transitions effectively, but may also introduce redundant segmentation points caused by local acceleration fluctuations. In contrast, the FP-based method generated fewer segmentation points and achieved higher precision (0.820) than STM (0.737). This indicates that foot-pressure signals provide more stable and reliable information for identifying activity boundaries, particularly when transitions are accompanied by changes in foot-contact patterns.
For continuous activities such as walking, running, and ascending/descending stairs, the FP-based method produced more temporally consistent segmentation results. These activities contain repetitive and stable lower-limb motion patterns, which are effectively captured by foot-pressure variations. Meanwhile, the STM-based method occasionally detected additional boundaries within continuous motions due to instantaneous acceleration changes.
When combining both modalities, the STM+FP configuration achieved the highest recall (0.915) and the highest F1-score (0.808), demonstrating that integrating complementary transition information improves the completeness of segmentation. In contrast, the “Both” condition achieved the highest precision (0.886) but relatively low recall (0.339). Since this method only retains segmentation points detected by both STM and FP, it represents a conservative strategy that prioritizes boundary reliability over detection coverage.
Overall, these results indicate that the evaluated segmentation methods do not simply differ in performance level, but provide different characteristics in terms of boundary detection confidence. The FP-based method tends to generate conservative segmentation boundaries with higher precision, where detected transitions are strongly supported by changes in foot-pressure patterns. The STM-based method provides higher sensitivity to transient and global motion changes, enabling the detection of a wider range of potential transitions. The “Both” condition represents boundaries with strong agreement between heterogeneous sensor modalities and therefore provides highly reliable but selective segmentation points. Meanwhile, the STM+FP configuration improves transition coverage by combining complementary information from both methods.
The Adaptive strategy did not achieve the highest overall segmentation F1-score. This result can be attributed to the transition-dependent nature of the Adaptive strategy. Unlike a fixed strategy such as STM+FP, which consistently combines candidate points from both modalities and achieves high recall (0.915), the Adaptive strategy selects different segmentation methods based on the activity-specific F1-scores obtained from the training participants. Consequently, it does not always use the method that provides the highest overall segmentation performance.
Furthermore, because the Adaptive Segmentation Table is constructed from the training participants, the method that performs best for a given activity in the training data may not always be optimal for the excluded participant. This participant-dependent variation may further limit the overall segmentation performance of the Adaptive strategy. Therefore, the lower overall F1-score of the Adaptive strategy does not necessarily indicate that adaptive selection is ineffective, but rather reflects the trade-off between activity-specific method selection and the generalization of the selected segmentation methods across participants.
To further assess the robustness of the segmentation evaluation, we compared the results obtained using the grouping-based and strict one-to-one matching criteria. The results of the strict one-to-one matching evaluation are shown in Table 4. Compared with the grouping-based evaluation, strict one-to-one matching resulted in lower Precision across the segmentation methods due to the increased number of false positives. For example, the Precision of STM decreased from 0.737 to 0.664, while that of FP decreased from 0.820 to 0.677. Similar reductions were observed for the other segmentation methods.
Table 4.
Comparison of Segmentation Performance Using Strict One-to-One Matching.
Despite the stricter treatment of multiple detections, the overall performance tendency among the segmentation methods remained similar. STM continued to show relatively high recall, whereas FP maintained a relatively conservative detection behavior. The combination of STM and FP also continued to provide high recall, demonstrating the benefit of integrating complementary transition cues. These results indicate that although the grouping criterion can result in higher Precision than strict one-to-one matching, the choice of matching criterion does not substantially change the overall characteristics of the evaluated segmentation strategies.
The strict one-to-one matching results therefore provide an additional, more conservative evaluation of segmentation performance, while the grouping-based evaluation remains the primary criterion in this study. This is because the proposed segmentation strategies combine multiple candidate segmentation methods, and multiple closely located detected points may correspond to the same underlying activity transition. Moreover, the proposed framework prioritizes avoiding missed activity transitions, particularly short-duration or instantaneous transitions. Therefore, grouping nearby detected points while allowing potentially redundant detections to remain is consistent with the objective and the actual boundary-merging process of the proposed segmentation strategies.
These findings suggest that FP and STM should not be considered competing segmentation approaches; rather, they provide complementary information for detecting activity transitions. The different characteristics of these methods indicate that combining their segmentation cues or selecting an appropriate strategy according to activity characteristics may provide a better balance between boundary precision and transition coverage.
In addition to the overall segmentation performance, we further analyzed the best-performing segmentation method for each activity based on the activity labels obtained from the SW-based recognition results, as shown in Table 5. For each activity, the method achieving the highest F1-score was selected as the best-performing method. When multiple methods achieved the same F1-score, the corresponding methods were retained as tied best-performing methods. This activity-dependent method selection was used to construct the Adaptive Segmentation Table, which represents the practical setting in which activity labels are automatically inferred rather than manually provided.
Table 5.
Segmentation Method with the Best Performance for Each Activity Based on SW Labels.
The results demonstrate clear activity-dependent characteristics in segmentation performance. For activities such as CY (Cycling), DN (Downstairs), JT (jumping and throwing a ball), OD (opening a door), TR (Transition), UP (Upstairs), and WK (Walking), the STM-based method was consistently selected as the best-performing method. This suggests that acceleration-based information is effective for detecting activity transitions involving global body motion and postural changes.
In contrast, WC (walking while carrying heavy objects) was best segmented using the FP-only configuration. This suggests that foot-pressure information can provide useful transition cues when lower-limb and foot–ground interactions play an important role in the activity. For CF (Cleaning the Floor with a Vacuum), the Both condition was selected as the best-performing method, indicating that agreement between the two modalities can provide effective boundary information for this activity.
Several activities with more complex or ambiguous motion patterns, including KB (kicking a ball), LY (Lying), RN (Running), SD (Standing), SH (standing while holding heavy objects), SQ (Squatting), and ST (Standing), were associated with combined segmentation strategies or showed ties between individual and combined methods. In particular, the STM-only+FP-only+Both configuration was selected for several activities, suggesting that retaining complementary segmentation points from both modalities can be advantageous when activity transitions involve multiple types of motion cues.
Overall, these results indicate that no single segmentation method consistently provides the best performance across all activities. Instead, the most suitable segmentation strategy varies according to the characteristics of the activity transition. Therefore, the activity-dependent selection of segmentation methods provides a basis for the proposed adaptive framework, rather than relying on a single fixed segmentation method.
To further examine the effect of activity-label accuracy on this method selection, we additionally performed the same activity-wise analysis using the ground-truth activity labels. The results are presented in Table 6. In contrast to Table 5, which is based on automatically inferred activity labels and represents the practical implementation of the Adaptive Segmentation Table, the ground-truth-based analysis represents a reference condition in which the activity labels are assumed to be correct.
Table 6.
Best-Performing Segmentation Method for Each Activity Based on Ground-Truth Labels.
The comparison between the two tables shows that the selected segmentation methods are consistent for several activities, including CY, JT, OD, UP, and WK, for which STM was selected under both conditions. FP was also selected for WC under both conditions. These consistent selections suggest that the activity-dependent characteristics of segmentation performance can remain stable even when the activity labels are obtained automatically.
However, differences in the selected methods were observed for several other activities. For example, CF was associated with FP and Both under the ground-truth-based analysis, whereas Both was selected when using SW-based labels. Differences were also observed for DN, KB, RN, SH, SQ, ST, and TR. These differences indicate that errors in automatically inferred activity labels can affect the selection of the segmentation method for a given activity.
Nevertheless, the comparison provides evidence that the practical Adaptive Segmentation Table does not necessarily require perfect activity labels to identify useful activity-dependent segmentation strategies. The consistency observed for several activities suggests that the method-selection characteristics are partly preserved when using automatically inferred labels, while the differences highlight the potential influence of activity-recognition errors on adaptive method selection.
5.2. Activity Recognition Results
Table 7 and Table 8 present the activity recognition results for inter-participant and within-participant cross-validation, respectively. The within-participant results are reported for both all ten participants and the six participants remaining after excluding incomplete recordings. Precision, recall, and F1-score are macro-averaged across activity classes.
Table 7.
Comparison of Activity Recognition Performance in Inter-Participant Cross-Validation.
Table 8.
Comparison of Activity Recognition Performance in Within-Participant Cross-Validation.
In the inter-participant evaluation, the automatic segmentation methods generally achieved higher recognition performance than the sliding-window (SW) approach. Among the automatic segmentation methods, STM achieved the highest F1-score (0.820), followed by STM-only+FP-only (0.817), while STM+FP achieved an F1-score of 0.807. These results indicate that accurate segmentation does not necessarily lead directly to the highest activity recognition performance. In particular, although STM+FP achieved the highest recall in the segmentation evaluation, its recognition performance was lower than that of STM. This suggests that additional segmentation points, including those introduced by combining multiple segmentation cues, do not always improve the subsequent feature extraction and activity classification.
The adaptive strategies showed recognition performance comparable to the individual and combined segmentation methods. Adaptive(SW) achieved a precision of 0.836, recall of 0.825, and F1-score of 0.814, while Adaptive(GT), which uses the ground-truth activity labels to select the segmentation method, achieved 0.841, 0.830, and 0.819, respectively. The difference between Adaptive(SW) and Adaptive(GT) was only 0.005 for all three metrics. This indicates that errors in the initial SW-based activity prediction have only a limited effect on the final recognition performance of the Adaptive strategy. Furthermore, even when the true activity labels were provided, the recognition performance did not increase substantially. Therefore, the relatively lower performance of Adaptive(SW) compared with the best individual method cannot be explained solely by errors in the initial activity prediction or by incorrect method selection. Other factors, such as the segmentation characteristics of the selected methods and the effect of segmentation errors on subsequent feature extraction, may also contribute to the final recognition performance.
In the within-participant evaluation using all ten participants, the differences among the automatic segmentation methods were relatively small. Among the automatic segmentation methods, FP-only achieved the highest F1-score of 0.727, followed by STM-only (0.726), while STM achieved an F1-score of 0.724. The SW method also achieved an F1-score of 0.727, comparable to that of FP-only. These results indicate that segmentation-based feature extraction did not consistently outperform the fixed-window approach under this evaluation setting.
After excluding participants with incomplete recordings, overall recognition performance increased substantially for all methods. Among the automatic segmentation methods, FP-only achieved the highest F1-score of 0.832, followed by STM-only (0.830) and Both (0.829). The SW method achieved the highest F1-score overall at 0.834, slightly exceeding the automatic segmentation methods. These results indicate that the advantage of explicit activity segmentation is not consistent across evaluation settings, and that the relative performance of segmentation strategies depends on the participant characteristics and evaluation protocol.
One possible explanation for the slightly higher performance of SW in the within-participant evaluation is that the training and test data were collected from the same participant, although they corresponded to separate data collection sessions. Therefore, the recognition model may learn participant-specific motion characteristics that are shared across the two sessions. Such participant-specific characteristics may reduce the adverse effect of windows that cross activity boundaries. In addition, the SW method uses a 1-s window, and windows around activity boundaries may contain useful information from both adjacent activities, which can contribute to recognition performance. In contrast, automatic segmentation may introduce boundary localization errors, missed boundaries, or false boundaries, and these errors may offset the potential benefit of explicitly separating activity segments. Therefore, explicit segmentation does not necessarily provide an overall recognition performance advantage over SW in a within-participant setting.
To further examine whether the observed differences in F1-score among the automatic segmentation methods were statistically meaningful, participant-level statistical comparisons were conducted based on the inter-participant cross-validation results. Specifically, for each fold, one participant was held out as the test participant, and the F1-score obtained on the test participant was recorded for each automatic segmentation method. Thus, each method yielded one F1-score for each of the 10 participants. Manual (MAN) and Sliding Window (SW) were excluded from this analysis because the comparison focused on the automatic segmentation methods.
A Friedman test was first performed on the participant-level F1-scores to examine whether there was an overall difference among the automatic segmentation methods. The test yielded a Friedman statistic of 52.5791 with a p-value of , indicating a statistically significant overall difference among the methods. Pairwise comparisons were subsequently performed using the Wilcoxon signed-rank test with Holm correction for multiple comparisons. However, no pair of automatic segmentation methods showed a statistically significant difference after Holm correction (). These results indicate that, although differences were observed in the mean F1-scores across participants, none of the individual pairwise differences between automatic segmentation methods reached statistical significance after correction for multiple comparisons. Therefore, the observed performance differences among methods such as STM-only, FP-only, and Adaptive should not be interpreted as statistically significant superiority of one method over another, and may partly reflect participant-level variation or random variation in the evaluated dataset.
Figure 6 presents two representative examples selected from multiple activity transition points and shows the recognition results of the sliding-window, STM-based, and FP-based methods around activity transitions. In the figure, black points indicate ground-truth activity labels, green points represent correctly predicted labels, and red points represent misclassified predictions. The vertical dashed lines denote the ground-truth activity transition boundaries. As shown in Figure 6, the segmentation-based methods generally provide analysis segments that are better aligned with activity transitions than the sliding-window approach. Although some misclassifications remain near transition boundaries, the use of detected transition points can reduce the inclusion of multiple activities within a single segment, potentially improving feature consistency for subsequent activity recognition.
Figure 6.
Recognition results of activities at segmentation points by three different methods.
The quantitative results in Table 7 and Table 8 show that the benefit of explicit segmentation depends on the evaluation setting. All reported Precision, Recall, and F1-scores are macro-averaged across activity classes and calculated at the window level, where each window is treated as one recognition sample. In the inter-participant evaluation, all automatic segmentation methods achieved higher F1-scores than the SW method, with STM achieving the highest F1-score (0.820). In contrast, in the within-participant evaluations, the performance of segmentation-based methods was comparable to or slightly lower than that of the SW method. These results indicate that explicit segmentation does not necessarily improve activity recognition performance under all evaluation settings, although it provides a more explicit alignment between analysis segments and activity transitions.
The qualitative examples in Figure 6 particularly illustrate the potential benefit of accurate boundary detection for transitions between dynamic and static activities, such as jumping or throwing a ball followed by standing. In such cases, correctly identifying the activity transition can help avoid assigning samples from adjacent activities to the same analysis segment.
To quantitatively evaluate recognition behavior around activity transitions, we further computed recognition performance within and samples centered at each annotated boundary, as shown in Table 9 and Table 10. Compared with manual segmentation, all automatic segmentation methods exhibited lower recognition performance under both evaluation settings. However, the Adaptive(SW) method achieved the highest F1-score among the automatic methods in both evaluation regions, with an F1-score of 0.422 within samples and 0.501 within samples. This indicates that selecting segmentation methods according to the estimated activity labels can provide a performance advantage over using a single fixed segmentation method.
Table 9.
Activity recognition performance around segmentation points ( samples).
Table 10.
Activity recognition performance around segmentation points ( samples).
Within the -sample region, which focuses more directly on the immediate vicinity of activity boundaries, the F1-scores of most automatic methods were relatively similar, ranging from 0.383 to 0.419, while Adaptive(SW) achieved the highest F1-score of 0.422. Adaptive(GT), which uses the manually annotated activity labels to select the segmentation method, achieved a comparable F1-score of 0.418. The similar performance of Adaptive(SW) and Adaptive(GT) suggests that the automatically estimated labels obtained from the SW method can provide sufficiently useful information for selecting an appropriate segmentation method.
When the evaluation region was expanded to samples, recognition performance increased for all methods, including the manual segmentation condition. This increase is expected because the larger evaluation region contains a greater proportion of temporally stable activity samples in addition to the samples immediately surrounding the transition boundary. Among the automatic methods, Adaptive(SW) achieved the highest Precision (0.509), Recall (0.501), and F1-score (0.501), followed closely by Adaptive(GT) with an F1-score of 0.500. The other automatic methods achieved F1-scores between 0.483 and 0.498.
These results indicate that the adaptive segmentation framework can provide a modest improvement in activity recognition performance around segmentation boundaries compared with individual fixed segmentation methods. The similar results obtained by Adaptive(SW) and Adaptive(GT) further suggest that the proposed method can select effective segmentation strategies using activity labels estimated by the SW method, without requiring manually annotated labels during practical operation. Nevertheless, a considerable performance gap remains between manual and automatic segmentation, particularly around the immediate transition region. This indicates that improving the accuracy of automatically detected segmentation boundaries remains important for further improving activity recognition performance.
5.3. Effect of Foot-Pressure Features on Activity Recognition
To examine whether the improvement in activity recognition performance can be attributed simply to the addition of foot-pressure features, we conducted additional control experiments using IMU-only and IMU+FP feature sets. In these experiments, the segmentation method and the recognition procedure were kept identical, while only the input feature set of the activity recognition model was changed. For the IMU-only condition, only features extracted from the five IMU sensors were provided to the recognition model, whereas the IMU+FP condition additionally included features extracted from the foot-pressure sensors. The comparison was conducted for both STM-based and FP-based segmentation under the inter-participant and within-participant evaluation settings. Table 11 summarizes the F1-scores obtained under the two feature conditions. In the inter-participant evaluation, the F1-score for STM segmentation increased slightly from 0.814 with IMU-only features to 0.820 with IMU+FP features, corresponding to an increase of 0.006. In contrast, the F1-score for FP-based segmentation decreased from 0.803 to 0.789 when foot-pressure features were additionally provided to the recognition model. A similar tendency was observed in the within-participant evaluations. When all 10 participants were included, the F1-score decreased from 0.731 to 0.724 for STM segmentation and from 0.723 to 0.715 for FP-based segmentation. For the six participants with complete recordings, the F1-score decreased from 0.830 to 0.826 for STM segmentation and from 0.822 to 0.817 for FP-based segmentation. Thus, among the six paired comparisons between IMU-only and IMU+FP feature sets, only one showed an improvement when foot-pressure features were added, and the improvement was 0.006. The remaining five comparisons showed higher F1-scores with IMU-only features. These results indicate that adding foot-pressure features to the activity recognition model does not consistently improve activity recognition performance under the experimental conditions of this study.
Table 11.
Comparison of Activity Recognition Performance with and without Foot-Pressure Features.
5.4. Potential Applications
Although the proposed framework was evaluated using young healthy participants under controlled experimental conditions, it has potential applications in continuous activity monitoring scenarios in which wearable foot-pressure and inertial sensors are used to segment sequential activities. In particular, the framework may be applicable to exercise training and rehabilitation sessions consisting of a series of different activities.
For example, in a rehabilitation session, a sequence of activities such as standing, walking, stair ascent, and resting could potentially be divided into individual activity intervals based on detected activity boundaries. The duration of each activity and the corresponding sensor-derived features could then be analyzed retrospectively to characterize the temporal structure of a training session. Similarly, in sports training, continuous sessions involving activities such as running, cycling, and jumping could potentially be divided into activity-specific intervals, allowing sensor-derived characteristics of different exercises or training sessions to be analyzed and compared.
These examples represent potential applications rather than applications directly validated in the present study. The proposed framework should therefore be regarded as a proof-of-concept approach for activity segmentation in sequential exercise and rehabilitation scenarios, rather than as a clinically validated system or a solution established for unrestricted real-world conditions. Further validation with larger and more diverse participant populations, including older adults and individuals with different physical abilities, as well as unconstrained activity sequences, would be required before practical or clinical deployment.
5.5. Limitations
The proposed adaptive segmentation framework was evaluated using a predefined set of representative daily activities and activity transitions. Under this experimental setting, the results demonstrated the feasibility of selecting segmentation methods according to estimated activity transitions. Nevertheless, several limitations should be considered.
First, the evaluation was conducted using a limited set of activity types and predefined activity sequences. Although these activities included representative transition patterns, real-world activities are generally more diverse and less constrained, and may include unexpected or previously unseen transitions. Further evaluation using a broader range of activities and more natural activity sequences is therefore necessary.
Second, the Adaptive Segmentation Table (Table 5) was constructed based on the current dataset. The relationship between activity transitions and suitable segmentation methods may vary with different participant populations, activity sets, or sensor configurations. Although similar transition patterns may exhibit similar characteristics, the generalizability of the current Adaptive Segmentation Table has not yet been fully verified.
Third, the thresholds used in the FP-based segmentation method, including the SNCC threshold of 0.75, were empirically determined from preliminary experiments using the collected foot-pressure data. A systematic sensitivity analysis across different SNCC threshold values was not conducted because the current dataset was considered insufficient for reliable fine-grained parameter optimization. Therefore, the robustness of the segmentation performance to different SNCC threshold values remains to be investigated using larger and more diverse datasets.
Fourth, the STM implementation in this study differs from the original formulation proposed by Murao et al. [3]. While the original method computes STM values separately for each acceleration axis, our implementation calculates the resultant acceleration for each of the five IMU sensors and then averages these signals before applying STM. This modification was adopted to obtain a unified segmentation signal representing overall body movement from the multiple IMUs used in this study. Applying the original axis-wise formulation independently to all three acceleration axes of the five IMUs would produce multiple STM signals, requiring an additional fusion rule to determine a single set of activity boundaries. Such a fusion procedure is not directly specified for the multi-IMU configuration used in this study. However, averaging the resultant acceleration may attenuate localized or direction-specific movement changes, and the effect of this modification relative to the original axis-wise STM was not directly evaluated under the same experimental conditions. Therefore, the quantitative impact of this modification on the STM baseline cannot be isolated in the present study. A direct comparison between the original axis-wise and modified STM implementations, including an appropriate boundary-fusion strategy for the axis-wise outputs, is left for future work.
Fifth, the participant sample was relatively small and demographically imbalanced. The study included only 10 participants, of whom nine were male and one was female, and nine were in their 20 s. In addition, some within-participant evaluations were conducted using only six participants because of incomplete recordings. Therefore, the generalizability of the proposed framework to broader populations has not yet been established. In particular, the dataset did not include older adults or individuals with motor impairments, whose movement patterns and activity transitions may differ from those of the predominantly young participants in this study and may consequently affect both segmentation and activity recognition performance. Thus, the current results should not be generalized to broader or clinical populations without further validation. The present study should be regarded as a proof-of-concept evaluation rather than a validation in clinical or real-world populations.
Sixth, the piezoresistive foot-pressure sensors used in this study may exhibit output drift and load-dependent variations, which can affect the measured pressure signals. Before each data collection, the output of each sensor was confirmed to be zero under the unloaded condition, and zero-point correction was performed when necessary. In addition, the composite foot-pressure signal was normalized before peak detection to reduce sensitivity to the absolute signal magnitude. However, this normalization does not constitute body-weight calibration or compensation for the load-dependent response of the sensors. Therefore, residual drift and load-dependent effects may remain and could influence the detected activity boundaries.
Seventh, the label correction procedure described in Section 3.2 is non-causal and therefore currently limited to offline processing. For real-time applications, the backward label propagation could be replaced by a causal strategy using only current and past observations, such as delayed labeling or causal/incremental windowing. The resulting trade-offs among processing delay, boundary localization accuracy, and recognition performance should be evaluated in future work.
Finally, although foot-pressure information provides transition cues complementary to those obtained from IMU signals, adding pressure sensors increases sensor-attachment and hardware requirements. The current configuration uses five IMUs with six channels each (30 channels) and four pressure channels. Consequently, the recognition feature dimensionality increases from 180 to 204 dimensions, corresponding to an increase of approximately 13%. Although the additional pressure data introduce some computational overhead, the increase in feature dimensionality is relatively limited. More importantly, the pressure signals provide complementary information for detecting activity transition boundaries, which is the main motivation for incorporating them into the proposed segmentation framework. Nevertheless, increasing the amount of sensor data does not necessarily improve performance indefinitely, as additional channels may introduce redundancy, noise, or computational cost. Therefore, an appropriate balance between additional sensing information and system complexity should be considered when extending the sensor configuration.
Future work will address these limitations by evaluating more diverse activities, unconstrained activity sequences, and larger and more demographically diverse participant populations, including older adults and individuals with different levels of motor ability. In addition, systematic parameter analysis, more systematic calibration and drift-compensation methods for the foot-pressure sensors, and methods for automatically constructing or updating the Adaptive Segmentation Table using larger-scale datasets will be investigated.
6. Conclusions
This study proposed and systematically evaluated eight segmentation methods based on different combinations of the spectral transition measure (STM) algorithm and foot-pressure signals for wearable sensor-based activity recognition. In addition, an adaptive segmentation framework was introduced to select an appropriate segmentation method according to the estimated activity transition using an Adaptive Segmentation Table.
The experimental results demonstrated that the segmentation methods exhibited different characteristics depending on the type of activity transition. The STM-based method provided broader boundary coverage, whereas the foot-pressure-based method (FP) achieved higher boundary precision but lower recall. Combining the two methods increased boundary coverage while maintaining complementary boundary-detection characteristics. These results indicate that foot-pressure signals can provide activity-boundary information that differs from that obtained from inertial sensing.
Based on these findings, the proposed Adaptive strategy constructs an Adaptive Segmentation Table by selecting a segmentation method for each activity transition based on the training data. This enables different segmentation methods to be selected according to the estimated activity transition rather than relying on a single fixed segmentation method. The comparison between Adaptive (SW) and Adaptive (GT), in which the true activity information was used to select the segmentation method, showed only a small difference under the ideal condition. This indicates that the performance of the Adaptive strategy is influenced not only by errors in the initial activity prediction but also by the segmentation characteristics of the selected methods and their subsequent effects on activity recognition.
Activity recognition experiments showed that the automatic segmentation methods produced broadly comparable recognition performance. Although the overall statistical test indicated differences among the evaluated segmentation conditions, no significant pairwise differences were found between the automatic segmentation methods after multiple-comparison correction. In addition, expanding the evaluation region from to samples improved recognition performance, suggesting that the recognition model can tolerate a certain degree of boundary localization error. The control experiments comparing IMU-only and IMU+FP recognition features further showed that adding foot-pressure features did not consistently improve recognition performance, supporting the interpretation that the primary contribution of foot-pressure sensing in this study is its complementary information for activity segmentation rather than a direct improvement in recognition accuracy.
Overall, this study demonstrates the feasibility of using complementary segmentation methods within an adaptive framework for transition-dependent activity segmentation. The findings provide a basis for further investigation of cross-modal activity segmentation using larger and more diverse datasets, unconstrained activity sequences, different participant populations, and different wearable sensor configurations.
Author Contributions
Conceptualization, Y.Z., A.O., T.T. and M.T.; methodology, Y.Z., A.O., T.T. and M.T.; software, Y.Z.; validation, Y.Z.; formal analysis, Y.Z., A.O., T.T. and M.T.; investigation, Y.Z.; resources, Y.Z.; data curation, Y.Z.; writing—original draft preparation, Y.Z.; writing—review and editing, Y.Z., A.O., T.T. and M.T.; visualization, Y.Z., A.O., T.T. and M.T.; supervision, A.O., T.T. and M.T.; project administration, Y.Z., A.O., T.T. and M.T.; funding acquisition, Y.Z. and T.T. All authors have read and agreed to the published version of the manuscript.
Funding
This work was supported in part by JST SPRING, Grant Number JPMJSP2148, and by JST Moonshot R&D Program, Grant Number JPMJMS229C.
Institutional Review Board Statement
The study was conducted according to the guidelines of the Declaration of Helsinki and approved by the Ethics Committee of Kobe University (No. 06–27, 23 December 2024).
Informed Consent Statement
Informed consent was obtained from all participants involved in the study.
Data Availability Statement
Not published due to ethical restrictions. If you want to browse the data, please contact the author personally.
Conflicts of Interest
The authors declare no conflicts of interest.
References
- Wang, G.; Li, Q.; Wang, L.; Wang, W.; Wu, M.; Liu, T. Impact of Sliding-window Length in Indoor Human Motion Modes and Pose Pattern Recognition Based on Smartphone Sensors. Sensors 2018, 18, 1965. [Google Scholar] [CrossRef] [Scilit]
- Huynh, T.; Schiele, B. Analyzing Features for Activity Recognition. In Proceedings of the 2005 Joint Conference on Smart Objects and Ambient Intelligence: Innovative Context-Aware Services, Usages and Technologies (sOc-EUSAI), Grenoble, France, 12–14 October 2005; pp. 159–163. [Google Scholar]
- Murao, K.; Terada, T. Labeling Method for Acceleration Data using an Execution Sequence of Activities. In Proceedings of the 1st International Workshop on Human Activity Sensing Corpus and its Application (HASCA 2013), Zurich, Switzerland, 8–12 September 2013; pp. 611–622. [Google Scholar]
- Zhang, Y.; Ohnishi, A.; Terada, T.; Tsukamoto, M. Step-Based Sensor Data Segmentation Using Foot Pressure Sensors. In Proceedings of the Advances in Mobile Computing and Multimedia Intelligence (MoMM2025); Springer: Cham, Switzerland, 2025; Volume 16329, pp. 68–82. [Google Scholar]
- Lara, Ó.D.; Pérez, A.J.; Labrador, M.A.; Posada, J.D. Centinela: A Human Activity Recognition System Based on Acceleration and Vital Sign Data. Pervasive Mob. Comput. 2012, 8, 717–729. [Google Scholar] [CrossRef] [Scilit]
- Bao, L.; Intille, S.S. Activity Recognition from User-Annotated Acceleration Data. In Proceedings of the 2nd International Conference on Pervasive Computing (Pervasive 2004); Springer: Berlin/Heidelberg, Germany, 2004; pp. 1–17. [Google Scholar]
- Tsukamoto, A.; Yoshida, N.; Yonezawa, T.; Mase, K.; Enokibori, Y. Where Are the Best Positions of IMU Sensors for HAR? Approach by a Garment Device with Fine Grained Grid IMUs. In Proceedings of the 2023 ACM International Joint Conference on Pervasive and Ubiquitous Computing & the 2023 ACM International Symposium on Wearable Computing (UbiComp/ISWC’23), Cancun, Mexico, 8–12 October 2023; pp. 445–450. [Google Scholar]
- Sugimoto, C.; Ozaki, K.; Ezoe, R.; Hosaka, H.; Yamato, H. Human activity recognition Using Foot Pressure Sensing Shoes. J. Adv. Mech. Des. Syst. Manuf. 2010, 4, 206–213. [Google Scholar] [CrossRef] [Scilit]
- Fukahori, K.; Sakamoto, D.; Igarashi, T. Exploring Subtle Foot Plantar-based Gestures with Sock-placed Pressure Sensors. In Proceedings of the 33rd Annual ACM Conference on Human Factors in Computing Systems (CHI’15), Seoul, Republic of Korea, 18–23 April 2015; pp. 3019–3028. [Google Scholar]
- Ohnishi, A.; Terada, T.; Tsukamoto, M. A Method for Recognizing Postures and Gestures Using Foot Pressure Sensors. J. Inf. Process. 2019, 27, 348–358. [Google Scholar] [CrossRef] [Scilit]
- Hegde, N.; Bries, M.; Swibas, T.; Melanson, E.; Sazonov, E. Automatic Recognition of Activities of Daily Living Utilizing Insole-Based and Wrist-Worn Wearable Sensors. IEEE J. Biomed. Health Inform. 2018, 22, 979–988. [Google Scholar] [CrossRef] [Scilit] [PubMed]
- Patterson, T.; McClean, S.; Nugent, C.D.; Zhang, S.; Galway, L.; Cleland, I. Online Change Detection for Timely Solicitation of User Interaction. In Proceedings of the 8th International Conference on Ubiquitous Computing and Ambient Intelligence (UCAmI 2014); Springer: Cham, Switzerland, 2014; Volume 8867, pp. 116–123. [Google Scholar]
- Patterson, T.; Khan, N.; McClean, S.I.; Nugent, C.; Zhang, S.; Cleland, I.; Ni, Q. Sensor-Based Change Detection for Timely Solicitation of User Engagement. IEEE Trans. Mob. Comput. 2017, 16, 2889–2900. [Google Scholar] [CrossRef] [Scilit]
- Ni, Q.; Patterson, T.; Cleland, I.; Nugent, C. Dynamic Detection of Window Starting Positions and Its Implementation Within an Activity Recognition Framework. J. Biomed. Inform. 2016, 62, 171–180. [Google Scholar] [CrossRef] [Scilit] [PubMed]
- Aminikhanghahi, S.; Wang, T.; Cook, D.J. Real-Time Change Point Detection with Application to Smart Home Time Series Data. IEEE Trans. Knowl. Data Eng. 2018, 31, 1010–1023. [Google Scholar] [CrossRef] [Scilit] [PubMed]
- De Ryck, T.; De Vos, M.; Bertrand, A. Change Point Detection in Time Series Data Using Autoencoders with a Time-Invariant Representation. IEEE Trans. Signal Process. 2021, 69, 3513–3524. [Google Scholar] [CrossRef] [Scilit]
- Jung, S.; Oudre, L.; Truong, C.; Dorveaux, E.; Gorintin, L.; Vayatis, N.; Ricard, D. Adaptive Change-Point Detection for Studying Human Locomotion. In Proceedings of the 43rd Annual International Conference of the IEEE Engineering in Medicine and Biology Society (EMBC), Virtual, Mexico, 1–5 November 2021; pp. 2020–2024. [Google Scholar]
- Thakur, D.; Biswas, S. Online Change Point Detection in Application With Transition-Aware Activity Recognition. IEEE Trans. Hum.-Mach. Syst. 2022, 52, 1176–1185. [Google Scholar] [CrossRef] [Scilit]
- Najeh, H.; Lohr, C.; Leduc, B. Dynamic Segmentation of Sensor Events for Real-Time Human Activity Recognition in a Smart Home Context. Sensors 2022, 22, 5458. [Google Scholar] [CrossRef] [Scilit] [PubMed]
- Furui, S. On the Role of Spectral Transition for Speech Perception. J. Acoust. Soc. Am. 1986, 80, 1016–1025. [Google Scholar] [CrossRef] [Scilit] [PubMed]
- Dusan, S.; Rabiner, L. On the Relation Between Maximum Spectral Transition Positions and Phone Boundaries. In Proceedings of the 9th International Conference on Spoken Language Processing (INTERSPEECH-ICSLP 2006), Pittsburgh, PA, USA, 17–21 September 2006; pp. 1317–1323. [Google Scholar]
- ATR-Promotion. ATR-Promotion Sensor Products. Available online: http://www.atr-p.com/products/sensor.html (accessed on 28 May 2025).
- FlexiForce. A201 Force Sensor. Available online: https://www.tekscan.com/products-solutions/force-sensors/a201 (accessed on 28 May 2025).
- Altima. Altima Product Page. Available online: https://www.atr-p.com/products/Altima.html (accessed on 28 May 2025).
- Anderson, A.J.; Eguren, D.; Gonzalez, M.A.; Caiola, M.; Khan, N.; Watkinson, S.; Zuccaroli, I.; Hirczy, S.S.; Zabetian, C.P.; Mills, K.; et al. WearGait-PD: An Open-Access Wearables Dataset for Gait in Parkinson’s Disease and Age-Matched Controls. Sci. Data 2026, 13, 440. [Google Scholar] [CrossRef] [Scilit] [PubMed]
- Grouvel, G.; Carcreff, L.; Moissenet, F.; Armand, S. A Dataset of Asymptomatic Human Gait and Movements Obtained from Markers, IMUs, Insoles and Force Plates. Sci. Data 2023, 10, 180. [Google Scholar] [CrossRef] [Scilit] [PubMed]
- Chatzaki, C.; Skaramagkas, V.; Tachos, N.; Christodoulakis, G.; Maniadi, E.; Kefalopoulou, Z.; Fotiadis, D.I.; Tsiknakis, M. The Smart-Insole Dataset: Gait Analysis Using Wearable Sensors with a Focus on Elderly and Parkinson’s Patients. Sensors 2021, 21, 2821. [Google Scholar] [CrossRef] [Scilit] [PubMed]
- Anguita, D.; Ghio, A.; Oneto, L.; Parra, X.; Reyes-Ortiz, J.L. A Public Domain Dataset for Human Activity Recognition Using Smartphones. In Proceedings of the 21st International European Symposium on Artificial Neural Networks, Computational Intelligence and Machine Learning (ESANN 2013), Bruges, Belgium, 24–26 April 2013; pp. 437–442. [Google Scholar]
- Reiss, A.; Stricker, D. Introducing a New Benchmarked Dataset for Activity Monitoring. In Proceedings of the 16th IEEE International Symposium on Wearable Computers (ISWC 2012), Newcastle, UK, 18–22 June 2012; pp. 108–109. [Google Scholar]
- Kwapisz, J.R.; Weiss, G.M.; Moore, S.A. Activity Recognition Using Cell Phone Accelerometers. ACM SIGKDD Explor. Newsl. 2010, 12, 74–82. [Google Scholar] [CrossRef] [Scilit]
- Akbari, A.; Wu, J.; Grimsley, R.; Jafari, R. Hierarchical Signal Segmentation and Classification for Accurate Activity Recognition. In Proceedings of the 2018 ACM International Joint Conference and 2018 International Symposium on Pervasive Computing and Communications Workshops (UbiComp/ISWC 2018 Adjunct), Singapore, 8–12 October 2018; pp. 1596–1605. [Google Scholar]
- Chawla, N.V.; Bowyer, K.W.; Hall, L.O.; Kegelmeyer, W.P. SMOTE: Synthetic Minority Over-sampling Technique. J. Artif. Intell. Res. 2002, 16, 321–357. [Google Scholar] [CrossRef] [Scilit]
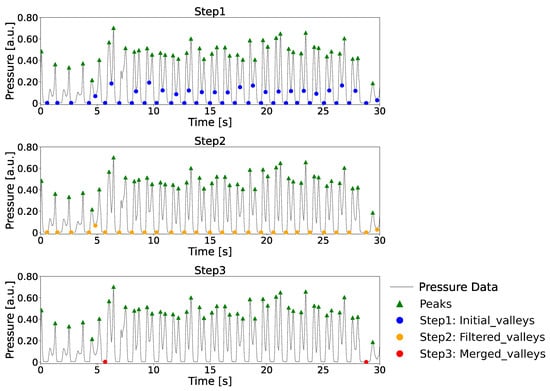
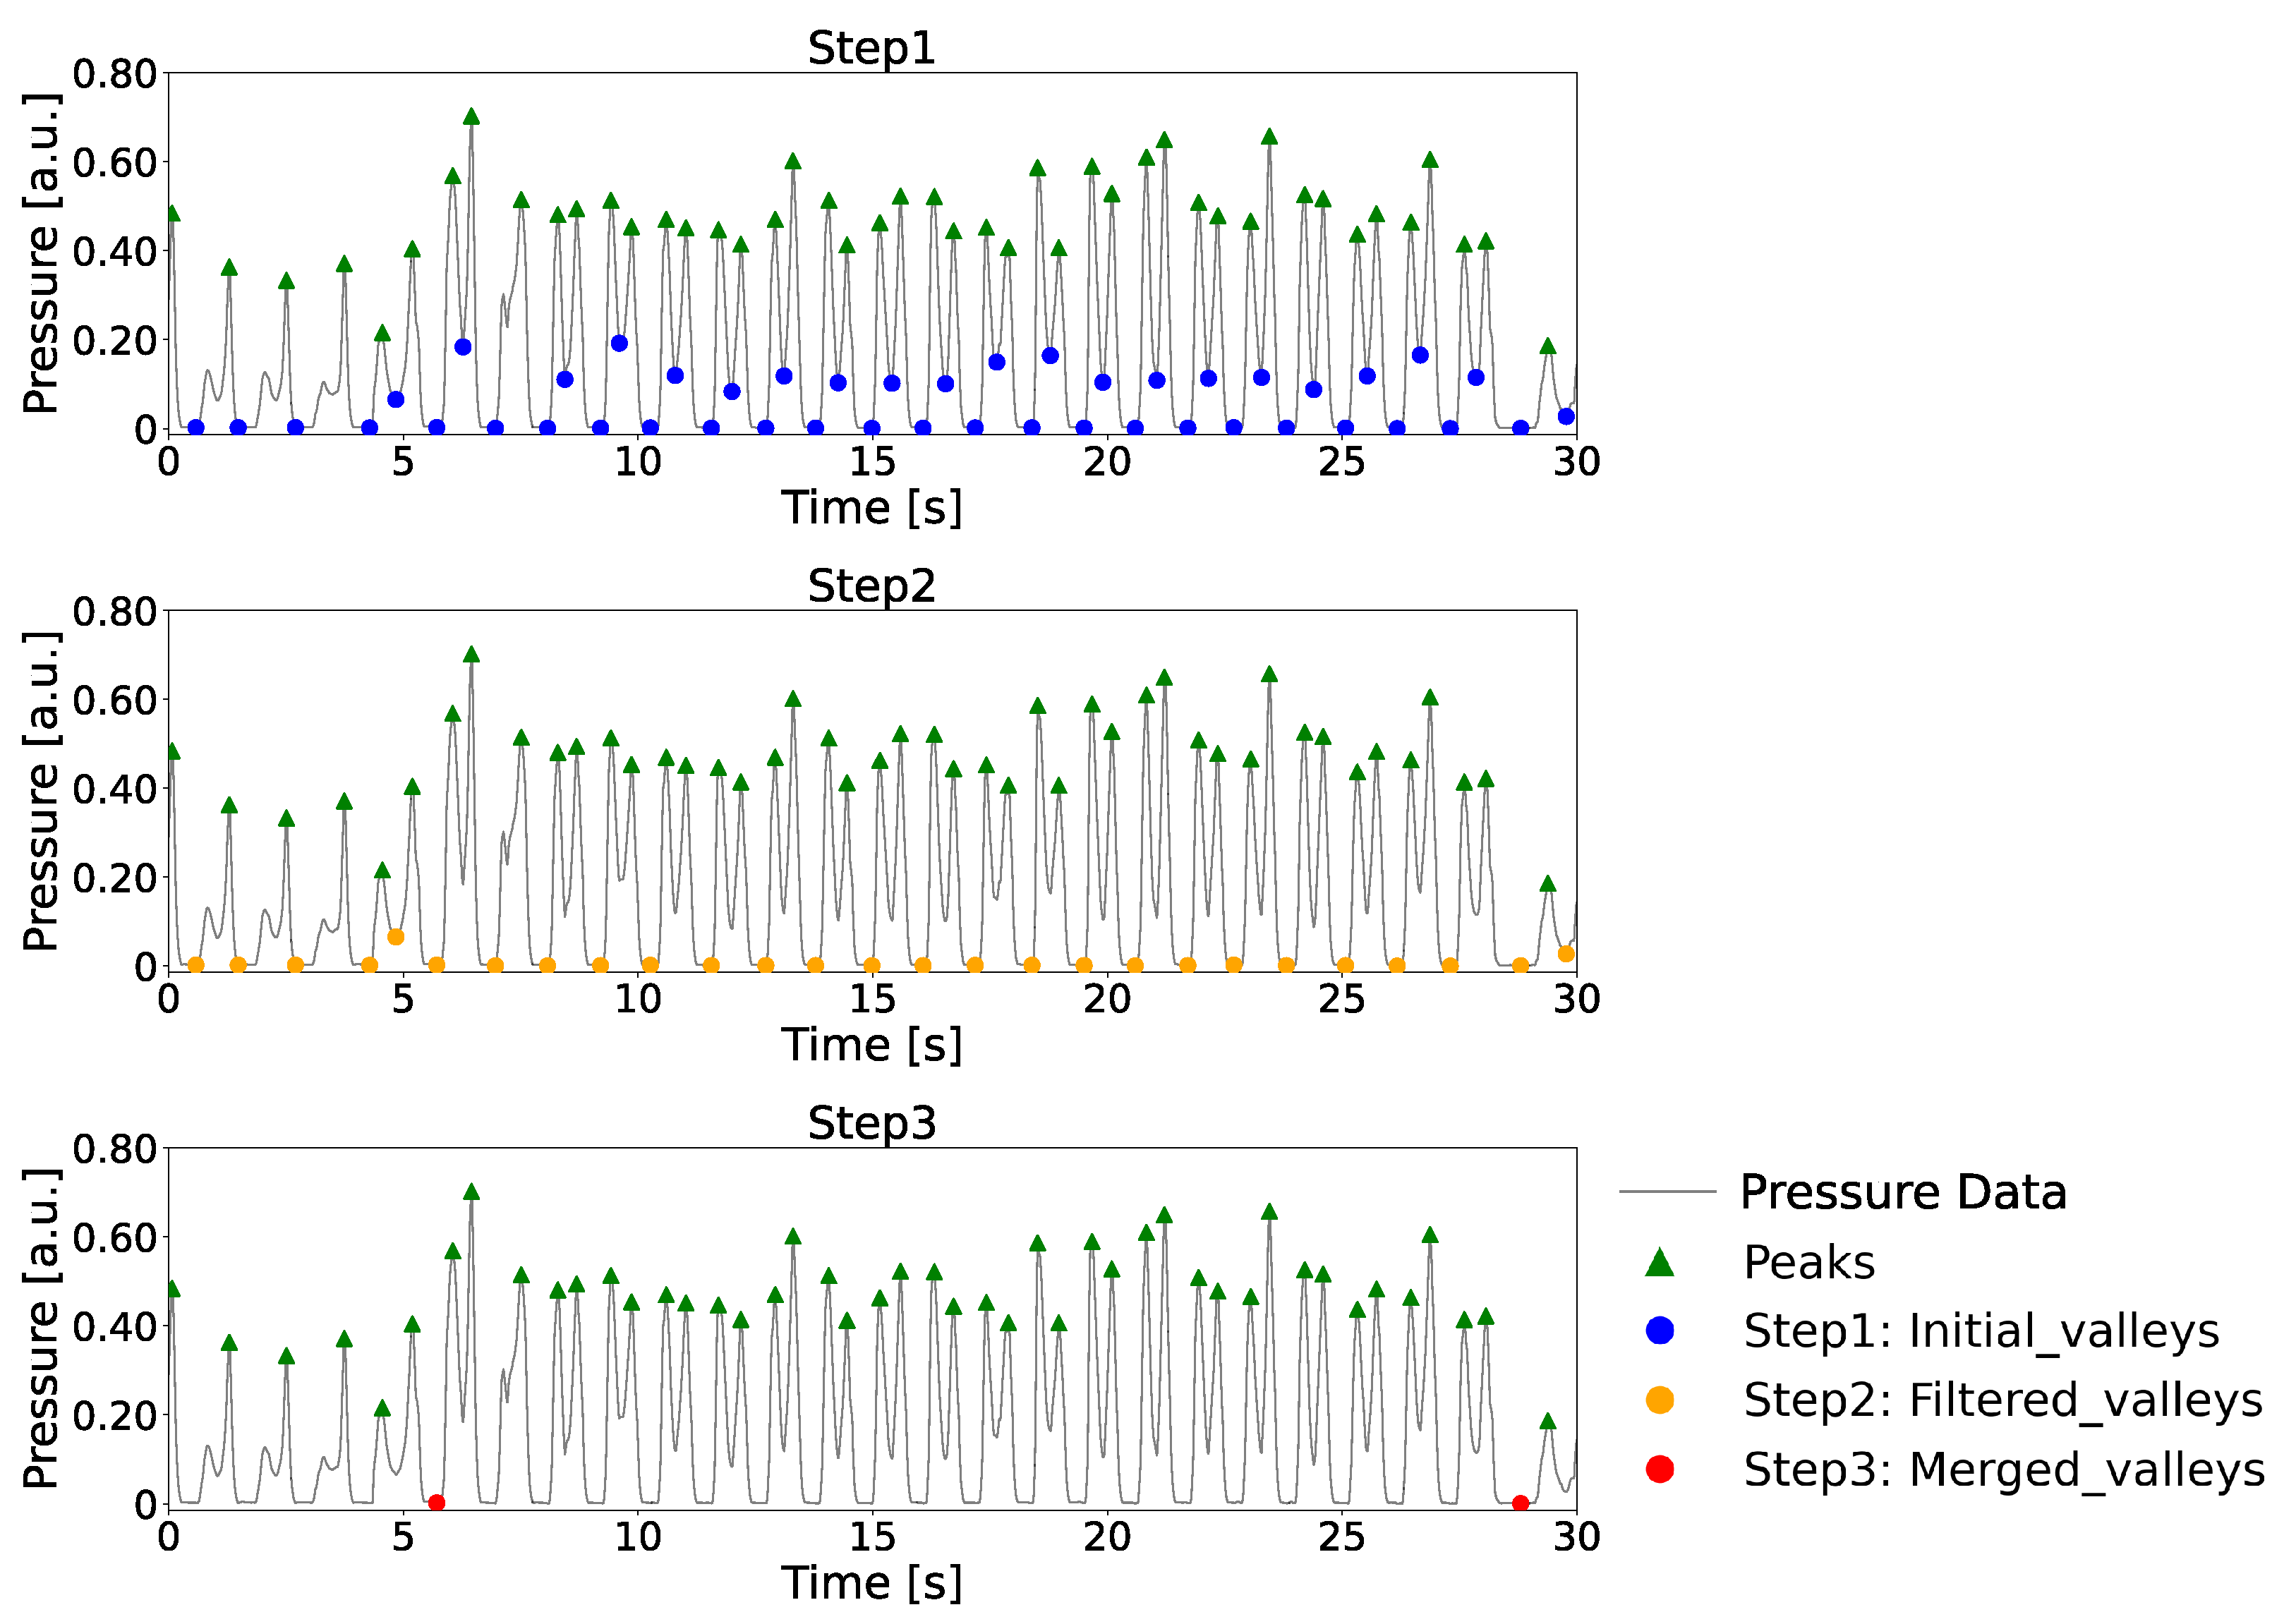
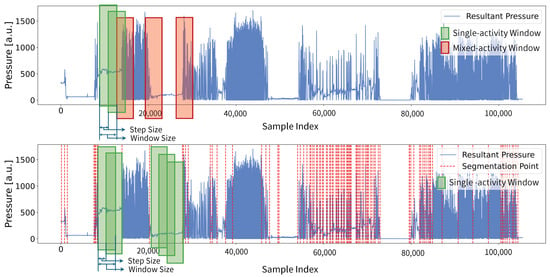
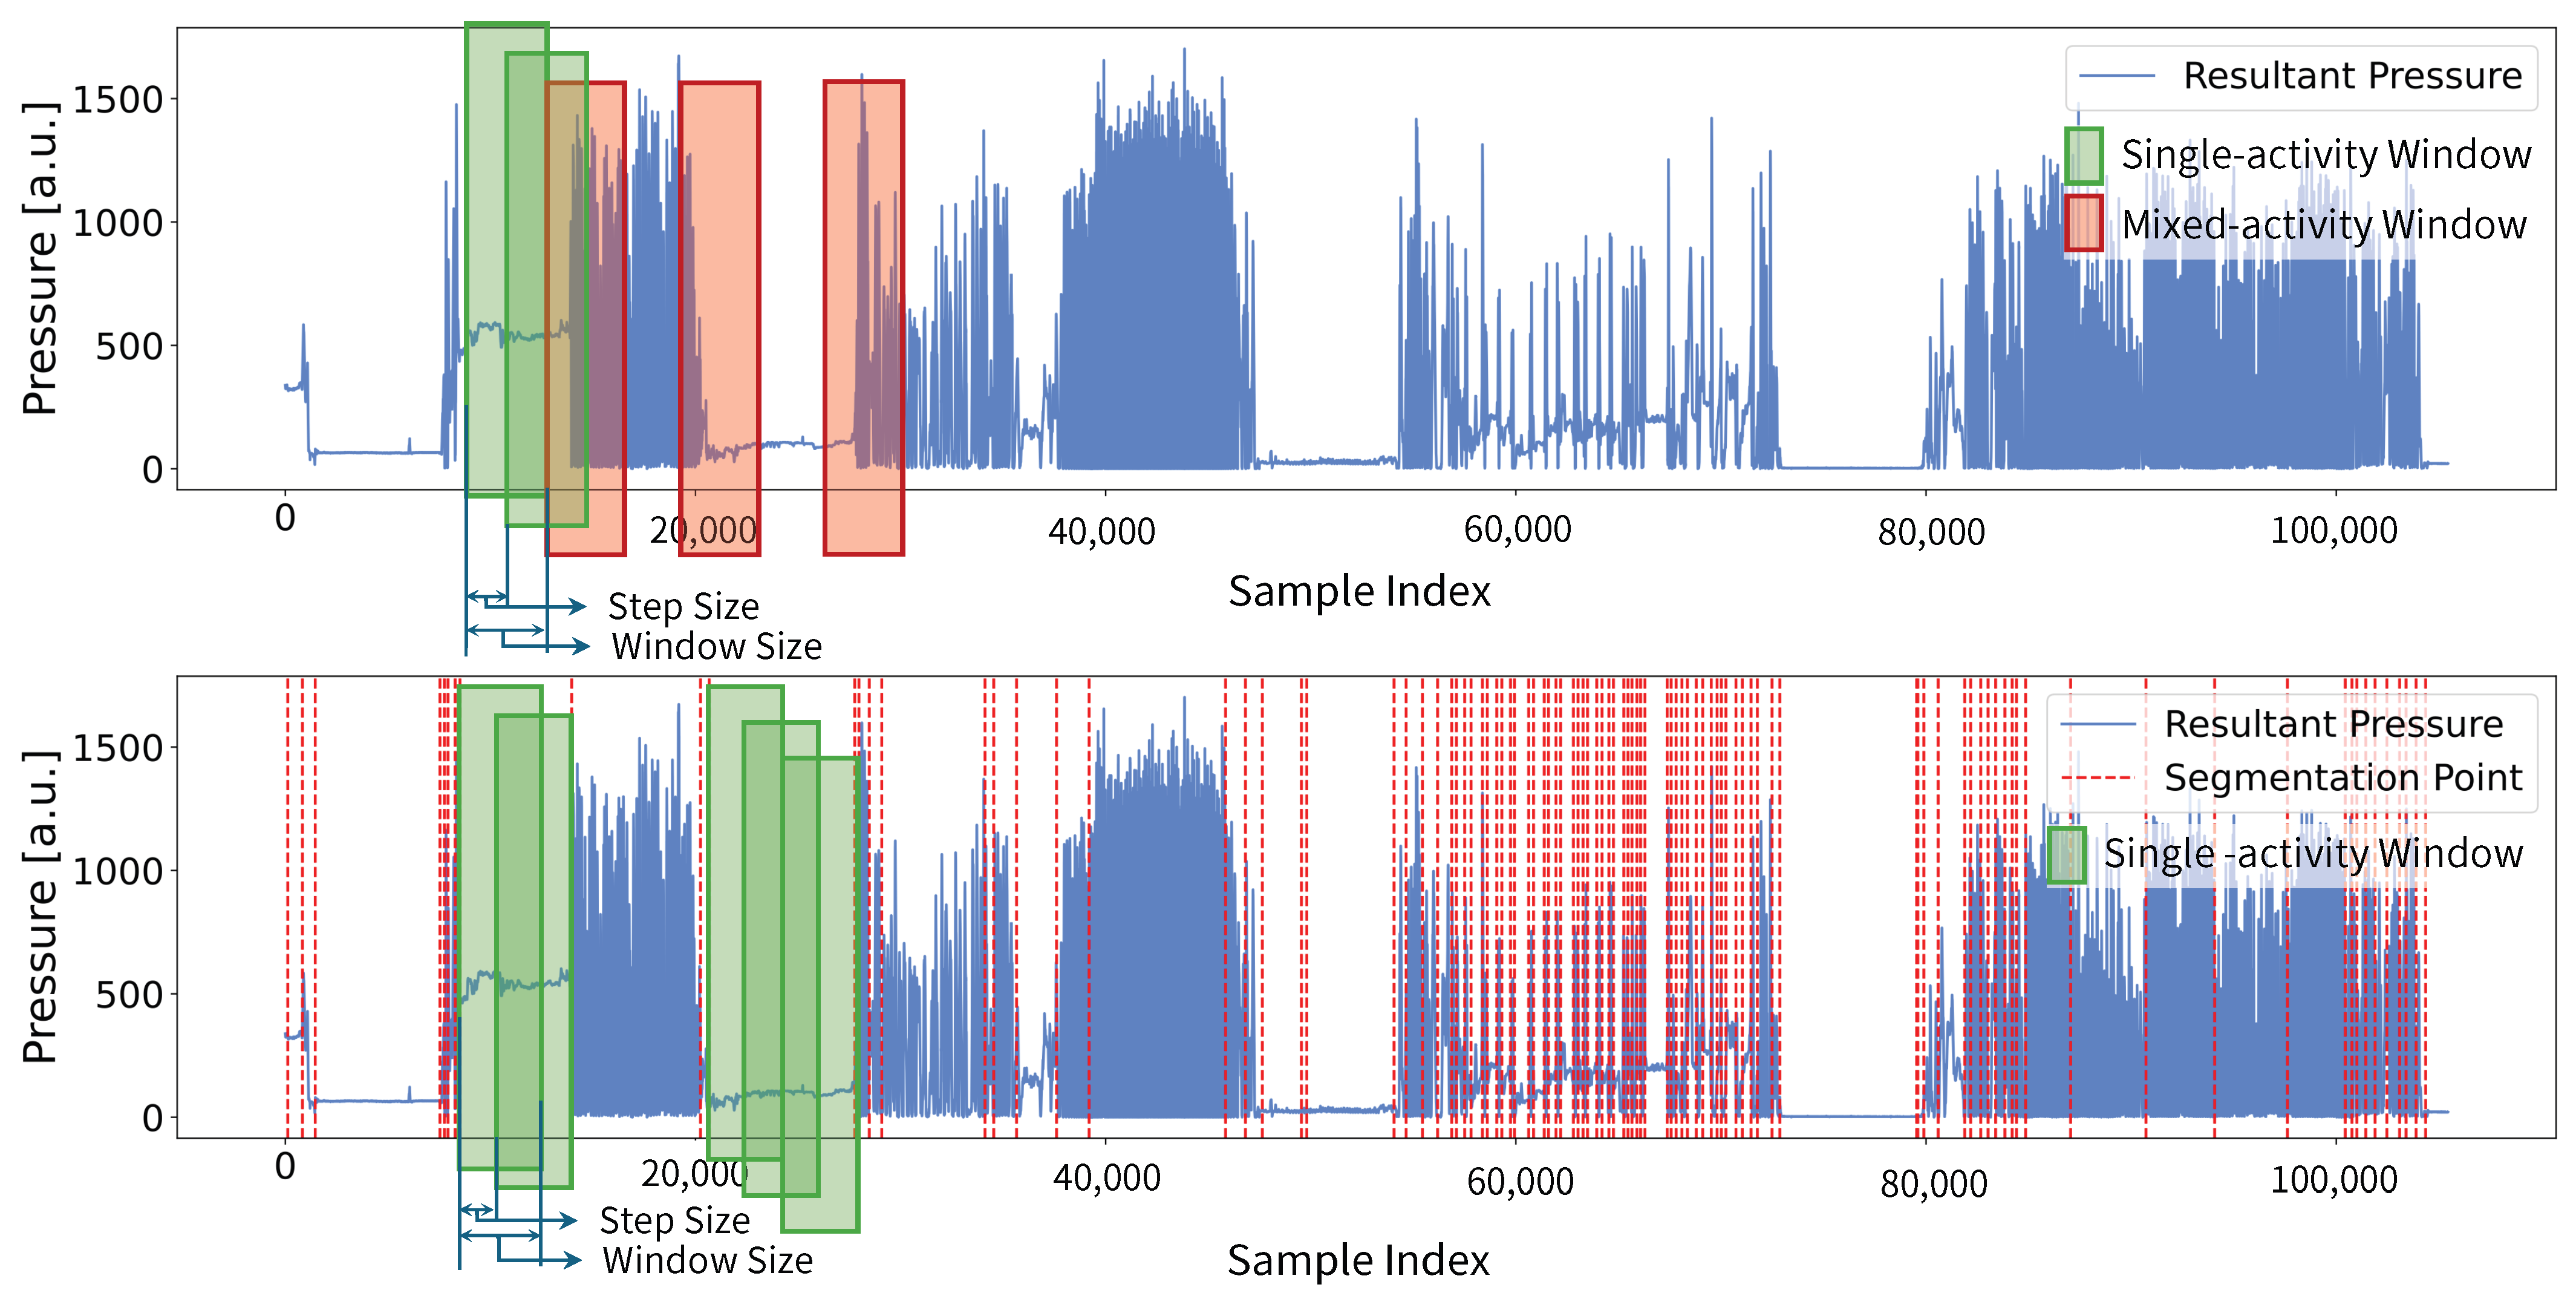
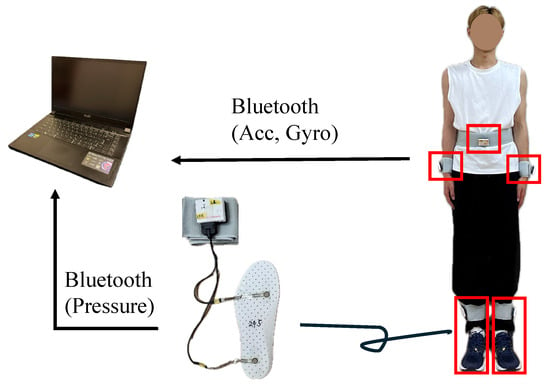
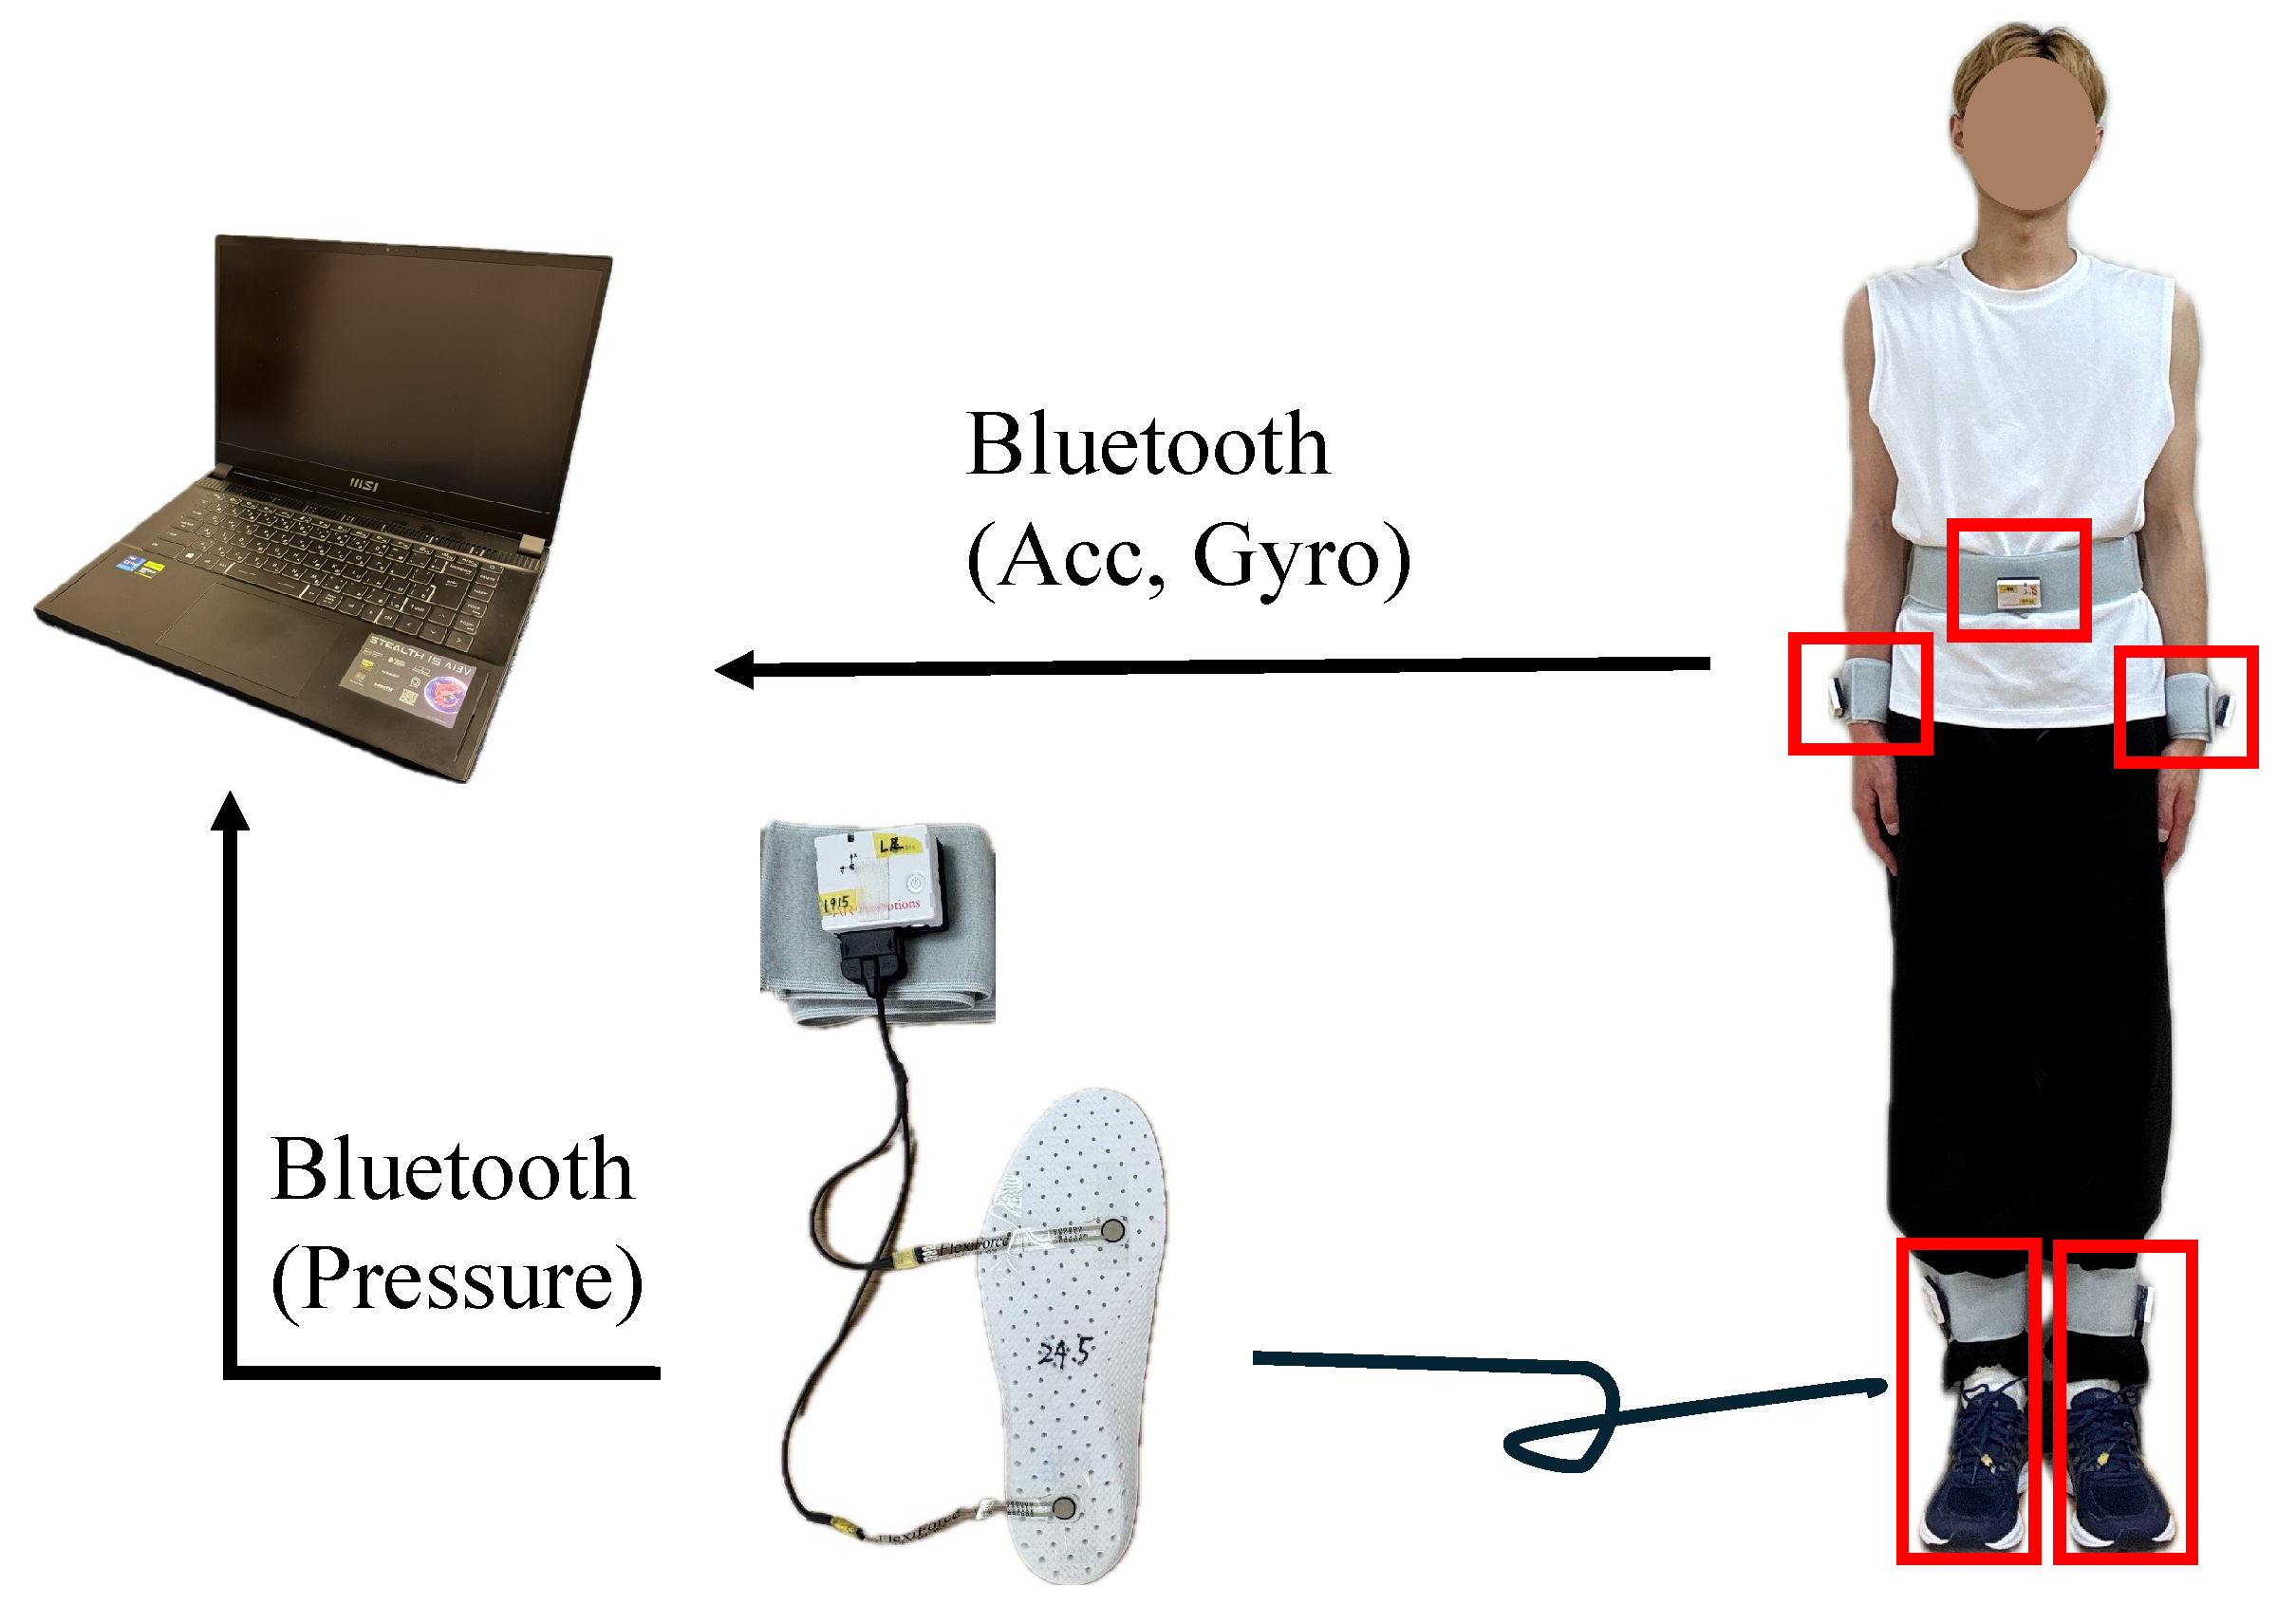
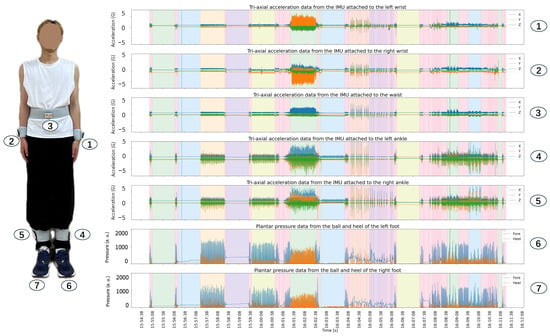
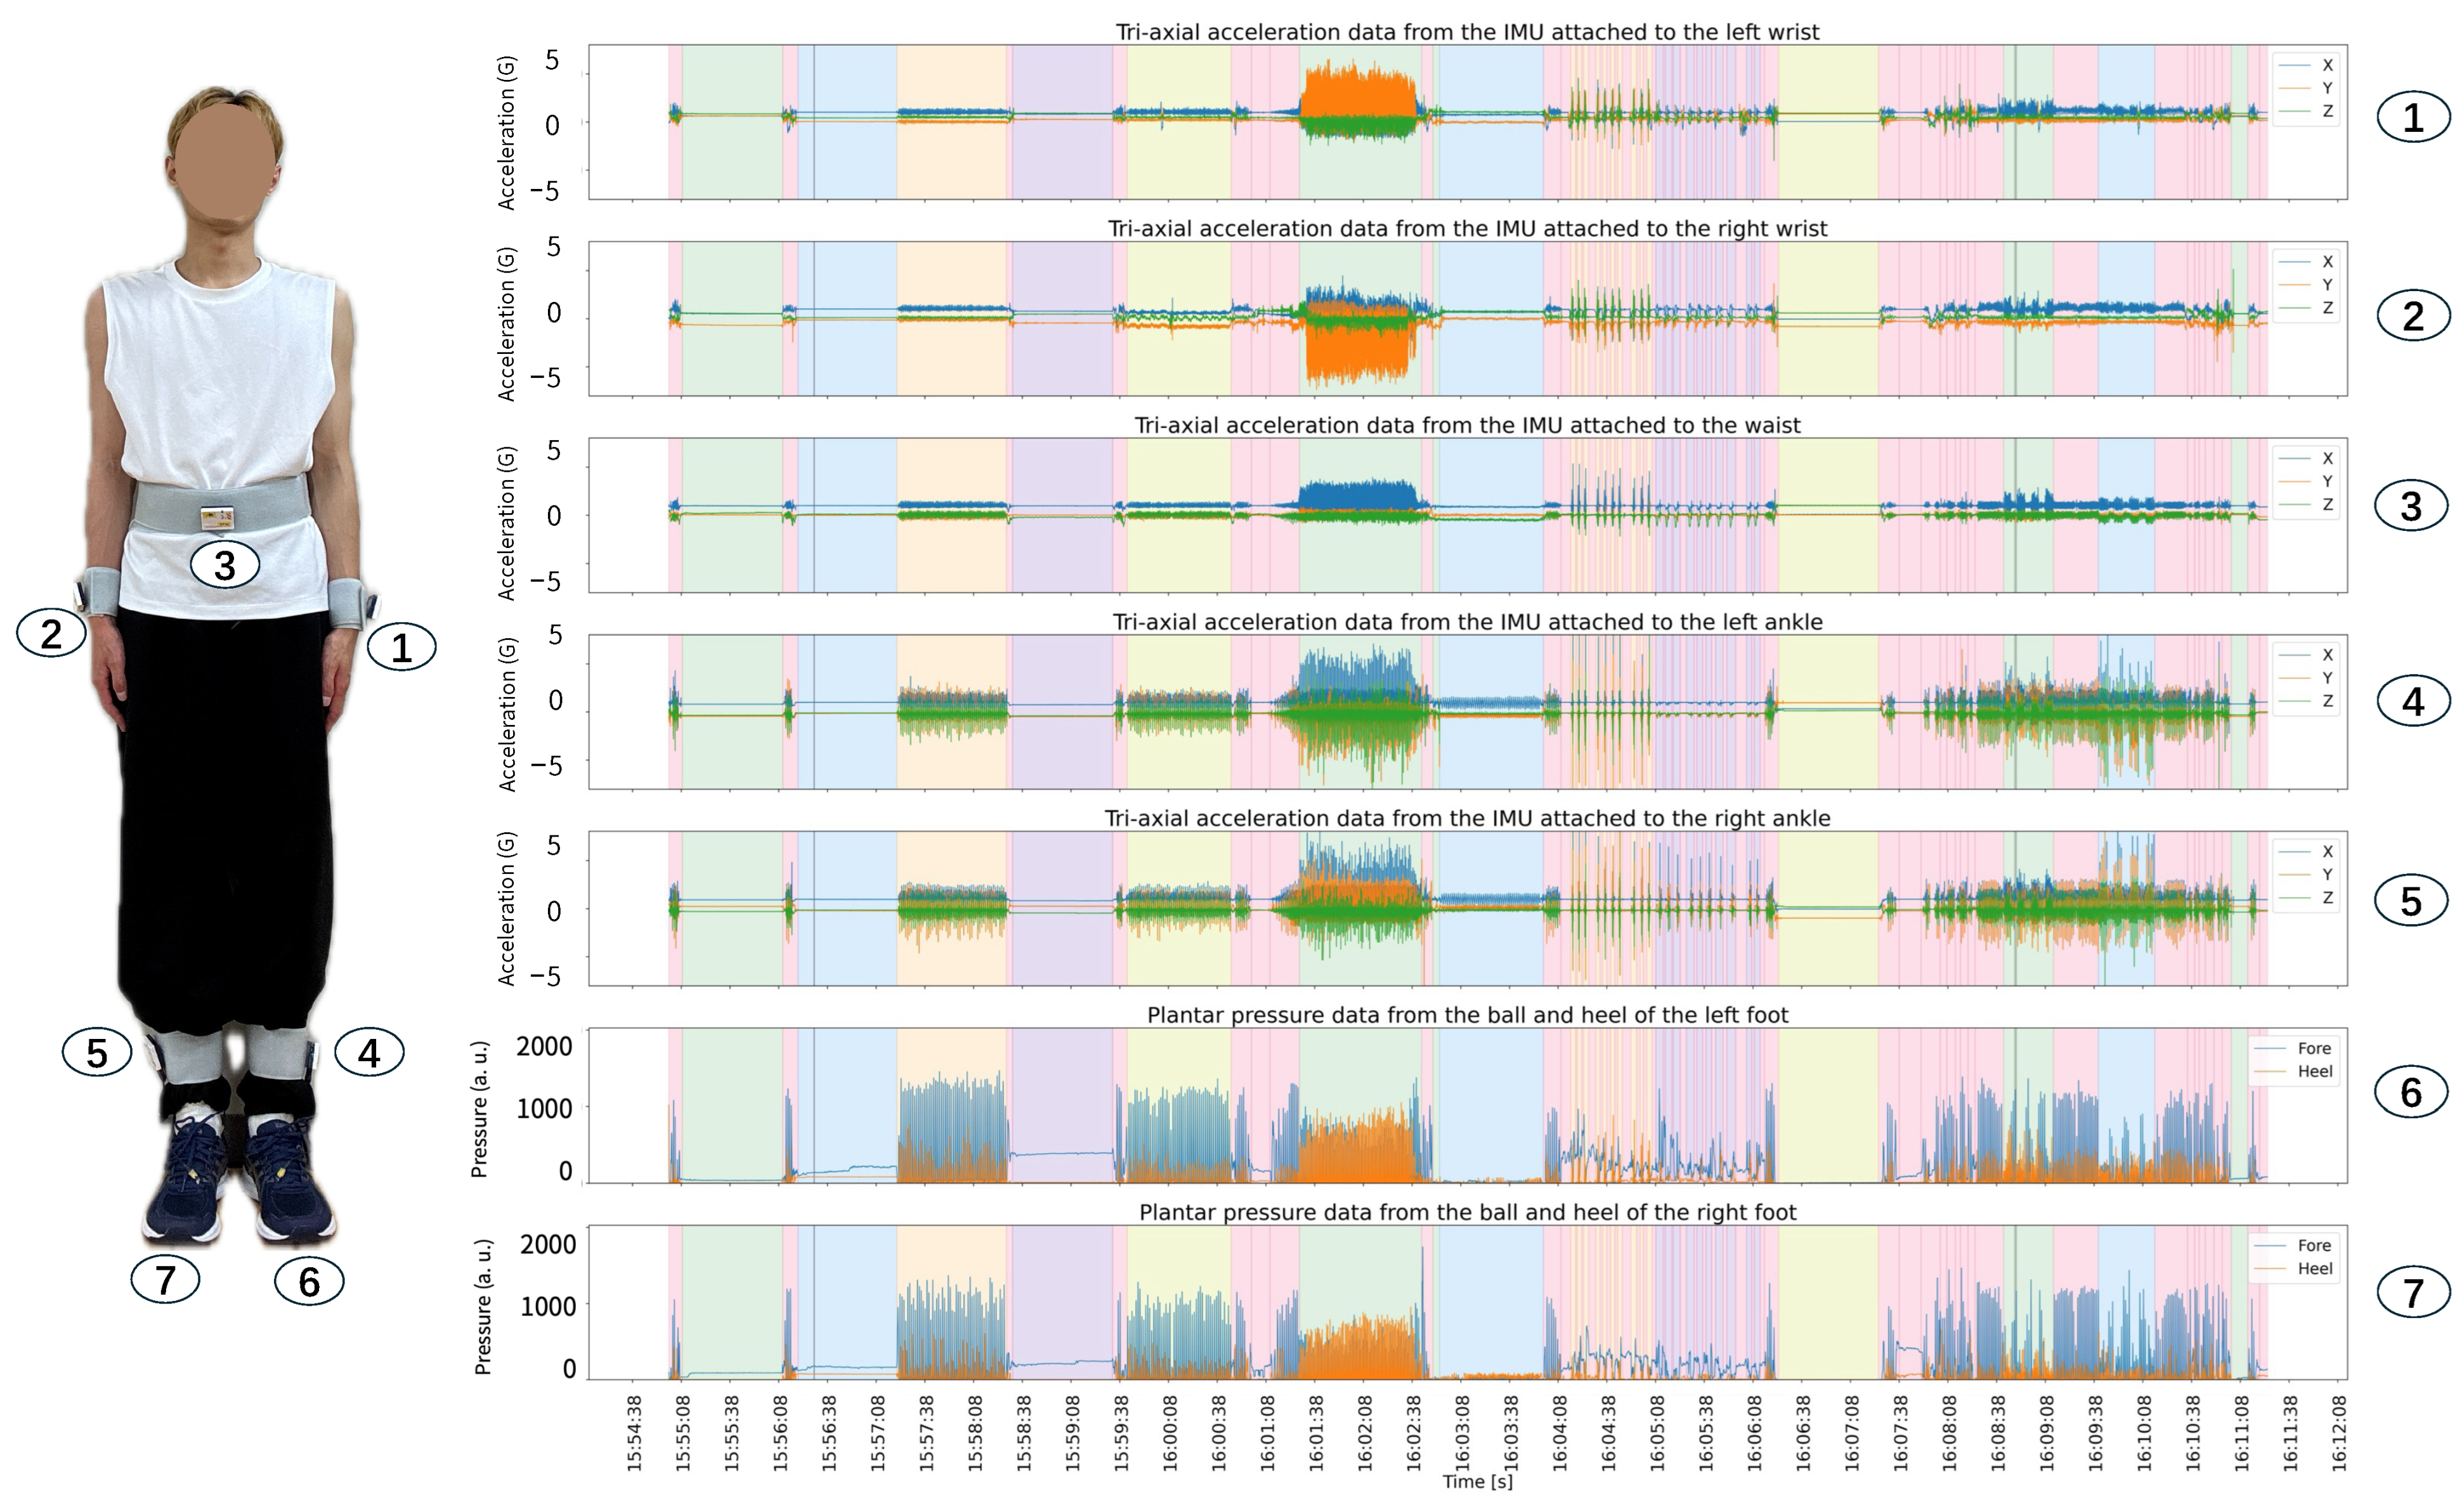
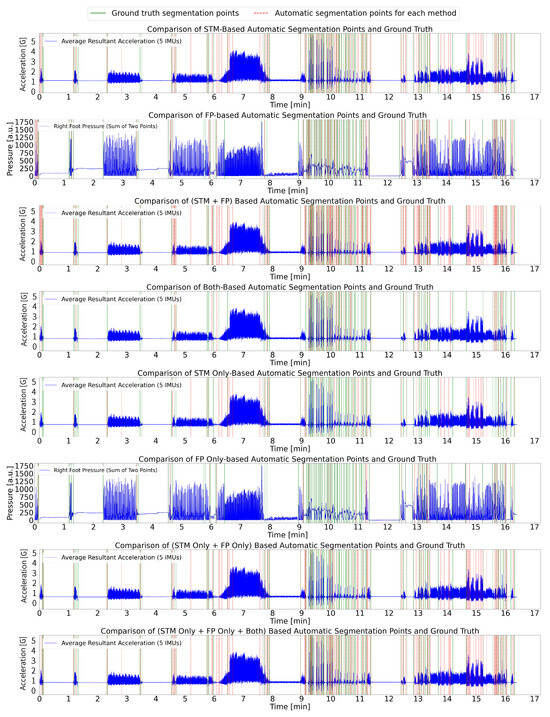
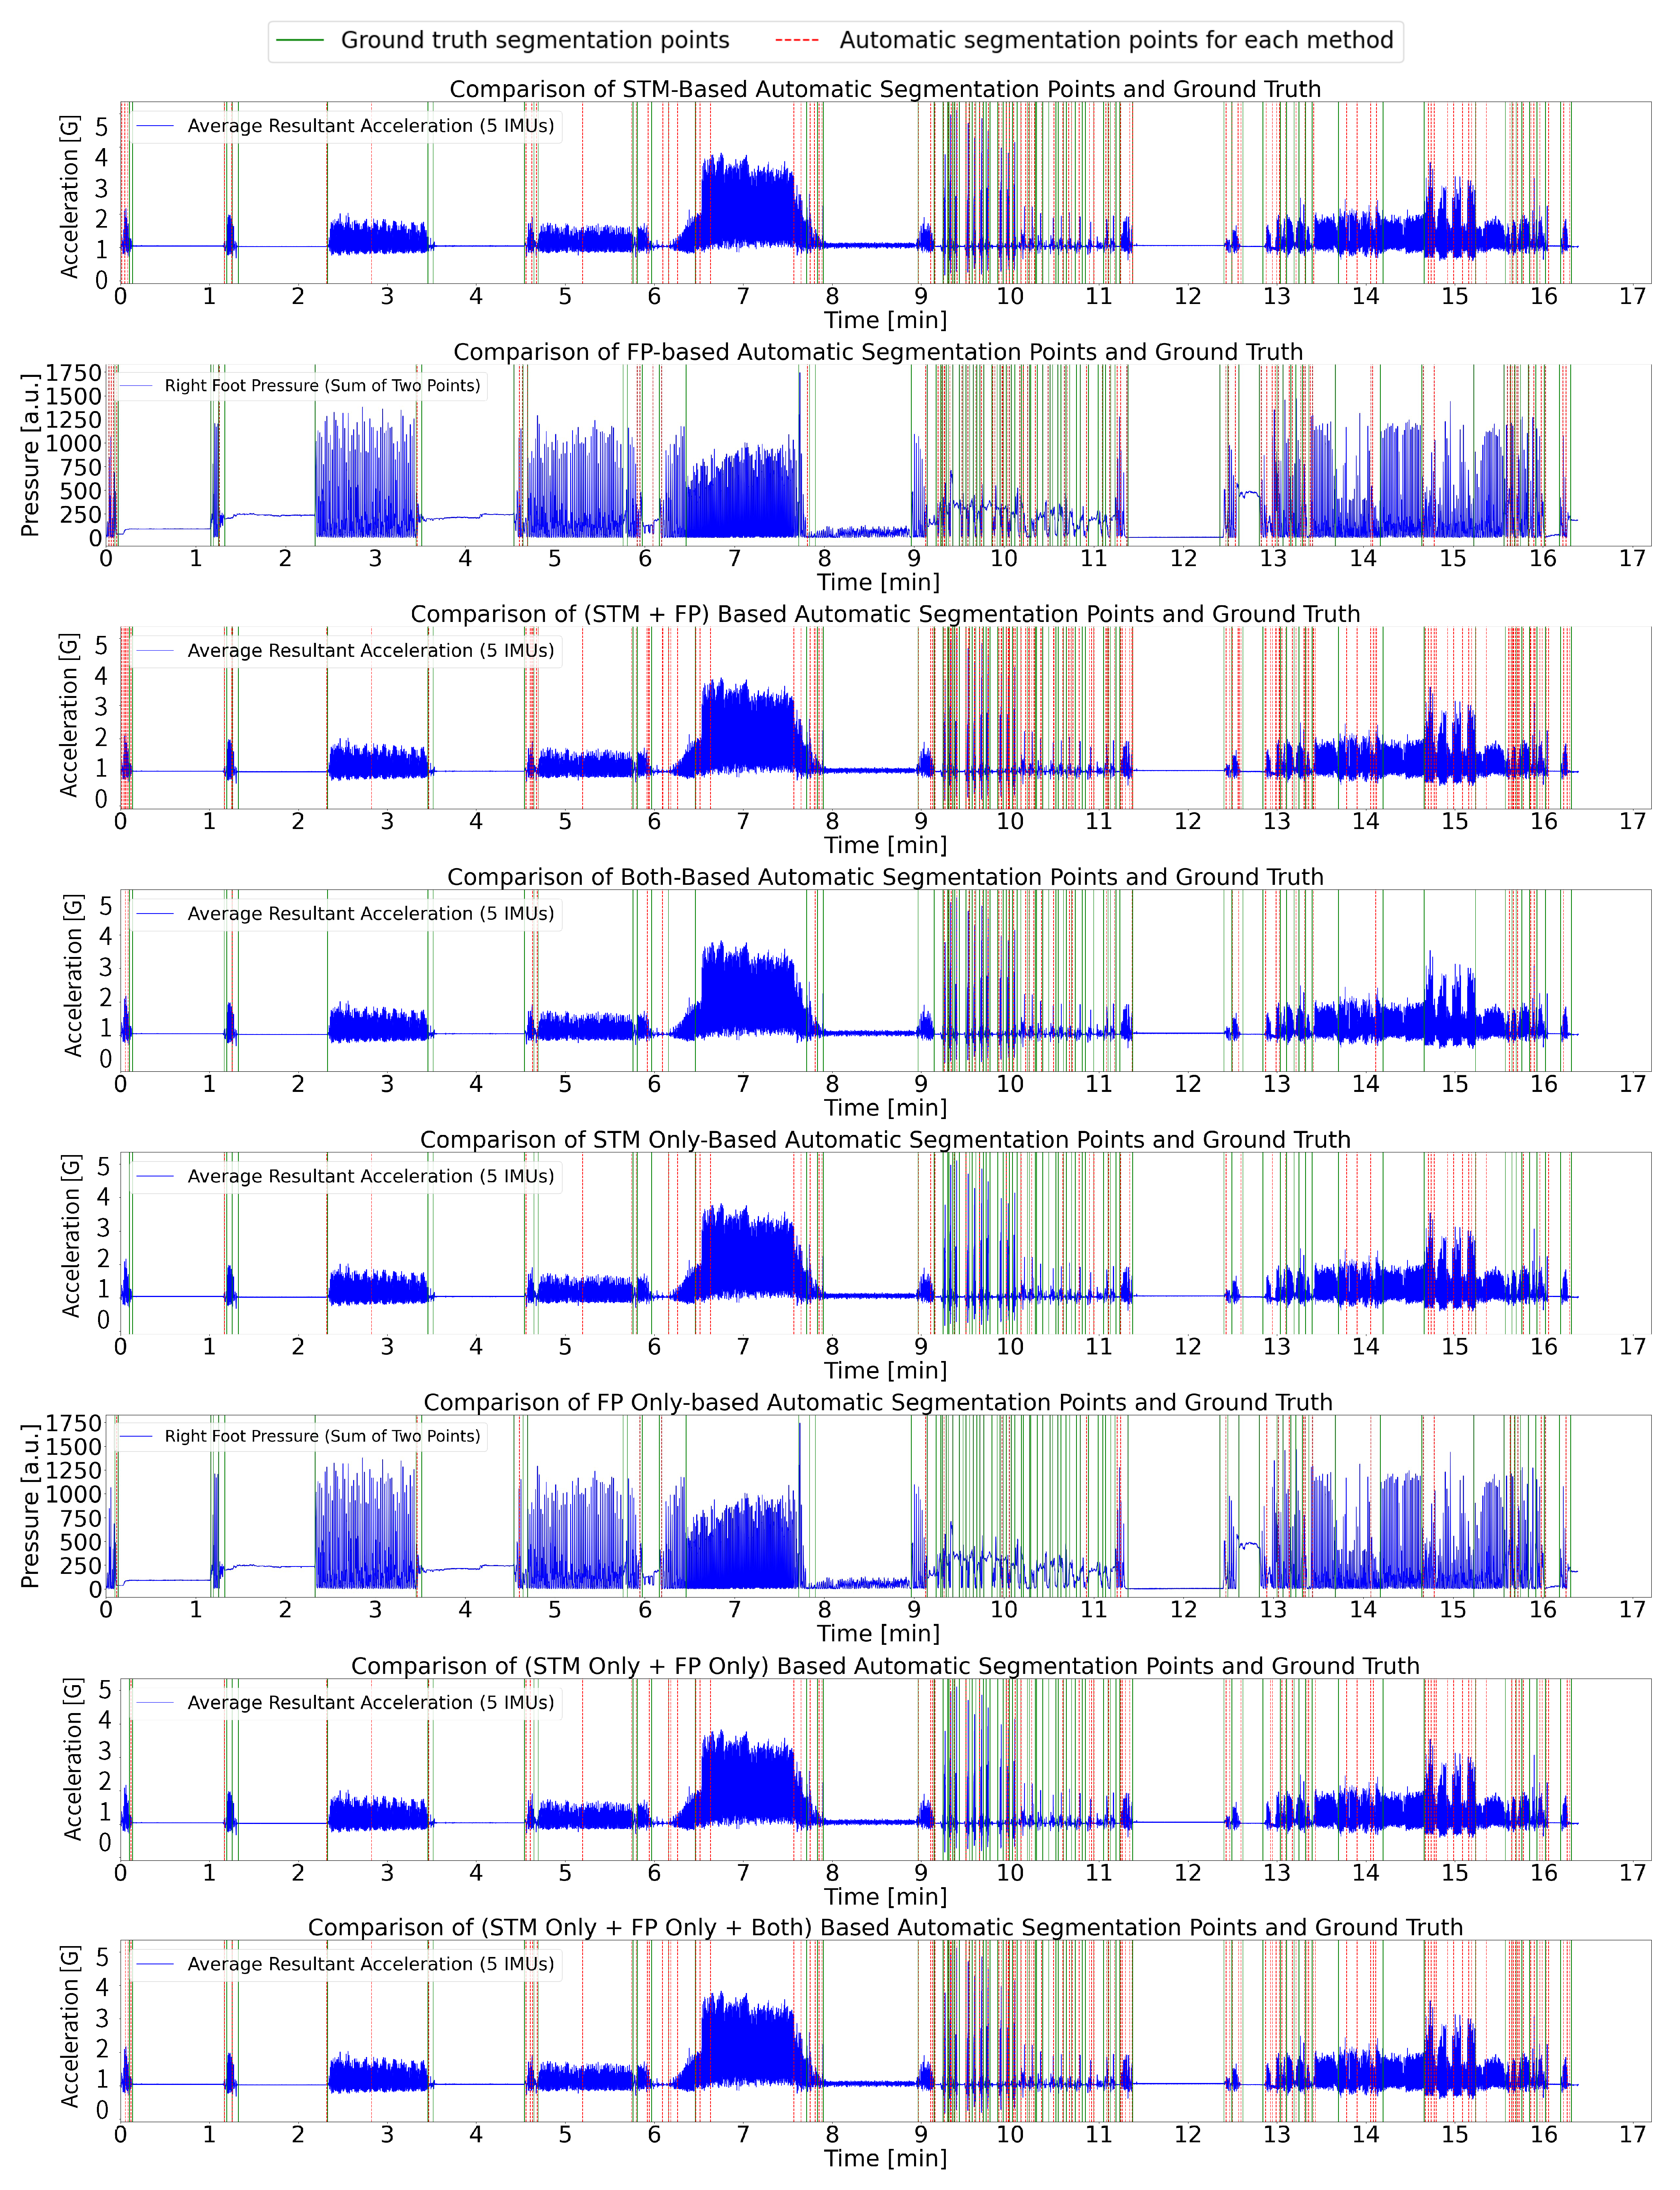
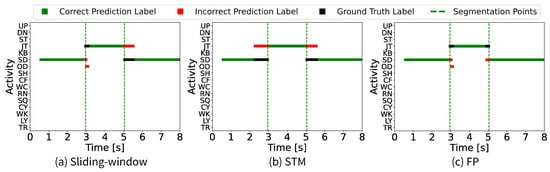
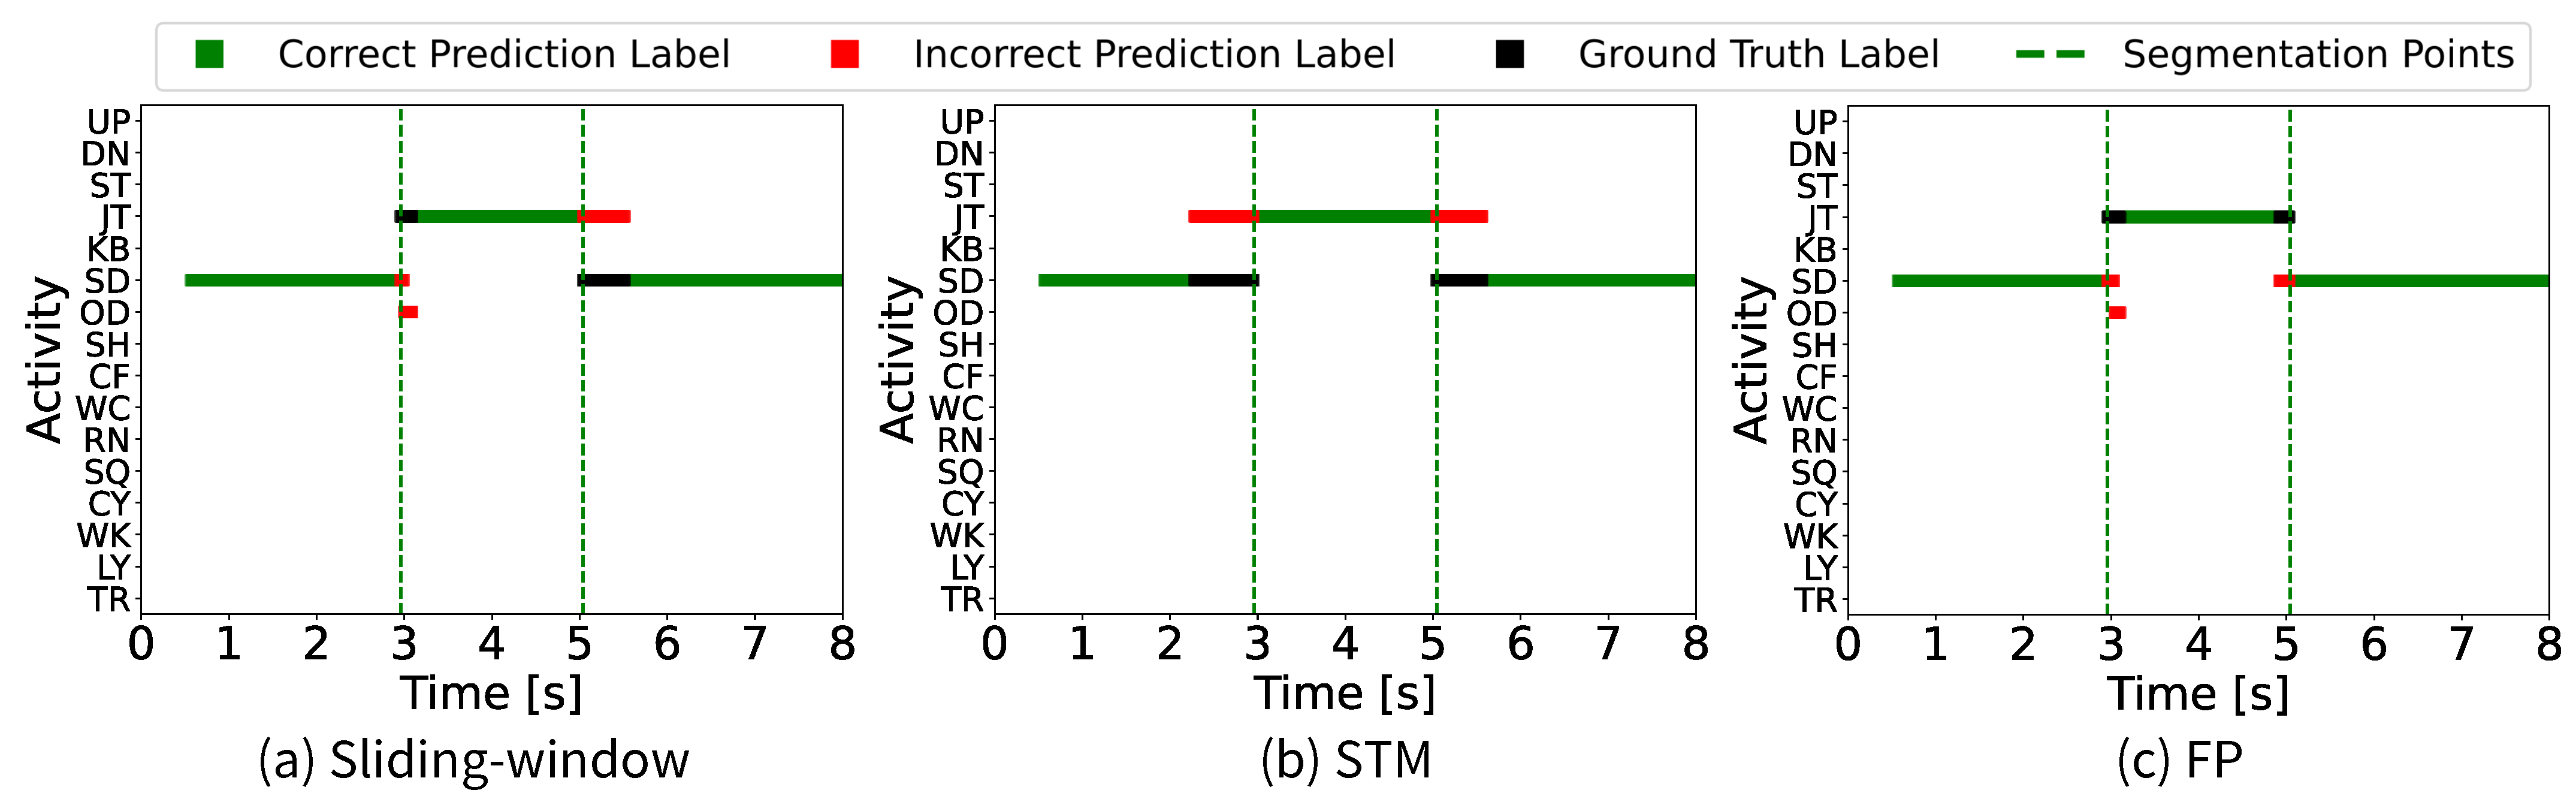

Disclaimer/Publisher’s Note: The statements, opinions and data contained in all publications are solely those of the individual author(s) and contributor(s) and not of MDPI and/or the editor(s). MDPI and/or the editor(s) disclaim responsibility for any injury to people or property resulting from any ideas, methods, instructions or products referred to in the content. |
© 2026 by the authors. Licensee MDPI, Basel, Switzerland. This article is an open access article distributed under the terms and conditions of the Creative Commons Attribution (CC BY) license.