


Abstract
The rapid expansion of photovoltaic (PV) installations necessitates advanced monitoring solutions to ensure optimal performance, early fault detection, and long-term reliability. This study presents a hybrid methodology for real-time PV module monitoring and fault diagnosis, integrating I–V curve analysis, IEC 60891 standardization, and Teaching–Learning-Based Optimization (TLBO) to estimate parameters of the Single Diode Model (SDM). An I-V Swinger-based test bench equipped with Arduino data acquisition and environmental sensors was developed to measure I–V characteristics under various operating conditions (OPC), including low irradiance, elevated temperature, and partial shading. The IEC 60891 procedure enabled OPC-to-STC conversion, facilitating accurate performance evaluation and degradation rate estimation. Concurrently, the TLBO algorithm efficiently extracted SDM parameters (IL, Io, Rs, Rsh, a), achieving a mean absolute percentage error (MAPE) below 5% and an R2 of 0.99, confirming the method’s robustness. Experimental results on an 11-year-old LX-80M module revealed moderate degradation (<13%) and demonstrated the system’s ability to capture shading-induced power losses and fill factor collapse, distinguishing between permanent aging and transient faults. A comparative analysis with the recent literature confirms that this integrated, low-cost, and high-accuracy approach bridges the gap between academic PV diagnostics and industrial monitoring needs. The proposed framework provides a foundation on which IoT-enabled predictive maintenance and digital-twin integration could subsequently be built; neither extension was implemented or validated in the present study.
1. Introduction
The rapid global expansion of photovoltaic (PV) energy is a cornerstone of the ongoing transition to sustainable, decarbonized electricity generation [1,2]. By 2030, solar PV is projected to account for a substantial share of new electricity generation capacity, with widespread deployment across residential, commercial, and utility-scale sectors. However, the long-term reliability and efficiency of PV systems remain critical challenges [3]. Modules are continually exposed to variable environmental stresses, including dust deposition and partial shading [4], spectral shifts, thermal cycling, and material aging [5]. These stressors lead to diverse degradation pathways, including increased series resistance, reduced shunt resistance, hotspot formation, delamination, and potential-induced degradation (PID) [6]. If undetected, these issues cause irreversible energy yield losses, accelerated module aging, and, in some cases, safety hazards [7,8].
Traditional PV monitoring practices rely primarily on periodic visual inspections or string-level power measurements, which are often insufficient for early fault detection [9,10]. Conventional methods can generally be classified into electrical-based approaches, such as I–V curve tracing and power curve analysis, and visual or thermal approaches, including infrared thermography, electroluminescence (EL), and ultraviolet fluorescence imaging [11,12]. While visual and thermal methods offer high diagnostic resolution, they are costly, intrusive, and not suitable for continuous field monitoring. Electrical-based methods, by contrast, are non-invasive and field-deployable but have historically lacked robust real-time capability and adequate environmental correction to distinguish actual faults from performance variations due to changing operating conditions [13].
In recent years, intelligent PV fault detection and monitoring has advanced significantly. Imaging-based deep learning methods, leveraging convolutional neural networks (CNNs), ConvMixer, and hybrid HoG-based deep learning models, can identify microcracks, hotspots, and PID in infrared and EL images [14]. However, these methods require large datasets and controlled acquisition conditions, which limit their practicality for continuous monitoring [15]. A complementary trend has been the transformation of I–V and P–V curves into graphical domains, such as Gramian Angular Difference Fields and Markov Transition Fields, enabling AI models to classify compound faults and environmental anomalies. At the same time, the adoption of Internet of Things (IoT) architectures and digital twins has enabled panel-level sensing, real-time data streaming, and predictive modeling. LoRa- and BLE-based nodes with edge computing have been deployed for anomaly detection, while digital twins integrate sensor data with simulation to support predictive maintenance strategies [16].
Alongside these sensing and AI innovations, metaheuristic and probabilistic parameter estimation techniques have gained prominence for their ability to extract single-diode model (SDM) parameters under real operating conditions [17]. Algorithms such as Teaching–Learning-Based Optimization (TLBO) and Bayesian inference can estimate photocurrent, reverse saturation current, series and shunt resistances, and the diode ideality factor directly from field data. These techniques enable early identification of degradation trends without requiring high-cost instrumentation or laboratory I–V characterization [18].
Despite these advancements, current approaches face notable limitations [19]. Many AI- and imaging-based techniques remain confined to laboratory validation, with limited translation into field-ready, real-time systems. Methods that rely solely on raw I–V data often lack robust environmental correction, making degradation assessments ambiguous. Furthermore, few frameworks unify real-time I–V acquisition, standardization to reference conditions, and physics-informed parameter extraction into a cost-effective, scalable solution suitable for industrial deployment [20,21].
To address these gaps, this study proposes a hybrid, field-deployable methodology for PV module monitoring and fault diagnosis. The approach combines low-cost, real-time I–V acquisition with an open-source I-V Swinger and IEC 60891-based standardization to translate curves from operating to standard test conditions, ensuring accurate performance and degradation assessment. Concurrently, the TLBO metaheuristic extracts SDM parameters, revealing underlying fault signatures and quantifying the evolution of series and shunt resistance. The system is experimentally validated under multiple scenarios, including low irradiance, elevated temperature, and partial shading, using an 11-year-old LX-80M module to assess both short-term fault sensitivity and long-term degradation. By integrating real-time monitoring, standardized performance evaluation, and robust parameter estimation, this work bridges the gap between academic PV diagnostics and industrial predictive maintenance and establishes a basis for developing IoT-enabled and digital-twin-assisted solar asset management.
The proposed framework is evaluated in two complementary stages: (i) the monitoring and IEC 60891 standardization stage using an 11-year-old LX-80M field-aged monocrystalline module, and (ii) the TLBO-based SDM parameter estimation stage using the HIT Power 240S module, for which complete reference SDM parameters are available from the manufacturer’s datasheet.
The remainder of this paper is organized as follows. Section 2 presents the system architecture, including the I-V Swinger hardware, the LX-80M module specifications, and the environmental sensor configuration. Section 3 describes the experimental framework, detailing the IEC 60891 standardization procedure (Section 3.1), the TLBO algorithm implementation and search space definition (Section 3.2), and the experimental protocol (Section 3.3). Section 4 presents and discusses the results, organized into standardization results using IEC 60891 (Section 4.1) and TLBO-based SDM parameter estimation (Section 4.2). Section 5 concludes the study with key findings, limitations, and directions for future work.
2. System Overview
The experimental framework developed in this study integrates real-time I–V curve acquisition, environmental data monitoring, standardized performance evaluation, and computational parameter extraction to provide a comprehensive approach to photovoltaic (PV) module fault detection and degradation analysis. At its core, the system is designed to bridge the gap between laboratory-grade diagnostics and cost-effective field implementation [5,22].
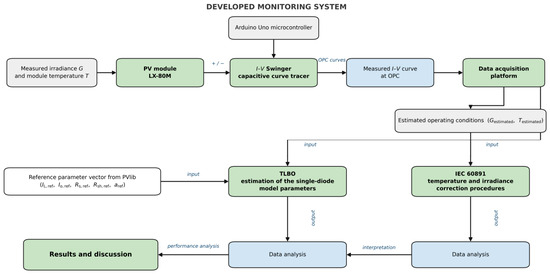
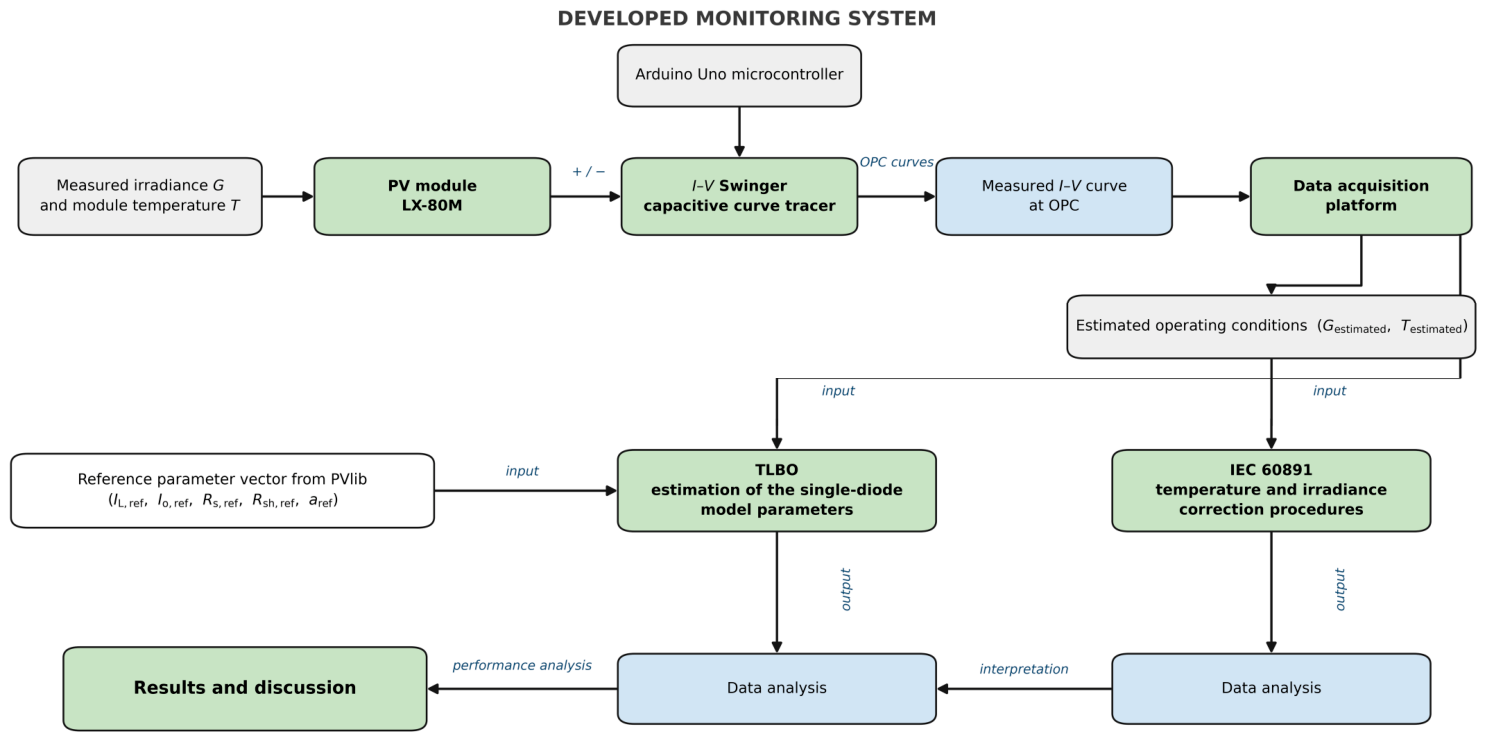
A real-time I–V monitoring system was constructed using an open-source I-V Swinger [22], which operates on the principle of capacitive load tracing to obtain current–voltage (I–V) characteristics of PV modules under outdoor conditions, as shown in Figure 1. The capacitive load tracing method works as follows. The I-V Swinger employs a capacitor as a dynamic load. When the capacitor is initially uncharged, it behaves as a short circuit, drawing the module’s short-circuit current (ISC) while the voltage across the module is zero. As the capacitor charges, the voltage across it rises, and the current decreases along the module’s I–V characteristic. When the capacitor is fully charged, the voltage reaches the open-circuit voltage (VOC) and the current approaches zero. The resulting current–voltage trajectory traces the full I–V curve within a fraction of a second, with the sweep speed determined by the capacitance value and the module’s internal resistance. Between measurements, a bleed resistor and an SPDT (single-pole double-throw) switch discharge the capacitor to ensure repeatable measurements. The hardware setup consisted of an Arduino Uno microcontroller for data acquisition, interfaced with high-accuracy voltage and current sensors, as well as temperature and irradiance sensors for environmental monitoring. The module back-surface temperature was measured using a thermocouple attached to the rear side of the module with thermally conductive adhesive. The ambient temperature was measured using a shielded temperature sensor co-located with the irradiance sensor. This configuration enabled synchronized measurement of the I–V curve, module surface temperature, and plane-of-array irradiance, all of which are critical for accurate performance assessment. Compared with commercial I–V tracers, the adopted system offers a low-cost, portable, and field-ready alternative that can be deployed for both research and operational monitoring.
Figure 1.
Developed Monitoring System.
To account for environmental variability, IEC 60891 standardization procedures were employed to convert I–V curves measured under operating conditions (OPC) to standard test conditions (STC) [23]. This correction is essential for distinguishing true performance degradation from transient environmental effects [24]. The procedure involved applying temperature and irradiance corrections to the measured current and voltage values, thereby transforming OPC curves into their STC equivalents [25]. These standardized curves enabled consistent evaluation of key performance indicators [26], including maximum power (Pmax), open-circuit voltage (Voc), short-circuit current (Isc), and fill factor (FF), as well as the quantification of power loss and degradation rates over time [13,25].
To complement the standardization process, Teaching–Learning-Based Optimization (TLBO) was implemented to extract parameters of the Single Diode Model (SDM), which serves as a physics-informed representation of PV module behavior [27,28,29]. The SDM comprises the photocurrent (IL), diode reverse saturation current (Io), series resistance (Rs), shunt resistance (Rsh), and diode ideality factor (a). Accurately estimating these parameters under real operating conditions is crucial for detecting early signs of degradation, such as the gradual increase in Rs due to contact aging or the reduction in Rsh indicative of leakage paths and microcracks. TLBO, a population-based metaheuristic inspired by the teacher–student dynamic in a classroom, was selected for its fast convergence, minimal parameter tuning, and robustness against local minima, making it well-suited for non-linear PV modeling [17,30,31,32,33].
The experimental validation was conducted on an 11-year-old LX-80M monocrystalline module, representative of long-term field-aged PV hardware. Multiple test scenarios were designed to evaluate the system’s diagnostic capability under realistic conditions: (i) nominal irradiance and temperature, (ii) low irradiance simulating cloudy conditions, (iii) elevated temperature under strong solar exposure, and (iv) partial shading to emulate common operational faults. In each scenario, we collected real-time I–V curves, corrected them to STC per IEC 60891 procedures, and analyzed them using TLBO-based SDM parameter extraction. Combining curve standardization and parameter estimation enabled not only quantification of performance deviations but also identification of underlying fault mechanisms, as reflected in changes in the extracted parameters.
By integrating real-time acquisition, environmental correction, and metaheuristic parameter identification, the proposed methodology provides a comprehensive, scalable diagnostic framework. It enables both immediate fault detection, such as shading-induced power losses and fill-factor collapse, and longer-term degradation tracking via the evolution of SDM parameters, offering a practical pathway to predictive PV maintenance.
The module used in this study belongs to the Solo Line Island PV module family manufactured by Luxor Solar (Stuttgart, Germany). The LX-80M, which has been in operation for 11 years, has 36 series-connected monocrystalline silicon cells and consists of two cell arrays, each with 18 cells in series, with one bypass diode per cell array in parallel. The module was installed in Annaba, Algeria, which has a Mediterranean climate with average annual temperatures of approximately 18 °C and typical annual irradiance of 4.5–5.5 kWh/m2/day. The module was operated as part of a small-scale residential installation with a nominal string voltage of approximately 24 V (single module). Table 1 lists the main parameters of the PV modules.
Table 1.
Electrical and Thermal characteristics of the PV module (LX-80M).
The I-V Swinger, originally designed by Chris Satterlee [22] as an educational tool for PV characterization, is rated for up to 80 V and 10 A.
3. Experimental Framework
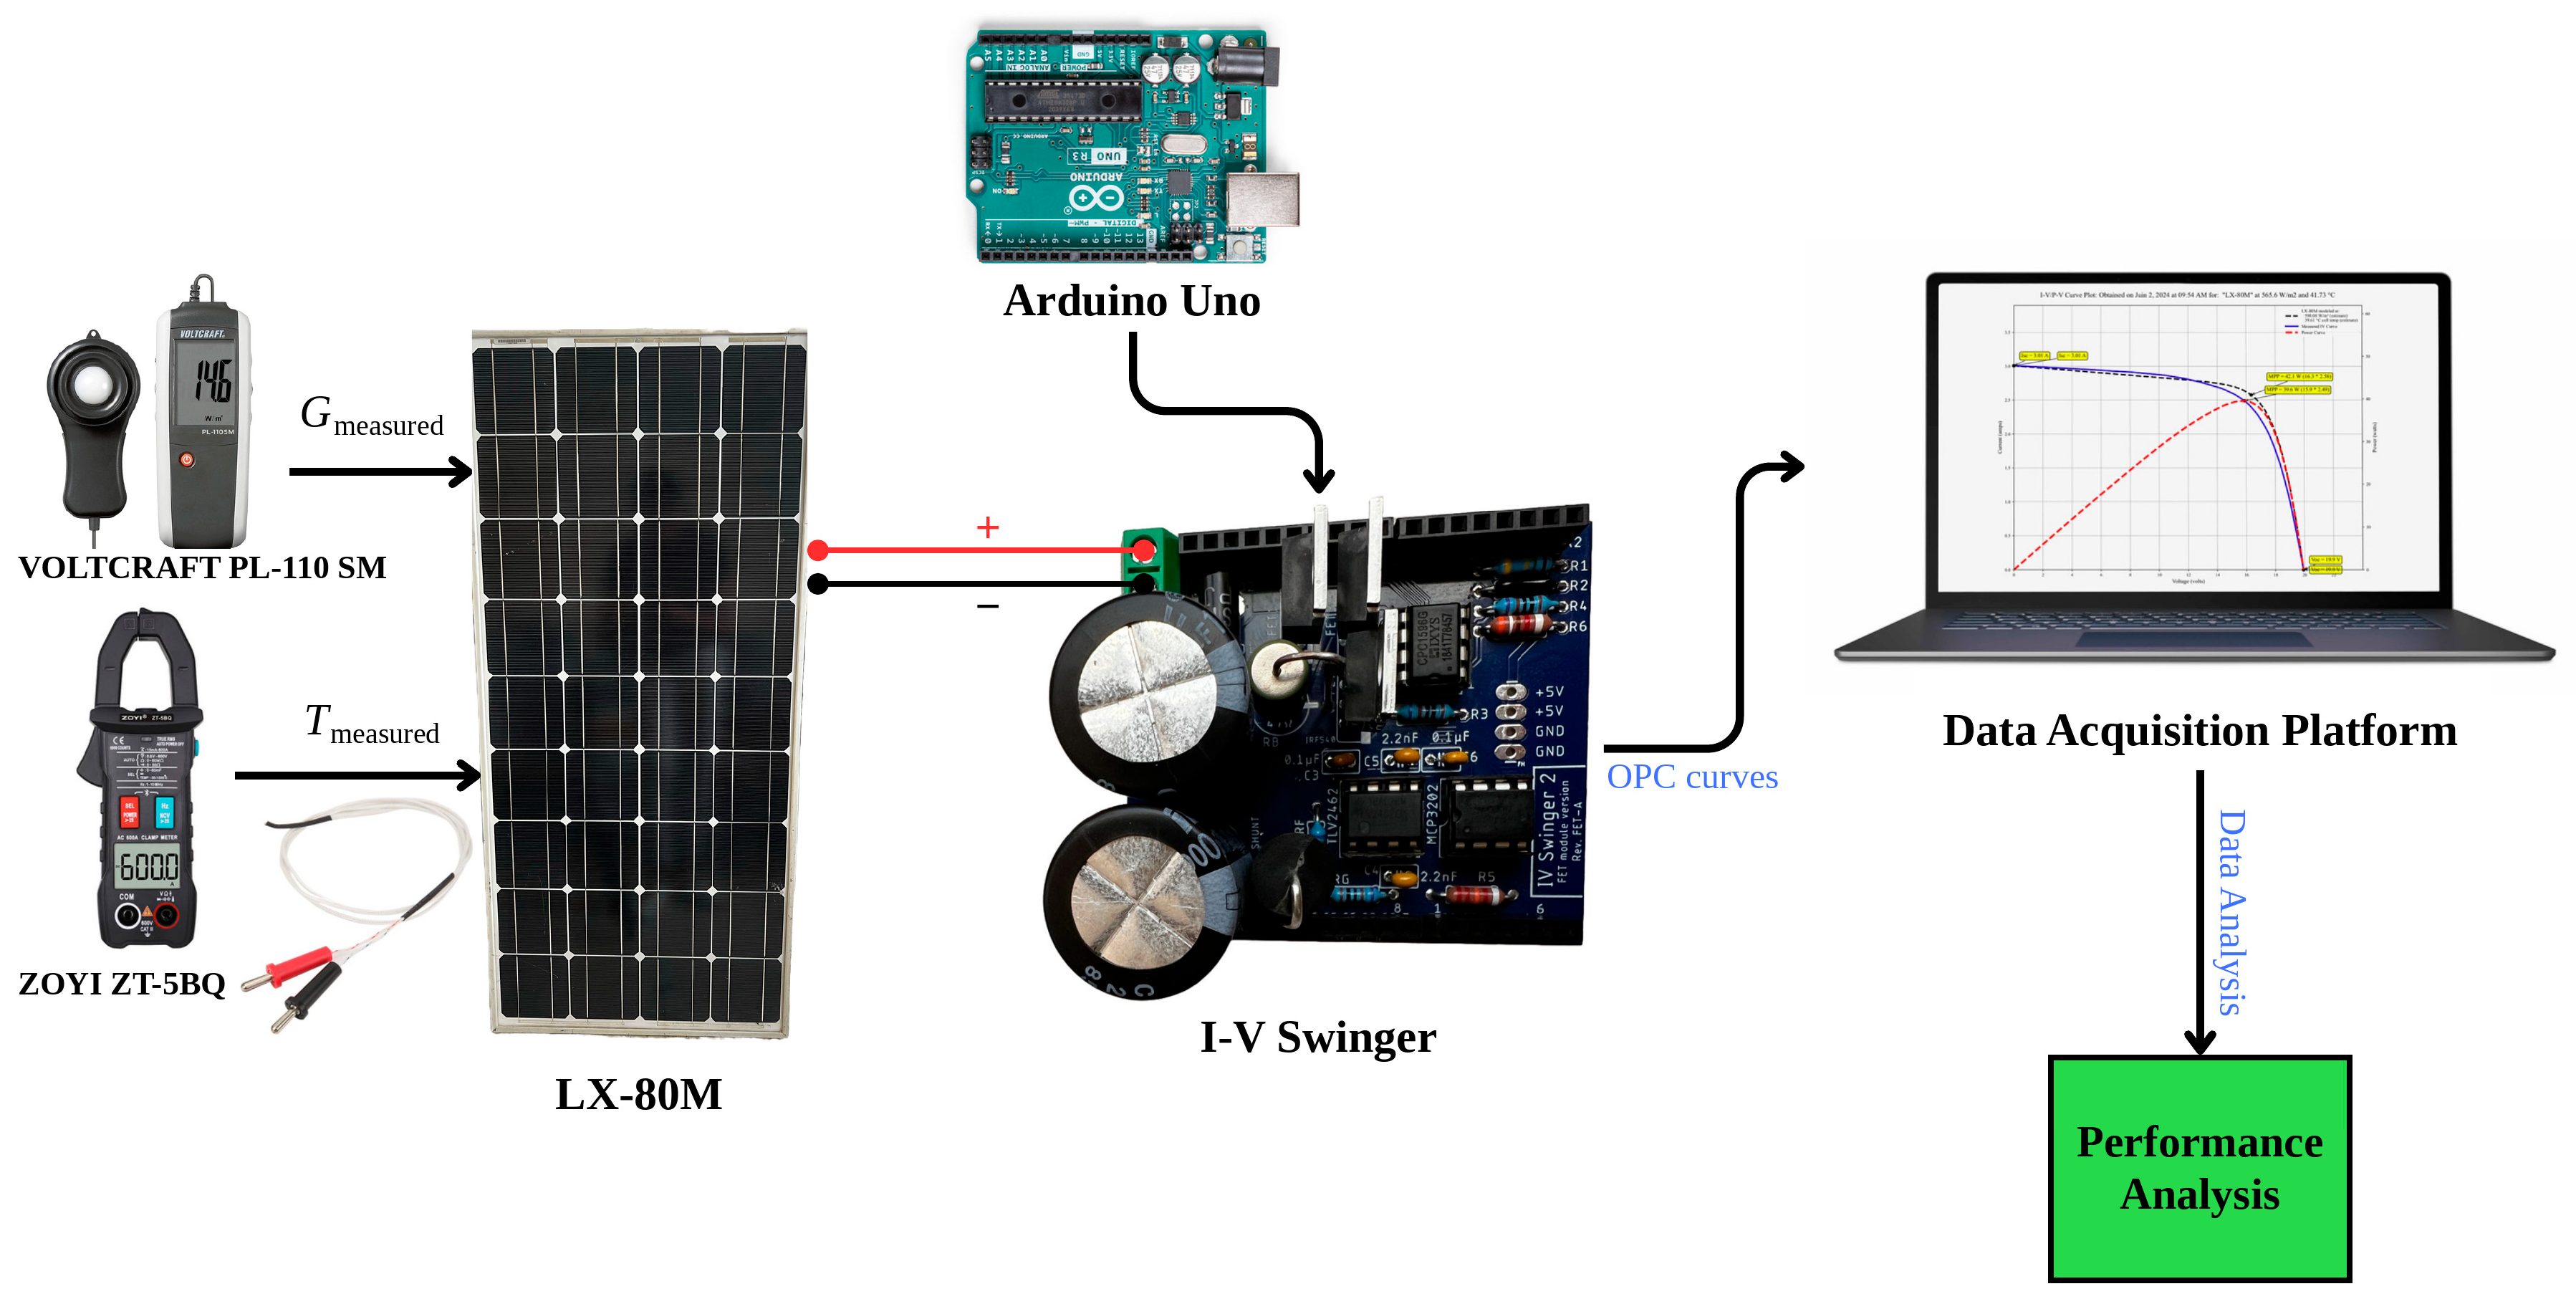
The experimental framework is a critical component that outlines the methodologies and tools. This chapter details the experimental apparatus setup, the procedures followed, and the specific tests conducted to collect data. The framework includes advanced tools such as the I-V Swinger, an Arduino Uno, and various sensors to measure voltage, current, and environmental conditions. These tools enable monitoring and analysis, ensuring that the collected data is comprehensive and precise.
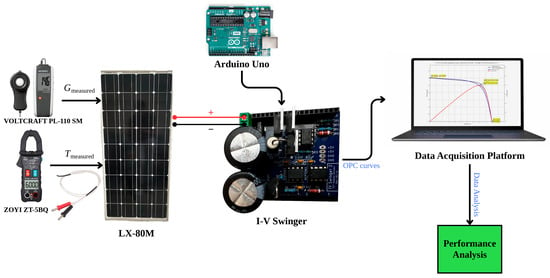
Figure 2 shows the implemented built-in real-time monitoring system.
Figure 2.
Schematic of the Experimental Setup.
3.1. IEC 60891
The IEC 60891 standard [23] provides procedures for correcting the measured current–voltage (I–V) characteristics of photovoltaic devices to reference conditions, typically standard test conditions (STC: 1000 W/m2, 25 °C, AM 1.5). This correction is essential for distinguishing true performance degradation from transient environmental effects, as I–V curves measured under operating conditions (OPC) are influenced by varying irradiance and temperature. The standard defines four correction methods; this study adopts Procedure 2, which is based on the simplified one-diode model and is the most widely used method in commercial I–V curve tracers [34]. The procedure applies temperature and irradiance corrections to the measured current and voltage values using six correction parameters derived from I–V curves measured at different conditions. The corrected STC-equivalent curve enables consistent evaluation of key performance indicators—maximum power (Pmax), open-circuit voltage (Voc), short-circuit current (Isc), and fill factor (FF) and helps quantify power loss and degradation rates over time [25].
Performance analysis and solar degradation control can be achieved by comparing two I–V curves: one measured on-site at operating conditions (OPC) and the other stated in the manufacturer’s datasheet (standard test conditions, STC). To make such a thing possible, OPC curves must be translated into STC curves. A possible translation procedure using IEC 60891 can be performed. An international standard that focuses on methods for correcting the measured current–voltage (I–V) characteristics of PV devices for variations in temperature and irradiance [23,24]. On-site, solar characteristics can be acquired using commercial I–V curve tracers in accordance with IEC 60891 [20]; in this study, the I-V Swinger is used to measure I–V curves at OPC.
The international standard IEC 60891 defines four distinct correction methods and outlines how to identify the pertinent parameters for each. Most commercial I–V curve tracers adhere to the second correction method; hence, this approach will be the only one examined in this study [34].
This procedure is based on the simplified one-diode model of PV devices. The semi-empirical translation formulae contain six I–V curve correction parameters, which can be determined by measuring I–V curves at different temperatures and irradiance levels. Besides the relative temperature coefficients for short-circuit current (αrel) and open-circuit voltage (βrel), an additional temperature coefficient (k′) is commonly used, which accounts for changes in the internal series resistance (and fill factor) with temperature.
The correction procedure is defined by Equations (1)–(3), which give the corrected current, the corrected voltage, and the temperature-corrected internal series resistance, respectively:
In Equations (1)–(3), (, ) are the coordinates of points on the measured I–V characteristic. The resistance term appearing in Equation (2) is itself obtained from Equation (3); (V2, I2) are the coordinates of the corresponding points on the corrected I–V curve; G1 is the irradiance as measured with the reference device, corrected for temperature and linearity of the reference device; G2 is the target irradiance for the corrected I–V characteristic.
The internal series resistance R′s at 25 °C is determined using both the mathematical model of the I-V Swinger and the PVlib Python package (v0.10.4), by fitting the SDM parameters according to the California Energy Commission (CEC) and System Advisor Model (SAM) methodologies for a given solar module. The CEC methodology refers to the module performance model and the associated database of validated module parameters maintained by the California Energy Commission. SAM is the System Advisor Model developed by the National Renewable Energy Laboratory (NREL), and we access its implementation here through PVlib.
3.2. TLBO
The teaching–learning-based optimization (TLBO) algorithm [17,28,29] is used in this work to extract the single-diode model parameters from measured I–V curves. To validate the TLBO algorithm’s parameter extraction capability, the HIT Power 240S module (Panasonic, Kadoma, Japan) was selected as the reference case. This module was chosen because its manufacturer datasheet provides complete reference SDM parameters—photocurrent (IL), diode saturation current (Io), series resistance (Rs), shunt resistance (Rsh), and ideality factor (a)—derived from the CEC (California Energy Commission) and SAM (System Advisor Model) methodologies. These reference values serve as the ground truth against which the TLBO-estimated parameters are compared. In contrast, the LX-80M module used for the monitoring and standardization experiments does not provide such reference parameters in its datasheet, making direct TLBO validation against known values impossible. The TLBO validation on the HIT Power 240S demonstrates the algorithm’s mathematical robustness, which is transferable to the LX-80M module despite the difference in cell technology (heterojunction vs. monocrystalline silicon), as the Single-Diode Model is technology-agnostic.
PV performance modeling and monitoring are critical for assessing a PV plant’s technical and economic sustainability over its lifespan. Carefully selecting a reliable equivalent circuit model is central to PV modeling. Once the model is selected, several methods exist to determine its parameters.
However, manufacturers typically do not provide SDM parameters, so researchers must estimate them from experimental I–V characteristics, a challenging task because of model non-linearity and the sensitivity of deterministic methods to initialization. However, several methods can estimate these parameters from fundamental I–V characteristics. The deterministic techniques, such as least-squares and Newton–Raphson, are sensitive to initialization and tend to converge to local optima. As a result, increased attention is being paid to population-based (meta)heuristic methods that are more resilient and effective at handling these issues. Most of these heuristic algorithms successfully extract solar cell properties from I–V curve data and are simple to use.
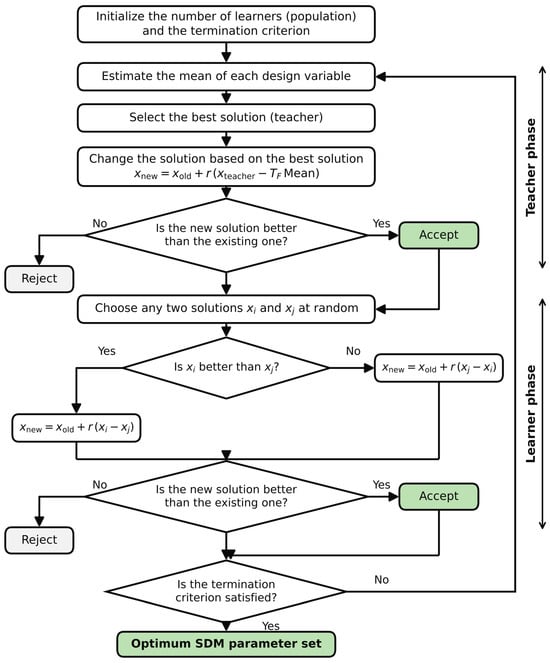
TLBO mimics the influence of teachers on students in a traditional classroom learning process: the teacher (the best solution) shares knowledge with the students (the solution population), and the teacher’s teaching quality affects the students’ grades (fitness values). The Teacher phase and the Learner phase are the two primary stages of the TLBO learning process. During the first phase, the mean student position is computed and shifted toward the teacher’s position, as the teacher is identified as the best solution. The new student position is then computed using Equation (4):
In Equation (4), xi(t) is the previous i-th student’s position, r is a random number between [0, 1], x* is the current teacher’s position, is the mean of the current population, and TF is the teaching factor that is calculated randomly. In the second phase, student i increases its knowledge by interacting with another student, j, randomly selected. The two students i and j are compared according to three rules:
- If both solutions are feasible, then the better fitness value is selected.
- The possible solution is selected if one solution is feasible and the other is infeasible.
- If both solutions are infeasible, then the solution with the minimum transgression of the feasibility constraints is selected.
Student i updates its knowledge if the selected student j has better knowledge. The modification of the student’s knowledge is applied according to Equation (5):
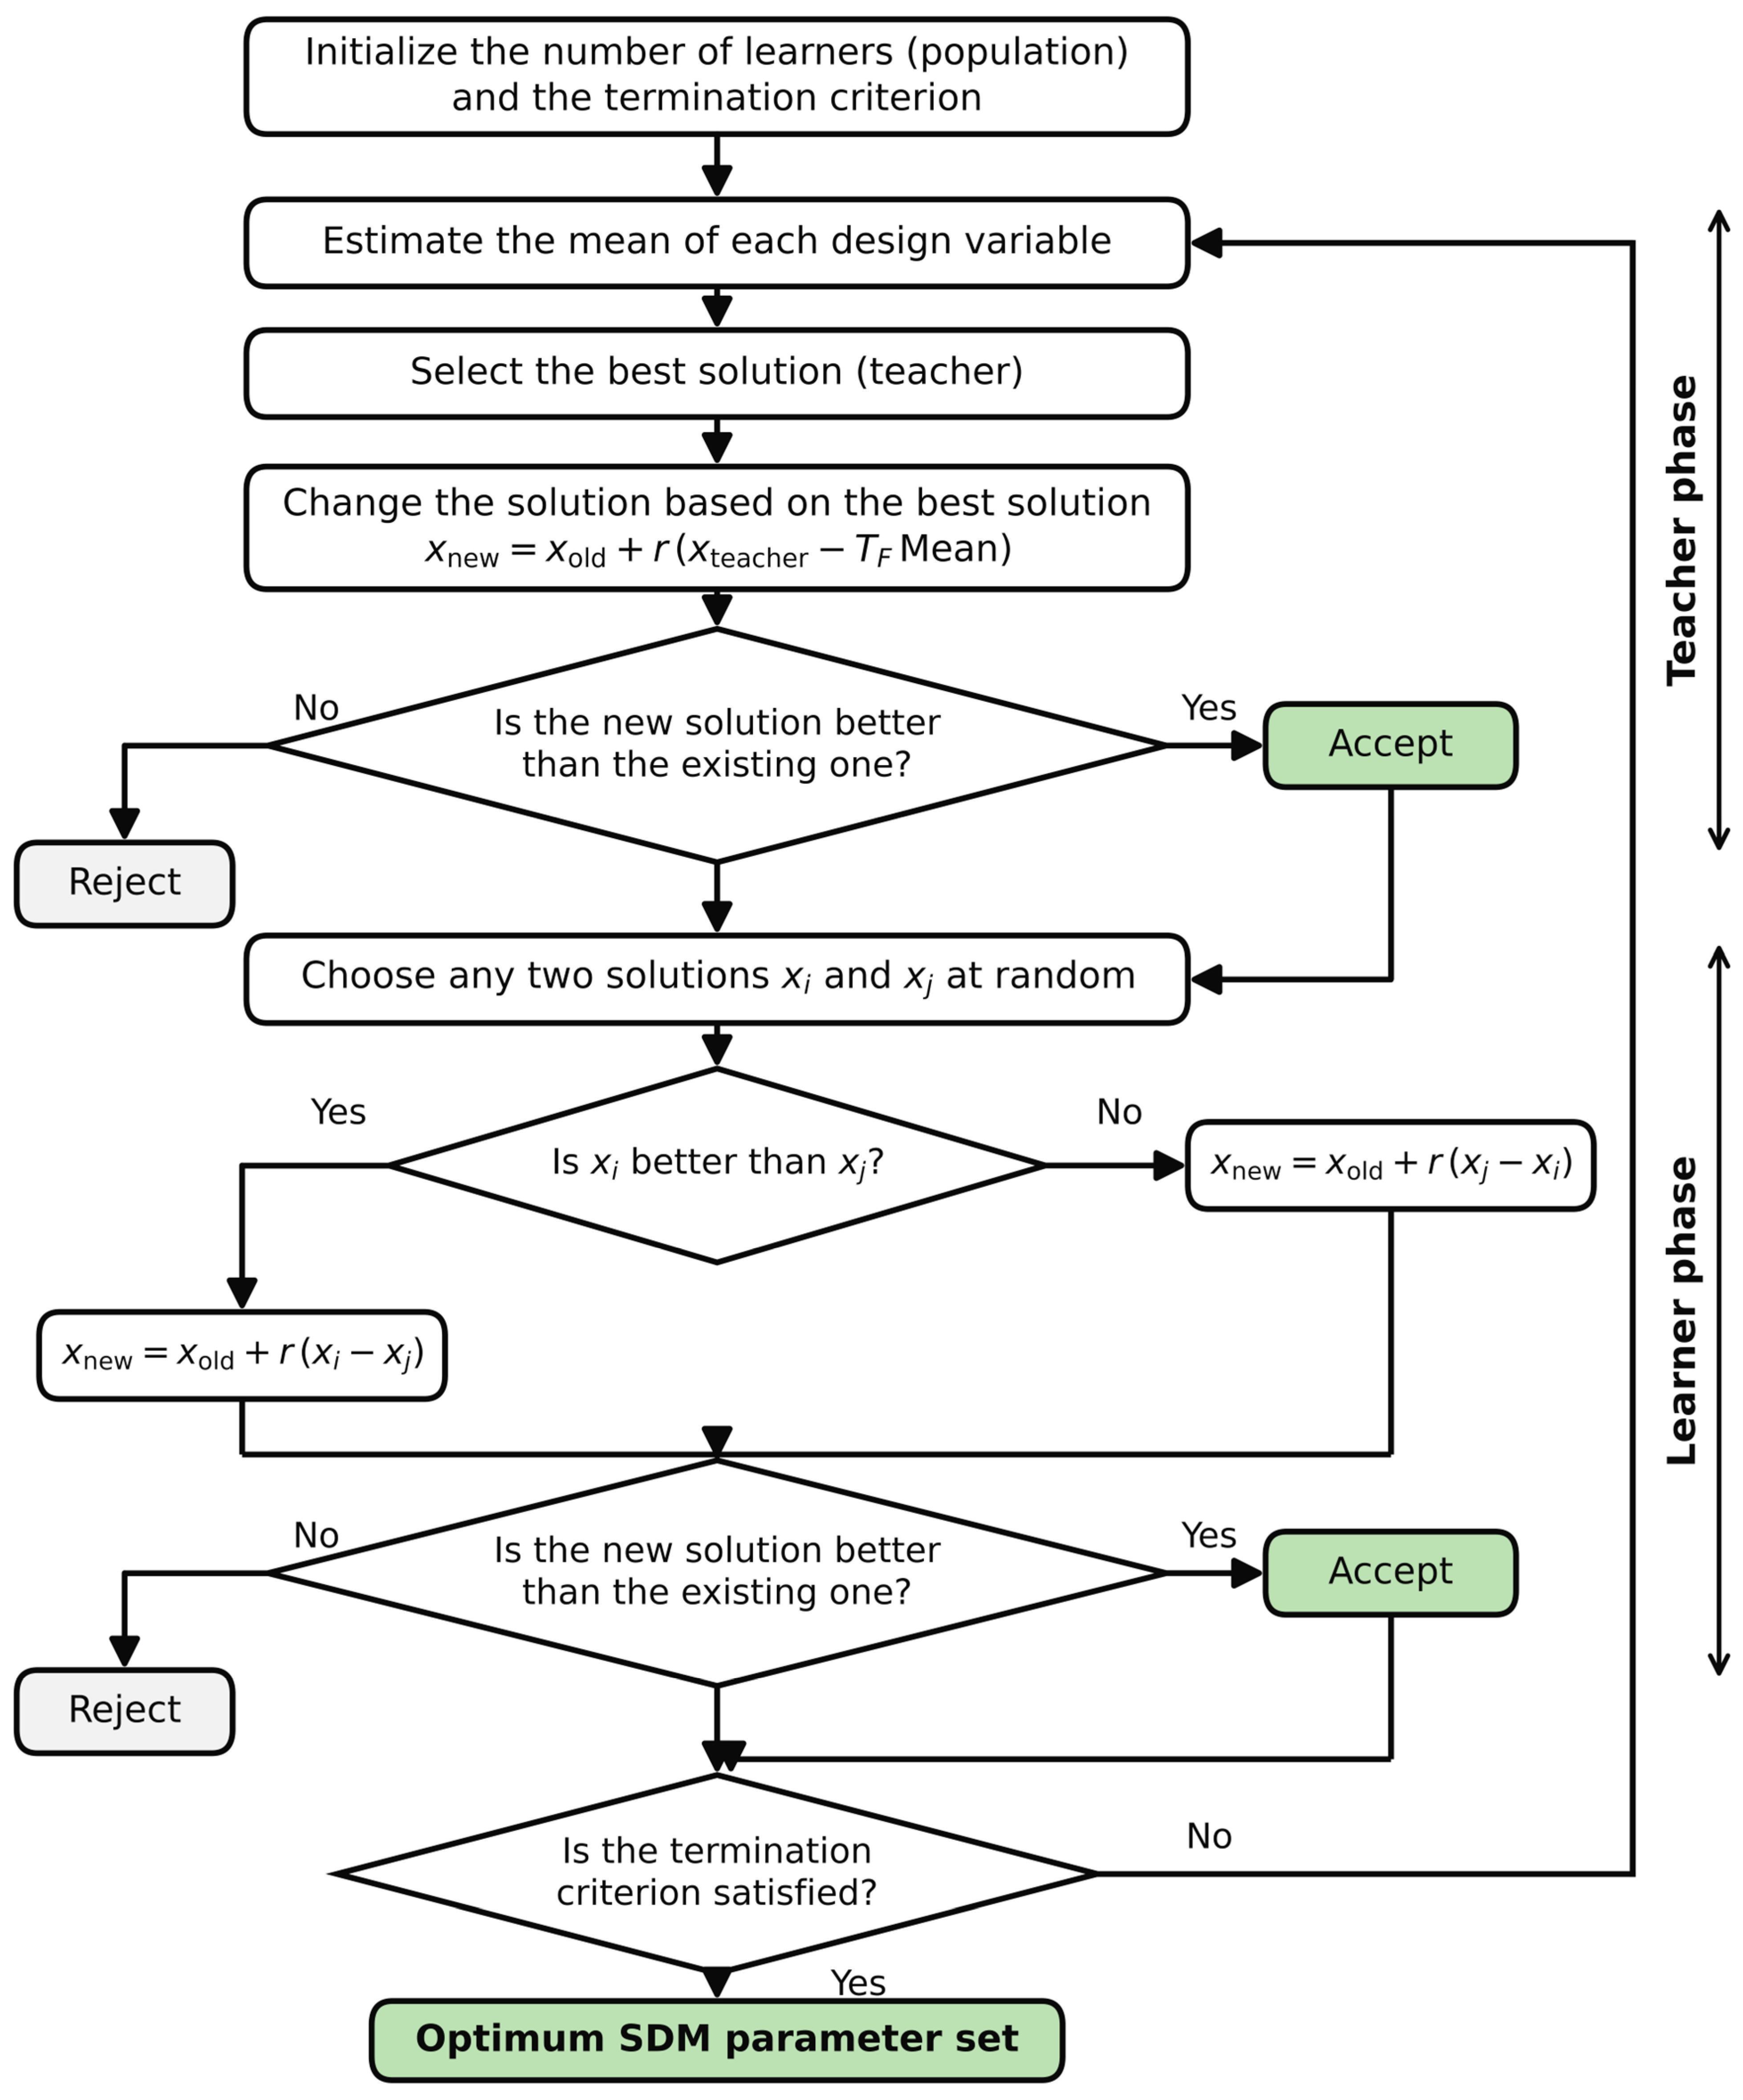
The complete implementation of the TLBO procedure, comprising the teacher phase, the learner phase and the convergence test, is summarized in the flow chart of Figure 3.
Figure 3.
Flow Chart of the TLBO algorithm.
Table 2 outlines the acceptable range for each SDM parameter during the TLBO optimization process. The ranges are defined as follows: Photocurrent (IL): Ranges from half to 1.1 times the reference photocurrent (IL,ref); Diode Saturation Current (Io): Ranges from 0.9 times to 20 times the reference Io,ref; Series Resistance (Rs): Ranges from 0.9 times to 4 times the reference Rs,ref; Shunt Resistance (Rsh): Ranges from 1/20 to 1.1 times the reference Rsh,ref; Ideality Factor (a): Varies between the ideal value determined by both the number of series-connected cells (Ns) and the ideality factor of the solar cell (n).
Table 2.
Baseline Search Domain.
These ranges ensure the optimization process explores a vast yet reasonable space for each parameter, reflecting typical and extreme values observed in real-world PV systems.
By applying power production data to determine solar cell characteristics using the TLBO, we created an accurate performance-monitoring model that enabled us to track changes in the extracted parameters over time. We selected the TLBO technique to establish model parameters that replicate the panel’s actual behavior. Variations from the starting values may indicate PV module performance degradation, such as reduced photocurrent from dust deposition or increased series resistance from aging. A significant drop in photocurrent may indicate a solar cell issue, whereas a sudden rise in series resistance may signal a connection problem.
3.3. Experimental Protocol
Between successive I–V curve acquisitions, the module was maintained at open-circuit conditions (disconnected from any load) to ensure thermal stability and consistent starting conditions. The capacitor load was discharged through the bleed resistor between measurements, as described in Section 2. This procedure minimizes self-heating effects and ensures repeatability of consecutive I–V sweeps.
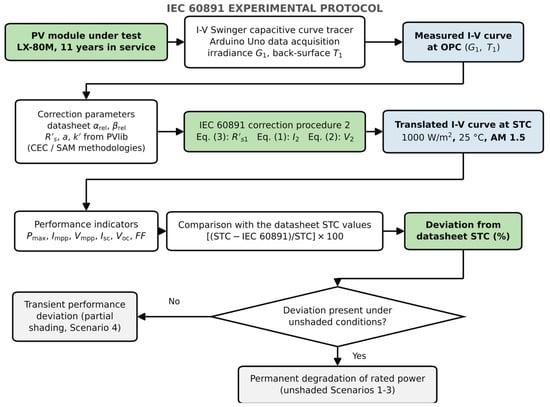
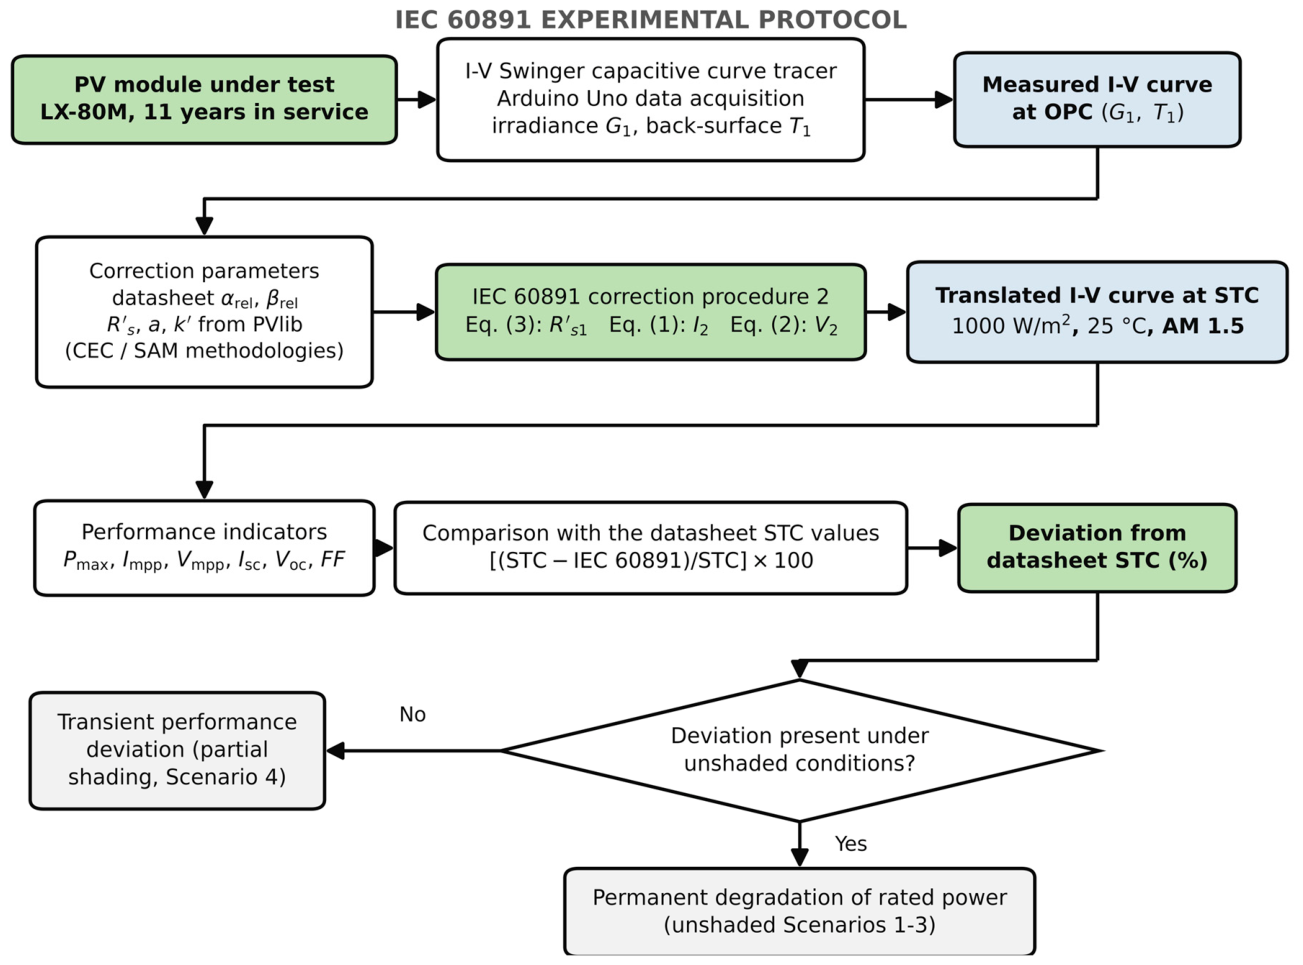
The complete standardization protocol applied to the LX-80M module is summarized in Figure 4. Each curve is acquired with the I–V Swinger together with the plane-of-array irradiance G1 and the back-surface temperature T1 prevailing at that instant. The correction parameters—the relative temperature coefficients αrel and βrel taken from the datasheet, and Rs′, a and k′ obtained with PVlib following the CEC and SAM methodologies—are then applied through IEC 60891 correction procedure 2, using Equations (3), (1) and (2), in that order, to translate the curve to STC. The performance indicators Pmax, Impp, Vmpp, Isc, Voc and FF extracted from the translated curve are compared with the datasheet STC values. A deviation observed under unshaded conditions is attributed to permanent degradation of the rated power, whereas a deviation that accompanies partial shading is reported as a transient performance deviation.
Figure 4.
IEC (International Electrotechnical Commission) 60891 Experimental Protocol.
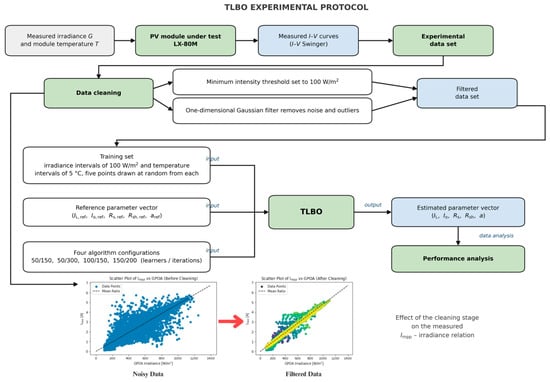
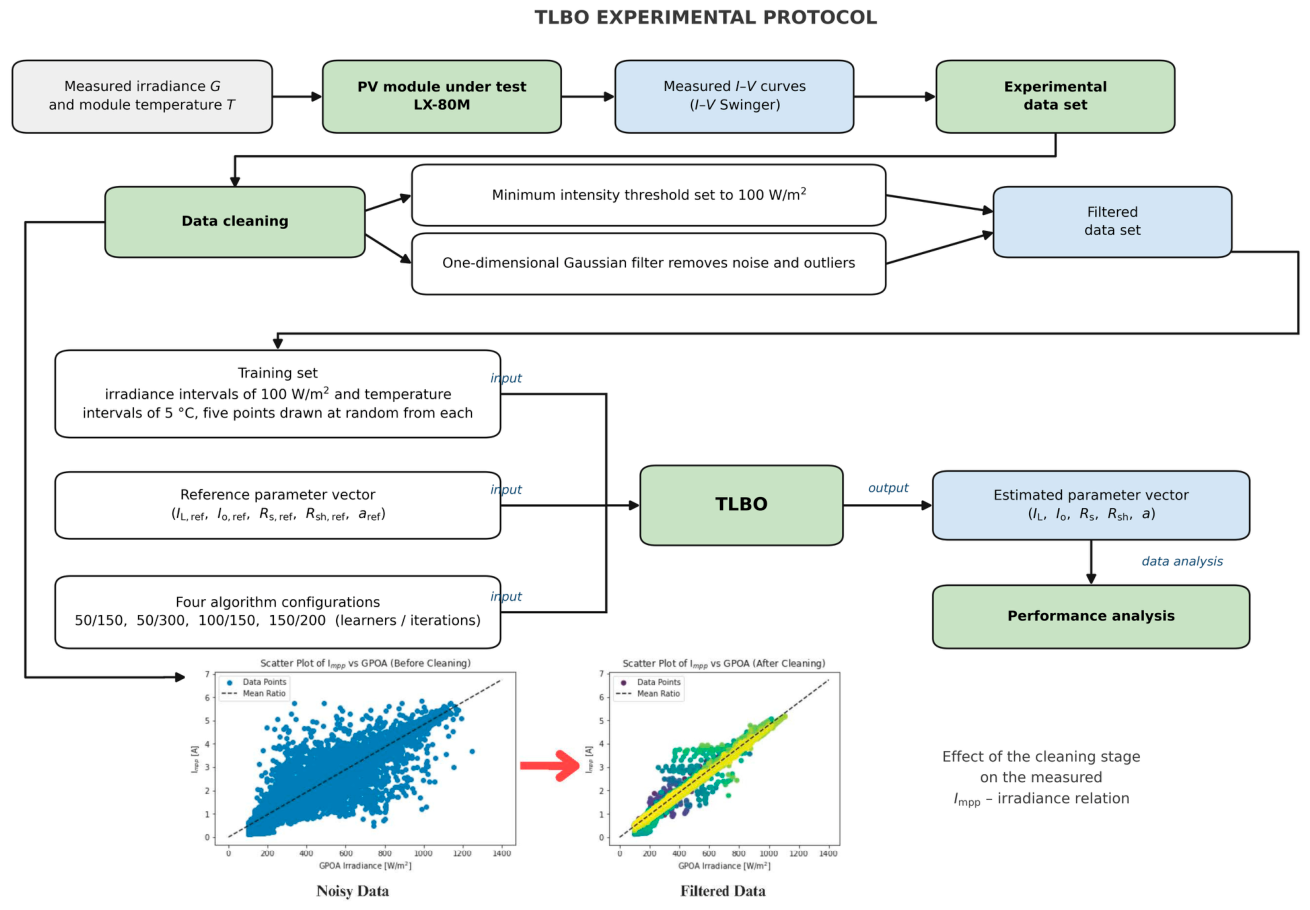
Figure 5 summarizes the corresponding protocol for the parameter-estimation stage. The measured I–V curves and the simultaneously recorded irradiance and temperature form the experimental data set, which passes first through a data-cleaning stage: samples acquired below a minimum intensity threshold of 100 W/m2 are discarded, and a one-dimensional Gaussian filter is applied to suppress noise and outliers, as the two scatter plots of Impp against plane-of-array irradiance at the foot of the figure illustrate. The filtered data set is then partitioned into irradiance intervals of 100 W/m2 and temperature intervals of 5 °C, and five points are drawn at random from each interval to form the training set. This training set, together with the reference parameter vector (IL,ref, Io,ref, Rs,ref, Rsh,ref, aref) that defines the search bounds of Table 2, is supplied to the TLBO algorithm. The algorithm is run under the four configurations of population size and iteration count shown in the figure: 50 learners with 150 iterations, 50 with 300, 100 with 150, and 150 with 200. These four configurations are algorithm settings and are unrelated to the four measurement scenarios defined at the beginning of Section 4. Each run returns the estimated parameter vector (IL, Io, Rs, Rsh, a), which is then passed to the performance-analysis stage.
Figure 5.
TLBO Experimental Protocol.
4. Results and Discussion
The results are presented in two stages: Section 4.1 reports the translation of the measured I–V curves to Standard Test Conditions using IEC 60891, and Section 4.2 reports the estimation of the single-diode model parameters by TLBO. Four measurement scenarios are analysed throughout. All four are outdoor acquisitions on the same field-aged LX-80M module under natural sunlight; they differ in the plane-of-array irradiance and the module temperature prevailing at the moment of acquisition and, in the last case, in the presence of partial shading:
- Scenario 1—unshaded; irradiance 509.12 W/m2, module temperature 42 °C.
- Scenario 2—unshaded; irradiance 730.12 W/m2, module temperature 40 °C.
- Scenario 3—unshaded; irradiance 864.74 W/m2, module temperature 41 °C.
- Scenario 4—2/4 partial shading, one of the two cell arrays fully masked; irradiance 591.76 W/m2, module temperature 62 °C.
Scenarios 1 to 3 therefore isolate the effect of the operating point on an unshaded module, while Scenario 4 superimposes a mismatch fault on it.
4.1. STC Conversion Using IEC 60891
This section establishes the magnitude of the performance deficit of the field-aged LX-80M module by translating each measured I–V curve to Standard Test Conditions (STC: irradiance 1000 W/m2, cell temperature 25 ± 3 °C, spectrum AM 1.5) with IEC 60891 correction procedure 2. The operating conditions (OPC) at which each curve was acquired are those listed at the beginning of this section and differ from one scenario to the next. We assigned k′ = 0; this parameter has minimal impact and can be safely neglected. Table 3 summarizes the standardization results for the LX-80M module across the four scenarios, reporting the measured OPC values, the datasheet STC values, the IEC 60891-corrected values, and the resulting degradation rate.
Rs′ = 0.183339149 Ω, a = 0.06, k′ = 0
Table 3.
Standardization Results (LX-80M).
In Table 3, the values in the ‘Performance Deviation from STC (%)’ column are prefixed with the ± symbol to indicate the magnitude of the deviation from the STC value. This symbol denotes a performance loss relative to STC (e.g., ±8.94% indicates an 8.94% reduction in power), not measurement uncertainty or a symmetric range. Detailed calculation and interpretation are provided in the table footnote.
Scenario 1: The maximum power output Pmax was 33.97 W under operating conditions (OPC) compared to 80 W under standard test conditions (STC). The corrected power output under IEC 60891 standards was 72.84 W, indicating an 8.94% degradation. Under OPC, the current at the maximum power point (Impp) and the voltage at the maximum power point (Vmpp) were lower than under STC. Specifically, Impp was 2.1490 A, and Vmpp was 15.8067 V under OPC. The fill factor, which indicates the quality of the solar cells, was significantly lower under OPC (0.4602) compared to STC (0.735), suggesting that performance under real conditions deviates notably from ideal conditions. The notable decrease in Pmax under OPC can be attributed to elevated temperatures and lower irradiance, which reduce solar cell efficiency.
Scenario 2: Pmax under OPC was 48.61 W, with a corrected value of 71.18 W using IEC 60891, leading to an 11.02% degradation rate. Impp and Vmpp under OPC were 3.1096 A and 15.6311 V, respectively, compared to higher values under STC. The fill factor was slightly higher than in Scenario 1, at 0.6605, but remained below the STC value. This scenario shows a higher Pmax and a better fill factor than Scenario 1 due to higher irradiance levels, though temperature remains a limiting factor. The degradation rate indicates a moderate loss of performance, underscoring the impact of suboptimal irradiance and temperature on solar panel efficiency.
Scenario 3: Pmax was 56.93 W under OPC, with a corrected value of 70.25 W, indicating a 12.19% degradation rate. Impp was 3.6364 A, and Vmpp was 15.6549 V, both lower than their respective STC values. The fill factor was 0.7073, slightly improving over previous scenarios, but still needs to reach the STC level. Despite higher irradiance, the power output and fill factor still lag behind STC values due to the elevated temperature. The degradation rate is the highest among the scenarios, indicating that high temperatures can significantly impair solar panel performance even at high irradiance levels.
Scenario 4: (partial shading): The ‘2/4 shading’ configuration was implemented by covering one complete cell array (18 of the 36 series-connected cells, i.e., half of the module’s active surface area) with an opaque panel. This activates the bypass diode of the shaded array, allowing current from the unshaded array to flow while the shaded cells contribute reduced current, leading to the observed power loss and fill factor collapse.
Pmax dropped significantly to 18.56 W under OPC, with a corrected value of 43.35 W, corresponding to a 45.82% performance deviation from the STC value. Impp was 2.6695 A, and Vmpp was 6.9524 V, both substantially lower than their STC counterparts. The fill factor collapsed to 0.2785, indicating severe shading. Unlike Scenarios 1–3, which reflect permanent degradation due to aging, Scenario 4 represents a transient shading condition. The drastic reduction in power output and fill factor under shaded conditions underscores the severe impact of shading on solar panel performance and demonstrates the system’s ability to detect operational faults.
The results across different scenarios highlight the significant impact of environmental conditions on solar panel performance. Elevated temperatures generally reduce efficiency, as evidenced by lower Pmax and FF values under OPC than under STC. Shading has an even more drastic effect, as evidenced by Scenario 4, where Pmax and FF plummeted. The IEC 60891 correction method provides a valuable means of standardizing measurements to accurately assess degradation rates. According to the manufacturer, the panel used in this study provides an 80% rated power guarantee over 10 years, implying a 20% degradation rate. However, our results showed that the 11-year-old solar panel exhibited no more than 13% degradation in rated power. While it is likely that this panel was not used in a high-volume production process, this does not undermine the good results obtained, indicating that it can be trusted for a range of applications.
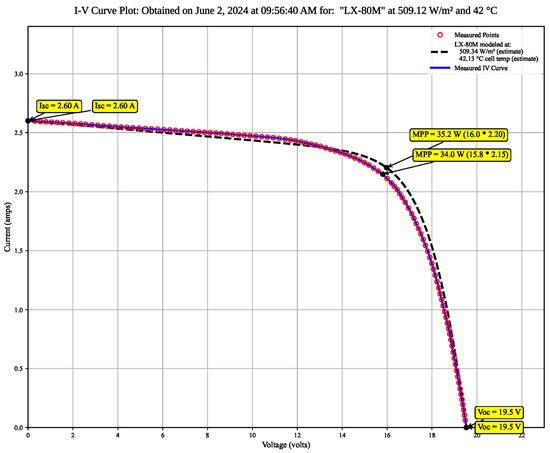
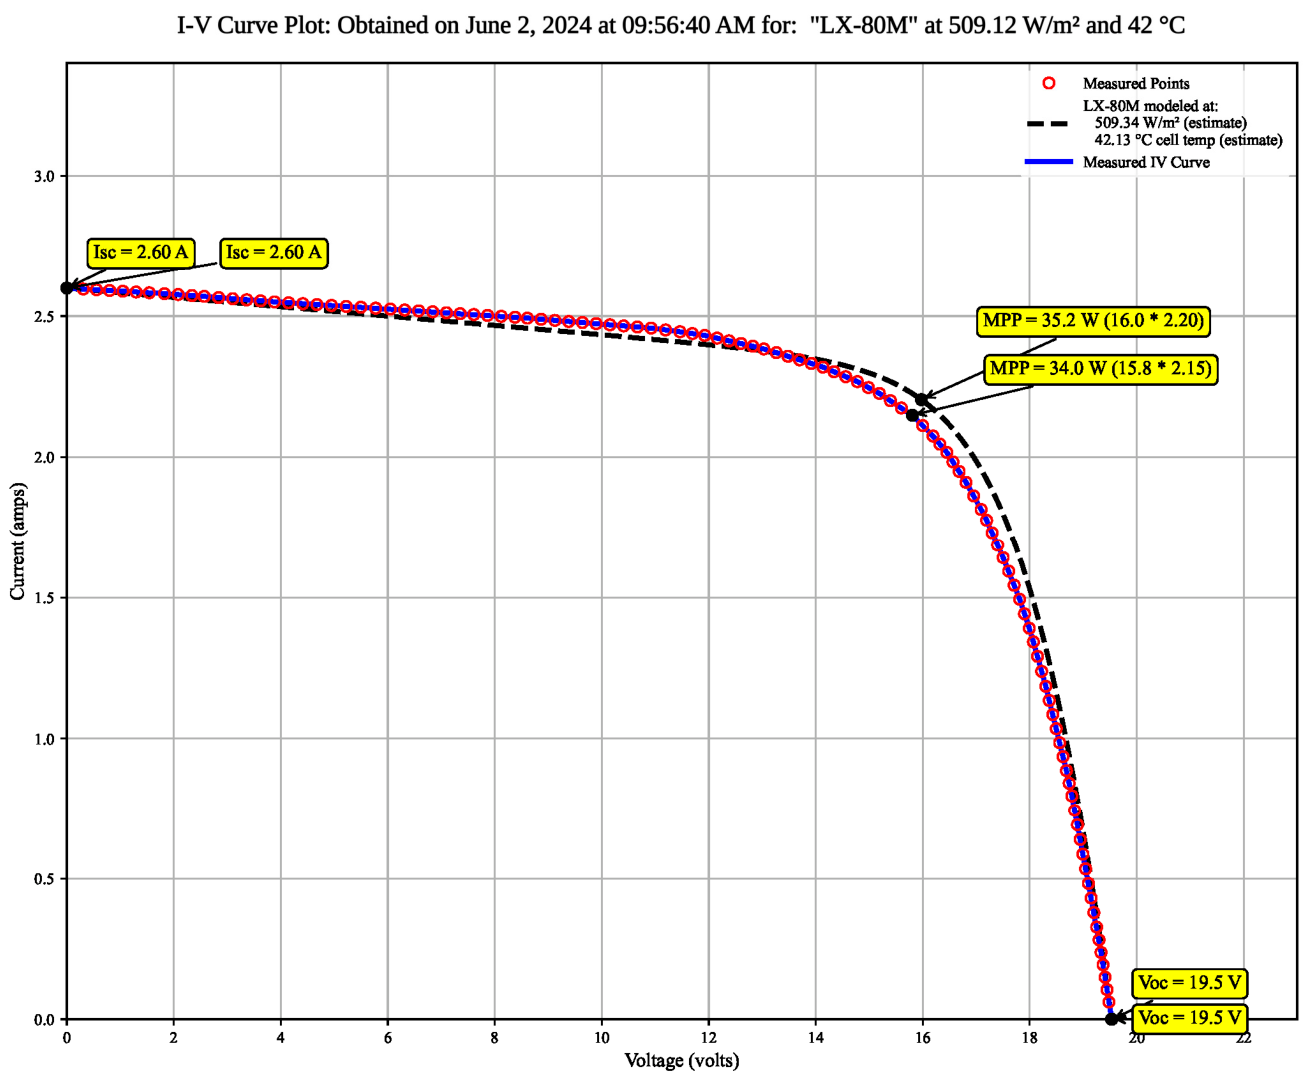
Figure 6 presents the I–V curve of the LX-80M solar module under an irradiance of 509.12 W/m2 and a temperature of 42 °C. The I–V curve shows the relationship between the solar panel’s current and voltage under the given conditions. Pmpp is achieved at a current (Impp) of 2.20 A and a voltage (Vmpp) of 16.0 V, yielding a power output of 35.2 W. Voc and Isc are 19.5 V and 2.60 A, respectively. Compared to the STC values, the I–V curve under OPC shows a noticeable decrease in current and voltage, highlighting the impact of lower irradiance and higher temperature. The reduction in performance under OPC, as shown in the I–V curve, underscores the influence of real-world conditions on solar panels’ efficiency.
Figure 6.
I–V Curve (Scenario 1).
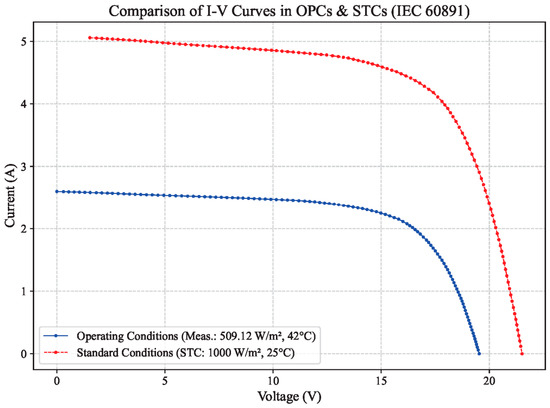
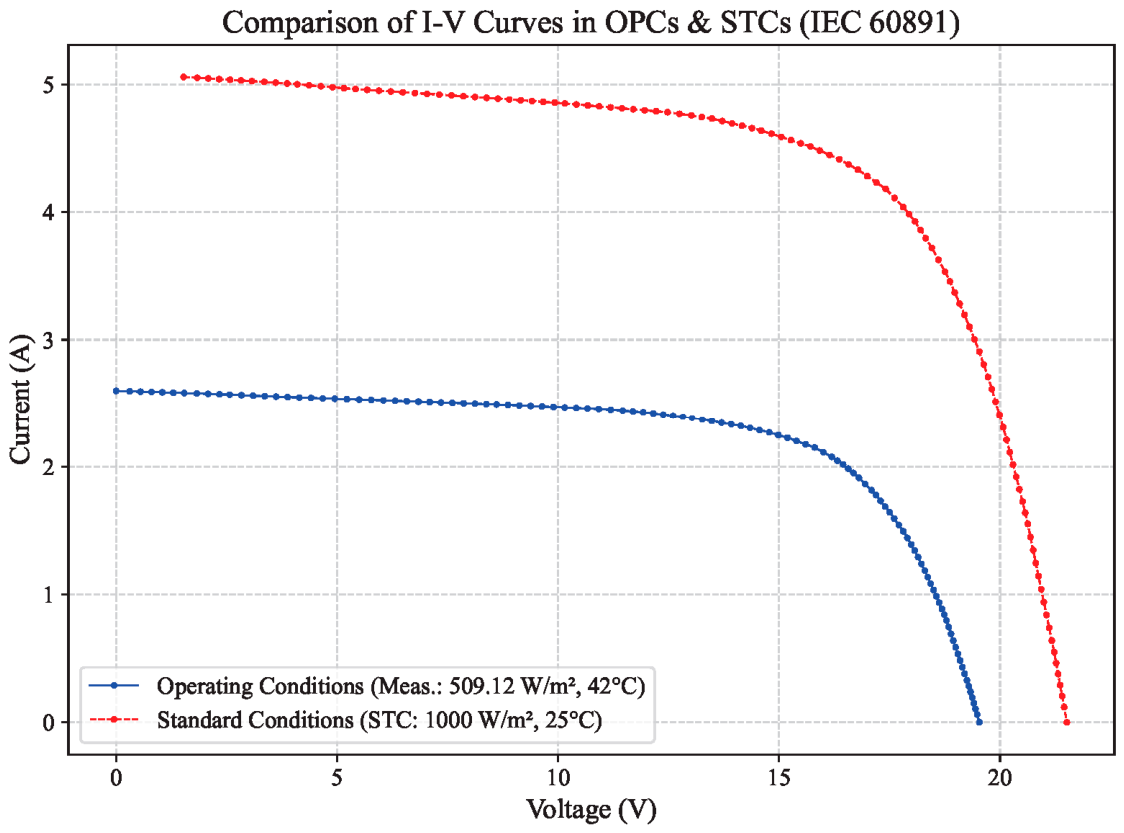
Figure 7 compares the I–V curves obtained under operating conditions (OPCs) with those under standard test conditions (STCs). The I–V curve under OPC (509.12 W/m2, 42 °C) is visibly lower than that under STC (1000 W/m2, 25 °C). The comparison highlights the substantial difference in performance between actual operating conditions and ideal laboratory conditions.
Figure 7.
OPCs vs. STCs (Scenario 1).
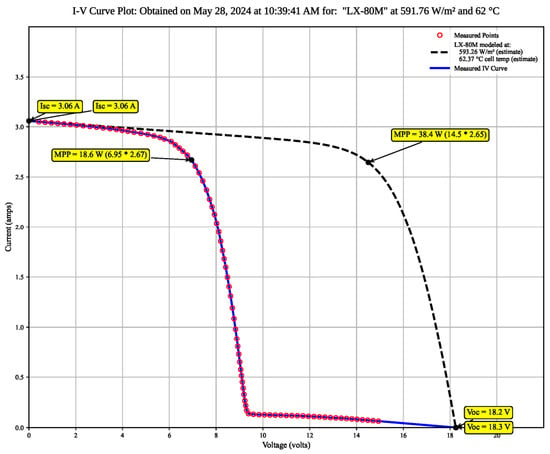
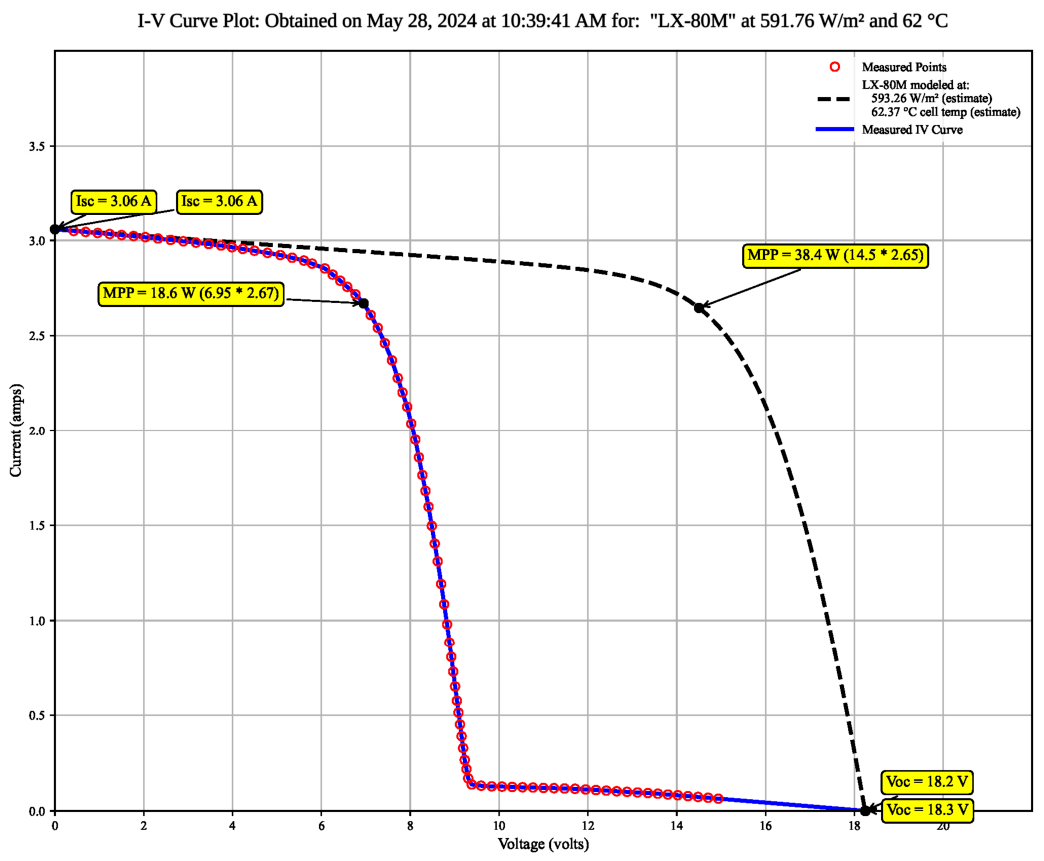
Figure 8 presents the I–V curve of the LX-80M solar module under shaded conditions with an irradiance of 591.76 W/m2 and a temperature of 62 °C. The I–V curve under shaded conditions starkly illustrates how shading can drastically reduce solar panels’ power output and efficiency.
Figure 8.
I–V Curve (Scenario 4).
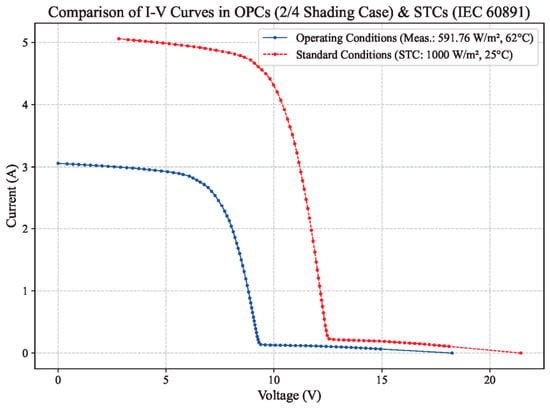
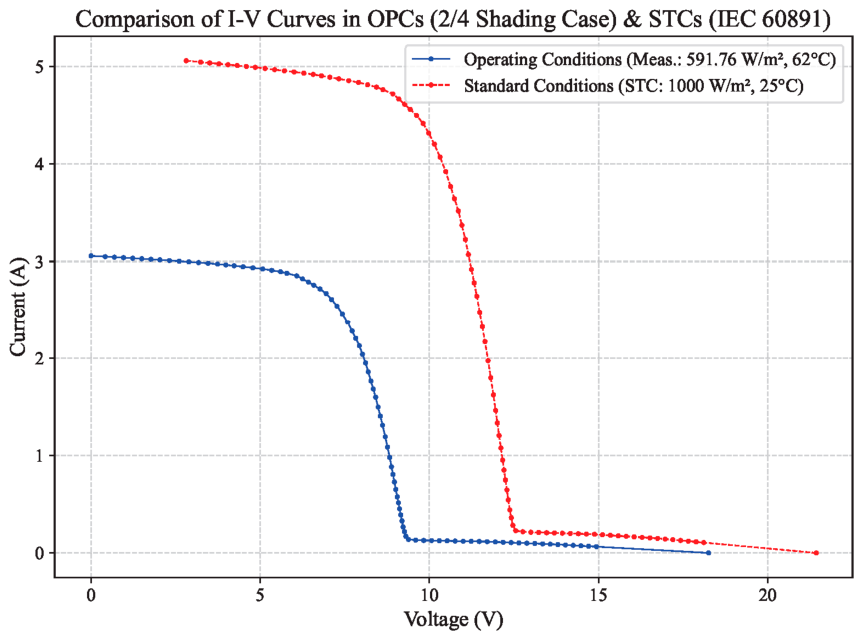
Figure 9 compares the I–V curves under operating conditions (591.76 W/m2, 62 °C, with shading) with those under standard test conditions (STC: 1000 W/m2, 25 °C). The shaded OPC I–V curve is much lower than the STC curve, showing drastic reductions in current and voltage. The fill factor under shading is also significantly reduced, reflecting poor performance.
Figure 9.
OPCs vs. STCs (Scenario 4).
The comparison in this figure underscores the detrimental effect of shading on solar panel performance.
These figures demonstrate the critical need for accurate monitoring and correction techniques to account for environmental impacts on solar panel performance. They reinforce the importance of using standardized methods to effectively evaluate and mitigate performance degradation.
4.2. Estimation of SDM Parameters Using TLBO
All estimates reported in this section are referred to Standard Test Conditions (irradiance 1000 W/m2, cell temperature 25 ± 3 °C, spectrum AM 1.5); the teaching factor was set to TF′ = 2 and the random coefficient to r = 0.2. The TLBO-based SDM parameter estimation stage was evaluated using the HIT Power 240S module, for which complete reference SDM parameters are available from the manufacturer’s datasheet. This module was selected as a validation benchmark to assess the algorithm’s ability to recover known parameters from I–V data, rather than to analyze the degradation of this specific module. The TLBO validation on the HIT Power 240S—which employs heterojunction technology—demonstrates the algorithm’s mathematical robustness. While this technology differs from the conventional monocrystalline silicon of the LX-80M module used in the monitoring stage, the Single-Diode Model structure remains valid for both technologies, as the SDM is a lumped-parameter representation of the cell’s electrical behavior that does not depend on the specific technology. The purpose of this stage is algorithmic validation, not comparative technology analysis. The experimental monitoring and IEC 60891 standardization were performed on the field-aged LX-80M module (Scenarios 1–4, Table 3). The use of two different modules constitutes a limitation of this study, as complete end-to-end validation on a single module was not performed; this limitation is explicitly acknowledged in the Conclusion.
The SDM parameters extracted by the TLBO algorithm under the four configurations are reported in Table 4, together with the reference values and the search bounds. For Scenarios 2–4, the estimated saturation current converges to the upper limit of the admissible range, indicating that this bound is active. Since Io and a are strongly correlated in the single-diode model, the corresponding values should be interpreted jointly rather than as independent estimates.
Table 4.
Validation benchmark of the TLBO estimator: single-diode model parameters extracted for the Panasonic HIT Power 240S reference module under four algorithm configurations, together with the reference values and the admissible search bounds. This table serves algorithm validation only; it does not report parameters of the field-aged LX-80M module analysed in Section 4.1.
Table 4 summarizes the parameters of the Single Diode Model (SDM) estimated using the Teaching–Learning-Based Optimization (TLBO) algorithm. The parameters listed include the photocurrent (IL), the diode saturation current (Io), series resistance (Rs), shunt resistance (Rsh), and the ideality factor (a). These parameters were determined for different scenarios with varying numbers of learners and iterations to optimize the model’s accuracy.
The electrical and thermal characteristics of the HIT Power 240S module used to define the benchmark reference parameters are listed in Table 5.
Table 5.
Electrical and thermal characteristics of the HIT Power 240S reference module (Panasonic), used to define the benchmark parameters of Table 4. The module under experimental test in this study is the LX-80M of Table 1. Standard Test Conditions: Irradiance 1000 W/m2, Temperature 25 °C, AM 1.5.
- Key Observations:
- Photocurrent (IL): The estimated IL values under STC conditions are close to the ideal value (5.8575 A), with slight variations across different scenarios. This indicates that the TLBO algorithm effectively captures the photocurrent under standard conditions.
- Diode Saturation Current (Io): The Io values show more variability, which is expected given the sensitivity of this parameter to changes in temperature and irradiance.
- Series Resistance (Rs): The Rs values are within a reasonable range, though they vary significantly with the number of learners and iterations. This suggests that although the algorithm converges, there remains some sensitivity to the configuration of the optimization process.
- Shunt Resistance (Rsh): The Rsh values are pretty variable, reflecting the challenges in accurately determining this parameter due to its strong dependence on operating conditions.
- Ideality Factor (a): The ideality factor values are consistent across scenarios, indicating stable estimation by the TLBO algorithm.
The TLBO algorithm’s effectiveness in estimating SDM parameters is evident from the consistency and accuracy of the results.
Table 6 evaluates the efficiency of the TLBO algorithm by comparing the fitness values (F(x)) achieved by the best learner across different scenarios. The fitness values are broken down into power (F(x)P), current (F(x)I), and voltage (F(x)V) components:
Table 6.
Evaluation of Algorithm Efficiency.
- Scenario 1: The best learner achieved a total fitness value of 3.17%, with 4.35% for power, 4.38% for current, and 0.79% for voltage.
- Scenario 2: The best learner achieved a similar total fitness value, with minor variations in the component values.
- Scenarios 3 & 4: Consistent performance, indicating reliable algorithm convergence.
The consistent fitness values across scenarios demonstrate the robustness and reliability of the TLBO algorithm in optimizing the SDM parameters. The slight variations among components reflect the algorithm’s sensitivity to various aspects of PV system performance.
Table 7 provides an evaluation of the TLBO algorithm’s effectiveness, using Mean Absolute Percentage Error (MAPE) and R-squared (R2) metrics for assessing power (P), current (I), and voltage (V):
Table 7.
MAPE & R2: Performance Assessment.
- Scenario 1: MAPE for power (PMAPE) is 4.30%, and R2 (PR2) is 0.99. Similarly, high accuracy is observed for current (IMAPE: 4.47%, IR2: 0.99%) and voltage (VMAPE: 0.88%, VR2: 0.80%).
- Scenarios 2 & 3 & 4: Consistent MAPE and R2 values, indicating reliable model performance across different scenarios.
The high R2 values close to 1 across all scenarios indicate excellent model fit, while the low MAPE values indicate the accurate prediction of PV system performance. These metrics confirm the TLBO algorithm’s capability to accurately estimate SDM parameters and predict PV performance under various conditions.
The coefficient of determination is reported separately for power, current and voltage because the three quantities are fitted over very different dynamic ranges. Power and current vary by more than two orders of magnitude along the measured I–V curve, so a model that reproduces the curve shape returns R2 close to 0.99 for both. The voltage, by contrast, spans only the narrow interval between the maximum-power point and the open-circuit point, and most of the acquired points lie in the nearly horizontal current-limited region, where a small current error maps onto a comparatively large voltage error. The variance of the voltage data is therefore small, and R2, which normalises the residual by that variance, is correspondingly more sensitive: the values of 0.80–0.81 obtained here correspond to a mean absolute percentage error below 0.9% in voltage, which is the more informative accuracy indicator in this regime. The lower voltage R2 should thus be read as a consequence of the limited voltage variance rather than as a poor fit of the model.
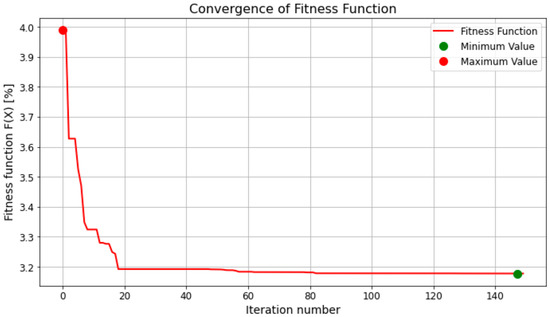
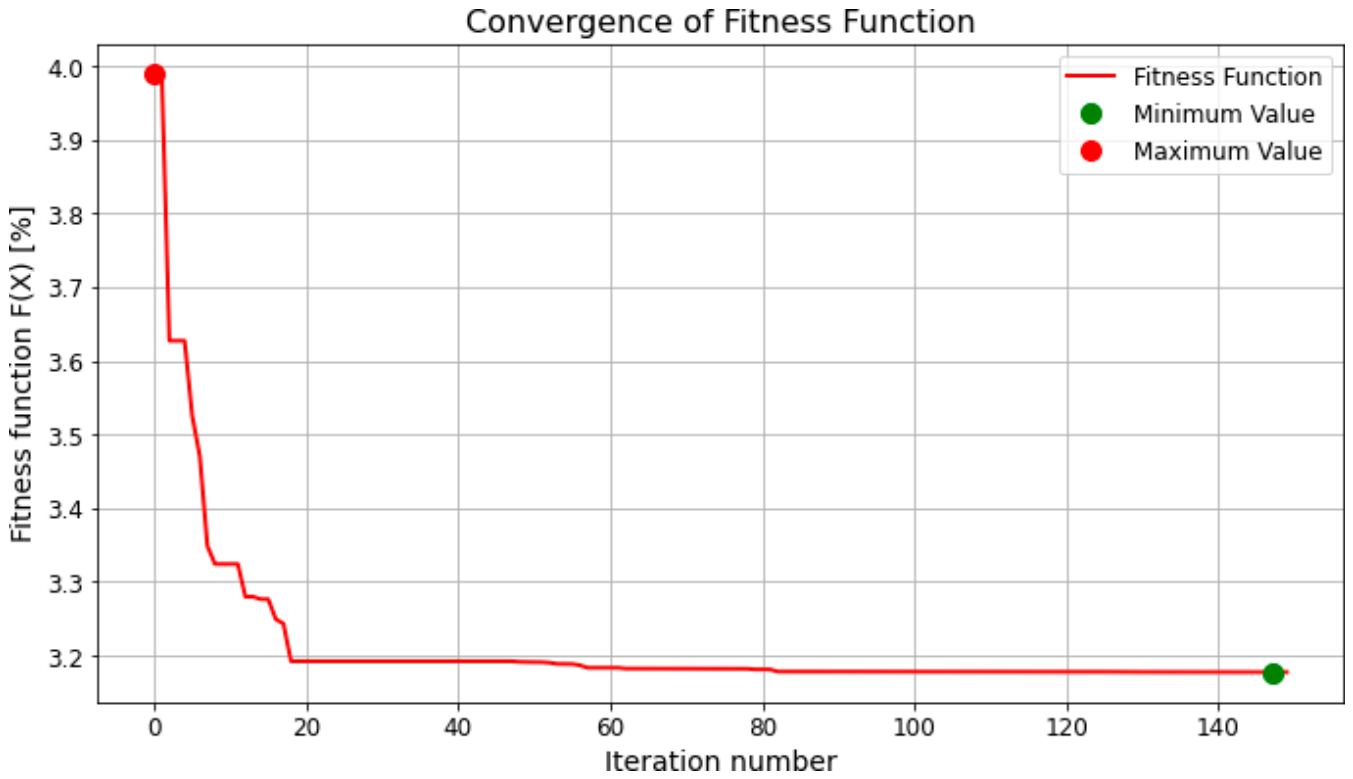
Figure 10 displays the evolution of the fitness function over the iterations of the Teaching–Learning-Based Optimization (TLBO) algorithm. The fitness function measures how well the estimated parameters fit the observed data, with lower values indicating a better fit. The figure typically shows:
Figure 10.
Fitness Function Evolution (Scenario 1).
- Initial High Values: At the beginning of the optimization process, the fitness values are relatively high, reflecting the initial random guess of the parameters.
- Rapid Decrease: As the algorithm progresses, the fitness values drop sharply, indicating that the TLBO is quickly converging towards a better solution.
- Gradual Stabilization: After the initial rapid decrease, the fitness values stabilize, showing minor improvements with each iteration as the algorithm fine-tunes the parameters.
The fitness function evolution demonstrates the efficiency and effectiveness of the TLBO algorithm in optimizing the SDM parameters. The rapid decrease in fitness values during the initial iterations indicates that the algorithm quickly identifies the general region of the optimal solution. The subsequent gradual improvements and stabilization suggest that the algorithm fine-tunes the parameters to achieve a highly accurate fit.
To verify that the validated estimator behaves as intended on the module studied here, it was additionally applied to the LX-80M curves of Section 4.1. Under unshaded operation, the single-diode model reproduces the measured curve with a coefficient of determination on power of 0.9999 and a normalised RMSE of 0.27%, whereas under partial shading the same model cannot reproduce the characteristic, the normalised RMSE rising to 18.01% with two parameters driven onto their search bounds. The full analysis is reported in the Supplementary Materials.
5. Conclusions
This study presented a hybrid, field-deployable methodology for real-time monitoring and fault diagnosis of photovoltaic modules, combining low-cost I–V curve acquisition, IEC 60891 standardization, and Teaching–Learning-Based Optimization (TLBO) for Single-Diode Model (SDM) parameter estimation. Experimental validation on an 11-year-old LX-80M monocrystalline module showed the framework’s ability to accurately capture performance deviations, identify fault signatures, and quantify long-term degradation trends under realistic operating conditions.
The analysis of I–V and P–V characteristics across multiple scenarios—nominal operation, low irradiance, elevated temperature, and partial shading—highlighted the system’s capability to distinguish environmentally induced performance fluctuations, permanent degradation, and transient fault conditions such as shading. Partial shading produced the most significant anomaly, with a fill factor collapse to 0.27 and a 45.82% performance deviation from the datasheet STC value after IEC 60891 correction, confirming the framework’s effectiveness in detecting critical operational faults.
The integration of TLBO-based SDM parameter extraction provided deeper diagnostic insights. The evolution of series resistance (Rs) and shunt resistance (Rsh) across different scenarios revealed early indicators of contact aging and leakage paths, while tracking photocurrent (IL) enabled quantification of irradiance-dependent power loss. The TLBO algorithm achieved robust convergence with R2 ≈ 0.99 and MAPE < 5%, validating its suitability for real-time PV diagnostics without requiring derivative-based or high-complexity solvers.
From a practical standpoint, this hybrid framework bridges the gap between academic PV diagnostics and industrial O&M practices. The hardware cost, the acquisition time and the computational load reported here indicate that the framework is compatible with routine operation and maintenance practice, although this was established on a single module under a limited set of operating conditions rather than in a plant-scale deployment. Both the measurement chain and the parameter-extraction stage are, in principle, transferable to an edge-computing node, so the present work is best regarded as a foundational step towards IoT-enabled monitoring and digital-twin-assisted asset management rather than as a demonstration of either capability. Neither IoT integration nor a digital twin was implemented or validated in this study; confirming that potential for scalability requires multi-module and multi-string testing, and is identified as future work below.
A limitation of this study is that the experimental monitoring and TLBO parameter estimation stages were validated on two different modules (LX-80M and HIT Power 240S, respectively). This separation was necessary because the LX-80M datasheet does not provide the complete reference SDM parameters required for TLBO validation, whereas the HIT Power 240S datasheet does. While this two-module approach allows each stage to be validated with appropriate reference data, it does not constitute complete end-to-end validation on a single module. Future work will address this limitation by collecting synchronized I–V and environmental data from a single module equipped with both the monitoring system and the TLBO parameter estimation workflow.
To ensure reproducibility and support further research, we will make the TLBO implementation and I–V curve processing scripts developed in this study publicly available. In the meantime, the code is available from the corresponding authors on request.
This contrast provides the criterion by which the two stages of the framework act together. IEC 60891 translation reports the magnitude of a deficit with respect to the datasheet but not its cause, so an unshaded deviation and a shading event differ only in size once translated. The quality of the single-diode fit separates them: a deficit accompanied by an accurate reconstruction indicates degradation, while the same deficit accompanied by a collapse of the fit indicates a transient mismatch fault. In this sense, combining standardization with physics-informed parameter extraction yields a diagnosis rather than a measurement of loss alone.
Future work will focus on multi-module deployment, integration with LoRa/BLE wireless communication, and real-time edge AI algorithms for automatic anomaly classification. Additionally, combining Bayesian inference and metaheuristic optimization could further improve uncertainty quantification in long-term degradation tracking. By unifying experimental, computational, and predictive capabilities, this work contributes a robust foundation for next-generation photovoltaic monitoring systems that enhance reliability, safety, and sustainable solar energy production.
Supplementary Materials
The following supporting information can be downloaded at: https://www.mdpi.com/article/10.3390/eng7100510/s1. Table S1: Single-diode model parameters extracted by TLBO from the measured LX-80M I–V curves, with the corresponding goodness-of-fit statistics; Figure S1: Measured I–V curves of the field-aged LX-80M module compared with the single-diode reconstruction obtained by TLBO.
Author Contributions
Conceptualization, M.F., A.D. (Azzeddine Dekhane), S.M., A.D. (Abdelhak Djellad), M.T. and A.A.-Q.; Methodology, A.D. (Azzeddine Dekhane) and A.A.-Q.; Software, M.F., A.D. (Azzeddine Dekhane), S.M., N.B. and F.M.; Validation, A.D. (Azzeddine Dekhane) and F.M.; Formal analysis, S.M., N.B., A.D. (Abdelhak Djellad), F.M. and A.A.-Q.; Investigation, S.M. and M.K.; Resources, A.D. (Azzeddine Dekhane), A.D. (Abdelhak Djellad) and M.T.; Data curation, M.F., A.D. (Azzeddine Dekhane), S.M., N.B., F.M. and A.A.-Q.; Writing—original draft, A.D. (Azzeddine Dekhane), S.M., N.B., M.K. and M.T.; Writing—review & editing, M.F., A.D. (Azzeddine Dekhane), S.M., N.B., M.K., M.T. and A.A.-Q.; Visualization, M.F., A.D. (Azzeddine Dekhane), A.D. (Abdelhak Djellad) and M.K.; Supervision, A.D. (Azzeddine Dekhane); Project administration, A.D. (Azzeddine Dekhane) and M.T.; Funding acquisition, M.F., M.T. and A.A.-Q. All authors have read and agreed to the published version of the manuscript.
Funding
This research received no external funding.
Institutional Review Board Statement
Not applicable.
Informed Consent Statement
Not applicable.
Data Availability Statement
The raw data and code supporting the conclusions of this article will be made available by the authors on request.
Conflicts of Interest
The authors declare no conflicts of interest.
References
- Fraunhofer ISE. Photovoltaics Report; Fraunhofer Institute for Solar Energy Systems ISE: Freiburg, Germany, 2024. [Google Scholar]
- Dekhane, A.; Mohamed Foued, G.; Djellabi, R.; Djellad, A.; Benamira, N. Real Large-Scale Waste Management and Electricity Generation by Incineration and Methanation Routes: Methodologies and Comparative Investigation on Local Municipal Waste Landfills. Iran. J. Chem. Chem. Eng. 2024, 43, 3427–3437. [Google Scholar] [CrossRef] [Scilit]
- Djellad, A.; Belakehal, S.; Chenni, R.; Dekhane, A. Reliability Improvement in Serial Multicellular Converters Based on STATCOM Control. J. Eur. Syst. Autom. 2021, 54, 519–528. [Google Scholar] [CrossRef] [Scilit]
- Djerourou, A.; Dekhane, A.; Bouraiou, A.; Atoui, I. Evaluating MPPT Techniques: Optimizing Photovoltaic Systems Under Partial Shading Conditions. In Proceedings of the 2023 Second International Conference on Energy Transition and Security (ICETS), Adrar, Algeria, 12–14 December 2023; pp. 1–9. [Google Scholar] [CrossRef] [Scilit]
- Bouderres, N.; Kerdoun, D.; Chiheb, S.; Djellad, A.; Dekhane, A.; Kebabsa, T. PV array power optimization under shading condition using PSO and IncCond MPPT control. In Proceedings of the 2022 19th International Multi-Conference on Systems, Signals & Devices (SSD), Sétif, Algeria, 6–10 May 2022; pp. 1168–1173. [Google Scholar] [CrossRef] [Scilit]
- Green, M.A.; Dunlop, E.D.; Hohl-Ebinger, J.; Yoshita, M.; Kopidakis, N.; Ho-Baillie, A.W.Y. Solar cell efficiency tables (version 55). Prog. Photovolt. Res. Appl. 2020, 28, 3–15. [Google Scholar] [CrossRef] [Scilit]
- Pillai, D.S.; Rajasekar, N. A comprehensive review on protection challenges and fault diagnosis in PV systems. Renew. Sustain. Energy Rev. 2018, 91, 18–40. [Google Scholar] [CrossRef] [Scilit]
- Köntges, M.; Kurtz, S.; Packard, C.; Jahn, U.; Berger, K.A.; Kato, K.; Friesen, T.; Liu, H.; Van Iseghem, M. Review of Failures of Photovoltaic Modules; Report IEA-PVPS T13-01:2014; International Energy Agency: Paris, France, 2014. [Google Scholar]
- Madeti, S.R.; Singh, S.N. Monitoring system for photovoltaic plants: A review. Renew. Sustain. Energy Rev. 2017, 67, 1180–1207. [Google Scholar] [CrossRef] [Scilit]
- Triki-Lahiani, A.; Bennani-Ben Abdelghani, A.; Slama-Belkhodja, I. Fault detection and monitoring systems for photovoltaic installations: A review. Renew. Sustain. Energy Rev. 2018, 82, 2680–2692. [Google Scholar] [CrossRef] [Scilit]
- Mellit, A.; Tina, G.M.; Kalogirou, S.A. Fault detection and diagnosis methods for photovoltaic systems: A review. Renew. Sustain. Energy Rev. 2018, 91, 1–17. [Google Scholar] [CrossRef] [Scilit]
- Tsanakas, J.A.; Ha, L.; Buerhop, C. Faults and infrared thermographic diagnosis in operating c-Si photovoltaic modules: A review of research and future challenges. Renew. Sustain. Energy Rev. 2016, 62, 695–709. [Google Scholar] [CrossRef] [Scilit]
- Jordan, D.C.; Kurtz, S.R. Photovoltaic Degradation Rates—An Analytical Review. Prog. Photovolt. Res. Appl. 2013, 21, 12–29. [Google Scholar] [CrossRef] [Scilit]
- Deitsch, S.; Christlein, V.; Berger, S.; Buerhop-Lutz, C.; Maier, A.; Gallwitz, F.; Riess, C. Automatic classification of defective photovoltaic module cells in electroluminescence images. Sol. Energy 2019, 185, 455–468. [Google Scholar] [CrossRef] [Scilit]
- Djellad, A.; Dekhane, A.; Farhat, M.; Takruri, M.; Al-Qaisi, A. Whale optimization-based fractional order control for high-performance grid-connected photovoltaic multilevel inverters: Diode-clamped versus T-type MLIs. Sci. Rep. 2025, 15, 36695. [Google Scholar] [CrossRef] [Scilit] [PubMed]
- Paredes-Parra, J.M.; García-Sánchez, A.J.; Mateo-Aroca, A.; Molina-García, Á. An Alternative Internet-of-Things Solution Based on LoRa for PV Power Plants: Data Monitoring and Management. Energies 2019, 12, 881. [Google Scholar] [CrossRef] [Scilit]
- Rezaee Jordehi, A. Parameter estimation of solar photovoltaic (PV) cells: A review. Renew. Sustain. Energy Rev. 2016, 61, 354–371. [Google Scholar] [CrossRef] [Scilit]
- International Energy Agency—PVPS. Photovoltaic Power Systems Programme Annual Report 2023; International Energy Agency: Paris, France, 2024. [Google Scholar]
- Farhat, M.; Dekhane, A.; Djellad, A.; Takruri, M.; Al-Qaisi, A.; Barambones, O. Optimizing photovoltaic performance: Data-driven maximum power point prediction via advanced regression models. Results Control Optim. 2025, 20, 100586. [Google Scholar] [CrossRef] [Scilit]
- Morales-Aragonés, J.I.; Dávila-Sacoto, M.; González, L.G.; Alonso-Gómez, V.; Gallardo-Saavedra, S.; Hernández-Callejo, L. A Review of I–V Tracers for Photovoltaic Modules: Topologies and Challenges. Electronics 2021, 10, 1283. [Google Scholar] [CrossRef] [Scilit]
- Fadhel, S.; Delpha, C.; Diallo, D.; Bahri, I.; Migan, A.; Trabelsi, M.; Mimouni, M.F. PV shading fault detection and classification based on I–V curve using principal component analysis: Application to isolated PV system. Sol. Energy 2019, 179, 1–10. [Google Scholar] [CrossRef] [Scilit]
- Satterlee, C. IV Swinger: An Open-Source Capacitive I-V Curve Tracer for Photovoltaic Solar Panels. 2017. Available online: https://github.com/csatt/IV_Swinger (accessed on 15 July 2026).
- IEC 60891:2021; Photovoltaic Devices—Procedures for Temperature and Irradiance Corrections to Measured I–V Characteristics. IEC: Geneva, Switzerland, 2021.
- Piliougine, M.; Sánchez-Friera, P.; Spagnuolo, G. Comparative of IEC 60891 and Other Procedures for Temperature and Irradiance Corrections to Measured I–V Characteristics of Photovoltaic Devices. Energies 2024, 17, 566. [Google Scholar] [CrossRef] [Scilit]
- Li, B.; Diallo, D.; Migan-Dubois, A.; Delpha, C. Performance evaluation of IEC 60891:2021 procedures for correcting I–V curves of photovoltaic modules under healthy and faulty conditions. Prog. Photovolt. Res. Appl. 2023, 31, 474–493. [Google Scholar] [CrossRef] [Scilit]
- Li, B.; Migan, A.; Delpha, C.; Diallo, D. Evaluation and improvement of IEC 60891 correction methods for I–V curves of defective photovoltaic panels. Sol. Energy 2021, 216, 225–237. [Google Scholar] [CrossRef] [Scilit]
- Rao, R.V.; Savsani, V.J.; Balic, J. Teaching–learning-based optimization algorithm for unconstrained and constrained real-parameter optimization problems. Eng. Optim. 2012, 44, 1447–1462. [Google Scholar] [CrossRef] [Scilit]
- Rao, R.V.; Savsani, V.J.; Vakharia, D.P. Teaching-learning-based optimization: A novel method for constrained mechanical design optimization problems. Comput.-Aided Des. 2011, 43, 303–315. [Google Scholar] [CrossRef] [Scilit]
- Rao, R.V. Review of applications of TLBO algorithm and a tutorial for beginners to solve the unconstrained and constrained optimization problems. Decis. Sci. Lett. 2016, 5, 1–30. [Google Scholar] [CrossRef] [Scilit]
- Patel, S.J.; Panchal, A.K.; Kheraj, V. Extraction of solar cell parameters from a single current–voltage characteristic using teaching learning based optimization algorithm. Appl. Energy 2014, 119, 384–393. [Google Scholar] [CrossRef] [Scilit]
- Yu, K.; Chen, X.; Wang, X.; Wang, Z. Parameters identification of photovoltaic models using self-adaptive teaching-learning-based optimization. Energy Convers. Manag. 2017, 145, 233–246. [Google Scholar] [CrossRef] [Scilit]
- Laudani, A.; Fulginei, F.R.; Salvini, A. High performing extraction procedure for the one-diode model of a photovoltaic panel from experimental I–V curves by using reduced forms. Sol. Energy 2014, 103, 316–326. [Google Scholar] [CrossRef] [Scilit]
- Cubas, J.; Pindado, S.; Victoria, M. On the analytical approach for modeling photovoltaic systems behavior. J. Power Sources 2014, 247, 467–474. [Google Scholar] [CrossRef] [Scilit]
- De Riso, M.; Dhimish, M.; Guerriero, P.; Daliento, S. Design of a Portable Low-Cost I-V Curve Tracer for On-Line and In Situ Inspection of PV Modules. Micromachines 2024, 15, 896. [Google Scholar] [CrossRef] [Scilit] [PubMed]

Disclaimer/Publisher’s Note: The statements, opinions and data contained in all publications are solely those of the individual author(s) and contributor(s) and not of MDPI and/or the editor(s). MDPI and/or the editor(s) disclaim responsibility for any injury to people or property resulting from any ideas, methods, instructions or products referred to in the content. |
© 2026 by the authors. Licensee MDPI, Basel, Switzerland. This article is an open access article distributed under the terms and conditions of the Creative Commons Attribution (CC BY) license.