


Abstract
This study investigates particle distribution and deposition during pipeline transport of sulfide tailings slurry using an Eulerian multiphase model in ANSYS Fluent 2024. A 200 mm-diameter pipeline was simulated over inlet mass concentrations of 20–50%, inlet velocities of 0.5–3.0 m s−1, and pipe inclinations of 0–40°. The measured particle-size distribution was represented by seven solid size classes, and the Wasp model was used to estimate the critical deposition velocity. Results show that low velocity and high concentration promote bottom deposition and increase relative deposited-bed height, whereas increasing velocity enhances particle suspension and reduces bed thickness. Increasing pipe inclination generally intensifies deposition over much of the developed-flow region, while the longitudinal bed profile becomes non-monotonic at larger inclinations. Medium-to-coarse particles preferentially settled near the pipe bottom, whereas the 30 μm fraction exhibited a more uniform cross-sectional distribution under the representative condition examined. Industrial pressure-gradient measurements were used to evaluate the hydraulic response of the model, yielding relative errors of 1.05–4.28% and a mean absolute percentage error of 2.86%. The results provide guidance for selecting operating conditions that limit deposition during sulfide-tailings pipeline transport.
1. Introduction
Mining is an indispensable component of China’s economic structure [1,2]. Mineral processing, however, inevitably generates large quantities of solid waste known as tailings. Global tailings production is estimated at several billion tonnes annually; their surface storage consumes substantial land and can lead to dam instability, dust emissions, and heavy-metal contamination of soil and groundwater [3]. The economical, safe, and environmentally responsible disposal and reuse of tailings therefore remain critical challenges for the global mining industry.
Among available tailings-management technologies, hydraulic transport [4] is widely used to convey tailings from concentrators either to surface storage facilities or to underground voids for cemented backfill because it provides continuous, high-capacity, highly automated transport at comparatively low cost. Research on tailings-slurry pipeline transport has principally relied on physical experiments [4,5,6,7,8,9] and empirical correlations [10,11]. Although experiments can directly reveal flow phenomena, they are time-consuming and costly and are constrained by pipe dimensions, measurement methods, and operating conditions. They consequently cannot resolve the rapidly evolving multiphase flow field throughout a pipe, particularly in long, industrial-scale systems. Empirical and semi-empirical correlations derived from experiments also have limited applicability and may not accurately predict the behaviour of tailings with widely differing densities, particle-size distributions, and particle shapes. With its comprehensive multiphase-flow capabilities, broad physical-model library, and mature pre- and post-processing environment, ANSYS Fluent is widely used in industrial and academic investigations of solid–liquid flows. Numerical simulations that specify particle and slurry rheological properties across a range of inlet velocities and concentrations can elucidate the internal flow mechanisms of tailings pipelines and thereby support pipeline design, operating-parameter prediction, and safe, stable system operation.
Vlasák et al. [12] experimentally investigated the effects of solids concentration and mixture velocity on flow behaviour, pressure drop, and concentration distributions of coarse-particle-water mixtures in horizontal, vertical, and inclined smooth stainless-steel pipes. They reported pronounced stratification in horizontal and inclined pipes: particles moved predominantly within a near-bed layer, whereas saltation became the dominant transport mode at intermediate and high velocities. The frictional pressure drop in horizontal pipes was substantially higher than in vertical pipes, and the frictional pressure drop in upward-flowing pipes increased with inclination. Matoušek et al. [13] likewise observed a stratified structure comprising a deposited layer and a transport layer, and showed that particle-size distribution affects transport energy consumption. Recent international studies have further advanced the numerical and experimental characterization of slurry pipeline transport. Sadeghi et al. [14] developed an industrial-scale multiphase CFD model for concentrated polydisperse tailings slurry and validated the model against field measurements, showing that particle-size distribution and slurry rheology significantly influence pressure drop and solids distribution. Kumar and Kaushal [15] employed an Eulerian two-fluid framework to investigate highly concentrated particulate slurry flow and demonstrated that experimentally validated turbulence modelling can reproduce pressure-drop and solids-concentration characteristics. More recently, Shajahan et al. [16] combined pipeline experiments with particle-resolved direct numerical simulations to characterize the transition from fixed-bed and sliding-bed transport to suspended flow, providing further insight into the physical basis of limit-deposition conditions. These studies highlight the importance of particle-size effects, multiphase-model selection, and local concentration validation in slurry-pipeline simulations. Vertical hydraulic-lifting experiments by Tang et al. [17,18] showed that the homogeneous suspension velocity increased with particle concentration and particle size, whereas the heterogeneous suspension velocity increased as concentration decreased and particle density increased. Particle rotational velocity increased with water velocity and particle sphericity, but decreased with particle size and density. They further recommended an ore-lifting velocity at least three times the maximum particle settling velocity to ensure safe transport. Zhang et al. [19] reported an exponential increase in pipeline resistance with velocity and the highest pressure at the bottom of bends. At a fixed velocity, resistance increased with slurry concentration; at a fixed concentration, it also increased with velocity, with an increasing rate of growth. Yang et al. [20] used numerical simulation to study the gravity-driven transport of high-concentration waste-rock and aeolian-sand backfill slurry and identified a pronounced velocity gradient across the pipe diameter and a strong effect of slurry mass concentration on transport resistance. Yu et al. [21] analyzed cemented-tailings backfill slurry in a 75 mm-diameter pipe using Fluent and found that, at a maximum concentration of 65%, the gravitational-flow velocity could reach 2.6 m s−1, exceeding the critical velocity and satisfying production requirements. Moreover, as mineral-processing technologies continue to advance, mining operations are increasingly characterized by mechanization and large-scale production. Conventional slurry-delivery systems, with backfilling capacities of 60–80 m3 h−1, can no longer satisfy current production demands. To ensure the safe and efficient pipeline transport of backfill slurry while maintaining coordination between mining and backfilling operations, it is practically important either to increase the number of backfilling systems or to enhance the delivery capacity of individual systems [22].
Furthermore, China has placed increasing emphasis on environmental protection and ecological civilization. At the China International Mining Conference held in Beijing in 2007, Xu Shaoshi proposed the development of “green mining,” advocating science- and technology-driven mineral development with environmentally sustainable practices as its fundamental objective [23]. Consequently, backfilling methods are expected to account for an increasing proportion of mining operations. With continued improvements in mining productivity, high-throughput pipeline transport systems will become a key development direction in backfill mining [24,25,26].
Previous studies have explored the flow characteristics of tailings-slurry pipelines through theoretical calculations, numerical simulations, and loop-pipe experiments. Most, however, have examined multicomponent backfill slurries, which tend to behave as homogeneous fluids with characteristic structural-flow behaviour at high concentrations. In engineering practice, the tailings slurry conveyed from a concentrator to a backfill-preparation plant is inherently a solid–liquid mixture of particles and water. Its flow regime varies strongly with inlet velocity and slurry concentration, and may be homogeneous, heterogeneous, or transitional. Existing numerical studies often simplify tailings as a single-size particle phase, an assumption that cannot fully represent the complex size composition of real tailings and the substantial interactions between coarse and fine particles. As engineering applications demand greater predictive accuracy, the limitations of monodisperse models have become increasingly evident. A multi-size numerical representation can preserve the measured particle-size composition and provide size-resolved information on particle segregation and deposition in wide-size-distribution slurries. However, the present study does not attempt to quantify the predictive improvement of this representation relative to monodisperse or reduced-size-class models.
Critical velocity is commonly investigated using empirical correlations and theoretical analyses; however, its definition varies among researchers. It is generally interpreted in three ways: (1) the velocity at which slurry transport occurs without the onset of particle settling, deposition, or sliding-bed formation in the pipeline [27]; (2) the velocity at which the slurry flows in a homogeneous or pseudo-homogeneous regime [28,29]; and (3) from the perspective of practical mine backfilling, the velocity at which the pipeline transport resistance reaches its minimum [30,31]. Accordingly, this study considers the pipeline transport of sulfide tailings slurry from a mine in Yunnan Province, China. The full particle-size distribution was first determined by sieving, and the Wasp model [32] was used to calculate critical deposition velocities at different concentrations. An Eulerian multiphase model incorporating multiple tailings size classes was then developed in ANSYS Fluent and coupled with the RNG k-ε turbulence model. For a horizontal pipe, the effects of inlet velocity and slurry concentration on the relative deposited-bed height were first analyzed to establish the relationship between operating conditions and bed formation. At representative velocity and concentration conditions, pipe inclination was subsequently varied to investigate its effect on the longitudinal distribution of bed thickness. Finally, the radial distributions of tailings particles of different sizes were examined. The findings provide a basis for optimizing the transport parameters of wide-size-distribution tailings slurries, mitigating particle deposition, and maintaining stable operation of backfill-transport systems.
2. Materials and Methods
2.1. Particle-Size Distribution and Critical Transport Parameters of Sulfide Tailings
Tailings particle-size distribution is a key determinant of particle suspension, settling, and segregation during pipeline transport, and it provides the basis for both multi-size numerical modelling and critical deposition-velocity calculation. To characterize the size composition of the sulfide tailings, sieving tests were first performed and the Wasp model was then applied to calculate critical deposition velocities at different concentrations. The results were used to define the subsequent simulation cases.
2.1.1. Particle-Size Distribution of Sulfide Tailings
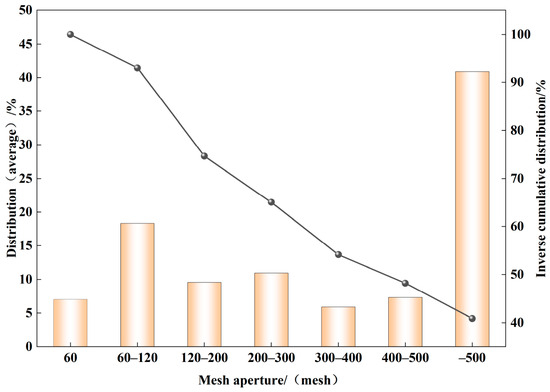
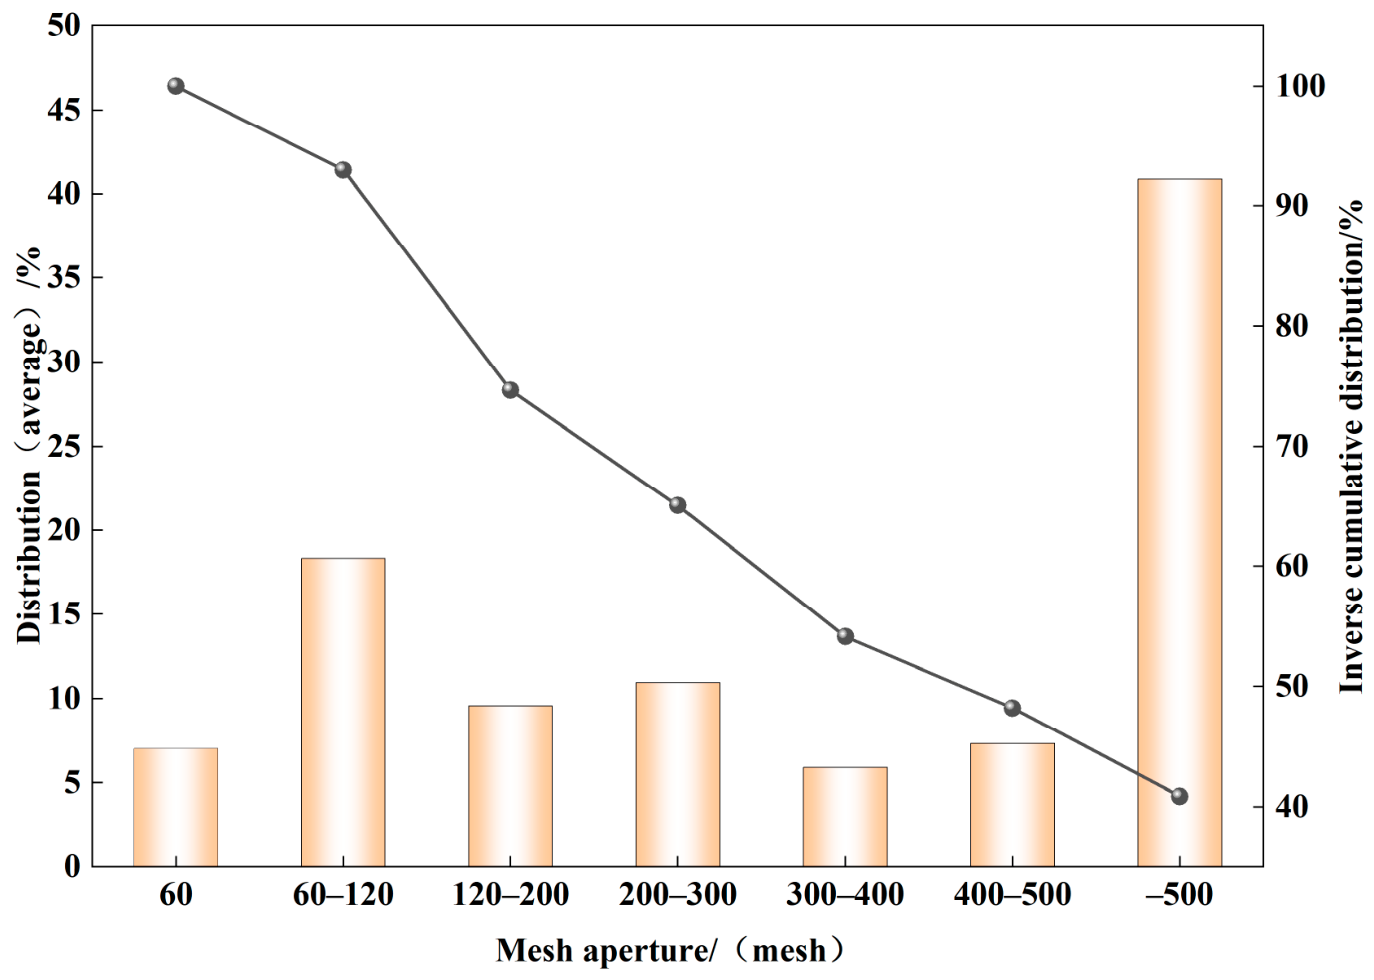
Sieving tests were conducted to characterize the particle-size distribution of the sampled sulfide tailings. The sulfide tailings samples originate from Gejiu City, Honghe Hani and Yi Autonomous Prefecture, Yunnan Province. Before sieving, the field-collected tailings were air-dried or oven-dried at low temperature until their moisture content was essentially stable. The material was gently disaggregated and homogenized to reduce the influence of particle agglomeration. Particle-size analysis was then performed by dry sieving using 60-, 120-, 200-, 300-, 400-, and 500-mesh sieves arranged from the largest to the smallest opening, with a collecting pan placed beneath the 500-mesh sieve. The material retained in each sieve fraction and collected in the pan was recovered and weighed to determine the corresponding mass fraction. The term “sulfide tailings” is used to identify the investigated tailings material, whereas mineral-specific chemical effects were not included in the numerical model. The present CFD analysis focuses on hydrodynamic transport and deposition governed primarily by particle-size distribution, solids concentration, gravity, and interphase momentum exchange. Chemical reactions and mineral-specific surface effects are therefore beyond the scope of this study. The results are presented in Table 1. The sulfide tailings were dominated by fine particles: the fraction finer than 500 mesh accounted for 40.87%, followed by the 60–120-mesh fraction at 18.33%. The remaining fractions were 10.96% for 200–300 mesh, 9.58% for 120–200 mesh, 7.33% for 400–500 mesh, 7.02% for particles retained on the 60-mesh sieve, and 5.91% for 300–400 mesh. The particle-size distribution is shown in Figure 1.
Table 1.
Particle-size distribution of sulfide tailings.
Figure 1.
Particle-size distribution of sulfide tailings.
Replicate-based uncertainty statistics were not available in the archived particle-size measurements; therefore, standard-deviation or confidence-interval error bars could not be reliably reconstructed. The reported values are presented as the available measured size-fraction data.
2.1.2. Calculation of the Critical Deposition Velocity
The critical deposition velocity is a key parameter for assessing whether tailings slurry can be transported stably through a pipeline. When the transport velocity is below this threshold, solid particles tend to accumulate at the pipe bottom and form a deposited bed; above the threshold, particle suspension is enhanced and the risk of blockage is reduced. The Wasp critical deposition-velocity model was therefore applied to the tailings slurry at different concentrations to guide inlet-velocity selection and the classification of representative transport conditions. The Wasp equation is given below:
where is the Wasp critical deposition velocity of the tailings slurry (m s−1); is the dimensionless critical-deposition Froude number; is the total solids volume fraction of the slurry; d85 is the characteristic particle diameter corresponding to 85% cumulative undersize in the particle-size distribution (m). The value of was obtained by linear interpolation of the measured cumulative particle-size distribution between the adjacent sieve sizes bracketing 85% passing; D is the pipe diameter (m); g is gravitational acceleration (9.81 m s−2); is the tailings-particle density (kg m−3); and is the liquid density (kg m−3).
It should be noted that the seven representative particle diameters listed in Table 1 were used to discretize the experimentally determined particle-size distribution into seven granular phases in the Eulerian CFD model, whereas the Wasp correlation was evaluated using d85 as the characteristic particle diameter of the overall tailings grading. Therefore, one reference critical deposition velocity was obtained for each total slurry concentration rather than separate Wasp velocities for the seven CFD particle-size classes. For the tailings investigated in this study, d85 was approximately 218 μm and was adopted as the characteristic particle diameter in the Wasp calculation. Substitution of the measured parameters yielded the critical deposition velocities listed in Table 2.
Table 2.
Wasp critical deposition velocities.
2.2. Governing Equations and Numerical Models
ANSYS Fluent uses the finite-volume method to discretize the governing mass and momentum conservation equations over arbitrary control volumes and is therefore well suited to simulating multiphase tailings-slurry flow in pipelines. Heat transfer was not considered in the present isothermal flow model; therefore, the energy equation was not activated. Because the tailings exhibit a complex particle-size distribution and pronounced interphase slip, the Eulerian multiphase framework was adopted to solve separate conservation equations for the liquid and solid phases. The RNG k-ε model was adopted to describe turbulent momentum transport under the strong-shear conditions encountered in the pipeline. Particle suspension and settling were not attributed to the turbulence model alone, but resulted from the coupled effects of gravity, interphase momentum exchange, granular-phase stresses, and turbulent dispersion within the Eulerian–granular framework.
2.2.1. Phase Continuity Equations
In the Eulerian multiphase framework, mass conservation is satisfied separately for the liquid phase and each solid phase. In the absence of interphase mass transfer, the continuity equation for phase is expressed as
The phase volume fractions satisfy the local closure condition.
where , , and denote the volume fraction, density, and velocity vector of phase , respectively; the subscripts and denote the liquid phase and the th solid phase, respectively. Because steady-state simulations were performed in the present study, the transient term vanishes after convergence. Equation (3) is solved separately for water and each of the seven tailings phases rather than for a single equivalent slurry phase.
2.2.2. Phase Momentum Equations
Momentum conservation was solved separately for the liquid and granular solid phases. For the liquid phase, the momentum equation can be written as
For the th granular solid phase, the momentum equation is expressed in the compact form.
where , , and are the volume fraction, density, and velocity vector of the th solid phase, respectively; is the pressure shared by the Eulerian phases; is the granular solids pressure; is the granular-phase stress tensor; is gravitational acceleration; and denotes the total interphase momentum-exchange force acting on the th solid phase. In the present model, includes water–solid drag, lift, turbulent-dispersion effects, and momentum exchange with the other granular solid phases. The corresponding closure models are described in Section 2.2.3. For each water–solid phase pair, the water–solid contribution to the interphase momentum exchange contains drag, lift, and turbulent-dispersion terms:
where is the water–solid momentum-exchange coefficient, is the lift-force contribution, and is the turbulent-dispersion contribution. Momentum conservation requires .
In the present simulations, the Gidaspow formulation was used for water–solid drag, the Tomiyama model for lift, and the Lopez de Bertodano formulation for turbulent dispersion. The same closure models were assigned independently to all seven water–solid phase pairs. Therefore, although identical correlations were employed, momentum exchange was evaluated separately for each particle-size class according to its individual particle diameter and local phase properties. The virtual-mass force and additional turbulent-interaction force were not activated.
Momentum exchange among different granular solid phases was also considered explicitly. All solid–solid phase pairs employed the Schiller–Naumann drag formulation. A constant particle–particle restitution coefficient of 0.90 was specified for all solid-phase interactions.
For each granular solid phase, the stress tensor can be expressed as
where and are the granular shear and bulk viscosities, respectively, and is the identity tensor. Through the granular constitutive relations, the solid-phase momentum equation, therefore, accounts for solids pressure, collisional stresses, and frictional stresses in locally dense regions. The detailed granular constitutive closures are provided in Section 2.2.3.
2.2.3. Interphase Momentum Exchange and Granular-Phase Closures
The seven tailings size classes were treated as separate granular Eulerian secondary phases. The same granular constitutive framework was applied to all seven solid phases, with only the particle diameter differing among the size classes (247, 165, 135, 59, 42, 33, and 30 μm). For all water–solid phase pairs, the Gidaspow model was employed to calculate the interphase drag force. The Tomiyama model was adopted for the lift force, while turbulent dispersion was represented using the Lopez de Bertodano formulation. The same water–solid interaction framework was independently applied to water–tailings1 through water–tailings7. Therefore, although identical closure correlations were used, the momentum exchange of each particle-size class was evaluated separately according to its individual particle diameter and local phase properties. The virtual-mass force and additional turbulent-interaction force were not activated. Momentum exchange among different granular solid phases was also explicitly considered. All solid–solid phase pairs employed the Schiller–Naumann drag model, and a constant particle–particle restitution coefficient of 0.90 was specified for all solid-phase interactions. The kinetic theory of granular flow (KTGF) was used to describe the constitutive behaviour of the granular phases. Granular temperature was evaluated using the algebraic formulation. The Syamlal–O’Brien model was employed for granular shear viscosity and solids pressure, whereas the Lun et al. formulations were adopted for granular bulk viscosity and the radial distribution function. Frictional viscosity was described using the Schaeffer model, and frictional pressure was evaluated using the kinetic-theory-based formulation implemented in Fluent. The friction-packing limit was set to 0.61, the maximum packing volume fraction to 0.63, and the internal friction angle to 0.5236 rad (30°), The friction coefficient and elastic modulus were evaluated using Fluent’s derived formulations. These constitutive relationships were applied consistently to all seven granular phases to account for interphase slip, particle collisions, solids pressure, and frictional stresses in locally dense regions, particularly near the pipe invert where particle enrichment and deposited-bed formation occur.
2.2.4. RNG k-ε Turbulence Model
To describe the turbulent flow characteristics of the tailings slurry accurately, the RNG k-ε model was adopted. Its governing equations are given in Equations (9)–(11).
where is turbulent kinetic energy (m2 s−2); μ is dynamic viscosity (Pa s); is turbulent viscosity (Pa s); is the turbulent Prandtl number for k; is the production of turbulent kinetic energy induced by mean velocity gradients (kg m−1 s−3); ε is turbulent dissipation rate (m2 s−3); is the turbulent Prandtl number for ε; and are empirical constants; is the additional correction term in the RNG ε equation; is slurry density (kg m−3); and is an empirical constant.
The RNG model constants used in the calculations were Cμ = 0.0845, C1ε = 1.42, C2ε = 1.68, and C3ε = 1.30. The additional RNG correction term in the ε equation is
with , , and , where is the characteristic strain rate. The differential-viscosity and swirl-dominated-flow options were not activated. These settings, together with the phase-specific momentum exchange and granular closures described above, were used consistently for all numerical cases.
2.3. Pipeline Model, Boundary Conditions, and Simulation Design
2.3.1. Physical Model and Geometry
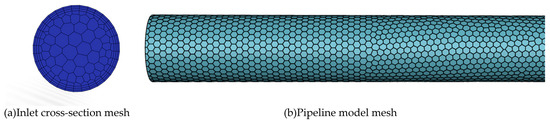
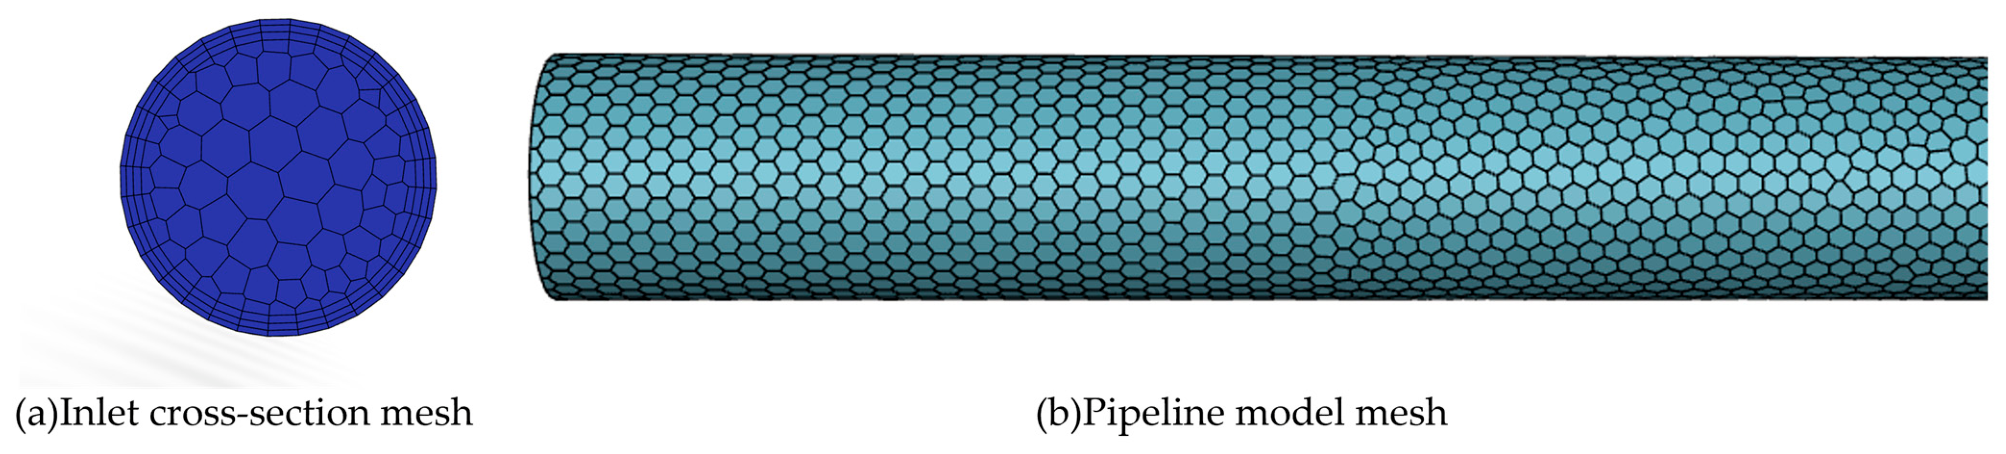
A three-dimensional inclined circular-pipe model was developed using the actual pipeline parameters between the concentrator and backfill plant at a mine in Yunnan Province, China. The pipe was treated as a rigid, smooth circular conduit, with wall roughness neglected because of its minor effect on the flow. A commonly used engineering diameter of D = 0.20 m was selected. To obtain fully developed flow and minimize inlet effects, the total pipe length was set to L = 100 m, ensuring that the flow was fully developed in the central region. A global Cartesian coordinate system was used, with the x-axis aligned with the pipe axis for the horizontal case (θ = 0°), the positive y-axis vertically upward, and the z-axis in the horizontal transverse direction. For the inclined cases, the entire pipe geometry was rotated upward by an angle θ in the x–y plane while the global coordinate system and gravity vector remained unchanged. The investigated pipe inclinations were θ = 0°, 10°, 20°, 30°, and 40°. The geometric model and mesh are shown in Figure 2. Water was used as the liquid phase, and the solid phases were represented by equivalent spherical particles for computational tractability. For computational tractability, all tailings size classes were represented by equivalent spherical particles in the present Eulerian model. Particle shape descriptors such as sphericity, roundness, and aspect ratio were not independently measured for the sampled tailings. Therefore, the effect of particle angularity and irregularity was not explicitly included in the drag or settling formulations. The spherical-particle assumption enables a consistent treatment of the seven particle-size classes and is commonly used in Eulerian multiphase simulations; however, it should be regarded as an idealization of the actual tailings morphology. Particle density, diameter, and volume fraction were specified according to the engineering conditions and research objectives. Both phases were considered incompressible, heat transfer was neglected, and steady turbulent flow was assumed.
Figure 2.
Geometry and mesh of the pipeline model.
2.3.2. Model Configuration
In accordance with the simulation design and the applicability of Fluent boundary conditions, the inlet was specified as a velocity inlet, the continuous liquid phase at the pipe wall as a no-slip boundary, and the outlet as a pressure outlet. For the granular solid phases, particle–wall interactions were specified separately from the liquid-phase no-slip condition. A partial-slip granular-wall treatment was adopted, with a particle–wall restitution coefficient of 0.90, a specularity coefficient of 0.05, and a particle–wall friction coefficient of 0.30. Tangential particle motion along the wall was permitted while accounting for momentum loss due to particle–wall collisions and friction. The same granular-wall parameters were applied to all seven granular phases. The particle–wall restitution coefficient should be distinguished from the particle–particle restitution coefficient used in the solid–solid interaction model. Similarly, the standard wall functions used for the RNG k-ε turbulence model describe the continuous-phase near-wall turbulence treatment rather than the granular-phase wall boundary condition. Gravitational acceleration was set to −9.81 m s−2 in the global negative y-direction and remained unchanged for all inclination cases. For the inclined-pipe simulations, the pipe geometry was rotated upward to the prescribed inclination angle, and the inlet velocity direction was aligned with the corresponding pipe axis. Thus, the different inclination conditions were represented by changing the pipe orientation rather than by changing the gravity direction. Because the tailings exhibit a wide particle-size distribution and size-dependent settling and segregation, an Eulerian multiphase approach was adopted to resolve the transport behaviour of the different particle-size classes. The eight phases were defined as follows: water plus seven tailings phases based on the size fractions in Table 1: tailings1 (247 μm), tailings2 (165 μm), tailings3 (135 μm), tailings4 (59 μm), tailings5 (42 μm), tailings6 (33 μm), and tailings7 (30 μm). The experimentally determined mass fraction of each sieve class was retained when defining the seven granular phases, whereas the continuous particle-size distribution within each sieve interval was discretized using one nominal computational diameter. The adopted diameters of 247, 165, 135, 59, 42, 33, and 30 μm should therefore be interpreted as representative numerical diameters used for CFD discretization rather than independently measured d50 values. The volume fraction of each phase was calculated from the experimental design and size distribution and then specified in the solver. The computational domain was discretized using an unstructured polyhedral mesh. Because an unstructured polyhedral mesh was employed, fixed axial, radial, and circumferential cell counts analogous to those of a structured mesh are not uniquely defined. Therefore, the spatial resolution of the computational domain was characterized by the local cell size, near-wall layer configuration, and targeted refinement near the pipe invert. The final mesh used for the parametric simulations contained 1,011,023 polyhedral cells, 3,641,242 nodes, and 4,953,989 faces, including 4,747,273 interior faces, 206,478 wall faces, 119 velocity-inlet faces, and 119 pressure-outlet faces. The minimum and maximum characteristic cell sizes were approximately 2.0 mm and 25 mm, respectively. Local refinement was applied near the pipe wall and especially around the pipe invert, where large velocity and solids-volume-fraction gradients developed. The characteristic cell size in the near-invert region was approximately 2–4 mm. Six near-wall layers were employed with an initial layer height of approximately 2.0 mm and a growth ratio of 1.20. The mesh quality was evaluated using cell aspect ratio, skewness, and orthogonal quality. The mean and maximum aspect ratios were approximately 2.5 and 5.0, respectively. The mean skewness was approximately 0.25, while the maximum skewness remained below 0.75. The minimum orthogonal quality was approximately 0.25, with an average value of approximately 0.80. Standard wall functions were adopted for near-wall turbulence treatment. The wall values were maintained approximately within 35–220, which is consistent with the logarithmic-layer treatment of the adopted wall-function formulation. A three-grid convergence study was performed using approximately 585,083, 1,011,023, and 1,747,048 cells. The simulations were performed under steady-state conditions using the Phase Coupled SIMPLE algorithm for pressure–velocity coupling. Spatial gradients were evaluated using the Least Squares Cell Based method. Pressure interpolation employed the PRESTO! scheme. Momentum, turbulent kinetic energy, and turbulent dissipation rate were discretized using second-order upwind schemes, whereas the phase-volume-fraction equations were discretized using first-order upwind. The representative case with , , and , was selected. The relative deposited-bed heights predicted using the coarse, medium, and fine meshes were 0.14586, 0.14500, and 0.14440, respectively. The difference between the medium and fine meshes was approximately 0.42%. The observed convergence order was approximately 2.00, and the corresponding fine-grid GCI was approximately 1.18%. The corresponding pressure gradients were approximately 703.6, 700.0, and 697.5 Pa m−1 for the coarse, medium, and fine meshes, respectively. The medium-to-fine difference was approximately 0.36%, and the corresponding fine-grid GCI was approximately 1.02%. These results indicate that further mesh refinement produces only minor changes in both the hydraulic response and the predicted deposited-bed height. Therefore, the 1,011,023-cell mesh was adopted for all subsequent parametric simulations as a compromise between numerical accuracy and computational cost. A targeted parameter-sensitivity analysis was additionally performed to assess the influence of the granular-wall specularity coefficient and the maximum packing volume fraction on the predicted deposition behaviour. The representative case with Cₘ = 30%, u = 1.0 m s−1, and θ = 0° was used, and the relative deposited-bed height h/D and pressure gradient were selected as response quantities. For the specularity coefficient, values of 0.01, 0.05, and 0.10 were examined, with 0.05 retained as the baseline value. The corresponding h/D values were 0.1418, 0.1450, and 0.1496, respectively, while the pressure gradients were 696.8, 700.0, and 704.9 Pa m−1. Relative to the baseline case, the maximum variation in h/D was approximately 3.2%, whereas the pressure-gradient variation remained within approximately 0.7%. The maximum packing volume fraction was further varied from 0.60 to 0.66, with 0.63 used as the baseline value. The corresponding h/D values were 0.1487, 0.1450, and 0.1429, and the pressure gradients were 703.4, 700.0, and 698.2 Pa m−1, respectively. The maximum variation in h/D was approximately 2.6%, while the pressure-gradient variation remained within approximately 0.5%. These results show that, for the representative condition examined, the deposited-bed height is more sensitive to the two granular parameters than the bulk pressure gradient; nevertheless, the variations over the tested parameter ranges remained limited. All simulations were performed using ANSYS Fluent 2024. The production simulations employed the medium mesh containing 1,011,023 cells and were executed using four CPU cores.
2.3.3. Simulation Design
When slurry flows through a pipe, particularly at low velocity or high concentration, particle settling can exceed turbulent suspension, causing particles to accumulate at the pipe bottom and form a high-concentration, low-velocity deposited bed. The upper part of the pipe then contains a low-concentration, high-velocity suspended-flow region. To isolate the effects of inlet concentration and inlet velocity on relative deposited-bed height, horizontal-pipe cases were used. In a horizontal pipe, gravity acts perpendicular to the pipe axis, so deposition is dominated by radial settling and bottom accumulation without an axial gravitational component. This configuration clearly reveals the independent effects of concentration and velocity on bed formation and development. The inlet velocity and slurry concentration were then fixed while the pipe inclination was varied to examine its effect on bed thickness and its longitudinal distribution. The Wasp critical deposition velocities calculated using d85 were 1.65, 1.81, 1.94, and 2.05 m s−1 for inlet mass concentrations of 20%, 30%, 40%, and 50%, respectively. These values were used as reference velocities in the simulation matrix to represent near-critical transport conditions. The Wasp correlation was used only for engineering reference and simulation-case selection and was not imposed as a closure relation or boundary condition in the Eulerian CFD model. To further evaluate the influence of velocity on particle transport and deposition, a range of inlet velocities was considered at each concentration. For a mass concentration of , inlet velocities of u = 0.5, 1.0, 1.65, 2.5, and 3.0 m s−1 represent conditions below the critical velocity, close to or slightly above the critical velocity, and well above the critical velocity. Comparing solid-phase volume-fraction distributions, bottom deposition, and interphase stratification across these conditions reveals how velocity controls transport stability and deposition in inclined tailings pipelines. The inlet volume fraction of each solid phase was obtained by multiplying the total solid volume fraction by the corresponding measured particle-size fraction, while the water-phase volume fraction was calculated as the remainder to unity. The numerical simulation cases are summarized in Table 3, while the corresponding phase-specific inlet volume fractions are listed in Table 4. As an additional indication of the geometric scale of the dispersed phases, the particle-to-pipe diameter ratio di/D was calculated for the seven particle-size classes. With D = 0.20 m and di = 30–247 μm, di/D ranged from 1.50 × 10⁻⁴ to 1.235 × 10⁻³. The corresponding values for the seven classes were 1.235 × 10⁻³, 8.25 × 10⁻⁴, 6.75 × 10⁻⁴, 2.95 × 10⁻⁴, 2.10 × 10⁻⁴, 1.65 × 10⁻⁴, and 1.50 × 10⁻⁴, respectively. The Wasp analysis in Table 2 already provides a dimensionless critical-deposition parameter for gravity-controlled transport. Reynolds numbers based on an apparent slurry viscosity and particle Reynolds numbers based on local phase-slip velocities are not reported because these quantities were not independently available from the archived experimental and post-processing records; unsupported effective-viscosity or slip-velocity assumptions were therefore avoided.
Table 3.
Numerical simulation cases.
Table 4.
Phase-specific inlet volume fractions at different inlet mass concentrations.
3. Results and Discussion
3.1. Quantitative Definition of the Deposited-Bed Interface
At low inlet velocities or high slurry concentrations, solid particles preferentially accumulate near the pipe invert, resulting in a particle-enriched lower region with a relatively low water-phase volume fraction and an overlying suspension region with a higher water-phase volume fraction. Therefore, the transition between these two regions can be identified from the vertical variation in the water-phase volume fraction.
In the present Eulerian model, the computational domain contains one water phase and seven solid tailings phases, and the local phase-volume fractions satisfy
The total solid-phase volume fraction is defined as
Accordingly, the vertical gradients of the water phase and the total solid phase have equal magnitudes but opposite signs:
Consequently, the position of the maximum positive vertical gradient of the water-phase volume fraction is mathematically identical to the position of the maximum negative vertical gradient of the total solid-phase volume fraction. The deposited-bed interface was therefore defined from the water-phase profile as
which is equivalently expressed in terms of the total solid-phase volume fraction as
For the discrete water-phase volume-fraction profiles exported from Fluent, the gradient at an interior sampling point was evaluated using the central-difference expression.
where is the discrete vertical gradient at sampling point , is the local water-phase volume fraction, and is the corresponding vertical coordinate. Because the local vertical coordinate originates at the pipe invert, the deposited-bed thickness is , and the corresponding relative deposited-bed height is
The same gradient-based criterion was applied consistently to all operating conditions and axial monitoring locations. No fixed water-volume-fraction threshold or case-dependent manual adjustment was introduced. Owing to the local phase-volume-fraction closure, the maximum positive gradient of the water phase and the maximum negative gradient of the total solid phase identify exactly the same interface location. Thus, the water-phase volume fraction provides a direct and reproducible indicator for locating the deposited-bed interface in the present multiphase model.
Notably, when the inlet velocity exceeded the critical deposition velocity, the relative bed height did not become zero but approached a small, stable value. The critical deposition velocity represents the minimum mean velocity required for stable transport without sustained deposition or blockage; it does not imply that every particle is fully suspended. Owing to the low-velocity near-wall region, differences in particle size, and the gravitational settling of coarse particles, some particle enrichment persists at the pipe bottom. Thus, above the critical velocity, the bed thickness decreases substantially and then stabilizes rather than disappearing completely.
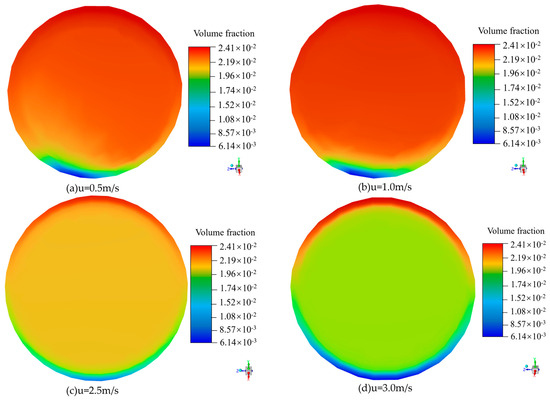
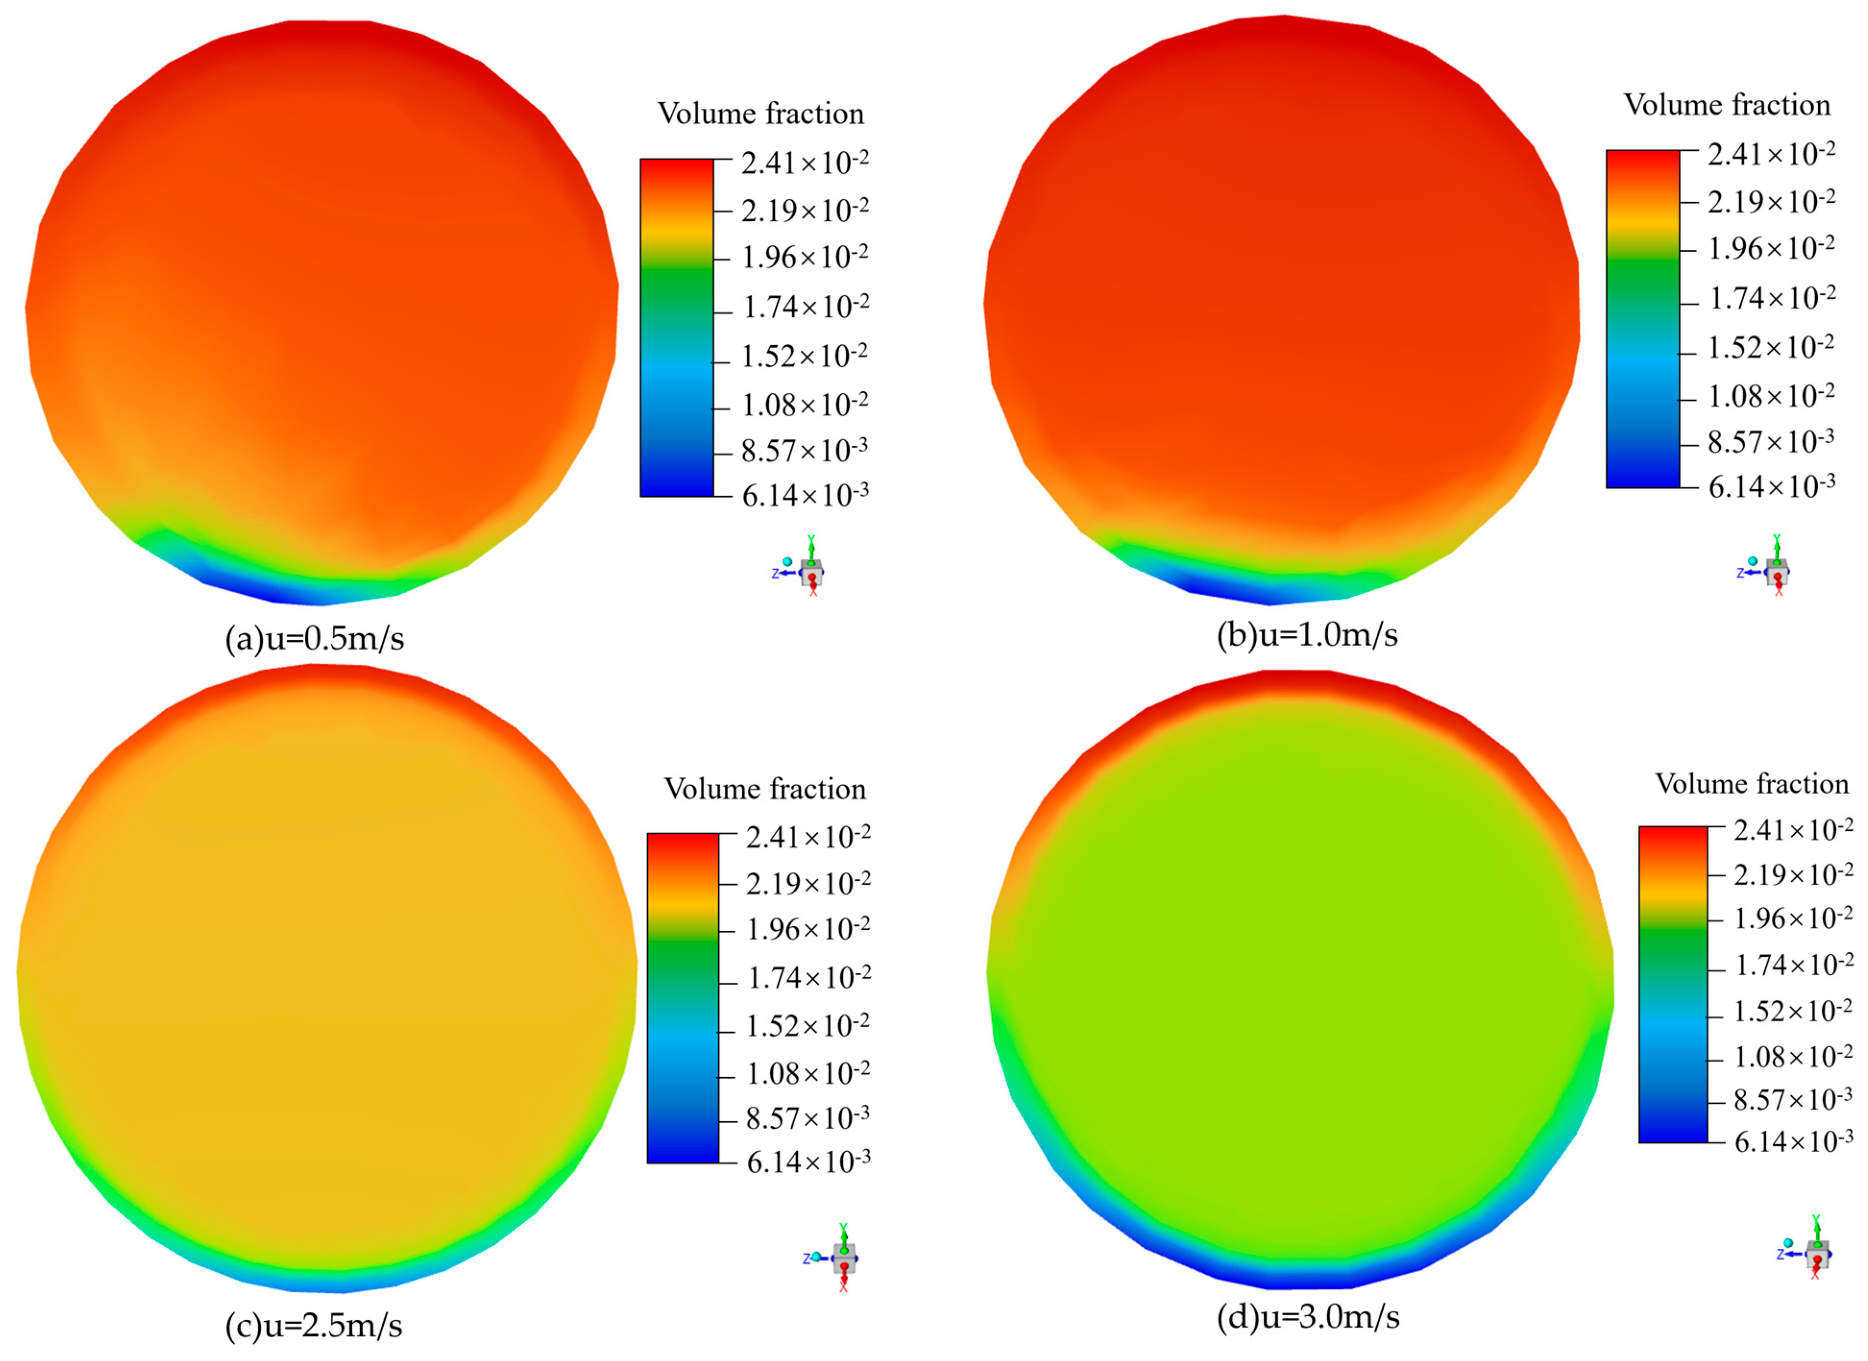
Although the total solid-phase volume fraction provides an intuitive representation of particle accumulation, the water-phase volume fraction contains exactly the same interface information because . Accordingly, the water-phase contours are retained in Figure 3, while the deposited-bed interface is identified quantitatively from the maximum positive gradient of . Owing to space limitations, only the simulated water-phase volume-fraction contours for the horizontal pipe () at different inlet velocities are shown in Figure 3.
Figure 3.
Water-phase volume-fraction contours.
3.2. Effects of Inlet Conditions on Relative Deposited-Bed Height
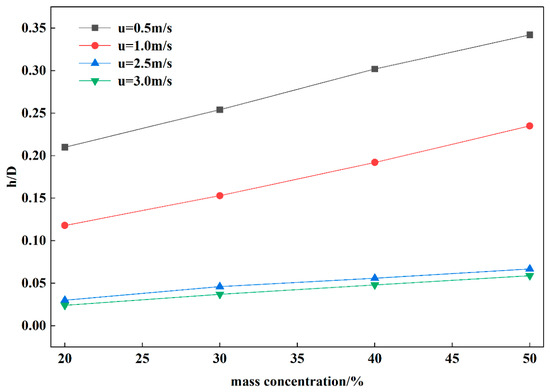
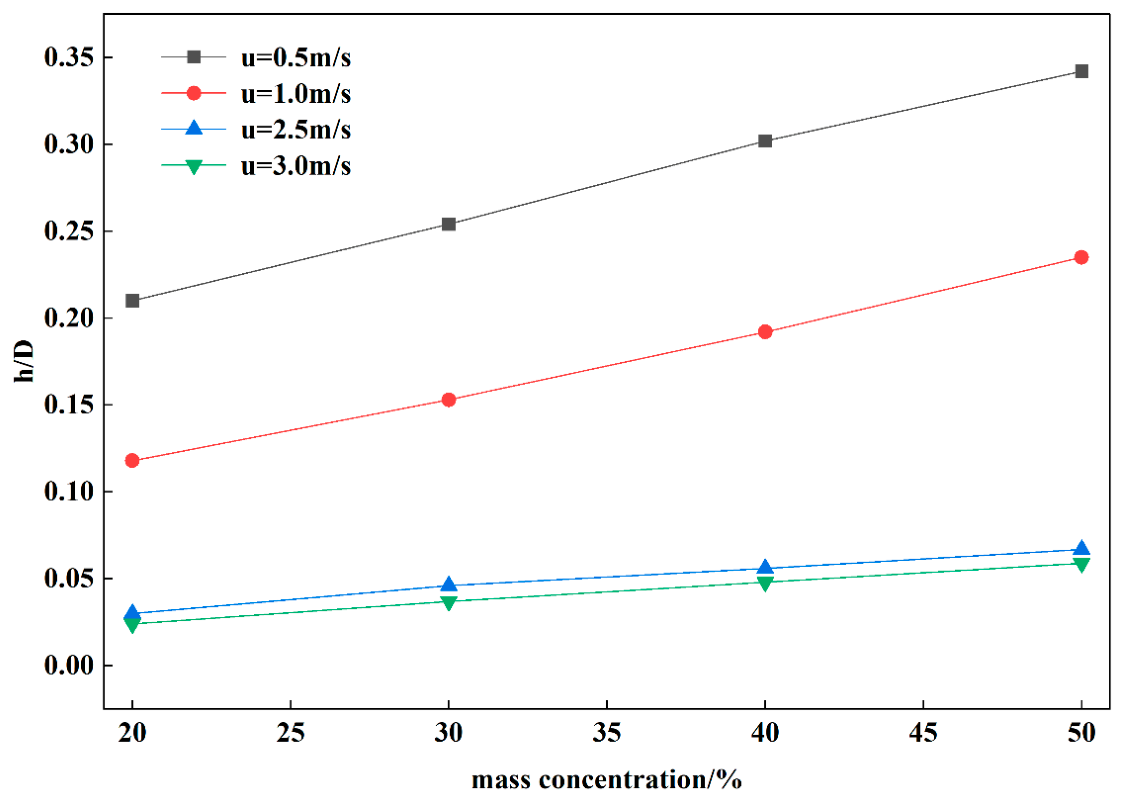
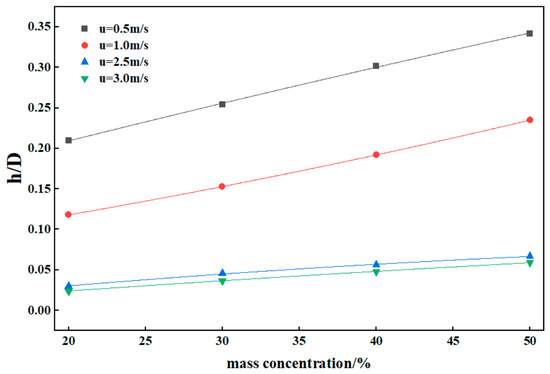
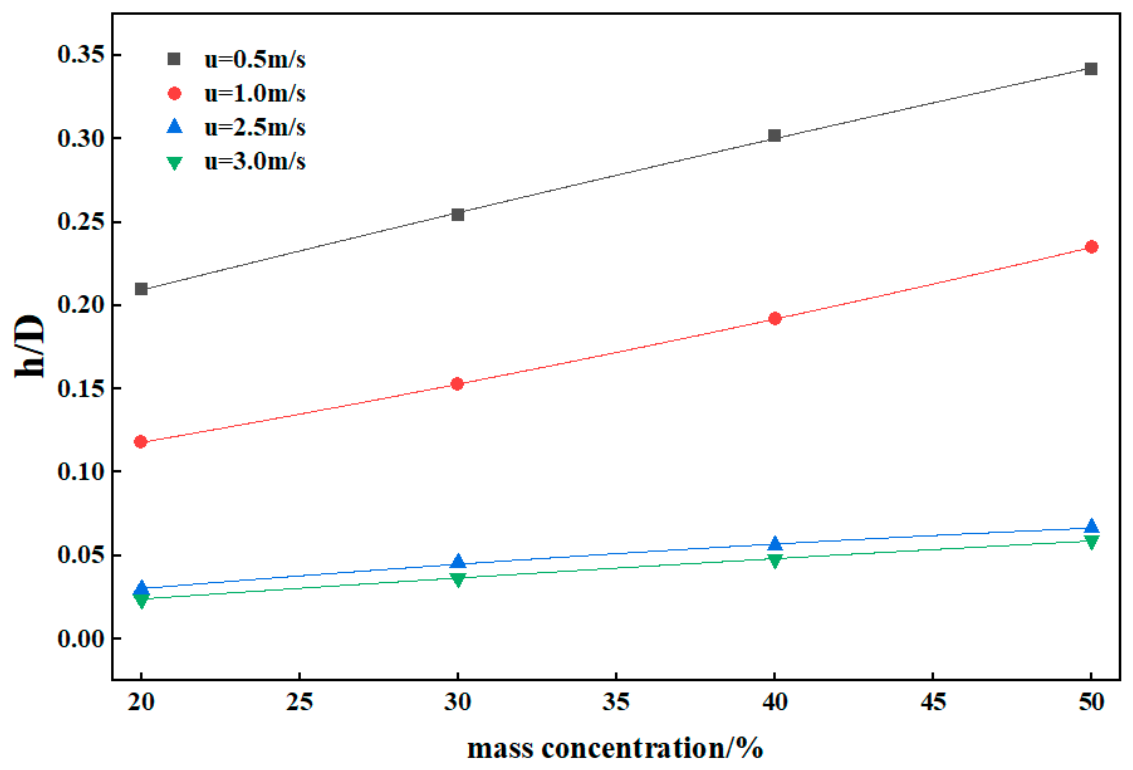
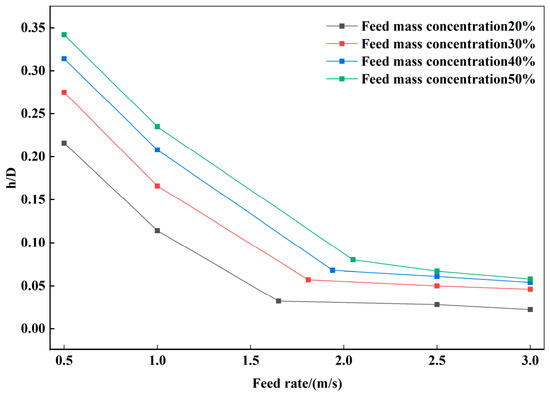
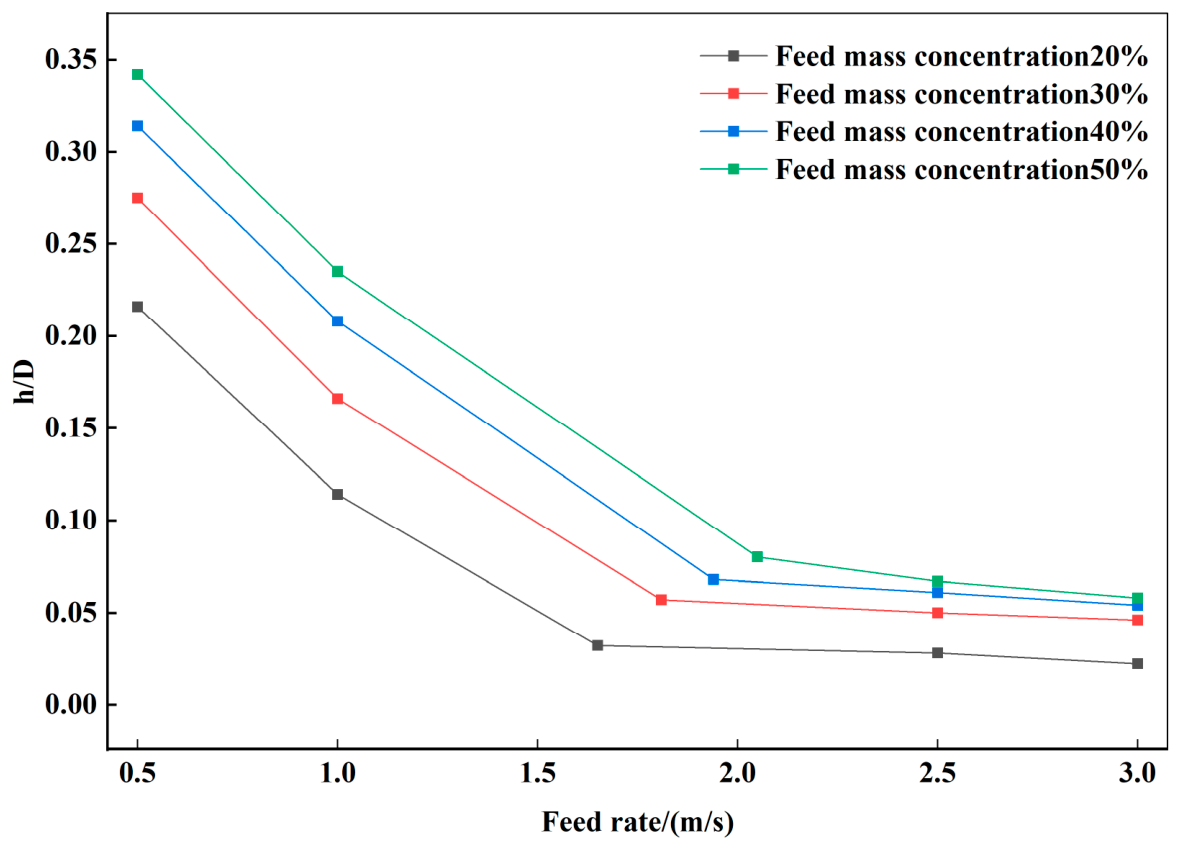
Unless otherwise specified, the relative deposited-bed heights used in Figure 4, Figure 5, Figure 6, Figure 7 and Figure 8 were extracted from the cross-section located at 50 m from the pipe inlet, where the vertical water-phase-volume-fraction profile was used to determine the bed interface according to the criterion defined in Section 3.1. The transport behaviour of tailings slurry is closely related to particle size, velocity, pipe inclination, and slurry concentration. Solid–liquid two-phase distributions were therefore simulated under different velocities, concentrations, and inclinations.
Figure 4.
CFD-predicted relative deposited-bed height (h/D) as a function of inlet mass concentration.
Figure 5.
Regression curves for relative deposited-bed height (h/D) versus inlet mass concentration.
Figure 6.
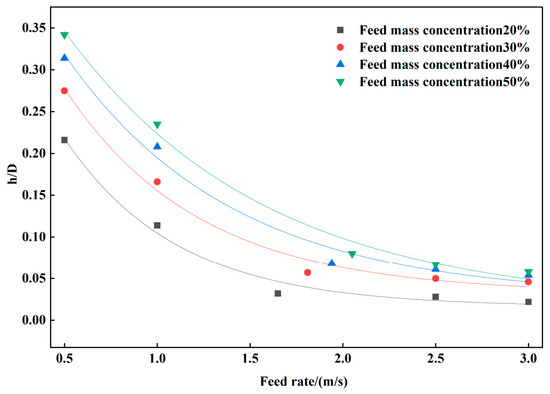
CFD-predicted relative deposited-bed height (h/D) as a function of inlet velocity.
Figure 7.
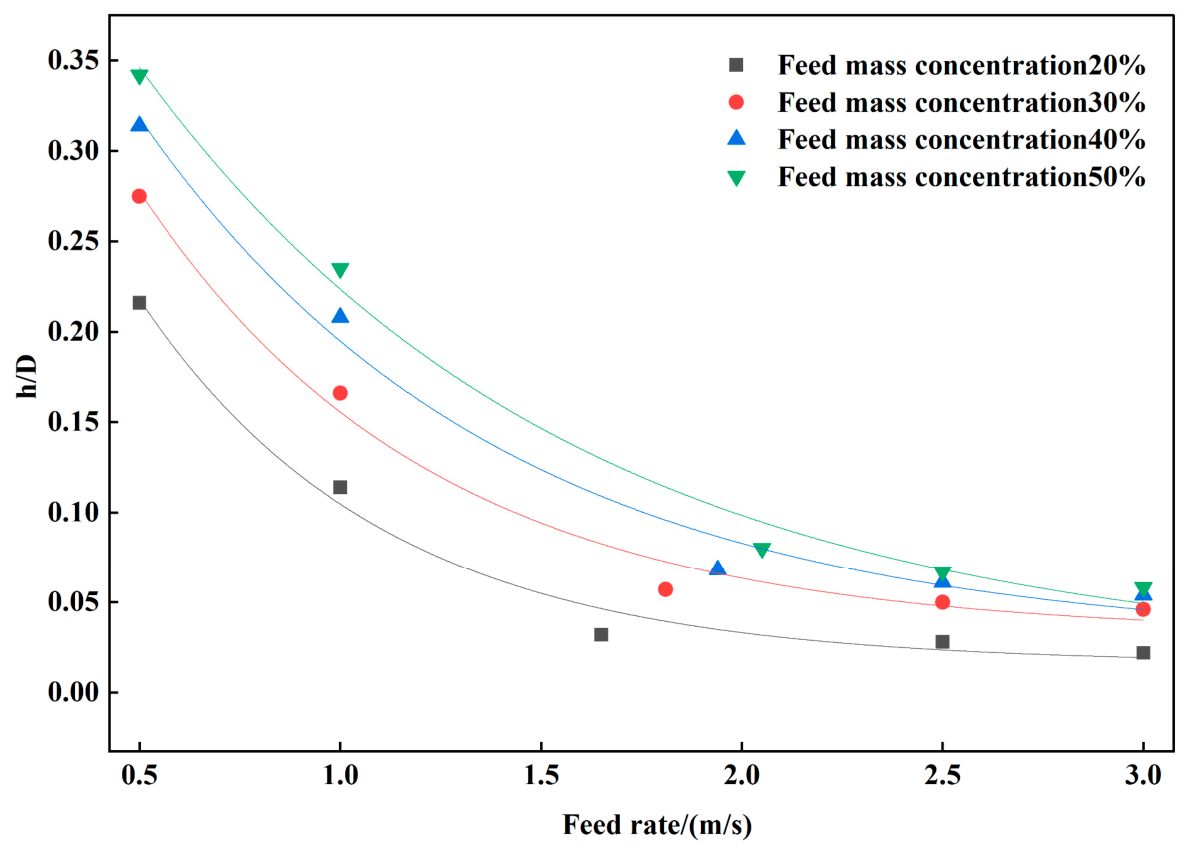
Regression curves for relative deposited-bed height (h/D) versus inlet velocity.
Figure 8.
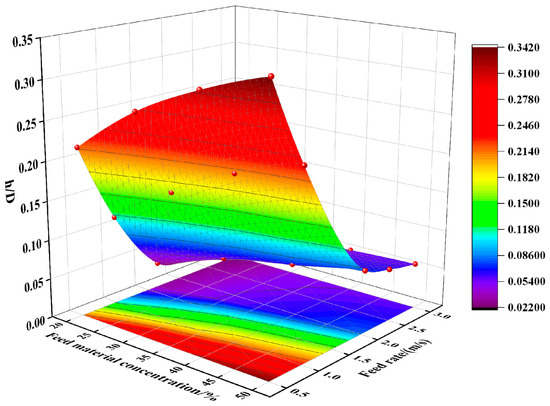
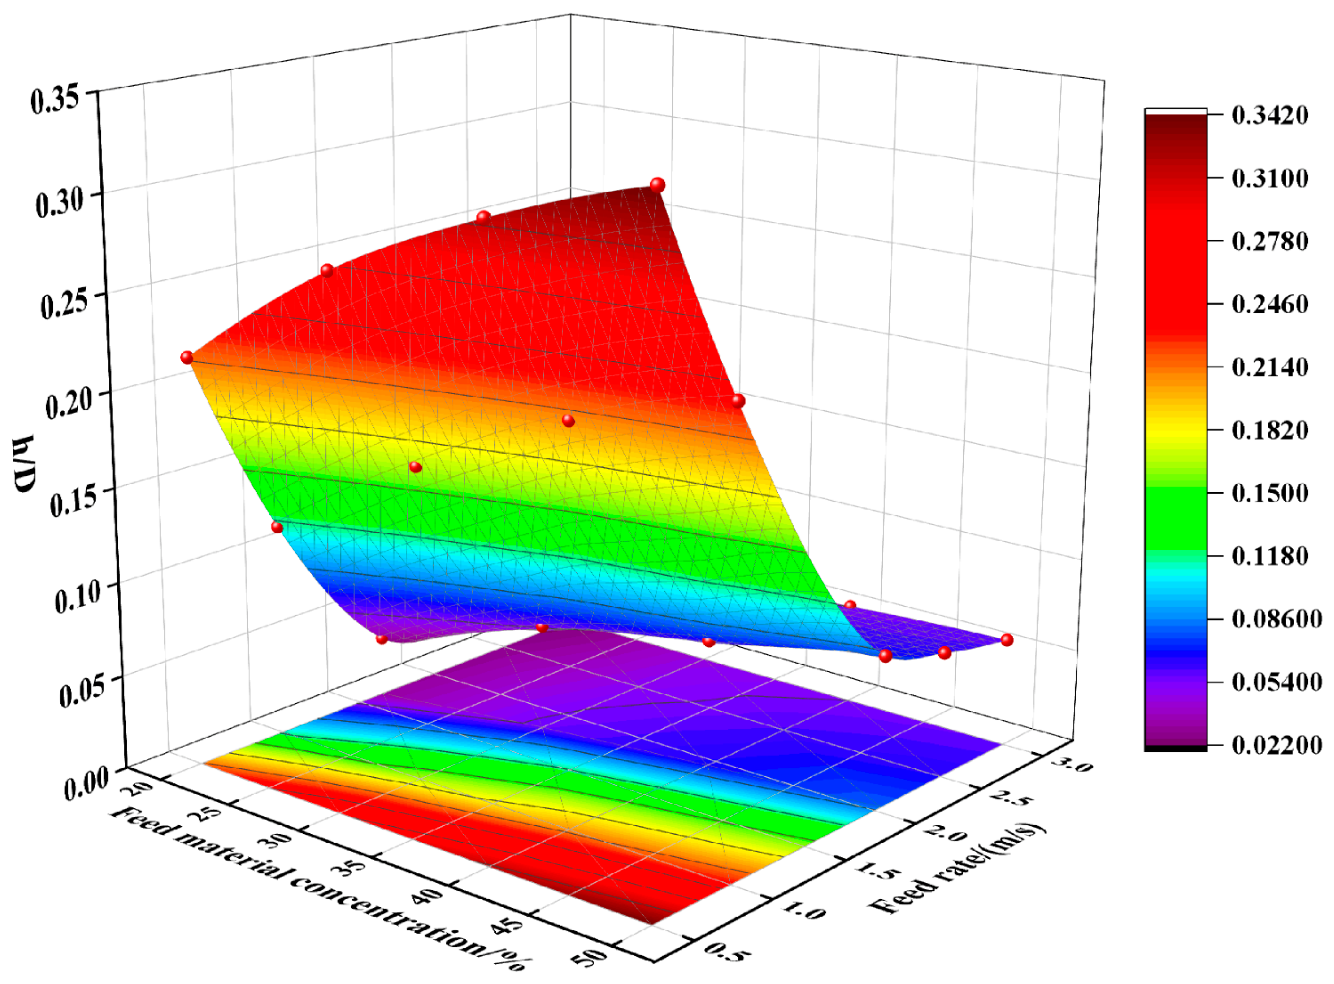
Response surface of relative deposited-bed height (h/D) as a function of mass concentration and inlet velocity.
3.2.1. Relationship Between Relative Deposited-Bed Height and Inlet Concentration
The numerical results were used to plot the relative deposited-bed height as a function of inlet mass concentration (Figure 4). The relative bed height increased with mass concentration. Equation (20) was therefore used to fit the relationship, and regression curves for different inlet velocities are shown in Figure 5. The regression equations are listed in Table 5. Figure 4 presents the original CFD-predicted data, whereas Figure 5 presents the corresponding regression relationships obtained from these numerical results. The two figures are therefore retained separately to distinguish the numerical predictions from the fitted models.
Table 5.
Regression equations for relative deposited-bed height (h/D) versus mass concentration.
The fitted expression is:
where is mass concentration (%), h/D is relative deposited-bed height, and , and are fitting parameters.
The coefficients of determination () ranged from 0.9906 to 0.9998, indicating that the fitted curves reproduced the simulated data closely within the investigated concentration range. Relative bed height increased nonlinearly with mass concentration. At low concentrations, the increasing number of tailings particles intensified settling and rapidly increased the relative bed height. As concentration rose further, particle–particle collisions and interactions became stronger, and the bed continued to thicken, but its rate of growth gradually decreased.
3.2.2. Relationship Between Relative Deposited-Bed Height and Inlet Velocity
The numerical results were used to plot relative deposited-bed height against inlet velocity (Figure 6). The relationship exhibited clear exponential decay: the relative bed height decreased rapidly as inlet velocity increased and gradually approached a stable value at high velocities. The simulated results at different inlet mass concentrations were fitted using the ExpDec1 function in Origin 2026. The resulting regression curves are shown in Figure 7, and the equations are listed in Table 6. Figure 6 presents the original CFD-predicted data, while Figure 7 shows the corresponding ExpDec1 regression relationships. Separate presentation was retained to distinguish the numerical results from the fitted models and to avoid excessive graphical overlap.
Table 6.
Regression equations for relative deposited-bed height (h/D) versus inlet velocity.
The fitted expression is:
where u is the inlet velocity, and , , and are fitting parameters.
The coefficients of determination () ranged from 0.98835 to 0.99308, indicating that the fitted curves reproduced the simulated data closely within the investigated inlet-velocity range. Inlet velocity had a pronounced effect on bed development. At low velocity, the slurry had insufficient particle-carrying capacity and the relative bed height was high. As velocity increased, shear and turbulent dispersion intensified, re-entraining deposited particles into the suspension region and substantially decreasing the relative bed height. At high velocities, the relative bed height remained small, indicating that tailings were transported predominantly in suspension and that only a weak deposited bed formed near the bottom.
3.2.3. Joint Relationship of Relative Deposited-Bed Height with Inlet Velocity and Mass Concentration
In practical tailings-slurry pipelines, inlet velocity and mass concentration vary rather than remaining constant. A three-dimensional correlation model was therefore developed for relative deposited-bed height as a function of inlet velocity and mass concentration. The fitted response surface is shown in Figure 8, and the three-dimensional regression equations are given in Equations (22) and (23). Based on the data trend, the following three-dimensional response function was adopted:
where is inlet mass concentration (%), and , , and are fitting parameters.
Fitting the simulated data yields:
The results demonstrate a clear nonlinear coupled relationship between relative deposited-bed height, inlet velocity, and mass concentration. The fitted three-dimensional relation provides an empirical representation of the simulated relationship among relative deposited-bed height, inlet velocity, and mass concentration within the investigated parameter range. The fitted three-dimensional relation is used only as an empirical representation of the simulated trends within the investigated parameter range and should not be extrapolated beyond this range without additional numerical or experimental validation. At a fixed mass concentration, bed thickness decreases rapidly in the low-velocity range and more gradually at higher velocities. At a fixed inlet velocity, bed thickness increased with mass concentration because the greater particle inventory intensified bottom deposition and promoted formation of a thicker deposited bed. Thus, increasing mass concentration promotes bed development, whereas increasing inlet velocity effectively reduces bed thickness; together, these variables control the deposition distribution of tailings slurry in the pipe. Accordingly, the fitted relationships presented in this study should be applied only within the investigated ranges of mass concentration and inlet velocity, and extrapolation beyond these conditions requires additional numerical or experimental validation.
3.2.4. Relationship Between Relative Deposited-Bed Height and Pipe Inclination
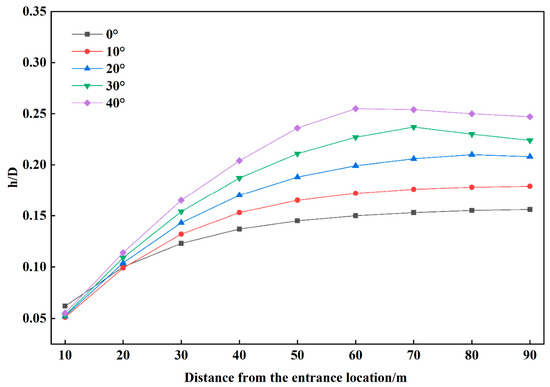
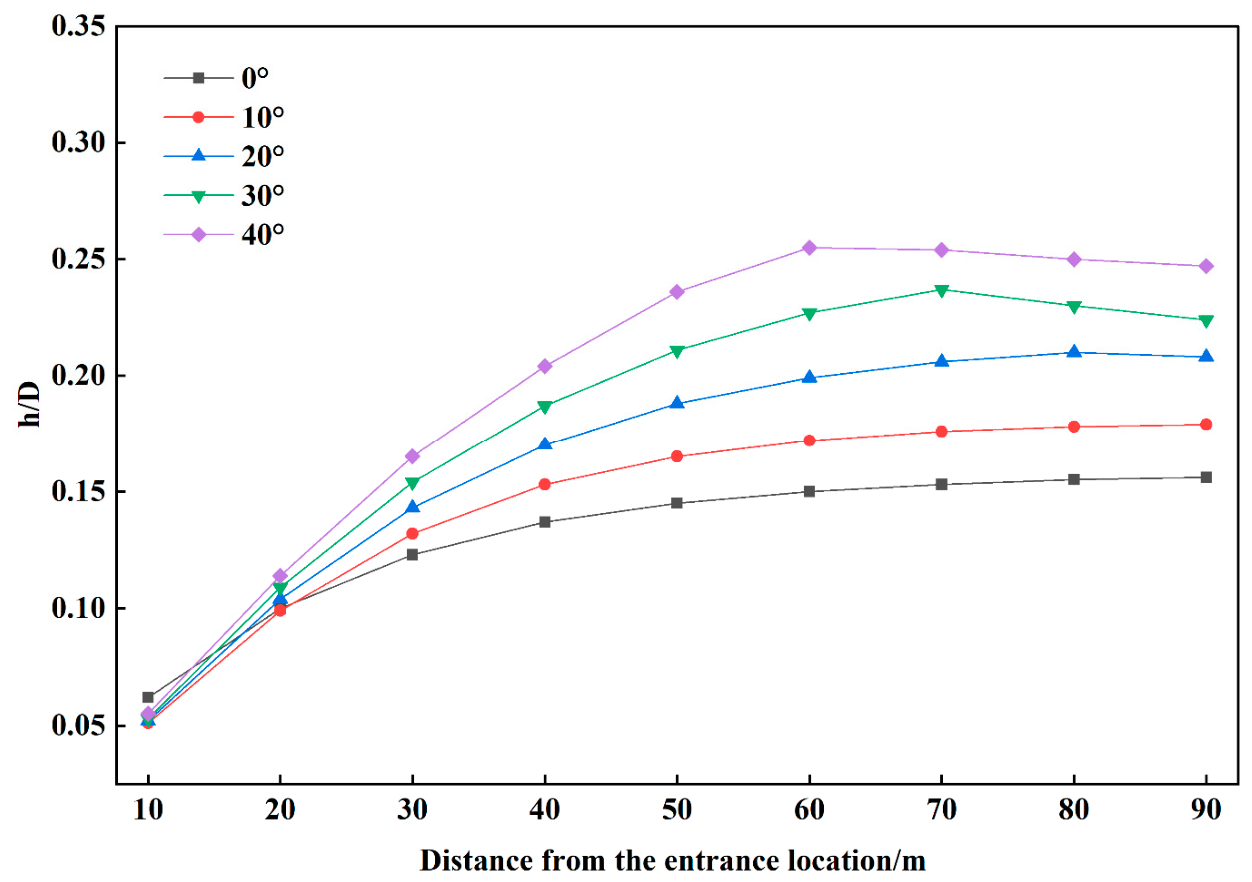
To quantify the longitudinal variation in deposited-bed thickness at different pipe inclinations, monitoring cross-sections were defined at 10 m intervals along the pipe. At each cross-section, a monitoring line was placed along the vertical diameter, and the distributions of tailings solid-phase volume fraction at different elevations were exported using Fluent post-processing. Owing to space limitations, only the results for an inlet velocity of u = 1.0 m s−1 and an inlet mass concentration of 30% are reported in Table 7.
Table 7.
Relative deposited-bed height (h/D) along the pipeline.
As shown in Figure 9, increasing inclination increases the component of gravity parallel to the pipe axis and decreases the component perpendicular to it. In upward transport, the axial gravitational component opposes slurry motion, weakens the axial conveying capacity of tailings particles, and promotes slip and local accumulation. The longitudinal evolution of deposited-bed height exhibited different characteristics among the inclination cases. Near the inlet (x = 10 m), the horizontal pipe produced a slightly greater relative deposited-bed height (h/D = 0.062) than the inclined cases (h/D = 0.051–0.055), indicating that the influence of inclination was not monotonic within the inlet-development region. Farther downstream, the longitudinal response differed with inclination. For the 0–20° cases, h/D generally increased downstream and gradually approached a relatively stable value. The 0° case increased from 0.062 at 10 m to 0.156 at 90 m, while the 10° case increased from 0.051 to 0.179. The 20° case likewise increased over most of the pipe length and showed only a slight decrease from 0.210 at 80 m to 0.208 at 90 m. At larger inclinations, the longitudinal distribution became non-monotonic. For 30°, h/D reached a maximum of 0.237 at approximately 70 m and subsequently decreased to 0.224 at 90 m. For 40°, the maximum h/D of 0.255 occurred earlier, at approximately 60 m, followed by a gradual decrease to 0.247 at 90 m. Therefore, increasing inclination does not produce a uniform increase in deposited-bed height at every axial position. Instead, larger inclinations generally increase bed height over much of the developed-flow region and shift the maximum-bed-height location toward the middle and upstream portions of the pipe.
Figure 9.
Relative deposited-bed height (h/D) versus distance from the inlet.
3.3. Radial Particle-Size Segregation in the Pipeline
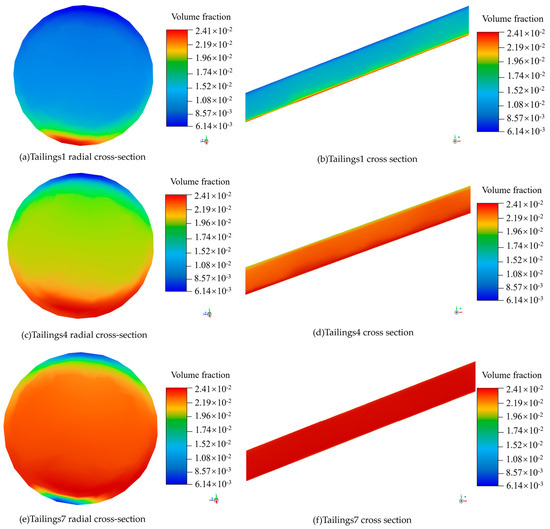
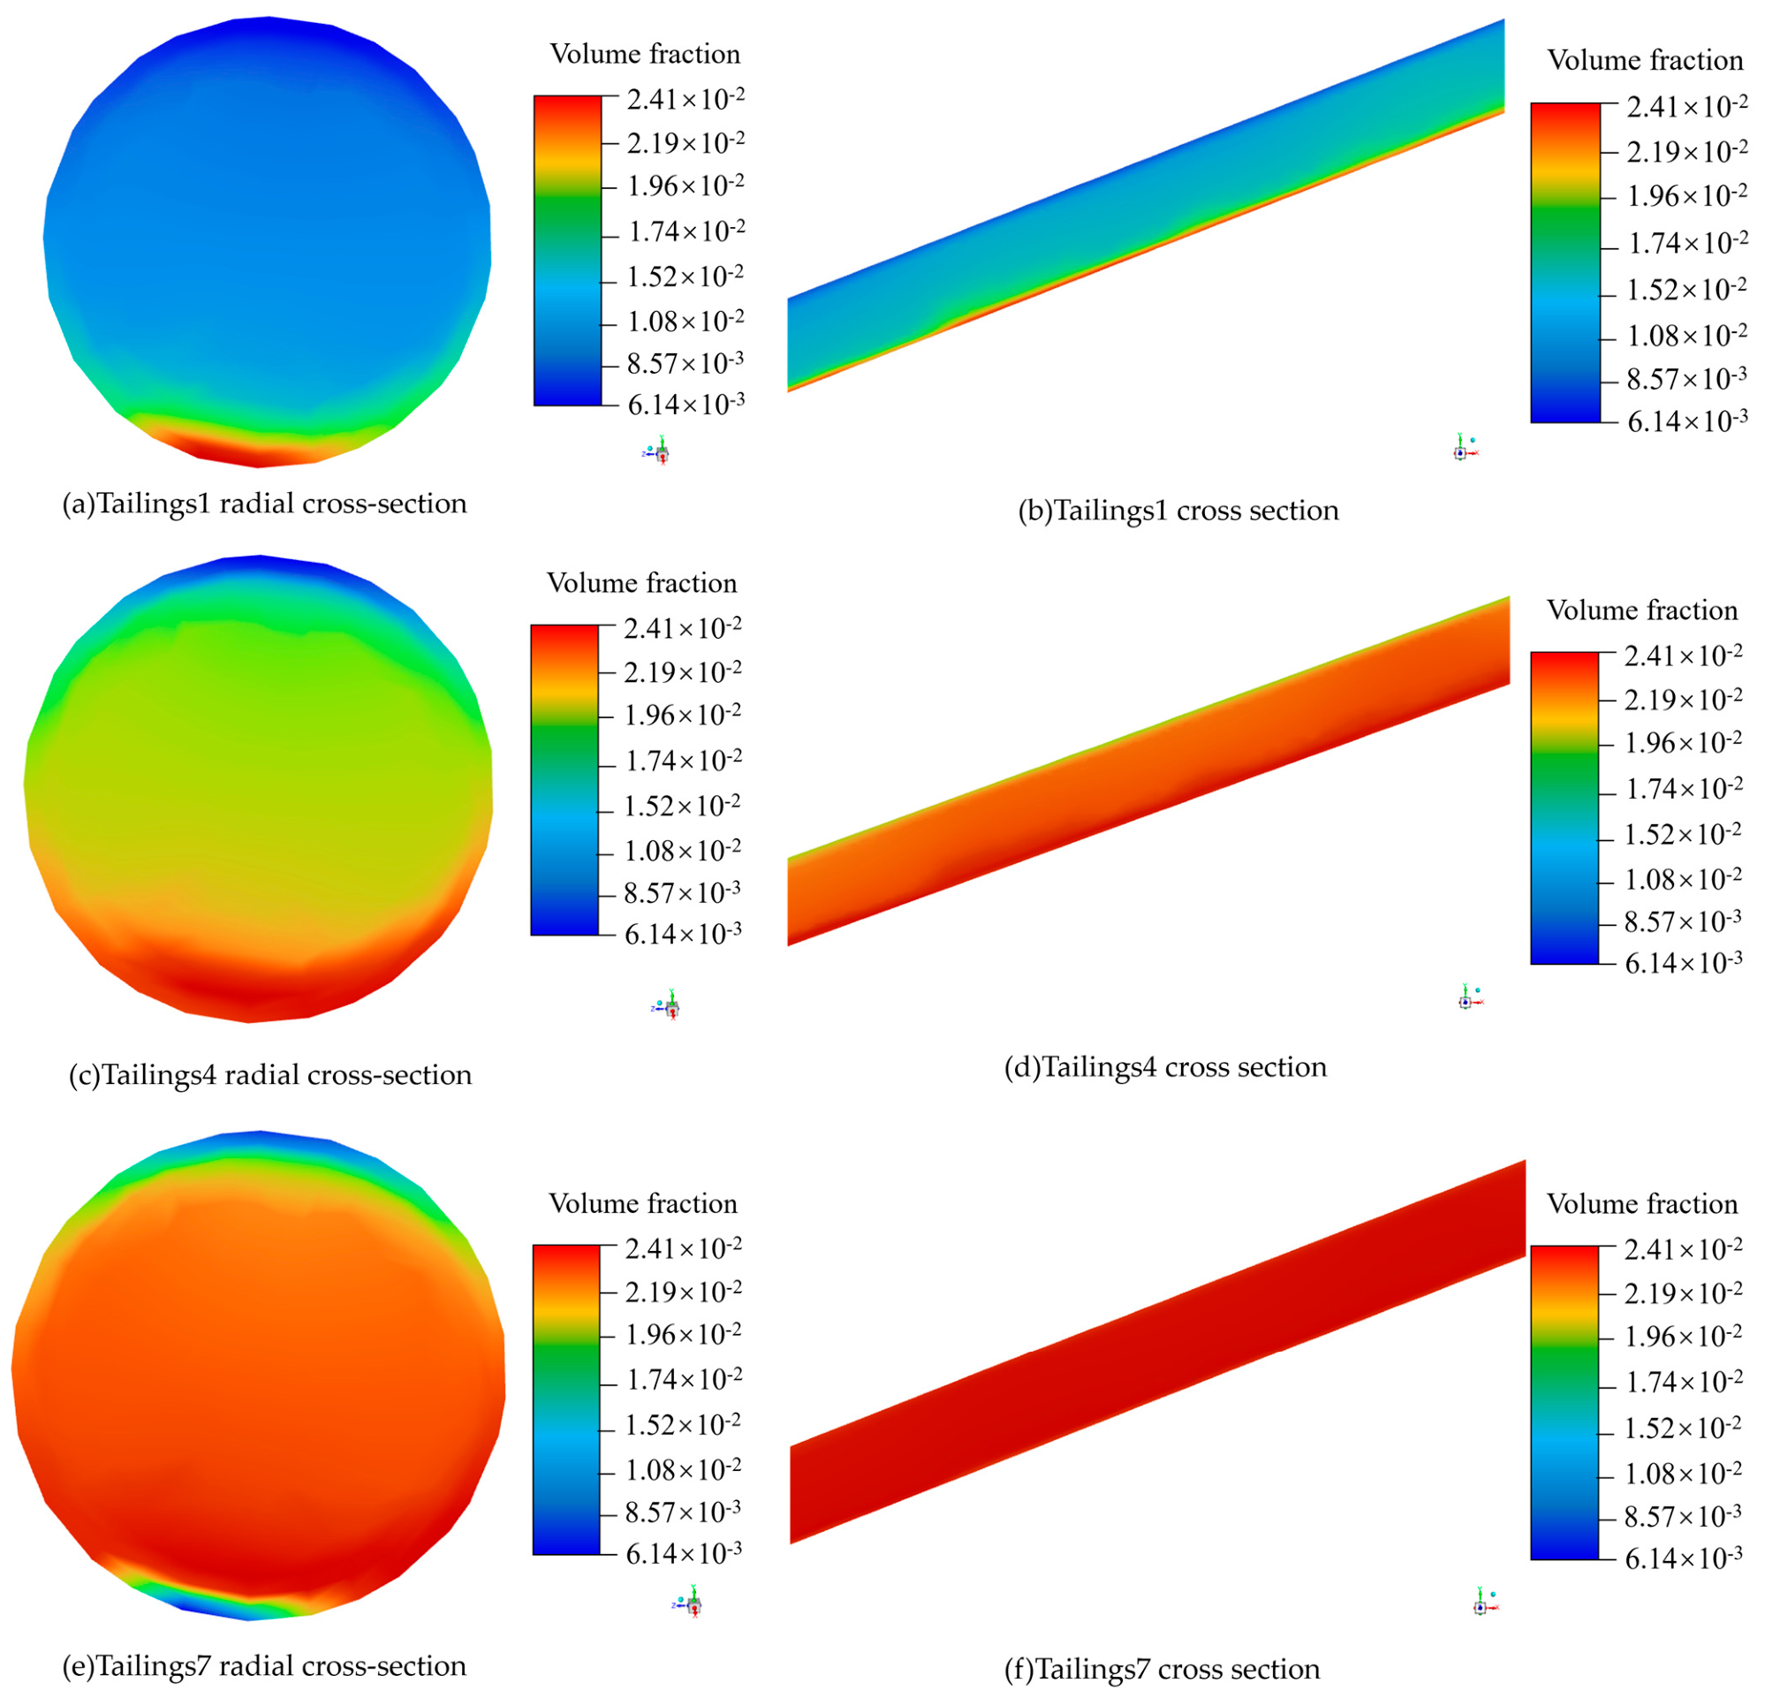
During pipeline transport, particles of different sizes distribute non-uniformly in the radial direction because of gravitational settling, turbulent dispersion, particle–particle collisions, and the wall boundary layer. A radial cross-section was positioned at the pipe centre (50 m from the inlet). Owing to space limitations, only the simulation results for tailings1 (247 μm), tailings4 (59 μm), and tailings7 (30 μm) at an inlet velocity of 1.0 m s−1, pipe inclination of 40°, and mass concentration of 30% are shown in Figure 10. The particle-size distributions shown in Figure 10 are used to illustrate the qualitative radial-segregation tendency under the representative operating condition. Because complete particle-size-specific vertical concentration profiles were not retained in the archived post-processing dataset, no quantitative segregation coefficient or vertical-profile comparison is reported here. Accordingly, the discussion is restricted to the relative distribution characteristics directly observable for the three representative particle sizes shown.
Figure 10.
Phase-distribution contours.
Figure 10a,b show high-volume-fraction red and yellow regions for 247 μm coarse particles at the pipe bottom, whereas the upper part of the pipe is predominantly blue, indicating a low particle volume fraction. These coarse particles are strongly affected by gravitational settling, migrate readily to the pipe bottom, and form a bottom-enriched zone. Figure 10c,d show that 59 μm particles also exhibit bottom enrichment, with higher volume fractions near the bottom and wall and lower fractions in the upper region. Compared with the 247 μm particles, however, their radial distribution is more uniform: the bottom high-concentration zone is broader but the concentration gradient is weaker. Figure 10e,f show extensive red and orange regions for tailings7 (30 μm), with only small local variations near the boundary. Under the representative condition shown in Figure 10, the 30 μm fraction exhibited a more uniform cross-sectional distribution than the 59- and 247 μm fractions. This observation is qualitative and should not be interpreted as a quantitative segregation threshold for all particles finer than 59 μm. They are strongly affected by turbulent dispersion and entrainment by the water phase, have low settling velocities, and do not readily form a distinct deposited bed on their own.
The contour plots reveal clear radial size segregation of tailings particles. Under the combined influence of gravity and turbulent dispersion, coarse particles preferentially migrate toward the pipe bottom, whereas fine particles are more likely to remain suspended in the liquid-phase core flow. The 247, 165, and 135 μm size classes were concentrated mainly at the bottom and in the near-bottom region and were the principal contributors to deposited-bed formation. The 59 and 42 μm fractions were distributed mainly in the central and lower regions and retained partial suspension. The 33 and 30 μm fractions were strongly influenced by turbulent dispersion and were relatively uniform across the cross-section, contributing mainly to suspended transport. Radially, the total solid-phase volume fraction was highest at the pipe bottom, where coarse particles were most abundant; the pipe centre formed a mixed coarse-fine suspension zone, whereas the pipe top had the lowest solid-phase volume fraction and was dominated by fine particles. It should be noted that the <500-mesh fraction accounts for 40.87% of the total tailings mass but is represented by a single 30 μm solid phase in the present model. The simulations show that the 30 and 33 μm phases are distributed comparatively uniformly across the pipe cross-section, whereas the 247, 165, and 135 μm fractions exhibit substantially stronger bottom enrichment and make the dominant contribution to deposited-bed formation. The present results therefore indicate that the overall bed-formation behaviour is more strongly controlled by the medium-to-coarse fractions. Nevertheless, representing the broad <500-mesh fraction by a single diameter may influence the detailed suspension and turbulent-dispersion behaviour predicted for the fine particles. This discretization should therefore be regarded as a limitation of the present model. Future work should resolve the fine-particle fraction using wet laser-diffraction measurements and additional fine-particle size classes. The predicted size-segregation behaviour should also be interpreted in light of the spherical-particle assumption. Real sulfide tailings particles may be angular or irregular rather than perfectly spherical. Such deviations in particle shape can modify the effective drag coefficient, rotational behaviour, particle–wall contacts, and terminal settling velocity. Consequently, the absolute settling rate and the detailed near-bottom concentration distribution may differ from those predicted for equivalent spherical particles. Nevertheless, the present simulations consistently show that the larger 247, 165, and 135 μm fractions exhibit stronger bottom enrichment than the finer fractions, indicating that the qualitative size-dependent segregation trend is robust within the adopted modelling framework. It should be noted that the <500-mesh fraction accounted for 40.87% of the total tailings mass but was represented by a single nominal diameter of 30 μm because no wet laser-diffraction data were available to resolve its internal size distribution. This discretization is a simplification of the actual fine-particle PSD and may influence the detailed predicted suspension, dispersion, and radial segregation of the finest particles. Therefore, the results for this fraction should be interpreted at the representative size-class level rather than as a fully resolved continuous fine-particle distribution. Future work should employ wet laser diffraction and a finer PSD discretization to characterize this fraction more accurately. The seven-size-class representation therefore enables the size-dependent segregation behaviour of the measured tailings grading to be resolved explicitly. Nevertheless, because no monodisperse or reduced-size-class simulations were performed, the present results should not be interpreted as demonstrating quantitatively superior predictive accuracy over simplified particle-size representations.
4. Hydraulic Validation Against Industrial Pressure-Gradient Data
4.1. Industrial Test Conditions and Results
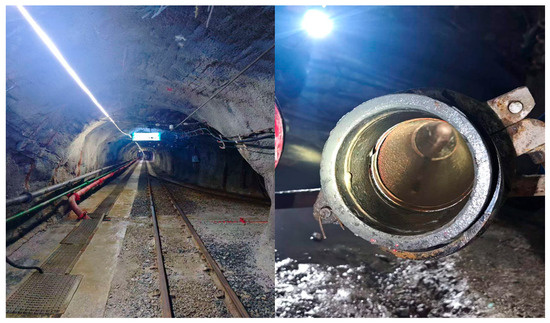
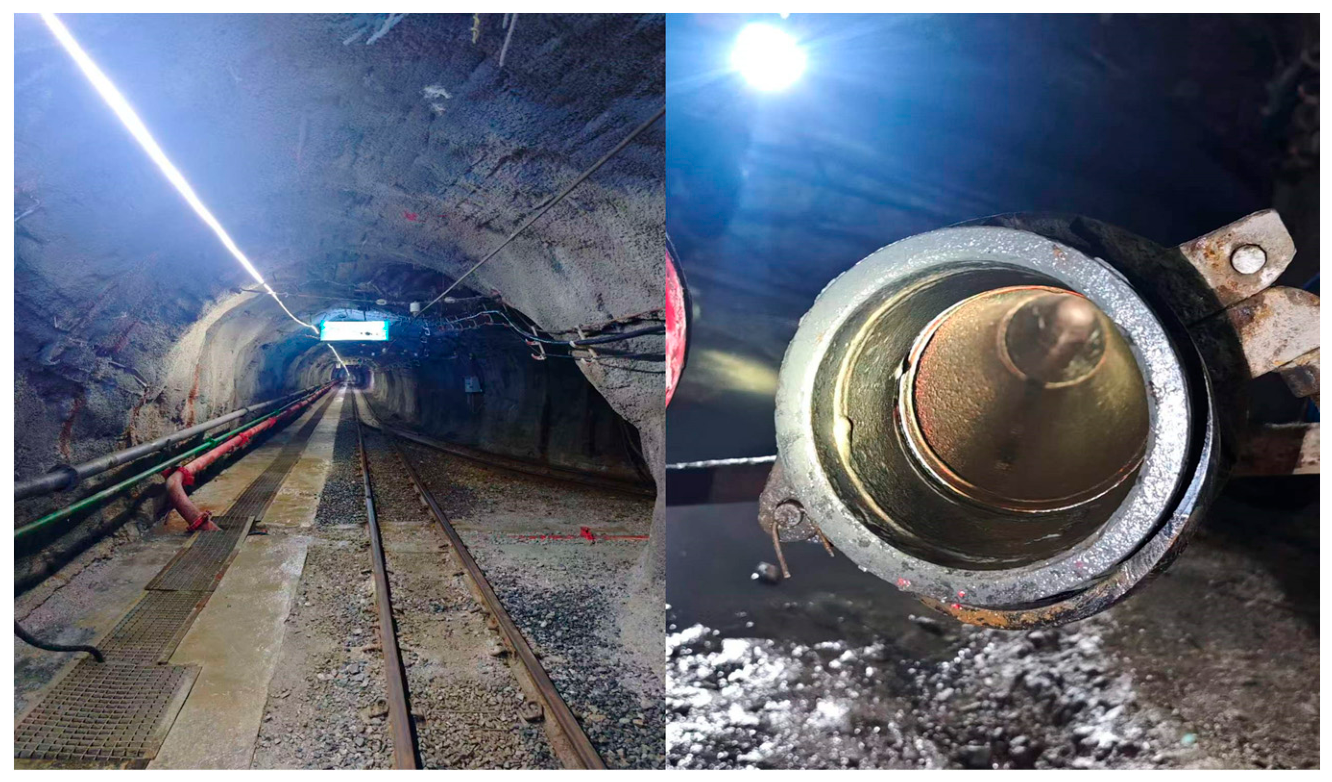
A pilot-scale industrial pipeline test was conducted to validate the slurry-transport performance predicted by the numerical model. The on-site photograph is shown in Figure 11. Tests were performed at a mass concentration of 30% and at inlet velocities of 1.00–2.50 m s−1. To quantify the hydraulic resistance under representative operating conditions, the test was performed at the preparation station of a tin mine in Yunnan Province, China. The readings from the pressure-monitoring system were used to calculate the measured pressure gradient along the pipeline. Table 8 compares the measured pressure gradients with the corresponding numerical predictions for the nine validation cases. Replicate-based uncertainty statistics for the field pressure-gradient measurements were not retained in the available industrial records; therefore, measurement error bars are not reported. The comparison is based on the recorded values for the nine operating cases.
Figure 11.
Field pictures and pressure detection arrangement.
Table 8.
Comparison of simulated and industrially measured pressure gradients.
The model reproduced the increase in pressure gradient with both pipe inclination and inlet velocity. For example, at an inlet velocity of 1.00 m s−1, the measured pressure gradient increased from 684.257 Pa m−1 at an inclination of 10° to 1358.233 Pa m−1 at 30°, and the simulation captured the same trend. Across all nine validation cases, the simulated pressure gradients were consistently, but only slightly, higher than the industrial measurements, with absolute differences of 14.295–51.384 Pa m−1. The relative error ranged from 1.05% to 4.28%, while the mean absolute percentage error was 2.86% and the overall relative deviation was 2.77%. These results demonstrate that the Eulerian multiphase model accurately predicts the hydraulic behaviour of slurry pipeline transport within the tested ranges of concentrations, velocities, and inclinations.
4.2. Scope and Limitations of Hydraulic Validation
The available industrial measurements consist exclusively of pressure-gradient data. Therefore, the present field comparison provides validation only for the hydraulic resistance predicted by the numerical model. The agreement between measured and simulated pressure gradients supports the model’s ability to reproduce the bulk hydraulic response within the investigated operating range, but it should not be interpreted as direct experimental validation of all particle-scale or deposition-related predictions.
In particular, deposited-bed height, near-bottom solids concentration, radial particle-size segregation, and the movement or stationarity of the deposited bed were not measured independently in the available industrial tests. These quantities should therefore be regarded as numerical predictions of the present Eulerian–granular model rather than field-validated observables. Similarly, the Wasp critical deposition velocity used in this study serves as an engineering reference for selecting representative transport conditions and was not independently validated by direct field measurements of deposition onset.
Future validation should incorporate direct measurements of deposited-bed height, local solids-concentration profiles, particle-size-resolved radial distributions, and bed-motion behaviour under controlled operating conditions. Such measurements would allow a more comprehensive assessment of the model’s capability to predict particle segregation and deposited-bed development in addition to its hydraulic response. A further limitation concerns slurry rheology. No independent rheological measurements, such as apparent-viscosity, yield-stress, or flow-curve tests, were available for the present tailings slurry. The carrier liquid was therefore represented as Newtonian water, while the effects of the solid phase were treated explicitly through the Eulerian granular framework rather than through an equivalent non-Newtonian slurry-viscosity model. This approximation is considered more appropriate for the present multiphase formulation than assigning a single bulk apparent viscosity to the mixture. Nevertheless, at the highest mass concentration of 50% (corresponding to a solids volume fraction of approximately 24.74%), interactions among fine particles may produce concentration-dependent apparent viscosity or weak non-Newtonian behaviour that is not fully represented by the present liquid-phase model. Consequently, the predicted pressure loss, suspension behaviour, and fine-particle distribution at the highest concentration may contain additional rheological uncertainty. Future work should include direct rheological measurements and compare the present Eulerian–granular formulation with concentration-dependent or non-Newtonian rheological descriptions. Another limitation concerns particle shape. The present model assumes equivalent spherical particles because detailed particle-shape measurements were not available. In reality, sulfide tailings particles may exhibit angular and irregular morphologies. Non-spherical particles generally experience different drag, rotation, and wall-contact behaviour from spherical particles, which may influence settling velocity, suspension, and local bed packing. Therefore, the predicted absolute deposited-bed height and fine-scale concentration field may contain additional uncertainty associated with the spherical-particle approximation. Future work should incorporate experimentally measured particle-shape descriptors and non-spherical drag or shape-correction models to evaluate this effect quantitatively.
5. Conclusions
Comprehensive numerical simulations and regression analyses indicate that deposition in sulfide tailings slurry pipelines fundamentally results from the competition among particle gravitational settling, flow entrainment, and turbulent dispersion.
- Correlation models were established between relative deposited-bed height and inlet mass concentration and inlet velocity, and a three-dimensional model was further developed to represent their joint effect. The fitted relationships reproduced the simulated trends within the investigated ranges of inlet mass concentration and velocity.
- Transport velocity is a major determinant of tailings-suspension state and deposited-bed development. At low velocities, gravitational settling is pronounced and coarse tailings particles readily accumulate at the pipe bottom, producing a large radial volume-fraction gradient and an evident deposited bed. Increasing inlet velocity enhances turbulent dispersion and reduces bed thickness. Thus, increasing transport velocity effectively suppresses particle deposition, although excessively high velocities increase pipe wear and energy consumption.
- The distributions of tailings phases of different sizes differ markedly across the pipe cross-section. Medium-to-coarse particles of 247, 165, and 135 μm are strongly affected by gravitational settling and are prone to local deposition at the pipe bottom. Fine particles of 59, 42, 33, and 30 μm are more readily entrained and more strongly influenced by turbulent dispersion, resulting in relatively uniform cross-sectional distributions. Although the 30 μm fraction has the largest proportion in the tailings grading and the highest mean phase volume fraction, its degree of segregation is not the greatest because of its small size. Tailings-phase distribution is therefore governed not only by particle size but also by the proportion of each size class in the total tailings.
- Within the operating conditions investigated in this study, the combination of low velocity, high concentration, and steep inclination produced greater deposited-bed development. The results suggest that maintaining the transport velocity slightly above the estimated critical deposition velocity may help reduce particle deposition in the investigated pipeline system.
Author Contributions
Conceptualization, methodology, writing—original draft preparation, X.Z.; validation, formal analysis, investigation, writing—review and editing, D.Q.; data curation, resources, T.Y.; visualization, J.Y. All authors have read and agreed to the published version of the manuscript.
Funding
This research was funded by the Yunnan Major Science and Technology Special Plan, grant number 202502AB080007, and the Science and Technology Program of Guizhou Province (No. (2023)371).
Institutional Review Board Statement
Not applicable.
Informed Consent Statement
Not applicable.
Data Availability Statement
The processed numerical data supporting the figures and tables, together with the principal mesh information, numerical input parameters, boundary conditions, and solver settings used in this study, are available from the corresponding author upon reasonable request. The corresponding ANSYS Fluent case and data files are also available from the corresponding author upon reasonable request, subject to file-size and data-transfer limitations.
Acknowledgments
We sincerely thank the staff of the Faculty of Land Resources Engineering at Kunming University of Science and Technology for their valuable assistance with the experimental work.
Conflicts of Interest
The authors declare no conflicts of interest.
References
- Wang, Y.; Zhang, S.; Dai, B.; Zhao, F.; Wang, X.; Pan, K. Decarbonisation pathways and engineering technologies for China’s metal and non-metal mining industry. Metal. Mine 2023, 52, 1–7. [Google Scholar] [CrossRef]
- Chen, J. Innovation and application of the “five-in-one” systems engineering management model in the development of Zijinshan Gold-Copper Mine and other mines. Metal. Mine 2019, 1–6. [Google Scholar] [CrossRef]
- Cheng, H.Y.; Wu, A.X.; Wu, S.C.; Zhu, J.-Q.; Li, H.; Liu, J.; Niu, Y.-H. Research status and development trend of solid-waste backfill in metal mines. Chin. J. Eng. 2022, 44, 11–25. [Google Scholar] [CrossRef]
- Li, F.; Li, Y.; Sun, X. Research progress and industrial applications of hydraulic pipeline transport. Shanxi Water Resour. 2008, 2, 46–47, 54. [Google Scholar]
- Liu, W.; Wang, Y.; Wang, G. Pipeline-transport resistance characteristics of paste based on small-scale loop-pipe experiments. Min. Res. Dev. 2023, 43, 12–16. [Google Scholar] [CrossRef]
- Yang, X.B.; Zheng, B.; Deng, G.; Lai, W.; Li, W. Hydraulic-transport performance of tailings based on loop-pipe experiments. Min. Res. Dev. 2023, 43, 26–31. [Google Scholar] [CrossRef]
- Yang, X.B.; Yan, Z.; Yin, S.; Yang, H. Resistance model and optimisation of coarse-aggregate paste pipeline transport based on loop-pipe experiments. J. Hunan Univ. (Nat. Sci.) 2022, 49, 181–191. [Google Scholar] [CrossRef]
- Wang, Y.; Na, Q.; Wu, A.; Zhang, H.; Wang, G.; Wang, Y.; Zhang, W.; Wang, X. Comparison of resistance between pipe loop tests and theoretical calculations for fly ash-slag slurry. J. Cent. South Univ. (Sci. Technol.) 2022, 53, 2234–2244. [Google Scholar] [CrossRef]
- Wang, H.; Wang, X.; Kou, Y.; Wu, Z.; Peng, Q. Loop-pipe experiments on high-concentration cemented backfill using full tailings. Chin. J. Eng. 2021, 43, 215–222. [Google Scholar] [CrossRef]
- Chang, Y.J.; Wu, A.X.; Ruan, Z.E.; Wang, Y.M. Wear mechanism and parameter optimisation for pipelines conveying paste with coarse aggregate. J. Cent. South Univ. (Sci. Technol.) 2024, 55, 307–316. [Google Scholar] [CrossRef]
- Yu, Y.C.; Wang, H.F.; Zhang, Z.Q.; Luo, Z.L.; Wei, X.M. Long-distance reverse-slope transport of backfill slurry at the Jinchanghe polymetallic mine. Nonferrous Met. (Min. Sect.) 2022, 74, 52–56. [Google Scholar] [CrossRef]
- Vlasák, P.; Chára, Z.; Krupička, J.; Konfršt, J. Experimental investigation of coarse-particle-water mixture flow in horizontal and inclined pipes. J. Hydrol. Hydromech. 2014, 62, 241–247. [Google Scholar] [CrossRef] [Scilit]
- Matoušek, V.; Krupička, J.; Pěník, V. Distribution of medium-to-coarse glass beads in slurry pipe flow: Evaluation of measured concentration profiles. Part. Sci. Technol. 2014, 32, 186–196. [Google Scholar] [CrossRef] [Scilit]
- Sadeghi, M.; Sontti, S.G.; Zheng, E.; Zhang, X. Computational fluid dynamics (CFD) simulation of three-phase non-Newtonian slurry flows in industrial horizontal pipelines. Chem. Eng. Sci. 2023, 270, 118513. [Google Scholar] [CrossRef] [Scilit]
- Kumar, Y.; Kaushal, D.R. Economic particulate transport performance analysis of k-epsilon models in highly concentrated slurry through pipelines. Part. Sci. Technol. 2024, 42, 668–687. [Google Scholar] [CrossRef] [Scilit]
- Shajahan, T.; Schouten, T.; Raaghav, S.K.; van Rhee, C.; Keetels, G.; Breugem, W.-P. Characteristics of slurry transport regimes: Insights from experiments and interface-resolved Direct Numerical Simulations. Int. J. Multiph. Flow 2024, 176, 104831. [Google Scholar] [CrossRef] [Scilit]
- Li, Q.H.; Tang, D.S.; Xiao, H.; Song, Y.W.; Li, Z. Experimental investigation of the flow state of coarse ore particles in the bottom section of a rigid lifting pipe. Min. Metall. Eng. 2019, 39, 5–8. [Google Scholar] [CrossRef]
- Tang, D.S.; Xiao, H.; Song, Y.; Gong, D.; Xia, J.; Li, M. Experimental study on floating velocity of deep-sea coarse ore particles. Min. Metall. Eng. 2016, 36, 1–5, 8. [Google Scholar] [CrossRef]
- Zhang, X.X.; Qiao, D.P.; Song, H. Numerical simulation of pipeline-transport characteristics of high-concentration waste-rock-tailings slurry. Chin. J. Nonferrous Met. 2019, 29, 1092–1101. [Google Scholar] [CrossRef]
- Yang, T.Y.; Qiao, D.P.; Wang, J.; Zhang, X.; Chen, Y. Numerical simulation and new model of pipeline transportation resistance of waste-rock-aeolian-sand high-concentration slurry. Chin. J. Nonferrous Met. 2021, 31, 234–244. [Google Scholar] [CrossRef]
- Yu, G.B.; Yang, P.; Chen, Z.C.; Men, R.Y. Study on pipeline self-flowing transportation of cemented tailing fill slurry based on Fluent software. Adv. Mater. Res. 2013, 734–737, 833–837. [Google Scholar] [CrossRef] [Scilit]
- Fairhurst, C. Some challenges of deep mining. Engineering 2017, 3, 527–537. [Google Scholar] [CrossRef] [Scilit]
- Xu, S.S. Speech at the opening ceremony of the 2007 China International Mining Conference. Natl. Land Resour. Inf. 2007, 24–25. [Google Scholar]
- Liu, F.C.; Xiong, Y.W.; Liu, E.Y.; Lei, X. Application and development trend of large-flow filling technology in metal mines. Min. Res. Dev. 2021, 41, 34–38. [Google Scholar] [CrossRef]
- Xu, W.Y.; Guo, L.J.; Yang, X. Study of high-altitude and mass-flow filling technology in the Jiama Copper Mine. China Min. Mag. 2015, 24, 99–103. [Google Scholar]
- Zhang, B.; Wang, Y.; Wu, A.; Hu, G.; Wang, H.; Wang, Y.; Zheng, X. High-flow paste self-filling technology and its application in the southeast orebody of Chambishi Copper Mine. Min. Technol. 2021, 21, 160–163. [Google Scholar] [CrossRef]
- Fei, X.J. Study on non-depositing velocity in slurry pipelines. J. China Coal Soc. 1997, 22, 86–90. [Google Scholar]
- Xu, Z.L. Study on velocity distribution and hydraulic gradient of heterogeneous flow in a horizontal pipe. J. China Coal Soc. 1998, 23, 93–98. [Google Scholar]
- Zhao, L.A.; Xu, Z.L.; Wang, T.L. Experimental studies on critical velocities of sand-water heterogeneous flow in horizontal pipelines. Hydro-Sci. Eng. 2016, 4, 63–69. [Google Scholar] [CrossRef]
- Wang, X.M.; Li, T.Z.; Zhang, Q. Study on a prediction model of critical flow velocity in slurry pipeline transportation based on GA-ELM. J. Saf. Sci. Technol. 2015, 11, 101–105. [Google Scholar] [CrossRef]
- Wang, X.M.; Zhang, G.Q.; Zhang, Q.L.; Li, S. ELM prediction of critical flow velocity in long-distance gravity transport of ultrafine full tailings at ultra-high capacity. Sci. Technol. Rev. 2015, 33, 27–31. [Google Scholar] [CrossRef]
- Wasp, E.J.; Kenny, J.P.; Gandhi, R.L. Solid-Liquid Flow: Slurry Pipeline Transportation; Gulf Publishing Company: Houston, TX, USA, 1979. [Google Scholar]

Disclaimer/Publisher’s Note: The statements, opinions and data contained in all publications are solely those of the individual author(s) and contributor(s) and not of MDPI and/or the editor(s). MDPI and/or the editor(s) disclaim responsibility for any injury to people or property resulting from any ideas, methods, instructions or products referred to in the content. |
© 2026 by the authors. Licensee MDPI, Basel, Switzerland. This article is an open access article distributed under the terms and conditions of the Creative Commons Attribution (CC BY) license.