


Abstract
This study proposes and validates a data-driven statistical process control (SPC) framework for monitoring and reducing particle contamination in automotive aluminium die-casting, addressing a documented gap in the structured application of inferential statistics to technical cleanliness management in automotive SMEs. An action research strategy based on DMAIC and CRISP-DM was conducted over eleven months in an automotive die-casting SME. The study encompassed a VDA 19.1/19.2-aligned audit, descriptive analysis of 64 pre-intervention samples, negative binomial regression with Wald hypothesis testing, Individual Moving Range (I-MR) control charts for before-and-after comparison, and microscopic characterisation of out-of-specification particles using Microsoft Excel, Minitab, and RStudio. The negative binomial model consistently outperformed Poisson regression across all granulometric classes (ΔAIC up to 2958.77). Mould cavity, injection machine condition, and injection operator were the dominant contamination predictors. Statistically significant variability reductions were achieved for total particles in the 150–400 µm range and for metallic particles in the 150–200 µm and 200–400 µm classes; the metallic 200–400 µm class also showed a significant mean reduction. Particles exceeding 400 µm remained dominated by sporadic special-cause events. The study is restricted to one component and site; the post-intervention sample (n = 17) limits statistical power, and extension to additional components, processes, and larger datasets is recommended. The reported findings should accordingly be read as case-study evidence rather than as generalisable, definitive conclusions. The framework offers a replicable, cost-effective approach to data-driven quality management for automotive SMEs, aligned with Industry 5.0 human-centric manufacturing principles. This paper bridges a literature gap by integrating negative binomial regression, Wald testing, and I-MR control charts into a unified SPC framework for technical cleanliness in automotive die-casting, connecting quality intelligence with the transversalities of artificial intelligence, innovation, and sustainability. The methodology itself relies on classical inferential statistics and SPC rather than on artificial intelligence algorithms; its Industry 5.0 relevance lies in providing the structured, human-centric, data-driven decision-making foundation on which future AI-assisted particle classification and real-time monitoring can be built.
1. Introduction
The automotive sector is undergoing a period of profound and accelerating transformation, driven by the transition towards electric mobility, autonomous driving, and increasingly stringent functional demands on component performance and safety. Electric powertrains, high-voltage battery systems, and power electronics impose far more exacting requirements on particulate contamination than conventional combustion-engine systems: conductive metallic particles exceeding 30 µm can damage battery cell separators and trigger thermal runaway events with severe safety consequences [1,2]. Technical cleanliness—formally defined as the controlled measurement and limitation of particulate contamination in functionally relevant automotive components, governed by VDA 19.1 and ISO 16232 [3]—has consequently evolved from a secondary quality attribute into a critical, non-negotiable production requirement [4,5,6]. This evolution is particularly challenging for small and medium-sized enterprises (SMEs) in the automotive supply chain, which must comply with increasingly sophisticated cleanliness specifications while operating under resource and data management constraints not faced by large-scale manufacturers [7].
Despite the growing operational relevance of technical cleanliness, its systematic management through rigorous statistical process control (SPC) remains largely underexplored in the published literature. A bibliometric survey using the terms “technical cleanliness” and “automotive industry” in Google Scholar returned approximately 108 results—markedly limited relative to other established domains of industrial engineering and quality management [8]. Existing contributions concentrate predominantly on inspection and detection technologies, including automated particle classification using deep learning [9], image processing algorithms for inspection automation [10], packaging and logistics influences on contamination [11,12], and normative framework analyses [13]. The structured integration of inferential statistical methods to identify process factors governing particle generation—and to evaluate the effectiveness of corrective actions—remains absent from the published literature.
A further gap exists in the statistical treatment of particle count data. Particle counts are inherently discrete, non-negative, and typically overdispersed—exhibiting variance substantially exceeding the mean due to the intermittent and variable nature of contamination events. These characteristics render normality-based SPC approaches statistically invalid without transformation. Count data models, particularly negative binomial regression, provide a theoretically grounded alternative capable of accommodating overdispersion; however, their application to technical cleanliness monitoring has not been previously reported.
This paper addresses these gaps through the development and validation of a data-driven SPC framework applied to an aluminium die-casting SME in the Portuguese automotive supply chain, over an eleven-month longitudinal study. The study pursued four specific objectives: (i) characterise the baseline technical cleanliness state through a structured VDA 19.2-aligned audit; (ii) develop and implement a count data-based monitoring framework using negative binomial regression and Wald hypothesis testing; (iii) identify process variables significantly associated with particle contamination across four granulometric classes; and (iv) evaluate targeted improvement actions through before-and-after I-MR control chart analysis. The research integrates action research with the DMAIC (Define, Measure, Analyse, Improve, Control) cycle and CRISP-DM (Cross-Industry Standard Process for Data Mining) as a complementary analytical structure.
The contributions are threefold: demonstrating the feasibility of structured SPC in a resource-constrained SME environment; establishing negative binomial regression as the methodologically appropriate framework for particle count inference; and providing a replicable methodology for data-driven quality management in automotive die-casting. The paper is structured as follows: Section 2 reviews related work; Section 3 describes the methodology; Section 4 characterises the industrial context; Section 5 presents and discusses results; Section 6 articulates the connection to the transversalities of artificial intelligence, innovation, and sustainability; Section 7 concludes.
2. Related Work
Technical cleanliness in automotive manufacturing is governed primarily by VDA 19.1, defining methods for particle extraction, quantification, and classification, and ISO 16232 [3], its international counterpart. These standards form the operational basis for cleanliness specification across the automotive supply chain, progressively complemented by VDA 19.2 for assembly environments and ZVEI [2] guidelines for electronic and high-voltage components. A persistent challenge concerns the tendency to define cleanliness specifications with overly conservative margins, imposing disproportionate cost on suppliers without commensurate improvement in functional reliability [1]. VDA 19 itself addresses this tension through the principle “as clean as necessary, not as clean as possible.”
Research in technical cleanliness has concentrated on measurement and detection. Zwinkau et al. [9] developed a deep learning classification method achieving 97.7% binary accuracy in distinguishing metallic from non-metallic particles, comparable to polarised light microscopy under VDA 19 and ISO 16232 [3] protocols. Panusch et al. [10] advanced image processing algorithms combining extended depth of field, shape-from-focus, and robust image stitching to reduce manual intervention in inspection, opening pathways for tighter coupling between inspection data and production control systems.
At the process and supply-chain level, Pedrosa et al. [12] documented the impact of assembly and logistics operations on metallic particle contamination in automotive electronic components, demonstrating that adjustments in packaging and soldering processes effectively reduce non-conformities. Peckman and Luptak [11] evaluated packaging solutions for automotive cables under transport conditions, establishing that only plastic bag packaging consistently met cleanliness specifications. Schleicher and Damak [6] examined contamination risks in high-voltage automotive applications, emphasising that prevention must be embedded across all design, production, and assembly stages.
From a system-level perspective, Shaik and Rodrigues [14] combined system dynamics modelling with layout optimisation, demonstrating measurable operational and economic benefits from structured cleanliness management. From a sustainability perspective, Krotil [15] discussed the relevance of technical cleanliness in remanufacturing processes for automotive components, noting that cleanliness verification is an enabling condition for circular economy strategies.
Statistical process control offers established tools for separating common-cause from assignable-cause variability and monitoring process stability over time [16]. The integration of SPC with data-driven approaches has been demonstrated in adjacent manufacturing quality contexts [17]. However, the practical integration of negative binomial regression and Wald testing within a technical cleanliness SPC framework has not been reported—the gap this paper explicitly targets. Complementary quality-monitoring literature reinforces the broader relevance of statistically grounded particle/attribute monitoring across manufacturing sectors, including data-attribute-based monitoring frameworks for welding processes [18] and long-standing applications of control charts to particle counts in semiconductor manufacturing [19], although neither addresses automotive technical cleanliness specifically.
3. Methodology
The study adopts an action research strategy [20], structured around the DMAIC methodology [21], complemented by the CRISP-DM model [22] as an analytical framework within the Measure and Analyse phases. The combination of DMAIC and CRISP-DM operationalises Data-Driven Decision Making (DDDM) in the industrial quality management context.
The study was conducted over eleven months in an aluminium die-casting SME in the Norte region of Portugal, supplying components to the automotive sector. The component selected for study was chosen based on its production relevance, history of technical cleanliness non-conformities, high variability in contamination results, and associated economic impact of customer complaints. The particle size specifications applicable to the component are presented in Table 1. The four granulometric classes (150–200 µm, 200–400 µm, 400–600 µm, and ≥600 µm) follow the size-class structure conventionally used in VDA 19.1/ISO 16232-based technical cleanliness reporting; the specific numerical particle-count limits per class, however, are contractual requirements defined by the component’s original equipment manufacturer (OEM) customer for this application, since neither VDA 19 nor ISO 16232 prescribes universal numerical thresholds and instead requires cleanliness levels to be agreed between customer and supplier.
Table 1.
Particle quantity requirements per size class for the studied component.
Samples were collected three times per week following VDA 19.1 [23] protocols. Production data were manually recorded and subsequently digitised; records were verified against production files and unverifiable samples were excluded. The final pre-intervention dataset comprised 64 samples; the post-intervention dataset comprised 17 samples. A second mould (“Mould 2”) yielded only two valid entries after verification, one of which was a clear outlier; this sample size was insufficient to estimate within-mould variability, so both records were excluded prior to regression and I-MR analysis, reducing that dataset to 62 pre-intervention observations while the full 64-sample dataset was retained for descriptive statistics. All categorical process variables (mould cavity, injection machine, injection operator, inspection operator, washing weekday, inspection weekday, and part visual state) were treatment-coded as factors, with the modal level of each variable used as the reference category. Samples correspond to physically distinct components inspected on different production days; nonetheless, because several samples share the same cavity, machine, or operator, some within-group correlation cannot be excluded, and this is acknowledged as a limitation in Section 7. Regarding model complexity, the full model for each particle class combined up to ten process variables and, driven mainly by the 19-level injection-operator factor, approximately 40 estimated parameters relative to 62–64 observations; to mitigate the associated overfitting risk, Wald Type II tests were computed on grouped factors rather than on individual dummy coefficients, non-informative variables were removed through stepwise model reduction (Section 5.4), and DHARMa simulated-residual diagnostics were used to confirm that model adequacy was preserved after reduction. The statistical methodology proceeded in four stages: (i) descriptive analysis including Anderson–Darling normality testing using Minitab 21; (ii) Poisson versus negative binomial model selection using the Akaike Information Criterion (AIC) in RStudio 2025; (iii) Wald hypothesis testing (Type II ANOVA) on negative binomial regression coefficients, with DHARMa simulated residual diagnostics; and (iv) I-MR control chart analysis with F-tests for standard deviation and two-sample t-tests for mean comparisons.
The technical cleanliness audit was structured in accordance with the VDA 19.1 [23] audit template, adapted to the specific production flow of the study company. Each item was classified as conforming (OK), non-conforming (NOK), or improvement opportunity, with weighted scoring: OK items received full weight, improvement opportunities were assigned half weight, and NOK items received zero weight. Areas scoring at or above 80% were rated “Very Good”, 50–80% as “Requires Attention”, and below 50% as “Requires Immediate Action”, consistent with VDA 19.2 [24] risk identification and prioritisation principles.
4. Industrial Context
The study was conducted at an aluminium die-casting SME in the Norte region of Portugal, operating as a Tier 2 supplier in the automotive supply chain. The company produces aluminium die-cast components for integration into hydraulic and mechatronic systems, with production organised around three injection machines (MFI 32, MFI 33, and MFI 34) and multiple mould cavities. Post-injection operations include cutting, vibration finishing, machining, rework, washing, gauge verification, and packaging. Data management was exclusively paper-based throughout the study period, representing a characteristic constraint of Portuguese manufacturing SMEs undergoing quality system improvement and a condition that directly affected dataset scope and variable completeness.
The cleanliness specifications for the studied component impose zero tolerance for particles exceeding 600 µm of any type. An initial quartile analysis of the historical dataset revealed that more than 75% of samples exceeded this zero-tolerance threshold for the ≥600 µm class and that only 25–50% of samples met the 200–400 µm specification—confirming the severity of the non-conformity situation prior to intervention and the strategic importance of the study.
5. Results and Discussion
5.1. Technical Cleanliness Audit
The audit conducted in accordance with the VDA 19.1 [23] framework revealed a heterogeneous performance profile, with the global result indicating a process requiring attention (44.26% conforming items, 36.07% non-conforming, 16.97% improvement opportunities). Table 2 presents the area-by-area classification. The injection and machining areas presented 100% non-conforming items and were identified as the primary sources of metallic particle generation. The washing area and internal packaging and transport area also fell into the “Requires Immediate Action” category. Cutting and the technical cleanliness laboratory demonstrated “Very Good” performance. The audit directly informed the prioritisation of improvement actions, concentrating resources on the highest-impact stages in accordance with the VDA 19.2 [24] principle of prioritising interventions from the inside outward.
Table 2.
Technical cleanliness audit results by production area.
5.2. Descriptive Statistical Characterisation
Descriptive analysis of the 64 pre-intervention samples revealed a process characterised by high variability and right-skewed, non-normal distributions across all granulometric classes. Table 3 presents the key descriptive statistics. The total particle count showed a mean of 282 particles, a standard deviation of 191, and values ranging from 52 to 917. The particle mass indicator showed a mean of 1.6 g against a specification limit of 1.5 g, with standard deviation of 0.8 g. For metallic particles, the total count showed a mean of 85 and a standard deviation of 90—effectively equal to the mean—reflecting extreme overdispersion. Skewness and kurtosis values were highest for metallic particle classes, particularly in the 150–200 µm range (skewness = 4.1), indicating heavy-tailed distributions driven by rare but severe contamination episodes. These distributional characteristics confirm the necessity of count data regression over normality-based SPC approaches.
Table 3.
Descriptive statistics for particle counts and particle mass across size classes (n = 64, before improvement actions).
5.3. Model Selection: Negative Binomial vs. Poisson Regression
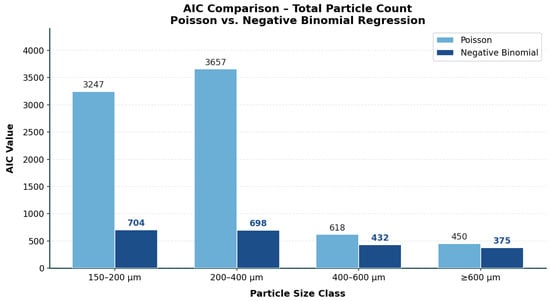
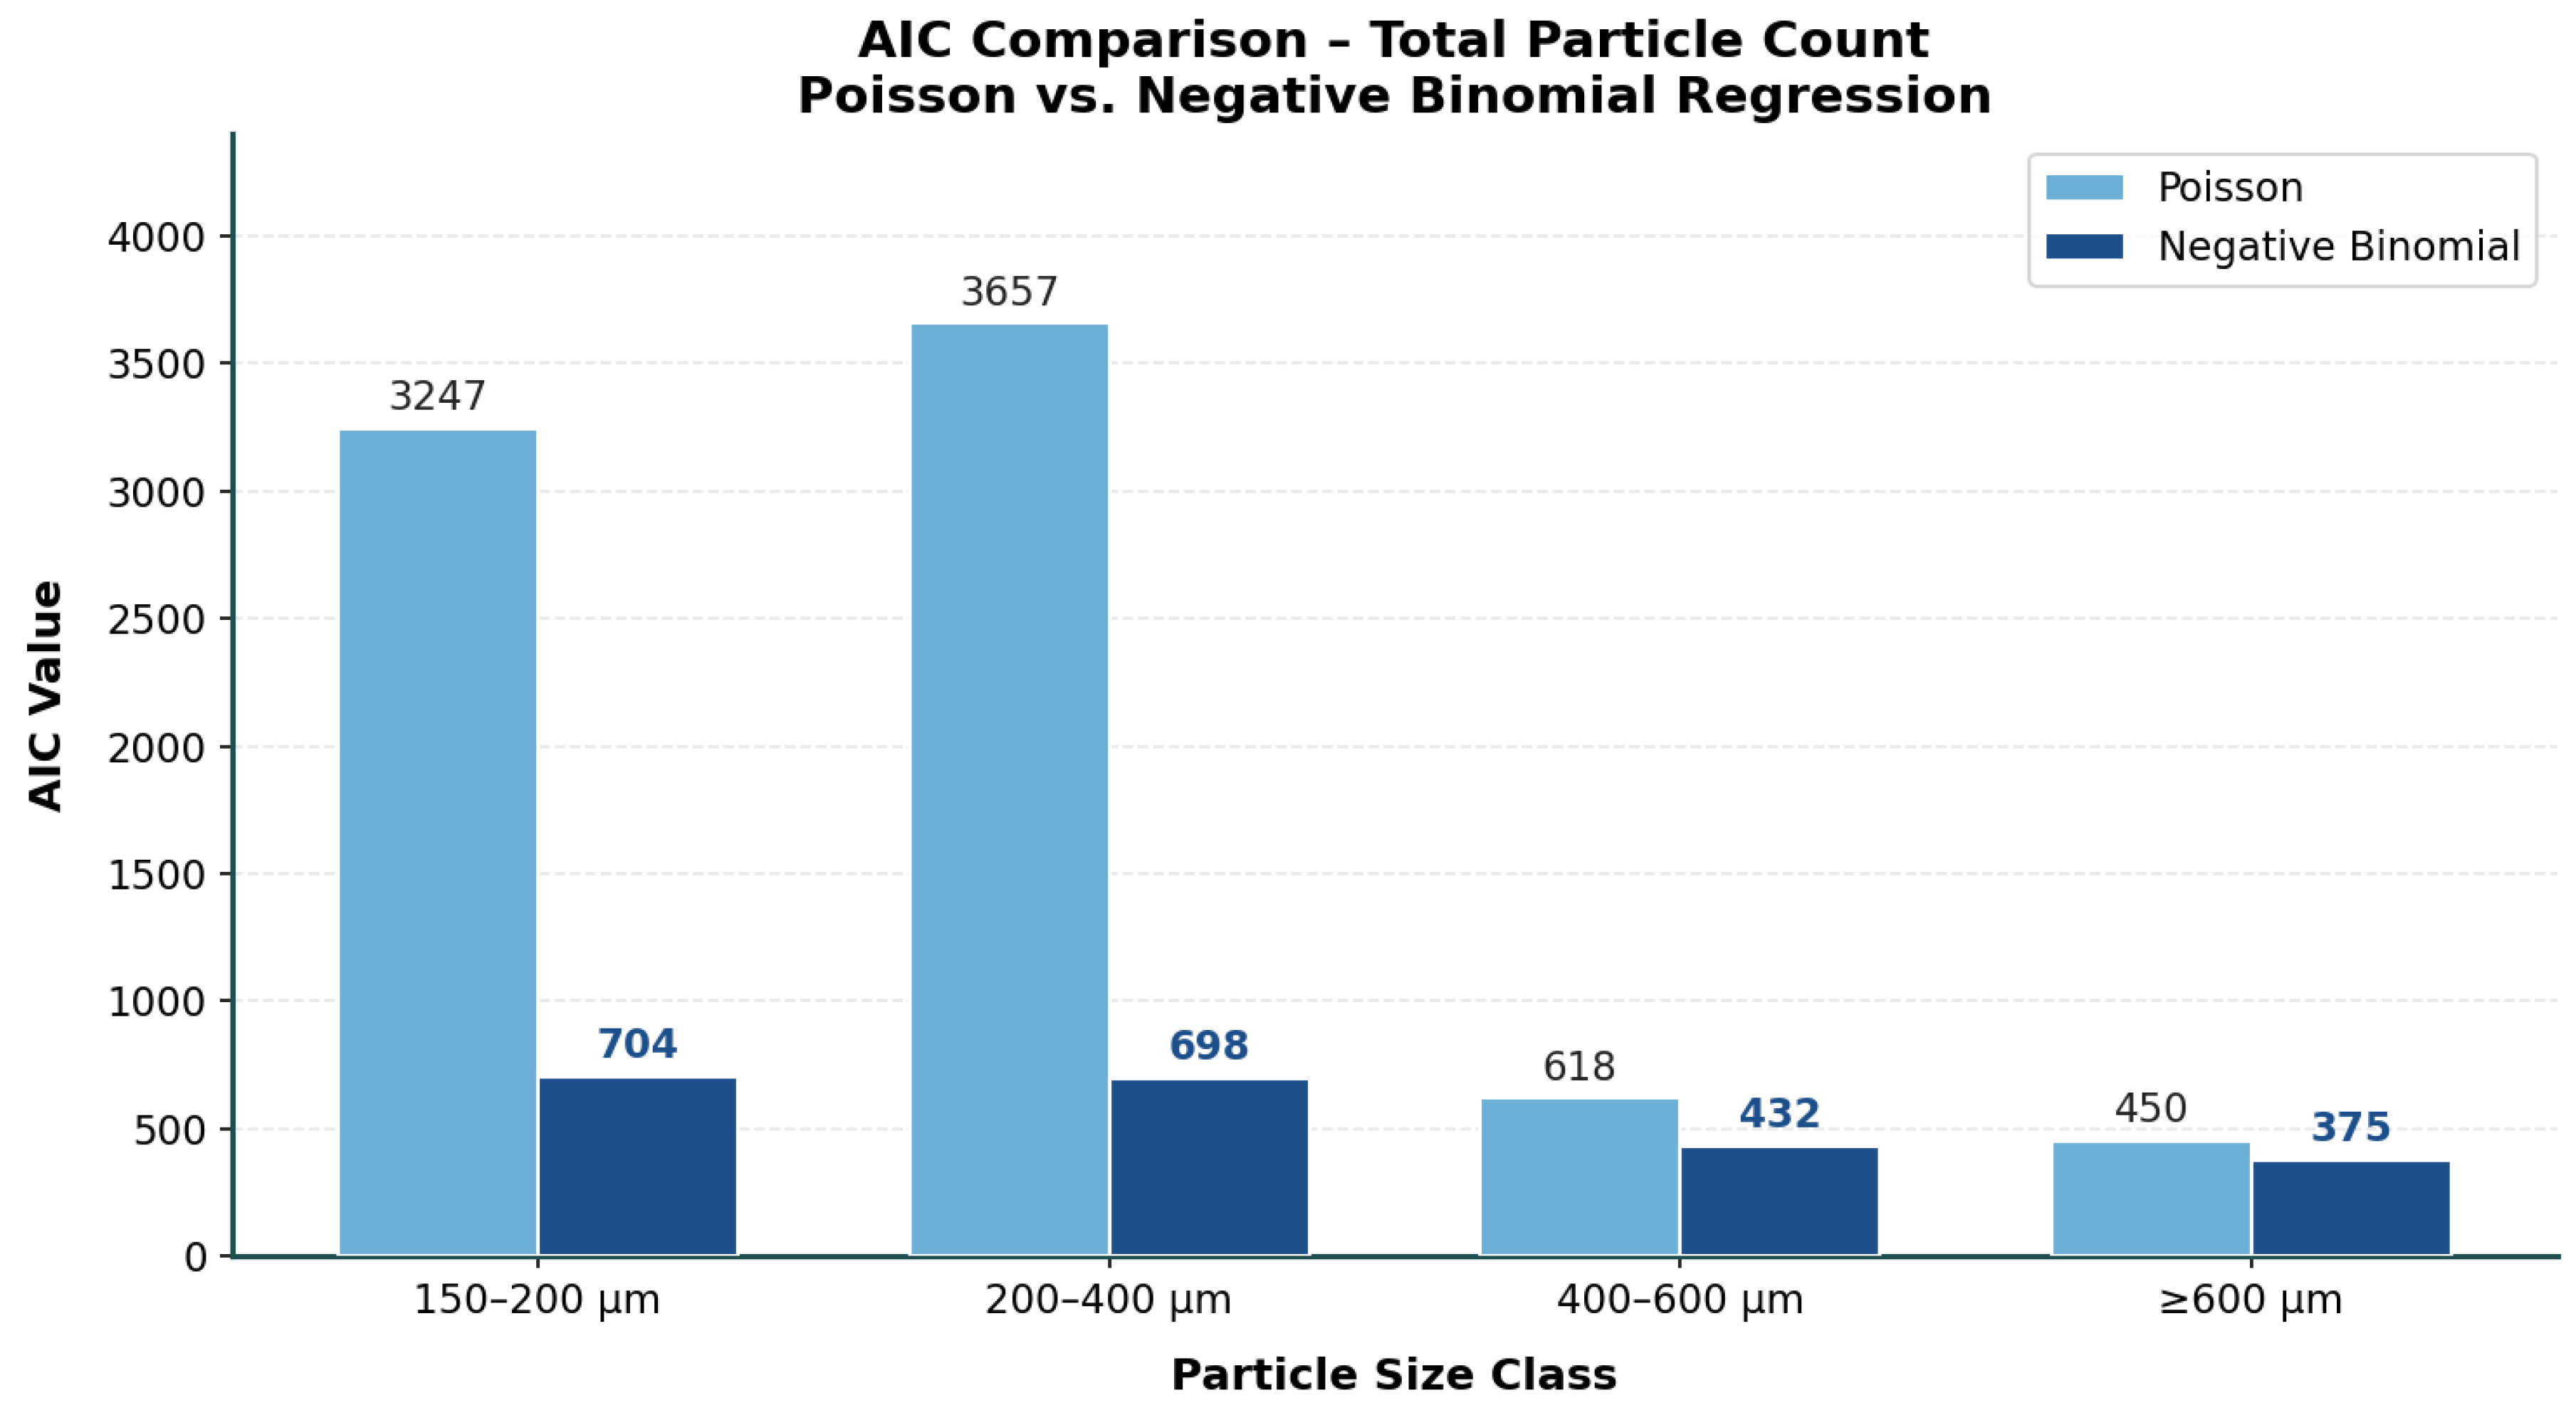
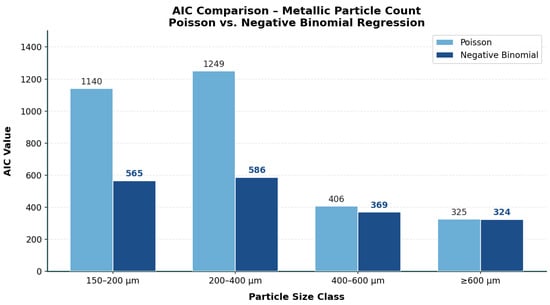
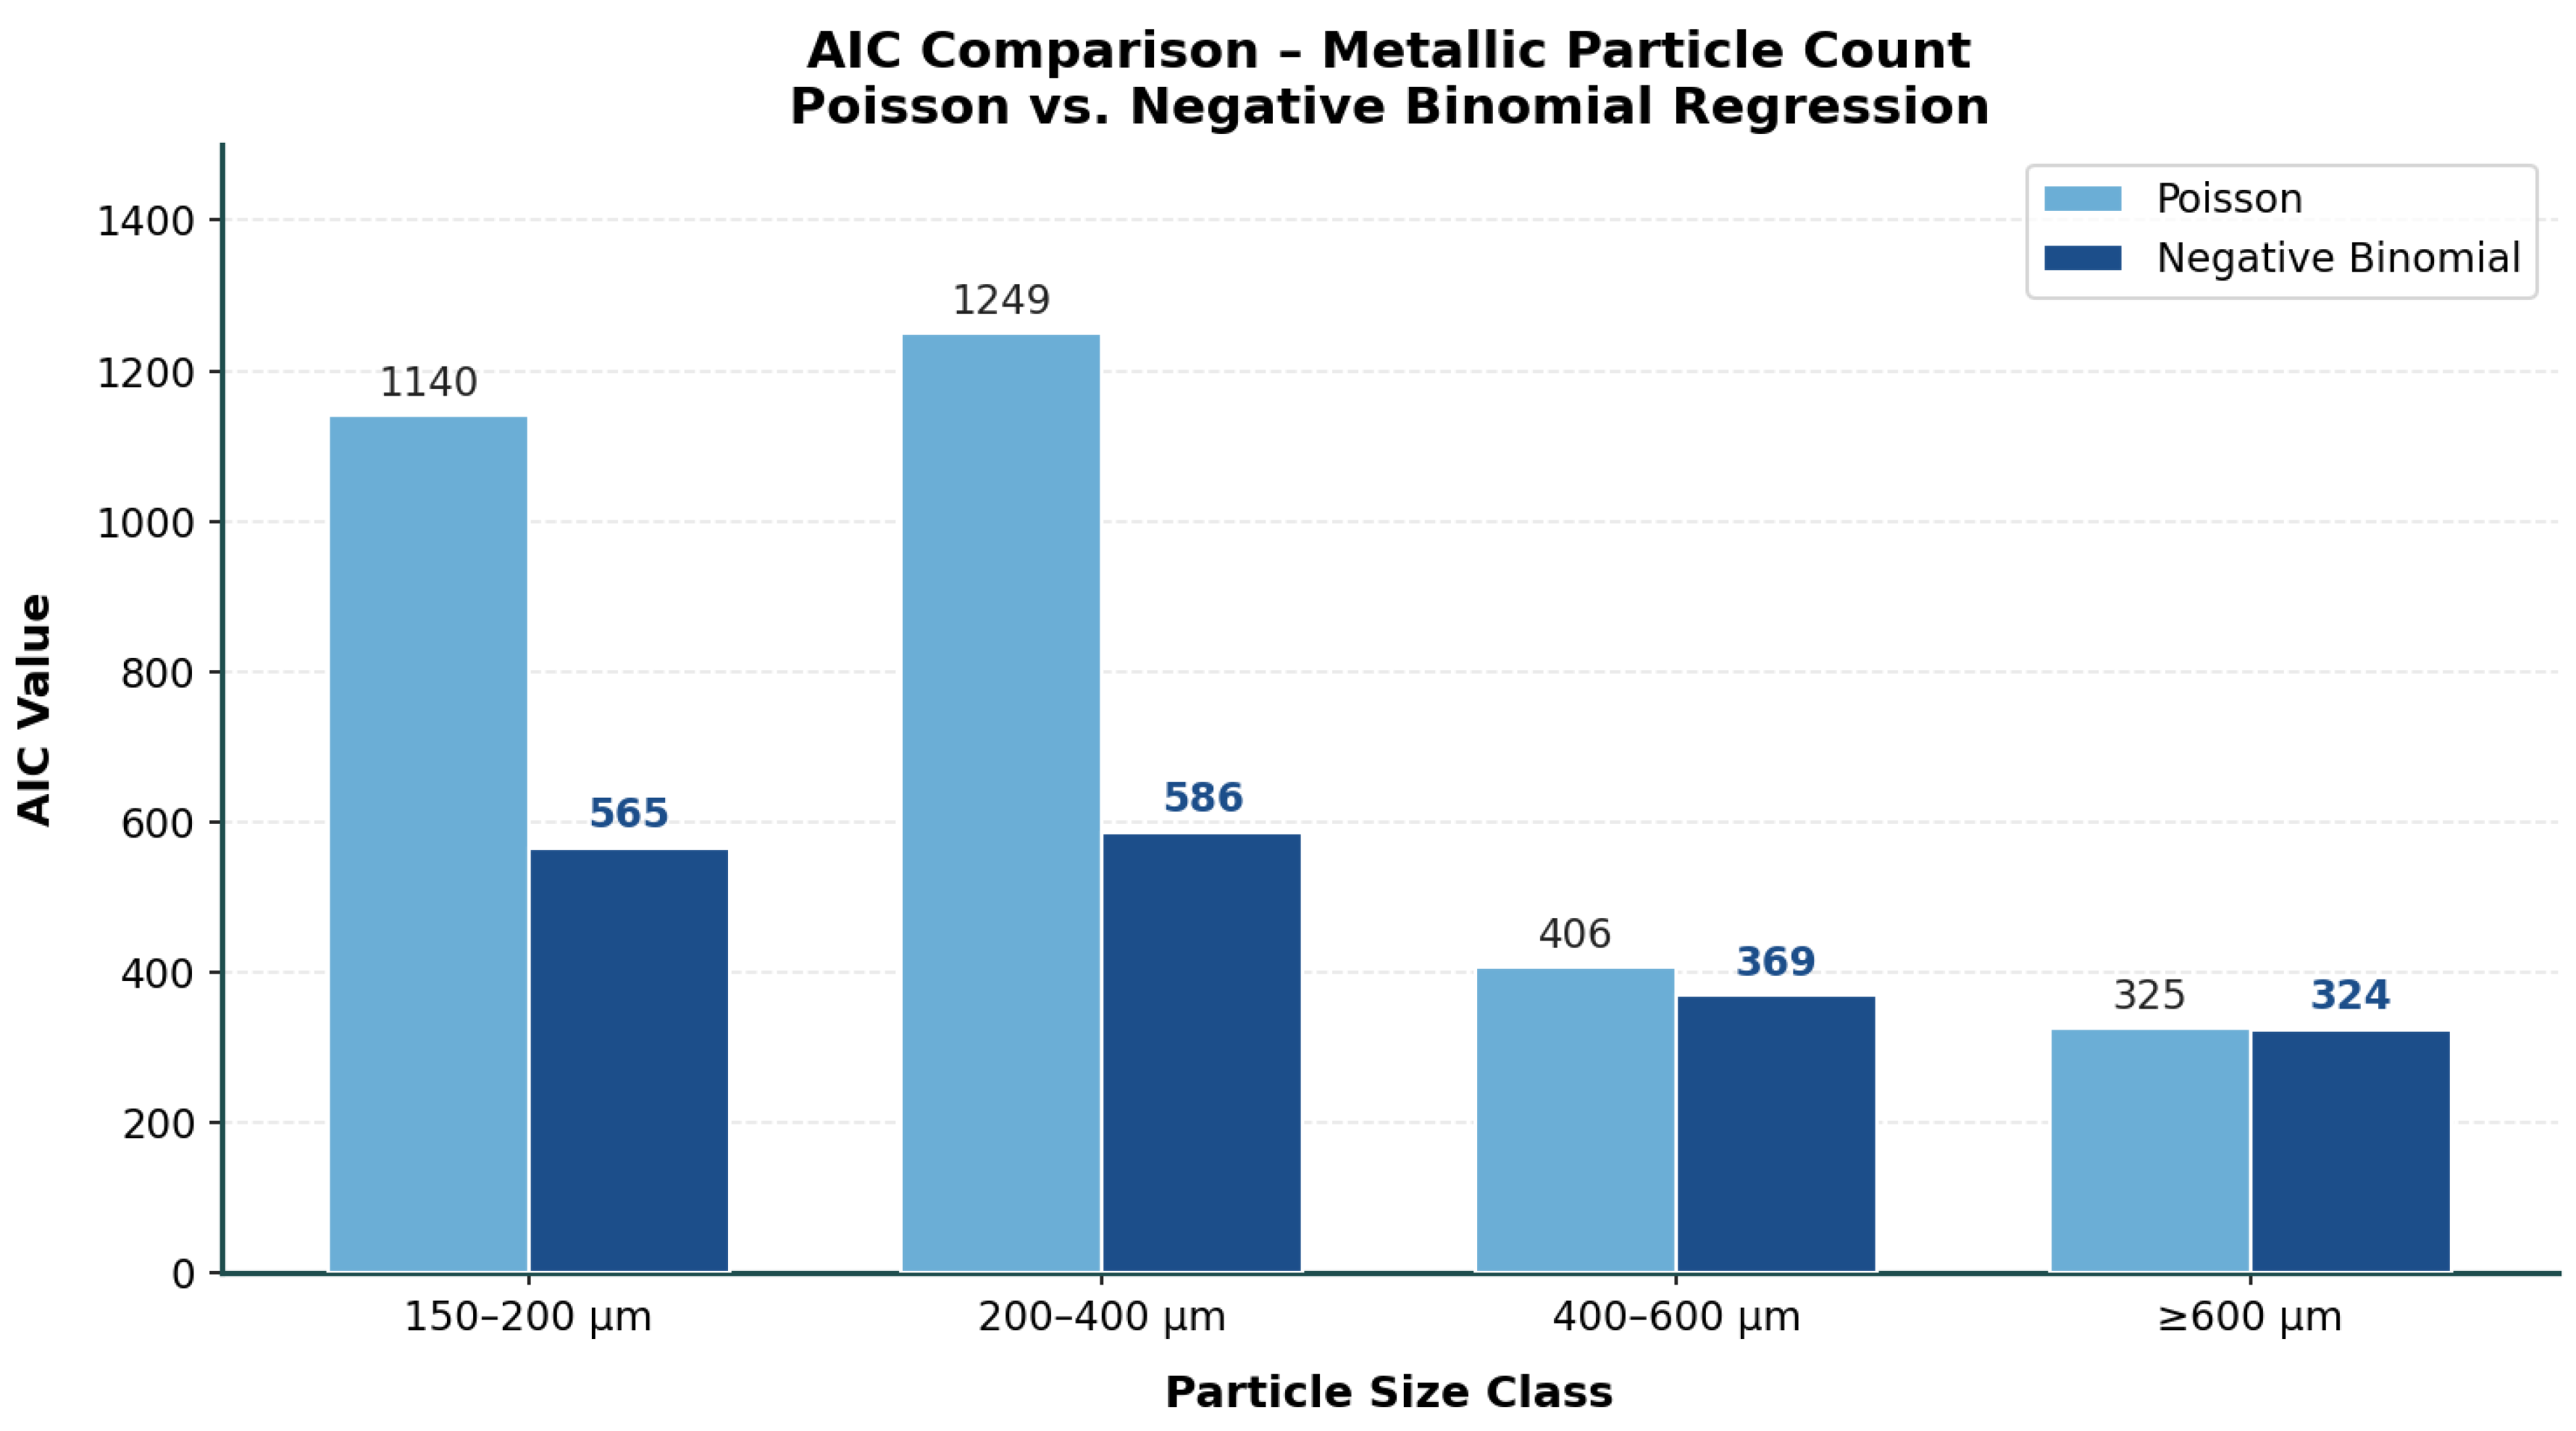
Both Poisson and negative binomial regression models were fitted for each particle class and type and compared using the AIC. Table 4 and Figure 1 and Figure 2 present the results. The negative binomial model consistently and decisively outperformed the Poisson model across all classes and particle types. The most dramatic differences occurred in the 150–200 µm and 200–400 µm total particle classes (ΔAIC of 2542.51 and 2958.77, respectively), confirming extremely strong overdispersion. For larger particle classes, the ΔAIC was smaller but remained positive and substantive, supporting the negative binomial throughout. These findings provide strong evidence for negative binomial regression as the methodologically appropriate framework for particle count inference in this domain. AIC comparison was complemented by DHARMa simulated-residual diagnostics (Section 5.4): non-significant Kolmogorov–Smirnov tests on simulated residuals (e.g., p = 0.121 for a reduced metallic model) indicated no significant residual overdispersion or distributional misfit once the negative binomial distribution was adopted. Full coefficient-level tables (incidence-rate ratios and 95% confidence intervals) are not reported individually because several predictors are categorical factors with a large number of levels (up to 19 for injection operator); Wald Type II tests on the grouped factor were therefore used as the primary inferential summary, consistent with standard practice for high-cardinality categorical predictors. Zero-inflated or hurdle negative binomial specifications were not formally compared in this study; we acknowledge this as a limitation and recommend such models be evaluated in future work, particularly for the larger particle classes where zero counts are more frequent and sporadic special-cause events dominate (Section 5.6).
Table 4.
AIC comparison of Poisson and negative binomial models for total and metallic particle counts across size classes.
Figure 1.
AIC comparison (Poisson vs. negative binomial) for total particle counts across size classes.
Figure 2.
AIC comparison (Poisson vs. negative binomial) for metallic particle counts across size classes.
Figure 1 illustrates the AIC comparison for total particle counts; Figure 2 presents the equivalent comparison for metallic particle counts. In both cases, the magnitude of the advantage of the negative binomial model is particularly pronounced for the smaller particle classes, reflecting the more intense overdispersion associated with higher-frequency, more variable contamination in those ranges.
5.4. Identification of Significant Process Factors
Negative binomial regression models were fitted for each particle class and type using all available process variables: injection machine (MFI), mould cavity, mould cycle count, injection operator, washing weekday, inspection weekday, inspection operator, washing-to-inspection interval, lead time, and part visual state. Model adequacy was verified using DHARMa simulated residual diagnostics; in most models, the Kolmogorov–Smirnov test on simulated residuals was non-significant, confirming model validity. For metallic particle classes where full models showed diagnostic deviations, stepwise model reduction produced more parsimonious models with lower AIC and valid diagnostics.
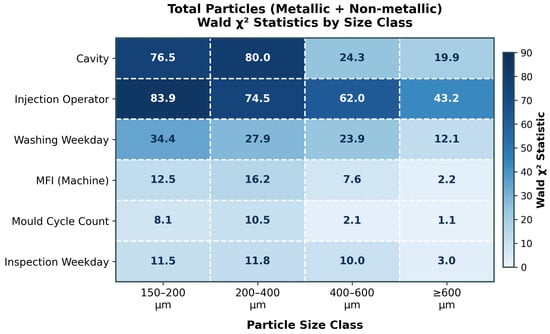
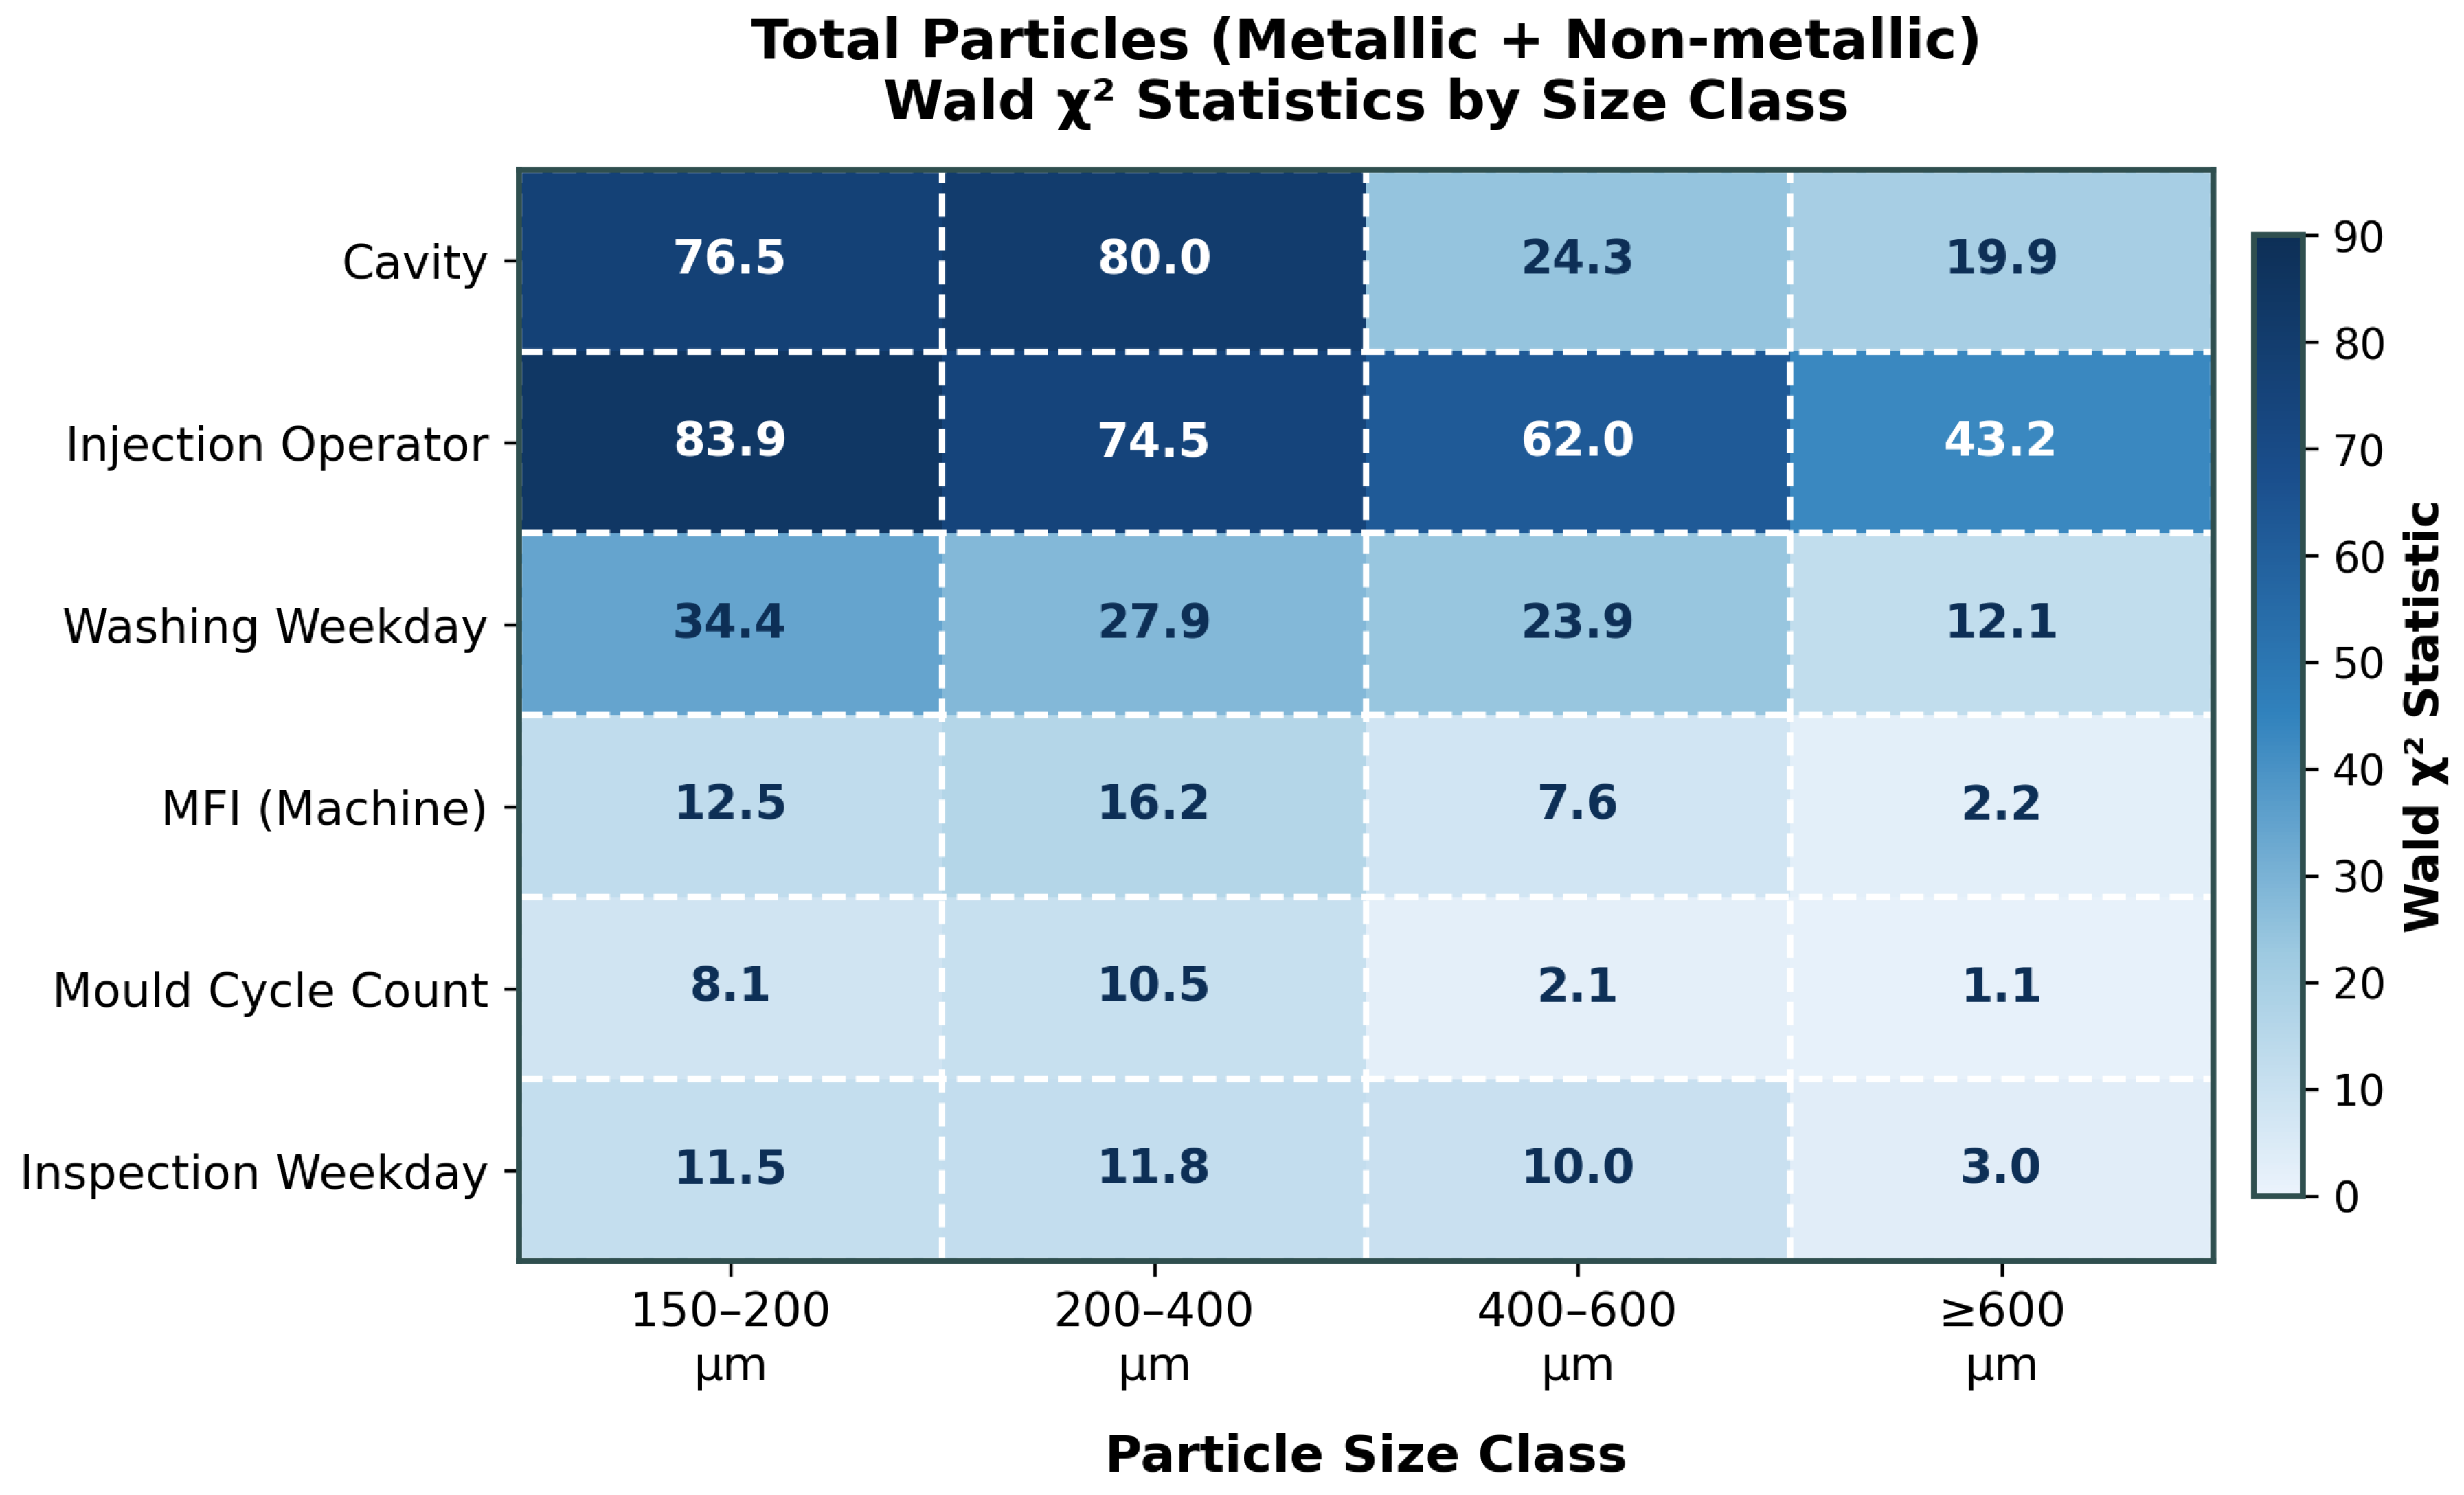
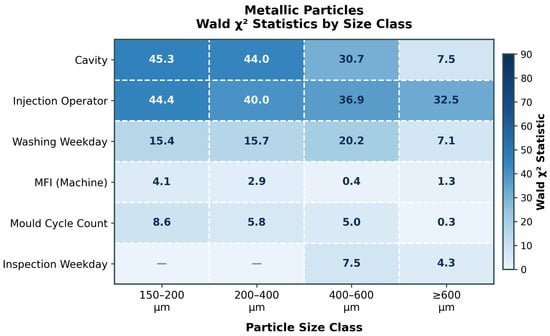
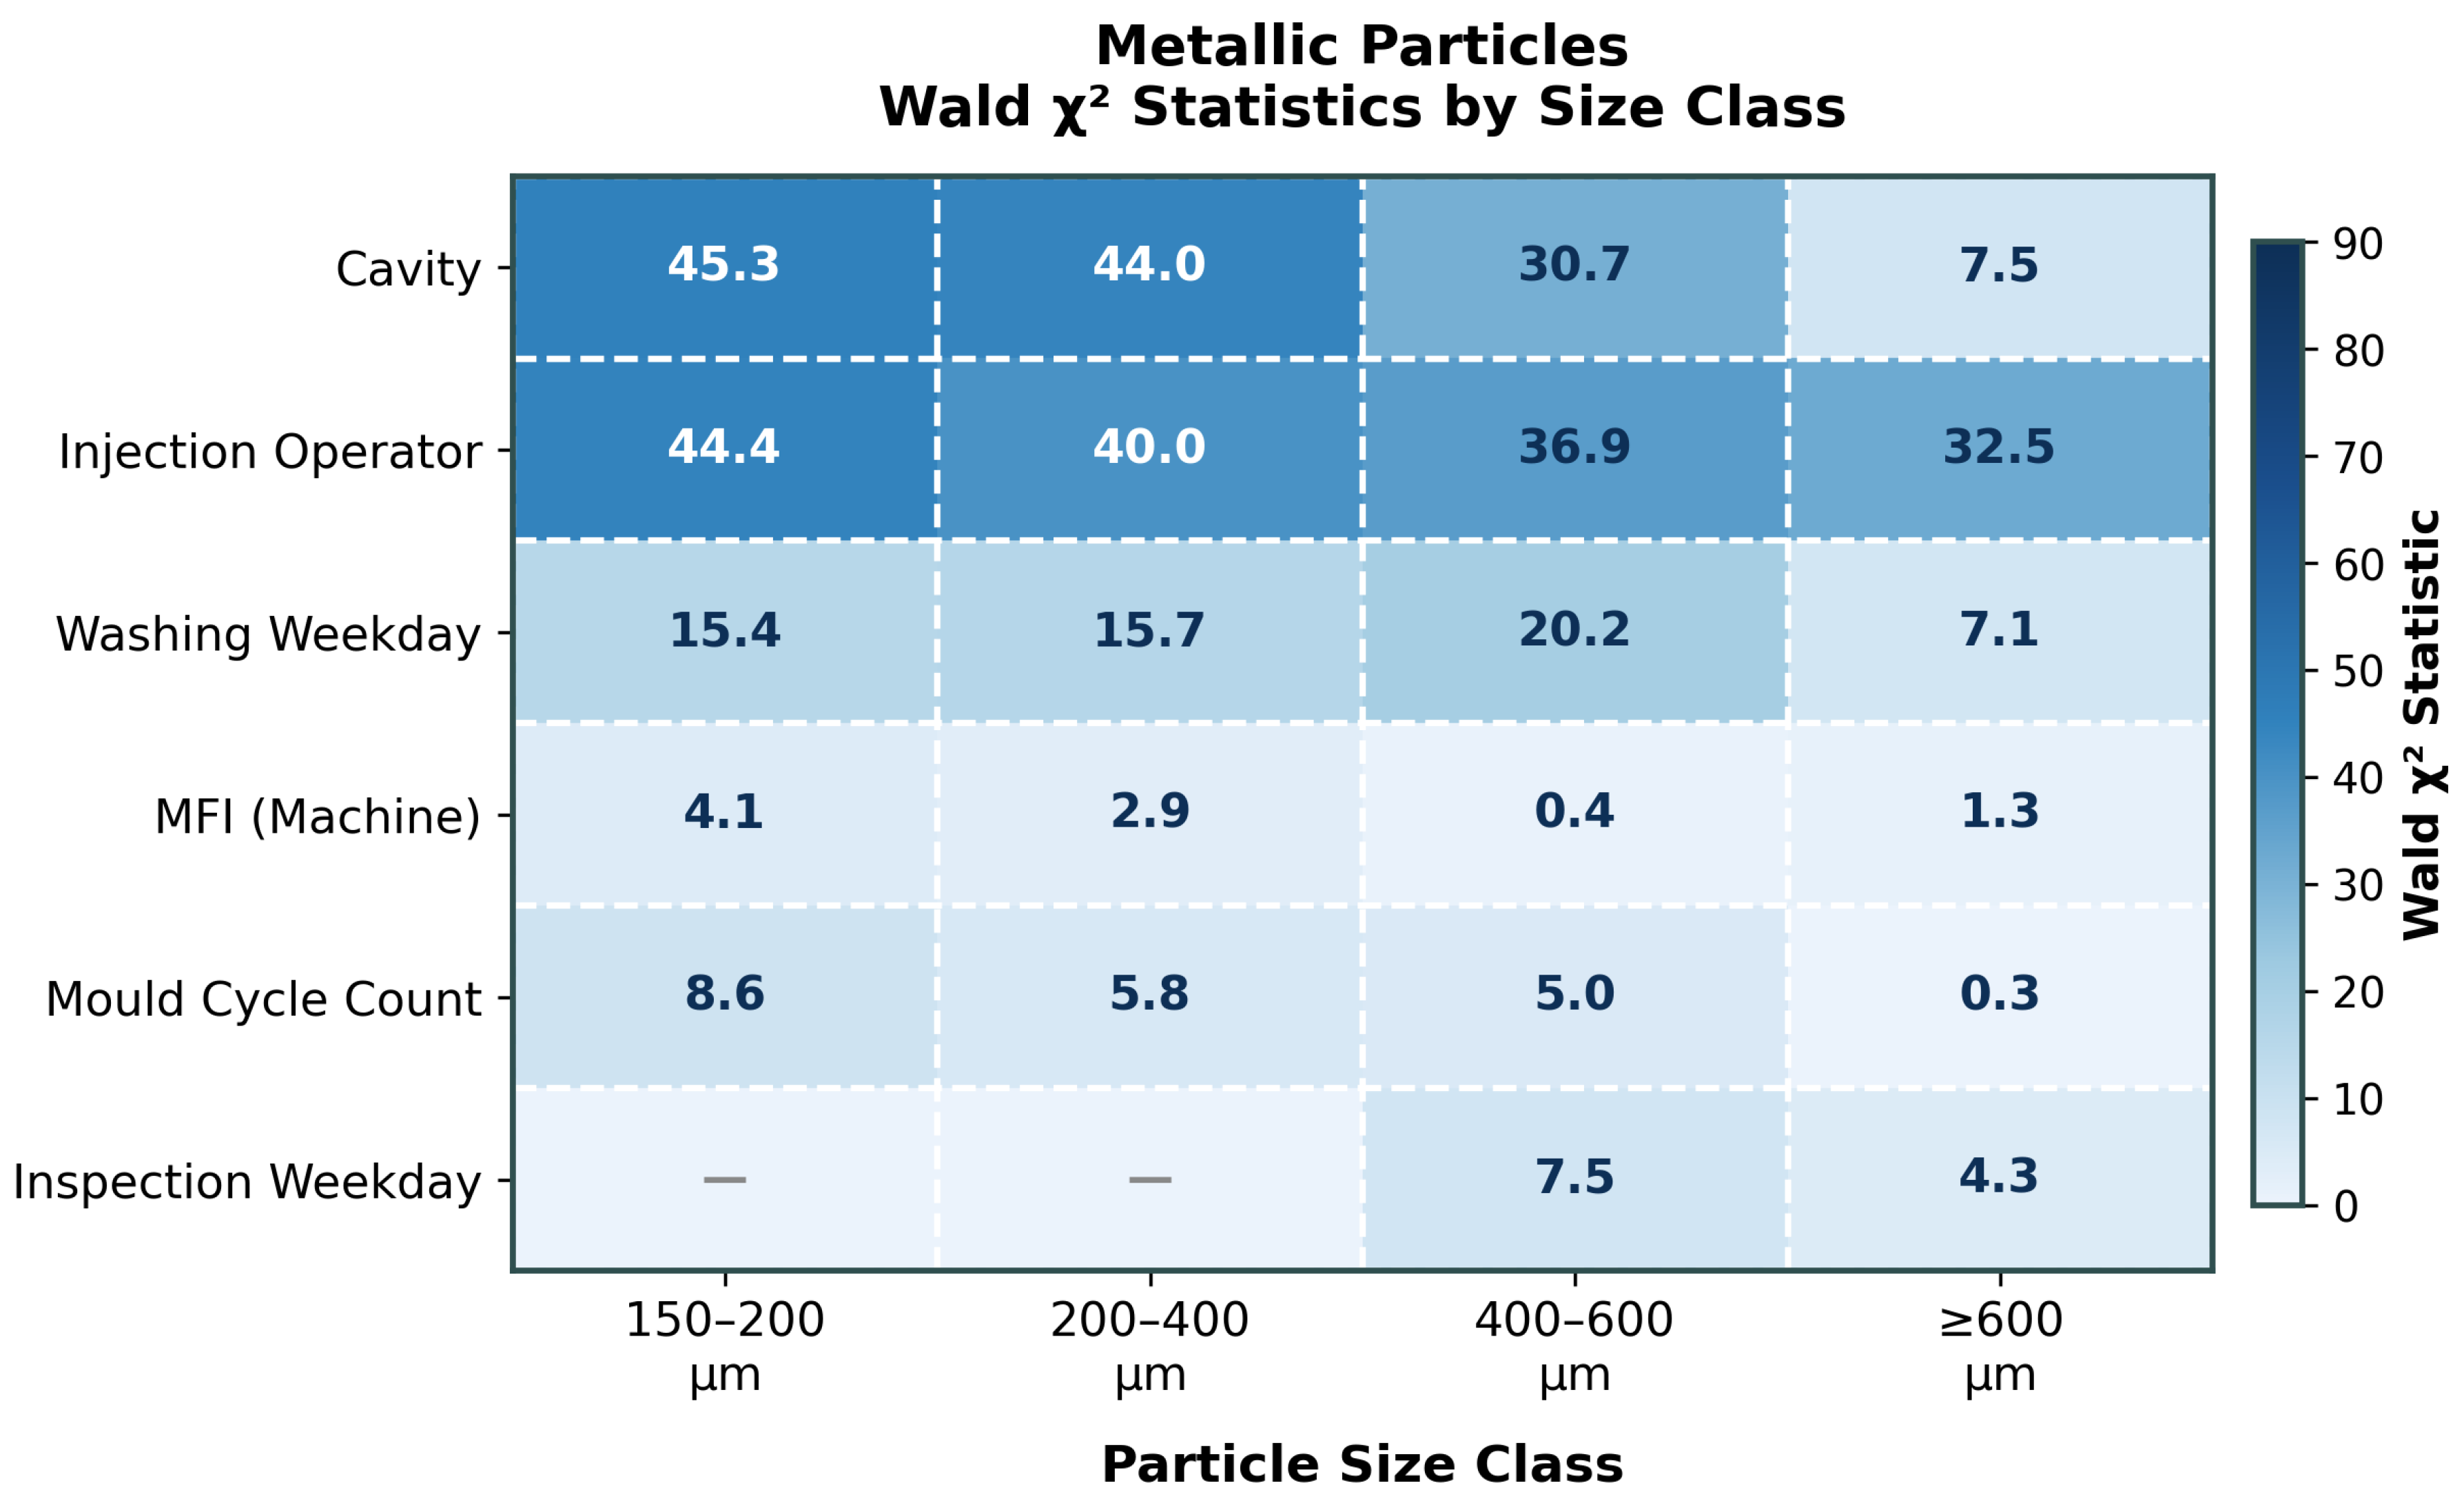
Table 5 presents the Wald test results for the 150–200 µm total particle class, representative of the smallest and most numerous particles. Mould cavity, injection operator, and washing weekday were highly significant (p < 0.001); injection machine and mould cycle count were significant (p < 0.01); and inspection weekday was significant (p < 0.05). The mould variable was excluded due to collinearity with cavity. Figure 3 and Figure 4 present heatmaps of Wald chi-squared statistics across all size classes for total and metallic particles, respectively, enabling visualisation of factor influence patterns across the granulometric spectrum.
Table 5.
Wald test results (Type II ANOVA) for factors influencing total particle count in the 150–200 µm class.
Figure 3.
Wald chi-squared statistic heatmap for total particles (metallic + non-metallic) across particle size classes and process variables.
Figure 4.
Wald chi-squared statistic heatmap for metallic particles across particle size classes and process variables.
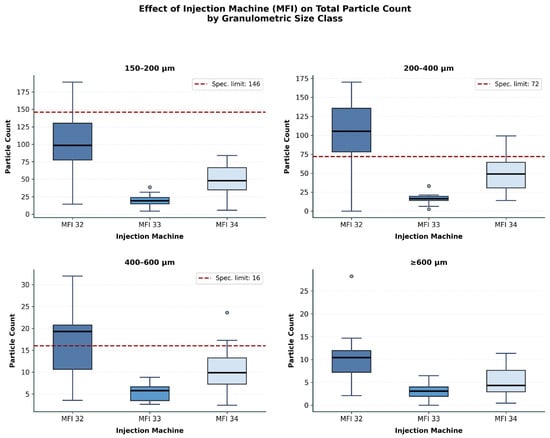
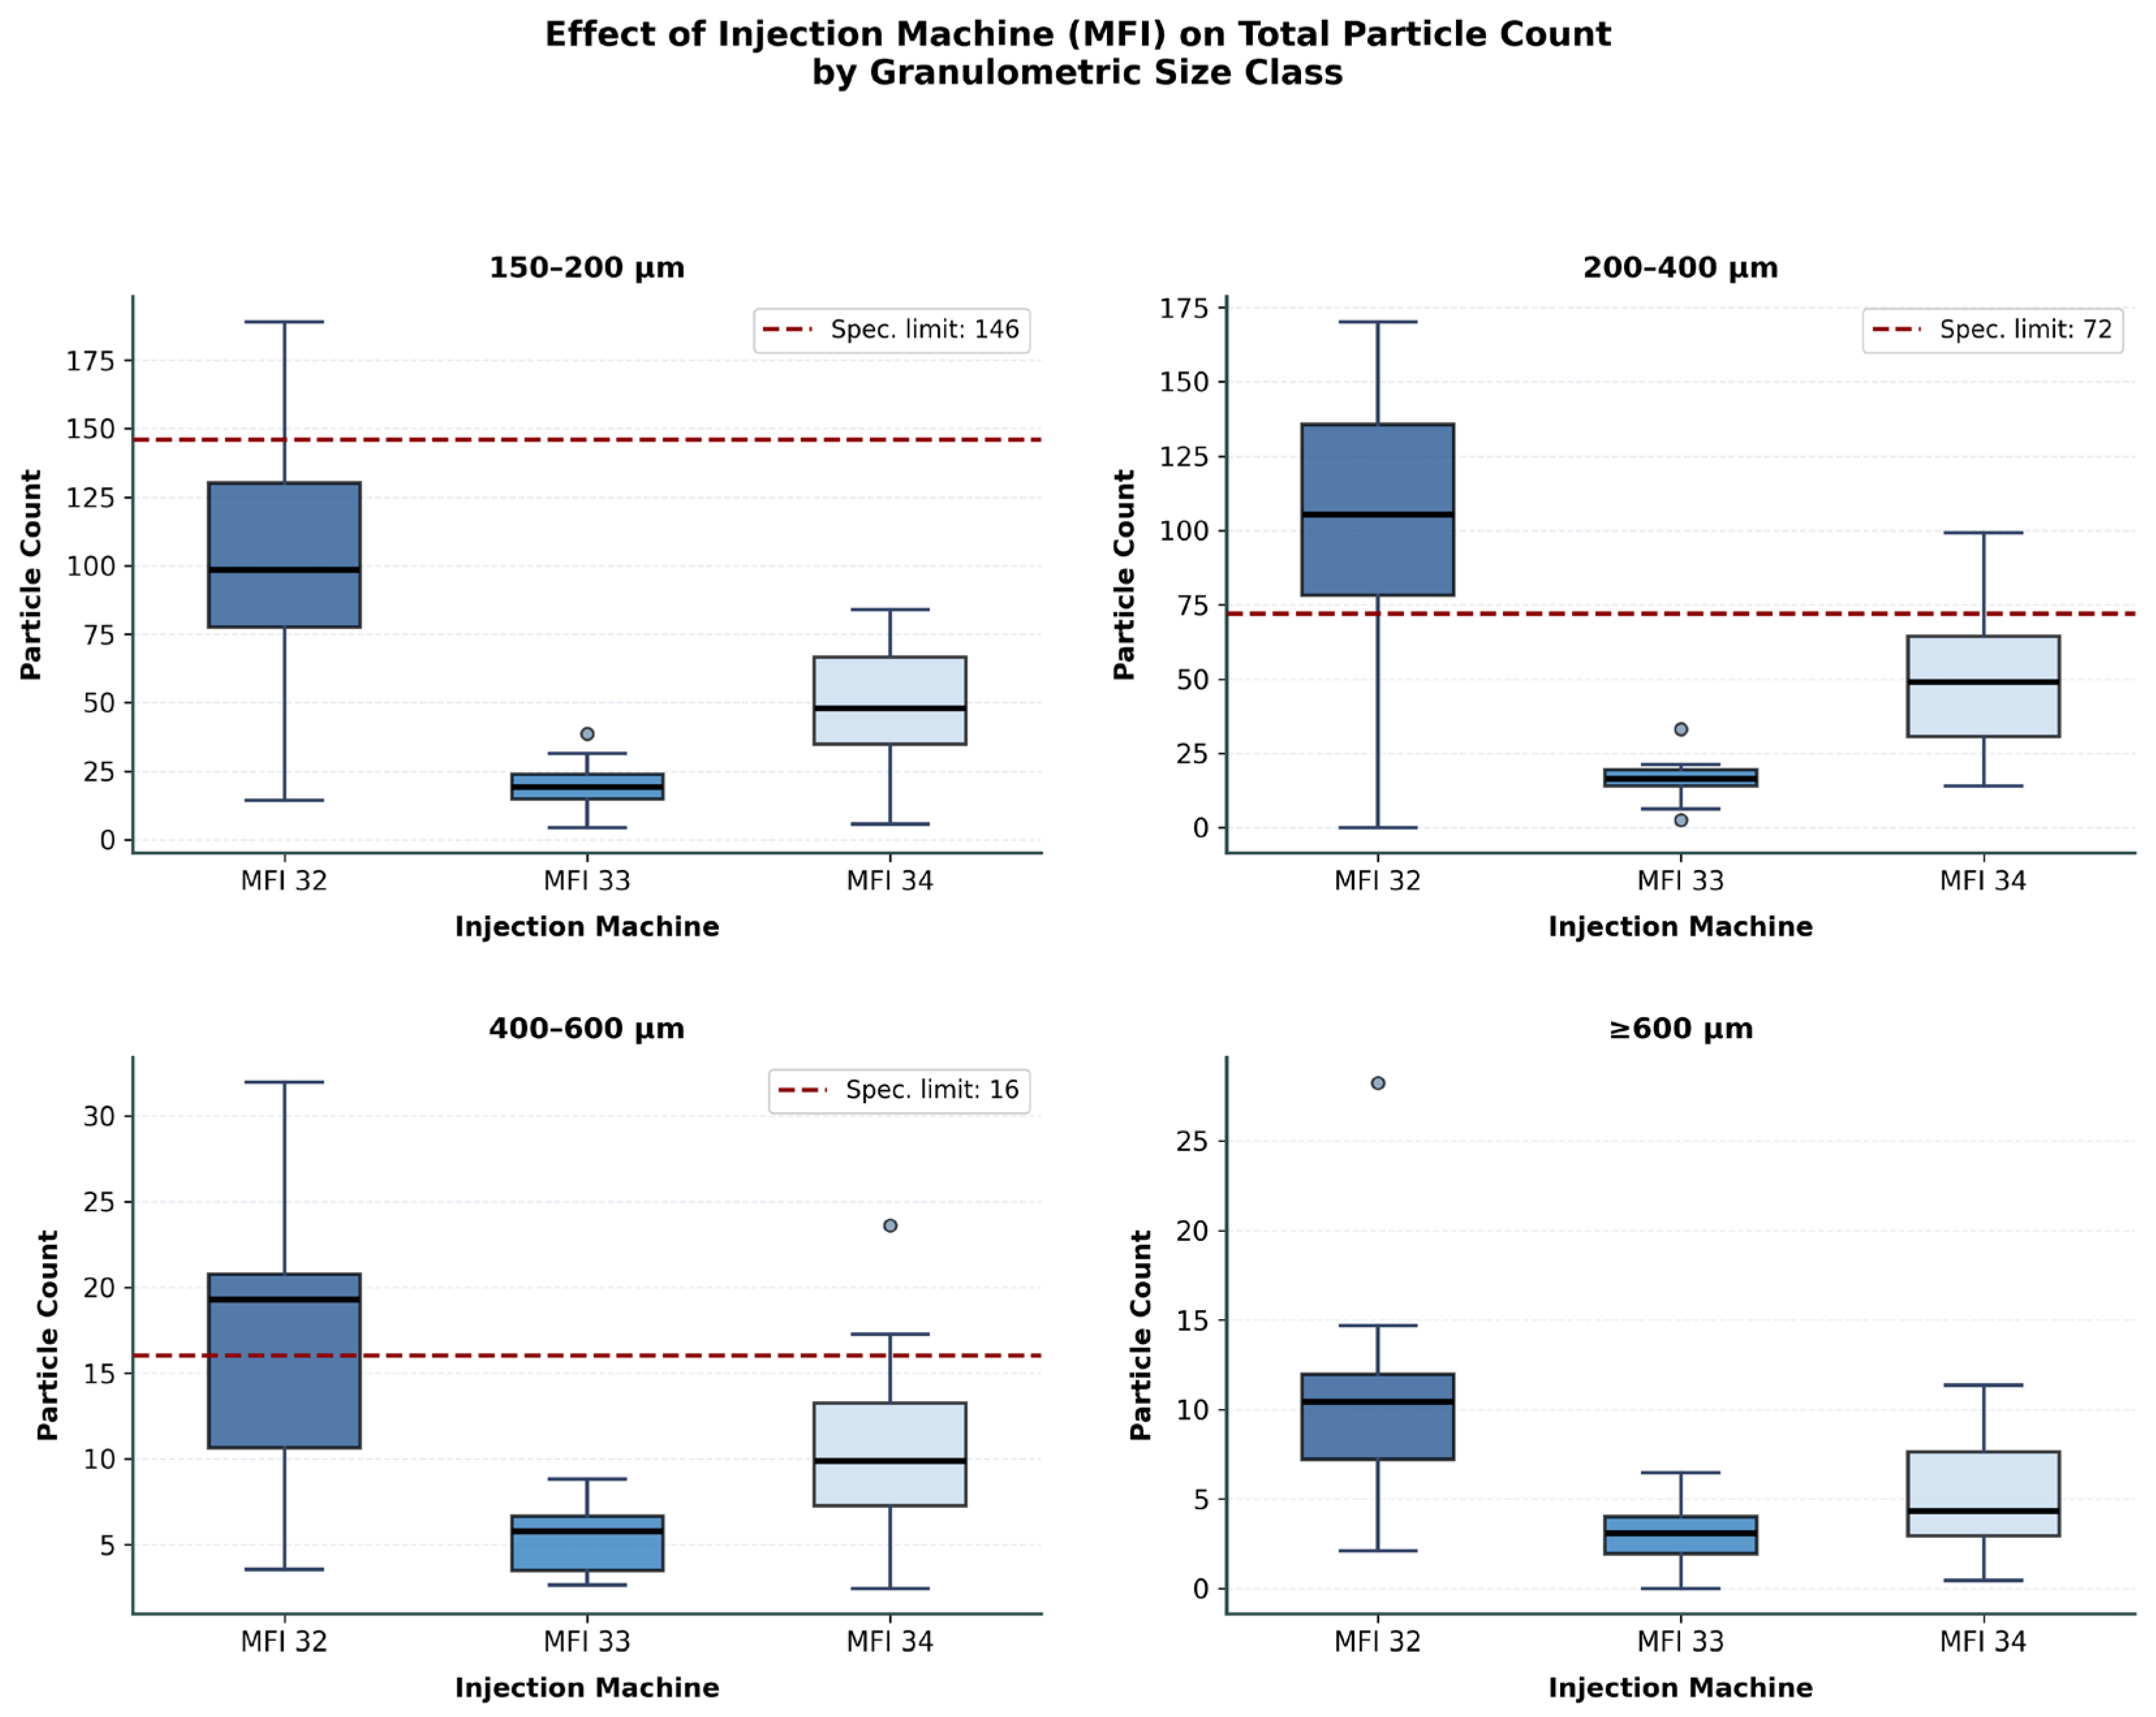
The heatmaps reveal a clear and interpretable pattern. Mould cavity and injection operator are the most persistent and dominant predictors across all granulometric classes and particle types. The injection machine showed stronger association with the 150–400 µm range, consistent with the audit identification of MFI 32 as exhibiting visible wear, oil leaks, and inadequate cleanliness conditions. Figure 5 illustrates the effect of injection machine on total particle counts by size class.
Figure 5.
Effect of injection machine (MFI) on total particle count by size class: MFI 32 consistently presents the highest counts and widest variability; MFI 33 presents the most stable performance. Dashed red lines indicate specification limits.
The mould cycle count showed significant associations, particularly for the 150–200 µm and 200–400 µm metallic classes. LOESS smoothing of particle counts against cycle count revealed a sawtooth pattern of progressive increase followed by partial recovery, a pattern consistent with, rather than confirmed against, scheduled or corrective maintenance actions: discrete maintenance event dates were not available as a verifiable variable in the production dataset (Section 4), so this association is reported as suggestive rather than causally established—suggesting that current maintenance intervals may be insufficient to counteract cumulative tool degradation at the rate required by the cleanliness specification. The injection operator effect was found, through stratified visual analysis of operator counts coloured by assigned machine, to co-occur strongly with machine assignment: since operators were not randomly distributed across machines, the operator variable captures, in part, the cumulative effect of machine characteristics, suggesting that machine-directed interventions should be prioritised over operator-directed ones. This relationship was assessed graphically rather than through a formal statistical mediation test (e.g., an operator×machine interaction term); it is therefore reported as an observed association rather than a formally tested mediating effect.
5.5. Improvement Actions
Because training, maintenance, gauge repositioning, rework relocation, and packaging redesign were implemented concurrently as a single structured programme rather than sequentially, the evaluation reported in Section 5.6 assesses the combined effect of this intervention programme; the study design does not permit isolating the statistical contribution of any individual action, and this is stated explicitly as a scope limitation in Section 7. A structured improvement programme was implemented based on the convergent evidence from the audit, statistical analysis, microscopic particle characterisation, and operator consultation. In the human and organisational dimension, a technical cleanliness training programme was integrated into onboarding procedures, complemented by a 5S reactivation initiative in the injection area. In the process engineering dimension, the inspection gauge was repositioned upstream of the washing step, eliminating post-washing particle generation by gauge–surface friction—identified through microscopic analysis of aluminium particles with ductile fracture morphology. Manual rework was transferred to controlled machining, removing a source of irregular burr particles, and zero tolerance for material drag-out was established. A backup mould system enabled condition-based maintenance, addressing the sawtooth degradation pattern identified in the regression analysis. Packaging geometry was redesigned to reduce friction between the component air-pocket regions and the inner surface, a mechanism identified microscopically as generating both metallic and non-metallic particles.
5.6. Process Improvement Evaluation via I-MR Control Charts
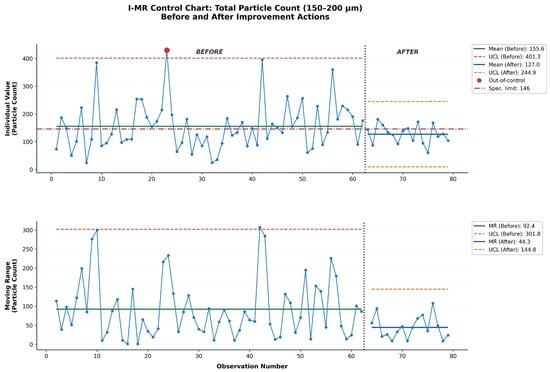
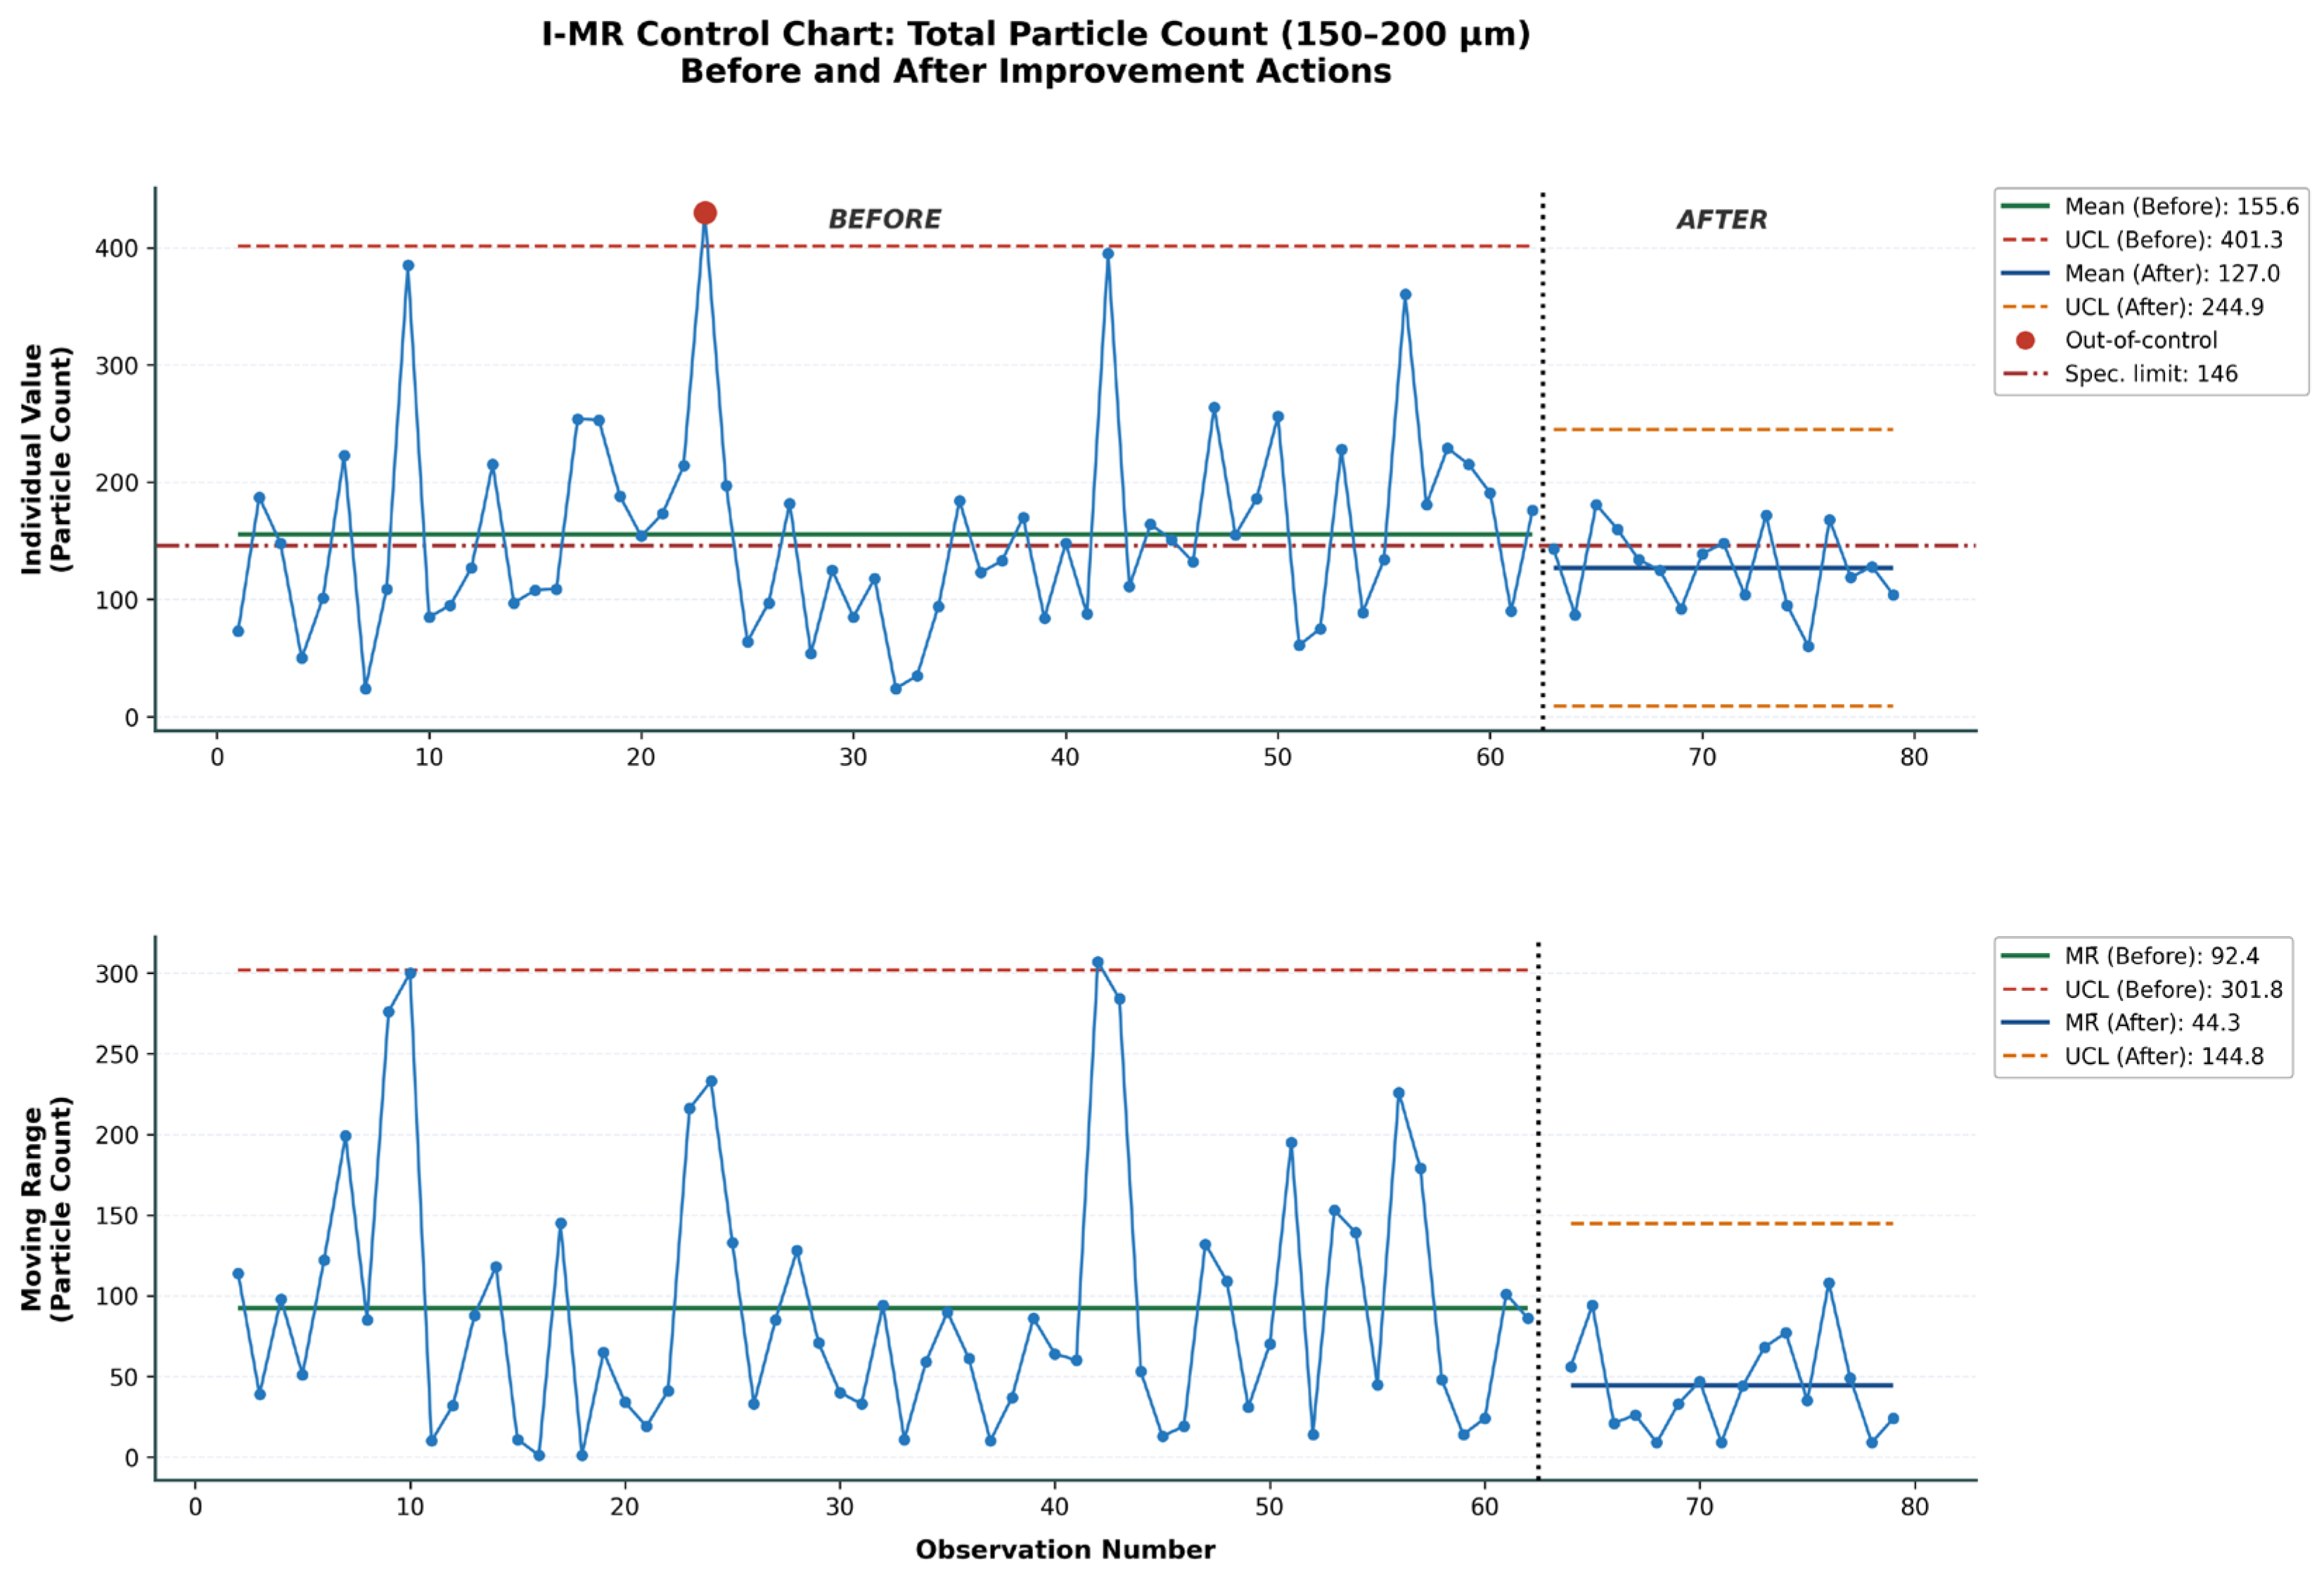
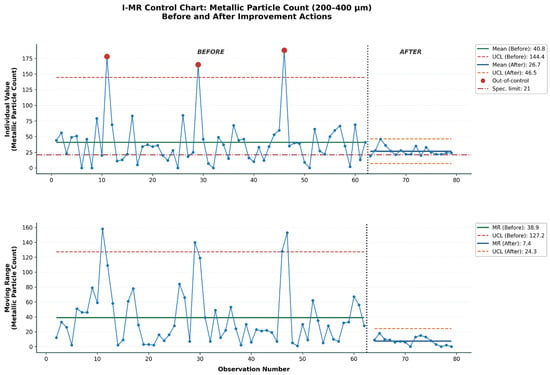
The effectiveness of the improvement programme was evaluated using I-MR control charts comparing 62 pre-intervention with 17 post-intervention observations (the two Mould 2 records described in Section 3 were excluded from this comparison for the same reasons as in the regression analysis). Table 6 summarises the statistical testing results. I-MR charts and their associated F-tests (variance) and two-sample t-tests (mean) are the standard tools recommended for before–after process comparison in classical SPC methodology and were retained here for consistency with this framework and ease of interpretation for practitioners; however, because particle counts are discrete, right-skewed, and overdispersed (Section 5.2), a negative binomial regression with intervention period as a predictor would provide a distributionally more consistent test of the pre/post difference, and we identify this as a recommended complementary analysis for future work rather than a substitute for the results reported here. The post-intervention sample (n = 17) is also markedly smaller than the pre-intervention sample (n = 62) and small relative to the extreme variability documented in Section 5.2; the statistical power to detect small-to-moderate improvements is therefore limited, and the results below should be regarded as preliminary validation evidence for the improvement programme rather than a definitive confirmation, pending collection of a larger post-intervention dataset under stable operating conditions. Figure 6 presents the I-MR chart for total particles in the 150–200 µm class; Figure 7 presents the I-MR chart for metallic particles in the 200–400 µm class—the class showing the most comprehensive improvement. To quantify practical compliance rather than statistical significance alone, we compared each specification limit to the pre- and post-intervention sample quartiles (the same method used for the pre-intervention audit in Section 4). Before the intervention, the specification limit fell within the interquartile range (Q1–Q3) for the 150–200 µm and 400–600 µm classes (≈50–75% of samples compliant, both total and metallic), between Q1 and Q2 for the 200–400 µm classes (≈25–50% compliant), and below Q1 for the ≥600 µm classes (<25% compliant, consistent with the >75% non-conformance reported in Section 4). After the intervention, compliance improved to above 75% for total particles in the 400–600 µm class and to effectively 100% for metallic particles in the 150–200 µm class (the post-intervention maximum fell below the specification limit); it remained in the 50–75% range for total particles in the 150–200 µm class and in the 25–50% range for metallic particles in the 200–400 µm and 400–600 µm classes. Compliance did not improve materially for total particles in the 200–400 µm class or for either ≥600 µm class, where the post-intervention minimum observed count (2 particles) still exceeded the zero-tolerance limit. These results show that the statistically significant variability reduction documented below did not uniformly translate into full specification compliance, particularly for the 200–400 µm total class and the ≥600 µm zero-tolerance classes, which remain priority targets for the next improvement cycle.
Table 6.
Effect of improvement actions on process variability (ΔSD) and mean particle counts across size classes, based on I-MR control chart analysis (n = 62 before; n = 17 after).
Figure 6.
I-MR control chart for total particle count (150–200 µm), before and after improvement actions. Red markers indicate out-of-control observations; green lines denote pre-intervention means; blue lines denote post-intervention means.
Figure 7.
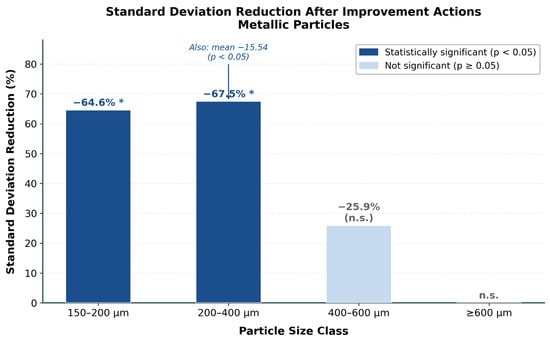
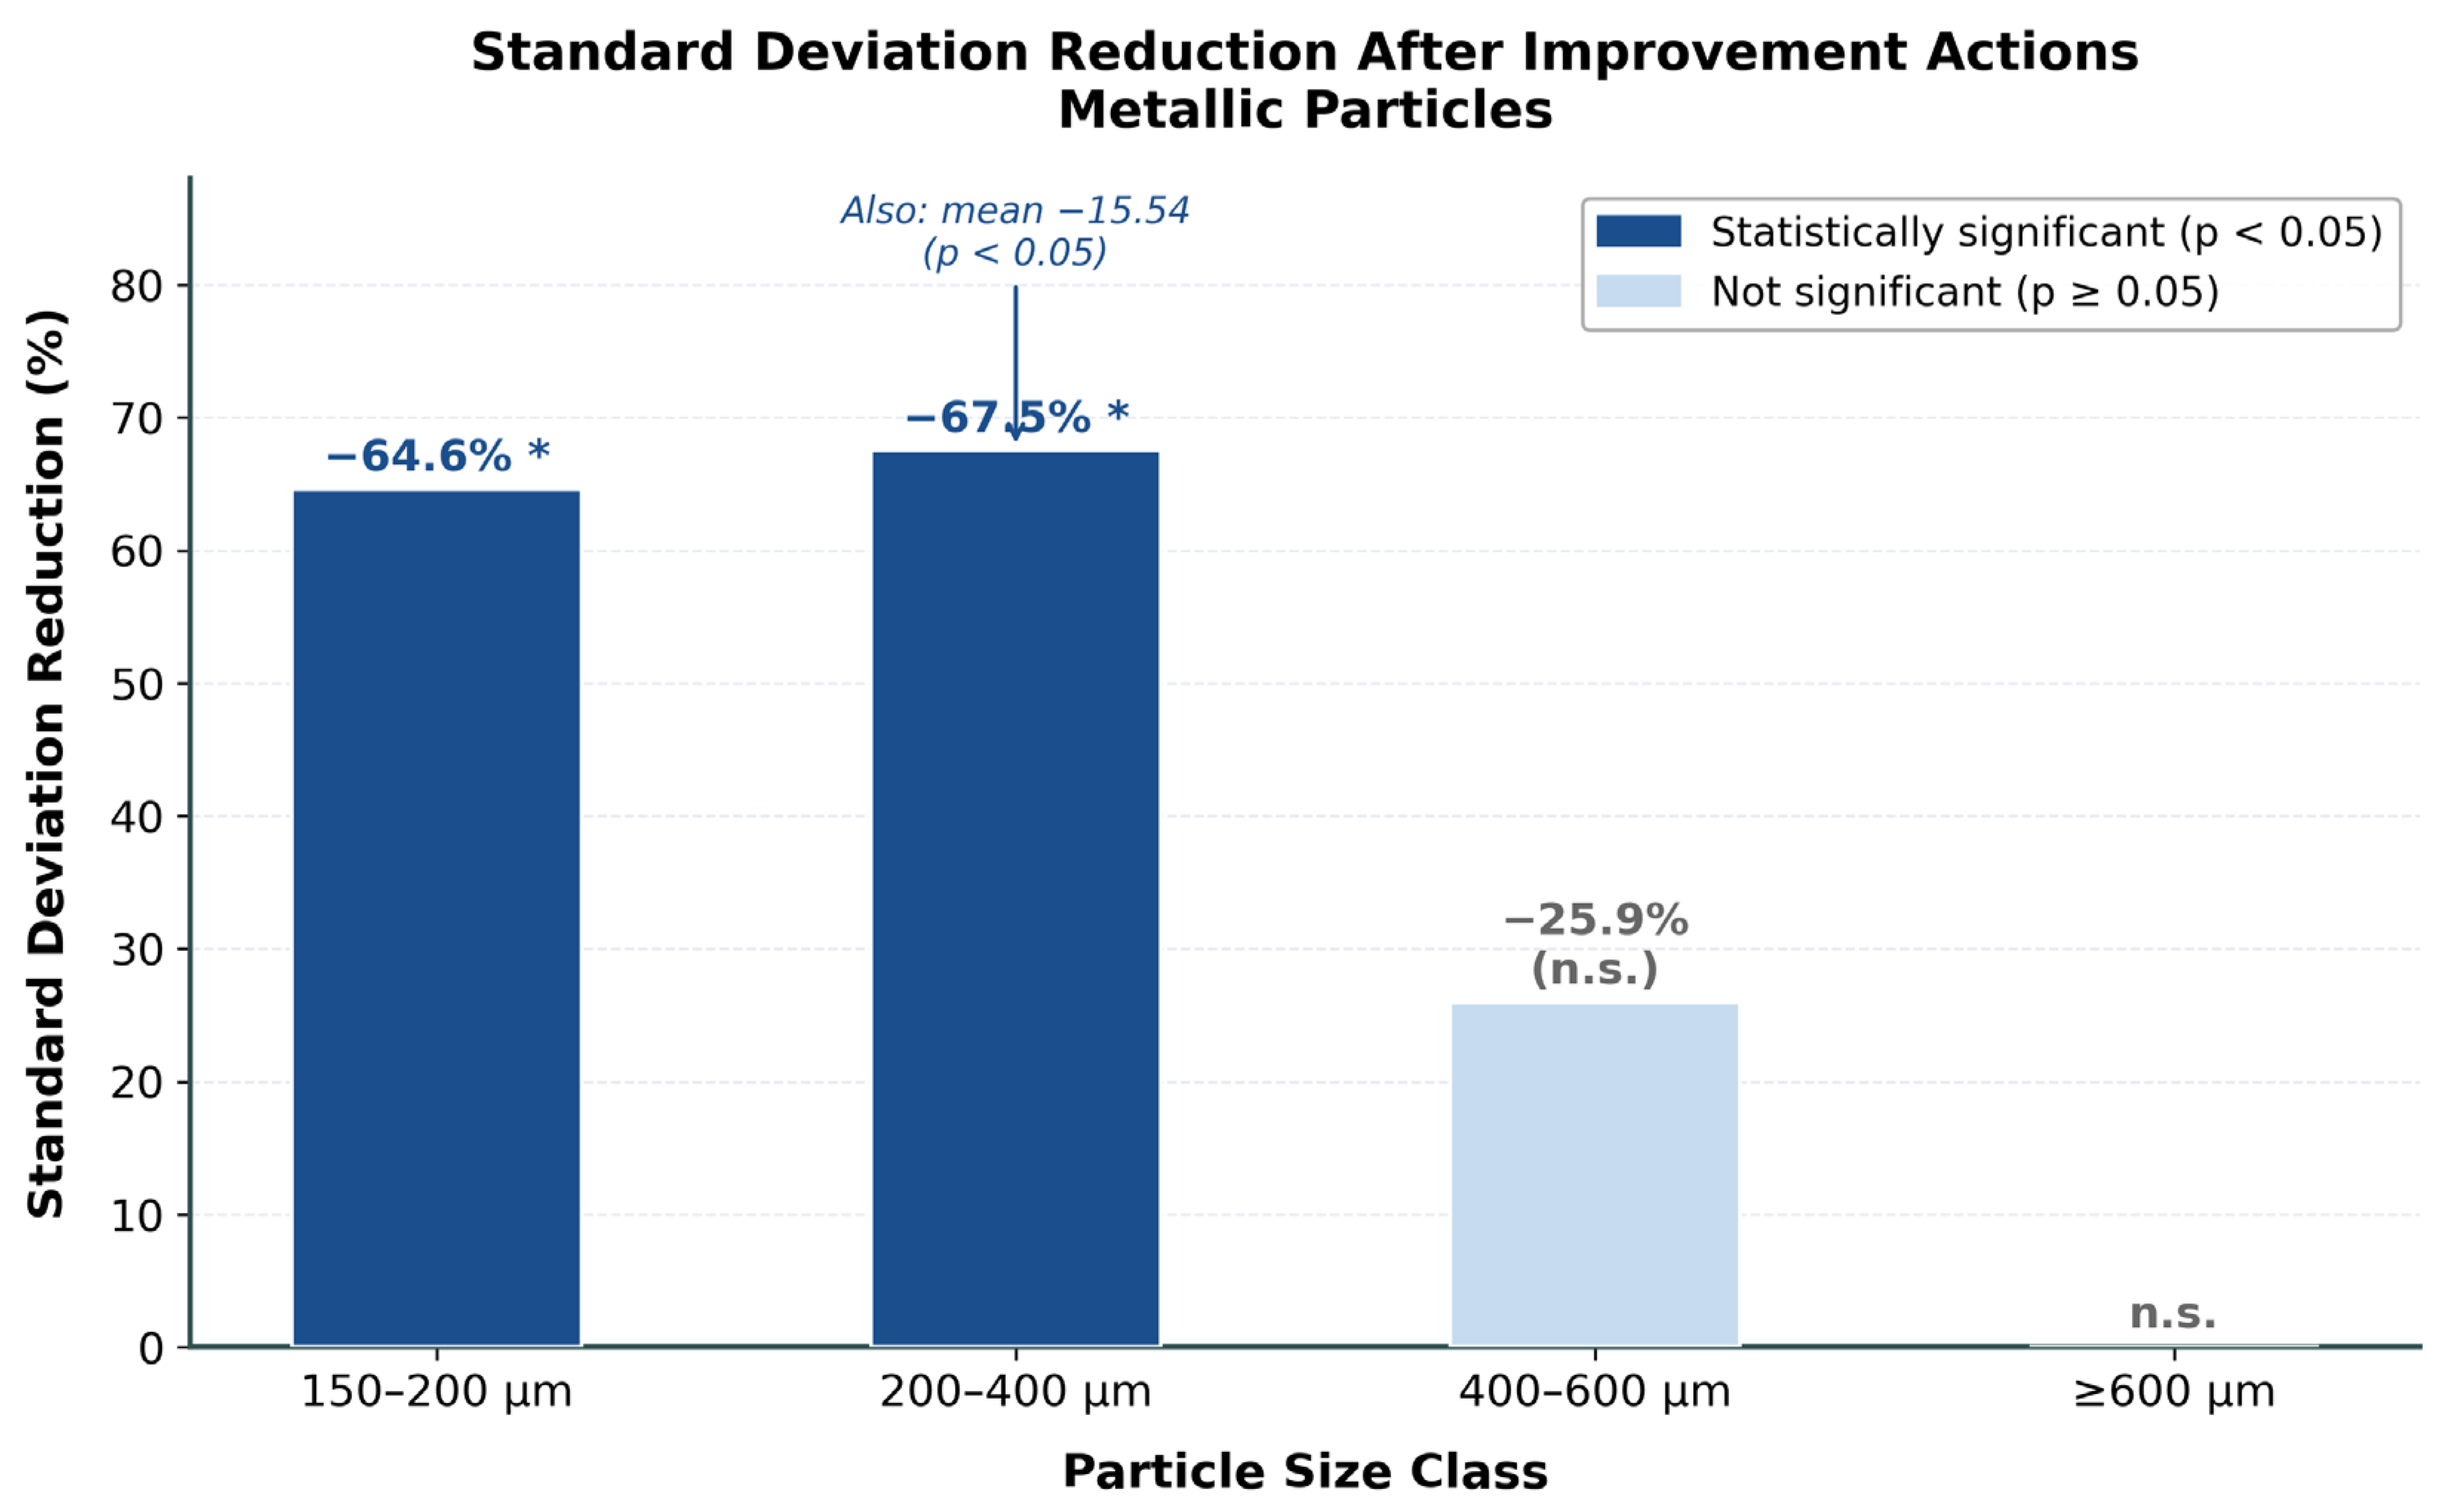
I-MR control chart for metallic particle count (200–400 µm), before and after improvement actions. This class achieved statistically significant reductions in both process variability (−67.5%) and process mean (−15.54 particles).
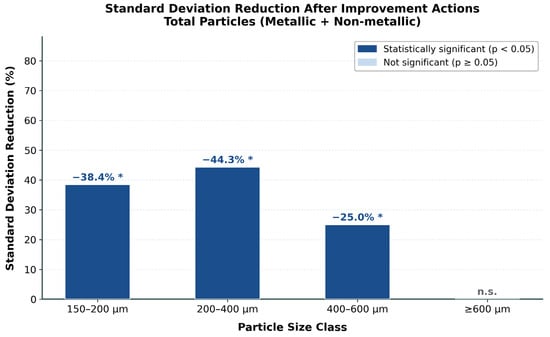
In the pre-intervention period, the individual chart for the 150–200 µm total class shows multiple out-of-control points attributable to special causes. Following improvement implementation, all post-intervention observations fall within revised control limits, and the moving range chart confirms a pronounced reduction in short-term variability, consistent with the 38.4% statistically significant standard deviation reduction. The metallic 200–400 µm class (Figure 7) was the only instance where both process variability (−67.5%, p < 0.05) and process mean (−15.54 particles, p < 0.05) were simultaneously and significantly reduced, representing the most comprehensive improvement. Statistically significant variability reductions were also achieved for total particles in the 400–600 µm class (−25.0%) and metallic 150–200 µm class (−64.6%). For particles exceeding 400 µm, no statistically significant changes were recorded, consistent with the regression finding that large particles are driven by sporadic special-cause mechanisms. Figure 8 and Figure 9 provide a consolidated view of the variability reduction results for total and metallic particles, respectively.
Figure 8.
Standard deviation reduction (%) for total particle classes after improvement actions. Blue bars: statistically significant (* p < 0.05); grey bars: not significant.
Figure 9.
Standard deviation reduction (%) for metallic particle classes after improvement actions. Blue bars: statistically significant (* p < 0.05); grey bars: not significant. The 200–400 µm class additionally achieved a statistically significant reduction in process mean (−15.54 particles, p < 0.05).
6. Connection to Artificial Intelligence, Industry 5.0, and Sustainability
This paper’s methodological contribution rests on classical inferential statistics—negative binomial regression, Wald hypothesis testing, and I-MR control charts—rather than on artificial intelligence algorithms. Its connection to Industry 5.0 is therefore conceptual rather than technical: Industry 5.0 emphasises human-centric, resilient, and sustainable manufacturing, in which structured data-driven decision-making is a necessary foundation for more advanced digital and AI-enabled capabilities. By showing that a resource-constrained automotive SME can implement a statistically rigorous quality-monitoring framework using only spreadsheet and open-source statistical software, this study establishes the data governance, variable standardisation, and decision discipline that are prerequisites for reliable deployment of AI-based particle classification and inspection systems such as those reported by Zwinkau et al. [9] and Panusch et al. [10].
From an innovation perspective, the framework offers automotive SMEs facing similar resource constraints a replicable, low-cost pathway to statistically grounded quality management. From a sustainability perspective, more effective particle contamination control reduces scrap, rework, and customer returns, and supports the technical cleanliness verification requirements associated with component remanufacturing and circular-economy strategies [15]. Future integration of the present statistical framework with AI-assisted, real-time particle classification, as proposed in Section 7, would close the loop between human-centric decision-making and automated inspection, moving the SME described here progressively toward the Industry 5.0 paradigm rather than claiming that this paradigm has already been achieved by the present study alone.
7. Conclusions and Future Research
This study developed, implemented, and evaluated a data-driven SPC framework for technical cleanliness management in an automotive aluminium die-casting SME, integrating a VDA 19.2-aligned audit, negative binomial regression with Wald hypothesis testing, I-MR control charts, and microscopic particle characterisation within a DMAIC-CRISP-DM action research methodology. Three principal contributions emerge.
First, the study provides strong evidence that negative binomial regression is the appropriate statistical model for particle count data in automotive technical cleanliness monitoring, within the scope of the single component and site studied. The ΔAIC for Poisson models reached 2958 for the 200–400 µm total particle class, providing unambiguous quantitative evidence of overdispersion that renders Poisson-based and normality-based approaches invalid. Any SPC application to particle count data that does not account for overdispersion will produce incorrect control limits and misleading factor significance estimates.
Second, Wald test analysis identifies mould cavity, injection machine condition, and injection operator as the dominant and most consistent predictors of particle contamination across all granulometric classes. The descriptive finding that the operator effect co-occurs strongly with, and is not randomly distributed across, machine assignment (assessed graphically rather than through a formal mediation test, Section 5.4) redirects corrective focus from individuals to equipment and process systems, although this should be read as an observed association rather than a confirmed causal or mediated mechanism. The sawtooth degradation pattern identified through LOESS analysis of particle counts against the mould cycle counter provides direct, actionable guidance for maintenance interval optimisation.
Third, the before-and-after I-MR analysis demonstrates that a structured, analytically grounded improvement programme can achieve statistically significant variability reductions in the 150–400 µm range within an eleven-month action research timeline, based on a post-intervention sample (n = 17) that we regard as preliminary validation evidence pending a larger confirmatory dataset (Section 5.6). The simultaneous reduction of both variability and mean for metallic particles in the 200–400 µm class is consistent with condition-based maintenance, gauge repositioning, rework transfer to machining, and packaging redesign having, as a combined programme rather than as individually separable actions (Section 5.5), addressed the root causes of contamination in this critical size range; the compliance analysis in Section 5.6 further shows that this variability reduction did not uniformly translate into full specification compliance. The absence of significant improvement for particles exceeding 400 µm delineates the boundary of the first improvement cycle and defines the agenda for subsequent interventions.
The study presents three principal limitations. The dataset is restricted to one component and industrial site; given these constraints, the quantitative findings should be understood as case-study evidence characterising this specific production line rather than as generalisable population parameters for automotive die-casting broadly. The post-intervention sample of 17 constrains statistical power, and we recommend collecting a larger post-intervention dataset under stable operating conditions before treating the I-MR findings as a final validation of the framework. The paper-based data management environment excluded machining-related variables from regression models despite microscopic evidence implicating machining as a contamination source; because machining could not be included as a control variable, part of the contamination attributed to mould cavity, injection machine, and injection operator may partially reflect uncontrolled machining effects, and the reported associations should be interpreted as the net effect of the observed variables together with any unmeasured machining influence, rather than as fully isolated effects of injection-stage factors alone. These limitations simultaneously define the research agenda: future work should extend the methodology to additional components, processes, and facilities; deploy systematic digitisation of production records, including machining parameters, to broaden the variable set; evaluate a Bayesian negative binomial regression as a complementary approach that may provide more robust parameter estimation given the limited post-intervention sample size, alongside the frequentist framework applied here; and investigate the integration of AI-assisted particle classification with real-time SPC feedback, creating a closed-loop intelligent quality management architecture aligned with Industry 5.0 principles.
Author Contributions
Conceptualization, A.M.; Methodology, A.M.; Validation, A.R.; Formal analysis, A.R.; Investigation, A.M.; Resources, A.M.; Data curation, A.M.; Writing—original draft, A.M.; Writing—review & editing, A.M., A.R.; Supervision, A.R.; Project administration, A.R. All authors have read and agreed to the published version of the manuscript.
Funding
This work is funded by national funds through FCT—Fundacão para a Ciência e a Tecnologia, I.P., under project 2023.13382.PEX (F4PPT—Fabrica para Pessoas, Processos e Tecnologia) and UID/PRR/05549/2025 (2Ai Laboratory).
Institutional Review Board Statement
Not applicable.
Informed Consent Statement
Not applicable.
Data Availability Statement
The original contributions presented in this study are included in the article. Further inquiries can be directed to the corresponding author.
Conflicts of Interest
The authors declare no conflict of interest.
Abbreviations
The following abbreviations are used in this manuscript:
| SPC | Statistical Process Control |
| SME | Small and Medium-Sized Enterprise |
| DMAIC | Define, Measure, Analyse, Improve, Control |
| CRISP-DM | Cross-Industry Standard Process for Data Mining |
| DDDM | Data-Driven Decision Making |
| VDA | Verband der Automobilindustrie |
| ISO | International Organization for Standardization |
| AIC | Akaike Information Criterion |
| I-MR | Individual Moving Range |
| MFI | Injection Machine Identifier (die-casting SME internal code) |
References
- Brag, P.; Rochowicz, M. Safety in Electromobility—Technical Cleanliness Between the Poles of Design Requirements and Efficient Production. In Advances in Automotive Production Technology–Theory and Application; Weissgraeber, P., Heieck, F., Ackermann, C., Eds.; Springer: Berlin/Heidelberg, Germany, 2021; pp. 319–326. [Google Scholar]
- ZVEI–German Electrical and Electronic Manufacturers Association. Technical Cleanliness in Electrical Engineering, 2nd ed.; ZVEI: Frankfurt am Main, Germany, 2019. [Google Scholar]
- ISO 16232:2018; Road Vehicles–Cleanliness of Components and Systems. ISO: Geneva, Switzerland, 2018.
- Hermanns, M. Partial Cleaning and Surface Processing of Parts for E-mobility. ATZproduction Worldw. 2019, 6, 40–43. [Google Scholar] [CrossRef] [Scilit]
- Lutz, T. When are parts sufficiently clean? Int. Surf. Technol. 2018, 11, 36–37. [Google Scholar] [CrossRef] [Scilit]
- Schleicher, M.; Damak, N. Impact of Technical Cleanliness on HV Automotive Applications. In Proceedings of the PCIM Europe 2022–International Exhibition and Conference for Power Electronics, Intelligent Motion, Renewable Energy and Energy Management, Nuremberg, Germany, 10–12 May 2022; pp. 1–10. [Google Scholar]
- Jordão, M.; Fernandes, F. A Indústria Automóvel em Portugal; Direção-Geral das Atividades Económicas: Lisbon, Portugal, 2022. [Google Scholar]
- Motta, A.G.B. Implementação de Controlo Estatístico nos Requisitos de Limpeza Técnica de Componentes para o Setor Automóvel numa Indústria de Fundição Injetada. Master’s Thesis, Instituto Politécnico do Cávado e do Ave, Barcelos, Portugal, 2026. [Google Scholar]
- Zwinkau, R.; Frentrup, S.; Möhle, R.; Deuse, J. Automatic Particle Classification Through Deep Learning Approaches for Increasing Productivity in the Technical Cleanliness Laboratory. In Production at the Leading Edge of Technology; Springer: Cham, Switzerland, 2020; pp. 34–44. [Google Scholar]
- Panusch, T.; Möhle, R.; Zwinkau, R.; Deuse, J. Reduction of Human Effort in Technical Cleanliness Inspection Through Advanced Image Processing Approaches. In Advances in Manufacturing, Production Management and Process Control; Trzcielinski, S., Ed.; Springer: Cham, Switzerland, 2021; pp. 108–115. [Google Scholar]
- Peckman, J.; Luptak, V. Cleanliness test for variable packaging solutions in the automotive supply chain. Arch. Motoryz. 2021, 91, 49–62. [Google Scholar] [CrossRef] [Scilit]
- Pedrosa, C.; Almeida, N.M.; Pereira, F.; Reis, C.M.; Braga, P. Impact of Metallic Particle Contamination in Relation to Product Requirements in the Automotive Industry (Case Study)—Part 1. In Occupational and Environmental Safety and Health IV; Arezes, P.M., Ed.; Springer: Cham, Switzerland, 2023; pp. 99–109. [Google Scholar]
- Faber, J.; Brodzik, K.; Nycz, M. Understanding technical cleanliness: Importance, assessment, maintenance. Combust. Engines 2021, 186, 25–32. [Google Scholar] [CrossRef] [Scilit]
- Shaik, A.S.; Rodrigues, L.L.R. Plant layout optimisation with implementation of technical cleanliness in an automotive industry: A system dynamics approach. Int. J. Technol. Policy Manag. 2018, 18, 201–221. [Google Scholar] [CrossRef] [Scilit]
- Krotil, S. Resource Efficiency by Remanufacturing of Used Parts. ATZproduction Worldw. 2019, 6, 44–48. [Google Scholar] [CrossRef] [Scilit]
- Montgomery, D.C. Introduction to Statistical Quality Control, 8th ed.; John Wiley and Sons: Hoboken, NJ, USA, 2020. [Google Scholar]
- Dogan, O.; Hiziroglu, O.A. Empowering Manufacturing Environments with Process Mining-Based Statistical Process Control. Machines 2024, 12, 411. [Google Scholar] [CrossRef] [Scilit]
- Stavropoulos, P.; Papacharalampopoulos, A.; Sabatakakis, K. Data Attributes in Quality Monitoring of Manufacturing Processes: The Welding Case. Appl. Sci. 2023, 13, 10580. [Google Scholar] [CrossRef] [Scilit]
- Kawamura, H.; Nishina, K.; Higashide, M. Control Charts for Particles in the Semiconductor Manufacturing Process. Econ. Qual. Control 2008, 23, 95–107. [Google Scholar] [CrossRef] [Scilit]
- Baskerville, R.; Myers, M.D. Special Issue on Action Research in Information Systems: Making IS Research Relevant to Practice–Foreword. MIS Q. 2004, 28, 329–336. [Google Scholar] [CrossRef] [Scilit]
- Cleto, M.G.; Quinteiro, L. Gestão de projetos através do DMAIC: Um estudo de caso na indústria automotiva. Rev. Produção Online 2011, 11, 210–239. [Google Scholar] [CrossRef] [Scilit]
- Kurgan, L.A.; Musilek, P. A survey of Knowledge Discovery and Data Mining process models. Knowl. Eng. Rev. 2006, 21, 1–24. [Google Scholar] [CrossRef] [Scilit]
- Verband der Automobilindustrie (VDA). VDA 19.1: Inspection of Technical Cleanliness–Particle Contamination of Functionally Relevant Automotive Components, 3rd ed.; VDA QMC: Berlin, Germany, 2025. [Google Scholar]
- Verband der Automobilindustrie (VDA). VDA 19.2: Technical Cleanliness in Assembly, 1st ed.; VDA QMC: Berlin, Germany, 2010. [Google Scholar]

Disclaimer/Publisher’s Note: The statements, opinions and data contained in all publications are solely those of the individual author(s) and contributor(s) and not of MDPI and/or the editor(s). MDPI and/or the editor(s) disclaim responsibility for any injury to people or property resulting from any ideas, methods, instructions or products referred to in the content. |
© 2026 by the authors. Licensee MDPI, Basel, Switzerland. This article is an open access article distributed under the terms and conditions of the Creative Commons Attribution (CC BY) license.