


Abstract
To achieve proactive preventive maintenance of green and low-carbon infrastructure, this study systematically investigated the long-term durability and resistance degradation of prefabricated recycled aggregate concrete (RAC) bridge components. A 80-month multi-field coupled damage experiment under sustained flexural loading, natural atmospheric exposure, and chloride drying-wetting cycles was conducted, and an in-situ physical exposure and multi-source data-driven Support Vector Regression (SVR) dynamic surrogate model was established. Results indicate a prominent time-dependent ebb-and-flow mechanism of degradation drivers: environmental and stress boundaries dominate the early stage, whereas the material replacement rate () surges to become the absolute dominant driving variable (36.8%) in the ultra-long term (), proving the cumulative dominance of recycled aggregates. Concurrently, the residual capacity exhibits a distinct two-stage decay characterized by a 10% critical reinforcement mass loss threshold, beyond which the degradation rate of RAC100 accelerates to 1.63 times that of conventional concrete. Driven by the multi-stage injection of in-situ experimental inspection data (surface crack profiling, 2D spatial chloride profiles, and rebar mass loss), the SVR network successfully achieves a collapse-like convergence of the remaining useful life (RUL) confidence interval, precisely locking the RUL of the RAC100 component at 34.5 years within a 1.4-year error margin. This framework provides critical algorithmic support for the life-cycle safety paradigm shift in low-carbon structures.
1. Introduction
Against the macroeconomic backdrop of traffic infrastructure construction comprehensively advancing toward a green transition and the national “dual carbon” strategic goals, the promotion of low-carbon recycled materials and industrialized prefabricated structures has emerged as a core pathway for the sustainable development of bridge engineering. By recycling and reusing construction and demolition wastes, recycled aggregate concrete (RAC) can significantly alleviate the depletion crisis of natural aggregates and decrease the carbon emission index [1,2,3]. Applying recycled concrete to prefabricated beam components not only leverages the high-efficiency advantages of factory prefabrication but also substantially enhances the ecological and environmental benefits of the structures throughout their full life cycles [4,5]. However, during an extensive service lifetime, such low-carbon prefabricated components are inevitably subjected to multi-field coupled effects, including the sustained bending stress fields induced by vehicular loads, the ingress of high-concentration chloride ions from de-icing salts and coastal splash zones, as well as alternating fluctuations of the atmospheric environment [6,7]. Therefore, deeply dissecting the time-dependent degradation mechanisms of prefabricated recycled concrete components under complex multi-field coupled conditions, and implementing precise forecasting of their long-term resistance evolution, remains a critical industrial bottleneck to guarantee the load-bearing safety of these low-carbon structures over their entire life cycles.
Domestic and international scholars have conducted extensive experimental investigations into the microstructural defects and durability transport behaviors of recycled aggregate concrete (RAC) materials. Numerous micro- and meso-mechanical studies [8,9,10] have revealed that the old adhered mortar on the surface of recycled coarse aggregates, along with the characteristic multiple interface transition zones (ITZs), leads to a higher initial porosity and randomly distributed microcracks within the matrix. This inherent microstructural defect directly results in the apparent diffusion coefficients of aggressive media (e.g., chloride ions and carbon dioxide) within RAC being significantly higher than those in conventional concrete [11,12,13]. Regarding multi-field coupled effects, existing studies [14,15,16] have confirmed the asymmetric regulation mechanism of sustained stress fields on medium transport: the load-induced microcrack network in the tensile zone triggers an explosive infiltration via convection-diffusion, whereas the compaction and self-tightening effect in the compressive zone retards the accumulation of aggressive media to some extent. Although previous studies have enhanced the barrier effect of the aggregate ITZ through nano-silica slurry modification [17] or carbon dioxide carbonation strengthening technologies [18,19], most of these mechanistic studies rely heavily on dogmatic laboratory accelerated corrosion protocols (such as the galvanostatic accelerated corrosion method [20,21]), whose spatiotemporal boundaries and chemical degradation kinetics differ drastically from real service environments. Up to now, scarce research has been able to track deeply the time-dependent, causal closed-loop deterioration chain encompassing diffuse crack pattern evolution, localized rebar pitting morphology, and macro-flexural resistance decay of full-scale prefabricated components under the long-term interactive effects of “real sustained loading, chronic natural atmospheric exposure, and salt spray environments” spanning several years (e.g., over 80 months) [22].
Against the backdrop of insufficient mechanistic understanding, the development of long-term durability prediction models and intelligent operation and maintenance frameworks for concrete structures faces significant mathematical and physical bottlenecks. Traditional durability evaluation methods are mostly based on physical mechanistic operators (such as the modified Fick’s second law or phenomenological damage evolution equations [23,24]). Due to the lack of site-specific parameter updates, such deterministic models are extremely difficult to adaptively match the strong spatial random and discrete characteristics of recycled coarse aggregates, often resulting in exceptionally wide confidence intervals for long-term forward extrapolation [25]. To address these limitations, data-driven machine learning (ML) algorithms have been widely adopted in structural health monitoring and life assessment of concrete structures, leveraging their powerful non-linear mapping and feature mining capabilities [26]. Several studies have attempted to implement decision tree or random forest regression (RFR) models to extrapolate the time-dependent performance metrics of waste-modified concrete [27,28]. Nevertheless, existing ML-based prediction frameworks lean heavily toward static offline assessments, which lack a dynamic injection mechanism for in-situ multi-source monitoring data streams when coping with data distribution shifts and matrix heterogeneity induced by complex variable environments [29]. More critically, when executing ultra-long-term forward prognostications well beyond the known experimental ages (e.g., extrapolating to 30–50 years), ensemble tree-based models such as RFR, restricted by their underlying non-parametric splitting rules and localized neighborhood averaging, are highly susceptible to rigid, “staircase-like” horizontal convergence or divergent overfitting. Meanwhile, the boundary generalization behavior and mathematical rationality of support vector regression (SVR), which incorporates the structural risk minimization criterion, remain systematically uncalibrated and unselected regarding the long-term forward extrapolation of full-scale low-carbon components [30].
In view of this, this study systematically investigates full-scale prefabricated recycled aggregate concrete (RAC) beam components subjected to a rigorous 80-month service lifetime sequence of complex multi-field coupled damage, encompassing a 10-month initial matrix stable curing period, a 10-month laboratory accelerated drying–wetting chloride cycling under a 60% sustained flexural limit load level, and a subsequent 60-month extended period of real natural atmospheric exposure. First, by utilizing a 3D fine-meshed matrix array drilling powder extraction and potentiometric titration method alongside the ASTM G1-25 standard acid–base neutralized rust removal mass loss test, the spatial 2D continuous chloride concentration profile and the precise local pitting mass loss rate of tensile longitudinal rebars were quantitatively acquired. This successfully decoupled the collaborative deterioration transfer mechanism between the sustained bending stress field and the multiple ITZ defects of recycled aggregates along the chronological axis, characterized by “early-stage boundary stress field regulation and long-term material matrix defect dominance,” thereby elucidating the two-stage resistance decay physical pattern of the residual ultimate flexural moment with the reduction in the effective cross-sectional area of reinforcement. Subsequently, a collaborative forecasting framework based on Support Vector Regression (SVR) and Random Forest Regression (RFR) driven by the dynamic injection of multi-stage in-situ experimental inspection data was constructed for the first time. Focus was placed on employing the ensemble learning algorithm to quantitatively decouple the feature importance influencing the time-dependent degradation characteristics of the low-carbon components. The differences in mathematical rationality between SVR and RFR during long-term forward extrapolation over an ultra-long cycle of 50 years were deeply analyzed and compared. Furthermore, by introducing a critical structural safety resistance redline, the dynamic convergence and precise locking of the high-confidence interval for the remaining useful life (RUL) of the components were ultimately achieved.
2. Experimental
2.1. Materials
The natural coarse aggregate (NCA) used in this study was crushed limestone. The recycled coarse aggregate (RCA) originated from waste concrete at a construction solid waste recycling and processing plant, which was produced through sequential processes including screening, crushing, washing, and oven-drying. The particle size distribution of both coarse aggregates fell primarily within the range of 5–25 mm, and their specific particle grading curves are illustrated in Figure 1. The physical and mechanical properties of the two types of coarse aggregates, such as water absorption, crushing value, and clay content, are summarized in Table 1. The cement utilized in the experiments was Grade 42.5 ordinary Portland cement (OPC), and river sand was employed as the natural fine aggregate (NFA).
Figure 1.
Particle size distributions of two types of coarse aggregates.
Table 1.
Physical and mechanical properties of two types of coarse aggregates.
In accordance with the Specification for Mix Proportion Design of Ordinary Concrete (JGJ 55–2011), the replacement rates of recycled coarse aggregate were set at 0%, 50%, and 100%, respectively, to investigate the effect of recycled aggregate content on concrete durability. The specific mix proportions are summarized in Table 2. Since the water absorption of recycled coarse aggregate is significantly higher than that of natural coarse aggregate, the recycled coarse aggregate tends to absorb a portion of the free water from the cement paste during the concrete mixing process. This leads to a lower effective water-cement ratio and compromises the workability of the fresh concrete. Therefore, the mixing water consumption of the recycled aggregate concrete was intentionally increased.
Table 2.
Mixture proportions of concrete.
The tensile longitudinal reinforcement utilized in this study consisted of HRB335 hot-rolled ribbed steel bars with a diameter of 12 mm, with both ends bent upward by 100 mm to satisfy the anchorage requirements of the tensile longitudinal rebars under sustained loading conditions. The erection bars and stirrups were both made of HPB235 plain round steel bars with a diameter of 8 mm. The primary mechanical property indicators of the two types of steel reinforcement are summarized in Table 3.
Table 3.
Mechanical properties of employed steel reinforcements.
2.2. Component Manufacturing
To investigate the long-term service performance and time-dependent durability laws of prefabricated components, the reinforcement design of the specimens in this study was conducted in accordance with the Code for Design of Concrete Structures (GB/T 50010-2010).
A total of 12 reinforced concrete beam components with dimensions of 120 mm × 200 mm × 1400 mm was fabricated, all of which were designed to fail in a flexural mode. The experimental matrix evaluated three recycled aggregate replacement rates (0%, 50%, and 100%), with four identical beams manufactured for each concrete mixture type. For each mixture, the four beams were designated into two distinct self-anchored loading pairs (two beams per pair) corresponding to two scheduled destructive testing ages. Pair 1 was evaluated after 20 months (encompassing 10 months of stable curing followed by 10 months of accelerated chloride drying–wetting under load), and Pair 2 was evaluated after 80 months (encompassing the 20-month initial accelerated phase plus an additional 60 months of natural atmospheric exposure). Baseline physical and material mechanical properties at 0 months were determined using companion cube and prism control specimens cast from the identical concrete batches.
To accelerate the penetration process of external aggressive media (such as ) into the concrete interior and onto the reinforcement surfaces, the concrete cover thickness on the top, bottom, and sides of the components was uniformly designed to be 25 mm, as illustrated in Figure 2.
Figure 2.
Specimen dimension and reinforcements details of beams (Unit: mm).
The entire fabrication process of the components was completed in a standard indoor laboratory environment to eliminate uncontrolled external temperature and humidity fluctuations. The initial step involved mold preparation and reinforcement binding. High-stiffness wooden molds were utilized, with a thin layer of release oil uniformly brushed onto the inner surfaces. The longitudinal rebars and stirrups of the reinforcement cage were tightly bound and connected using steel wires, and standard customized concrete cubic spacers were placed at the bottom to precisely control the 25 mm bottom concrete cover thickness. Subsequently, a three-phase asynchronous concrete mixer was employed; the cement, river sand, and recycled coarse aggregates with different replacement rates were first dry-mixed uniformly for 1 min, after which the mixing water was added followed by continuous mechanical mixing for 1.5 min. The fresh concrete was poured into the wooden molds in layers and compacted through layered vibration using an immersion vibrator until reaching a uniform and dense state, and the surface was finally smoothed with a trowel. Immediately after casting, a layer of plastic film was covered to suppress early-stage water evaporation. The wooden molds were dismantled after 5 days of natural indoor curing, and the specimens were subsequently kept indoors for standard water-sprinkling curing up to an age of 28 days. After the termination of demolding and curing, all components were placed under atmospheric environmental conditions to cure until an age of 10 months, ensuring that the internal microstructure and late-stage strength of the recycled concrete matrix were fully developed to establish a stable baseline for the subsequent time-dependent analysis.
2.3. Simulation of Coupled Effect of Loading and Environment
Distinct from traditional electrochemical accelerated corrosion methods that rely heavily on applied currents, an in-situ self-anchored flexural loading and environmental accelerated degradation collaborative system was designed in this experiment. This system was developed to highly simulate the dual coupled damage mode of “sustained loading + cyclic drying–wetting chloride exposure” experienced by prefabricated bridge components under real service conditions.
The experiment adopted a pairwise symmetrical loading mechanism, utilizing high-strength anchor bolts, steel plates, padding blocks, and cylindrical steel bearings to longitudinally anchor and lock two beam components featuring the same recycled coarse aggregate replacement rate, as illustrated in Figure 3. A constant four-point bending load was applied to the components by tightening the nuts with a torque wrench, and the target loading amplitude was strictly set at 60% of the baseline ultimate flexural capacity () of each respective concrete mixture. To establish the reference ultimate flexural capacity () without prematurely destroying the long-term durability specimens, theoretical ultimate moments were computed using the measured 28-day compressive strengths of companion specimens (31.1 MPa for NAC, 27.7 MPa for RAC50, and 25.7 MPa for RAC100) and verified against unexposed control tests, yielding baseline ultimate capacities of 32.4 kN for NAC, 30.1 kN for RAC50, and 28.6 kN for RAC100. Consequently, the individual 60% target sustained loads applied to the self-anchored pairs were set to 19.4 kN for NAC, 18.1 kN for RAC50, and 17.2 kN for RAC100.
Figure 3.
Damage scheme of applying combined effects of chloride attacks and loading on the beams.
Prior to loading, repeated calibrations were conducted using pre-tension sensors in cooperation with load cells to establish a precise quantitative relationship between the bolt torque values and the vertical concentrated load values. To monitor long-term load retention and compensate for potential stress relaxation in the anchor bolts as well as concrete creep, inline donut-type load cells were permanently installed on designated monitoring pairs. Load levels were inspected weekly during the initial 10-month accelerated exposure phase and monthly during the subsequent 60-month natural exposure phase. Whenever the measured load dropped by more than 2% of the target value, a calibrated digital torque wrench was immediately used to re-tighten the nuts and restore the sustained load to its exact target value.
Under the self-anchored loading state, the components were precisely divided along their longitudinal axis () into a load-free zone ( and ), a flexural–shear zone ( and where shear force and moment increases linearly), and a pure flexural zone ( between the two loading points at and where and ). The active chloride wet-dry exposure area was symmetrically applied across the central segment. Chloride sampling points (at longitudinal intervals) and rebar cutting segments ( lengths) were strictly mapped onto this longitudinal coordinate system to directly decouple the distinct influences of pure flexure, flexural shear, and load introduction points.
To induce the natural penetration of aggressive media under atmospheric conditions, cotton cloth saturated with a 3.5 wt% NaCl solution was wrapped around the surfaces of the flexural–shear zone and the pure flexural tensile zone at the core of the components. During wrapping, full contact between the wet cotton cloth and the concrete surface was ensured, and a plastic film was tightly wrapped over the outer layer to suppress moisture evaporation. In this experiment, a complete drying–wetting cycle was defined as 14 days, in which the wet cotton cloth covering stage lasted for 7 days; subsequently, the wet cotton cloth and plastic film were removed, and electric fans were utilized to accelerate the natural air-drying of the component surfaces for 7 days. The capillary suction effect generated by drying–wetting convection was exploited to accelerate the inward transport and accumulation of external aggressive media, such as oxygen and free chloride ions, into the concrete interior.
Since free chloride ions primarily act as a catalyst in the electrochemical process of steel corrosion (meaning that the total amount of chloride ions is theoretically not consumed when the physicochemical binding of cement hydration products is neglected), a relatively high concentration of chloride ions had accumulated inside the components after undergoing 10 months of accelerated drying–wetting cycles. At this point (reaching a total exposure age of 20 months), the application of artificial chloride damage was terminated, while the pairwise loading state was kept unchanged, and the components were continuously placed in a real natural atmospheric environment for an additional 60 months of natural exposure (extending the total exposure age to 80 months) to allow the natural electrochemical corrosion and time-dependent degradation processes of the internal reinforcement to fully proceed. To clearly distinguish between environmental regimes, the chronological timeline in this study explicitly defines specimen age (total time since casting), exposure age (cumulative duration under active environmental exposure, starting at month 10), and damage age (duration under sustained loading). Over the 60-month period, the local environmental records indicated an annual mean temperature of 16.8 °C (with monthly extremes ranging from −3.5 °C to 38.2 °C), an average relative humidity of 74.5%, and an average annual rainfall of 1180 mm. The ambient atmospheric chloride deposition rate at the site was monitored at 8.2 mg/(m2·d).
Prior to formally conducting the testing of durability performance indicators, the self-anchored anchorage devices on the beam components were completely unloaded and removed, and the specimens were placed horizontally on the ground for no less than 7 days to ensure full recovery of their elastic deformation. Each beam was utilized to detect macro-durability indicators, including surface crack propagation, stratified concrete chloride content, steel corrosion degree, and ultimate flexural load-bearing capacity, thereby providing a full-scale, multi-dimensional in-situ observational dataset for the subsequent data-driven time-dependent durability prediction model.
2.4. Experimental Testing
2.4.1. Crack Testing
During the sustained loading process, the propagation of surface cracks on the beam components under the loaded state was observed and recorded. Information regarding the locations, patterns, and lengths of the cracks on the tensile faces and both side faces of the beam components was documented, and the crack widths were measured using a PTC-C10 intelligent crack gauge (with an accuracy of 0.02 mm). Generally, longitudinal corrosion-induced cracking caused by the corrosion of longitudinal rebars in beam components exhibits two distinct patterns: one is the single-faced cracking of the concrete cover induced by rust expansion stress, and the other is the multi-faced cracking of the concrete cover triggered by rust expansion stress.
2.4.2. Residual Flexural Performance Testing of Beam Components
The flexural load-bearing capacity test of the beam components in this study adopted a four-point loading configuration, where the length of the pure flexural zone in the mid-span of the beam was 400 mm, and both supports were hinged. Strain gauges were installed on the top concrete surface at the mid-span of the beam, and dial indicators were arranged at the mid-span and the support positions at the bottom of the beam, respectively.
Prior to formal loading, pre-loading was required to ensure that all measuring instruments were functioning properly. The loading protocol for the flexural capacity test of the beam components was primarily divided into two stages: in the elastic stage before the reinforcement yielded, the loading process was load-controlled at a constant rate of 2 kN/s; in the elasto-plastic stage after the reinforcement yielded, the loading process was displacement-controlled at a constant rate of 0.5 mm/s. During the flexural capacity testing, the concrete strains, deflections, and cracking patterns of the beam components under each load level were recorded and collected until the failure of the beam components.
2.4.3. Chloride Content Testing
Upon completion of the residual flexural performance testing at each designated testing age (20 months and 80 months), a concrete powder extraction method via drilling was employed to collect powder samples from the interior of the specimens, aiming to quantitatively acquire the spatiotemporal penetration profile of chloride ions within the recycled concrete. To avoid structural damage that could compromise subsequent environmental exposure, drilling was performed exclusively on destructively tested beams at their respective end-of-exposure ages (Pair 1 beams at 20 months and Pair 2 beams at 80 months); no beam was subjected to repeated drilling across multiple exposure ages.
The sampling points were uniformly arranged in a matrix distribution along both the height and length directions of the beam components, with intervals of 50 mm along the height and 100 mm along the length. To eliminate localized concentration anomalies induced by local convection at cracks, the sampling points were strictly arranged to avoid the locations of macro-flexural transverse cracks, as illustrated in Figure 4. To strictly prevent atmospheric -induced carbonation of the samples from altering the chloride binding equilibrium, the collected powders were immediately vacuum-sealed for preservation. Subsequently, each group of powder samples was finely ground and sieved to extract particles with a size of less than 75 μm, which were then placed in an oven and dried to a constant weight (with a weight variation in less than 1% within 24 h) and sealed for subsequent use. At each grid coordinate, three replicate powder samples were extracted across the two companion beams of the same loading pair to ensure statistical reliability.
Figure 4.
Coordinate system of drilling.
During the measurement stage, exactly of the constant-weight concrete powder was accurately weighed and placed into a standard sample bottle, followed by the injection of of deionized water. After thorough shaking, the sample bottle containing the concrete powder suspension was placed in a constant-temperature shaker for intermittent extraction until the water-soluble chloride ions in the suspension were completely released (defined as a content variation in less than 1% within 24 h). In this experiment, a portable rapid chloride ion tester (DY-2501B) was employed to determine the mass fraction of water-soluble chloride ions in the filtered suspension. Prior to formal testing, to ensure the response robustness of the electrochemical probe, the tester was subjected to a three-point linear calibration using standard calibration solutions with mass fractions of 0.005%, 0.05%, and 0.5%, respectively. The subsequent formal potentiometric titration of unknown samples was initiated only after the measured probe sensitivity converged within the range of 90–110% (i.e., the measurement accuracy of the instrument reached within of the reading). If the probe sensitivity failed to meet this standard, physical treatments including polishing the electrode probe surface sequentially with fine sandpaper and soaking it in a dedicated cleaning solution for 1 h were required, or the entire set of calibration solutions had to be replaced with fresh ones. Furthermore, during the intervals between changing test samples, the probe of the chloride tester was thoroughly rinsed with deionized cleaning solution and gently wiped dry with a lint-free cotton cloth to eliminate testing residuals caused by multi-sample cross-contamination, thereby ensuring high-fidelity spatial chloride distribution data for input into the subsequent data-driven predictive models.
2.4.4. Steel Reinforcement Corrosion Measurement
Upon completion of the macro-mechanical and material destructive testing of the components, a mass loss method was employed to determine the localized corrosion degree of the reinforcement, aiming to precisely quantify the real physical damage state of the internal load-bearing steel bars under the coupled effects of sustained loading and a chloride environment. The removal of corrosion products from the steel surfaces was conducted in strict accordance with the chemical cleaning protocols recommended in the American Standard Practice for Preparing, Cleaning, and Evaluating Corrosion Test Specimens (ASTM G1-25).
First, a dedicated steel rust removal solution was prepared by completely dissolving of antimony trioxide () and of antimony trichloride () into of concentrated hydrochloric acid () solution with a specific gravity of 1.19. At a constant room temperature, the corroded steel bar samples stripped from the recycled concrete matrix were fully immersed in the rust removal solution and allowed to stand for cleaning for 15 min; during this process, a dedicated wire brush was utilized for auxiliary mechanical brushing to remove localized insoluble, dense rust layers. Subsequently, the steel samples were immediately transferred into a saturated calcium hydroxide () solution for immersion washing to completely eliminate residual acid on the steel surfaces through an acid–base neutralization reaction, thereby terminating secondary acid corrosion. Finally, anhydrous ethanol () was used to rinse the steel surfaces to remove residual stains and excess moisture, and the samples were then placed in a vacuum drying oven to dry to a constant weight.
Based on the variations in mass and geometric dimensions before and after cleaning, the localized corrosion degree of the reinforcement was characterized by the mass loss per unit length. The localized corrosion rate of the steel bars determined by the mass loss method was quantitatively calculated via Equation (1):
where represents the localized corrosion rate of the steel reinforcement (%); and denote the residual mass (g) and residual length (mm) of the corroded steel bar sample after cleaning, respectively; is the standard linear density of the uncorroded steel bar in its initial state (g/mm), which corresponds to in the original formulation. The initial linear densities of the HPB235 and HRB335 grade steel bars utilized in this experiment under the uncorroded baseline state were precisely taken as 0.380 g/mm and 0.758 g/mm, respectively. The measurement uncertainty of was determined to be within . This rigorous multi-variable corrosion quantification aligns with integrated assessment methodologies for corroded RC structures [31].
3. Results
3.1. Surface Crack Propagation of Components
The collaborative effects of long-term sustained flexural loading and environmental aggressive media lead to the generation of irreversible macro-cracks on the surfaces of prefabricated beam components, which serves as an external manifestation of structural stiffness degradation. Table 4 summarizes the statistical observation results of surface transverse cracks on the beam components with three different recycled coarse aggregate replacement rates after being subjected to multi-field coupled damage.
Table 4.
Transverse cracks of beams after long-term combined damages.
As indicated in Table 4, the introduction of recycled coarse aggregates exerts a significant influence on the flexural cracking patterns of the specimens, demonstrating a distinct dosage effect that depends heavily on the replacement rate. As the recycled aggregate replacement rate increases monotonically from 0% (NAC) to 50% (RAC50) and 100% (RAC100), the total number of transverse main cracks propagating on the component surfaces shows a continuous upward trend (increasing from 6 to 10). Concurrently, the average spacing between adjacent transverse cracks undergoes a substantial reduction, decreasing from 115 mm for NAC to 97 mm for RAC100, representing a maximum reduction of 15.7%.
However, it is noteworthy that the increase in cracking density does not lead to the exacerbation of crack widths. Conversely, both the average width (0.59 mm) and maximum width (2.04 mm) of the surface transverse cracks in the conventional concrete beam component (NAC) are significantly larger than those of the two groups of recycled concrete components (where the average width of RAC100 is merely 0.30 mm). This observed crack pattern is hypothesized to be associated with fracture energy release mechanisms in concrete damage mechanics. This anomalous phenomenon is highly consistent with the fracture energy release theory in concrete damage mechanics. Fundamentally, concrete cracking is a physical process in which the structure releases the internal elastic energy accumulated from external loading inputs, and characteristic indicators such as the number of main cracks, spatial distribution of fractures, and crack widths in the tensile zone serve as the specific macroscopic carriers for the dissipation of internal deformation energy. Under a constant bending moment, owing to the relatively homogeneous initial internal matrix and fewer fracture energy release sites, the accumulated strain energy within the NAC component tends to undergo concentrated, explosive dissipation at a very limited number of main cracks, which is consequently accompanied by the severe expansion of individual crack widths. In sharp contrast, the RAC components (RAC50 and RAC100) experience an energy-dispersive dissipation effect due to the presence of internal weak interfaces. They distribute and absorb the external input energy through the dense initiation of high-frequency, multiple microcracks, thereby effectively suppressing the propagation of individual cracks into wide fissures. It should be noted that this fracture-energy-based interpretation is proposed as a physical hypothesis to explain the observed macroscopic cracking morphology; dedicated experimental verification using techniques such as digital image correlation (DIC), acoustic emission (AE) monitoring, or direct tension-softening tests will be conducted in future work.
3.2. Spatial Distribution of Chloride Ions
The accumulation level and spatial distribution pattern of free chloride ions inside concrete directly determine the locations and rates of steel reinforcement corrosion. Figure 5 illustrates the distributions of free chloride ion content inside the components with different recycled coarse aggregate replacement rates after being subjected to the coupled damage of sustained bending loads and a chloride environment.
Figure 5.
Distribution of chloride content in concrete along the (a) NAC, (b) RAC50, and (c) RAC100 beams. (Error bars represent the standard deviation calculated across replicate sampling extractions per grid coordinate.).
As can be observed from the spatial evolution trends, the incorporation of recycled coarse aggregates exerts a distinct accelerating effect on the transport of chloride ions within the matrix. With the increase in the recycled coarse aggregate replacement rate, both the maximum and average values of free chloride ion content inside the components exhibit a monotonic upward trend. The fundamental reason for this dosage effect lies in the unique multiple complex interfacial transition zones (ITZs) and high porosity characteristics inherent to recycled concrete, which render its overall mechanical barrier weaker than that of conventional concrete. Under the same bending moment, the high-replacement recycled concrete (RAC100) develops a greater number of transverse cracks on its surface. These array-distributed crack networks not only significantly increase the macro-contact area between the component and the external chemical media, but also accelerate the inward and deep-seated penetration of free chloride ions from the external environment into the concrete.
Furthermore, regardless of the variations in the recycled aggregate replacement rate, the maximum and average values of chloride ion content in the surface-layer concrete of each group of beam components (i.e., at depths of 25 mm and 175 mm) are significantly higher than those in the deep core-zone concrete (i.e., at depths of 75 mm and 125 mm). The surface-layer concrete is directly influenced by the environmental suction action of the drying–wetting cyclic spectra, leading to the rapid accumulation of chloride ions at the surface layer and the formation of an extremely high concentration gradient. Conversely, since the deep concrete is far removed from the exposure boundaries, it primarily relies on slow, concentration-gradient-driven diffusion, whereby the advancement of the penetration front exhibits a distinct lag effect.
Simultaneously, the chloride concentration distribution confirms the non-uniform regulation mechanism of the sustained bending stress field on the transport performance of the media. The data indicate that the chloride ion content inside the concrete in the tensile zone is significantly higher than that in the compressive zone. Under long-term sustained tensile stress, the internal micro-pore structure of the matrix undergoes tensile tearing, causing originally isolated micro-pores to gradually interconnect, which is accompanied by the initiation of numerous microcracks and the propagation of macro-transverse main cracks; this provides a more convenient transport channel for the inward penetration of chloride ions. In contrast, under the compaction effect of sustained compressive stress, some of the originally connected pores and initial microcracks inside the concrete in the compressive zone are compressed or even closed, leading to an increase in the tortuosity of the matrix. This drastically reduces the apparent chloride diffusion coefficient of the concrete in the compressive zone, significantly increasing the resistance to the ingress of external aggressive media.
3.3. Reinforcement Corrosion Degree
The corroded cross-sectional reduction in internal load-bearing reinforcement is directly related to the resistance degradation of prefabricated components. Figure 6 illustrates the spatial distribution laws of the corrosion degree of longitudinal reinforcement (including tensile longitudinal rebars and erection bars) in beam components with three different recycled coarse aggregate replacement rates after being subjected to the coupled damage of bending loads and a chloride environment.
Figure 6.
Corrosion degree distribution of longitudinal reinforcements along the (a) NAC, (b) RAC50, and (c) RAC100 beam.
The results indicate that the introduction of recycled coarse aggregates significantly accelerates the electrochemical corrosion process of longitudinal reinforcement, demonstrating a distinct dependence on the replacement rate. Specifically, the average corrosion rates of the tensile longitudinal rebars and erection bars in the NAC beam component () are 2.62% and 1.91%, respectively; these two values increase to 3.44% and 1.92% for the RAC50 beam component (); and further deteriorate to 3.96% and 2.17% for the RAC100 beam component ().
On the one hand, owing to the porous old mortar adhered to the surfaces of recycled coarse aggregates, a high replacement rate introduces more numerous and complex interfacial transition zones (ITZs) as well as micro-pore defects inside the concrete, rendering external more liable to penetrate into the deeper layers, thereby prematurely depassivating the steel surface and triggering electrochemical activities. On the other hand, under sustained external loading, a greater number of load-induced cracks develop on the surfaces of recycled concrete components, accelerating the inward transport of , , and . Consequently, a prominent macro-cell corrosion effect is formed in the vicinity of the cracks, where the directly exposed steel surface at the crack location undergoes severe dissolution as an electrochemical anode, drastically increasing the localized corrosion rate of the reinforcement near the cracks. Once the reinforcement corrodes, the volumetric expansion of multiple corrosion products further exerts pressure on the surrounding concrete, inducing circumferential tensile stresses that drive the initiation and propagation of longitudinal corrosion-induced cracks along the rebars, thereby establishing a vicious circle of “crack-accelerated ingress and rust-expansion-exacerbated cracking.”
Similarly, regardless of the variations in the recycled coarse aggregate replacement rate, the corrosion degree of longitudinal reinforcement generally peaks near the loading points of the beam components ( and ). This localization occurs precisely at the boundary interfaces where the constant maximum bending moment () transitions into the active shear span (), compounded by localized transverse bearing stresses introduced beneath the steel padding blocks. The superposition of multiaxial stress concentration and severe flexural–shear cracking at these transitional coordinates accelerates local chloride ingress and electrolyte transport, resulting in pronounced corrosion peaks at and relative to the interior pure bending segment ().
This is primarily because the vicinity of the loading points falls within a co-high zone of bending moments and shear stresses, where the concrete matrix degradation and micro-fracture development induced by principal tensile stresses are most severe, providing a more convenient fast-track channel for the penetration of external aggressive media, and ultimately resulting in the most intense cross-sectional reduction in reinforcement in this specific zone. Correspondingly, due to the multi-transport path effect introduced by the recycled aggregates, the localized maximum corrosion rate of longitudinal reinforcement around the loading points also increases significantly with the elevation of the replacement rate.
Furthermore, the influence of transverse crack width on the corrosion degree of longitudinal reinforcement gradually diminishes with the extension of the damage age. Under a long-term service environment rich in chlorides, the surface area of longitudinal reinforcement located within the cracked zones of the beam components is, in fact, far smaller than the total surface area of longitudinal reinforcement situated within the uncracked zones. In other words, with the significant forward extrapolation of service time, the barrier performance (i.e., matrix permeability) of the uncracked concrete itself plays a more fundamental and dominant role in the long-term overall resistance degradation, whereas the material compactness in the uncracked zones is highly correlated with the recycled coarse aggregate replacement rate.
To deeply reveal the evolutionary mechanism from material-level micro-damage to component-level macro-deterioration, a multivariate quantitative correlation analysis was performed by linking the reinforcement corrosion degree with the surface longitudinal corrosion-induced crack width and the internal concrete chloride content, respectively. Figure 7 shows the correlation between the reinforcement corrosion degree () and the surface longitudinal corrosion-induced crack width (). It should be noted that data points extracted along the same reinforcement bar and within identical beam pairs share common concrete batch, mechanical stress, and exposure histories, exhibiting inherent spatial correlation. The fitted regression curves are provided herein to illustrate empirical macroscopic trends for engineering reference, where the corresponding uncertainty bands should be interpreted considering within-beam clustering effects.
Figure 7.
Relationship between corrosion degree of longitudinal reinforcement and the crack width.
The fitting results indicate that regardless of the variations in the recycled coarse aggregate replacement rate, a strong positive correlation is consistently exhibited between the two parameters, with the linear fitting coefficients of each group exceeding 0.85. This strong linear mapping relationship unveils the classical mechanical mechanism of reinforcement corrosion-induced cracking: as the localized corrosion degree of the reinforcement intensifies, the iron matrix transforms into low-density, large-volume corrosion products, the volumetric expansion of which exerts continuously increasing internal pressure and circumferential tensile stresses on the surrounding concrete matrix, thereby driving the concrete cover to undergo through-thickness splitting from the inside out.
However, the incorporation of recycled coarse aggregates significantly alters this strain response rate. With the increase in the recycled aggregate replacement rate, the slope of the linear fitting curves exhibits a monotonic upward trend. The increase in the fitting slope indicates that under the same reinforcement corrosion degree (i.e., theoretically identical generation of corrosion products and equivalent initial internal pressure and circumferential tensile stresses), the width of the longitudinal corrosion-induced cracks on the surfaces of recycled concrete components is significantly larger, and the crack damage degree is more severe. This strongly confirms the macroscopic degradation of the cracking resistance of the recycled concrete matrix. Due to the inherent high porosity of the recycled aggregates and the low fracture energy characteristics of the multiple ITZs, the tensile stiffness and toughness confining the rust expansion deformation are substantially weakened. Consequently, the internal circumferential stresses are highly susceptible to brittle instability and propagation at the weak regions of the matrix, which is macroscopically manifested as the accelerated expansion of crack widths.
Furthermore, reinforcement corrosion is also closely related to the local micro-physical space and chemical environment (such as pore solution ion concentration, pH value, temperature, humidity, and oxygen content). By approximating the concrete chloride content at the deeper layers of 25 mm and 175 mm as the localized aggressive boundary conditions on the surfaces of the erection bars and tensile longitudinal rebars, respectively (since both have a concrete cover thickness of 25 mm), Figure 8 establishes a statistical response network between the reinforcement corrosion degree and the concrete chloride content (). It can be observed that a significant positive correlation likewise exists between the two parameters. Similarly, the empirical fitting lines reflect the overall degradation trajectory across different replacement levels, while the dispersion is subject to shared-specimen boundary conditions.
Figure 8.
Relationship between corrosion degree of longitudinal reinforcement and the chloride content.
The corrosion degree of longitudinal reinforcement inside recycled concrete exhibits a higher degradation sensitivity to the concrete chloride content. That is, under the identical local chloride concentration background, the electrochemical corrosion rate and cross-sectional erosion degree of the steel bars inside the recycled concrete with a high replacement rate are significantly more severe. The micro-damage mechanism of this phenomenon lies in the poor physical performance of the interlocking interface between the recycled aggregate concrete and the steel reinforcement, which is highly susceptible to the early-stage generation of interfacial degradation defects such as microcracks and micro-pores. These micro-scale channels not only compromise the continuity of the reinforcement matrix, but also readily form local micro-zones that enrich free chloride ions and moisture, thereby drastically lowering the critical chloride threshold required for the active depassivation of the passive film, and significantly accelerating the electrochemical reaction process of anodic activation and dissolution on the longitudinal rebar surfaces.
3.4. Relationship Between Residual Flexural Capacity and Corrosion Degree of Tensile Longitudinal Reinforcement
According to the classical research findings by Zhu and François, the residual flexural load-bearing capacity of beam components is primarily governed by the maximum localized corrosion degree (critical cross-sectional reduction) of the internal tensile longitudinal reinforcement, rather than the average corrosion level across the entire length of the reinforcement [32]. To this end, this study conducts an in-depth analysis of the correlation between the residual yield moment, ultimate moment of the beam components, and the maximum localized corrosion degree of the tensile longitudinal reinforcement. The experimental results are illustrated in Figure 9.
Figure 9.
Relationship between residual flexural bearing capacity and maximum corrosion degree of longitudinal reinforcement: (a) yield moment and (b) ultimate moment.
The overall evolution trend indicates that with the continuous extension of the damage age, the maximum localized corrosion degree of the tensile longitudinal reinforcement inside the beam components increases significantly due to the accumulation of chloride ions in the bending stress crack zones. However, the relationship between the macroscopic residual flexural performance and the maximum localized corrosion degree does not present a simple linear decreasing pattern; instead, it exhibits a distinct two-stage degradation characteristic characterized by a sharp critical threshold.
When the maximum localized corrosion degree of the tensile longitudinal reinforcement is below 10%, the yield moment and ultimate moment of the components do not decrease, but rather exhibit a slight upward trend alongside the increase in the maximum localized corrosion degree. This phenomenon is tentatively hypothesized to relate to the slight volumetric expansion of early-stage corrosion products filling interfacial micro-voids; however, it must be emphasized that this remains a hypothetical interpretation. Alternative mechanisms—such as continued cement hydration (concrete aging over the curing and early exposure periods), inherent specimen-to-specimen scatter, and test tolerances—could plausibly account for these minor variations in the absence of direct bond-slip or interfacial push-out measurements. In the early stage of passive film depassivation, a small amount of the iron matrix transforms into minor corrosion products, the limited volume expansion of which does not trigger cracking of the concrete cover. Conversely, it exerts pressure on the surrounding matrix, generating a localized compaction effect at the steel-concrete interface. This leads to a phased enhancement in their bond-slip performance, which is macroscopically manifested as short-term, small-amplitude fluctuations or even marginal increases in the yield and ultimate moments.
Once the maximum localized corrosion degree of the tensile longitudinal reinforcement exceeds the critical threshold of 10%, both the residual yield moment and ultimate moment of the components shift toward a severe, accelerated degradation trend. At this juncture, with the rapid surge in the localized mass loss rate, the effective cross-sectional area of the steel bars suffers a substantial reduction, and their mechanical behavior shifts from ductile to brittle. Concurrently, the propagation of longitudinal corrosion-induced cracks leads to the total collapse of the bond transfer mechanism between the steel reinforcement and the concrete, preventing effective collaborative load-bearing capacity, and ultimately inducing a significant decay in the flexural resistance of the components.
It should be noted that rather than representing a mathematically optimized change-point, the approximate 10% corrosion level serves as an empirical transition demarcating the moderate-term (20-month) and long-term (80-month) test groups across the investigated mixtures. Below this level, capacity reduction remains relatively moderate (within 10–15%), whereas beyond this level, accelerated loss occurs due to the combined effects of cross-sectional steel loss, bond deterioration, and concrete matrix degradation. It should be noted that corrosion loss is intrinsically coupled with exposure duration and aggregate replacement ratio, and rigorous identification of physical damage thresholds warrants systematic parameter sensitivity and constraint optimization methodologies [33].
The influence of the recycled coarse aggregate replacement rate on the flexural performance of prefabricated components exhibits prominent time-dependent effect. When conducting durability service life design and safety assessment predictions for green and low-carbon recycled concrete structures, one must never perform simple linear extrapolations based solely on early-stage or short-term accelerated experimental results. Instead, a long-term time-dependent resistance degradation operator that explicitly accounts for the specificity of the material replacement rate must be introduced. The dynamic response evolution envelope of the residual load-bearing capacity decoupled in this section will serve directly as the core physical performance constraint to calibrate and drive the data-driven dynamic durability state prediction model based on in-situ monitoring in the subsequent chapter.
4. Data-Driven Durability Prediction
4.1. Data-Driven Prediction Framework and Feature Vector Design
Owing to the unique multiple complex interfacial transition zones (ITZs) and randomly distributed initial microcracks inherent to recycled aggregate concrete (RAC), its material-level transport properties and mechanical degradation behaviors exhibit prominent anisotropy and high dispersion characteristics. Traditional deterministic mechanistic models rely heavily on idealized laboratory accelerated boundaries, making it difficult to accurately characterize the specific time-dependent degradation trajectory of prefabricated bridge barrier/beam components under the multi-field coupled actions of “bending load–chloride–drying–wetting cycles” in real service conditions.
To address this, this study constructs a two-layer dynamic forecasting architecture combining in-situ multi-source inspection data injection with a machine learning surrogate model. First, the heterogeneous features of the component over its standardized full-service life are transformed into structured data streams in a high-dimensional space. Subsequently, the data-driven engine is utilized to invert and calibrate the non-linear mapping network formed by the interaction between the material and the environment, thereby achieving an “outside-in” dynamic extrapolation and prediction from surface-level explicit damage to deep-seated essential resistance degradation.
To precisely map the engineering environment and the physical-mechanical states of the materials into the algorithmic space, this study tailors a 5-dimensional core input feature vector :
where is the inherent material property feature, taken as the mass replacement rate of the recycled coarse aggregate (0%, 50%, 100%), which is used to quantitatively calibrate the defect density of the initial microstructure of the matrix; is the stress state sensitivity factor, assigned categorical codes of 1 for the tensile zone, 0 for the load-free/shear transition zone, and −1 for the compressive zone, which qualitatively accounts for asymmetric transport behaviors (“tensile opening versus compressive closing”). It is acknowledged that operates as a macroscopic zone identifier rather than a continuous physical stress tensor; localized variations in bending moment and shear force are spatially mapped through the paired longitudinal and vertical coordinates () along the determinate structural profile; is the time-dimensional feature, defined specifically as the cumulative exposure age (months) experienced by the components to account for the dynamic transition from the initial accelerated chemical boundary phase (months 0–10 of exposure) to the subsequent natural atmospheric exposure phase (months 10–70 of exposure); and are the coordinates of the spatial measuring points, representing the absolute distances of the measuring point from the left end face and the top face of the beam component, respectively, which endows the model with 2D continuous predictive capability across the spatial cross-section of the component.
To avoid mathematical ambiguity and target cross-contamination in vector regression, three independent scalar Support Vector Regression (SVR) models (, , and ) are trained separately to predict the multi-dimensional degradation responses:
where is the spatial free chloride ion concentration, is the localized corrosion degree of the longitudinal reinforcement at coordinate , and is the corresponding surface crack width measured along the reinforcement trajectory.
To transform the localized maximum corrosion prediction into macroscopic load-carrying capacity, an analytical cross-sectional mechanics model is sequentially coupled at the downstream stage. Based on the maximum predicted local corrosion degree , the residual effective rebar area and degraded yield strength are computed:
The residual ultimate bending moment is then determined via cross-sectional force equilibrium:
where , , and represent the beam width, effective depth, and concrete compressive strength, respectively, and is the empirical strength deterioration coefficient calibrated from tensile tests on corroded bars.
To ensure statistical transparency and rigor, Table 5 outlines the quantitative hierarchical sample distribution of the experimental dataset across all input features, targets, exposure stages, and physical specimens. It is explicitly clarified that the effective structural sample size is governed by the 12 physically independent beam components across the scheduled exposure batches, while the multiple spatial points ( per response metric) represent localized field distributions within these members. To strictly prevent information leakage between correlated spatial points originating from the same beam, model training and cross-validation strictly employed a Group-K-Fold partitioning strategy based on beam specimen identities, ensuring that spatial data from any given beam were exclusively assigned to either the training or the validation partition.
Table 5.
Hierarchical breakdown and sample size distribution of the machine-learning dataset.
To preserve authentic material damage characteristics and localized physical dispersion, discrete destructive and semi-destructive measurements—including chloride concentration profiles, localized rebar mass loss, and surface crack widths—were maintained in their raw experimental values without artificial frequency filtering. Wavelet denoising (utilizing a Symlets wavelet basis with 3-level soft-thresholding decomposition) was restricted exclusively to auxiliary continuous high-frequency environmental sensor time-series. Furthermore, to strictly prevent data leakage across validation boundaries, all feature scaling via min-max normalization was fitted solely on the training fold of each Group-K-Fold split, with the learned parameters () subsequently applied to transform the corresponding validation split into the standard [0, 1] range. This ensures that baseline feature scales and numerical stability are maintained without pre-exposing target degradation trends to the learning engine.
4.2. SVR and RFR Prediction Model Construction and Hyperparameter Optimization
4.2.1. Construction of Support Vector Regression (SVR) Mechanism
Based on the structural risk minimization (SRM) criterion, Support Vector Regression (SVR) maps non-linear multi-field coupled degradation samples from a low-dimensional space into a high-dimensional feature space by introducing a resilient kernel function, thereby transforming complex non-linear transport into a high-dimensional linear regression problem. Aiming at the highly non-linear characteristics of the internal spatial diffusion of aggressive media and the time-dependent decay of resistance within recycled concrete, this study employs the support vector regression (-SVR) operator for modeling. Assuming the training dataset is , the objective of SVR is to construct an optimal hyperplane , which ensures the smoothness of the control function while keeping the error from all sample points to the hyperplane no greater than . By introducing slack variables and , the Lagrangian dual optimization objective function and its corresponding constraints are formulated as:
where and are the Lagrange multipliers; is the penalty factor used to balance the trade-off weight between the empirical risk and the model generalization margin. To accurately capture the localized abrupt response on the spatiotemporal cross-section, the Gaussian radial basis function (RBF) is selected as the high-dimensional mapping kernel function :
where is the kernel function width parameter, which determines the boundary distribution topology in the high-dimensional space. After solving the dual optimization problem, the final SVR continuous predictive network for spatial chloride accumulation or resistance degradation is obtained as follows:
By maximizing the geometric margin, the SVR algorithm effectively circumvents the excessive reliance of traditional empirical models on boundary conditions, demonstrating exceptional generalization robustness in long-term forward extrapolation based on small sample sizes.
4.2.2. Construction of Random Forest Regression (RFR) Mechanism
Unlike SVR, which focuses on boundary-optimized hyperplanes, Random Forest Regression (RFR) is based on an ensemble learning framework, constructing multiple independently evolving regression decision trees (Classification and Regression Trees, CART) via the Bagging algorithm. Aiming at the highly discrete sample streams caused by the high porosity of recycled coarse aggregates, the RFR algorithm demonstrates robust non-linear fault tolerance and matrix anti-noise performance. Its core construction procedure is outlined as follows: First, bootstrap sampling is employed to perform random extractions with replacement from the original service damage dataset, thereby constructing independent training subsets. Subsequently, during the node splitting process of each decision tree, instead of utilizing the full feature space, a subset containing features is randomly selected for splitting (typically taken as ), and the optimal node split is executed in accordance with the principle of Mean Squared Error (MSE) minimization.
For a specific spatiotemporal mechanical feature vector input , the final predicted durability degradation index of the entire ensemble network is obtained via the arithmetic mean of the output values from all individual regression trees:
where is the independent predictive output of the -th regression decision tree under the randomly allocated vector ; represents the total capacity of decision trees in the forest. By virtue of the dual random sampling mechanism (sample randomness and feature randomness), the RFR algorithm achieves decoupling among the decision trees, drastically reducing the over-fitting risk of a single model to the highly discrete characteristics of recycled coarse aggregates.
4.2.3. Model Hyperparameter Optimization and Cross-Validation
To eliminate potential data leakage caused by intra-specimen spatial correlation and to ensure strict predictive generalization across unseen components, a hierarchical validation framework was established:
- Specimen-Grouped Cross-Validation: Rather than naive random splitting, hyperparameter optimization for both the SVR and RFR models strictly implemented a Leave-One-Beam-Group-Out (specimen-grouped) cross-validation protocol. Under this scheme, all spatial measurement points ( grid locations along the span and across depths) originating from the same physical beam were clustered and assigned together exclusively to either the training or the validation fold. This prevents the learning algorithms from interpolating between neighboring spatial points on the same physical member during tuning.
- Blind Test Holdout: Two complete, physically independent 80-month exposure beam specimens ( spatial points across all response variables) were quarantined entirely from the cross-validation and hyperparameter selection pipelines, serving as an untouched blind test benchmark to rigorously evaluate forward spatiotemporal extrapolation. This strict separation between model development and final predictive validation adheres to established data-driven evaluation methodologies for concrete durability and strength prediction [34].
Table 6 outlines the complete hyperparameter search space, search resolutions, scoring metrics, and optimal parameter configurations determined for the SVR and RFR models.
Table 6.
Hyperparameter search space, grid settings, and optimal values for surrogate models.
All numerical models were developed using Python 3.12 with the scikit-learn and NumPy libraries on an 8-core Apple M-series workstation. A fixed master random seed (seed = 42) was assigned to ensure computational reproducibility.
To evaluate uncertainty and avoid single-split bias, the optimization routine was executed over 10 repeated Leave-One-Beam-Group-Out splits. Table 7 reports the resulting statistical distributions (mean standard deviation) across the repeated validation folds for the target responses (, , ).
Table 7.
Cross-validation performance distributions across 10 repeated grouped splits.
The systematic documentation of the interaction between parameter optimization grids and hyperparameter stability follows the methodological principles established for machine learning in structural component capacity predictions.
4.3. Feature Importance Analysis of Durability Influencing Factors Based on RFR
4.3.1. Principle of Feature Importance Calculation
In addition to possessing robust non-linear fitting and generalization performance, Random Forest Regression (RFR) can quantitatively extract the feature importance of each input feature with respect to the target response variables. To profoundly reveal the degradation driving mechanism of recycled concrete components under multi-field coupled damage, this study employs a permutation-importance-based method for calculation.
The core mathematical logic lies in the following procedure: after the training of the random forest is completed, while keeping other input feature matrices unchanged, the sequential observation data of a specific feature (such as the recycled coarse aggregate replacement rate ) are artificially and randomly shuffled. These shuffled data are then re-inputted into the trained regression trees to calculate the mean squared error of the out-of-bag data at this juncture, denoted as . The absolute importance of this feature can be quantitatively characterized by the error increment before and after the shuffling:
Finally, the absolute importance of each feature is normalized to obtain its relative contribution rate (%). This method does not rely on linear correlation assumptions, thereby accurately reflecting the dominant contribution degree of each physical quantity to the time-dependent degradation of durability within a high-dimensional non-linear space.
4.3.2. Quantitative Decoupling of Dominant Factors Influencing Long-Term Durability Degradation of Components
Utilizing the aforementioned RFR feature importance analysis mechanism, this study extracted the time-dependent contribution rates of each input feature (, , , , ) to the target deterioration metrics. To preserve mathematical rigor and ensure that the dynamic variance of the exposure time feature () is systematically captured, the global permutation importance ranking was evaluated across the complete multi-temporal dataset spanning the full exposure life-cycle () using 100 shuffle iterations with baseline RMSE deterioration as the scoring metric. Furthermore, dynamic sensitivity comparisons were decoupled between the early service stage () and the full extended service life-cycle (), as illustrated in Figure 10.
Figure 10.
Feature importance contribution ranking of input variables evaluated over the dynamic service life-cycle.
During the early service stage (, encompassing initial chloride penetration and active depassivation), boundary transport conditions, spatial positions, and environmental stress states exert dominant control over deterioration. The longitudinal spatial coordinate and the bending stress state sensitivity factor account for 35.6% and 26.8% of the predictive sensitivity, respectively, while the measuring point depth contributes 9.3%. This confirms that early chloride ingress is primarily governed by convective-diffusive boundary gradients and geometric stress concentration, where the asymmetric stress field (“tensile opening versus compressive closing”) under sustained service loads decisively regulates localized microcrack initiation and pore connectivity. At this stage, the material replacement rate exhibits a minor contribution (11.4%), and cumulative exposure duration contributes 17.0%, indicating that before extensive microcrack networks coalesce, the intrinsic ITZ defects of recycled aggregates have not fully dominated macroscopic transport.
When evaluated over the full extended 80-month life-cycle, the feature importance matrix undergoes substantial reconstruction. The relative contribution of the aggregate replacement rate surges sharply from 11.4% to 36.8%, leaping to become the most dominant governing feature among all physical inputs. Concurrently, the contributions of the longitudinal coordinate , the stress state factor , cumulative exposure time , and depth coordinate shift to 22.4%, 22.1%, 11.4%, and 7.2%, respectively.
It should be explicitly clarified that in this feature importance ranking reflects the global composite effect of the recycled concrete mix design (encompassing aggregate replacement ratio, associated mix water adjustments, initial matrix porosity, and baseline compressive strength) rather than an isolated, purely causal effect of aggregate substitution alone. Similar multi-variable coupling and time-dependent property evolution frameworks have been established in machine-learning-based concrete performance evaluations [35].
This phenomenon, from a data-driven deep perspective, quantitatively confirms that recycled coarse aggregates exert an irreversible, cumulative dominant effect on the long-term time-dependent degradation of the structure. Its intrinsic micro-evolutionary mechanism lies in the fact that with the long-term extension of service time, the unique multiple complex weak interfacial transition zones (ITZs) and the high porosity characteristics of the old adhered mortar inside the high-replacement recycled concrete (RAC100) undergo diffuse damage accumulation under long-term stress corrosion. This induces a much denser and heterogeneous crack network compared to conventional concrete (NAC). Under a long-term scale, this macroscopic spatial high permeability derived from micro-scale material defects completely transcends the early control of pure diffusion boundaries, ultimately placing the internal longitudinal reinforcement in an extremely severe and highly scattered local macro-cell electrochemical corrosion environment.
4.4. Time-Dependent State Forward Extrapolation and Remaining Useful Life (RUL) Assessment
4.4.1. Comparative Analysis of Full-Life-Cycle Extrapolation Performance Between SVR and RFR
To validate the reliability of the trained machine learning surrogate models in predicting long-term time-dependent degradation, a comparative benchmark analysis was conducted between the Support Vector Regression (SVR) and Random Forest Regression (RFR) algorithms. The two physical beam components evaluated at the 80-month threshold ( localized coordinate records per output response across the span) were quarantined strictly as a blind holdout test set.
Table 8 summarizes the detailed performance breakdown of the surrogate models across both the grouped training/validation partitions and the blind holdout test set, itemized by concrete mixtures, exposure durations, and stress zones.
Table 8.
Performance evaluation and error distributions of SVR and RFR models across structural sub-groups and blind test sets.
The comparative results demonstrate that within the training sample domain, the RFR algorithm achieves slightly higher goodness-of-fit on local training points due to the high flexibility of decision tree recursive splitting over discrete recycled aggregate data. However, on the blind 80-month holdout test set, SVR exhibits superior stability and lower generalization error across all sub-groups, yielding test determination coefficients of for free chloride content and for localized rebar corrosion degree.
The observed residual scatter aligns with measured physical dispersion across different replacement ratios and stress zones, confirming that the SVR structural risk minimization principle mitigates overfitting to localized specimen variations during long-term forward extrapolation. Complete partitioned datasets and cross-validation split indices are archived to ensure full reproducibility.
4.4.2. Material-Specific Time-Dependent Deduction of Residual Flexural Capacity of Components
Based on the optimal SVR predictive network, continuous time-series features for the next 50 years were inputted. To ensure that long-term extrapolation strictly satisfies fundamental transport and structural mechanics principles, an explicit physics-informed constraint operator was coupled with the data-driven predictions:
where strictly enforces non-negativity (), non-decreasing temporal deterioration ( under continuous exposure), and upper/lower capacity boundaries () governed by cross-sectional equilibrium. Specifically, the transformation from predicted localized corrosion to residual moment follows the explicit section-equilibrium formulations, utilizing baseline parameters (2 bars), , , , and in accordance with traceable structural capacity mapping frameworks [36].
To evaluate the strengths and operational boundaries of the proposed framework, its predictive characteristics were comparatively benchmarked against both classical deterministic transport formulations and existing data-driven durability models [37,38]. Classical time-dependent Fickian diffusion models () and empirical corrosion-induced damage laws [39] provide traceable physical causality but lack the dynamic flexibility to assimilate multi-point in-situ sensor streams or adapt to the spatial microstructural heterogeneity across multiple ITZs in recycled concrete. Conversely, while advanced data-driven algorithms (e.g., standard neural networks or decision trees [37]) excel at multi-dimensional non-linear mapping, they are prone to unphysical asymptotic divergence or overfitting when extrapolating far beyond empirical training horizons. By embedding explicit mechanics equilibrium and boundary constraint operators into the SVR learning engine, the present framework bridges deterministic mechanics with data-driven adaptivity, achieving progressive RUL interval convergence while strictly satisfying physical governing laws.
Consequently, the time-dependent degradation trajectories of the residual ultimate moment of the prefabricated beam components under different recycled coarse aggregate replacement rates were obtained through forward extrapolation and benchmarked against classical mechanistic models (Fickian diffusion with aging factor and Faraday-based corrosion laws), as illustrated in Figure 11.
Figure 11.
Time-dependent degradation of residual ultimate bending capacity of prefabricated RAC beams.
Figure 11 demonstrates that the deterioration of the residual load-bearing capacity possesses an exceptionally strong material-specific time-dependent effect. For the conventional concrete component (NAC), owing to its dense matrix and high resistance barrier against ingress, its residual ultimate moment remains largely stable during the first 25 years of service, after which it exhibits a mild, progressive decline with the propagation of pitting corrosion in the reinforcement. However, for the recycled concrete component with a high replacement rate (RAC100), its residual capacity degradation trajectory exhibits a prominent “accelerated steep drop” characteristic. Within the first 15 years of service, its ultimate moment can still be maintained above 95% of the initial design value due to the volume expansion self-tightening effect of early-stage corrosion products. Nevertheless, after crossing the 20-year service age landmark, the long-term highly dense crack network effect induced by multiple ITZ defects erupts completely, and the local macro-cell corrosion rate triggered by chloride ingress surges non-linearly. Consequently, the capacity degradation rate of RAC100 reaches 1.63 times that of the NAC component, and its remaining life prediction band demonstrates a distinct, accelerated divergent pattern with widening material-specific 95% confidence intervals reflecting long-term extrapolation uncertainty.
4.4.3. Remaining Useful Life (RUL) Assessment and Operation & Maintenance Decision-Making
To translate the aforementioned time-dependent degradation trajectories into quantifiable indicators capable, the safety red line for residual flexural capacity was set to (representing of the initial nominal capacity ), derived from the factored Ultimate Limit State (ULS) flexural demand () and safety reliability margins under standard concrete design specifications. The temporal point where the lower bound of the 95% confidence interval (CI) of the predicted capacity curve intersects this safety limit is defined as the total projected service lifespan (). The remaining useful life () at any current evaluation age is calculated as . Here, the 95% predictive intervals were constructed via non-parametric Bootstrap resampling by repeatedly fitting the surrogate model over resampled training partitions and propagating residual variance through the analytical cross-sectional equilibrium. The statistical calibration of the uncertainty bounds was verified on the quarantined 80-month holdout test set, yielding an empirical coverage probability of 92.9%. The core value of the proposed model lies in achieving a dynamic convergence of the RUL confidence intervals driven by the dynamic injection of multi-stage in-situ inspection data, as illustrated in Figure 12.
Figure 12.
Dynamic evolution and convergence trajectories of ultimate moment and remaining useful life (RUL) confidence intervals based on multi-stage in-situ inspection data injection.
As shown in Figure 12, during the initial stage of service (), owing to the sole availability of prior information regarding the baseline material physical parameters, the uncertainties stemming from the highly discrete recycled aggregates undergo severe temporal compounding and superposition. Consequently, the predicted residual capacity confidence band extrapolated after 50 years is exceptionally wide (bounded by the purple solid lines). At this baseline juncture, the projected total service life for the RAC100 component is evaluated at 28.0–42.0 years (median 35.0 years), corresponding to an initial span of 28.0–42.0 years.
When the service period reaches the 10th month, the initial stream of in-situ monitoring data is injected, narrowing the projected total service life to 32.0–39.0 years (median 35.5 years), which corresponds to an updated of 31.2–38.2 years (bounded by the green dashed lines). Furthermore, as the damage age extends to the 80th month, upon further inputting the two-dimensional spatial chloride accumulation fields across multiple measuring points and the macro-surface longitudinal corrosion-induced crack width variation data experienced after long-term natural atmospheric exposure, the data-driven engine completes a deep-level calibration and reconstruction. This leads to a progressive narrowing of the capacity degradation trajectory confidence band (bounded by the red solid lines), reflecting reduced epistemic variance as empirical observations accumulate. At this point, the projected total service lifespan () of the RAC100 component converges to 34.5 years (95% CI: 33.8–35.2 years), which corresponds to a finalized remaining useful life of 27.8 years (95% CI: 27.1–28.5 years), compressing the confidence margin to within 1.4 years.
Evaluating structural forecasting through calibrated error measures and holdout data rather than treating computational interval narrowing alone as definitive safety proof follows standard predictive evaluation protocols [39]. Based on these sequential updating trajectories, this study proposes the following preventive maintenance and management strategies tailored for prefabricated recycled concrete structures in green transportation infrastructure: Given that the RAC100 component will enter an accelerated capacity degradation stage after 20 years of service, with its remaining life rapidly approaching the 34.5-year limit, it is recommended that a first-level warning must be activated via the in-situ monitoring system between the 18th and 20th years of service. Concurrently, potential proactive interventions consisting of surface microcrack sealing via barrier coatings and electrochemical chloride extraction (ECE) can be considered within the core tensile and shear zones to help retard the “stress–corrosion” cycle, pending comprehensive life-cycle cost, efficacy, and post-intervention analyses.
Nevertheless, several boundary limitations should be noted: the present framework primarily focused on chloride-induced damage under sustained static flexure; other aggressive mechanisms (e.g., carbonation, freeze–thaw cycles, cyclic thermal gradients, and dynamic traffic fatigue) were not parameterized into the input space. Extending predictions beyond the 80-month test window represents exploratory scenarios, and future research should expand the multi-physics feature vector and couple the framework with high-performance composite [40].
5. Conclusions
This study investigated the long-term durability and flexural degradation of prefabricated recycled aggregate concrete (RAC) beams under sustained flexural loading and natural atmospheric exposure for up to 80 months, integrated with a physics-constrained machine learning framework. The primary conclusions are drawn as follows:
- Experimental Observations (0–80 Months): Natural atmospheric and sustained loading tests demonstrated that RAC100 beams experienced accelerated chloride ingress, higher localized rebar section loss, and pronounced spatial cracking compared to conventional concrete, primarily driven by multiple weak interfacial transition zones (ITZs) and porous adhered mortar under tension.
- Surrogate Interpolation & Feature Sensitivity: Under specimen-grouped cross-validation, the SVR surrogate effectively captured spatial durability fields (). Feature importance over the dynamic 0–80 month timeline revealed a transition from early stress/boundary dominance ( and spatial location contributing ) to long-term sensitivity governed by the composite RAC mix design ( contributing 36.8%), reflecting systemic material coupling.
- Physics-Constrained Projections & Maintenance Scenarios: Integrating physical boundary constraints and section equilibrium prevented unphysical extrapolation artifacts. Multi-stage inspection updates narrowed the projected total service life () of RAC100 to a median of 34.5 years (corresponding to an RUL of 27.8 years at the 80-month inspection). These projections outline illustrative maintenance scenarios, suggesting inspection alerts around years 18–20 prior to accelerated deterioration, which should be periodically updated with in-situ monitoring data.
Author Contributions
Conceptualization, J.L. and W.K.; Methodology, J.L. and W.K.; Validation, J.L. and W.K.; Formal analysis, J.L. and W.K.; Investigation, J.L. and W.K.; Resources, J.L. and W.K.; Data curation, J.L.; Writing—original draft preparation, J.L. and W.K.; Writing—review and editing, J.L.; Visualization, J.L. and W.K. Supervision, J.L.; Project administration, J.L. All authors have read and agreed to the published version of the manuscript.
Funding
The research received no external funding.
Data Availability Statement
Dataset available on request from the authors.
Conflicts of Interest
The authors declare no conflict of interest.
References
- Xiao, J.Z.; Li, W.G.; Fan, Y.H.; Huang, X. An overview of study on recycled aggregate concrete in China (1996–2011). Constr. Build. Mater. 2012, 31, 364–383. [Google Scholar] [CrossRef] [Scilit]
- Akbulut, Z.F.; Guler, S.; Yavuz, D.; Avcı, M.S. Toward sustainable construction: A critical review of recycled aggregate concrete properties and future opportunities. Case Stud. Constr. Mater. 2025, 23, e05133. [Google Scholar] [CrossRef] [Scilit]
- Xiao, J.; Poon, C.S.; Zhao, Y.; Wang, Y.; Ye, T.; Duan, Z.; Peng, L. Fundamental behavior of recycled aggregate concrete–overview II: Durability and enhancement. Mag. Concr. Res. 2022, 74, 1011–1026. [Google Scholar] [CrossRef] [Scilit]
- Abdo, A.; El-Zohairy, A.; Alashker, Y.; Badran, M.A.E.; Ahmed, S. Effect of Treated/Untreated Recycled Aggregate Concrete: Structural Behavior of RC Beams. Sustainability 2024, 16, 4039. [Google Scholar] [CrossRef] [Scilit]
- Ignjatović, I.S.; Marinković, S.B.; Tošić, N. Shear behaviour of recycled aggregate concrete beams with and without shear reinforcement. Eng. Struct. 2017, 141, 386–401. [Google Scholar] [CrossRef] [Scilit]
- Chen, B.; Zhao, Y.; Peng, L. Long-term performance of recycled aggregate concrete beams exposed to 10 years of loading and chloride environments. Eng. Struct. 2025, 333, 120140. [Google Scholar] [CrossRef] [Scilit]
- Yan, Y.; Si, Y.; Zheng, Y.; Wang, X. Durability of Nano-Reinforced Recycled Aggregate Concrete under Load and Chloride Ingress. Materials 2022, 15, 6194. [Google Scholar] [CrossRef] [Scilit] [PubMed]
- Wang, J.; Yang, Z.; Lai, H.; Sub, H.; Du, J. Corrosion-induced cracking and flexural behavior of recycled aggregate concrete beams with carbonated recycled coarse and fine aggregates. Structures 2025, 81, 110377. [Google Scholar] [CrossRef] [Scilit]
- Yi, G.; Song, Y.; Wang, J.; Chen, B. Corrosion Characteristics and Flexural Performance of Carbonated Recycled Aggregate Concrete Beams in Corrosive Environments. Buildings 2025, 15, 58. [Google Scholar] [CrossRef] [Scilit]
- Yu, Y.; Zheng, Y.; Zhao, X.Y. Mesoscale modeling of recycled aggregate concrete under uniaxial compression and tension using discrete element method. Constr. Build. Mater. 2021, 268, 121116. [Google Scholar] [CrossRef] [Scilit]
- Zhang, Z.; Zhao, R.; Zhao, R. Mesoscale simulation of chloride ion diffusion in five-phase recycled aggregate concrete. Int. Core J. Eng. 2025, 11, 173–186. [Google Scholar]
- Villagrán-Zaccardi, Y.A.; Zega, C.J.; Di Maio, A.A. Chloride Penetration and Binding in Recycled Concrete. J. Mater. Civ. Eng. 2008, 20, 449–455. [Google Scholar] [CrossRef] [Scilit]
- Du, X.L.; Jin, L.; Ma, G.W. A meso-scale numerical method for the simulation of chloride diffusivity in concrete. Finite Elem. Anal. Des. 2014, 85, 87–100. [Google Scholar] [CrossRef] [Scilit]
- Rong, G.; He, T.; Zhang, G.; Li, Y.; Wang, Y.; Xie, W. A review on chloride transport model and research method in concrete. Mater. Res. Express 2023, 10, 042002. [Google Scholar] [CrossRef] [Scilit]
- Wang, J.; Xu, Q. The combined effect of load and corrosion on the flexural performance of recycled aggregate concrete beams. Struct. Concr. 2023, 24, 544–558. [Google Scholar] [CrossRef] [Scilit]
- Wang, J.; Su, H.; Du, J.; Yu, J. Corrosion-induced cracking of recycled aggregate concrete beams under static load. Struct. Build. 2023, 176, 800–814. [Google Scholar] [CrossRef] [Scilit]
- Xiang, Y.; Li, Y.; Xu, Z.; Deng, J.; Cui, H.; Sun, G. Highly efficient resistance to chloride ion penetration and enhanced compressive strength in cement coupled with cationic polymer grafted nano-silica. Constr. Build. Mater. 2025, 478, 141420. [Google Scholar] [CrossRef] [Scilit]
- Liang, C.F.; Lu, N.; Ma, H.W.; Ma, Z.M.; Duan, Z.H. Carbonation behavior of recycled concrete with CO2-curing recycled aggregate under various environments. J. CO2 Util. 2020, 39, 101185. [Google Scholar] [CrossRef] [Scilit]
- Chinzorigt, G.; Lim, M.K.; Yu, M.; Lee, H.; Enkbold, O.; Choi, D. Strength, shrinkage and creep and durability aspects of concrete including CO2 treated recycled fine aggregate. Cem. Concr. Res. 2020, 136, 106062. [Google Scholar] [CrossRef] [Scilit]
- Zhao, P.; Xu, G.; Wang, Q.; Tang, G. Influence of sustained load on corrosion characteristics of reinforced concrete beams under galvanostatic accelerated corrosion. Constr. Build. Mater. 2019, 215, 30–42. [Google Scholar] [CrossRef] [Scilit]
- Wang, J.; Su, H.; Du, J. Corrosion depth of steel bars in recycled aggregate concrete beams under static load. Struct. Build. 2024, 177, 449–462. [Google Scholar] [CrossRef] [Scilit]
- Fu, C.; Jin, N.; Ye, H.; Jin, X.; Dai, W. Corrosion characteristics of a 4-year naturally corroded reinforced concrete beam with load-induced transverse cracks. Corros. Sci. 2017, 117, 11–23. [Google Scholar] [CrossRef] [Scilit]
- Coronelli, D.; Hanjari, K.Z.; Lundgren, K. Severely corroded RC with cover cracking. J. Struct. Eng. 2013, 139, 221–232. [Google Scholar] [CrossRef] [Scilit]
- Zhu, W.; François, R.; Coronelli, D.; Cleland, D. Effect of corrosion of reinforcement on the mechanical behaviour of highly corroded RC beams. Eng. Struct. 2013, 56, 544–554. [Google Scholar] [CrossRef] [Scilit]
- Zhao, Y.X.; Dong, J.F.; Wu, Y.Y. Steel corrosion and corrosion-induced cracking in recycled aggregate concrete. Corros. Sci. 2014, 85, 241–250. [Google Scholar] [CrossRef] [Scilit]
- Gamil, Y. Machine learning in concrete technology: A review of current researches, trends, and applications. Front. Built Environ. 2023, 9, 1145591. [Google Scholar] [CrossRef] [Scilit]
- Wattanapanich, C.; Imjai, T.; Sridhar, R.; Garcia, R.; Thomas, B.S. Optimizing recycled aggregate concrete for severe conditions through machine learning techniques: A review. Eng. Sci. 2024, 31, 1191. [Google Scholar] [CrossRef] [Scilit]
- Raju, M.R.; Ahmad, S.I.; Hasan, M.M.; Hasan, N.M.S.; Islam, M.M.; Basit, M.A.; Hossain, I.T.; Santo, S.A.; Alam, M.S.; Rahman, M. Machine learning for predicting strength properties of waste iron slag concrete. Heliyon 2025, 11, e42133. [Google Scholar] [CrossRef] [Scilit] [PubMed]
- Bahmani, H.; Mostafaei, H.; Santos, P.; Ferrández, D. Concrete Material Variability and Machine Learning Model Performance: A Comprehensive Review. Buildings 2026, 16, 556. [Google Scholar] [CrossRef] [Scilit]
- Yang, Y.; Zhu, T.-T.; Zhao, X.; Luo, H.; Liu, B.-Y.; Kong, T.-T.; Tao, J.; Zhang, F. Improved Prediction of Freeze–Thaw Resistance of Steel-Fiber-Reinforced Concrete in Cold-Region Tunnels Based on Machine Learning. Buildings 2026, 16, 1811. [Google Scholar] [CrossRef] [Scilit]
- Safa, M.; Shariati, M.; Ibrahim, Z.; Toghroli, A.; Petkovic, D. Potential of adaptive neuro fuzzy inference system for evaluating the factors affecting steel-concrete composite beam’s shear strength. Steel Compos. Struct. 2016, 21, 679–688. [Google Scholar] [CrossRef] [Scilit]
- Zhu, W.; François, R. Structural performance of RC beams in relation with the corroded period in chloride environment. Mater. Struct. 2015, 48, 1757–1769. [Google Scholar] [CrossRef] [Scilit]
- Shariat, M.; Shariati, M.; Madadi, A.; Wakil, K. Computational Lagrangian Multiplier Method by using for optimization and sensitivity analysis of rectangular reinforced concrete beams. Steel Compos. Struct. 2018, 29, 243–256. [Google Scholar]
- Shariati, M.; Mafipour, M.S.; Mehrabi, P.; Ahmadi, M.; Wakil, K.; Trung, N.T.; Toghroli, A. Prediction of concrete strength in presence of furnace slag and fly ash using Hybrid ANN-GA (Artificial Neural Network-Genetic Algorithm). Smart Struct. Syst. 2020, 25, 183–195. [Google Scholar] [CrossRef]
- Shariati, M.; Armaghani, D.J.; Khandelwal, M.; Khorami, M. Assessment of longstanding effects of fly ash and silica fume on the compressive strength of concrete using extreme learning machine and artificial neural network. J. Adv. Eng. Comput. 2021, 5, 50–74. [Google Scholar] [CrossRef] [Scilit]
- Safa, M.; Trung, N.T.; Fazli, A.S.; Zandi, Y.; Shariati, M.; Wakil, K.; Khorami, M. Moment rotation prediction of precast beam to column connections using extreme learning machine. Struct. Eng. Mech. 2022, 639–647. [Google Scholar]
- Taffese, W.Z.; Sistonen, E. Machine learning for durability and service-life assessment of reinforced concrete structures: Recent advances and future directions. Autom. Constr. 2017, 77, 1–14. [Google Scholar] [CrossRef] [Scilit]
- Vu, K.; Stewart, M.G.; Mullard, J. Corrosion-induced cracking: Experimental data and predictive models. ACI Struct. J. 2005, 102, 719. [Google Scholar] [CrossRef] [Scilit] [PubMed]
- Safa, M.; Sari, P.A.; Shariati, M.; Suhatril, M.; Trung, N.T.; Wakil, K.; Khorami, M. Development of neuro-fuzzy and neuro-bee predictive models for prediction of the safety factor of eco-protection slopes. Phys. A Stat. Mech. Its Appl. 2020, 550, 124046. [Google Scholar] [CrossRef] [Scilit]
- Sharifi Ghalehnoei, M.; Javanmardi, A.; Izadifar, M.; Ukrainczyk, N.; Koenders, E. Finite element analysis of shear reinforcing of reinforced concrete beams with carbon fiber reinforced polymer grid-strengthened engineering cementitious composite. Buildings 2023, 13, 1034. [Google Scholar] [CrossRef] [Scilit]
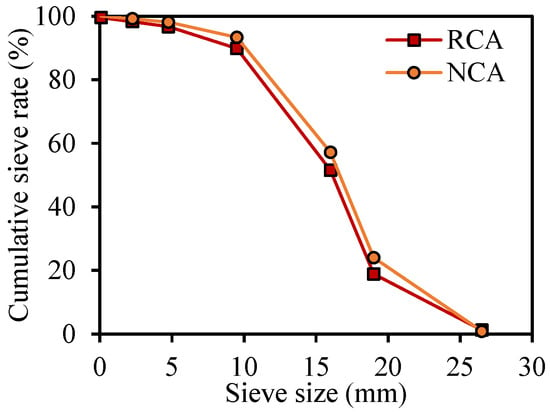
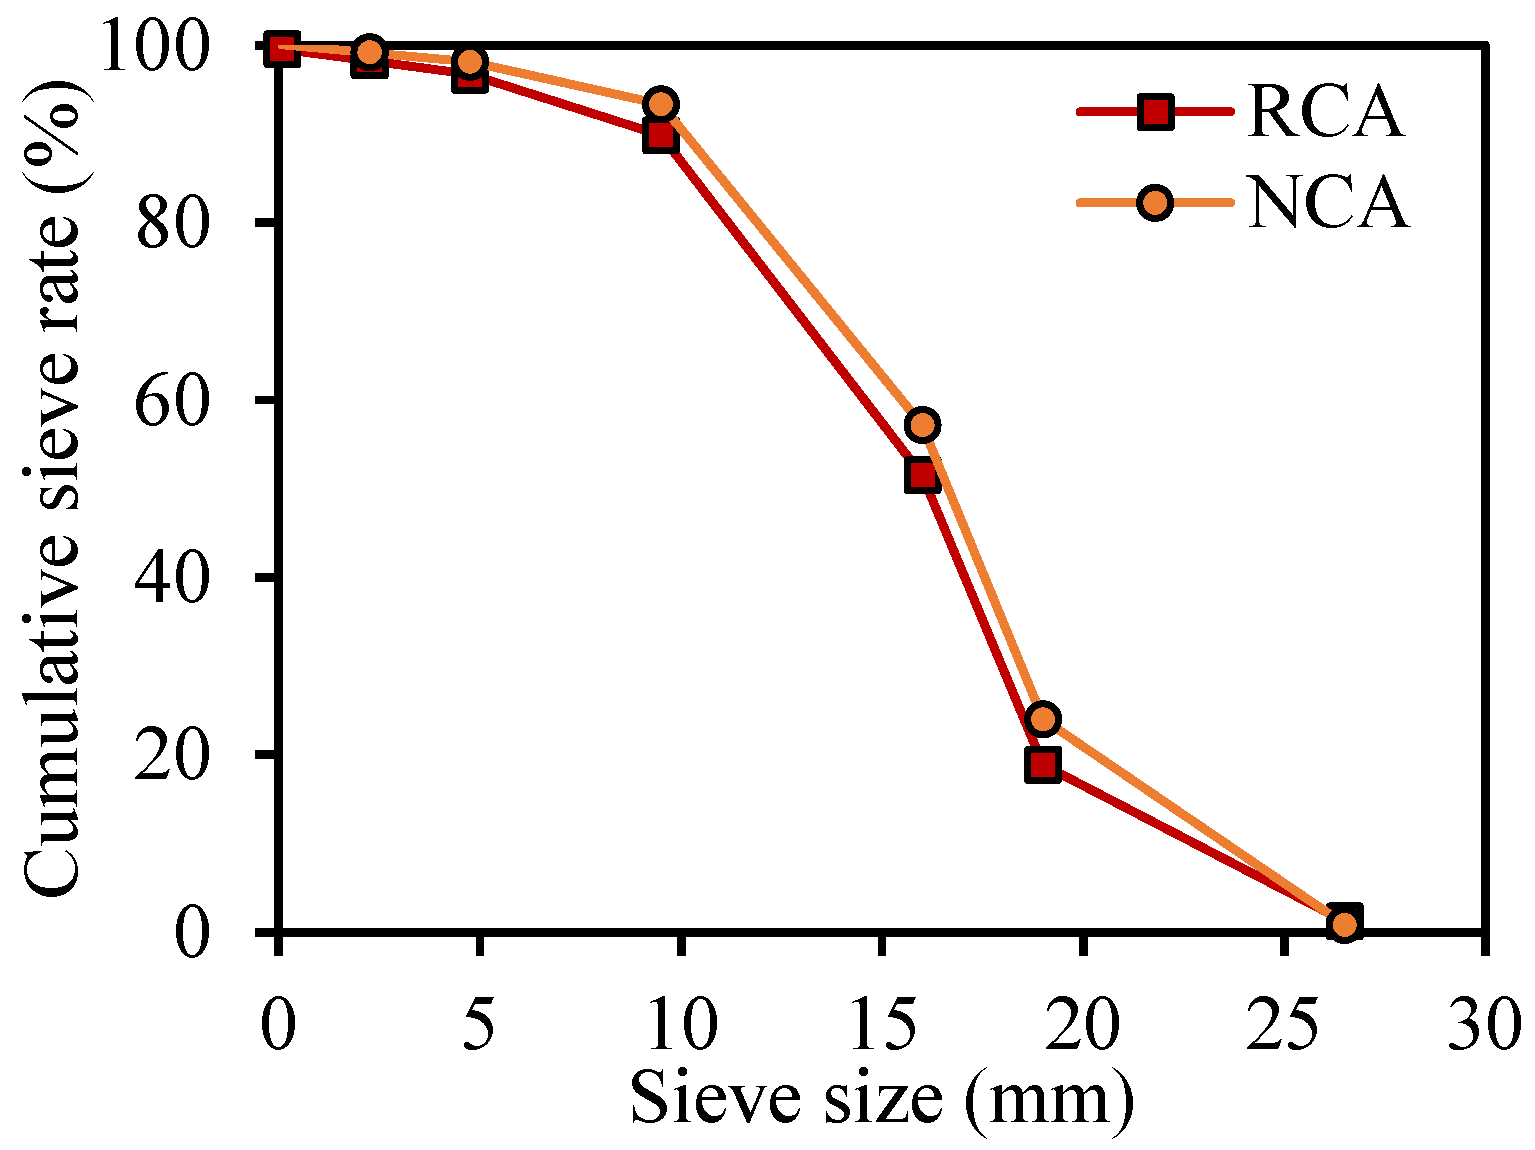
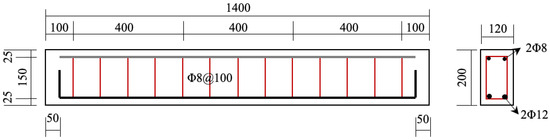
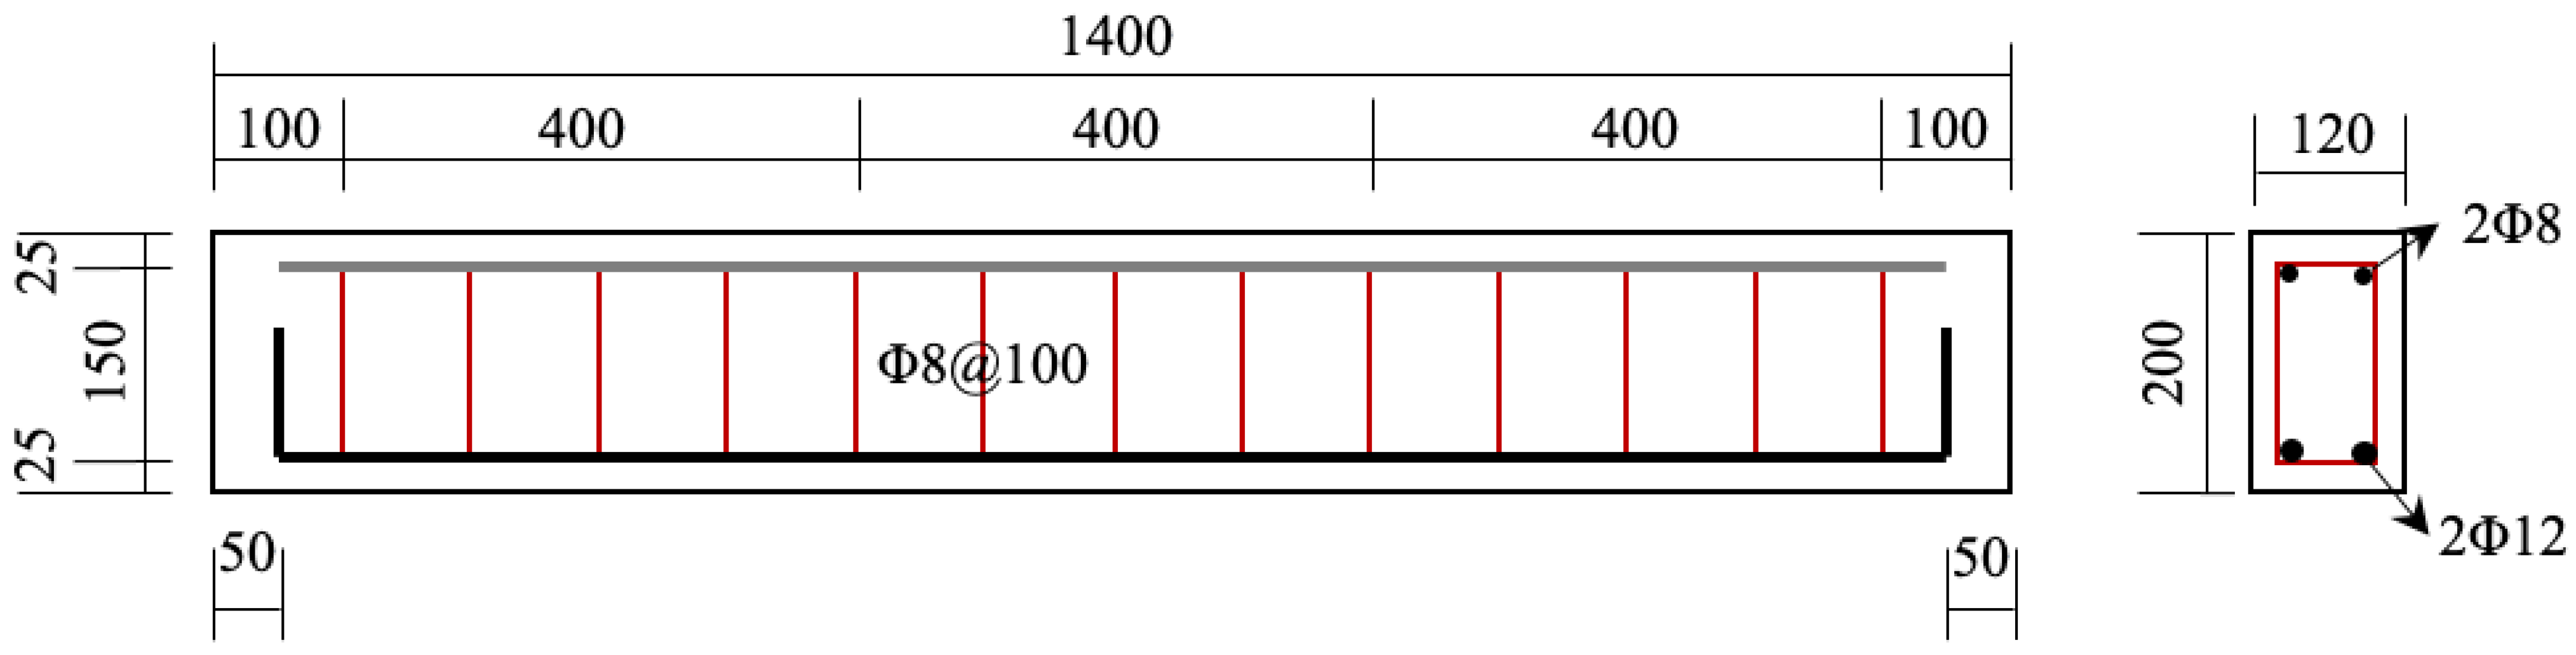
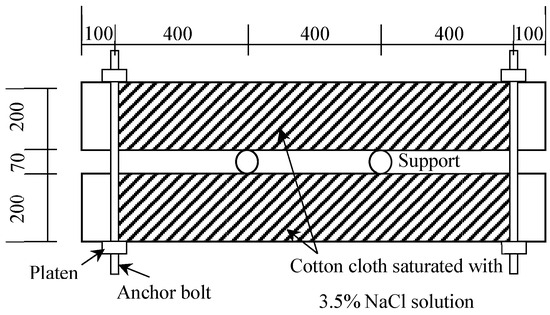
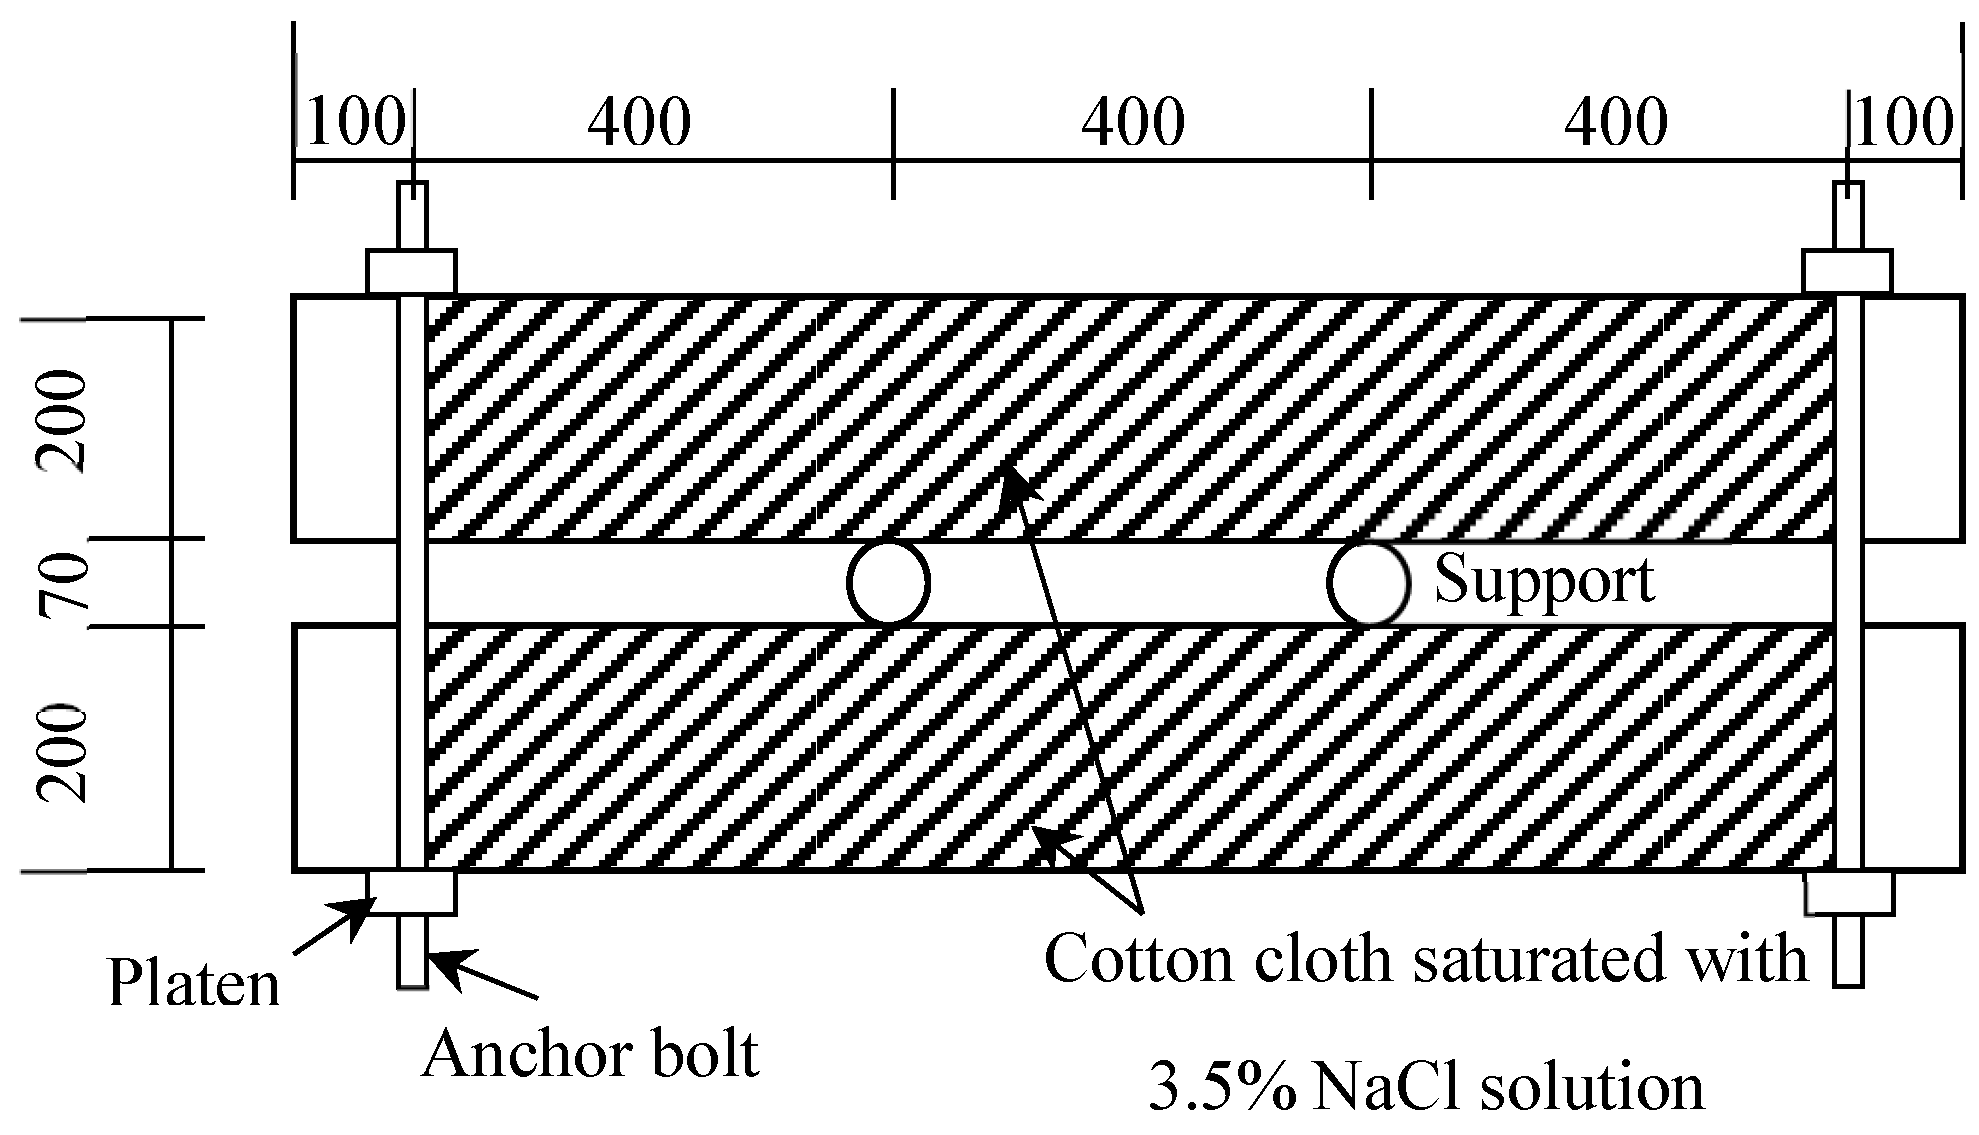


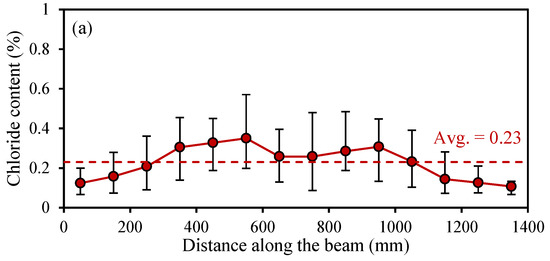
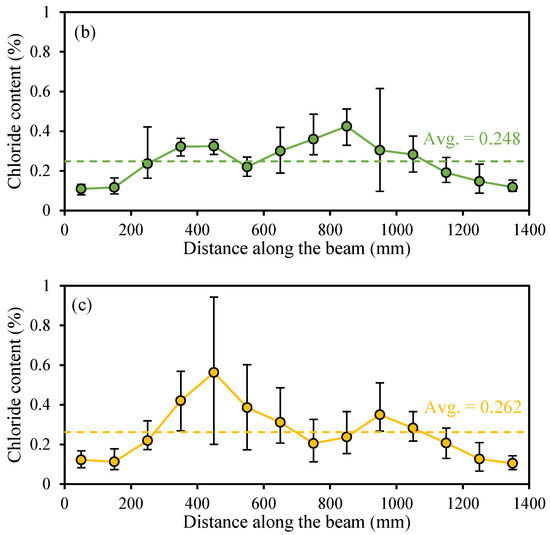
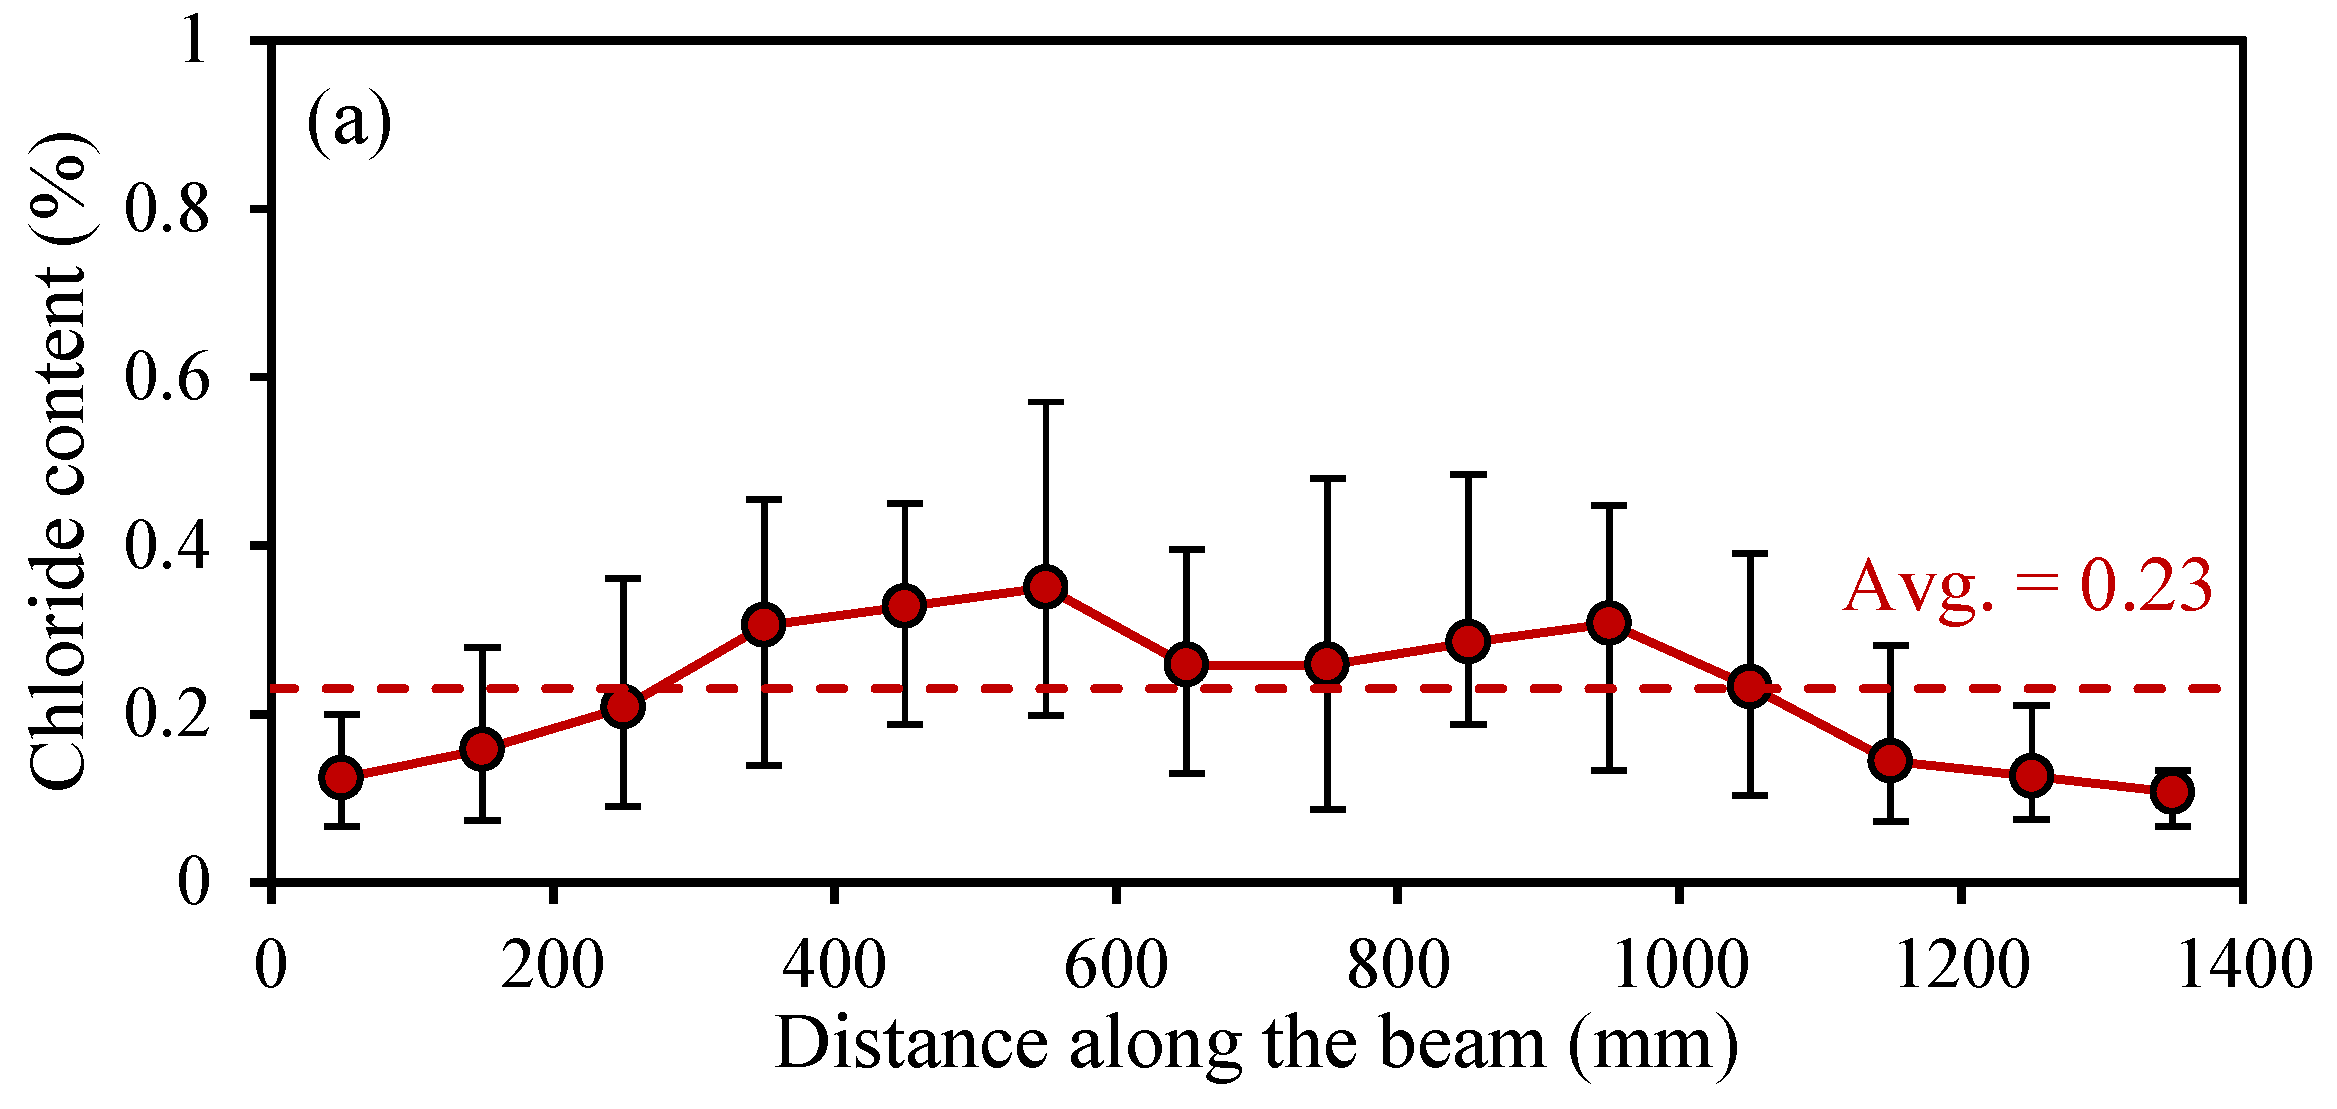
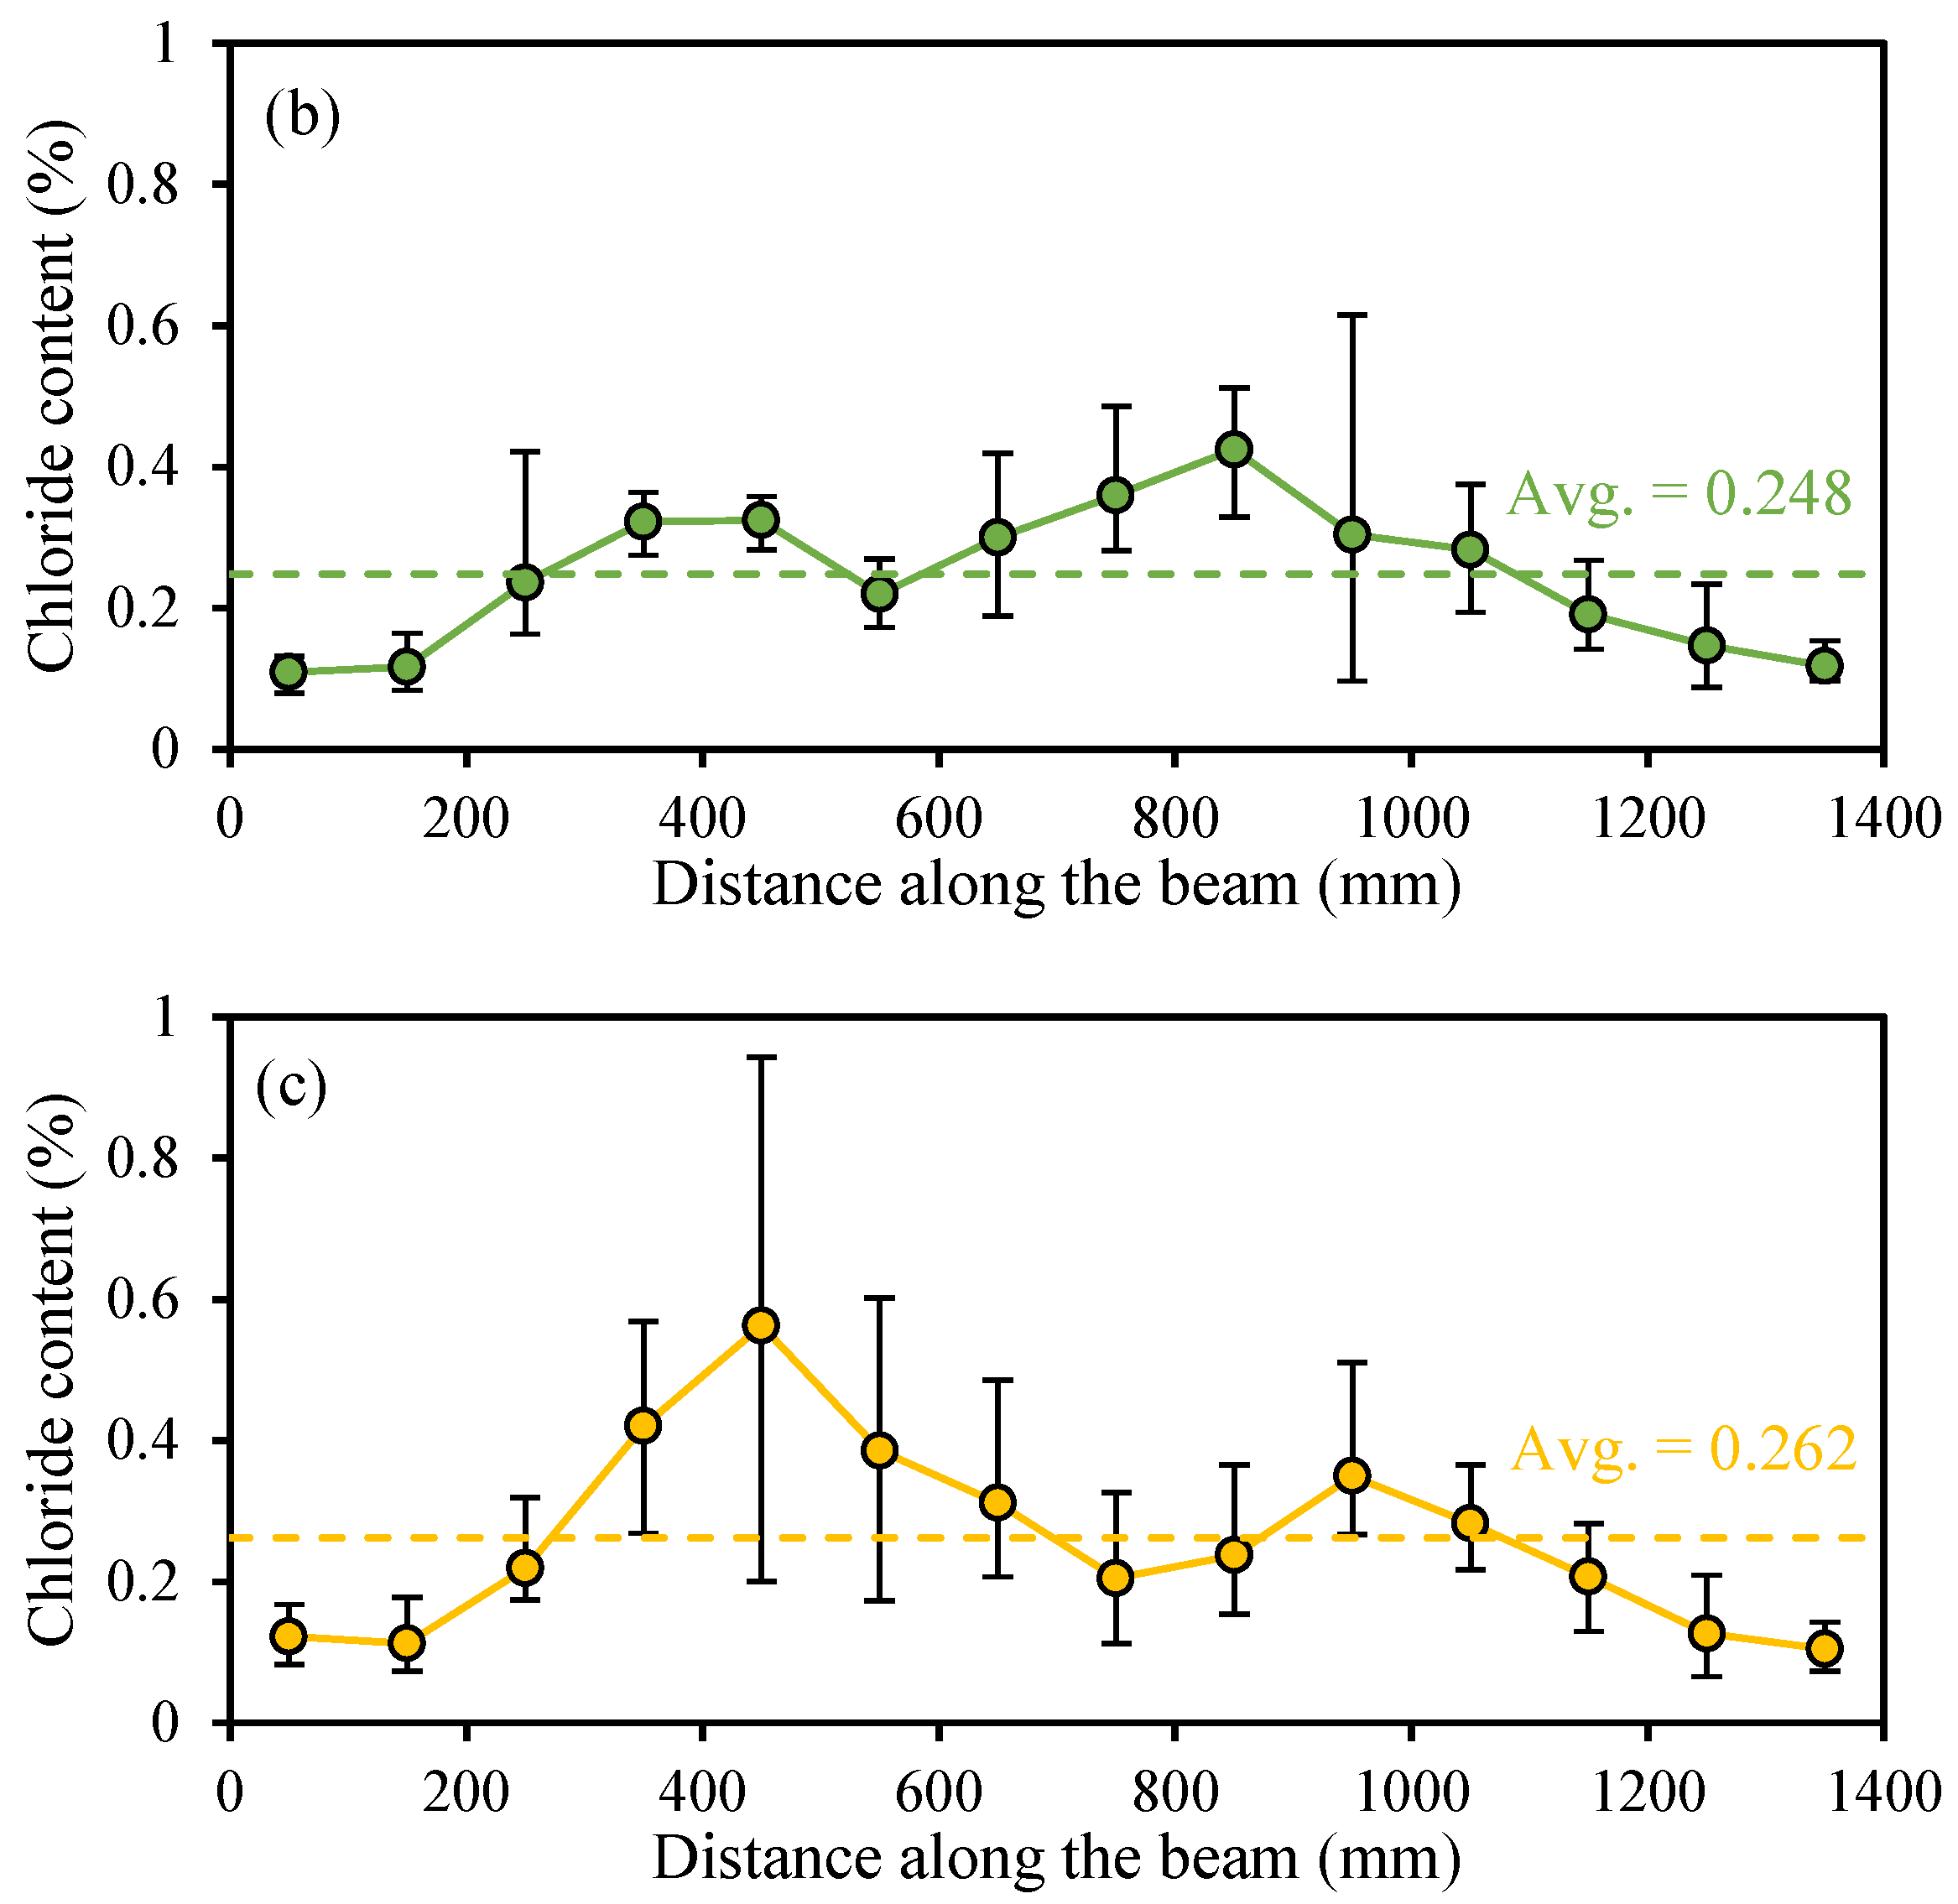
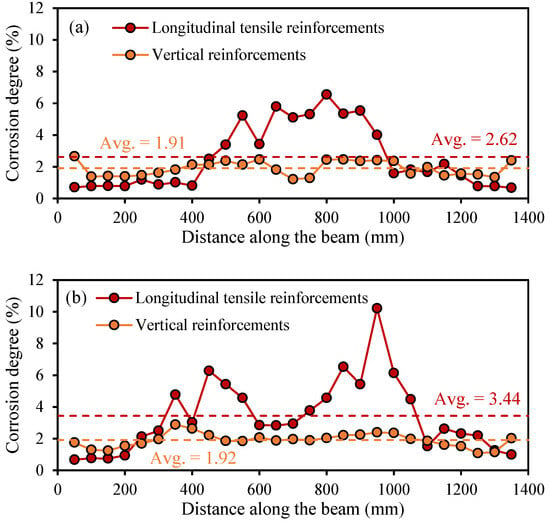
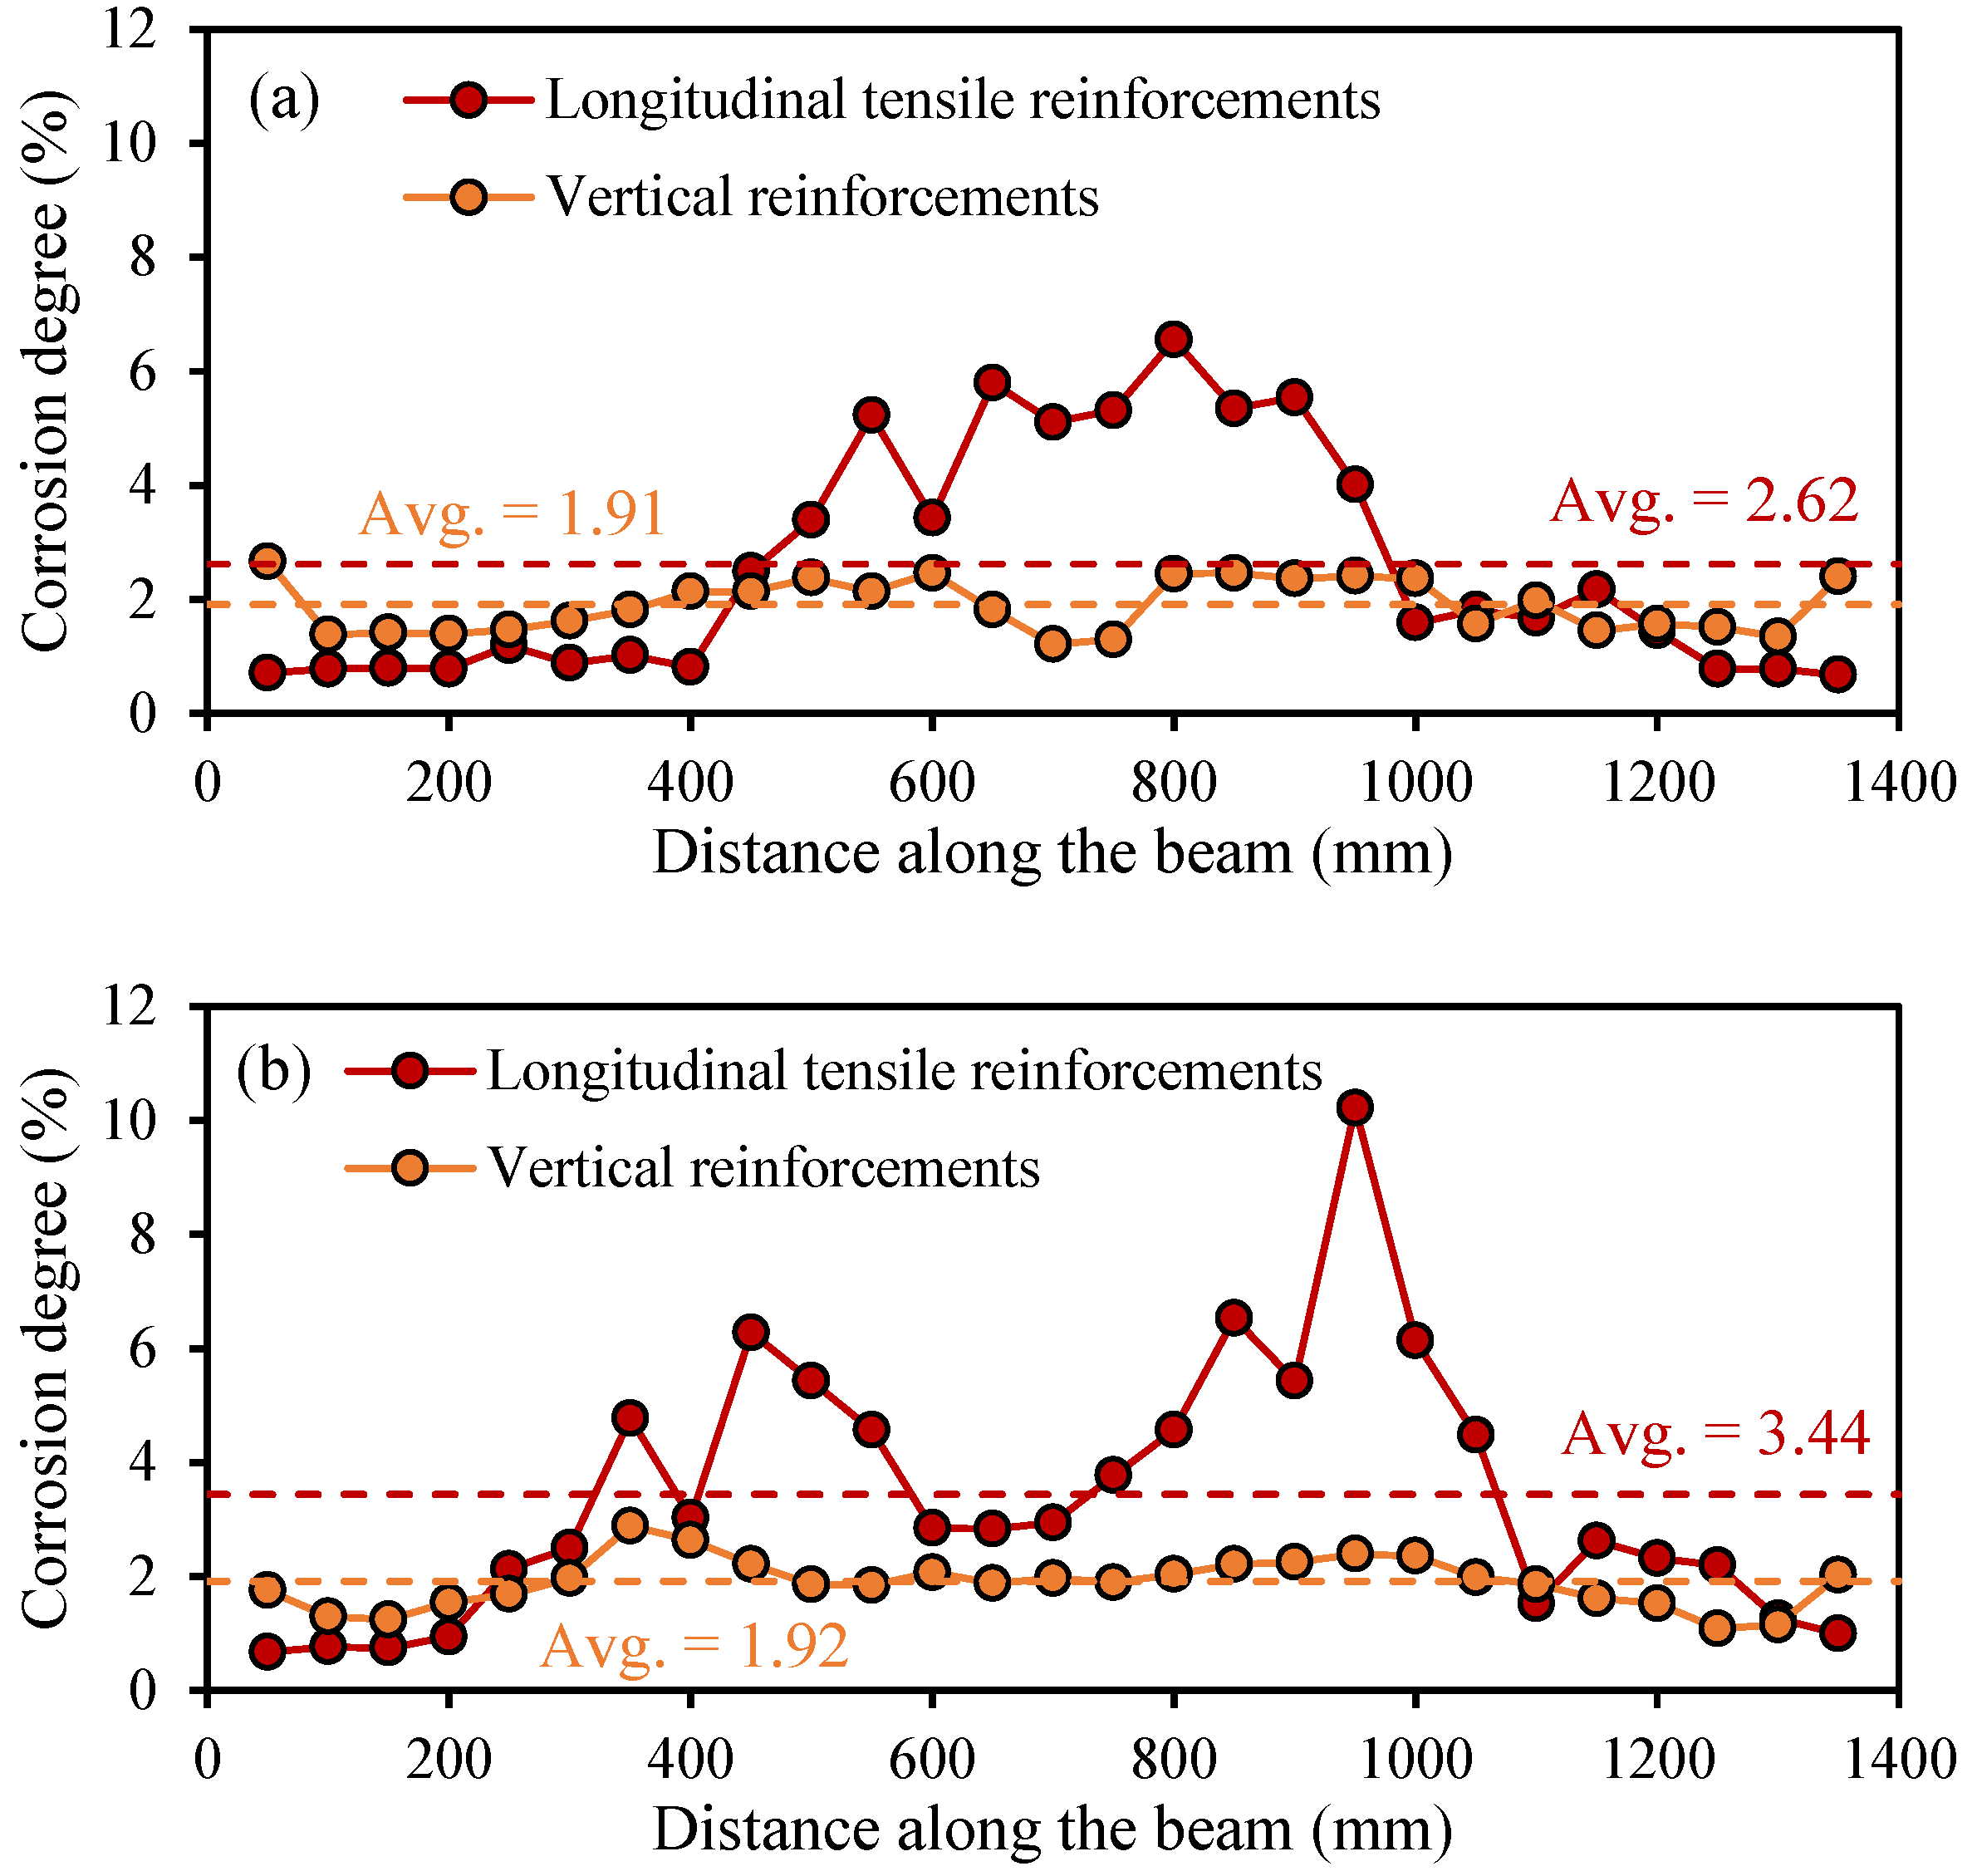
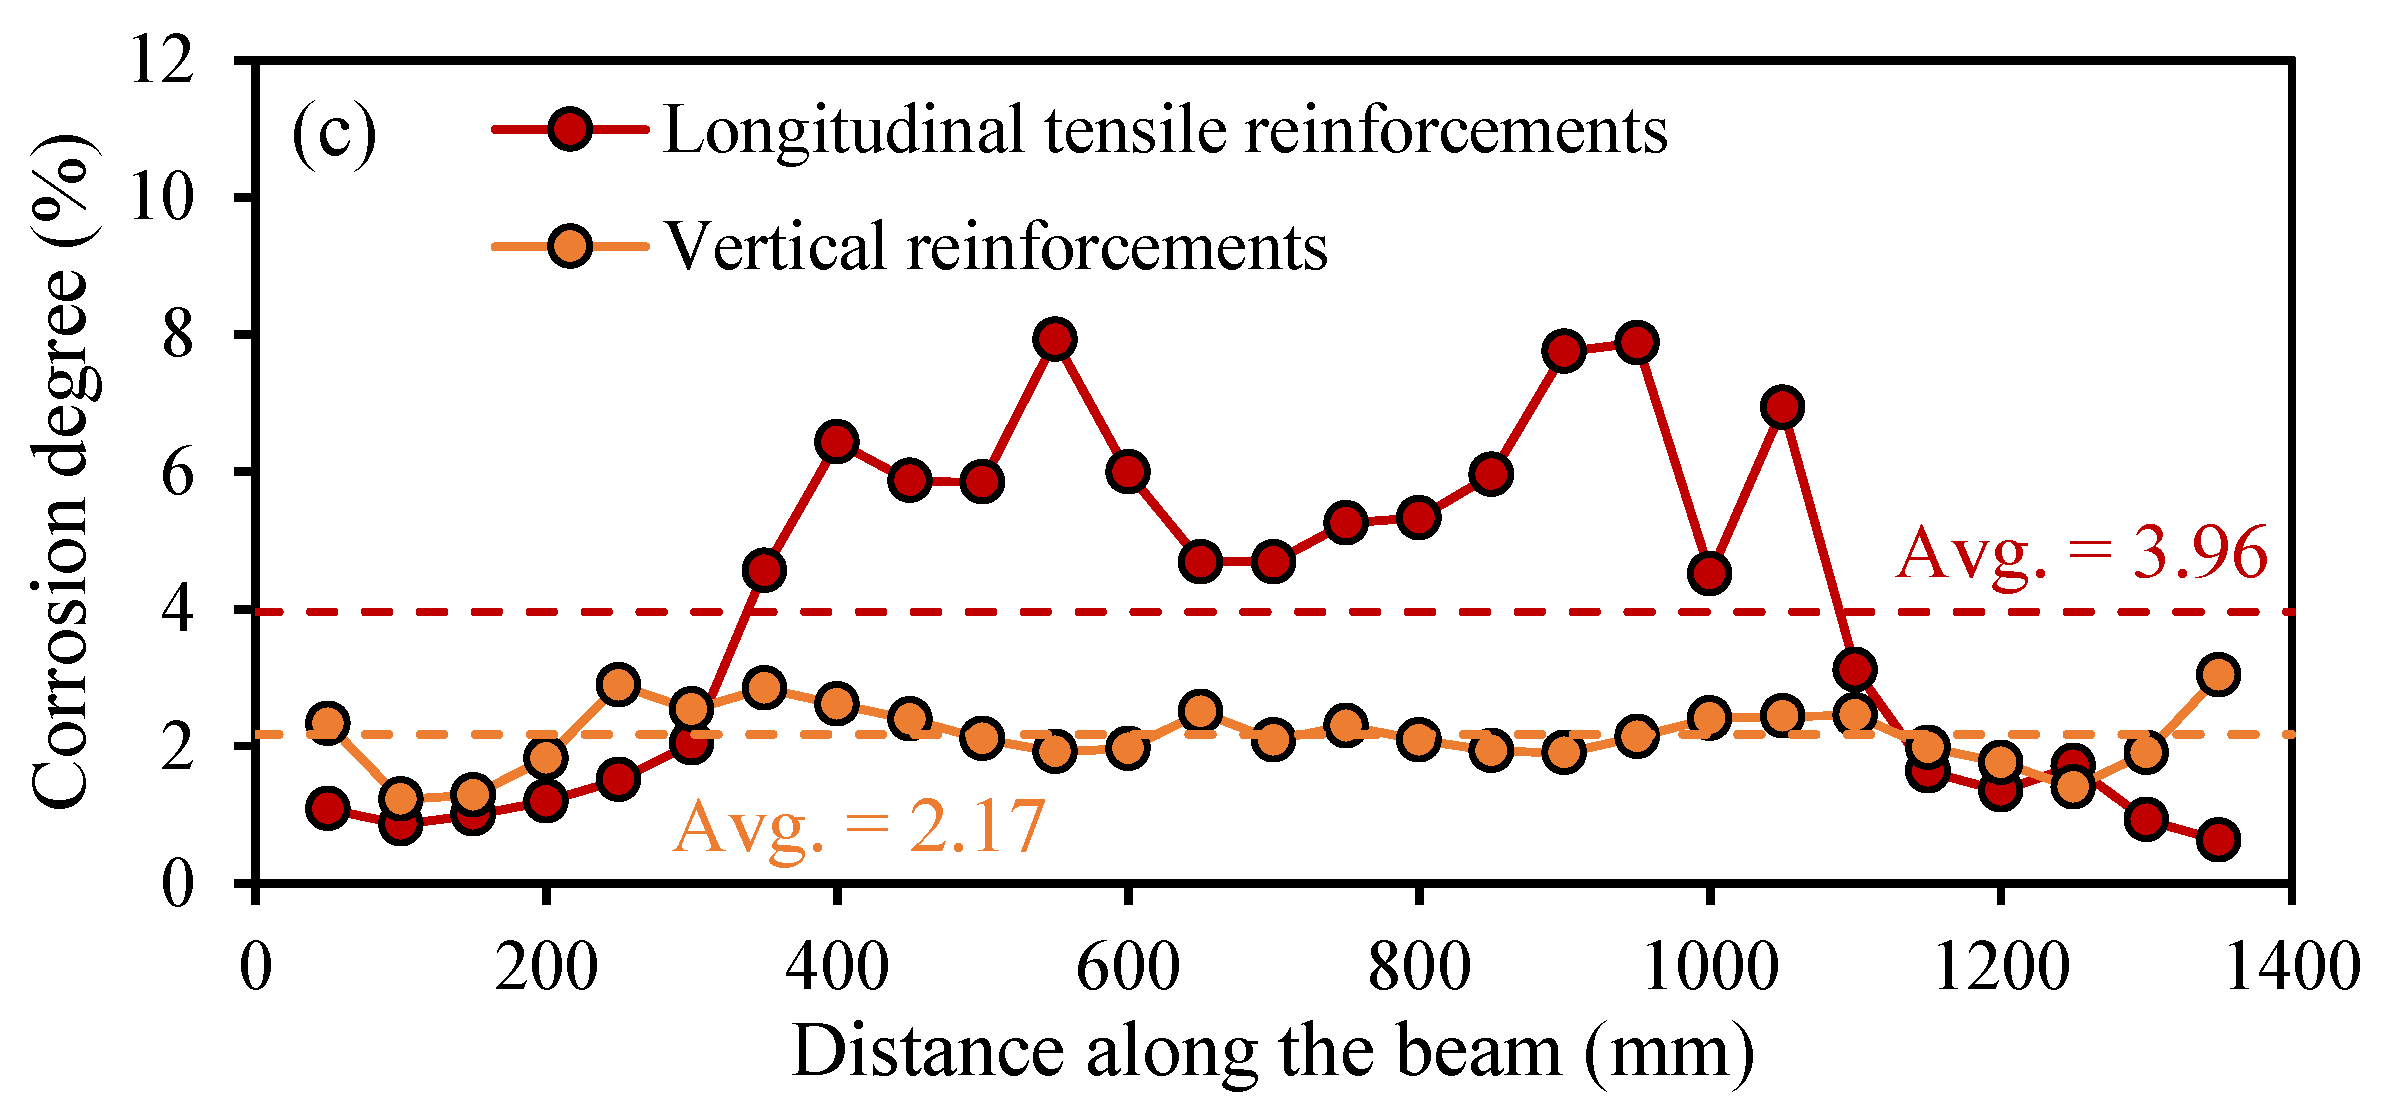
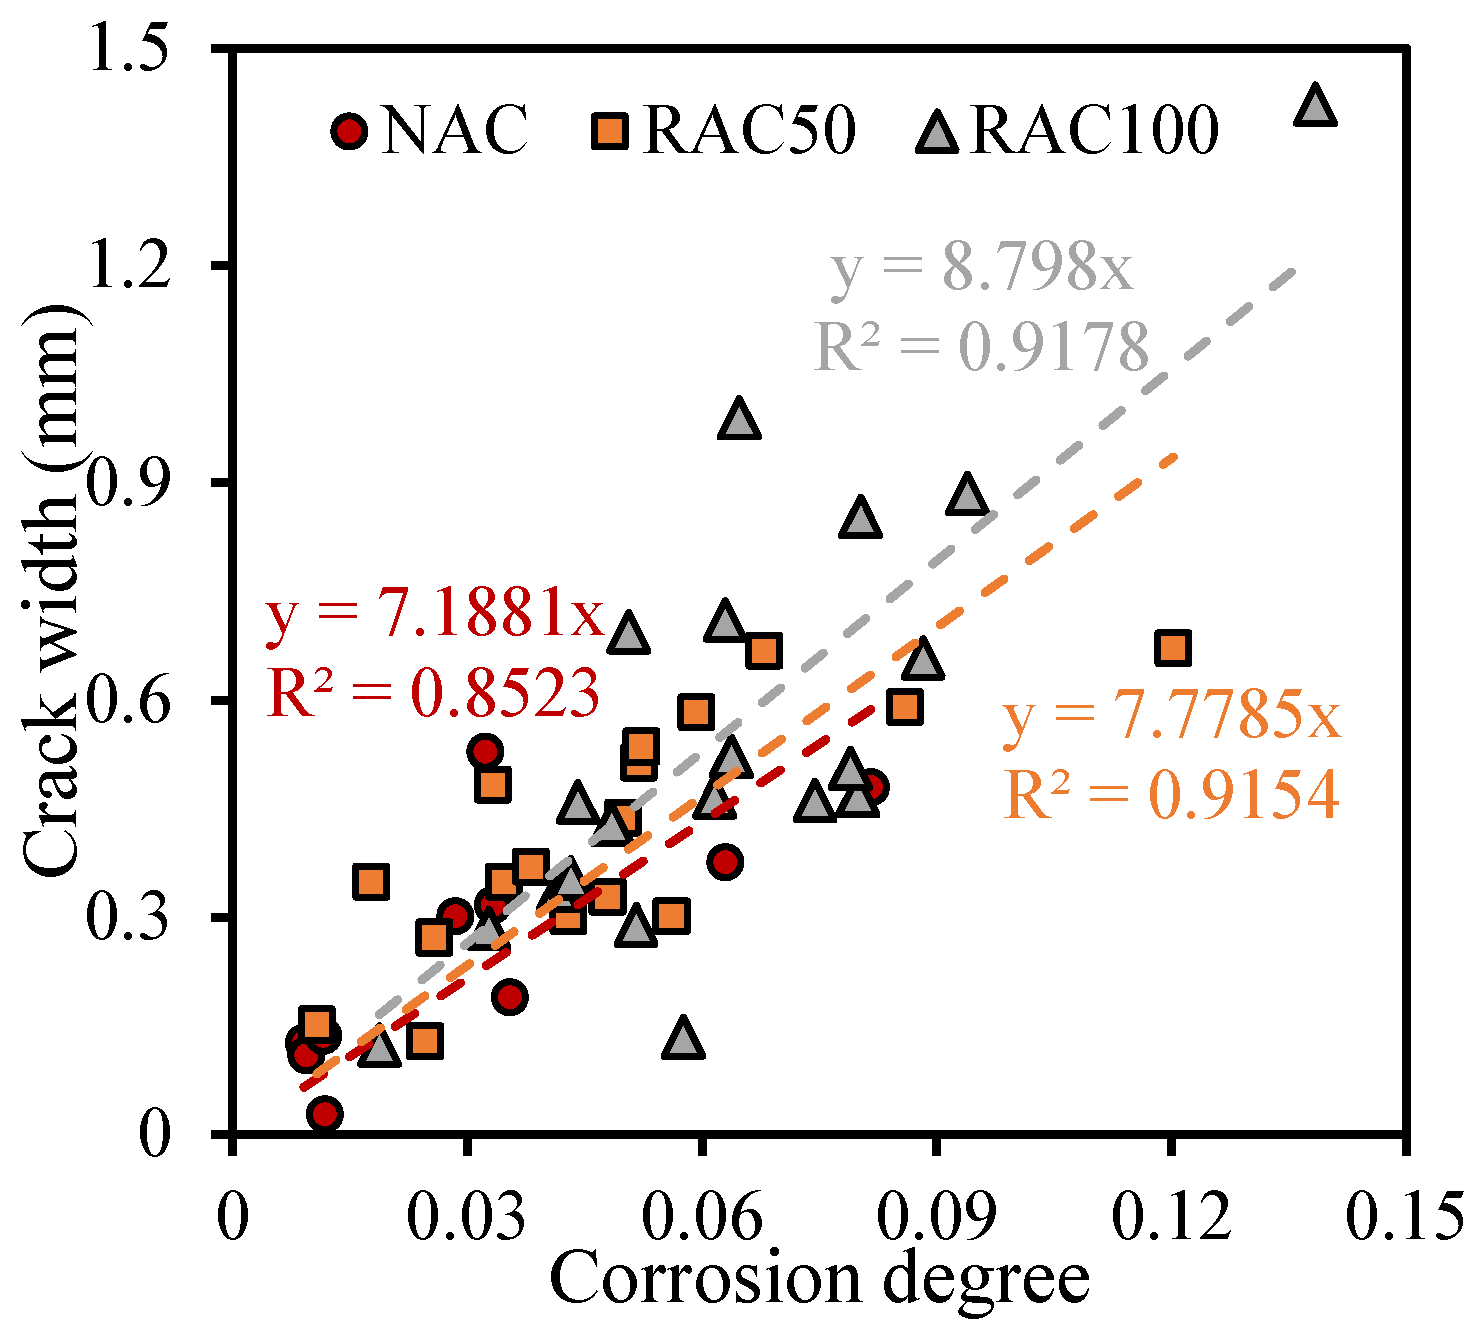
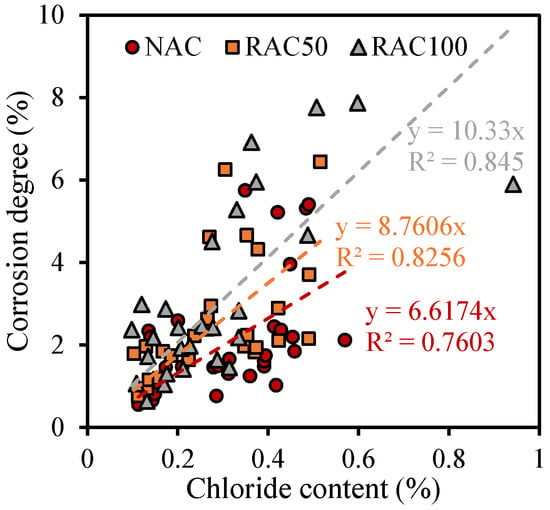
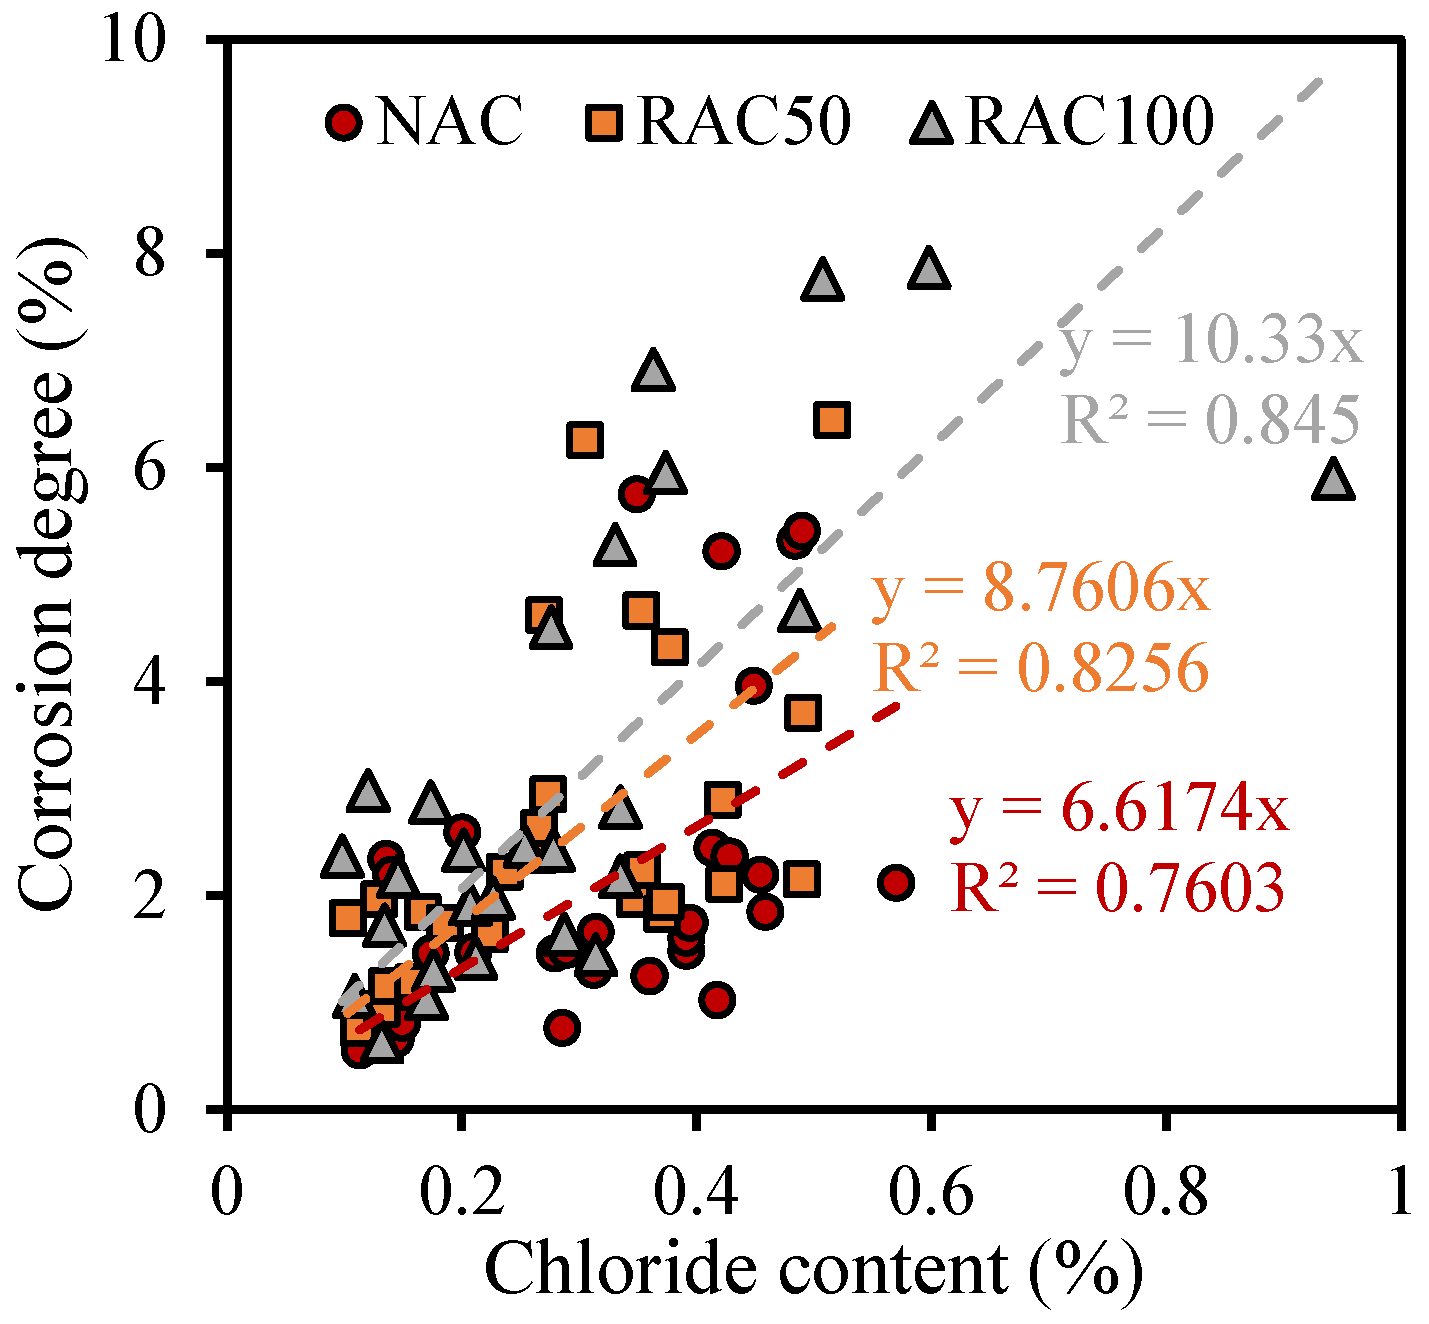
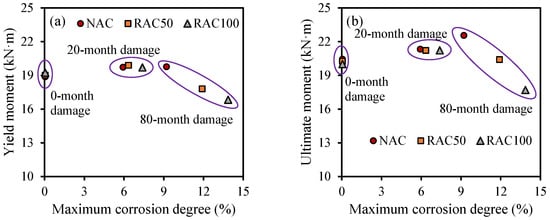
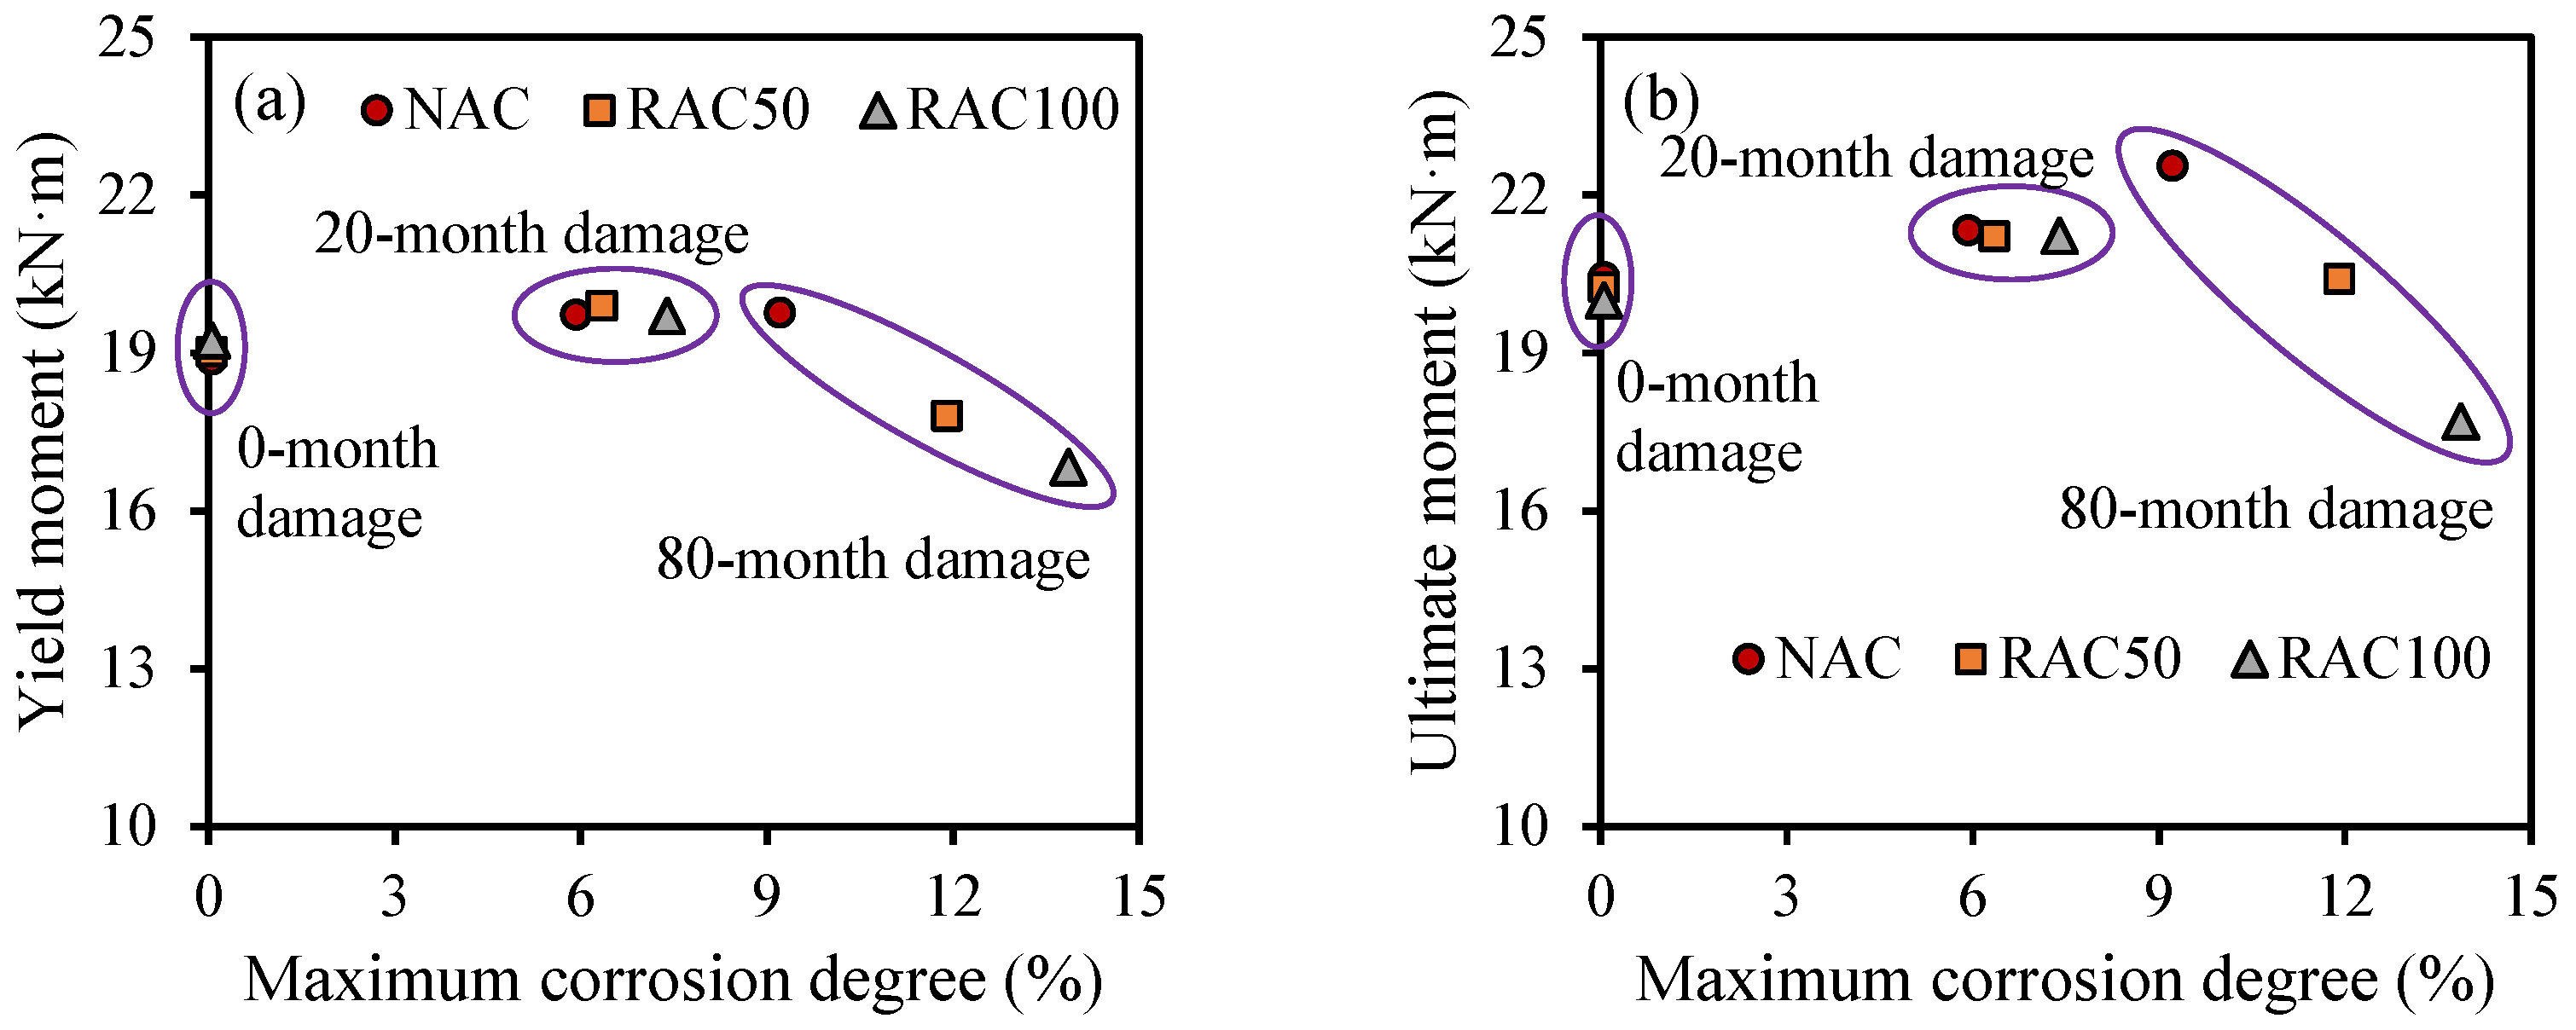
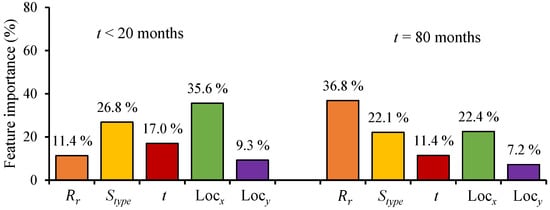
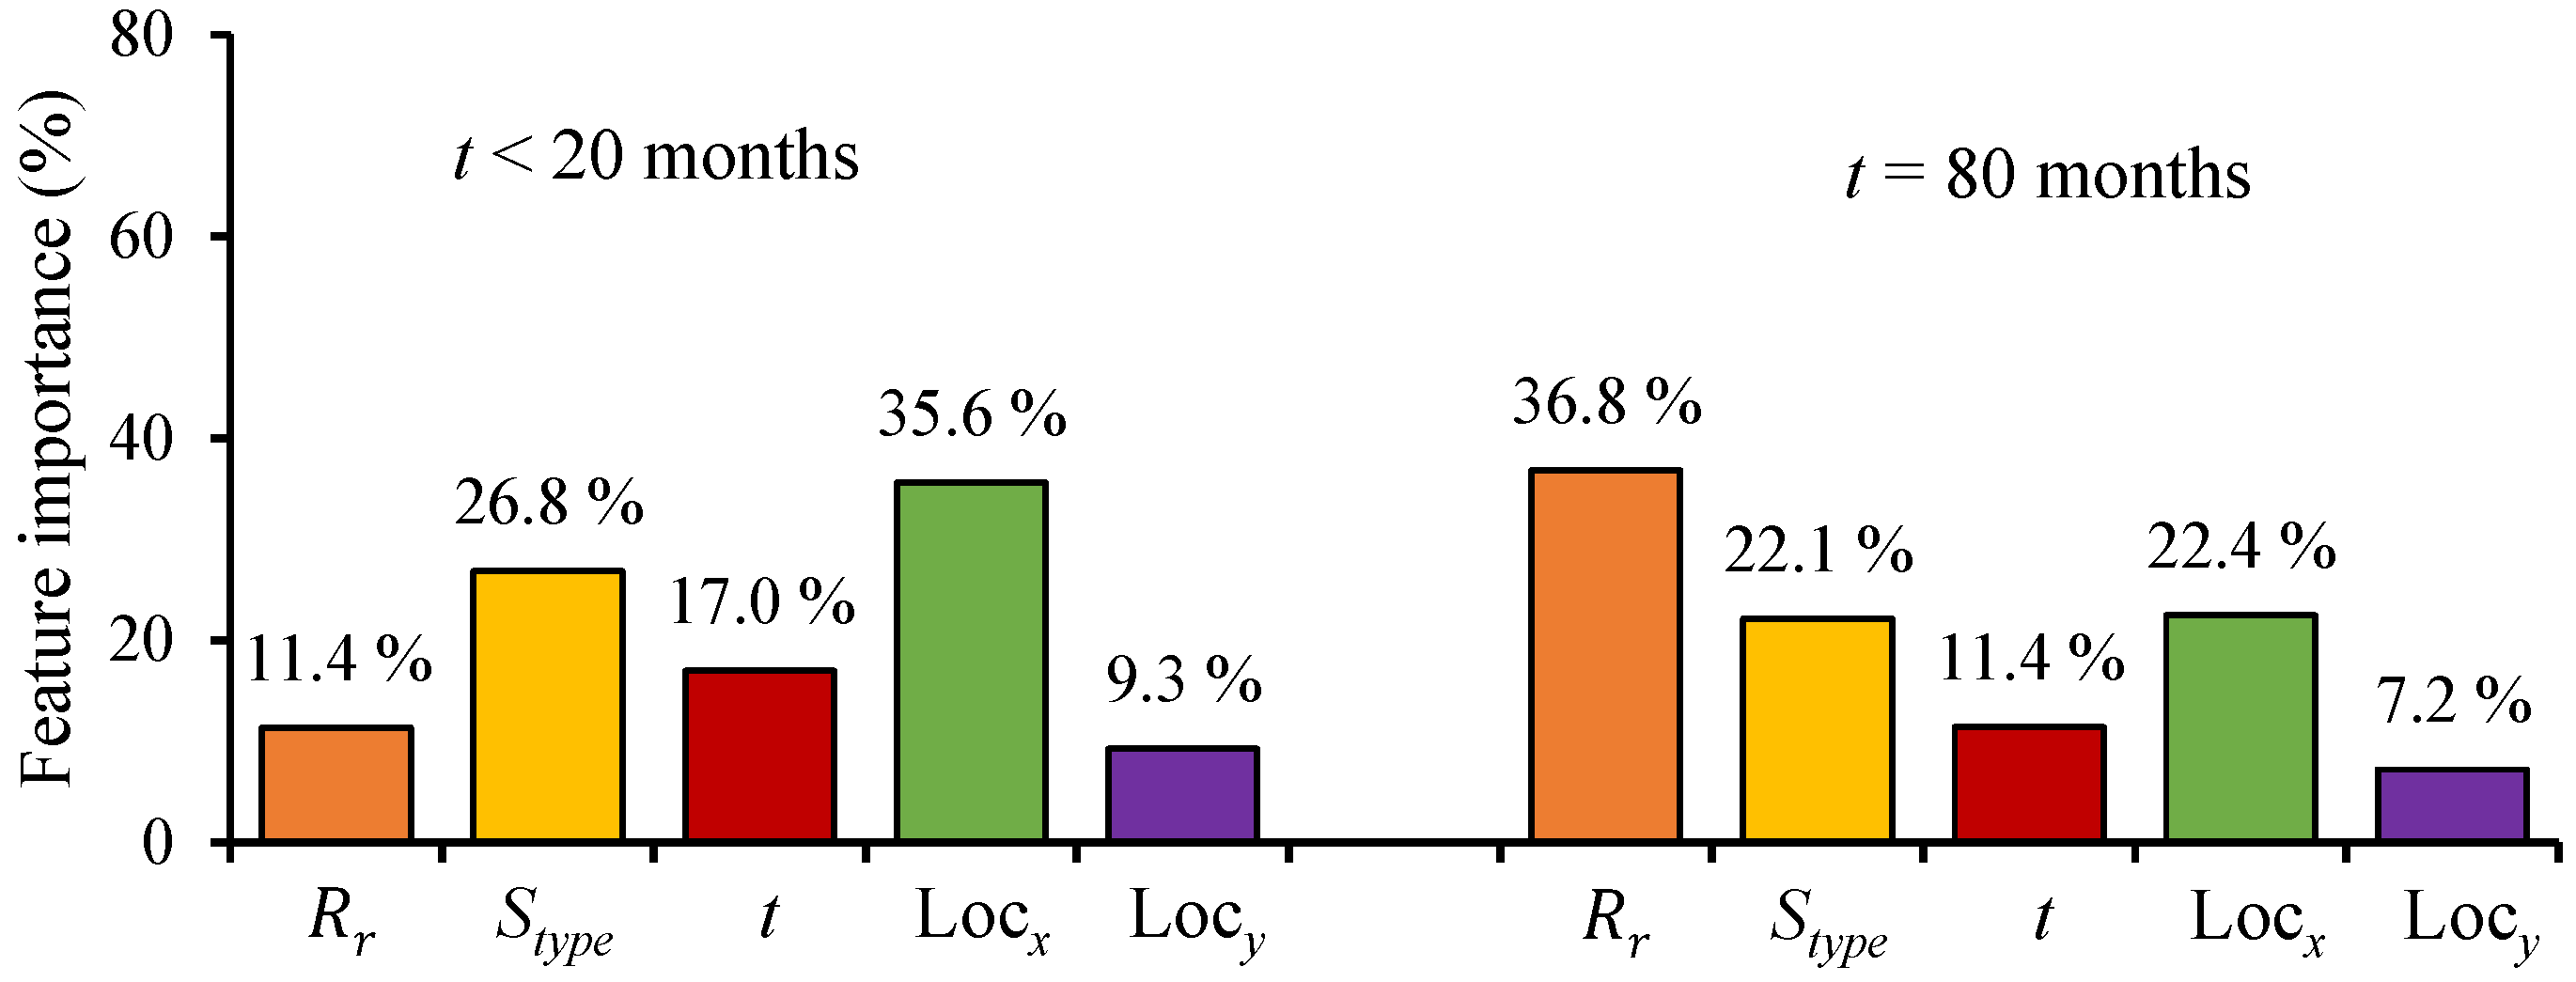
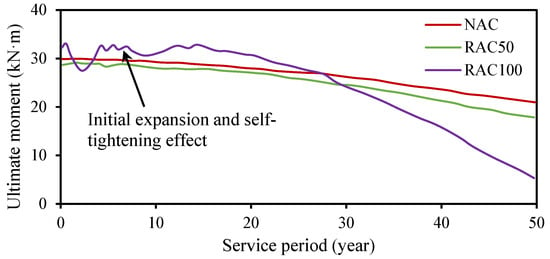
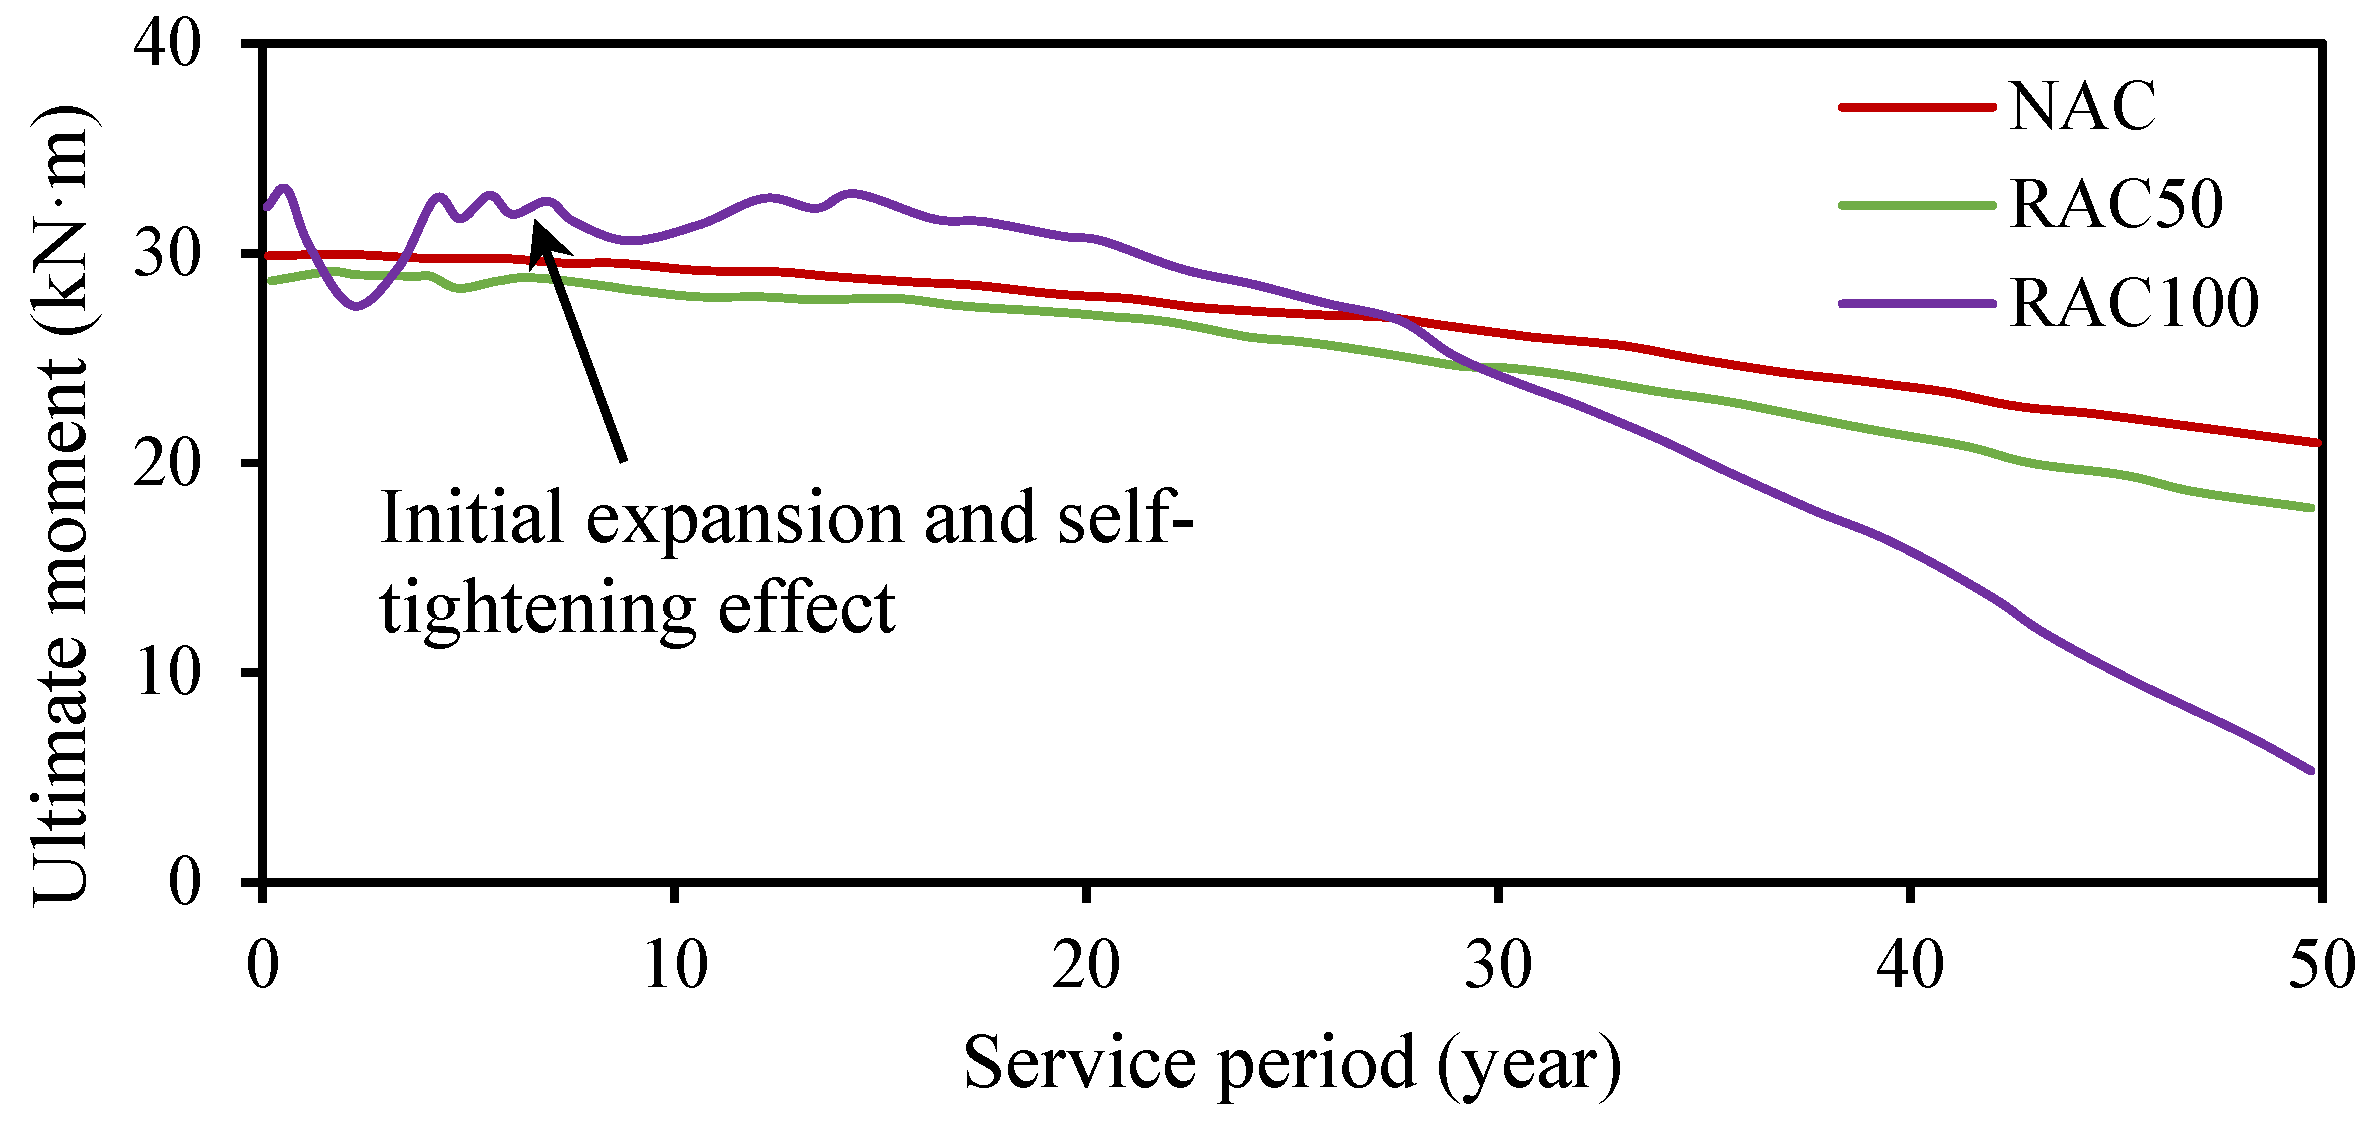
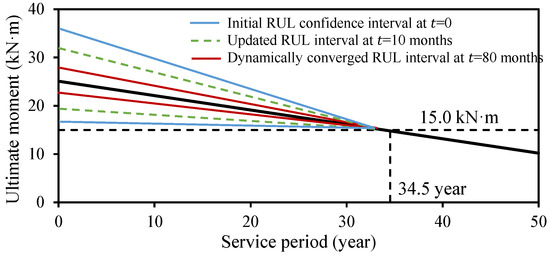
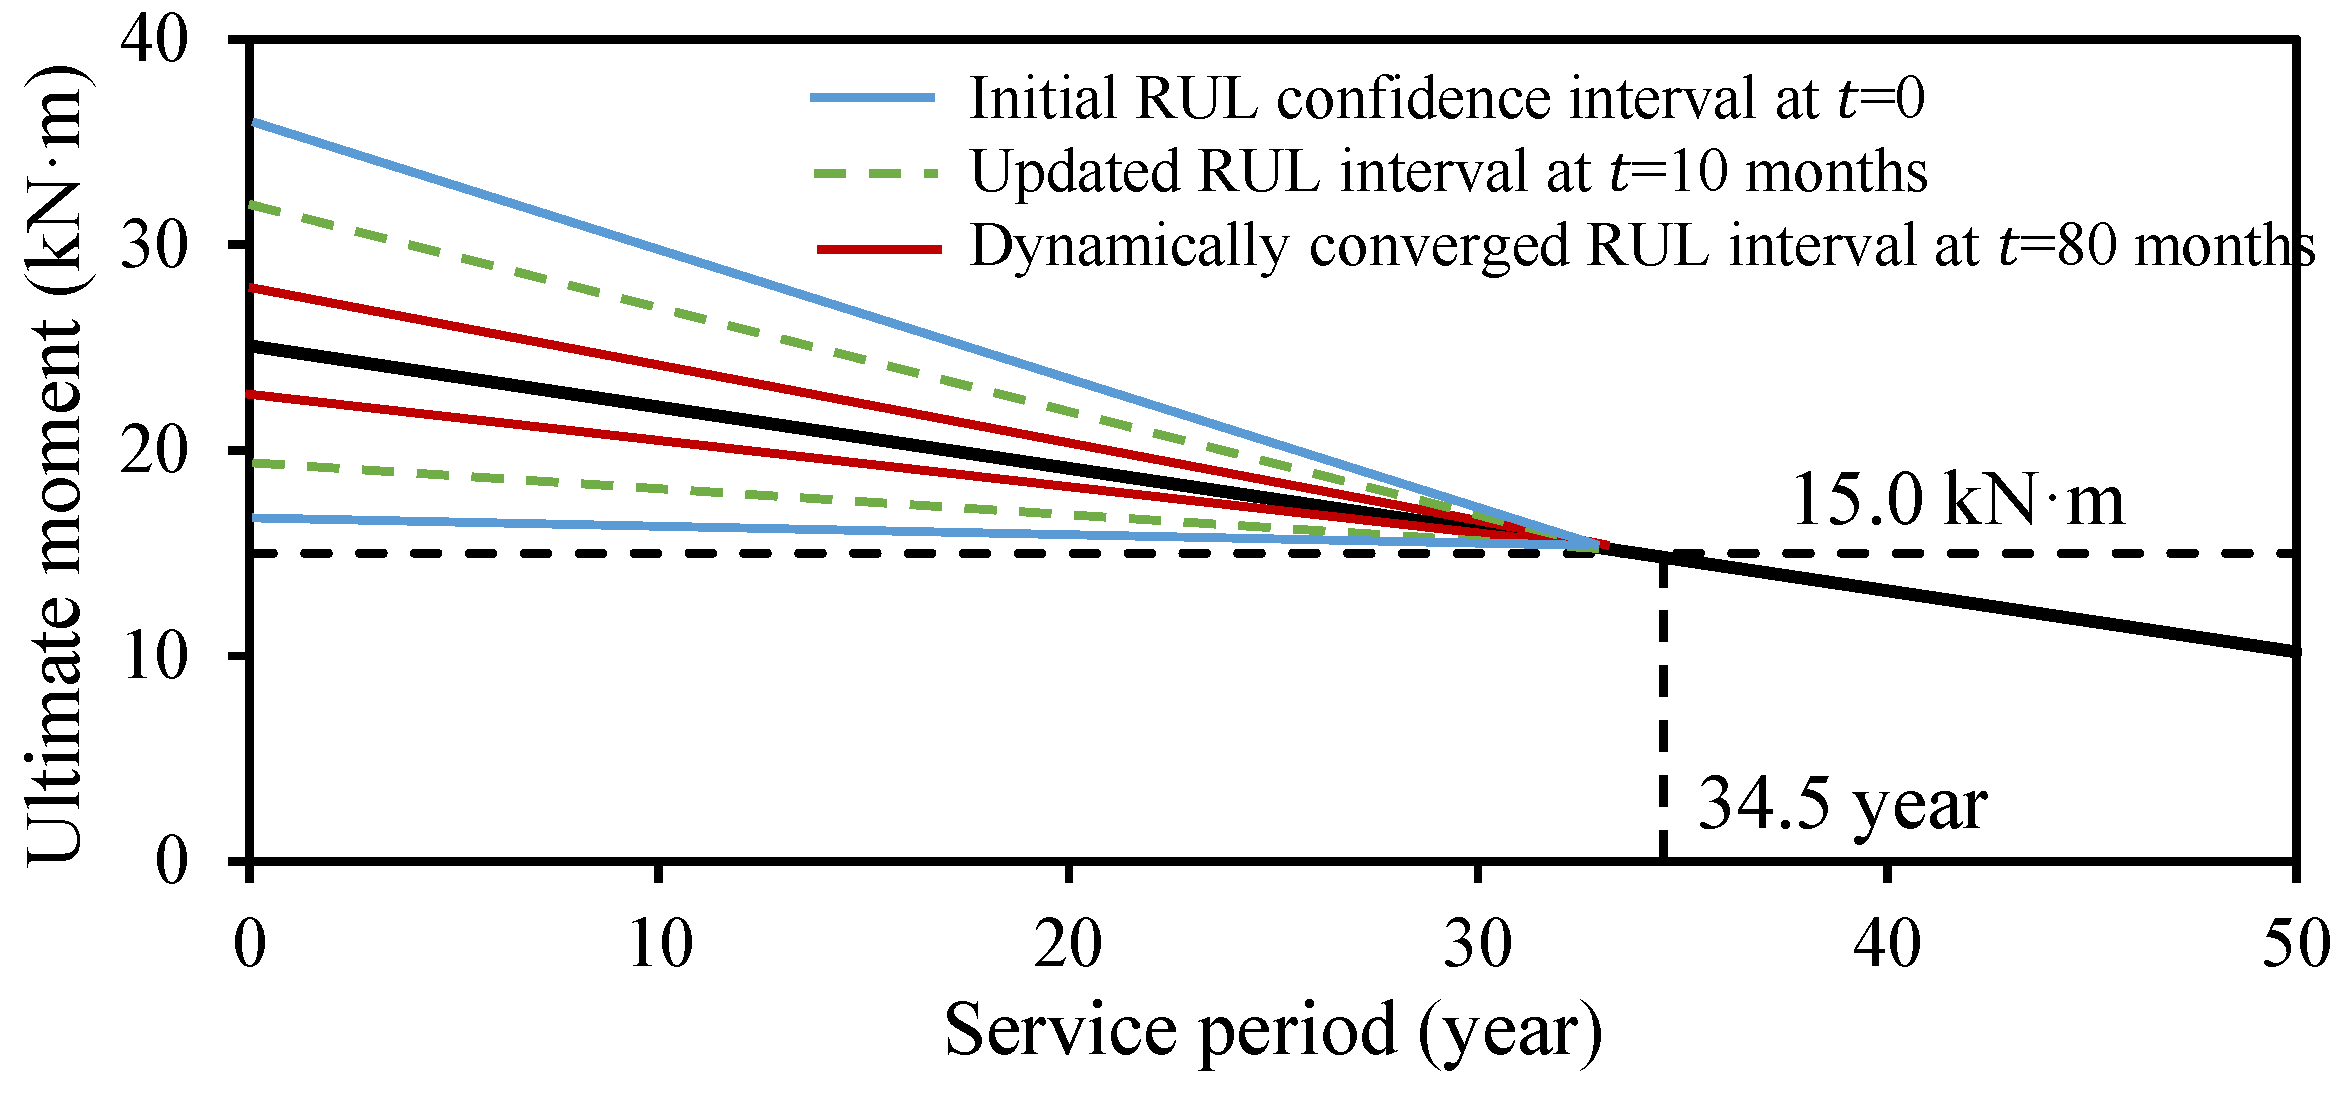

Disclaimer/Publisher’s Note: The statements, opinions and data contained in all publications are solely those of the individual author(s) and contributor(s) and not of MDPI and/or the editor(s). MDPI and/or the editor(s) disclaim responsibility for any injury to people or property resulting from any ideas, methods, instructions or products referred to in the content. |
© 2026 by the authors. Licensee MDPI, Basel, Switzerland. This article is an open access article distributed under the terms and conditions of the Creative Commons Attribution (CC BY) license.