


Abstract
Background and Objectives: Observational comparisons of laparoscopic and open colorectal resection are vulnerable to confounding by indication because fitter patients with earlier disease are preferentially offered the minimally invasive approach. Using a single-centre cohort as a worked example, we quantified how far the apparent laparoscopic advantage changed under progressively stricter control for measured confounding. Materials and Methods: In total, 89 adults undergoing elective resection for rectal or rectosigmoid adenocarcinoma were analysed by initiated approach (laparoscopic strategy, n = 61, of whom 19 were converted; planned open, n = 28) and, as a sensitivity analysis, by approach completed (laparoscopic, n = 42; open, n = 47). The primary outcome was major morbidity (Clavien–Dindo ≥ IIIa within 30 days); secondary outcomes were a 90-day textbook outcome and all-cause mortality, analysed with Kaplan–Meier and Cox methods (median follow-up 6 months, interquartile range 2–9). Approach effects were estimated as crude, Firth-penalised covariate-adjusted, stabilised inverse-probability-weighted, overlap-weighted, and doubly robust odds ratios, with balance quantified by standardised mean differences and sensitivity to unmeasured confounding by E-values. Results: Patients who completed laparoscopy were younger, less comorbid, and less often node-positive; baseline characteristics predicted the completed approach with a c-statistic of 0.83 (optimism-corrected 0.77). No patient died within 90 days. By initiated approach, major morbidity was 24.6% vs. 39.3% (crude odds ratio 0.50, 95% confidence interval 0.19–1.31; overlap-weighted 0.90, 0.30–2.70), and the 90-day textbook outcome was 41.0% vs. 42.9% (0.93, 0.37–2.29). By completed approach, the crude odds ratio for major morbidity was 0.17 (0.06–0.50), the Firth-adjusted 0.36 (0.11–1.14), and the overlap-weighted 0.96 (0.33–2.80); the crude mortality hazard ratio of 0.24 (0.07–0.83) became 1.06 (0.30–3.78) after weighting, with one influential patient. Inverse probability weighting left seven of nine covariates above a standardised difference of 0.10; overlap weighting balanced means by construction at the cost of a smaller target population. Conclusions: In this small cohort, the associations between approach and outcome changed substantially after adjustment and weighting, but the adjusted estimates remained imprecise and vulnerable to residual and unmeasured confounding, so neither a benefit nor its absence can be inferred. Observational comparisons of surgical approach should define exposure by initiated approach, report the balance actually achieved, and present sensitivity analyses before any superiority claim.
1. Introduction
Since its introduction for malignant disease, the laparoscopic approach to colorectal resection has been scrutinised for its ability to reduce surgical trauma without compromising oncological adequacy [1]. Early concerns about port-site recurrence and the completeness of clearance through small incisions shaped a generation of randomised trials designed to establish non-inferiority [2]. For colon cancer, the evidence matured favourably: landmark trials demonstrated equivalent disease-free and overall survival with shorter hospital stay and less short-term morbidity [3], and the results proved durable at 10 years [4].
The rectum proved more contentious. The confined pelvis, the imperative of total mesorectal excision, and the proximity of the circumferential margin raise the cost of an incomplete dissection. The COREAN trial reported short-term recovery benefits and non-inferior survival after laparoscopic resection [5,6], whereas two large trials failed to establish non-inferiority for a composite pathological endpoint [7,8], injecting caution into enthusiastic adoption.
In routine practice, the choice of approach is rarely random. Population-based data show that laparoscopy is used less often in patients with advanced-stage disease, greater comorbidity, rectal tumours, and emergency presentation [9]. Any observational comparison of approaches therefore risks attributing to the technique what is in fact the imprint of patient selection. This phenomenon, confounding by indication, arises whenever the factors that determine treatment allocation also determine outcome, and it can inflate or manufacture an apparent treatment effect [10]. Composite quality metrics such as the textbook outcome, which aggregate several favourable endpoints into one patient-centred measure, are increasingly used to benchmark surgical performance [11,12] and are equally susceptible to this bias unless case mix is accounted for [13].
Small single-centre cohorts are the setting in which such comparisons are most often made and least often adjusted. Confounding by indication in surgical comparisons is well recognised; the contribution of the present study is therefore didactic rather than clinical. It is offered as a worked example in which a familiar bias is traced step by step in a cohort of the size and type in which such comparisons are usually made: we do not attempt to estimate the true effect of laparoscopy, which randomised trials have already addressed, but to make the confounding visible and to show which analytical choices, including the definition of the exposure and the handling of follow-up, change the apparent result. In a single-centre cohort of patients undergoing resection for rectal and rectosigmoid adenocarcinoma, we compare open and laparoscopic approaches across oncological, morbidity, and survival domains and then measure, step by step, how far the apparent laparoscopic advantage persists under covariate adjustment, propensity score weighting, and quantitative sensitivity analysis. We report the balance actually achieved, including where it was inadequate, and interpret the attenuation of the estimates, rather than any single adjusted value, as the primary result. We hypothesised that the crude laparoscopic associations would change substantially under these procedures.
2. Materials and Methods
2.1. Study Design and Population
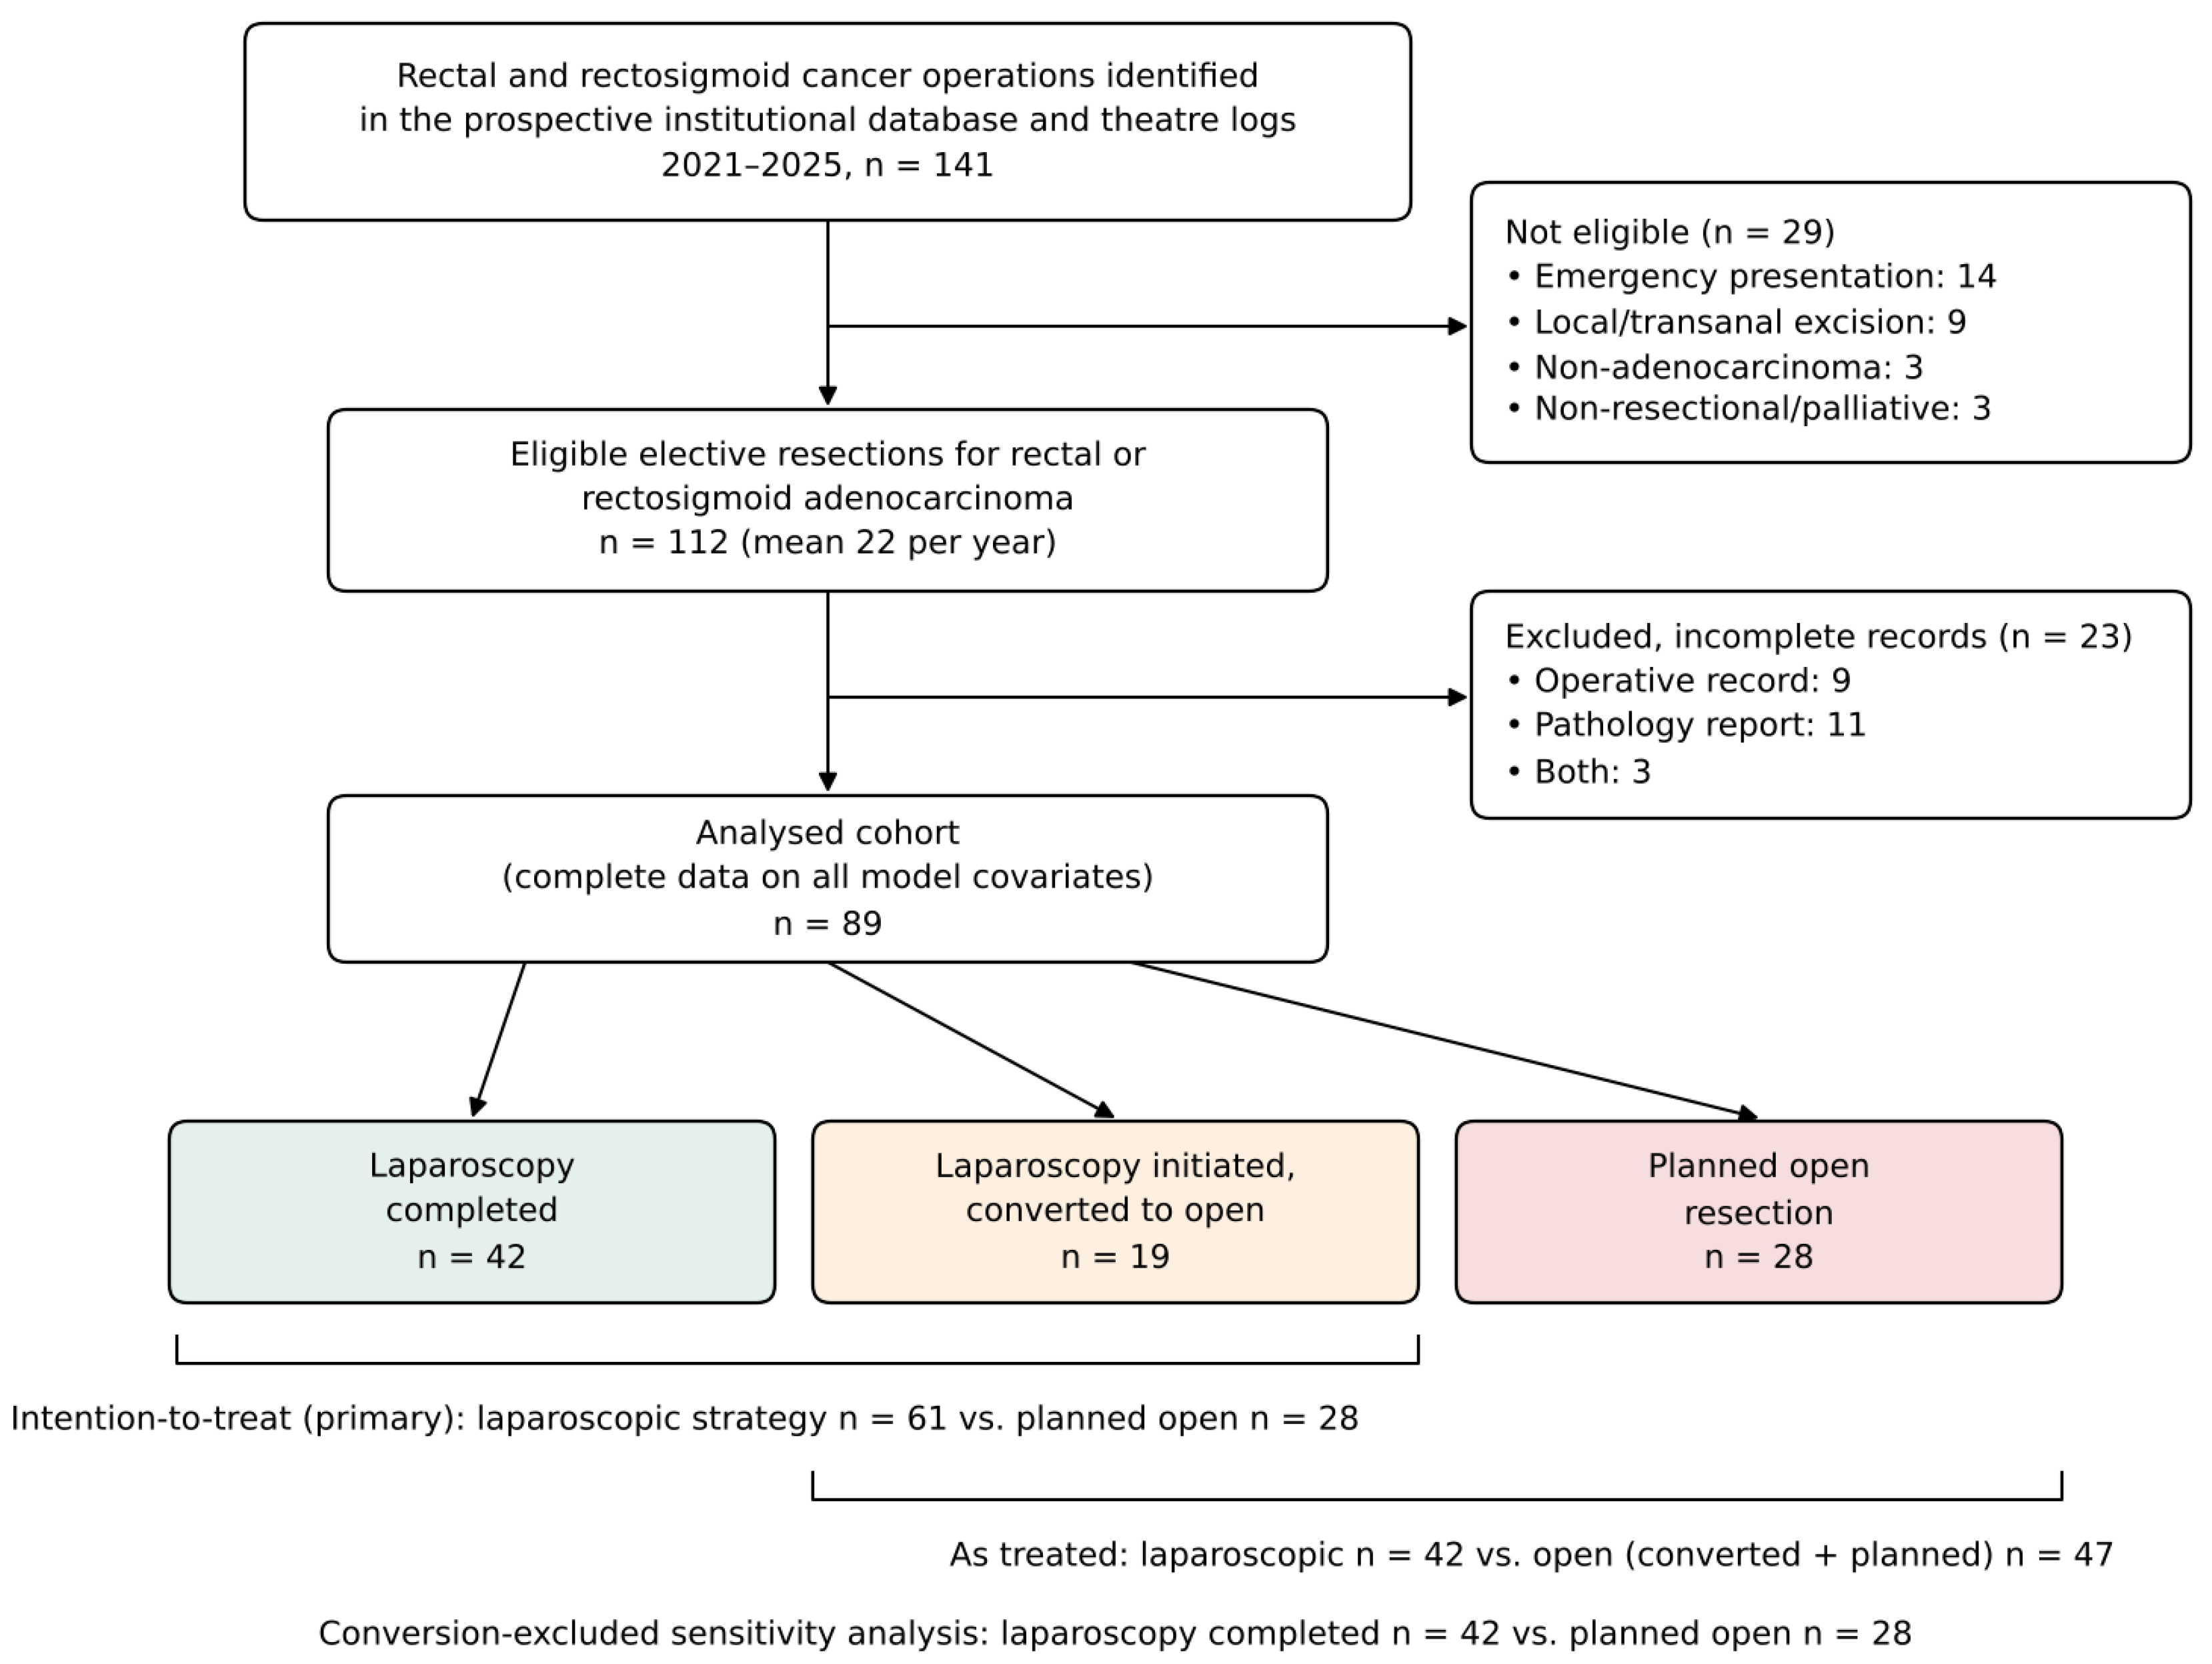
We performed a retrospective analysis of a prospectively maintained institutional database at a single tertiary referral centre, reported in accordance with the STROBE recommendations for observational studies [14]. The unit performs approximately 110–130 colorectal cancer resections per year, of which rectal and rectosigmoid resections account for roughly 28, including emergency cases. All adults who underwent elective oncological resection for histologically confirmed rectal or rectosigmoid adenocarcinoma between 1 January 2021 and 31 December 2025 were eligible. The series is consecutive: 141 rectal and rectosigmoid cancer operations were identified in the database and cross-checked against operating-theatre logs; 29 were ineligible (14 emergency presentations, nine local or transanal excisions, three non-adenocarcinoma histologies, and three non-resectional or palliative procedures), leaving 112 eligible elective resections (mean 22 per year). In total, 23 patients (20.5%) were excluded because the operative record (n = 9), the pathology report (n = 11), or both (n = 3) were incomplete, leaving 89 patients with complete data on every model covariate (Figure A1). Excluded patients did not differ materially from the analysed cohort in age (mean 69.2 vs. 68.4 years) or in the proportion treated laparoscopically (43.5% vs. 47.2%). All cases were discussed at a multidisciplinary tumour board. The surgical approach was chosen by the operating surgeon on the basis of tumour and patient characteristics, institutional expertise, and patient preference; no protocol dictated allocation, reproducing the conditions under which confounding by indication arises.
Laparoscopy was initiated in 61 patients (conventional and coloperineal laparoscopic procedures) and completed in 42; 19 procedures (31.1% of those initiated) were converted to open surgery. In total, 28 patients underwent planned open resection. The conversion rate was high because laparoscopic rectal surgery was being adopted during the study period in a population with a large proportion of low, bulky, irradiated tumours, and it fell from 54.5% (6 of 11 initiated procedures) in 2021 to 8.3% (1 of 12) in 2025. The reason for each conversion was recorded prospectively in the operative note. Because conversion is an intra-operative event that depends on the tumour and the patient, the primary exposure contrast is the initiated approach (laparoscopic strategy, n = 61, including converted procedures, vs. planned open, n = 28), which is the comparison that corresponds to the decision made before the operation. The comparison by approach completed (laparoscopic, n = 42, vs. open, n = 47, the latter comprising 19 converted and 28 planned open procedures), which was the basis of the original analysis and most clearly displays the selection that is the object of study, is retained as a secondary, as-treated analysis, and a conversion-excluded comparison (42 vs. 28) is reported as a further sensitivity analysis. The three groups are described separately in Section 3.8. Because allocation was clinically driven, systematic baseline differences between the groups were anticipated; their existence is the object of study rather than a nuisance to be hidden. Before the present revision, the complete dataset, every table, every figure, and every model output were re-audited against the source records; the corrections that resulted (Section 2.5) are confined to the complication and nodal-count variables and did not alter any model estimate. The study adhered to the Declaration of Helsinki and to institutional data governance requirements for de-identified retrospective research (ethics approval details are given in the Institutional Review Board Statement).
2.2. Variables and Outcome Definitions
The source and timing of ascertainment of every variable are listed in Table A2 (Appendix B). Baseline variables, all recorded at the pre-operative anaesthetic and surgical assessment, were age, sex, body mass index, Charlson comorbidity index, Eastern Cooperative Oncology Group (ECOG) performance status, smoking status, documented weight loss, and carcinoembryonic antigen category. The Charlson index was the age-adjusted version, which assigns 2 points for the index tumour (6 if metastatic) and 1 point per decade above 40 years; because age and tumour characteristics were adjusted for separately, a sensitivity analysis used the core comorbidity count without the age and tumour components. Tumour variables were location (rectal or rectosigmoid), height of the lower edge above the anal verge on rigid proctoscopy and magnetic resonance imaging (low, ≤5 cm; mid, >5–10 cm; upper, >10 cm; rectosigmoid), maximal diameter, pre-operative clinical T and N category from pelvic magnetic resonance and computed tomography, biopsy histological grade, and the pathological tumour–node–metastasis category, lymphovascular invasion, and resection-specimen grade according to the eighth edition of the American Joint Committee on Cancer Manual [15]. In the 60 patients who received neoadjuvant chemoradiotherapy, the pathological category is the post-treatment ypTNM category; “pT3–T4” and “pN+” in this report therefore denote (y)pT and (y)pN. Receipt of neoadjuvant chemoradiotherapy, the planned procedure (anterior resection with partial mesorectal excision, low anterior resection with total mesorectal excision, and abdominoperineal resection or Hartmann procedure), the operating surgeon (three consultant colorectal surgeons), and the calendar year of surgery were recorded, as were formation of an anastomosis, construction of a diverting stoma, and the level of vascular ligation. Total mesorectal excision was performed for mid and low rectal tumours and tumour-specific partial mesorectal excision, with at least 5 cm of distal mesorectal clearance, for upper rectal and rectosigmoid tumours; mesorectal completeness was graded on the resected mesorectum in both cases according to the plane of surgery [16]. Oncological quality of resection was described by mesorectal completeness, circumferential and distal margin status (a clear margin, R0, required a circumferential margin greater than 1 mm and a microscopically uninvolved distal margin), total nodal harvest, and the proportion of specimens with at least 12 nodes. Because nodal yield is reduced after chemoradiotherapy, attainment of the 12-node criterion is also reported by neoadjuvant status, and a sensitivity analysis waived the criterion in irradiated patients.
Perioperative outcomes were C-reactive protein and albumin measured on the morning of postoperative day 3, length of stay, antibiotic duration, intraoperative complications, postoperative complications graded by the Clavien–Dindo classification [17] within 30 days of surgery or during the index admission if longer, anastomotic leak, and reintervention. Anastomotic leak was defined according to the International Study Group of Rectal Cancer [18] (grades A–C, within 30 days), and its rate is reported with patients who had an anastomosis as the denominator; reintervention was any surgical, endoscopic, or radiological intervention under general anaesthesia within 30 days. Major morbidity, the primary outcome, was defined as any Clavien–Dindo grade IIIa or higher complication within 30 days; the highest grade per patient is reported, with uncomplicated patients recorded as a separate category. Follow-up was ascertained from the surgical outpatient clinic, the oncology day unit, and readmission records of the institution; the database was closed on 31 December 2025. Vital status at 90 days was confirmed for every patient by a records check supplemented by telephone contact, which is part of the unit’s quality protocol, so that 90-day mortality is complete even for the 28 patients (16 laparoscopic, 12 open) whose clinical follow-up ended before 90 days; no patient was lost before 90 days. Beyond 90 days, patients were censored at the last documented contact; the median observed follow-up was 6 months (interquartile range 2–9 months; reverse Kaplan–Meier median 7.3 months) was shorter in the laparoscopic group (5.8 vs. 8.2 months) because laparoscopy was adopted progressively over the study period. Mortality is reported as 90-day mortality, the endpoint against which population benchmarks are set [19], and as all-cause mortality analysed as a time-to-event outcome with Kaplan–Meier estimates at a common horizon of 6 and 9 months and Cox models (Section 2.5); the binary all-cause mortality used in the original submission is retained only as a descriptive summary because unequal follow-up makes it uninterpretable as a comparison. Cause of death was not adjudicated, and all deaths are therefore reported as all-cause deaths. Metastatic recurrence was defined as radiologically or histologically confirmed new distant disease during follow-up in patients without distant metastasis at baseline (M0, n = 86); the three patients with synchronous resectable liver metastases at presentation (two laparoscopic, one open) were excluded from the recurrence analysis.
The composite textbook outcome was defined over a common 90-day postoperative period and required the simultaneous achievement of no major complication and no reintervention within 30 days, survival to 90 days, a clear resection margin (R0 as defined above), an adequate nodal harvest (at least 12 nodes), and a non-prolonged length of stay (at or below the seventy-fifth percentile of the study cohort, 14 days), following established definitions for colorectal surgery [11]. No component was missing for any of the 89 patients because incomplete records had been excluded at cohort assembly. The definition used in the original submission, in which the survival component was survival to the end of individual follow-up and which therefore depended on the length of observation and incorporated late death, is retained only as a sensitivity analysis and is labelled “textbook outcome, original definition” wherever it appears.
2.3. Exposure, Confounders, and Analytic Strategy
The exposure of interest was the laparoscopic approach, with open surgery as the reference, defined primarily by the approach initiated (intention to treat) and secondarily by the approach completed (as treated; Section 2.1). The primary outcome was major postoperative morbidity; the 90-day textbook outcome and all-cause mortality were secondary outcomes. Because no patient died within 90 days, mortality in this cohort reflects disease burden rather than operative safety, and it is analysed with time-to-event methods and interpreted descriptively. Candidate confounders were specified a priori on clinical grounds as variables that plausibly influence both the choice of approach and outcome: age, Charlson index, performance status, body mass index, tumour location, advanced T category, nodal positivity, histological grade, and receipt of neoadjuvant therapy. Three of these (T category, nodal status, and grade) were taken from the resection specimen in the original analysis. These pathological measures are not available when the approach is chosen; they were used as the most reliably recorded proxies for the pre-operative tumour burden that guides the surgeon (agreement with the pre-operative clinical T category, clinical N category, and biopsy grade was 82%, 80%, and 84%, respectively), and they are retained in the main model because misclassification of the clinical categories would otherwise leave part of the selection unmodelled. This choice is tested in a sensitivity analysis in which the propensity model uses only information available before surgery (age, Charlson index, performance status, body mass index, tumour location, clinical T3–T4 category, clinical nodal positivity, biopsy grade, and neoadjuvant therapy), and in a further model, that adds tumour height, operating surgeon, and calendar year, which are determinants of selection in their own right. Variables recorded after the operation that lie on the causal pathway (margin status, nodal harvest, inflammatory markers, and conversion) were treated as outcomes or mediators and never as adjustment variables.
The analysis was designed as a graded sequence. Crude estimates were followed by covariate-adjusted estimates and then by propensity-score-weighted estimates, so that the change in the approach–outcome association at each step could be examined. Because covariate-adjusted logistic regression yields conditional odds ratios whereas weighting yields marginal ones and because the odds ratio is not collapsible, the change between steps is not by itself a quantitative measure of confounding; all estimators were therefore also expressed on a common marginal risk-ratio scale (Section 2.4). This graded comparison, rather than any single adjusted estimate, is the primary output of the study. As a secondary analysis, the comparison was repeated within the rectal stratum, which contained 71 of the 89 patients; the rectosigmoid stratum (13 laparoscopic, 5 open) was too small to test and is reported descriptively. The discrimination of postoperative inflammatory markers for major morbidity within each approach was examined as an exploratory analysis and is reported in Appendix A.
2.4. Propensity Score Weighting and Sensitivity Analyses
A propensity score for receipt of the laparoscopic approach was estimated by logistic regression on the nine covariates listed above [20,21], with performance status entered as an ordinal score in the main model and as a categorical variable (0, 1, and ≥2) in a sensitivity analysis. The discrimination of this model, expressed as a c-statistic, describes how well baseline characteristics predict allocation; it does not quantify confounding or the proportion of an outcome difference that selection explains, but a high value indicates that the groups were far from exchangeable. Optimism of the c-statistic was estimated by bootstrap (200 resamples) [22] and collinearity among covariates by variance inflation factors. Separate propensity models were fitted for each exposure definition (initiated, completed, and conversion-excluded) and for each sensitivity set of covariates, and balance and weight diagnostics are reported for every one of them (Table A3). The distribution of the score in each group was inspected to define the region of common support, defined by the overlap of the group-specific score ranges (min–max criterion).
Two weighting schemes were applied. Stabilised inverse probability of treatment weights, w = P(A = a)/P(A = a|X), where A is the approach received and X is the covariate vector, target the average effect in the whole cohort (the population of all 89 patients as treated). Overlap weights, w = 1 − e(X) for laparoscopic and w = e(X) for open patients, where e(X) is the propensity score, target the population of patients in clinical equipoise, in whom either approach was a realistic option; they are bounded, achieve exact balance of covariate means by construction, and down-weight patients at the extremes of the score [23,24]. For each scheme, the distribution of the weights (median, interquartile range, minimum, and maximum), the effective sample size (Kish’s formula, (Σw)2/Σw2) in each group, and the weighted frequency of each outcome are reported, together with covariate balance before and after weighting quantified by absolute standardised mean differences (SMD), with values below 0.10 regarded as adequate balance and values above 0.25 as substantial imbalance [25]. Weighted odds ratios were estimated with robust (sandwich) standard errors. A doubly robust estimate was obtained by fitting the covariate-adjusted outcome model within the inverse-probability-weighted sample [26]. Prespecified sensitivity analyses examined the stability of the weighted estimates: truncation of weights at the ninety-ninth percentile, restriction to the region of common support, and, because one laparoscopic patient who died carried the largest weight, omission of that patient (leave-one-out). Because balance after inverse probability weighting was incomplete (Section 3.5), those estimates are interpreted as partially deconfounded comparisons and not as causal effect estimates.
Sensitivity to unmeasured confounding was quantified with E-values, which express the minimum association, on the risk-ratio scale that an unmeasured confounder would need to have with both the approach and the outcome, conditional on the measured covariates, to explain the observed estimate away [27,28]. The E-value describes the strength of confounding that would be required; it does not measure the confounding actually present. To make the comparison with the measured covariates interpretable on the same scale, the exposure–confounder association was expressed as the prevalence ratio of the covariate between the open and laparoscopic groups and the confounder–outcome association as the risk ratio for the outcome between patients with and without the covariate, and the bias factor implied by each covariate was computed as RR_EU × RR_UD/(RR_EU + RR_UD − 1). For the crude comparisons, the risk ratio was computed directly from the two-by-two table; for the adjusted and weighted models, which yield odds ratios for common outcomes (incidence 22–35%), the odds ratio was converted to an approximate risk ratio by the square root transformation before the E-value was derived. Where a confidence interval already includes the null, the E-value for the limit is by definition 1 and is reported as not applicable rather than as a computed value.
2.5. Statistical Analysis
Distributional assumptions were assessed with the Shapiro–Wilk test. Normally distributed continuous variables were compared with the Student t-test, or the Welch variant when the Levene test indicated unequal variances, and are reported as mean and standard deviation; non-normal variables were compared with the Mann–Whitney U test and are reported as median and interquartile range. Because of the small sample and several sparse cells, all categorical variables were compared with Fisher’s exact test. Baseline tables additionally report the absolute SMD for every characteristic, which, unlike a p-value, describes the magnitude of imbalance independently of sample size. Missing values (carcinoembryonic antigen, n = 64 available; lymphovascular invasion, n = 78) were handled by available-case analysis, and the denominators are given; neither variable entered any model, and all model covariates were complete for the 89 patients. In the audit performed for this revision, two errors were identified and corrected: the “any postoperative complication” row of the perioperative table had been populated from an earlier, incomplete version of the complication register and understated the counts, and the median number of positive nodes in the open group had been computed among node-positive patients only; the Clavien–Dindo figure had also allocated uncomplicated patients to grade I. The corrected values are given in Section 3.2 and Section 3.3; no model used these variables, and no estimate changed. In a random 20% sample of patients (n = 18), all model covariates were re-abstracted from source records and agreed with the database except for one ECOG score.
Crude odds ratios were computed from the two-by-two tables, with a Haldane–Anscombe correction of 0.5 when a cell was empty. Multivariable logistic regression estimated covariate-adjusted odds ratios. The number of events per outcome (26 major complications, 20 deaths, 31 textbook outcomes under the original definition, and 37 under the 90-day definition) constrained each model to three or four covariates in addition to the exposure in order to keep the events-per-variable ratio at or above five, the lower bound below which simulation studies show that bias and coverage deteriorate [29,30]; the adjustment set for each outcome was fixed a priori from the confounder list and is stated in the table footnotes. Because this ratio lies below the conventional 10 [29], every adjusted model was also fitted by Firth penalised likelihood with profile-likelihood confidence intervals [31,32], which is the estimate presented in the revised tables; the maximum-likelihood estimates of the original submission are retained in Section 3.6 for comparison. To place crude, adjusted, and weighted estimates on a common estimand and scale, marginal risk ratios were obtained for the whole cohort by model-based standardisation (g-computation) from the adjusted models and directly from the weighted samples, with bootstrap confidence intervals (300 resamples). All-cause mortality and recurrence were analysed as time-to-event outcomes from the date of surgery with Kaplan–Meier estimates (log-log confidence intervals), the log-rank test, and Cox proportional-hazards models (crude, covariate-adjusted for age, Charlson index and nodal positivity, and weighted with robust standard errors); estimates are reported at 6 and 9 months, and not at 12 months, because fewer than five patients per group remained at risk beyond 10 months.
A post hoc precision analysis was performed to make the limits of the sample explicit in terms of the minimum detectable effect. With 42 and 47 patients, a two-sided α of 0.05 and 80% power, the smallest detectable differences were a reduction in major morbidity from 45% to 18% (odds ratio ≈ 0.27), a reduction in all-cause mortality from 36% to 11% (≈0.22), and an increase in textbook outcome from 26% to 55% (≈3.5); for the intention-to-treat contrast (61 vs. 28), the minimum detectable reduction in major morbidity was from 39% to 14%. Smaller effects of clinical relevance cannot be excluded by any analysis in this cohort. Two-sided p-values below 0.05 were regarded as statistically significant, and no correction for multiplicity was applied because the secondary and stratified analyses are explicitly exploratory. Analyses used Python 3 (version 3.12; Python Software Foundation, Wilmington, DE, USA) with the pandas (version 2.2), SciPy (version 1.13), statsmodels (version 0.14), and scikit-learn (version 1.5) libraries. The complete analysis script, with the specification of every model (Appendix B.4), is available from the corresponding authors on request.
3. Results
3.1. Baseline and Tumour Characteristics
Baseline characteristics of the two groups are presented in Table 1. Laparoscopic patients were younger (65.7 vs. 70.9 years, p = 0.005) and less comorbid (median Charlson index 5 vs. 6, p < 0.001) and had better performance status (median ECOG 0 vs. 1, p < 0.001); the standardised differences for these three variables (0.61, 0.75, and 1.05) all exceeded the 0.25 threshold for substantial imbalance. Body mass index and sex were balanced. Recorded current smoking was far more frequent in the laparoscopic group (28.6% vs. 2.1%). On re-abstraction, smoking status was explicitly documented in the admission note of every laparoscopic patient but of only 48% of open patients, the remainder having been coded as non-smokers by default; the variable therefore reflects documentation rather than biology, and it was excluded from the propensity model (a model that included it is reported in Table A3). The other abstracted variables did not show this pattern: in the 20% audit sample, every model covariate agreed with the source records except one ECOG score. Rectal (as opposed to rectosigmoid) location was more frequent in the open group (89.4% vs. 69.0%, p = 0.033), as were low tumours within 5 cm of the anal verge (42.6% vs. 16.7%, p = 0.011; SMD 0.59). Pre-operative clinical staging showed the same gradient as the pathological staging but with smaller differences: clinical T3–T4 category 54.8% vs. 68.1% (SMD 0.28), clinical nodal positivity 28.6% vs. 46.8% (SMD 0.38), and poorly differentiated biopsy grade 9.5% vs. 23.4% (SMD 0.38).
Table 1.
Baseline characteristics by surgical approach.
Tumour characteristics are summarised in Table 2. Tumour size did not differ, but every marker of biological aggressiveness was concentrated in the open group: poorly differentiated histology (27.7% vs. 7.1%, p = 0.014), pT3–T4 category (78.7% vs. 52.4%, p = 0.013), nodal involvement (44.7% vs. 11.9%, p = 0.001), and lymphovascular invasion (48.8% vs. 17.1%, p = 0.004), with standardised differences of 0.56 to 0.78. Distant metastasis, mucinous histology, and the level of vascular ligation did not differ. Taken together, Table 1 and Table 2 describe an open group that was older, frailer, and carried more advanced, more aggressive tumours; these differences precede the operation and are the substrate of confounding by indication.
Table 2.
Tumour and disease characteristics by surgical approach.
3.2. Oncological Quality of Resection
Pathological quality metrics are reported in Table 3. Total nodal harvest (median 12.5 vs. 12, p = 0.947) and the proportion of specimens with an adequate yield (59.5% vs. 53.2%, p = 0.669) did not differ, whereas the number of positive nodes was lower after laparoscopy (median 0 in both groups, interquartile range 0–0 vs. 0–2, p = 0.001; among node-positive patients, median 2 vs. 3), in keeping with the 11.9% and 44.7% nodal positivity in Table 2. The 12-node criterion was attained by 33 of 60 patients (55.0%) who had received neoadjuvant chemoradiotherapy and 17 of 29 (58.6%) who had not (p = 0.82). Total mesorectal excision was performed in 21 laparoscopic and 35 open patients (50.0% vs. 74.5%, p = 0.027) and partial mesorectal excision for upper rectal and rectosigmoid tumours in the remainder; mesorectal grading refers to the mesorectum actually resected. Complete mesorectal excision was more frequent after laparoscopy (92.9% vs. 74.5%, p = 0.025), and margin involvement was less frequent (4.8% vs. 29.8%, p = 0.002). Because margin status and mesorectal completeness depend heavily on tumour stage and fixity, these differences cannot be attributed to the approach without adjustment and were not modelled further.
Table 3.
Oncological quality of resection by surgical approach.
3.3. Perioperative Morbidity and Recovery
Perioperative outcomes are shown in Table 4. Length of stay (median 9 vs. 12 days, p = 0.016), antibiotic exposure (5 vs. 7 days, p < 0.001), and postoperative C-reactive protein (79 vs. 198 mg/L, p < 0.001; Figure 1) were lower after laparoscopy, and albumin was better preserved (3.2 vs. 2.9 g/dL, p = 0.002). Any postoperative complication (33.3% vs. 74.5%, p < 0.001), major morbidity (11.9% vs. 44.7%, p = 0.001), and reintervention (2.4% vs. 17.0%, p = 0.032) were less frequent after laparoscopy. Haemoglobin drop and intraoperative complications did not differ. Among patients with an anastomosis (36 laparoscopic, 33 open), anastomotic leak occurred in 16.7% and 21.2% (p = 0.761), and a diverting stoma had been constructed in 66.7% and 75.8%; the leak comparison is imprecise (odds ratio 0.74, 95% confidence interval 0.22–2.49) and is compatible with a substantial difference in either direction. The full Clavien–Dindo distribution, with uncomplicated patients shown separately, is given in Figure 2 with the raw counts: the highest grade was IIIa or above in 5 of 42 (11.9%) laparoscopic and 21 of 47 (44.7%) open patients, and grade IV events occurred in 2 (4.8%) and 9 (19.1%), respectively.
Table 4.
Perioperative morbidity and recovery by surgical approach.
Figure 1.
Postoperative C-reactive protein by surgical approach. Box plots with superimposed individual observations; Mann–Whitney U test.
Figure 2.
Distribution of the highest Clavien–Dindo grade per patient by surgical approach, with uncomplicated patients shown as a separate category (corrected in revision; the original figure had allocated uncomplicated patients to grade I). Raw counts, laparoscopic (n = 42): no complication 28, grade I 2, II 7, IIIa 2, IIIb 1, IVa 1, IVb 1; open (n = 47): no complication 12, grade I 3, II 11, IIIa 8, IIIb 4, IVa 4, IVb 5.
3.4. Mortality, Recurrence, and Textbook Outcome
Mortality by time window, metastatic recurrence, and the composite textbook outcome are reported in Table 5. No patient in either group died within 90 days of surgery. In total, 3 laparoscopic and 12 open patients died between 3 and 9 months, and a further five open patients died after 9 months; the crude binary proportions (7.1% vs. 36.2%) are retained in Table 5 as a description only because observed follow-up was shorter in the laparoscopic group, and the time-to-event analysis is reported in Section 3.9. Among the 86 patients without distant metastasis at baseline, metastatic recurrence was recorded in 3 of 40 (7.5%) laparoscopic and 16 of 46 (34.8%) open patients (p = 0.003). All 20 deaths occurred after the third postoperative month in a cohort whose open group carried 45% nodal positivity and 35% recurrence. Cause of death was not adjudicated; this timing and association are compatible with, but do not establish, death from disease, and the deaths are analysed throughout as all-cause deaths. The 90-day textbook outcome was attained by 47.6% versus 36.2% of patients (p = 0.291; crude odds ratio 1.60, 0.69–3.75) and the original definition, which additionally required survival to the end of follow-up, by 45.2% versus 25.5% (p = 0.074). Figure 3 disaggregates the original composite: laparoscopy led on every component sensitive to fitness or stage, whereas the two approaches converged on adequate nodal yield (59.5% vs. 53.2%).
Table 5.
Mortality by time window, metastatic recurrence, and textbook outcome by surgical approach.
Figure 3.
Attainment of the individual components of the textbook outcome (original definition, with survival to the end of follow-up as a component) and of the full composite by surgical approach. Labels give the percentage and the number of patients attaining each component. The dashed line separates the individual components from the full composite.
The comparison restricted to rectal tumours (n = 71; Table 6) reproduced the crude as-treated pattern: lower major morbidity (13.8% vs. 50.0%, p = 0.002), lower all-cause mortality (6.9% vs. 40.5%, p = 0.002), higher textbook-outcome attainment (58.6% vs. 19.0%, p = 0.001), and, in this stratum only, a higher adequate nodal yield (75.9% vs. 47.6%, p = 0.027) after laparoscopy. The rectosigmoid stratum contained only five open patients and is reported descriptively in the table footnote; no inference is drawn from it.
Table 6.
Crude comparison of the approaches within the rectal stratum (n = 71).
3.5. The Allocation Model and Covariate Balance
The propensity model for allocation to the laparoscopic approach, and the balance achieved before and after weighting, are presented in Table 7. Baseline characteristics predicted the operation a patient received with a c-statistic of 0.825 (bootstrap optimism 0.055; optimism-corrected 0.77); performance status was the only covariate independently associated with allocation (odds ratio 0.15 per ECOG point, p = 0.008), although comorbidity approached significance. When performance status was entered as a categorical variable, the odds ratios were 0.28 (0.08–1.02) for ECOG 1 and 0.07 (0.01–0.42) for ECOG ≥ 2 relative to ECOG 0, the c-statistic was 0.83, and the weighted estimates were unchanged (Table A3). Variance inflation factors were below 1.4 for all covariates except age (2.5) and the Charlson index (2.7), which are collinear (r = 0.71) because the age-adjusted index contains age points; this, rather than collinearity with performance status, accounts for the counterintuitive conditional odds ratio for the Charlson index, and in the sensitivity model using the core comorbidity count, the odds ratio was 1.12 per point (p = 0.71) with a c-statistic of 0.81. Before weighting, seven of the nine covariates showed an absolute standardised difference above 0.25, the largest being performance status (1.05), nodal positivity (0.77), and comorbidity (0.75). The distributions of the scores were displaced but overlapping (Figure 4): the open group was concentrated at low scores, and the laparoscopic group spread across the range. The region of common support extended from 0.06 to 0.88 and contained 82 of the 89 patients.
Table 7.
Propensity model for allocation to the laparoscopic approach and covariate balance before and after inverse probability weighting.
Figure 4.
Distribution of the propensity score for laparoscopic allocation by surgical approach. The shaded band marks the region of common support (0.06–0.88; 82 of 89 patients).
Weighting reduced the mean absolute standardised difference from 0.56 to 0.15 and brought every covariate below the 0.25 threshold except tumour location (0.33), but it did not achieve conventional balance: only age (0.05) and body mass index (0.06) fell below 0.10, and seven covariates remained between 0.12 and 0.33 (Figure 5). Neoadjuvant therapy, which was nearly balanced at baseline, became slightly less balanced after weighting (0.13 to 0.19). Inverse probability weighting, therefore, removed most, but not all, of the measured imbalance, and the weighted estimates below must be read with this residual in mind. The weights themselves and the overlap-weighted balance are described in Section 3.10; overlap weights balanced all nine covariate means exactly at the cost of a smaller effective sample.
Figure 5.
Absolute standardised mean differences for each covariate before and after inverse probability weighting. The shaded band and dashed line mark the 0.10 threshold for adequate balance; the dotted line marks 0.25. Only age and body mass index met the 0.10 threshold after weighting.
3.6. Crude, Covariate-Adjusted, and Weighted Estimates
Crude, covariate-adjusted, and weighted odds ratios for the laparoscopic approach are compared in Table 8 and Figure 6. These are the as-treated estimates of the original submission; the intention-to-treat estimates, the Firth penalised, overlap-weighted and doubly robust estimates, and all estimates on a common risk-ratio scale are given in Section 3.8 and Section 3.10. For every outcome, the estimate moved toward the null at each step. The crude odds ratio for all-cause mortality of 0.14 (95% confidence interval 0.04–0.51) attenuated to 0.21 (0.02–1.87) with covariate adjustment and to 1.23 (0.47–3.22) after weighting; major morbidity moved from 0.17 (0.06–0.50) to 0.31 (0.09–1.10) and 1.30 (0.53–3.20); and the textbook outcome was from 2.41 (0.99–5.89) to 1.72 (0.57–5.13) and 1.07 (0.44–2.57). Every adjusted and weighted interval included unity. Across the truncation and common-support sensitivity analyses, the weighted estimates ranged from 0.88 to 1.56, with all intervals spanning unity; omission of the single most heavily weighted laparoscopic patient, who died, moved the weighted mortality odds ratio to 0.32 (0.07–1.42) (Section 3.10), so the weighted mortality estimate is not robust to one observation. The weighted intervals are wide: they are compatible with a halving of the odds of death or a tripling, and they exclude only the very large crude effects. The change from the conditional adjusted odds ratio to the marginal weighted odds ratio combines confounding control with the non-collapsibility of the odds ratio and the use of different adjustment sets and is not a quantitative partition of the crude association; the common-scale comparison in Section 3.10 addresses this.
Table 8.
Crude, covariate-adjusted, and inverse-probability-weighted odds ratios for the laparoscopic approach, with sensitivity analyses (as-treated exposure definition; maximum-likelihood adjusted estimates of the original submission).
Figure 6.
Crude, covariate-adjusted, and inverse-probability-weighted odds ratios for the laparoscopic approach for each principal outcome. Point estimates with 95% confidence intervals on a logarithmic scale; the dashed line marks an odds ratio of one. Adjustment sets and sensitivity analyses are as in Table 8.
The full multivariable model for the textbook outcome is given in Table 9. After adjustment, the laparoscopic approach was not independently associated with the endpoint (odds ratio 1.72, 0.57–5.13, p = 0.334), whereas each additional Charlson point (0.31, 0.16–0.61, p < 0.001) and pT3–T4 category (0.05, 0.01–0.27, p < 0.001) were strongly associated with failure to attain it. Age and neoadjuvant therapy were not associated with the endpoint.
Table 9.
Multivariable logistic regression for attainment of the textbook outcome (n = 89; 31 events).
3.7. Sensitivity to Unmeasured Confounding
E-values are reported in Table 10. On the risk-ratio scale computed directly from the two-by-two tables, an unmeasured confounder would have needed an association of 9.6 with both approach and all-cause mortality, and of 7.0 with major morbidity to explain the crude estimates away entirely, and of 2.6 and 2.5 to move the confidence limits to the null. These values describe the strength an unmeasured confounder would need; they do not measure the confounding that was actually present. To put the measured covariates on the same scale, nodal positivity was 3.8 times as prevalent in the open as in the laparoscopic group (44.7% vs. 11.9%) and carried a risk ratio of 3.6 for all-cause death (12 of 26 node-positive vs. 8 of 63 node-negative patients), which together imply a bias factor of 2.1 for this single covariate; an ECOG score of 2 or more was 4.0 times as prevalent in the open group and carried a risk ratio of 2.2 for major morbidity (bias factor 1.7). No single measured covariate reaches the crude E-value, but several correlated covariates act jointly, and the crude associations did in fact change substantially on adjustment. A large E-value for a crude estimate is therefore not reassurance that the estimate is genuine; it only states what would be required. After covariate adjustment and after weighting, every confidence limit already included the null, so the E-value for the limit is 1 by construction and is labelled not applicable in Table 10.
Table 10.
E-values for the crude, covariate-adjusted, and weighted associations between the laparoscopic approach and outcome.
3.8. Conversion, Intention-to-Treat, and Conversion-Excluded Analyses
In total, 19 of the 61 initiated laparoscopic procedures (31.1%) were converted to open surgery. The recorded reasons were inadequate exposure of a bulky or fixed tumour in a narrow pelvis (n = 9), dense adhesions (n = 3), uncertainty about the distal margin or oncological clearance (n = 3), bleeding (n = 2), iatrogenic injury (n = 1), and cardiorespiratory intolerance of pneumoperitoneum (n = 1); the three intraoperative complications recorded in the open group all occurred in converted procedures. Conversion fell with calendar year (54.5%, 41.7%, 30.8%, 23.1%, and 8.3% of initiated procedures in 2021 to 2025) and was more frequent for low tumours (8 of 15 initiated low-tumour procedures, 53.3%, vs. 11 of 46, 23.9%). Table 11 describes the completed laparoscopic, converted and planned open groups separately. Converted patients resembled the planned open group in age, comorbidity, and stage more than the completed laparoscopic group and had the highest major morbidity (52.6%), the longest stay, and the highest C-reactive protein, consistent with conversion marking both an unfavourable tumour and an operative insult; their mortality and textbook-outcome attainment were similar to those of the planned open group (p = 0.76 and 0.36).
Table 11.
Baseline characteristics and outcomes of patients who completed laparoscopy, were converted from laparoscopy to open surgery, or underwent planned open resection.
Table 12 gives the approach-effect estimates under the three exposure definitions. By initiated approach, which is the primary comparison, the crude odds ratio for major morbidity was 0.50 (0.19–1.31), for all-cause death 0.27 (0.09–0.75), and for the 90-day textbook outcome 0.93 (0.37–2.29); after Firth penalised adjustment, these were 0.68 (0.24–1.94), 0.41 (0.12–1.32), and 0.81 (0.31–2.09) and, after overlap weighting, 0.90 (0.30–2.70), 0.71 (0.21–2.42), and 0.82 (0.30–2.27). Classifying converted procedures with the laparoscopic strategy, therefore, removed much of the crude difference in major morbidity and all of the crude difference in the 90-day textbook outcome before any adjustment because the converted patients carried both the highest morbidity and the least favourable case mix. The conversion-excluded comparison, which contrasts the two groups furthest apart in case mix, showed the largest crude differences (major morbidity 0.21, 0.06–0.70) and, like the as-treated analysis, weighted estimates near unity (1.17, 0.42–3.26). Under every exposure definition and every estimator, the adjusted and weighted intervals included unity and were wide.
Table 12.
Odds ratios for the laparoscopic approach by exposure definition and estimator.
3.9. Time-to-Event Analysis of Mortality and Recurrence
Kaplan–Meier estimates and Cox models are reported in Table 13 and Figure 7. Patients contributed 230 person-months of follow-up in the laparoscopic and 294 in the open group (129 in the converted and 165 in the planned open subgroup). In the as-treated comparison, the cumulative all-cause mortality was 8.2% (95% confidence interval 2.1–29.1) versus 21.1% (10.6–39.2) at 6 months and 15.3% (4.9–42.0) versus 40.3% (24.7–60.8) at 9 months, with 8 and 12 patients still at risk; the crude hazard ratio was 0.24 (0.07–0.83; log-rank p = 0.014), the hazard ratio adjusted for age, Charlson index, and nodal positivity 0.46 (0.12–1.74) and the inverse-probability-weighted hazard ratio 1.06 (0.30–3.78). Because the laparoscopic group was followed for less time, the Kaplan–Meier estimate of 9-month mortality in that group (15.3%) is twice the crude binary proportion (7.1%) used in the original submission, which treated censored patients as survivors. By initiated approach, 9-month mortality was 23.3% (11.3–44.4) in the laparoscopic strategy group and 44.6% (24.9–70.2) in the planned open group (crude hazard ratio 0.36, 0.15–0.88; adjusted 0.58, 0.22–1.55; weighted 0.74, 0.27–2.02). Estimates beyond 10 months are not reported because fewer than five patients per group remained at risk. Among the 86 M0 patients, the 9-month cumulative incidence of metastatic recurrence was 10.6% (3.5–29.6) versus 46.5% (31.0–65.2) (hazard ratio 0.22, 0.07–0.77; log-rank p = 0.009), the pattern expected from the fourfold difference in nodal positivity. With 20 deaths, no 90-day deaths, and a 9-month horizon, these analyses describe early disease burden in the two groups and do not inform the safety of either approach.
Table 13.
Time-to-event analysis of all-cause mortality and metastatic recurrence.
Figure 7.
Kaplan–Meier estimates of cumulative all-cause mortality by (A) approach completed and (B) approach initiated, with numbers at risk. Vertical ticks mark censoring at the last documented contact. Curves are truncated at 10 months because fewer than five patients per group remained at risk thereafter.
3.10. Weight Diagnostics, Alternative Estimators, and Common-Scale Estimates
Table 14 describes the weights. In the as-treated analysis, the stabilised inverse probability weights had a median of 0.79 (interquartile range 0.58–1.14) in the laparoscopic and 0.88 (0.69–1.12) in the open group; the maximum was 6.8, attached to a laparoscopic patient aged 84 years with ECOG 2, a Charlson index of 9, and node-positive disease (propensity score 0.07, within the region of common support) who died at 7 months, and only one other weight exceeded 3. The effective sample sizes were 24.7 of 42 laparoscopic and 40.2 of 47 open patients. The weighted frequencies of major morbidity were 28.4% vs. 23.4%, of all-cause death 21.6% vs. 18.3%, of the 90-day textbook outcome 39.5% vs. 40.0%, and of the original textbook outcome 36.4% vs. 34.8%, which reproduce the weighted odds ratios of Table 8. Omitting the most heavily weighted patient moved the weighted mortality odds ratio from 1.23 to 0.32 (0.07–1.42), the weighted major-morbidity odds ratio to 1.63 (0.63–4.21), and the original textbook-outcome odds ratio to 1.43 (0.57–3.60): this one observation contributed 6.8 of the 9.2 weighted laparoscopic deaths. Overlap weights, which are bounded between 0 and 1, gave effective sample sizes of 25.1 and 27.9, balanced all nine covariate means exactly, and yielded odds ratios of 0.96 (0.33–2.80) for major morbidity, 0.78 (0.21–2.93) for death, 1.06 (0.41–2.74) for the 90-day textbook outcome, and 1.21 (0.47–3.12) for the original composite; the doubly robust estimates were 1.14 (0.40–3.26), 1.02 (0.30–3.44), 1.01 (0.39–2.60), and 1.10 (0.42–2.88). The sensitivity propensity models (Table A3) led to the same conclusion: with pre-operative staging only (c-statistic 0.79; three of nine covariates below 0.10 after weighting), the weighted odds ratios were 1.08 (0.42–2.78) for major morbidity and 0.94 (0.34–2.61) for death; with tumour height, surgeon, and calendar year added, the weights became unstable (maximum 11.4; effective sample sizes 15.9 and 12.6) and the estimates wider (1.12, 0.36–3.48 and 1.41, 0.38–5.20); the core-comorbidity and categorical-ECOG models gave estimates within 0.1 of the main analysis; inclusion of smoking produced weights up to 17 with worse balance (mean SMD 0.38) and is reported only to document why the variable was excluded.
Table 14.
Distribution of the weights, effective sample sizes, balance, and weighted outcome frequencies for inverse probability and overlap weighting (completed-approach analysis).
Table 15 places the estimators on a common marginal risk-ratio scale for the whole cohort. For major morbidity, the crude risk ratio of 0.27 (0.11–0.64) became 0.42 (0.15–1.09) after model-based standardisation of the adjusted model, 1.21 (0.58–2.55) after inverse probability weighting, and 0.97 (0.40–2.33) in the overlap population; for all-cause death, the corresponding values were 0.20, 0.31, 1.18, and 0.82 and, for the 90-day textbook outcome, 1.32, 1.22, 0.99, and 1.04. On this scale, the standardised adjusted estimates lie closer to the null than the conditional odds ratios of Table 8, as expected from non-collapsibility, and the difference between the standardised and weighted estimates reflects the different adjustment sets and the instability of the weights rather than a further removal of confounding; the interval of every adjusted or weighted risk ratio includes 1, and none is narrow enough to distinguish a modest benefit from none.
Table 15.
Marginal risk ratios for the laparoscopic approach on a common scale (completed-approach analysis).
4. Discussion
4.1. Principal Findings
The central message of this study is methodological, and it is offered as a worked example rather than as new evidence on laparoscopy. On crude as-treated comparison, laparoscopic resection was associated with roughly four- to five-fold lower major morbidity and all-cause mortality. Three analytical choices changed that picture more than any modelling: defining the exposure by the approach initiated halved the crude morbidity difference and removed the crude difference in the 90-day textbook outcome; analysing mortality as a time-to-event outcome doubled the laparoscopic 9-month mortality estimate because that group was followed for less time; adjustment and weighting moved every remaining estimate toward unity, with intervals wide enough to include both important benefit and harm. A c-statistic above 0.8 for the completed operation shows that the groups were far from exchangeable, although it does not quantify how much of the crude difference selection explains. All 20 deaths occurred after the third month; cause of death was not adjudicated, so this is compatible with disease-related death but does not establish it.
Two internal observations are consistent with this interpretation, although neither is a control for a null effect of approach. The anastomotic leak rate did not differ (16.7% vs. 21.2% among patients with an anastomosis), but the comparison is imprecise, and leak risk also depends on tumour height, irradiation, and stoma policy, which differed between groups; the components of the original textbook outcome that separated the approaches were those most sensitive to comorbidity and stage. These patterns are readily explained by selection but do not exclude a direct effect of the technique: the adjusted morbidity estimates remained below unity under every exposure definition, and this cohort cannot distinguish a modest genuine benefit from none.
4.2. Relation to the Randomised Evidence and Previous Literature
These findings do not contradict the randomised trials that established laparoscopy as oncologically safe for colon cancer [3,4] and showed recovery benefits with equivalent survival in colorectal cancer [33,34]; they illustrate why observational data cannot substitute for randomisation, particularly in rectal cancer, where the pathological non-inferiority trials were equivocal [7,8], although longer follow-up indicated oncological equivalence [6,35,36]. That comorbidity and stage-governed outcome accords with the literature on surgical prognostication [37,38,39]; the preserved nodal harvest is consistent with trial data [40], and the superior mesorectal and margin metrics after laparoscopy are confounded by the lower, larger, and more advanced tumours in the open group [16].
The textbook outcome has been advocated as a composite benchmark of surgical quality [11,12], but applied without adjustment, it transmits selection, and case-mix variation between hospitals means that such metrics require adjustment before benchmarking [13]. A composite whose survival component depends on the length of observation also incorporates late death and inflates the association with stage, which is why the 90-day definition is now primary. The blunted inflammatory response after laparoscopy is well described [41,42,43]; the exploratory analysis in Appendix A is hypothesis-generating only and, because some complications were already manifest when the markers were measured, describes concurrent discrimination as much as prediction.
4.3. What the Propensity, Balance, and Sensitivity Analyses Add
The propensity model makes the lack of exchangeability explicit: a c-statistic of 0.83, or 0.77 after correction for optimism, means that the characteristics of a patient largely determined which operation was completed [20]. The progression from crude, through adjusted, to weighted estimates displays how the association changed as covariates were accounted for, but it is not a quantitative partition of the crude association because conditional and marginal odds ratios differ even without confounding [44] and the adjustment sets differed; the common-scale risk ratios of Table 15 are the appropriate comparison [45].
Weighting is not a cure for confounding, and three caveats bound our interpretation. First, balance after inverse probability weighting was incomplete (two of nine covariates below 0.10; tumour location 0.33), and the method is unbiased only when assignment is fully explained by measured covariates and the weights are stable [25], conditions that are demanding in 89 patients with strongly separated groups. Overlap weighting, which targets the population of clinical equipoise and balances covariate means exactly [23,24], and the doubly robust estimator [26] were therefore applied; they gave estimates between 0.8 and 1.2 for every outcome, but at effective sample sizes of 25 to 28 per group, their intervals remain wide, and they describe a different population, the patients who could realistically have received either operation. Second, the inverse probability estimates were fragile: one frail laparoscopic patient who died carried a weight of 6.8, and without that patient, the weighted mortality odds ratio fell from 1.23 to 0.32, so the weighted mortality result shows the absence of a robust signal rather than a precise estimate of no effect. Third, the model restricted to pre-operative staging gave the same conclusion with slightly poorer balance, and the model that added surgeon, calendar year, and tumour height produced unstable weights. Because adequate balance and stable estimation could not both be achieved, the weighted results are partially deconfounded descriptions, not effect estimates.
E-values address the complementary question of what would have to be true for the crude findings to be genuine [27,28]: an unmeasured confounder associated with both approach and mortality at a risk ratio approaching 10 would be required to explain the crude association away. The E-value does not measure the confounding present, but the measured covariates, expressed on the same scale, show that confounders of this general order exist in the cohort (nodal positivity alone implies a bias factor of 2.1, and several correlated covariates act together), which is why the crude estimate should not be trusted.
4.4. Clinical Implications and Future Directions
Unadjusted institutional comparisons should not be used to justify expanding or restricting a surgical technique since they reward units that select favourable patients rather than those that operate well [46]. Early complications compromise survival through failure-to-rescue mechanisms [47], so the case for minimally invasive access in suitable patients remains strong; its magnitude cannot be read from unadjusted comparisons.
Future work should examine the question in cohorts large enough for overlap weighting or matching to achieve conventional balance with stable weights, with the exposure defined by initiated approach, explicit measurement of surgeon experience, tumour fixity and operative urgency, and continuous severity metrics such as the comprehensive complication index [48]. Frameworks for evaluating surgical innovation [49] should treat the reporting of case mix, achieved balance, and sensitivity parameters as a minimum standard for observational comparisons of technique.
4.5. Study Limitations
This study has important limitations, and its conclusions are bounded by them. It is a retrospective, single-centre analysis of 89 patients from a unit with a modest annual volume, with 26 major complications and 20 deaths. The minimum detectable effects are large, and the multivariable models operated at five to six events per parameter, where sparse-data bias arises; Firth penalisation reduces but does not remove this problem. The propensity models were estimated in the same small sample, inverse probability weighting left seven of nine covariates above 0.10, overlap weighting achieved balance only in a smaller target population, and residual measured confounding, together with unmeasured confounding by surgeon experience, tumour fixity, operative urgency, and socioeconomic factors, certainly persists. The adjusted and weighted estimates are evidence that confounding alters crude comparisons, not measures of any true laparoscopic effect.
Mortality and conversion require particular qualifications. No patient died within 90 days, a figure below the historical population benchmark of approximately 3–4% reported for Swedish rectal cancer surgery in 2000–2011 [19], which predates current perioperative care and is cited for orientation only. Cause of death was not adjudicated, follow-up was short and unequal, and estimates beyond 9 months rest on fewer than 10 patients at risk per group; the time-to-event analysis corrects the dependence of the binary comparison on the length of observation but cannot lengthen follow-up. The conversion rate of 31% is high by contemporary standards and reflects the adoption phase of laparoscopic rectal surgery in a population with many low, bulky, irradiated tumours; with 19 converted patients, the intention-to-treat estimates are imprecise. The excess of recorded smokers in the laparoscopic group was traced to differential documentation. Outcome definitions were not externally audited, the exploratory inflammatory-marker thresholds were derived and tested in the same cohort, and no correction for multiplicity was applied to the many secondary comparisons, which should be regarded as descriptive.
5. Conclusions
In this small, single-centre cohort of patients undergoing resection for rectal and rectosigmoid adenocarcinoma, laparoscopic surgery appeared on unadjusted as-treated analysis to be associated with large advantages in morbidity, oncological quality, and survival. The patients who completed the minimally invasive operation were, however, systematically younger, fitter, and burdened with earlier and less aggressive tumours, to the extent that baseline characteristics alone predicted the completed operation with high accuracy. Defining the exposure by initiated approach, analysing mortality with time-to-event methods, and covariate adjustment and propensity-score weighting each changed the associations substantially, and the adjusted estimates were no longer distinguishable from chance, but balance was incomplete, the weighted estimates were imprecise and sensitive to single observations, and confidence intervals that include unity do not demonstrate equivalence. These data therefore neither establish nor exclude an effect of surgical approach; what they show is how much of a crude comparison can be reshaped by patient selection and by analytical choices. Observational comparisons of surgical approach should define the exposure by initiated approach, account for unequal follow-up, report the crude-to-adjusted change together with the balance actually achieved, and present quantitative sensitivity analyses before any claim of superiority is made. Randomised or rigorously risk-adjusted designs remain the only reliable means of distinguishing the effect of a technique from the effect of the patient to whom it is offered.
Author Contributions
Conceptualization, T.N. and L.G.S.; methodology, T.N. and L.G.S.; software, T.N. and L.G.S.; validation, T.N. and L.G.S.; formal analysis, A.C.I.; investigation, A.C.I.; resources, A.C.I.; data curation, A.C.I.; writing—original draft preparation, D.D., A.D.T. and S.P.; writing—review and editing, D.D., A.D.T. and S.P.; visualization, D.D., A.D.T. and S.P.; project administration, D.D., A.D.T. and S.P.; supervision, D.D., A.D.T. and S.P. All authors have read and agreed to the published version of the manuscript.
Funding
We would like to acknowledge the “Victor Babeș” University of Medicine and Pharmacy Timișoara (UMFVBT) for their support in covering the costs of publication for this research paper.
Institutional Review Board Statement
The study was approved by the Local Commission of Ethics of the “Pius Brînzeu” Clinical Emergency Hospital, Timișoara, Romania (approval No. 072, dated 2 February 2026), which operates under article 167 of Law no. 95/2006, art. 28, chapter VIII of order 904/2006, EU GCP Directive 2005/28/EC, the International Council for Harmonisation guidelines, and the Declaration of Helsinki.
Informed Consent Statement
Informed consent was obtained from all subjects involved in the study.
Data Availability Statement
The original contributions presented in this study are included in the article. Further inquiries can be directed to the corresponding authors.
Acknowledgments
The authors used ChatGPT (GPT-4o), an AI language model developed by OpenAI (San Francisco, CA, USA), exclusively to improve the manuscript’s language and readability. All scientific content, interpretations, and conclusions are the original work of the authors.
Conflicts of Interest
The authors declare no conflicts of interest.
Appendix A. Exploratory Analysis of Inflammatory Markers
Within each approach, the discrimination of postoperative C-reactive protein and of the C-reactive protein-to-albumin ratio for major morbidity was assessed by receiver operating characteristic analysis with bootstrap confidence intervals (1000 resamples) and Youden-optimal thresholds (Table A1). Both markers discriminated major morbidity in each group, with lower Youden-optimal thresholds after laparoscopy (171 vs. 198 mg/L for C-reactive protein; 52 vs. 92 for the ratio). With only five events in the laparoscopic group, however, the apparent sensitivity of 1.00 and the area under the curve of 0.95 are almost certainly optimistic, the thresholds were derived and evaluated in the same patients, and the analysis is reported solely to motivate external validation in a larger cohort. Both markers were measured on the morning of postoperative day 3, whereas major complications were diagnosed at a median of postoperative day 5 (interquartile range 4–7); in 6 of the 26 major complications (2 laparoscopic, 4 open), the complication was already clinically manifest by day 3, so the analysis describes concurrent discrimination in part rather than prediction. Excluding those six patients, the area under the curve for C-reactive protein in the open group was 0.83 (0.68–0.94); the laparoscopic estimate is not reported because three events remained.
Table A1.
Discrimination of postoperative inflammatory markers for major morbidity, stratified by surgical approach (exploratory).
Appendix B. Patient Flow, Variable Ascertainment, Sensitivity Propensity Models, and Model Specifications
Appendix B.1. Patient Flow
Figure A1.
Patient flow and exposure definitions.
Appendix B.2. Source and Timing of Ascertainment of Each Variable
Table A2.
Source, timing, and completeness of every variable used in the analysis.
Appendix B.3. Balance and Weight Diagnostics of the Sensitivity Propensity Models
Table A3.
Discrimination, balance after weighting, weight diagnostics, and weighted odds ratios for each propensity model.
Appendix B.4. Model Specifications
Propensity model: logit P(A = 1|X) = β0 + β1·age + β2·Charlson + β3·ECOG + β4·BMI + β5·I(pT3–T4) + β6·I(pN+) + β7·I(G3) + β8·I(rectal) + β9·I(neoadjuvant), fitted by maximum likelihood on 89 patients, with A = 1 for the laparoscopic approach (completed, initiated or, in the conversion-excluded analysis, completed among non-converted patients). Sensitivity models replace or add covariates as listed in Table A3. Stabilised weights: w_i = P(A = a_i)/P(A = a_i|X_i); overlap weights: w_i = 1 − e_i for a_i = 1 and w_i = e_i for a_i = 0. Weighted outcome models: logit P(Y = 1) = γ0 + γ1·A, fitted by weighted maximum likelihood with HC0 robust standard errors; doubly robust models add the a priori adjustment set to the weighted outcome model. Covariate-adjusted models: logit P(Y = 1) = γ0 + γ1·A + Σγ_k·X_k over the a priori adjustment set of Table 8, fitted by maximum likelihood (Table 8) and by Firth penalised likelihood with profile-likelihood intervals (Table 12). Standardised risk ratios: RR = mean_i[P^(Y = 1|A = 1, X_i)]/mean_i[P^(Y = 1|A = 0, X_i)] over all 89 patients, with percentile bootstrap intervals from 300 resamples of the whole procedure. Time-to-event: Kaplan–Meier estimator with Greenwood variance and log-log intervals; Cox proportional-hazards models h(t|A, X) = h0(t)·exp(γ1·A + Σγ_k·X_k) with Efron handling of ties, crude, adjusted for age, Charlson index, and nodal positivity and weighted with robust variance. E-values: E = RR + √[RR(RR − 1)] applied to the risk ratio (crude) or to √OR (adjusted and weighted) and to the confidence limit closest to the null. Analyses were performed in Python 3.12 (pandas 2.2, SciPy 1.13, statsmodels 0.14, and scikit-learn 1.5); the full script is available from the corresponding authors on request.
References
- Jacobs, M.; Verdeja, J.C.; Goldstein, H.S. Minimally invasive colon resection (laparoscopic colectomy). Surg. Laparosc. Endosc. 1991, 1, 144–150. [Google Scholar] [PubMed]
- Lacy, A.M.; García-Valdecasas, J.C.; Delgado, S.; Castells, A.; Taurá, P.; Piqué, J.M.; Visa, J. Laparoscopy-assisted colectomy versus open colectomy for treatment of non-metastatic colon cancer: A randomised trial. Lancet 2002, 359, 2224–2229. [Google Scholar] [CrossRef] [Scilit] [PubMed]
- Clinical Outcomes of Surgical Therapy Study Group. A comparison of laparoscopically assisted and open colectomy for colon cancer. N. Engl. J. Med. 2004, 350, 2050–2059. [PubMed]
- Deijen, C.L.; Vasmel, J.E.; de Lange-de Klerk, E.S.M.; Cuesta, M.A.; Coene, P.L.O.; Lange, J.F.; Meijerink, W.J.H.J.; Jakimowicz, J.J.; Jeekel, J.; Kazemier, G.; et al. Ten-year outcomes of a randomised trial of laparoscopic versus open surgery for colon cancer. Surg. Endosc. 2017, 31, 2607–2615. [Google Scholar] [CrossRef] [Scilit] [PubMed]
- Kang, S.B.; Park, J.W.; Jeong, S.Y.; Nam, B.H.; Choi, H.S.; Kim, D.W.; Lim, S.B.; Lee, T.G.; Kim, D.Y.; Kim, J.S.; et al. Open versus laparoscopic surgery for mid or low rectal cancer after neoadjuvant chemoradiotherapy (COREAN trial): Short-term outcomes of an open-label randomised controlled trial. Lancet Oncol. 2010, 11, 637–645. [Google Scholar] [CrossRef] [Scilit] [PubMed]
- Jeong, S.Y.; Park, J.W.; Nam, B.H.; Kim, S.; Kang, S.B.; Lim, S.B.; Choi, H.S.; Kim, D.W.; Chang, H.J.; Kim, D.Y.; et al. Open versus laparoscopic surgery for mid-rectal or low-rectal cancer after neoadjuvant chemoradiotherapy (COREAN trial): Survival outcomes of an open-label, non-inferiority, randomised controlled trial. Lancet Oncol. 2014, 15, 767–774. [Google Scholar] [CrossRef] [Scilit] [PubMed]
- Fleshman, J.; Branda, M.; Sargent, D.J.; Boller, A.M.; George, V.; Abbas, M.; Peters, W.R., Jr.; Maun, D.; Chang, G.; Herline, A.; et al. Effect of laparoscopic-assisted resection vs open resection of stage II or III rectal cancer on pathologic outcomes: The ACOSOG Z6051 randomized clinical trial. JAMA 2015, 314, 1346–1355. [Google Scholar] [PubMed]
- Stevenson, A.R.L.; Solomon, M.J.; Lumley, J.W.; Hewett, P.; Clouston, A.D.; Gebski, V.J.; Davies, L.; Wilson, K.; Hague, W.; Simes, J.; et al. Effect of laparoscopic-assisted resection vs open resection on pathological outcomes in rectal cancer: The ALaCaRT randomized clinical trial. JAMA 2015, 314, 1356–1363. [Google Scholar] [CrossRef] [Scilit] [PubMed]
- Taylor, E.F.; Thomas, J.D.; Whitehouse, L.E.; Quirke, P.; Jayne, D.; Finan, P.J.; Forman, D.; Wilkinson, J.R.; Morris, E.J.A. Population-based study of laparoscopic colorectal cancer surgery 2006–2008. Br. J. Surg. 2013, 100, 553–560. [Google Scholar] [CrossRef] [Scilit] [PubMed]
- Kyriacou, D.N.; Lewis, R.J. Confounding by indication in clinical research. JAMA 2016, 316, 1818–1819. [Google Scholar] [CrossRef] [Scilit] [PubMed]
- Kolfschoten, N.E.; Kievit, J.; Gooiker, G.A.; van Leersum, N.J.; Snijders, H.S.; Eddes, E.H.; Tollenaar, R.A.E.M.; Wouters, M.W.J.M.; Marang-van de Mheen, P.J. Focusing on desired outcomes of care after colon cancer resections; hospital variations in ‘textbook outcome’. Eur. J. Surg. Oncol. 2013, 39, 156–163. [Google Scholar] [CrossRef] [Scilit] [PubMed]
- Salet, N.; Bremmer, R.H.; Verhagen, M.A.M.T.; Ekkelenkamp, V.E.; Hansen, B.E.; de Jonge, P.J.F.; de Man, R.A. Is Textbook Outcome a valuable composite measure for short-term outcomes of gastrointestinal treatments in the Netherlands using hospital information system data? A retrospective cohort study. BMJ Open 2018, 8, e019405. [Google Scholar] [CrossRef] [Scilit] [PubMed]
- Kolfschoten, N.E.; Marang van de Mheen, P.J.; Gooiker, G.A.; Eddes, E.H.; Kievit, J.; Tollenaar, R.A.E.M.; Wouters, M.W.J.M. Variation in case-mix between hospitals treating colorectal cancer patients in the Netherlands. Eur. J. Surg. Oncol. 2011, 37, 956–963. [Google Scholar] [CrossRef] [Scilit] [PubMed]
- von Elm, E.; Altman, D.G.; Egger, M.; Pocock, S.J.; Gøtzsche, P.C.; Vandenbroucke, J.P.; STROBE Initiative. The Strengthening the Reporting of Observational Studies in Epidemiology (STROBE) statement: Guidelines for reporting observational studies. Lancet 2007, 370, 1453–1457. [Google Scholar] [CrossRef] [Scilit] [PubMed]
- Amin, M.B.; Edge, S.B.; Greene, F.L.; Byrd, D.R.; Brookland, R.K.; Washington, M.K.; Gershenwald, J.E.; Compton, C.C.; Hess, K.R.; Sullivan, D.C.; et al. (Eds.) AJCC Cancer Staging Manual, 8th ed.; Springer: New York, NY, USA, 2017. [Google Scholar]
- Quirke, P.; Steele, R.; Monson, J.; Grieve, R.; Khanna, S.; Couture, J.; O’Callaghan, C.; Myint, A.S.; Bessell, E.; Thompson, L.C.; et al. Effect of the plane of surgery achieved on local recurrence in patients with operable rectal cancer: A prospective study using data from the MRC CR07 and NCIC-CTG CO16 randomised clinical trial. Lancet 2009, 373, 821–828. [Google Scholar] [CrossRef] [Scilit] [PubMed]
- Dindo, D.; Demartines, N.; Clavien, P.A. Classification of surgical complications: A new proposal with evaluation in a cohort of 6336 patients and results of a survey. Ann. Surg. 2004, 240, 205–213. [Google Scholar] [PubMed]
- Rahbari, N.N.; Weitz, J.; Hohenberger, W.; Heald, R.J.; Moran, B.; Ulrich, A.; Holm, T.; Wong, W.D.; Tiret, E.; Moriya, Y.; et al. Definition and grading of anastomotic leakage following anterior resection of the rectum: A proposal by the International Study Group of Rectal Cancer. Surgery 2010, 147, 339–351. [Google Scholar] [CrossRef] [Scilit] [PubMed]
- Rutegård, M.; Haapamäki, M.; Matthiessen, P.; Rutegård, J. Early postoperative mortality after surgery for rectal cancer in Sweden, 2000–2011. Colorectal Dis. 2014, 16, 426–432. [Google Scholar] [CrossRef] [Scilit] [PubMed]
- Rosenbaum, P.R.; Rubin, D.B. The central role of the propensity score in observational studies for causal effects. Biometrika 1983, 70, 41–55. [Google Scholar] [CrossRef] [Scilit]
- Austin, P.C. An introduction to propensity score methods for reducing the effects of confounding in observational studies. Multivar. Behav. Res. 2011, 46, 399–424. [Google Scholar] [CrossRef] [Scilit] [PubMed]
- Steyerberg, E.W.; Harrell, F.E., Jr.; Borsboom, G.J.J.M.; Eijkemans, M.J.C.; Vergouwe, Y.; Habbema, J.D.F. Internal validation of predictive models: Efficiency of some procedures for logistic regression analysis. J. Clin. Epidemiol. 2001, 54, 774–781. [Google Scholar] [CrossRef] [Scilit] [PubMed]
- Li, F.; Morgan, K.L.; Zaslavsky, A.M. Balancing covariates via propensity score weighting. J. Am. Stat. Assoc. 2018, 113, 390–400. [Google Scholar] [CrossRef] [Scilit]
- Thomas, L.E.; Li, F.; Pencina, M.J. Overlap weighting: A propensity score method that mimics attributes of a randomized clinical trial. JAMA 2020, 323, 2417–2418. [Google Scholar] [CrossRef] [Scilit] [PubMed]
- Austin, P.C.; Stuart, E.A. Moving towards best practice when using inverse probability of treatment weighting (IPTW) using the propensity score to estimate causal treatment effects in observational studies. Stat. Med. 2015, 34, 3661–3679. [Google Scholar] [CrossRef] [Scilit] [PubMed]
- Funk, M.J.; Westreich, D.; Wiesen, C.; Stürmer, T.; Brookhart, M.A.; Davidian, M. Doubly robust estimation of causal effects. Am. J. Epidemiol. 2011, 173, 761–767. [Google Scholar] [CrossRef] [Scilit] [PubMed]
- VanderWeele, T.J.; Ding, P. Sensitivity analysis in observational research: Introducing the E-value. Ann. Intern. Med. 2017, 167, 268–274. [Google Scholar] [CrossRef] [Scilit] [PubMed]
- Haneuse, S.; VanderWeele, T.J.; Arterburn, D. Using the E-value to assess the potential effect of unmeasured confounding in observational studies. JAMA 2019, 321, 602–603. [Google Scholar] [CrossRef] [Scilit] [PubMed]
- Peduzzi, P.; Concato, J.; Kemper, E.; Holford, T.R.; Feinstein, A.R. A simulation study of the number of events per variable in logistic regression analysis. J. Clin. Epidemiol. 1996, 49, 1373–1379. [Google Scholar] [CrossRef] [Scilit] [PubMed]
- Vittinghoff, E.; McCulloch, C.E. Relaxing the rule of ten events per variable in logistic and Cox regression. Am. J. Epidemiol. 2007, 165, 710–718. [Google Scholar] [CrossRef] [Scilit] [PubMed]
- Firth, D. Bias reduction of maximum likelihood estimates. Biometrika 1993, 80, 27–38. [Google Scholar] [CrossRef]
- Heinze, G.; Schemper, M. A solution to the problem of separation in logistic regression. Stat. Med. 2002, 21, 2409–2419. [Google Scholar] [CrossRef] [Scilit] [PubMed]
- Jayne, D.G.; Guillou, P.J.; Thorpe, H.; Quirke, P.; Copeland, J.; Smith, A.M.H.; Heath, R.M.; Brown, J.M. Randomized trial of laparoscopic-assisted resection of colorectal carcinoma: 3-year results of the UK MRC CLASICC Trial Group. J. Clin. Oncol. 2007, 25, 3061–3068. [Google Scholar] [CrossRef] [Scilit] [PubMed]
- Green, B.L.; Marshall, H.C.; Collinson, F.; Quirke, P.; Guillou, P.; Jayne, D.G.; Brown, J.M. Long-term follow-up of the Medical Research Council CLASICC trial of conventional versus laparoscopically assisted resection in colorectal cancer. Br. J. Surg. 2013, 100, 75–82. [Google Scholar] [CrossRef] [Scilit] [PubMed]
- Fleshman, J.; Branda, M.E.; Sargent, D.J.; Boller, A.M.; George, V.V.; Abbas, M.A.; Peters, W.R., Jr.; Maun, D.C.; Chang, G.J.; Herline, A.; et al. Disease-free survival and local recurrence for laparoscopic resection compared with open resection of stage II to III rectal cancer: Follow-up results of the ACOSOG Z6051 randomized controlled trial. Ann. Surg. 2019, 269, 589–595. [Google Scholar] [PubMed]
- Bonjer, H.J.; Deijen, C.L.; Abis, G.A.; Cuesta, M.A.; van der Pas, M.H.G.M.; de Lange-de Klerk, E.S.M.; Lacy, A.M.; Bemelman, W.A.; Andersson, J.; Angenete, E.; et al. A randomized trial of laparoscopic versus open surgery for rectal cancer. N. Engl. J. Med. 2015, 372, 1324–1332. [Google Scholar] [CrossRef] [Scilit] [PubMed]
- Fagard, K.; Leonard, S.; Deschodt, M.; Devriendt, E.; Wolthuis, A.; Prenen, H.; Flamaing, J.; Milisen, K.; Wildiers, H.; Kenis, C. The impact of frailty on postoperative outcomes in individuals aged 65 and over undergoing elective surgery for colorectal cancer: A systematic review. J. Geriatr. Oncol. 2016, 7, 479–491. [Google Scholar] [CrossRef] [Scilit] [PubMed]
- Saunders, D.I.; Murray, D.; Pichel, A.C.; Varley, S.; Peden, C.J.; UK Emergency Laparotomy Network. Variations in mortality after emergency laparotomy: The first report of the UK Emergency Laparotomy Network. Br. J. Anaesth. 2012, 109, 368–375. [Google Scholar] [CrossRef] [Scilit] [PubMed]
- Panis, Y.; Maggiori, L.; Caranhac, G.; Bretagnol, F.; Vicaut, E. Mortality after colorectal cancer surgery: A French survey of more than 84,000 patients. Ann. Surg. 2011, 254, 738–744. [Google Scholar] [PubMed]
- van der Pas, M.H.; Haglind, E.; Cuesta, M.A.; Fürst, A.; Lacy, A.M.; Hop, W.C.; Bonjer, H.J.; COLOR II Study Group. Laparoscopic versus open surgery for rectal cancer (COLOR II): Short-term outcomes of a randomised, phase 3 trial. Lancet Oncol. 2013, 14, 210–218. [Google Scholar] [CrossRef] [Scilit] [PubMed]
- Veenhof, A.A.F.A.; Vlug, M.S.; van der Pas, M.H.G.M.; Sietses, C.; van der Peet, D.L.; de Lange-de Klerk, E.S.M.; Bonjer, H.J.; Bemelman, W.A.; Cuesta, M.A. Surgical stress response and postoperative immune function after laparoscopy or open surgery with fast track or standard perioperative care: A randomized trial. Ann. Surg. 2012, 255, 216–221. [Google Scholar] [CrossRef] [Scilit] [PubMed]
- Adamina, M.; Steffen, T.; Tarantino, I.; Beutner, U.; Schmied, B.M.; Warschkow, R. Meta-analysis of the predictive value of C-reactive protein for infectious complications in abdominal surgery. Br. J. Surg. 2015, 102, 590–598. [Google Scholar] [CrossRef] [Scilit] [PubMed]
- McSorley, S.T.; Watt, D.G.; Horgan, P.G.; McMillan, D.C. Postoperative systemic inflammatory response, complication severity, and survival following surgery for colorectal cancer. Ann. Surg. Oncol. 2016, 23, 2832–2840. [Google Scholar] [CrossRef] [Scilit] [PubMed]
- Greenland, S.; Robins, J.M.; Pearl, J. Confounding and collapsibility in causal inference. Stat. Sci. 1999, 14, 29–46. [Google Scholar] [CrossRef] [Scilit]
- Lonjon, G.; Boutron, I.; Trinquart, L.; Ahmad, N.; Aim, F.; Nizard, R.; Ravaud, P. Comparison of treatment effect estimates from prospective nonrandomized studies with propensity score analysis and randomized controlled trials of surgical procedures. Ann. Surg. 2014, 259, 18–25. [Google Scholar] [CrossRef] [Scilit] [PubMed]
- Gustafsson, U.O.; Scott, M.J.; Hubner, M.; Nygren, J.; Demartines, N.; Francis, N.; Rockall, T.A.; Young-Fadok, T.M.; Hill, A.G.; Soop, M.; et al. Guidelines for perioperative care in elective colorectal surgery: Enhanced Recovery After Surgery (ERAS®) Society recommendations: 2018. World J. Surg. 2019, 43, 659–695. [Google Scholar] [CrossRef] [Scilit] [PubMed]
- Ghaferi, A.A.; Birkmeyer, J.D.; Dimick, J.B. Variation in hospital mortality associated with inpatient surgery. N. Engl. J. Med. 2009, 361, 1368–1375. [Google Scholar] [CrossRef] [Scilit] [PubMed]
- Slankamenac, K.; Graf, R.; Barkun, J.; Puhan, M.A.; Clavien, P.A. The comprehensive complication index: A novel continuous scale to measure surgical morbidity. Ann. Surg. 2013, 258, 1–7. [Google Scholar] [PubMed]
- McCulloch, P.; Altman, D.G.; Campbell, W.B.; Flum, D.R.; Glasziou, P.; Marshall, J.C.; Nicholl, J.; Balliol Collaboration. No surgical innovation without evaluation: The IDEAL recommendations. Lancet 2009, 374, 1105–1112. [Google Scholar] [CrossRef] [Scilit] [PubMed]
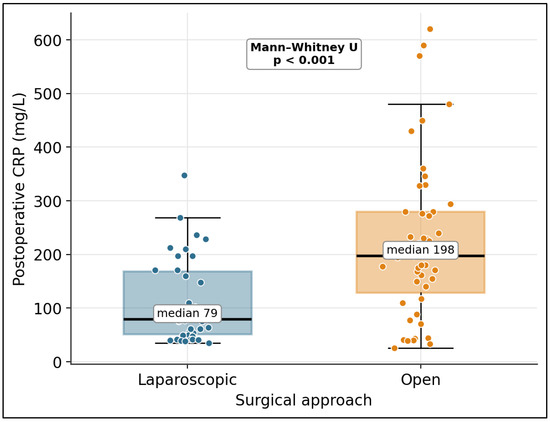
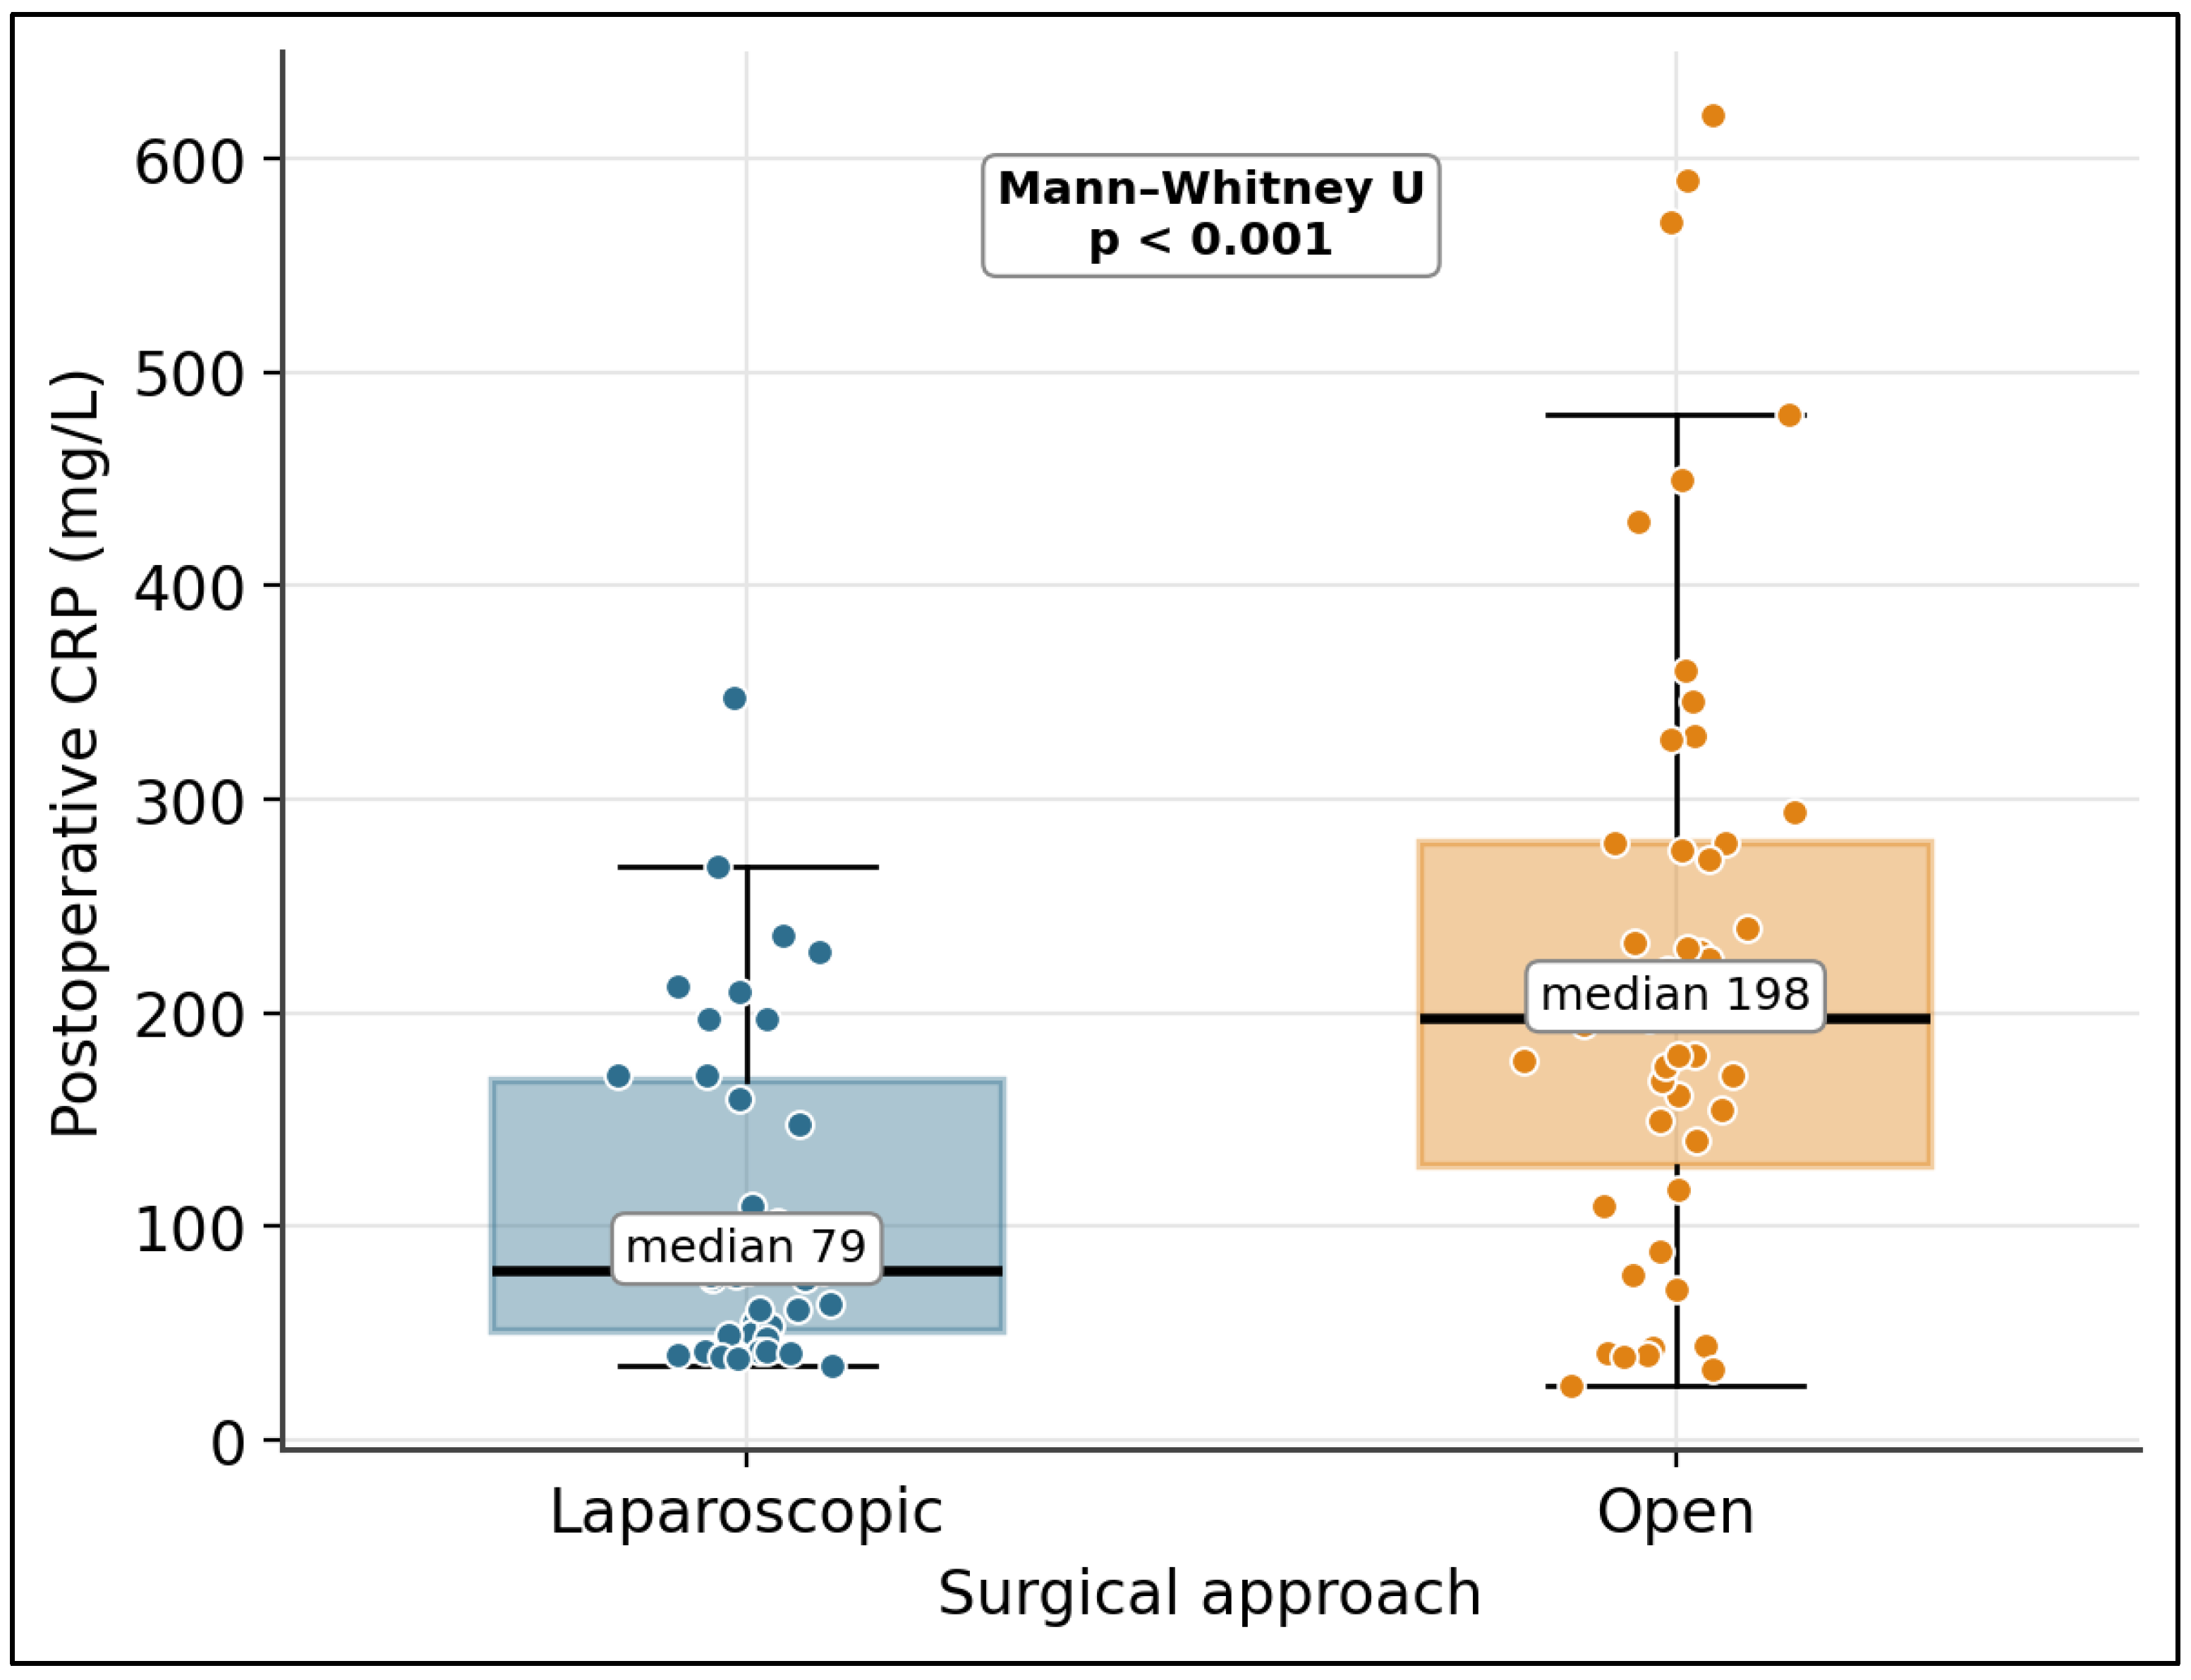
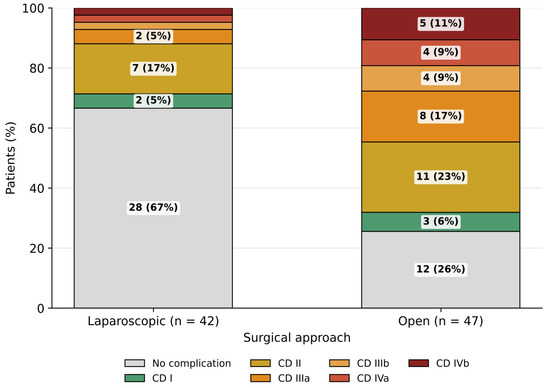
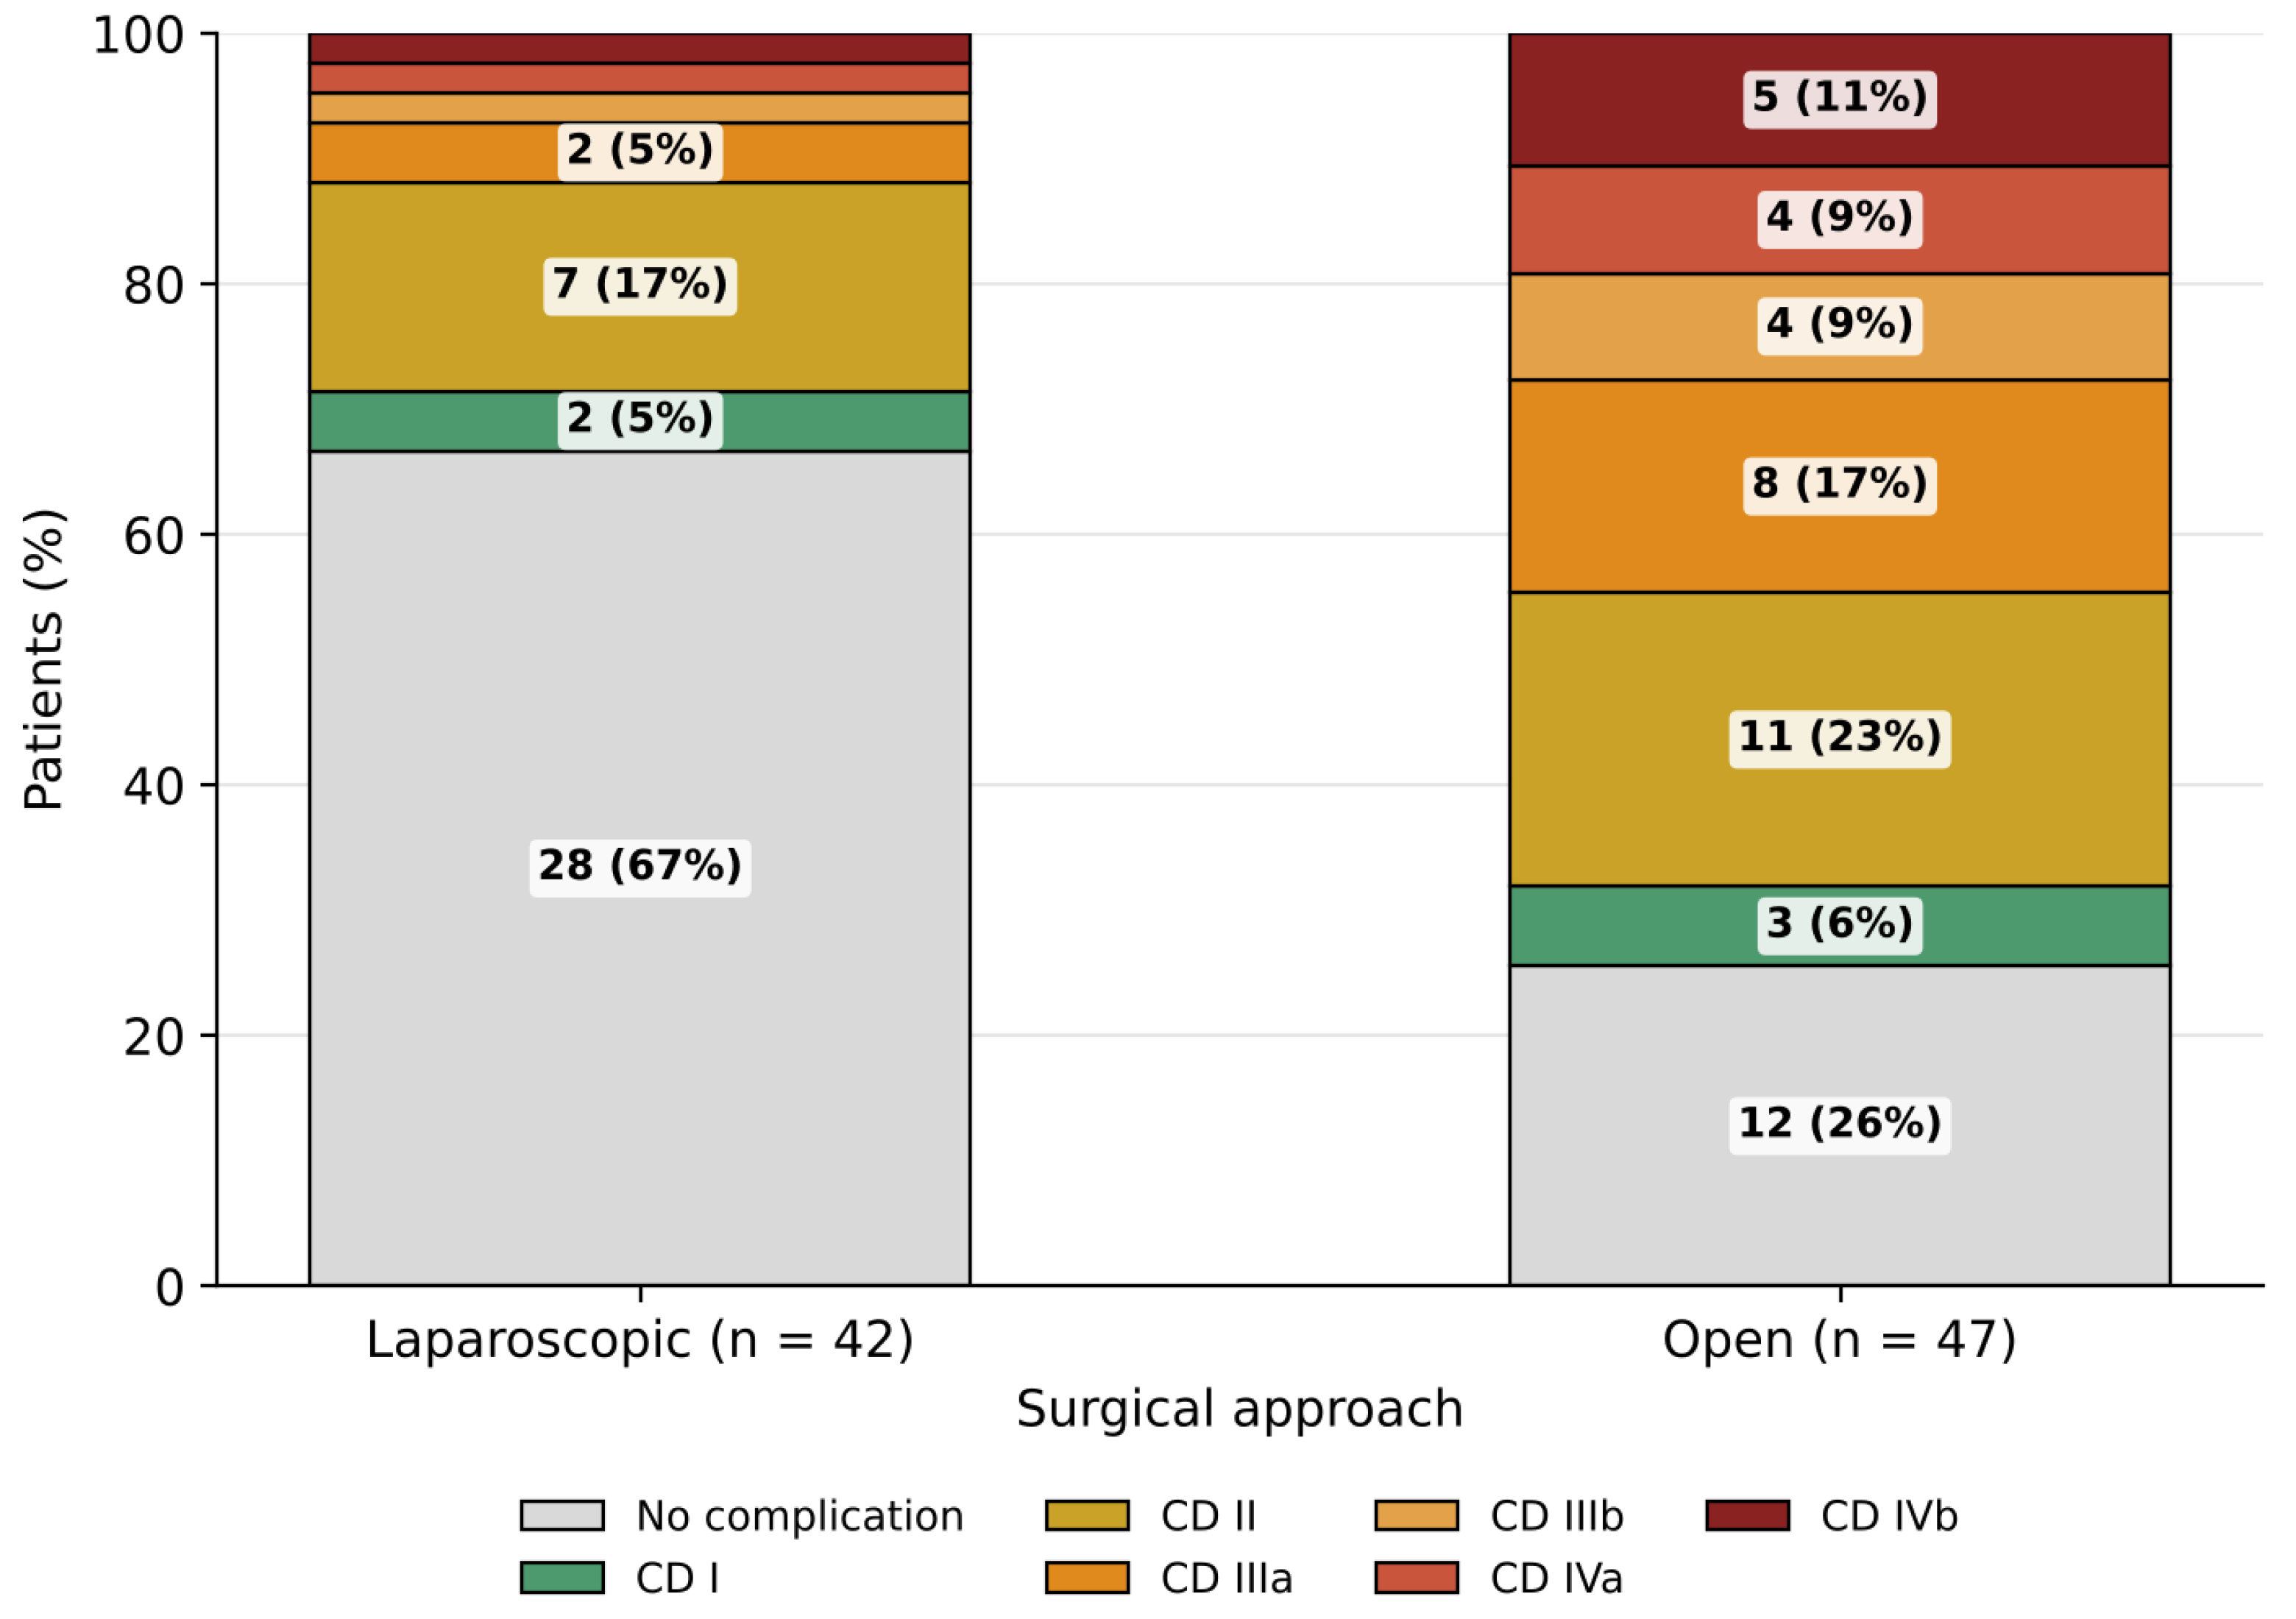
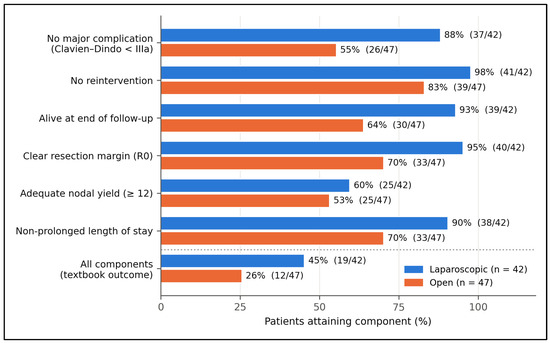
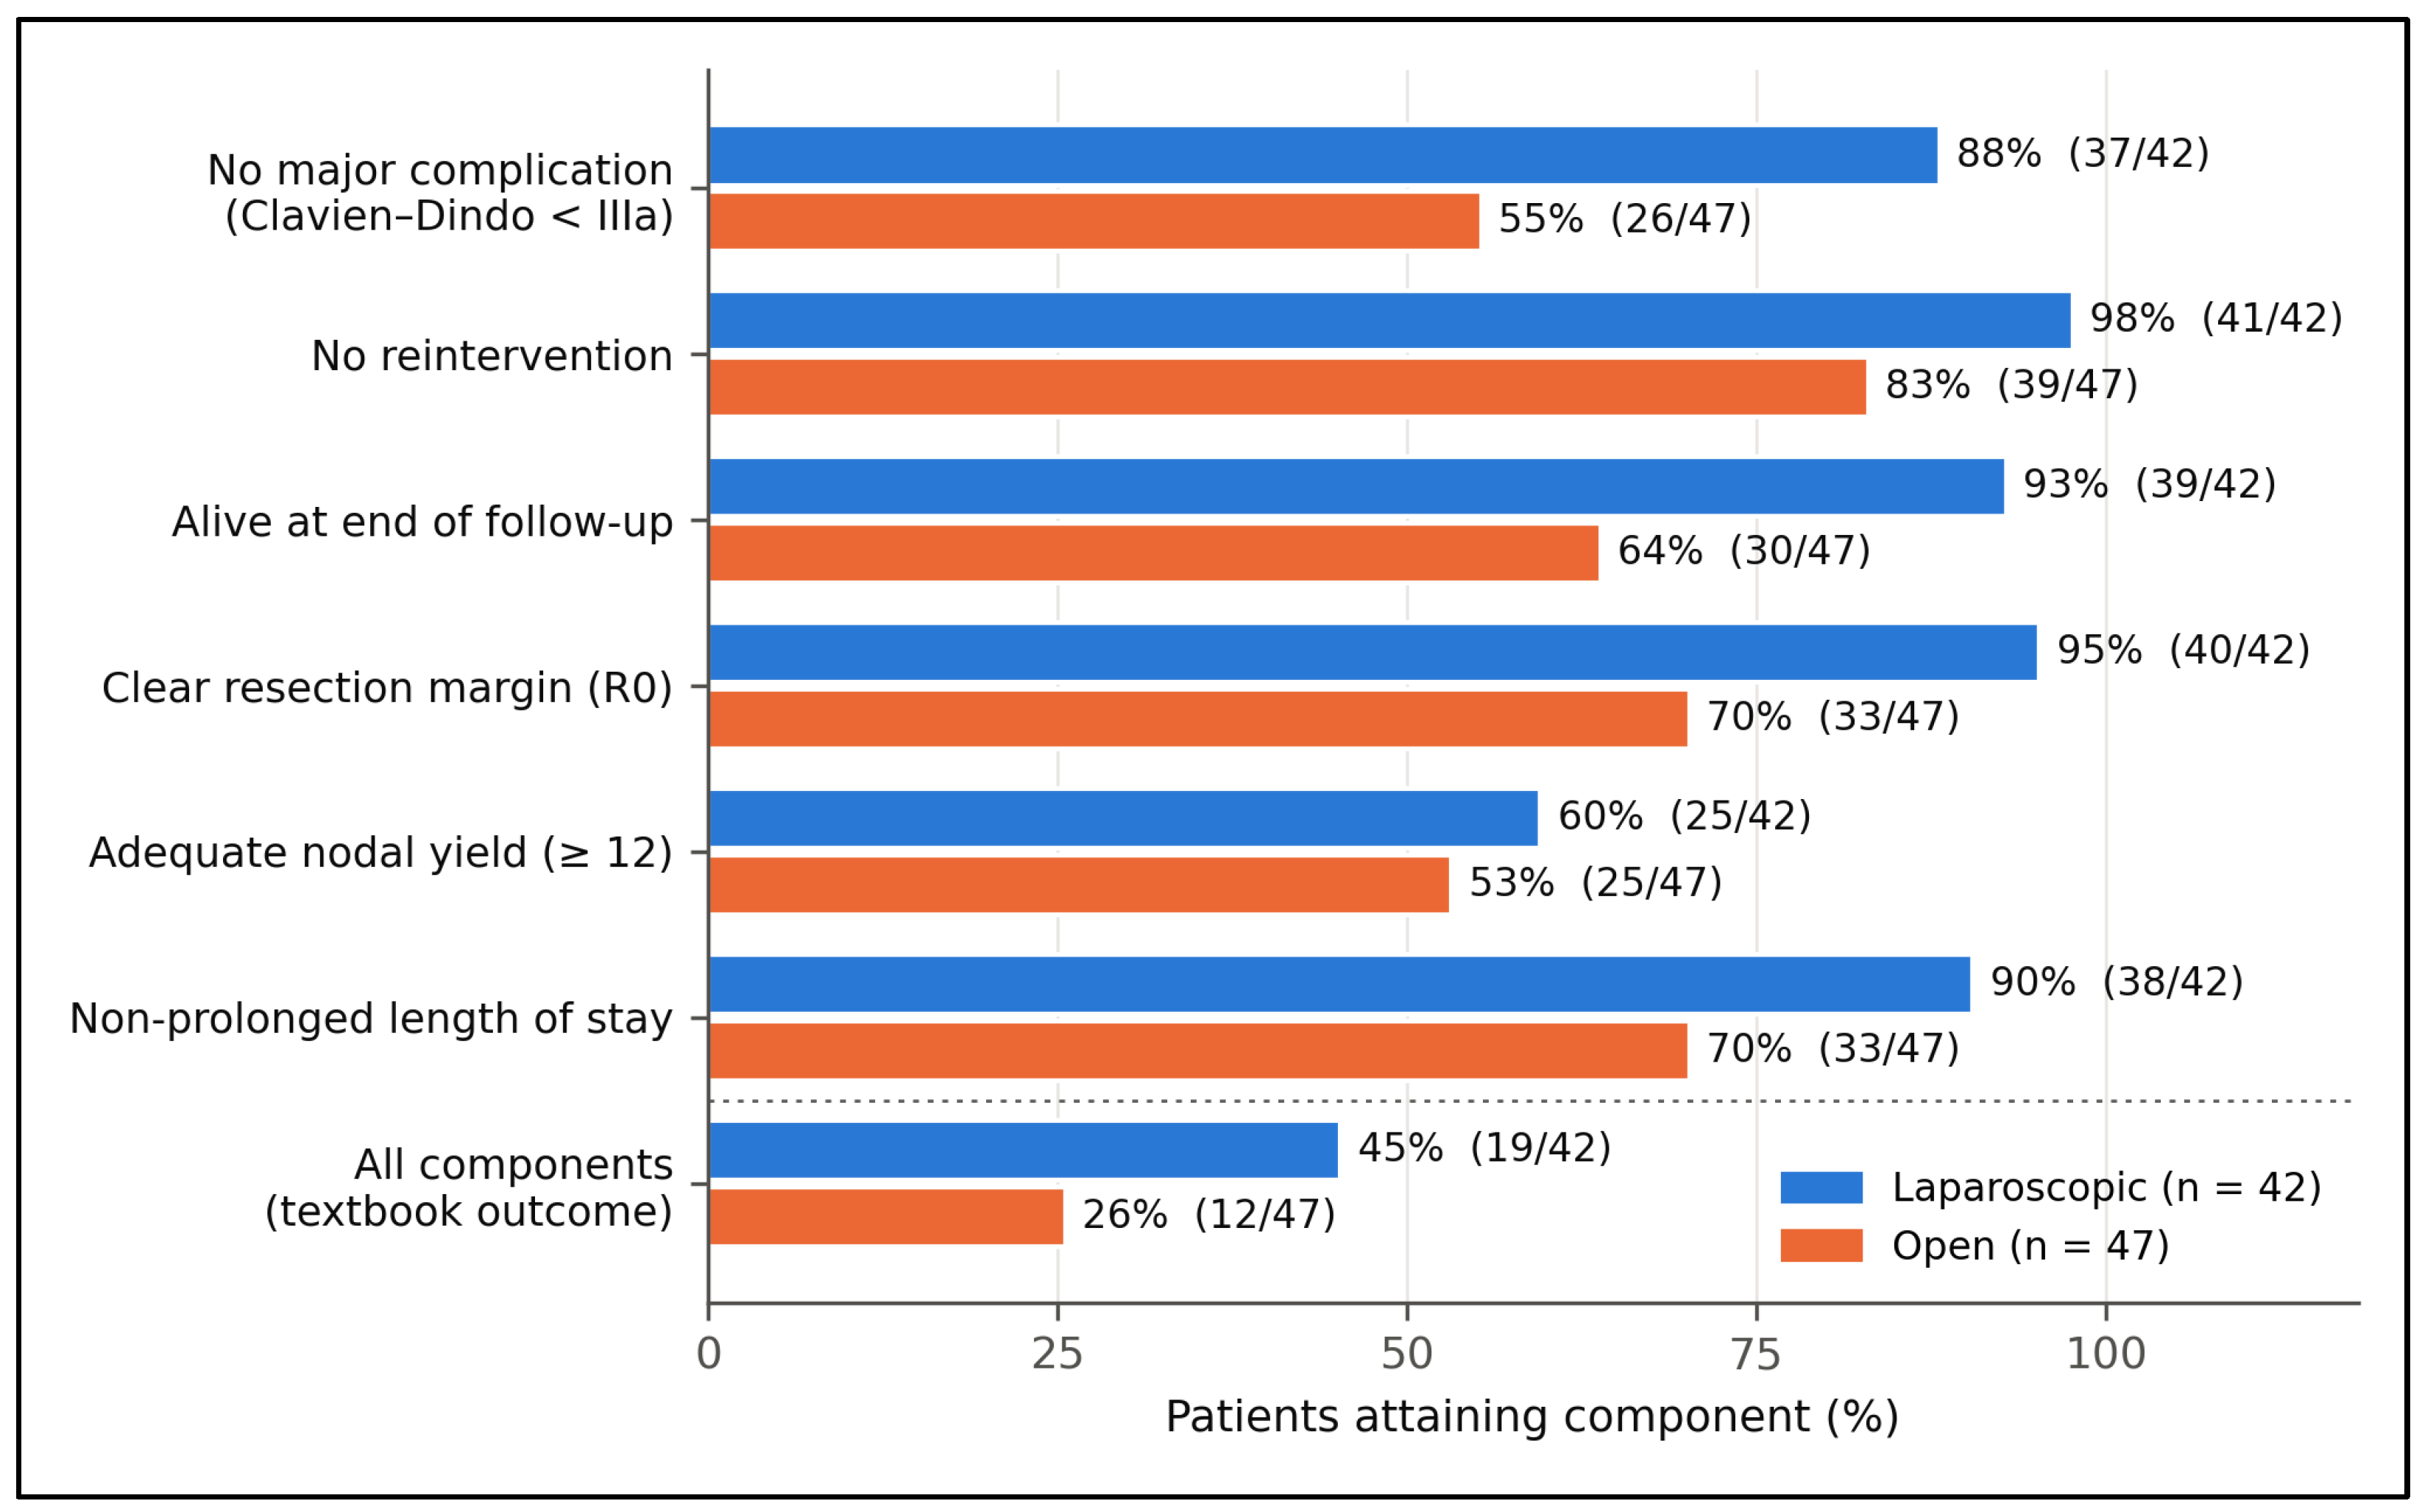
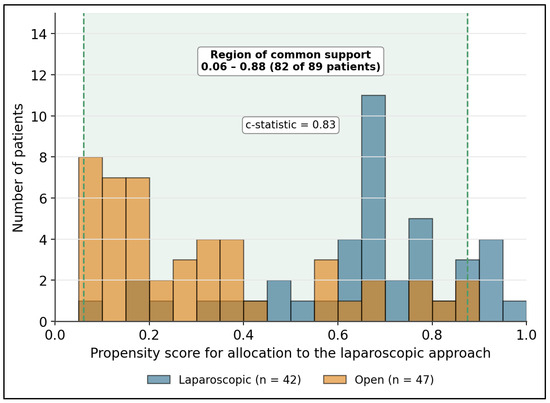
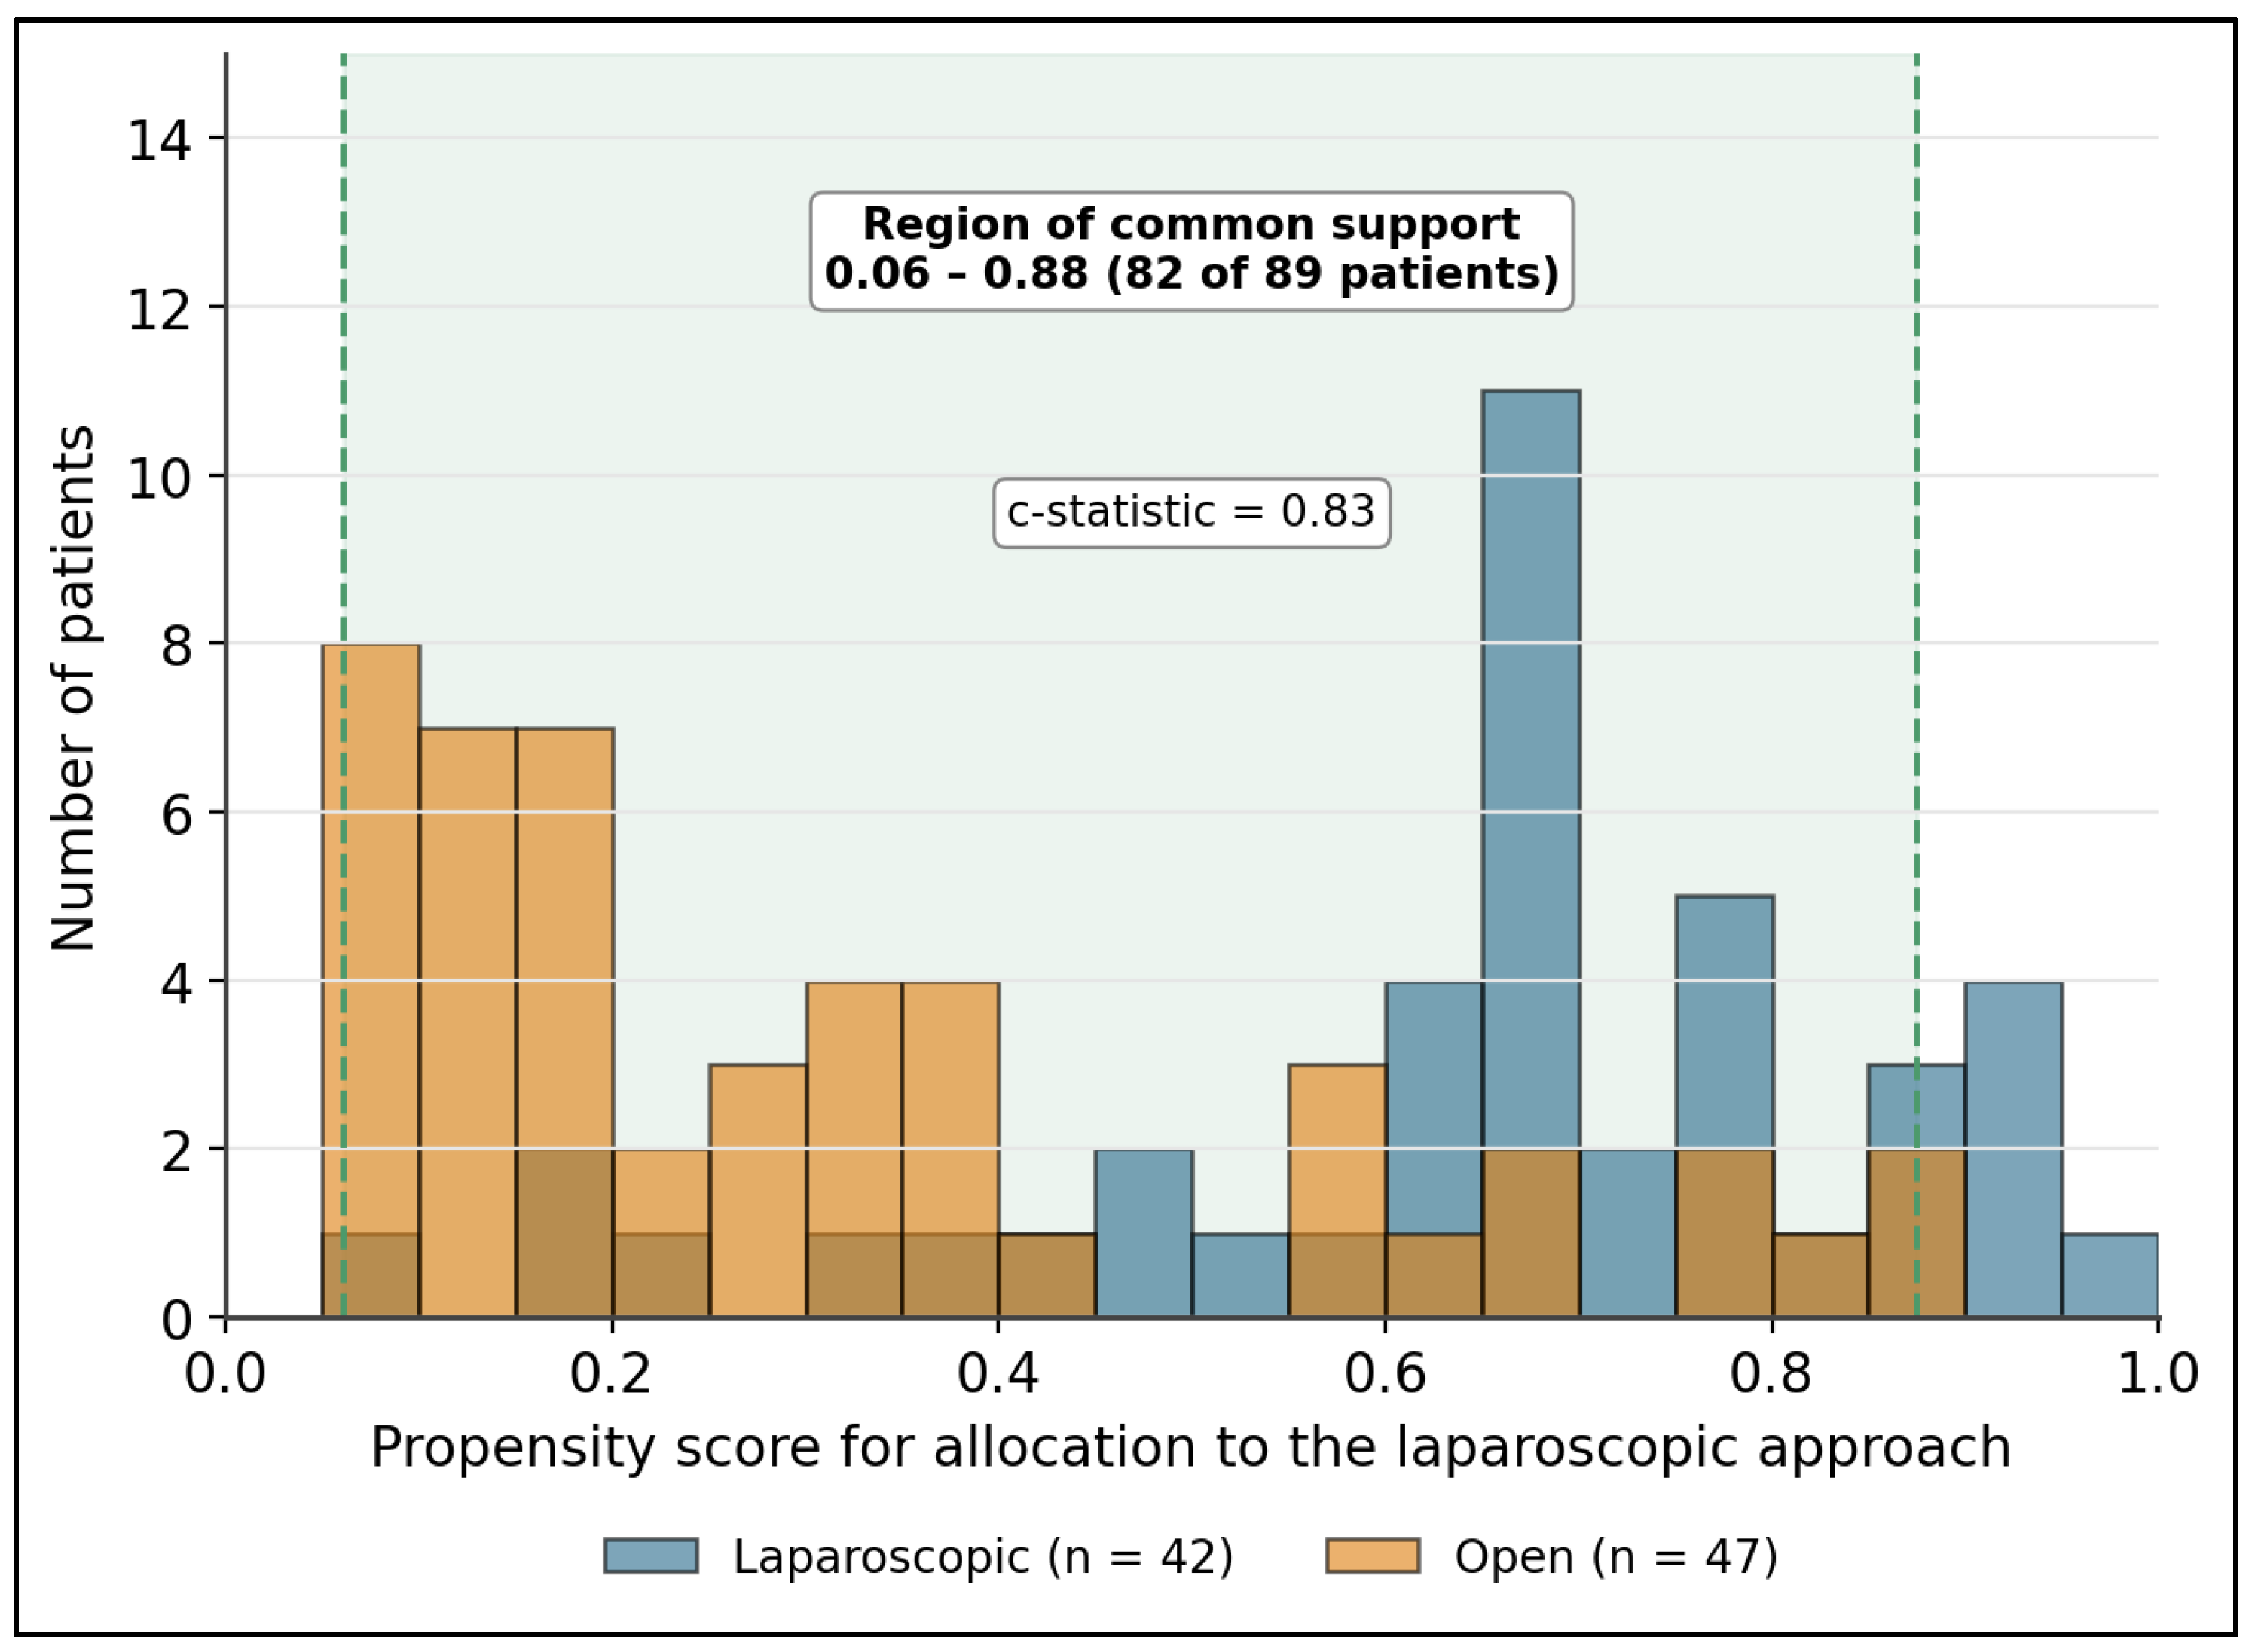
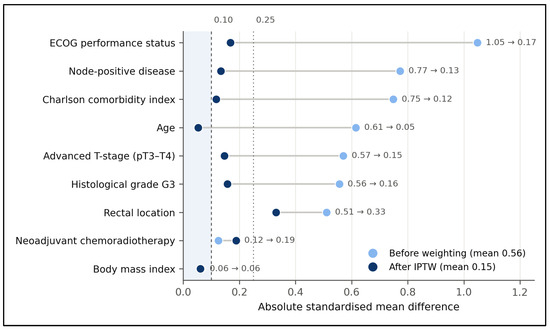
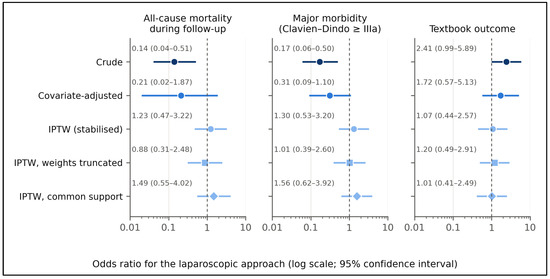
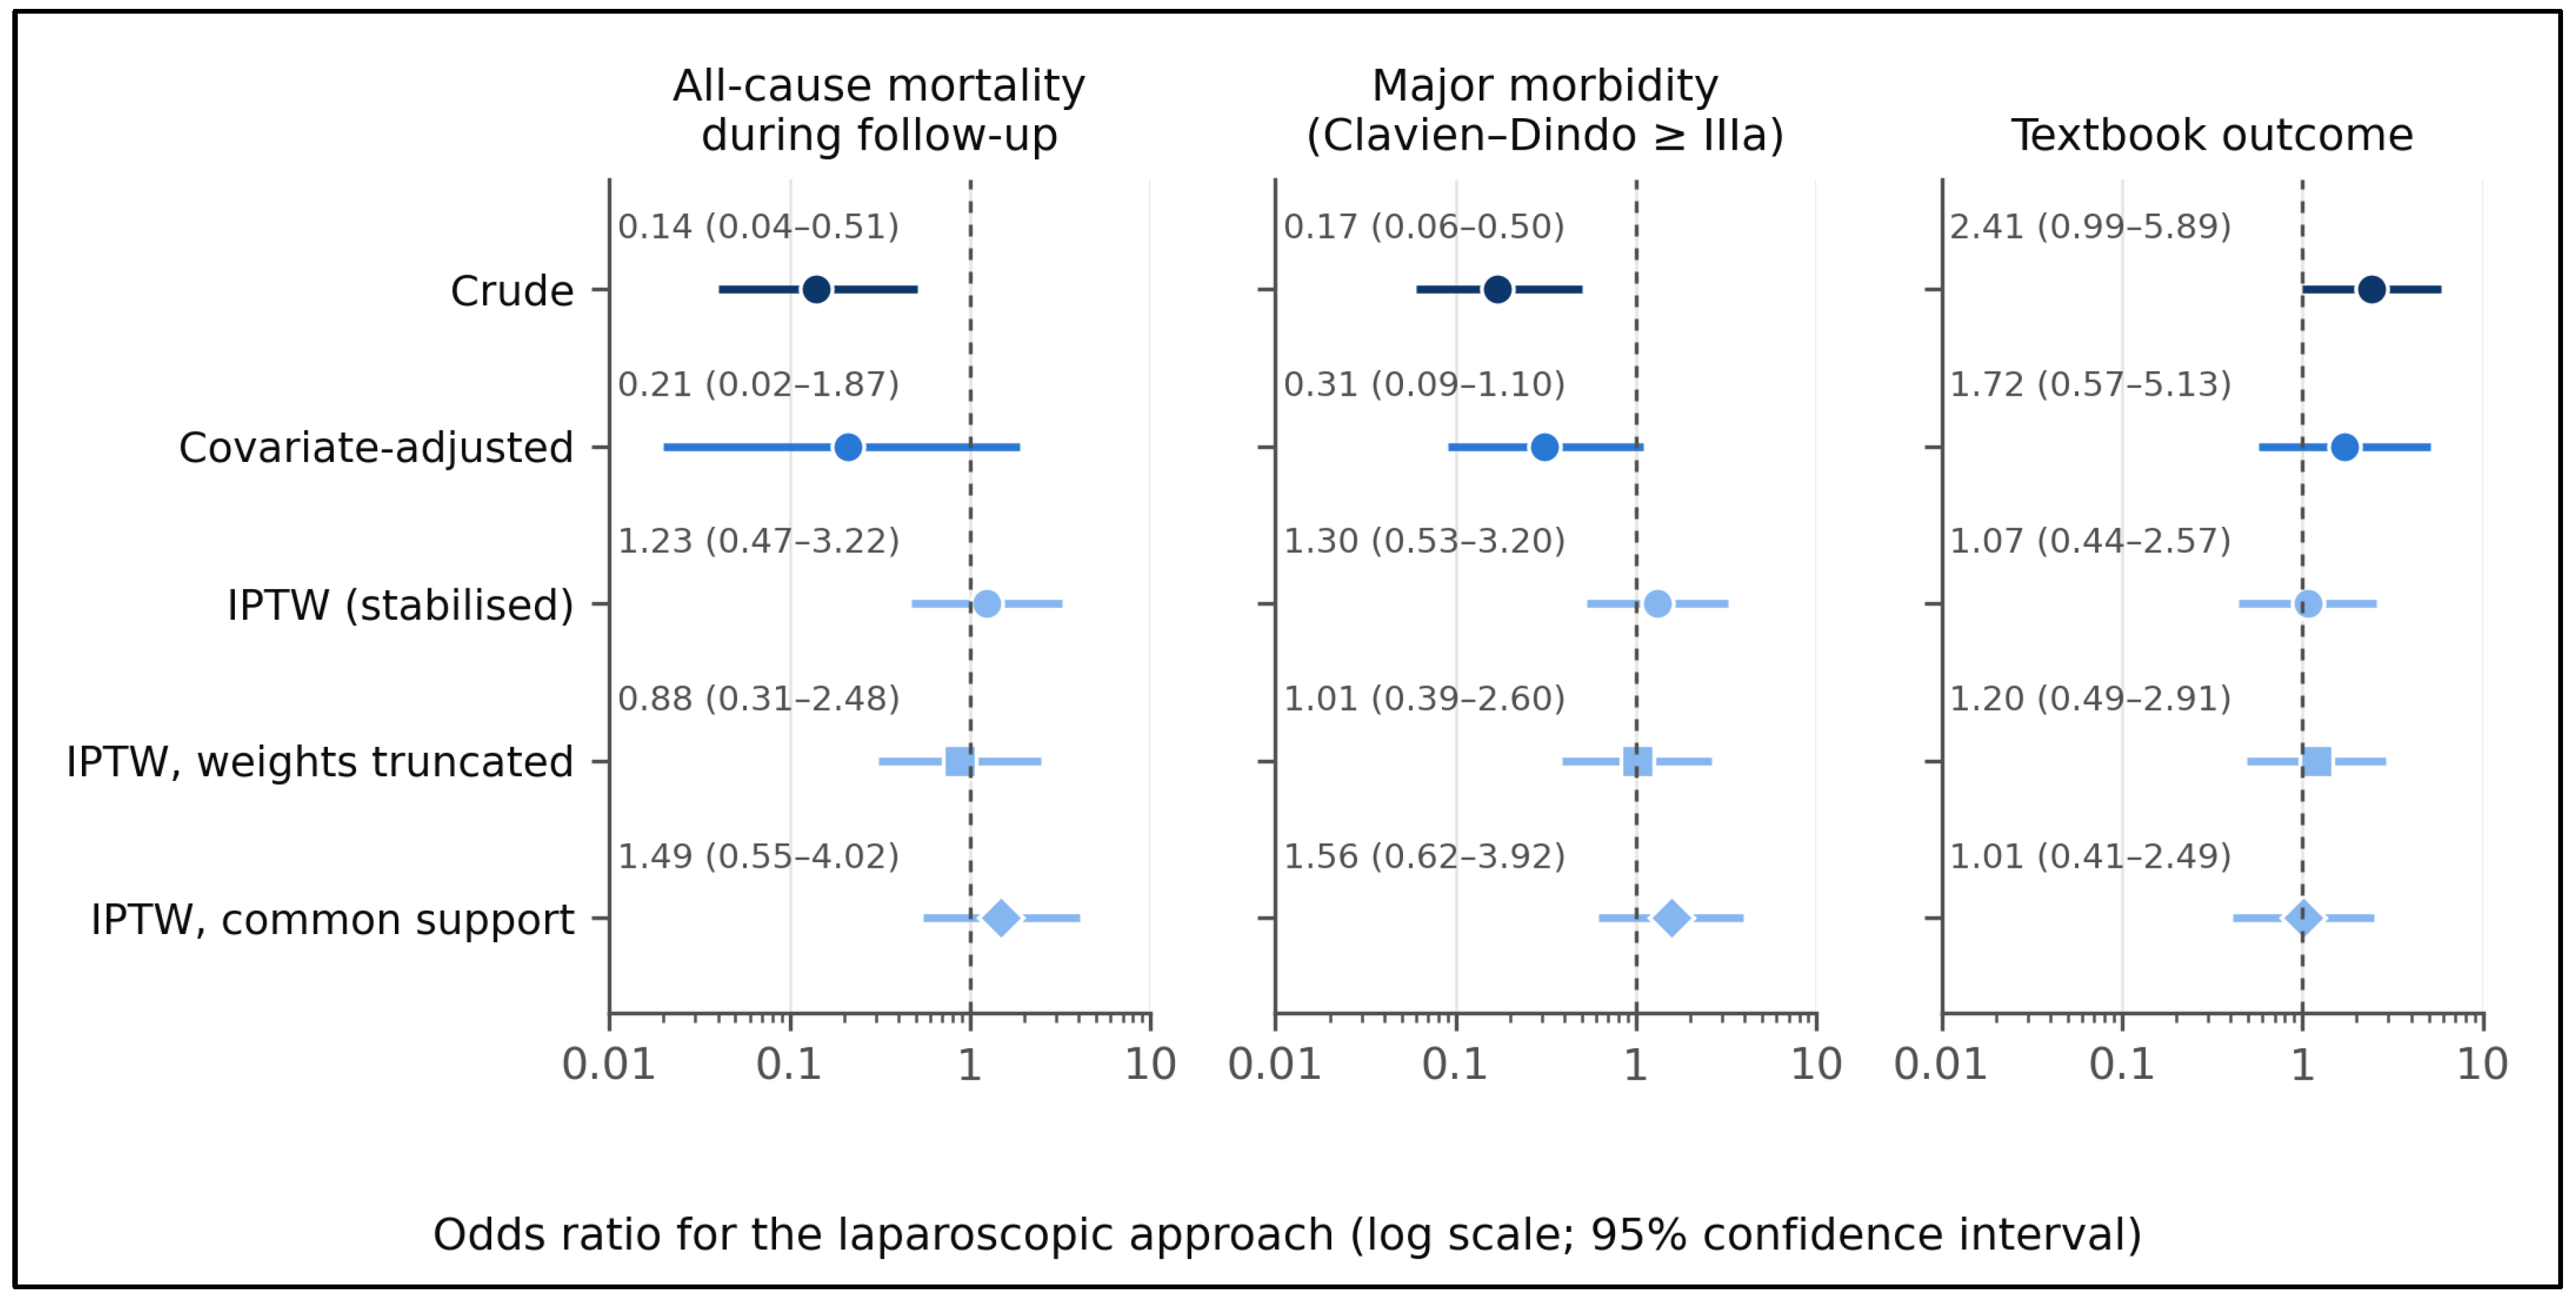
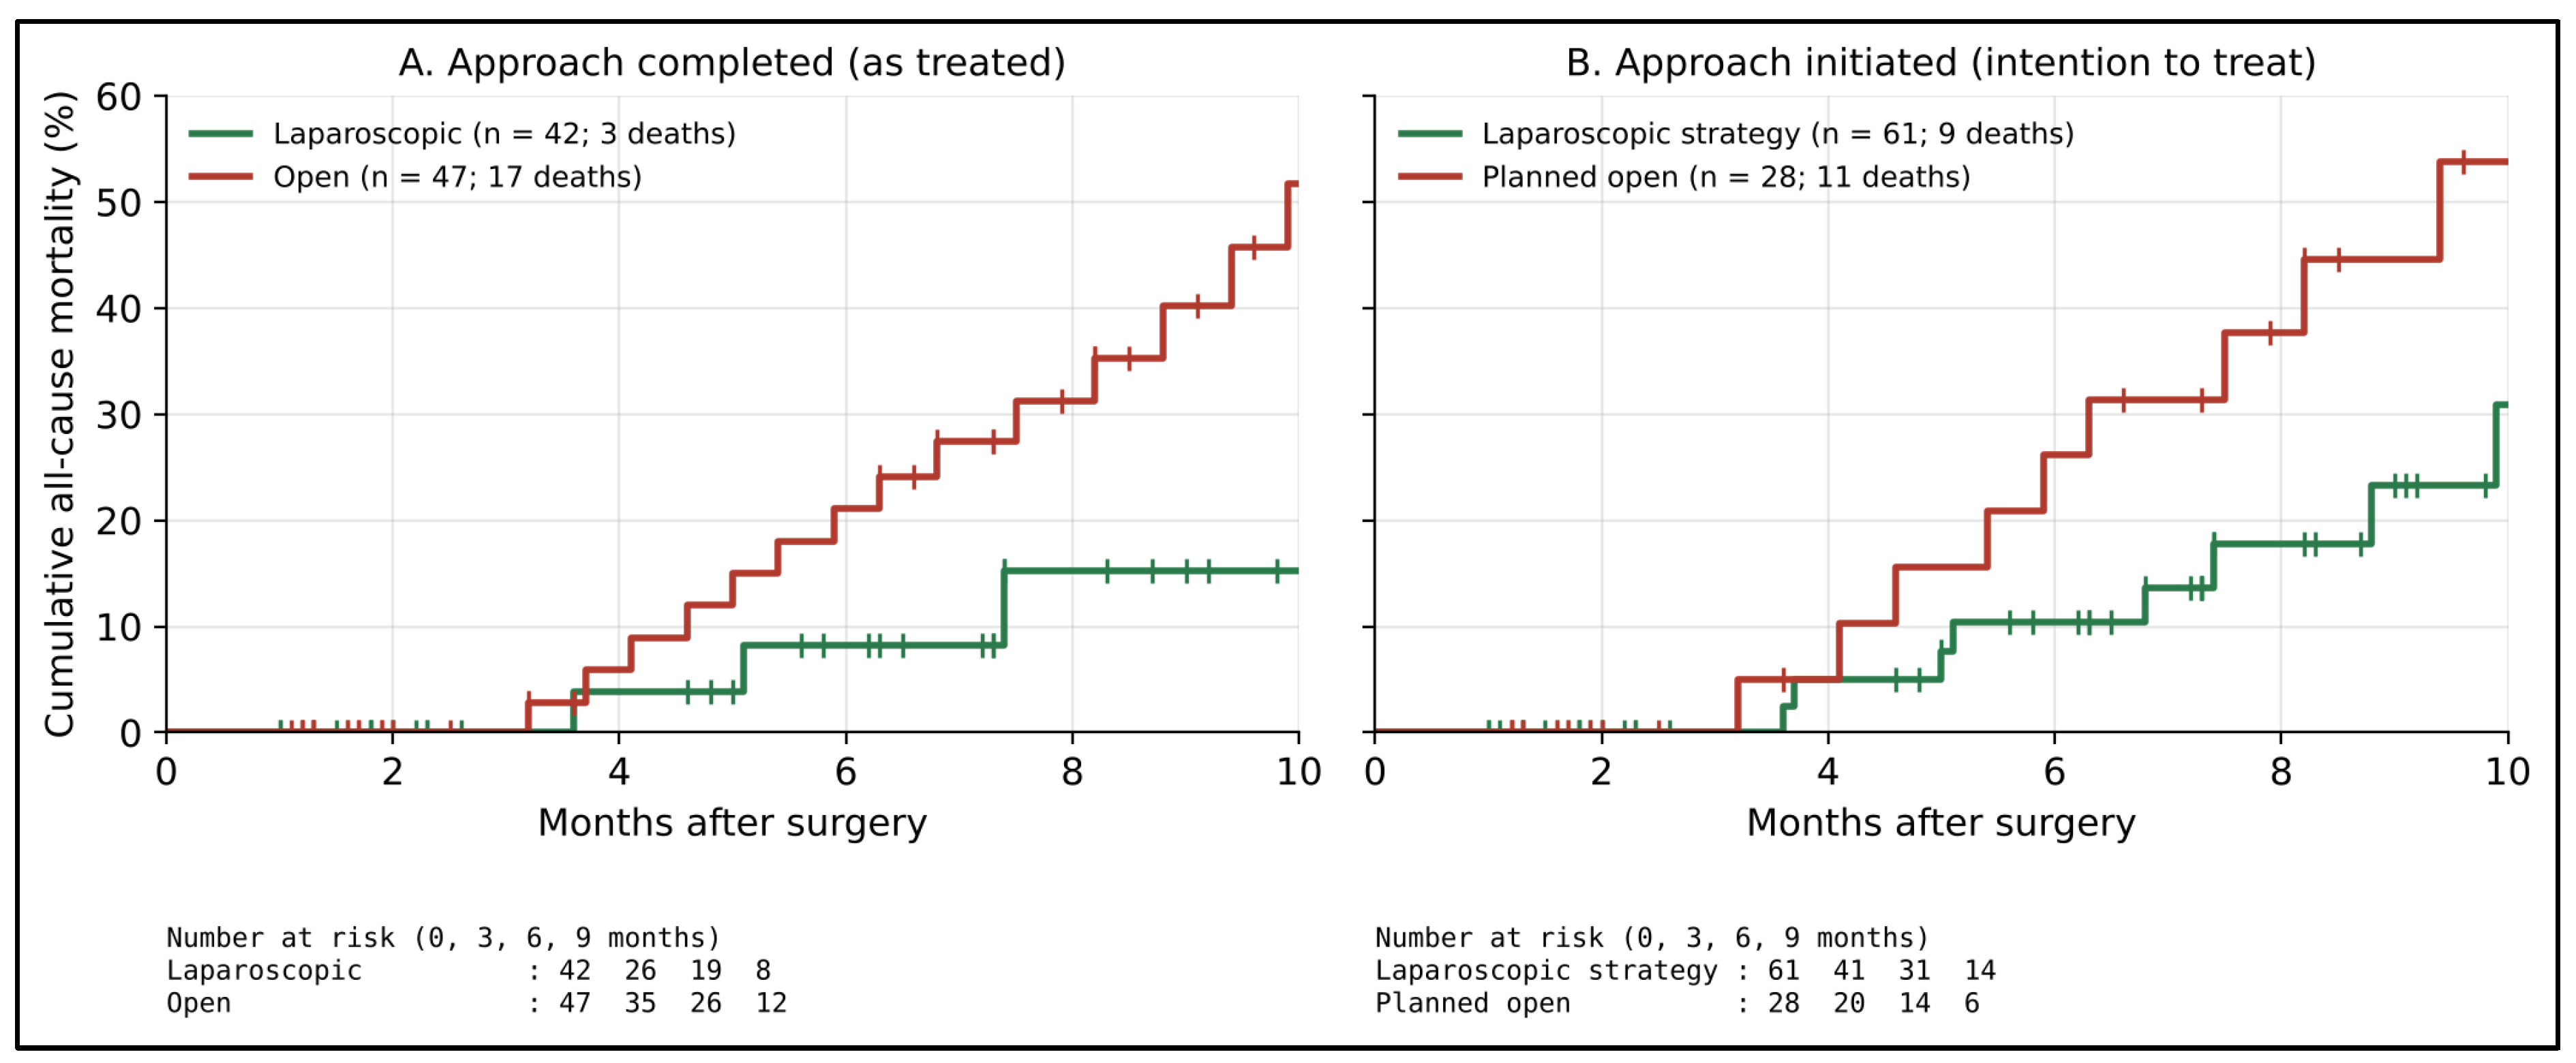

Disclaimer/Publisher’s Note: The statements, opinions and data contained in all publications are solely those of the individual author(s) and contributor(s) and not of MDPI and/or the editor(s). MDPI and/or the editor(s) disclaim responsibility for any injury to people or property resulting from any ideas, methods, instructions or products referred to in the content. |
© 2026 by the authors. Licensee MDPI, Basel, Switzerland. This article is an open access article distributed under the terms and conditions of the Creative Commons Attribution (CC BY) license.