


Abstract
Metaheuristic feature-selection studies can overstate optimizer-specific effects when data duplicates, unequal evaluation budgets, weak baselines and representation choices are not controlled. This study therefore presents a deduplicated, budget-matched benchmark of six recent metaheuristics for permanent magnet synchronous motor (PMSM) inverter fault diagnosis rather than proposing a new optimizer or deployable diagnostic system. After removing 17 surplus exact-duplicate rows, the primary analysis uses 10,875 unique observations, class-wise blocked nested validation and an approximately 300-unique-evaluation budget, together with genetic algorithm (GA), particle swarm optimization (PSO), differential evolution (DE), random search, deterministic greedy selection and classifier-representation controls. The Runge–Kutta optimizer (RUN) achieved a mean macro-averaged F1 score (macro-F1) = 0.9473 with 4.20 features, while greedy forward selection achieved 0.9476 with 5.00 features; their paired fold difference was negligible (exact sign-flip p = 0.9375), and the six recent optimizers did not differ significantly at fold level (Friedman p = 0.2428). The evidence therefore supports sparse feature search but not metaheuristic superiority. Because each fault class originates from one approximately 10 Hz recording, the conclusions are restricted to blocked within-session benchmarking and do not establish cross-session, high-frequency or deployment reliability.
1. Introduction
Permanent magnet synchronous motor (PMSM) drives are central to high-performance electric-drive systems because of their high-power density, efficiency, torque-to-inertia ratio and controllability. Their use extends across electrified transportation and industrial automation, where operating reliability is directly linked to the performance of the motor, inverter, sensing chain and control system [1,2,3]. Electrical parameter variation can further affect drive efficiency and operating behaviour, particularly in electrically propelled systems operating under changing thermal and load conditions [4,5,6]. The PMSM drive system is vulnerable to electrical, thermal and sensing faults that can degrade current regulation, torque production and operational safety. Mixed open-phase and current-sensor faults have been investigated in dual three-phase PMSM drives, where incomplete fault coverage can lead to serious loss of operating capability [7]. Recent PMSM diagnostic studies have also considered multi-state inverter, direct-current (DC) link capacitor and sensor faults using data-driven architectures [8], while demagnetization faults remain important because reduced flux linkage can impair dynamic performance and robustness to load variation [9]. Reliable diagnosis must support more than fault labelling. It should provide information that can assist fault containment, corrective control and safe continuation or shutdown of the drive. Fault-tolerant operation of inverter-fed PMSM drives has been examined under half-bridge faults [10], and control strategies have been developed for single-phase open-circuit faults to reduce torque ripple and copper loss [11]. Beyond PMSM applications, multi-source information fusion has been used to identify inverter-module faults in complex power-electronic systems, demonstrating the value of combining electrical and thermal measurements for diagnostic decision-making [12].
Recent work has increasingly applied intelligent methods to inverter and drive diagnosis. Transformer-based models have been used for hierarchical switch-fault diagnosis in four-leg inverters [13], while continuous-wavelet-transform-based deep learning has been used to diagnose and recover driving-module faults in electric vehicles [14]. Few-shot current-sensor diagnosis has also been investigated for PMSM systems, reflecting the practical difficulty of obtaining balanced labelled fault data across all operating conditions [15]. The selection and representation of diagnostic signals remain decisive. Non-invasive phase-current reconstruction can restore information needed by inverter-control and monitoring functions [16], while PMSM current-controller residuals have been incorporated into fault-status estimation under concurrent actuator and sensor failures [17]. Digital-twin-oriented co-simulation further shows how electromagnetic and inverter-control models can be combined to generate informative phase-current signatures for PMSM inter-turn short-circuit diagnosis [18].
Physics-based modelling and data-driven analysis are therefore complementary rather than competing approaches. Finite-element modelling can generate controlled signatures of incipient PMSM winding faults across severity and operating conditions [19], and leakage-current monitoring has been used for insulation-fault diagnosis in electric propulsion motors [20]. Physical constraints can also improve the relevance of learned features under changing loads, as demonstrated by physics-embedded attention for electromechanical performance evaluation [21]. However, high diagnostic accuracy alone does not establish reliable generalization. PMSM fault prediction models must remain robust to changing operating conditions and evolving fault signatures [22], while thermal-demagnetization studies show that uncertainty and safe operating boundaries require explicit treatment rather than simple point prediction [23]. Strict sequential partitioning has similarly been used in electric-machine fault diagnosis to reduce leakage between training and test data, especially when observations are temporally ordered or generated under closely related simulated conditions [24].
Generalization should also be assessed beyond a single acquisition setting. Cross-laboratory evaluation has demonstrated that diagnostic performance can change when motor rating, inverter configuration and operating conditions differ from those used for training [25]. Severity-estimation research further shows that models trained on limited simulated or experimental fault levels can struggle to extrapolate to unobserved conditions [26]. Multi-modal synchronous motor diagnosis has consequently adopted divergent signal representations and attention mechanisms to improve the extraction of complementary fault information [27]. The difficulty increases in integrated electromechanical systems, where a measured signature may reflect interactions among the motor, inverter, mechanical load, sensors and control loops [28]. Reconstruction of monitoring information is important in high-autonomy electric actuation systems [29], and coupled dynamic modelling has been used to examine how external loading affects underwater vehicle drive behaviour [30]. In integrated electric-drive units, weak early fault signatures can also be masked by strong multi-source excitation and electromechanical coupling [31].
These constraints motivate a benchmarking question rather than a deployment claim: when optimizer-assisted feature selection is evaluated on a fixed PMSM inverter testbed, which conclusions survive strict controls on data integrity, temporal separation, computational budget, comparator strength and classifier representation? Recent inverter-diagnosis work has shown that leakage-aware model selection and conventional feature-selection methods can materially affect reported performance [32,33,34,35]. The purpose of the present study is therefore not to add another optimizer ranking but to test whether such a ranking remains scientifically defensible after those controls are imposed. Metaheuristic wrapper feature selection is well established, with genetic algorithm (GA), particle swarm optimization (PSO) and differential evolution (DE) providing classical evolutionary and swarm baselines [36,37,38], while the arithmetic optimization algorithm (AOA), weighted mean of vectors optimizer (INFO), Runge–Kutta optimizer (RUN), Henry gas solubility optimization (HGSO), slime mould algorithm (SMA) and coot bird optimizer (COOT) provide contrasting arithmetic, weighted-vector, numerical-integration, physics-based, oscillatory and leader-chain update mechanisms [39,40,41,42,43,44]. Fair benchmarking requires explicit accounting for objective evaluations and simple controls [45,46,47,48]. A recent companion benchmark on the same public PMSM testbed examined a disjoint classical set comprising GA, PSO, DE, artificial bee colony (ABC), grey wolf optimizer (GWO) and whale optimization algorithm (WOA) and showed that search-process reporting can change the interpretation of endpoint rankings [49]. The present manuscript asks a different and more stringent question: whether conclusions about six recent optimizers remain defensible after exact-duplicate removal, matched unique-evaluation budgets, deterministic and random controls, decoded-representation auditing and paired classifier/feature-representation tests. The scientific contribution is therefore a controlled falsification test of optimizer-specific claims, not a second proposal of a new optimizer or classifier.
The methodological contribution is an auditable benchmark protocol with five safeguards: (1) data-integrity auditing before model comparison; (2) class-wise blocked nested validation with explicit temporal-gap sensitivity; (3) matched unique decoded objective evaluation budgets rather than equal iteration counts; (4) comparison against GA, PSO, DE, random search, full-feature Gaussian Naive Bayes (GNB), and deterministic greedy forward selection; and (5) separate analysis of decoded feature diversity and classifier/representation effects. The corresponding research questions are: RQ1, do the six recent optimizers differ in held-out macro-averaged F1 score (macro-F1) under the same deduplicated and budget-matched protocol? RQ2, does any recent optimizer provide an accuracy or sparsity advantage over conventional, random or deterministic controls? RQ3, how sensitive are conclusions to exclusion gap, objective design and feature representation? RQ4, what do matched-budget search trajectories and decoded solutions reveal when endpoint differences are small? An optimizer-specific advantage is claimed only when it exceeds the relevant control under the identical outer folds and is supported by fold-level inference; otherwise, the result is reported as no evidence of superiority, not as equivalence.
The remainder of the paper is organized as follows. Section 2 defines the diagnostic testbed and the controlled benchmark protocol. Section 3 reports only deduplicated analyses used for the scientific conclusions: data-integrity and gap sensitivity, the primary matched-budget benchmark and controls, objective-design sensitivity, classifier/representation sensitivity and decoded-solution/search-process analysis. Section 4 discusses the methodological implications and the strict boundary of inference. Section 5 concludes the paper.
2. Materials and Methods
2.1. Mathematical Modelling
2.1.1. PMSM Inverter Diagnostic Testbed
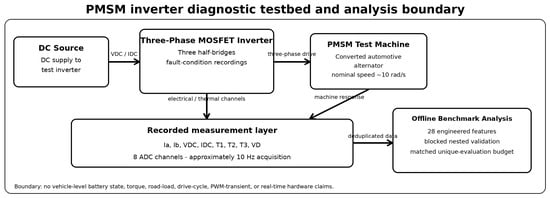
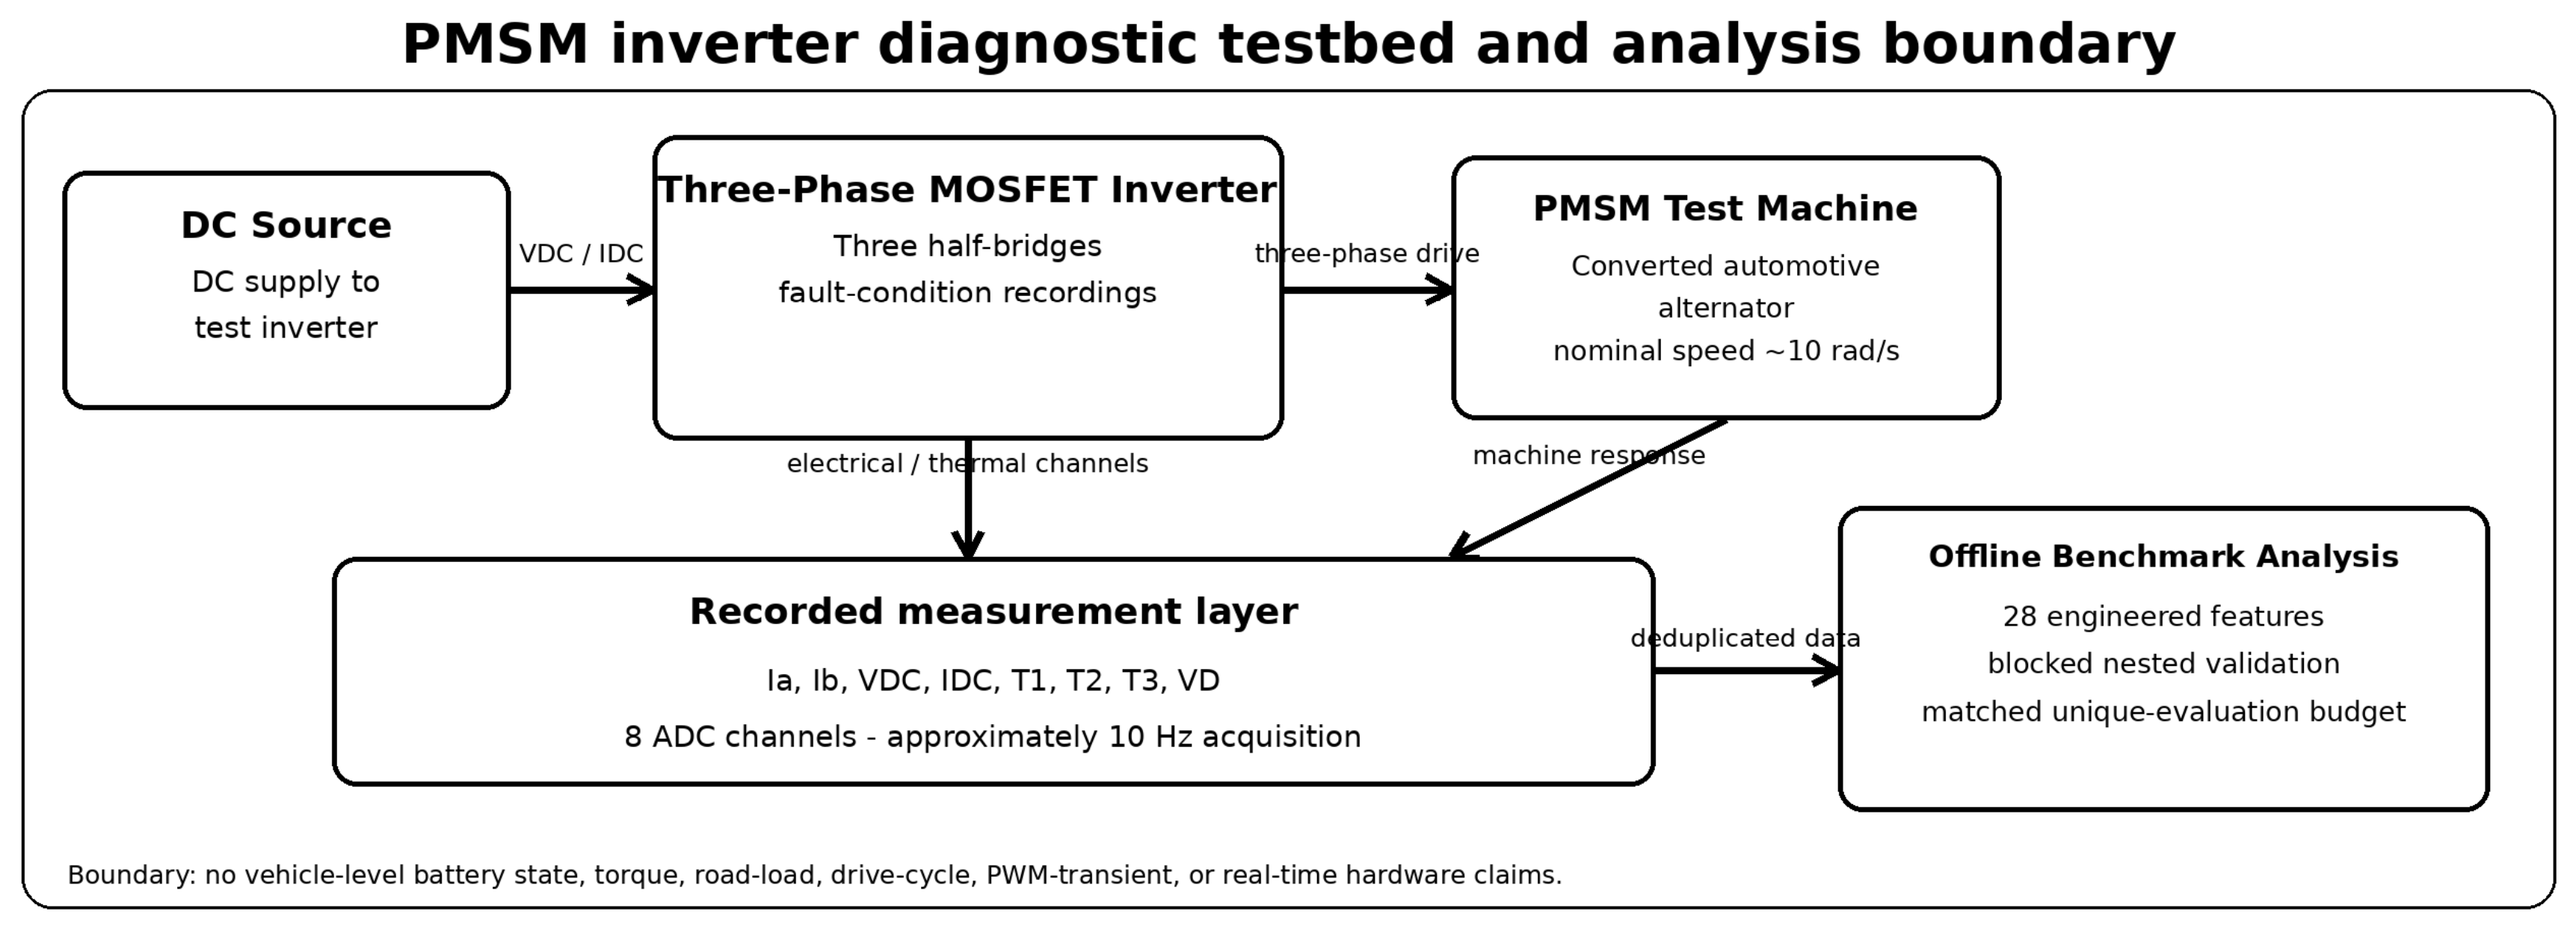
Figure 1 defines the PMSM inverter diagnostic testbed and the analysis boundary used in this benchmark. The public source package contains a DC-fed three-phase metal–oxide–semiconductor field-effect transistor (MOSFET) voltage-source inverter driving a converted automotive alternator operated as a PMSM at nominally 10 rad/s [50,51]. The recorded variables are phase-current channels Ia and Ib, DC-bus voltage VDC, DC-bus current IDC, half-bridge-temperature channels T1–T3 and driver-supply voltage VD. Only these eight recorded electrical and thermal channels enter the analysis. No vehicle-level battery state, torque, road-load, drive-cycle, high-frequency switching or real-time hardware measurements are introduced.
Figure 1.
Permanent magnet synchronous motor (PMSM) inverter diagnostic testbed and analysis boundary. The eight recorded channels are Ia, Ib, VDC, IDC, T1, T2, T3 and VD; the offline benchmark uses the deduplicated recordings and does not represent a vehicle-level or real-time hardware validation experiment. DC: direct current; MOSFET: metal–oxide–semiconductor field-effect transistor; ADC: analogue-to-digital converter; PWM: pulse-width modulation.
At observation t, the raw measurement vector is defined as
The class label is
Thus, ∈ ℝ8. F0 represents normal operation and F1–F8 represent the eight inverter-fault conditions in the source data. The raw analogue-to-digital converter (ADC) values are retained because the supplied metadata do not establish all physical-unit conversions. This prevents unsupported interpretation of the channels as fully calibrated physical measurements. The engineered diagnostic representation is obtained by
where φ(·) produces the 28 candidate features from raw signals, centred electrical channels, current magnitude and imbalance proxies, voltage interactions, thermal extrema, thermal spread and bridge-temperature differences. Table 1 defines the principal variables used throughout the diagnostic model.
Table 1.
Variables of the permanent magnet synchronous motor (PMSM) inverter diagnostic model.
2.1.2. PMSM Inverter Diagnostic Model and Variables
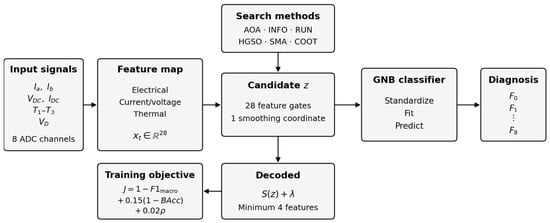
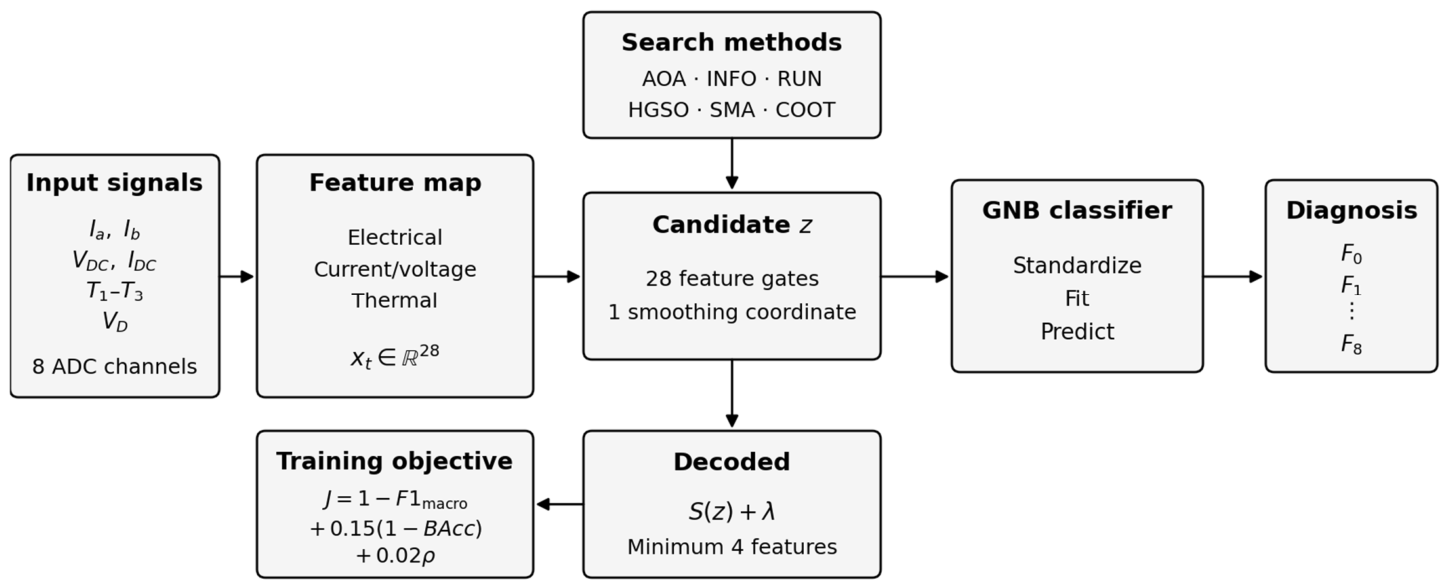
Figure 2 shows the PMSM inverter diagnostic model used in this study. The eight recorded signals are mapped to 28 candidate diagnostic features. A 29-coordinate candidate controls 28 feature gates and one Gaussian Naive Bayes (GNB) variance-smoothing coordinate. The selected representation is standardized, fitted and scored using the current training partition only. Variance-smoothing selection is a classifier hyperparameter optimization step; it is not probability calibration. Probability calibration is assessed only after model fitting using Brier score and expected calibration error. The measurement boundary remains restricted to Equation (1); related sensorless and electromagnetic monitoring methods may use additional quantities that are absent here [52,53].
Figure 2.
Permanent magnet synchronous motor (PMSM) inverter diagnostic model showing the raw signals, engineered representation, joint feature-mask and variance-smoothing candidate, Gaussian Naive Bayes (GNB) classifier and training-only objective. ADC: analogue-to-digital converter; BAcc: balanced accuracy; macro-F1: macro-averaged F1 score. AOA: arithmetic optimization algorithm; INFO: weighted mean of vectors optimizer; RUN: Runge–Kutta optimizer; HGSO: Henry gas solubility optimization; SMA: slime mould algorithm; COOT: coot bird optimizer.
2.1.3. Search Representation and Embedded Objective
Each candidate z ∈ [0, 1]29 contains 28 continuous feature gates and one variance-smoothing coordinate:
The selected feature set is
Here, j = 1,..., 28. Candidates with fewer than four selected features are treated as infeasible, and the smoothing coordinate selects one of 24 fixed variance-smoothing values.
For every candidate, standardization is learned within the relevant training partition only. The embedded classifier is fitted using the selected subset and smoothing value. Let ρ(z) = |S(z)|/28 denote the selected feature proportion. The composite diagnostic loss, using macro-F1 and balanced accuracy (BAcc), is
The common objective minimized by all six methods is
The first two terms reward multiclass discrimination, whereas the final term penalizes unnecessarily large feature subsets. The coefficients 0.15 and 0.02 were prespecified design choices rather than theoretically optimal values; their sensitivity is examined in Section 3.3. All objective evaluations are training-only. No calibration metric is optimized by J(z).
2.2. Dataset and Fault Taxonomy
The public source package contains 10,892 observations acquired from a custom three-phase MOSFET voltage-source inverter driving a converted automotive alternator operated as a PMSM at nominally 10 rad/s [50,51]. The acquisition system uses two Hall-effect current channels with nominal 100 mV/A sensitivity, voltage-sensing channels based on the same analogue front-end and resistive scaling, three 10 kΩ negative temperature coefficient (NTC) thermistor channels, and a 100-pulse-per-revolution position encoder. The eight analysis channels are Ia, Ib, VDC, IDC, T1-T3 and VD. The analogue channels are sampled at approximately 10 Hz (median raw interval 0.101 s), and each class is represented by one recording. The peer-reviewed dataset description explicitly notes that this rate captures steady-state/thermal behaviour but not high-frequency switching transients [51]. Accordingly, the data are used here as a fixed within-session benchmarking testbed, not as evidence of real-time electric-vehicle (EV) fault coverage. Table 2 reports the nine released operating/fault conditions and their class counts.
Table 2.
Verified class distribution in the attached public dataset. HB1–HB3 denote half-bridges 1–3.
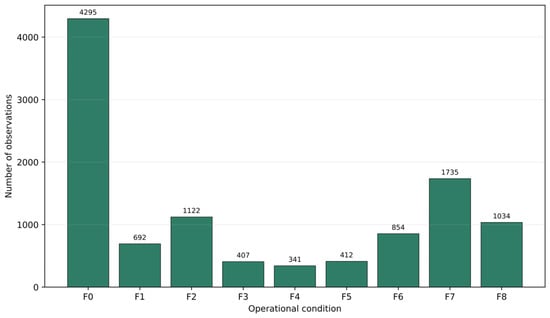
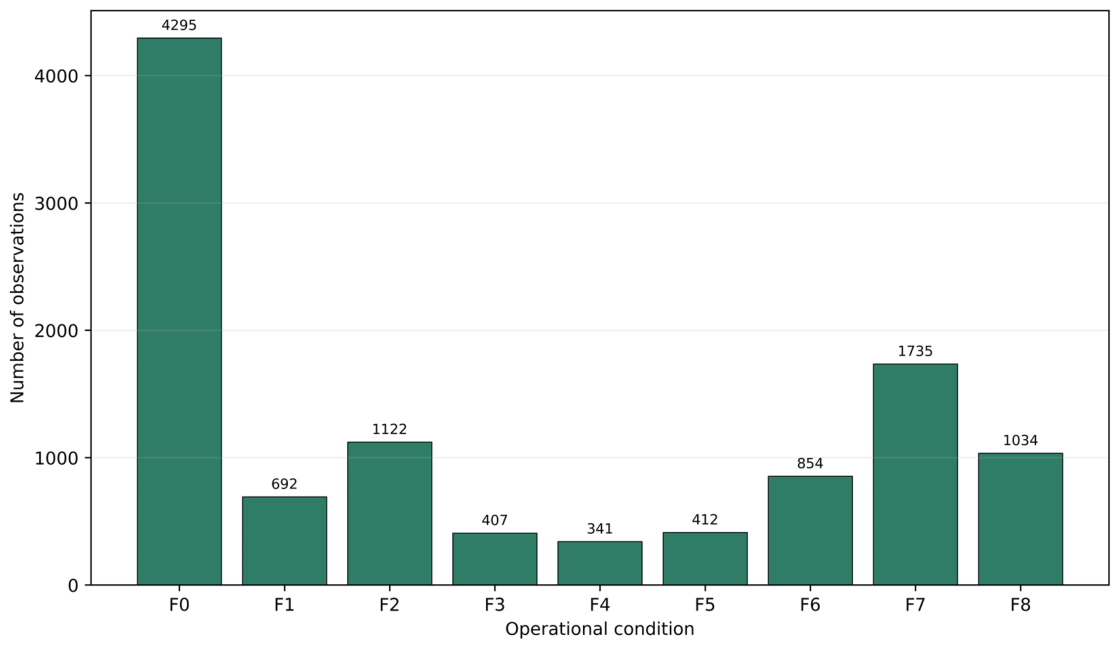
The taxonomy is asymmetric because the released dataset contains only half-bridge 2 (HB2) high-side and half-bridge 3 (HB3) low-side open-circuit recordings; unmeasured half-bridge 1 (HB1) or complementary open-circuit states are not synthesized. Class F7 is not a typographical error: the source file is explicitly labelled as the simultaneous HB1-and-HB2 overtemperature condition. These omissions limit fault-space coverage and are treated as a validity restriction rather than as negative examples of absent faults. Figure 3 visualizes the corresponding class-count imbalance across the nine conditions.
Figure 3.
Sample counts for the normal condition and eight inverter-fault classes.
2.3. Data Audit and Feature Engineering
Raw ADC values were retained because the supplied metadata do not establish all physical-unit conversions. Electrical channels were centred at the nominal 10-bit ADC midpoint:
The automated checks summarized in Table 3 confirm 10,892 released observations across nine classes, eight raw sensor channels and 28 engineered features, with no missing or infinite values. An exact-duplicate audit identified 17 surplus rows (33 rows participating in 16 duplicate groups). Six duplicate groups crossed outer-block assignments, and nine exact-duplicate test-to-training instances could survive the originally considered 10-sample exclusion rule. All scientific results reported in Section 3 therefore use the deduplicated 10,875-row dataset. An earlier exploratory search archive generated before this audit was discarded from the manuscript evidence base and is not used for performance ranking, statistical inference, search-efficiency claims or conclusions.
Table 3.
Automated checks performed on the raw and engineered data. ADC: analogue-to-digital converter.
The resulting 28-feature set contains raw channels, centred signals, current magnitude and imbalance proxies, voltage differences, electrical interactions, thermal extrema, thermal spread and pairwise bridge-temperature differences.
2.4. Blocked Nested Validation
Observations were retained in their within-class acquisition order. Each class was divided into five contiguous outer blocks. Outer fold k held out block k from every class, while a symmetric exclusion gap was removed from the adjacent training portion within each class. Inner validation used the same rule: the outer-training observations were split into three class-wise contiguous inner blocks, and the specified gap was deleted symmetrically around each inner validation boundary. The primary deduplicated benchmark uses a 10-sample exclusion gap. Autocorrelation function (ACF) analysis showed that the median first lag below |ACF| = 0.1 was 11 samples for both current channels, whereas most voltage/current-driver channels decorrelated earlier and some slowly varying thermal channels retained long dependence. At lag 10, the median absolute ACF across class-channel combinations was 0.0647, but the maximum remained 0.9645. Thus, a 10-sample gap reduces adjacency leakage but cannot be claimed to eliminate all temporal dependence. Section 3.1 reports sensitivity at gaps of 0, 10, 25, 50 and 100 samples on the deduplicated dataset.
The protocol therefore measures blocked within-session generalization only. Each fault label is confounded with one acquisition recording, so neither the outer folds nor the exclusion gap create independent sessions. Cluster-level inference consequently treats the five outer folds, rather than stochastic repeats, as the generalization units. Session-independent or hardware-independent performance cannot be established from this dataset.
2.5. Embedded Diagnostic Objective
The GNB classifier was used inside the optimization loop because it permits many deterministic training-only evaluations. For each candidate, the selected features are standardized using the corresponding training partition, and the variance-smoothing hyperparameter is selected jointly with the feature mask. The hyperparameter modifies the class-conditional variance estimate; it is not a probability-calibration objective. Calibration metrics are reported only as post hoc evaluation quantities.
Each agent encoded 28 continuous feature gates and one variance-smoothing coordinate. Gates of at least 0.5 were retained, subject to a four-feature minimum. The smoothing coordinate selected one of 24 log-spaced values from 10−12 to 10−3. The four-feature minimum, discrimination weight of 0.15, sparsity weight of 0.02 and smoothing range are sensitivity-tested in Section 3.3.
2.6. Optimizer Mechanisms and Locked Protocol
The principal search panel comprises six published recent optimizers under one common 29-coordinate representation: AOA [39], INFO [40], RUN [41], HGSO [42], SMA [43] and COOT [44]. They were selected to span distinct update mechanisms while remaining compatible with the same encoding and training-only objective. The scientific question is not which newly proposed algorithm is best; it is whether rankings among these mechanisms survive controlled changes in data integrity, budget accounting and comparison baseline. GA [36], PSO [37], DE [38] and pure random search [47] are therefore included as matched-budget search controls, while greedy forward selection and full-feature GNB provide non-metaheuristic references. Table 4 documents the algorithm-specific settings and common implementation rules.
Table 4.
Optimizer mechanisms, algorithm-specific settings and controlled implementation adaptations. AOA: arithmetic optimization algorithm; INFO: weighted mean of vectors optimizer; RUN: Runge–Kutta optimizer; HGSO: Henry gas solubility optimization; SMA: slime mould algorithm; COOT: coot bird optimizer. MOA: math optimizer accelerated parameter; MOP: math optimizer probability; ESQ: enhanced solution quality.
The primary computation design was fixed around the deduplicated dataset and a common unique-evaluation budget. Five class-wise blocked outer folds provide held-out estimates, and three blocked inner folds score candidate solutions using training data only. A symmetric 10-sample exclusion gap is used in the primary analysis and is stress-tested from 0 to 100 samples. Each stochastic search method is repeated five times per outer fold and is stopped at approximately 300 unique decoded training-objective evaluations. Thus, stochastic repeats quantify search variability, whereas the five outer folds remain the units of comparative inference. Table 5 summarizes the locked primary benchmark.
Table 5.
Locked primary benchmark and control design. AOA: arithmetic optimization algorithm; INFO: weighted mean of vectors optimizer; RUN: Runge–Kutta optimizer; HGSO: Henry gas solubility optimization; SMA: slime mould algorithm; COOT: coot bird optimizer. GA: genetic algorithm; PSO: particle swarm optimization; DE: differential evolution. GNB: Gaussian Naive Bayes.
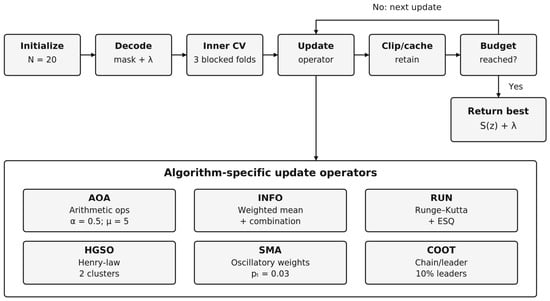
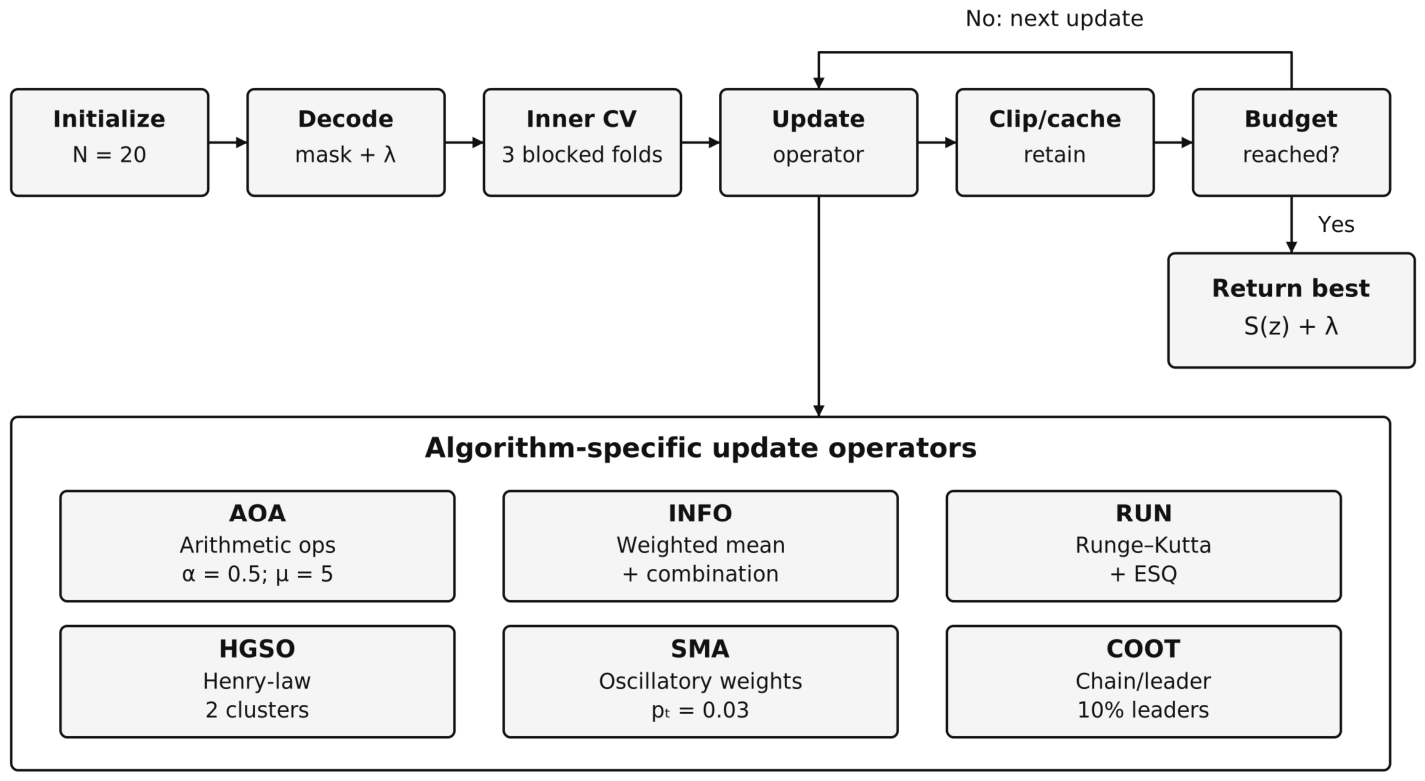
All stochastic generators were deterministically seeded. Candidate coordinates were decoded only inside the current training partition. Figure 4 consolidates the common workflow that was previously repeated across six nearly identical flowcharts. The only method-specific block is the update operator; shared decoding, blocked validation, clipping, caching and retention rules are shown once. Detailed published update equations are cited to the original algorithm papers [39,40,41,42,43,44] rather than reproduced as six long equation sequences.
Figure 4.
Unified optimization workflow and the six algorithm-specific update mechanisms. Shared decoding, blocked validation, clipping, caching and best-retention steps are common across methods. AOA: arithmetic optimization algorithm; INFO: weighted mean of vectors optimizer; RUN: Runge–Kutta optimizer; HGSO: Henry gas solubility optimization; SMA: slime mould algorithm; COOT: coot bird optimizer. CV: cross-validation; ESQ: enhanced solution quality.
2.7. Budget-Conditioned Search-Process Descriptors
Search-process analysis is derived from the same deduplicated matched-budget runs used for the primary comparison. For each run, the best training-only objective is recorded at approximately 20-unique-evaluation checkpoints up to the 300-evaluation limit. The first checkpoint defines J0, and the terminal checkpoint defines JB. The evaluation count E95 is the first checkpoint at which 95% of the achieved reduction J0 − JB has been attained. A normalized progress area summarizes how early that achieved improvement occurs; larger values indicate that more of the ultimately achieved improvement was obtained earlier in the budget. Checkpoint improvement count records the number of sampled budget intervals that produce a new best objective. These quantities describe search behaviour under an equal decoded evaluation budget and are not interpreted as evidence of held-out diagnostic superiority.
Because the encoded coordinates decode to discrete feature masks and smoothing values, search-state spread in continuous coordinates is not treated as diagnostic diversity. Final decoded solutions are compared separately using pairwise feature-mask Jaccard similarity, normalized Hamming distance and the number of distinct selected variance-smoothing values. This separation prevents continuous coordinate dispersion from being misinterpreted as diversity of actual diagnostic models.
The search-process descriptors are computed only from the deduplicated matched-budget experiment. They are used to characterize budget-conditioned search behaviour and are not treated as evidence of diagnostic superiority.
2.8. Performance and Statistical Analysis
The primary endpoint is outer-block macro-F1; supporting endpoints are balanced accuracy, Matthews correlation coefficient (MCC) and selected feature count. Stochastic repeats are first averaged within each outer fold. The six recent optimizers are then compared by a Friedman test on the five fold means, followed by exact fold-level sign-flip contrasts with Holm adjustment where appropriate [54,55]. The same five-fold paired structure is used to compare the best-performing recent optimizer with deterministic greedy forward selection. Because all folds derive from the same set of class-specific recordings, these tests quantify within-session fold variability only; they are not inferential statements about new acquisition sessions.
Statistical non-significance is not interpreted as equivalence. Conversely, a numerically leading mean is not interpreted as superiority without fold-level support. To prevent post hoc superiority claims, the benchmark applies an explicit adjudication rule: an optimizer-specific advantage requires (i) the same deduplicated outer folds, (ii) the same unique decoded evaluation budget, (iii) comparison against the deterministic greedy and random-search controls, and (iv) fold-level statistical support for the claimed performance advantage. If these conditions are not met, the conclusion is restricted to descriptive search-behaviour differences and no evidence of superiority.
2.9. Robustness and Control Experiments
Five control analyses were performed on the same 10,875-row deduplicated dataset. First, temporal-gap sensitivity used gaps of 0, 10, 25, 50 and 100 samples with full-feature GNB and training-only variance-smoothing selection. Second, objective-design sensitivity varied the balanced-accuracy weight (0, 0.15, 0.30), sparsity weight (0, 0.02, 0.05), minimum selected features (1, 4, 6, 8) and smoothing range (10−12 to 10−3 versus 10−15 to 10−1). Third, AOA, INFO, RUN, HGSO, SMA, COOT, GA, PSO, DE and random search were limited to approximately 300 unique decoded training-objective evaluations, with five repeats in every outer fold. Fourth, default full-feature GNB, smoothing-only full-feature GNB and greedy forward feature selection were evaluated on the identical blocked folds [56]. Fifth, the fold-specific RUN mask chosen by the lowest inner objective was transferred to Extra Trees, random forest, a support vector machine with a radial basis function kernel (RBF-SVM), k-nearest neighbours, Gaussian Naive Bayes (GaussianNB) and logistic regression and compared with the same classifiers using all 28 features. These controls distinguish optimizer effects from data-integrity, budget, deterministic-search and classifier-representation effects; none creates independent acquisition sessions.
3. Results
All scientific results in this section use the 10,875-row deduplicated dataset. The evidence is ordered from data integrity and temporal dependence to the primary matched-budget comparison, objective-design sensitivity, classifier/representation sensitivity and decoded search behaviour.
3.1. Data Integrity, Temporal Dependence and Gap Sensitivity
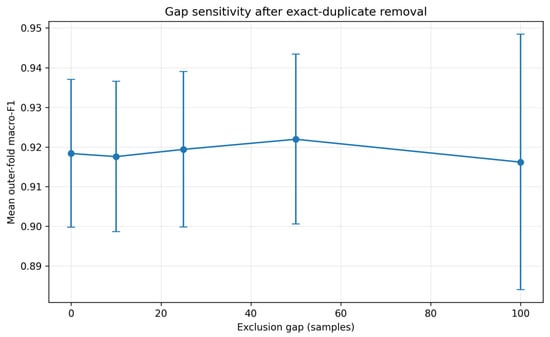
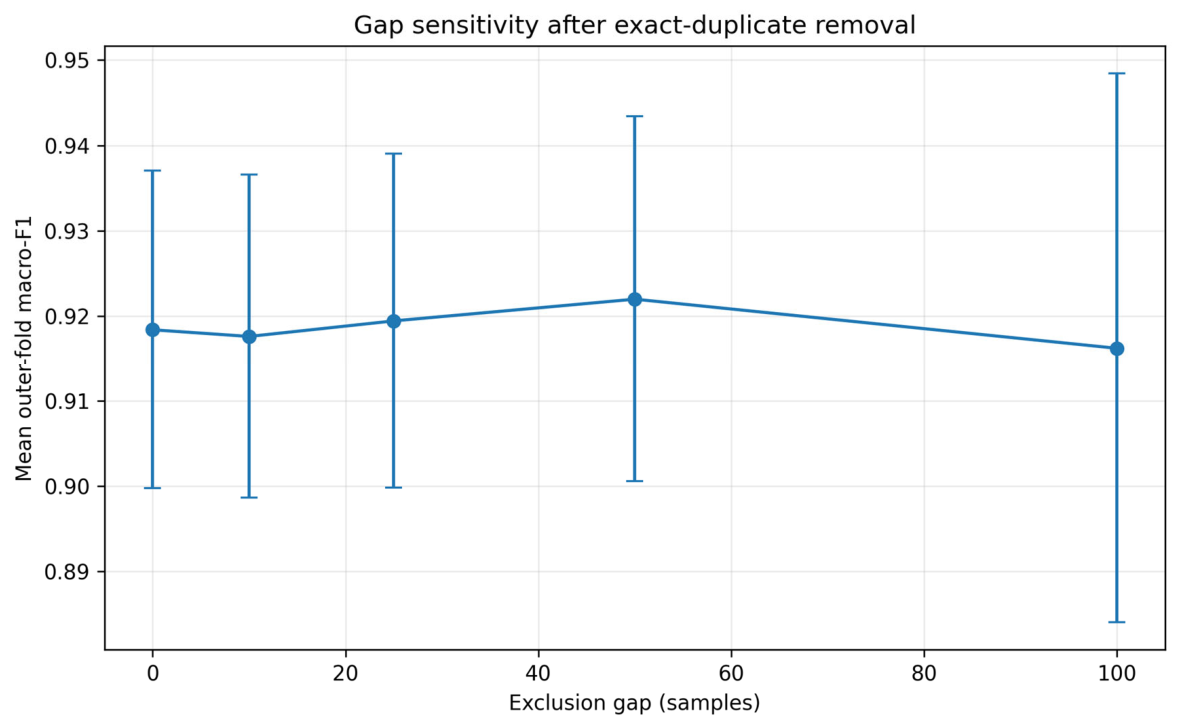
The exact-duplicate audit identified 17 surplus rows. Before removal, six duplicate groups crossed outer-block assignments, and nine exact test-to-training duplicate instances could survive a 10-sample gap. Those rows were removed before every result reported in this section. Autocorrelation remained channel- and class-dependent: the current channels reached |ACF| < 0.1 at a median lag of 11 samples, while several thermal channels decayed much more slowly. Table 6 and Figure 5 show that the full-feature GNB macro-F1 remained between 0.9163 and 0.9220 across gaps from 0 to 100 samples, with no monotonic gain. The 10-sample gap is therefore a pragmatic adjacency reduction, not evidence of temporal independence.
Table 6.
Exclusion-gap sensitivity on the deduplicated dataset using full-feature Gaussian Naive Bayes (GNB) with training-only variance-smoothing selection. Macro-F1: macro-averaged F1 score; SD: standard deviation; BAcc: balanced accuracy; N: number of training observations.
Figure 5.
Exclusion-gap sensitivity after exact-duplicate removal. Error bars show the standard deviation across the five outer folds. Macro-F1: macro-averaged F1 score.
3.2. Primary Matched-Budget Benchmark and Conventional Controls
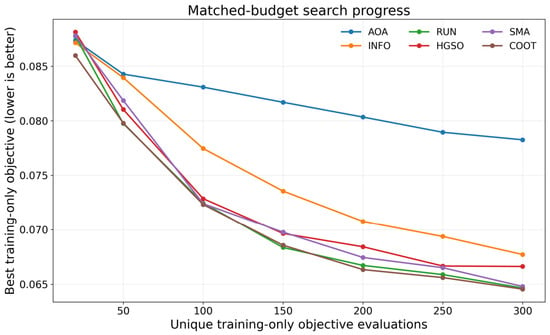
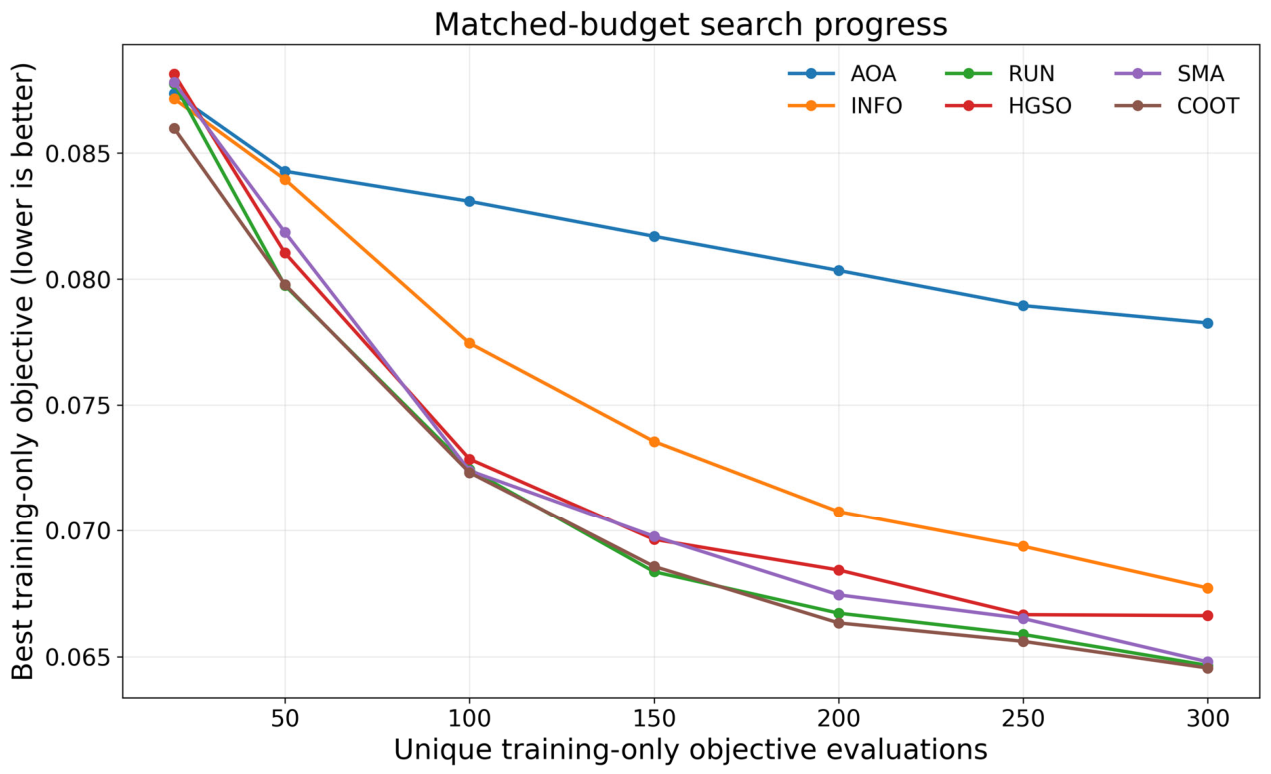
The primary benchmark equalized the research effort at approximately 300 unique decoded training-objective evaluations and used five stochastic repeats per outer fold. Table 7 shows that RUN had the highest mean macro-F1 among the six recent optimizers (0.9473; 4.20 features), followed by COOT (0.9447), HGSO (0.9415), INFO (0.9414), AOA (0.9322) and SMA (0.9274). The fold-level Friedman test remained nonsignificant (p = 0.2428); none of the Holm-adjusted exact contrasts established pairwise superiority. Table 8 exposes the five-fold means directly. Importantly, Table 9 shows that deterministic greedy forward selection achieved 0.9476 with 5.00 features, essentially matching RUN, while full-feature GNB achieved approximately 0.918 and random search achieved 0.9331. The result therefore rejects an accuracy-superiority claim for the recent metaheuristics and instead identifies a sparse performance frontier in which RUN and greedy selection reach nearly identical diagnostic quality by different search strategies. Figure 6 shows the training-objective progress under the common evaluation budget.
Table 7.
Matched unique-evaluation benchmark on the deduplicated dataset (five repeats per outer fold). AOA: arithmetic optimization algorithm; INFO: weighted mean of vectors optimizer; RUN: Runge–Kutta optimizer; HGSO: Henry gas solubility optimization; SMA: slime mould algorithm; COOT: coot bird optimizer. GA: genetic algorithm; PSO: particle swarm optimization; DE: differential evolution. RANDOM: random search. Macro-F1: macro-averaged F1 score; SD: standard deviation; BAcc: balanced accuracy; MCC: Matthews correlation coefficient. Unique evals: unique objective evaluations.
Table 8.
Fold-level mean macro-averaged F1 score (macro-F1) in the matched-budget six-optimizer experiment. AOA: arithmetic optimization algorithm; INFO: weighted mean of vectors optimizer; RUN: Runge–Kutta optimizer; HGSO: Henry gas solubility optimization; SMA: slime mould algorithm; COOT: coot bird optimizer.
Table 9.
Deterministic and full-feature Gaussian Naive Bayes (GNB) controls on the deduplicated dataset. Macro-F1: macro-averaged F1 score; SD: standard deviation; BAcc: balanced accuracy; MCC: Matthews correlation coefficient.
Figure 6.
Matched-budget search progress for the six recent optimizers. Lower training-only objective is better; curves are averaged over folds and stochastic repeats. AOA: arithmetic optimization algorithm; INFO: weighted mean of vectors optimizer; RUN: Runge–Kutta optimizer; HGSO: Henry gas solubility optimization; SMA: slime mould algorithm; COOT: coot bird optimizer.
The deterministic greedy control achieved a mean macro-F1 = 0.9476 with 5.00 features, compared with 0.9473 and 4.20 features for RUN. Their fold-level difference was negligible (two-sided exact sign-flip p = 0.9375). Full-feature GNB was approximately 0.918 whether variance smoothing was fixed or optimized, whereas random search reached 0.9331 under the same 300-evaluation search budget. Thus, metaheuristic search is not justified here by a statistically demonstrated accuracy advantage over greedy selection. Its remaining value is conditional: different operators can reach alternative sparse solutions and different budget-conditioned search trajectories, which are examined below.
3.3. Objective and Representation Sensitivity
Table 10 stress-tests the four principal design choices. Mean macro-F1 changed by 0.0015 across balanced-accuracy weights, 0.0059 across sparsity weights, 0.0099 across minimum-feature settings and 0.0052 across the tested smoothing ranges. Feature count was more responsive than macro-F1, particularly to the sparsity penalty. These results show that the chosen objective is not uniquely optimal; rather, several nearby configurations produce similar within-session performance while trading sparsity differently.
Table 10.
Sensitivity of the diagnostic design choices on the deduplicated dataset. Macro-F1: macro-averaged F1 score; SD: standard deviation; BAcc: balanced accuracy.
3.4. Classifier and Feature-Representation Sensitivity
Table 11 separates optimizer effects from classifier/representation effects. For each outer fold, the RUN solution with the lowest training-only inner objective supplies the selected mask (four features in each of the five folds); the same six classifiers are then evaluated with that mask and with all 28 features. This is a post-search sensitivity test and does not retune the six-optimizer ranking.
Table 11.
Paired classifier sensitivity using RUN-selected feature masks and all 28 features on the deduplicated blocked-validation benchmark. RUN: Runge–Kutta optimizer; macro-F1: macro-averaged F1 score; SD: standard deviation; MCC: Matthews correlation coefficient; RBF-SVM: support vector machine with a radial basis function kernel; GaussianNB: Gaussian Naive Bayes.
Classifier and representation choice produced substantially larger changes than the small differences among optimizers. With RUN-selected four-feature masks, mean macro-F1 ranged from 0.9019 for logistic regression to 0.9619 for Extra Trees, while all-feature classifiers ranged from 0.8357 for k-nearest neighbours to 0.9826 for random forest. RUN-selected masks improved GaussianNB (0.9490 versus 0.9176), RBF-SVM (0.9330 versus 0.9213) and k-nearest neighbours (0.9602 versus 0.8357), but all 28 features were stronger for Extra Trees, random forest and logistic regression. Sparse feature selection is therefore learner-dependent rather than universally accuracy-improving. These are offline predictive comparisons; real-time inference latency and hardware execution were not measured.
3.5. Decoded-Solution Diversity and Budget-Conditioned Search Behaviour
Decoded feature diversity and budget-conditioned search behaviour provide the mechanism-level evidence for RQ4. Table 12 shows that mean pairwise feature-mask Jaccard similarity ranges from 0.2886 (COOT) to 0.4903 (SMA), while the normalized Hamming distance ranges from 0.1071 to 0.3743. From the same deduplicated matched-budget checkpoint histories, the median unique-evaluation count required to reach 95% of each run's achieved training-objective improvement was 144 for HGSO, 177 for COOT, 189 for RUN, 195 for SMA, 200 for AOA and 265 for INFO. The corresponding mean normalized progress-area values were 0.793, 0.745, 0.768, 0.756, 0.564 and 0.663, respectively. These descriptors demonstrate different search timing under the same computational accounting rule even when held-out macro-F1 differences are not statistically established. They are algorithm-behaviour evidence, not proof of a more reliable diagnostic system.
Table 12.
Decoded final-solution diversity in the matched-budget experiment. AOA: arithmetic optimization algorithm; INFO: weighted mean of vectors optimizer; RUN: Runge–Kutta optimizer; HGSO: Henry gas solubility optimization; SMA: slime mould algorithm; COOT: coot bird optimizer.
4. Discussion
4.1. Scientific Contribution: Controlled Benchmarking of Optimizer Claims
The main scientific result is not a new optimizer and not a winning algorithm. It is a falsification result about how optimizer-specific claims should be interpreted in this diagnostic setting. Once exact duplicates are removed, unique decoded evaluation budgets are matched, strong simple controls are included and inference is conducted at the fold level, the six recent metaheuristics do not separate statistically and deterministic greedy selection matches the strongest mean macro-F1. This is more than an endpoint ranking: it demonstrates that a ranking that appears meaningful under weaker controls is not robust to data-integrity, budget, comparator and representation checks. The present benchmark therefore advances prior search-process work on this PMSM testbed [49] by adding a disjoint recent-optimizer panel and an explicit claim-adjudication protocol incorporating deduplication, matched unique-evaluation budgets, deterministic/random controls, decoded diversity and paired classifier representations.
4.2. What the Matched Controls Establish
The control experiments define what can and cannot be claimed. RUN and greedy forward selection form the strongest accuracy-sparsity trade-off in the present benchmark: their mean macro-F1 values differ by only 0.0003, while RUN uses 4.20 features on average and greedy selection uses 5.00. Because the fold-level difference is not significant, the data do not justify selecting a metaheuristic for accuracy alone. The search-process analysis nevertheless shows that the recent optimizers use the common budget differently: HGSO attains 95% of its achieved training-objective improvement earliest, whereas INFO improves later and COOT/RUN reach the lowest mean terminal inner objectives. These distinctions are relevant when search budget or solution diversity matters, but they are secondary to held-out diagnostic evidence.
4.3. Representation Effects Exceed Optimizer Effects
The paired representation experiment further limits optimizer-centric conclusions. Changing the classifier/feature representation moves macro-F1 far more than the small fold-averaged differences among recent optimizers. RUN-selected sparse masks improve GNB, RBF-SVM and k-nearest neighbours, yet all-feature Extra Trees and random forest remain stronger than their sparse-mask counterparts. The practical implication is that feature selection must be justified jointly with the target learner, sensor/feature cost and deployment constraints; it should not be presumed to improve accuracy universally. Offline search runtime and unique objective evaluations quantify model-development cost only. They do not measure embedded inference latency, real-time fault response or hardware feasibility.
4.4. Scope Boundary and Threats to Validity
The strongest restriction is structural and cannot be removed by resampling: each class corresponds to one acquisition recording, so acquisition session and fault label are confounded. Blocked folds, exclusion gaps and duplicate removal reduce leakage but do not create independent sessions. The approximately 10 Hz rate captures low-frequency and thermal condition signatures but cannot resolve pulse-width modulation (PWM) switching transients or rapidly developing electrical faults [51]. The exact intervention used to induce every released fault is incompletely documented, and the fault taxonomy is asymmetric. These constraints are acceptable for the stated scientific purpose—a controlled within-session benchmark of feature-selection search claims—but they preclude claims of cross-session diagnostic reliability, real-time fault coverage, variable-speed/load robustness or deployment readiness. Table 13 makes this boundary explicit.
Table 13.
Principal validity threats and required extensions. PWM: pulse-width modulation.
The present data do not contain labelled fault-onset transitions, maintenance outcomes, remaining useful life, independent repeated sessions, multiple hardware units or speed-load sweeps. Accordingly, the manuscript makes no prognostic, early-warning, real-time or deployment-performance claim. Independent repeated acquisitions under varied speed, load, hardware and sampling conditions are required to validate a practical PMSM inverter diagnostic system; such experiments are a distinct validation study rather than evidence that can be created by resampling this public dataset.
5. Conclusions
This study provides a controlled negative-result benchmark of metaheuristic feature selection for PMSM inverter fault diagnosis. After exact-duplicate removal, matched unique-evaluation budgets and fold-level inference, RUN achieved a mean macro-F1 = 0.9473 with 4.20 features, while deterministic greedy forward selection achieved 0.9476 with 5.00 features; the paired fold difference was negligible (p = 0.9375). The six recent optimizers did not differ significantly (Friedman p = 0.2428), and classifier/representation choice produced materially larger performance changes than optimizer identity. The supported scientific advancement is therefore the demonstration that optimizer rankings on this fixed diagnostic dataset are not robust evidence of optimizer superiority unless data integrity, computational budget, comparator strength and representation are controlled simultaneously. Metaheuristics may still be useful for exploring alternative sparse solutions and search trajectories, but this dataset provides no accuracy-based reason to prefer them over greedy selection. Because each condition is represented by one approximately 10 Hz recording, the conclusions are strictly limited to blocked within-session benchmarking. Independent sessions, multiple hardware units, varied speed-load conditions, broader fault coverage and higher-frequency sensing are required before practical diagnostic reliability can be established.
Author Contributions
Conceptualization, B.A.T. and K.R.; methodology, B.A.T. and K.R.; software, B.A.T. and K.R.; validation, B.A.T. and K.R.; formal analysis, B.A.T. and K.R.; investigation, B.A.T. and K.R.; resources, B.A.T. and K.R.; data curation, B.A.T. and K.R.; writing—original draft preparation, B.A.T. and K.R.; writing—review and editing, B.A.T. and K.R.; visualization, B.A.T. and K.R.; supervision, B.A.T. and K.R.; project administration, B.A.T. and K.R.; funding acquisition, B.A.T. and K.R. All authors have read and agreed to the published version of the manuscript.
Funding
This research received no external funding.
Data Availability Statement
The source dataset and code are publicly available from Zenodo, record 13974425, digital object identifier (DOI) 10.5281/zenodo.13974425 [50], and are described in the peer-reviewed data article [51]. All analyses supporting the scientific conclusions use the released data after exact-duplicate removal. Derived matched-budget, sensitivity, classifier-comparison and decoded-diversity tables and validation scripts are provided in the supplementary computational package.
Acknowledgments
The authors gratefully acknowledge the Department of Electrical and Electronic Engineering Technology, University of Johannesburg, and The School of Engineering, Nelson Mandela University for providing institutional support necessary for this research.
Conflicts of Interest
The authors declare no conflicts of interest.
References
- Diao, K.; Xu, S.; Deng, W.; Qian, Z.; Zhang, Q.; Wu, L.; Wang, Q. Model predictive control of permanent magnet synchronous motors for electrified transportation: Advances and perspectives. Renew. Sustain. Energy Rev. 2026, 235, 116946. [Google Scholar] [CrossRef] [Scilit]
- Diao, K.; Ding, Y.; Wang, Q.; Qian, Z.; Deng, W.; Sun, Z.; Chen, Q.; Wu, L. Integration of high-frequency injection methods for sensorless control of PMSMs in next-generation transportation systems: Principles, challenges, and solutions. Renew. Sustain. Energy Rev. 2026, 239, 117107. [Google Scholar] [CrossRef] [Scilit]
- Zhang, M.; Huang, J.; Luo, L.; Miao, L. Interval estimation for three-phase permanent magnet synchronous motor drive system: A hybrid dynamic event-triggered approach. Appl. Math. Model. 2026, 151, 116536. [Google Scholar] [CrossRef] [Scilit]
- Kitiş, U.; Polat, Ö. Estimation of the effect of changing resistance parameters on engine efficiency in electrical vehicles with convolutional neural network. Eng. Comput. 2026, 43, 2747–2763. [Google Scholar] [CrossRef] [Scilit]
- Qu, X.; Peng, C.; Zhang, S.; Lu, P. Improved variable-structure cascade ADRC-based model predictive torque control for permanent magnet synchronous motor. Control Eng. Pract. 2026, 175, 107111. [Google Scholar] [CrossRef] [Scilit]
- Zouari, W.; El Badsi, B.; Masmoudi, A. Four-switch three-phase inverter fed IM drives under predictive control strategies: A comparative study. Results Control Optim. 2026, 23, 100739. [Google Scholar] [CrossRef] [Scilit]
- Liu, Q.; Xiao, L.; Wu, Q.; Wang, Q.; Niu, H. An axis transformation-based diagnostic method covering mixed faults of open-phase and current sensor for dual three-phase PMSM drives. Electr. Power Syst. Res. 2026, 257, 112961. [Google Scholar] [CrossRef] [Scilit]
- He, S.; Zhong, Y.; Zhang, C.; Jia, H.; Chen, Y. A spatio-temporal feature co-attention network for accurate and robust multi-fault diagnosis in permanent magnet synchronous motor drives. Eng. Appl. Artif. Intell. 2026, 179, 115162. [Google Scholar] [CrossRef] [Scilit]
- Zhang, Q.; Xiao, W.; Mei, L.; Cui, J. Composite fault-tolerant predictive control strategy for PMSM demagnetization faults. ISA Trans. 2026, 177, 619–633. [Google Scholar] [CrossRef] [Scilit]
- Nammi, S.T.Y.; Kollu, R. Performance analysis of improved half-bridge NPC inverter-fed PMSM drive with fault tolerant operation. Next Res. 2026, 8, 101597. [Google Scholar] [CrossRef] [Scilit]
- Xiong, L.; Xu, H.; Sun, Q.; Yu, C. Fault-tolerant control strategy for single-phase open-circuit faults in permanent magnet synchronous machine. Robot. Intell. Autom. 2026, 46, 117–125. [Google Scholar] [CrossRef] [Scilit]
- Liu, H.; Wang, R.; Wang, Y.; Zhang, B.; Wang, Y. Fault diagnosis of offshore wind turbine inverter modules based on multi-source information fusion. Recent Adv. Electr. Electron. Eng. 2026, 19, e23520965364227. [Google Scholar] [CrossRef] [Scilit]
- Heidari, J.; Peykarporsan, R.; Oshnoei, S.; Lie, T.T.; Vandevelde, L.; Crevecoeur, G. Hierarchical switch fault diagnosis based on transformer algorithm in four-leg inverters of stand-alone wind energy conversion systems. Int. J. Electr. Power Energy Syst. 2026, 175, 111607. [Google Scholar] [CrossRef] [Scilit]
- Jang, J.; Lee, H. Resilient fault diagnosis and recovery framework for driving modules of electric vehicles using continuous wavelet transform-based fault-aware deep learning. Appl. Soft Comput. 2026, 198, 115289. [Google Scholar] [CrossRef] [Scilit]
- Chen, B.; Li, H.; Zhao, H.; Zhang, P.; Huang, J. A multi-scale adaptive frequency domain network for few-shot current sensor fault diagnosis. Eng. Appl. Artif. Intell. 2026, 177, 114983. [Google Scholar] [CrossRef] [Scilit]
- Zhou, H.; Xiang, X.; Li, H.; Song, H.; Zhang, H.; Yuan, B. A non-invasive phase current reconstruction strategy for three-level inverters with fixed sampling instants. Measurement 2026, 258, 119372. [Google Scholar] [CrossRef] [Scilit]
- Liu, S.; Zhou, S.; Abdullah, M.; Liu, Z.; Zhang, H.; Wang, R. Evaluation of servo fault status and fault-tolerant control for heavy-legged robots under concurrent velocity sensor failures. Control Eng. Pract. 2026, 169, 106761. [Google Scholar] [CrossRef] [Scilit]
- Lee, J.; Park, S.; Lee, Y.; Kim, N. High-fidelity co-simulation framework toward digital twin-based interturn short-circuit fault diagnosis in interior permanent magnet synchronous motor. CMES-Comput. Model. Eng. Sci. 2026, 148, 18. [Google Scholar] [CrossRef] [Scilit]
- Palomino-Huilcapi, J.; Kassas, M.; Abido, M.A. FEM-based modelling of incipient inter-turn short-circuit faults in line-start PMSM motors for smart-mobility predictive maintenance. Transp. Res. Procedia 2026, 96, 436–443. [Google Scholar] [CrossRef] [Scilit]
- Xu, M.; Wang, J.; Gao, J.; Zou, C. The insulation online monitoring research of aircraft electric propulsion motor based on leakage current with specific frequency. Electr. Power Syst. Res. 2026, 252, 112418. [Google Scholar] [CrossRef] [Scilit]
- Feng, S.; Chen, H.; Tang, J.; Zhang, P.; Liu, H.; Tao, H.; Chen, R.; Fei, X. Anti-load performance evaluation method for electro-hydrostatic actuators based on physics-embedded attention mechanism. Mech. Syst. Signal Process. 2026, 258, 114741. [Google Scholar] [CrossRef] [Scilit]
- Lin, C.-Y.; Tseng, Y.-C.; Yao, W.-S. Novel physics-informed spatiotemporal gated long short-term memory fault prediction for permanent magnet synchronous motor compressors in cold chain logistics. Expert Syst. Appl. 2026, 331, 133208. [Google Scholar] [CrossRef] [Scilit]
- Wang, H.; Zhang, J.; Feng, Y.; Zhu, B.; Diao, L. Physics-informed neural networks for safe operating boundary prediction of permanent magnet synchronous motors under thermal demagnetization risk. Eng. Appl. Artif. Intell. 2026, 174, 114523, Erratum in Eng. Appl. Artif. Intell. 2026, 177, 114813.. [Google Scholar] [CrossRef] [Scilit]
- Sharawy, M.; El-Nahas, A.; Alahmar, M.A.; Banakhr, F.A.; Mosaad, M.I.; Selmy, M. Machine learning framework for multi-fault diagnosis within three-phase induction motor in electric vehicle applications. Results Eng. 2026, 30, 110933. [Google Scholar] [CrossRef] [Scilit]
- Vitor, A.L.O.; Goedtel, A.; Souza, W.A.; Castoldi, M.F.; Morinigo-Sotelo, D.; Duque-Perez, O. Cohen’s class bilinear distributions and convolutional neural networks applied to broken rotor bar diagnosis. Expert Syst. Appl. 2026, 298, 129835. [Google Scholar] [CrossRef] [Scilit]
- Chae, M.; Kim, H.; Lee, S.K.; Kim, H.; Yang, J.; Yoon, H.; Youn, B.D. An adapter-enhanced, Fourier feature deep operator network for fault severity estimation of stator inter-turn short circuits in induction motors. Eng. Appl. Artif. Intell. 2026, 170, 114197. [Google Scholar] [CrossRef] [Scilit]
- Liu, W.; Wang, T. Synchronous motor fault diagnosis via a dual-branch deep network: Divergent input modalities with Swin Transformer and ECA-enhanced TCN. Measurement 2026, 283, 122090. [Google Scholar] [CrossRef] [Scilit]
- Zheng, Z.; Yan, Y.; Li, C.; Ge, M.; Zhang, Y.; Liu, H.; Yan, H. Nonlinear mechanism of electromagnetic torque harmonics generation induced by load disturbances based on field modulation theory. Commun. Nonlinear Sci. Numer. Simul. 2026, 161, 110100. [Google Scholar] [CrossRef] [Scilit]
- Qin, Y.; Ma, C. Real-time reconstruction of monitoring information for flight control electric actuation systems towards high-autonomy aerospace vehicles. Measurement 2026, 265, 120346. [Google Scholar] [CrossRef] [Scilit]
- Lian, Z.; Xiao, Z.; Zhang, Q.; Zhou, T.; Jiang, Z.; Li, C. Study on the electromechanical coupling dynamics of underwater vehicle drive system considering propeller hydrodynamic excitation. Appl. Math. Model. 2026, 157, 116855. [Google Scholar] [CrossRef] [Scilit]
- Fan, X.; Li, X.; Wang, H.; Wei, L.; Tie, Y. Fault propagation pathways and decoupling analysis of non-circulating bearing electrical erosion in integrated electric drive units. Mech. Syst. Signal Process. 2026, 259, 114803. [Google Scholar] [CrossRef] [Scilit]
- Kumar, M.P.; Velpula, S.; Saiprakash, C. Fault diagnosis and predictive maintenance of electric vehicle powertrain using artificial intelligence techniques: A review. Results Eng. 2026, 30, 110857. [Google Scholar] [CrossRef] [Scilit]
- Kuhn, L.; Meindl, M.; Bentheimer, C.; März, M. Hardware-based electric drive train fault detection unit enabling fail-operational capabilities for aviation applications. Aerosp. Sci. Technol. 2026, 172, 111681. [Google Scholar] [CrossRef] [Scilit]
- Wang, B.; Zhang, Z.; Khowja, M.; Vakil, G.; Gerada, C.; Yang, T. Constraint-driven design of a low-coupling segmented triple three-phase permanent-magnet starter-generator for more electric aircraft. Chin. J. Aeronaut. 2026, 39, 104263. [Google Scholar] [CrossRef] [Scilit]
- El Idrissi, R.; Bacha, A.; Lmai, F.; Janati Idrissi, K.; Papa, A.S. A novel fault detection and diagnosis approach for three-phase full-bridge inverter in permanent magnet synchronous motor based on optimal information gain threshold determination and supervised machine learning algorithms. Results Eng. 2025, 28, 108062. [Google Scholar] [CrossRef] [Scilit]
- Holland, J.H. Adaptation in Natural and Artificial Systems: An Introductory Analysis with Applications to Biology, Control, and Artificial Intelligence; MIT Press: Cambridge, MA, USA, 1992. [Google Scholar] [CrossRef] [Scilit]
- Kennedy, J.; Eberhart, R. Particle swarm optimization. In Proceedings of ICNN'95-International Conference on Neural Networks, Perth, Australia, 27 November–1 December 1995; Volume 4, pp. 1942–1948. [Google Scholar] [CrossRef] [Scilit]
- Storn, R.; Price, K. Differential Evolution—A Simple and Efficient Heuristic for Global Optimization over Continuous Spaces. J. Glob. Optim. 1997, 11, 341–359. [Google Scholar] [CrossRef] [Scilit]
- Abualigah, L.; Diabat, A.; Mirjalili, S.; Abd Elaziz, M.; Gandomi, A.H. The Arithmetic Optimization Algorithm. Comput. Methods Appl. Mech. Eng. 2021, 376, 113609. [Google Scholar] [CrossRef] [Scilit]
- Ahmadianfar, I.; Heidari, A.A.; Noshadian, S.; Chen, H.; Gandomi, A.H. INFO: An efficient optimization algorithm based on weighted mean of vectors. Expert Syst. Appl. 2022, 195, 116516. [Google Scholar] [CrossRef] [Scilit]
- Ahmadianfar, I.; Heidari, A.A.; Gandomi, A.H.; Chu, X.; Chen, H. RUN beyond the metaphor: An efficient optimization algorithm based on Runge Kutta method. Expert Syst. Appl. 2021, 181, 115079. [Google Scholar] [CrossRef] [Scilit]
- Hashim, F.A.; Houssein, E.H.; Mabrouk, M.S.; Al-Atabany, W.; Mirjalili, S. Henry gas solubility optimization: A novel physics-based algorithm. Future Gener. Comput. Syst. 2019, 101, 646–667. [Google Scholar] [CrossRef] [Scilit]
- Li, S.; Chen, H.; Wang, M.; Heidari, A.A.; Mirjalili, S. Slime mould algorithm: A new method for stochastic optimization. Future Gener. Comput. Syst. 2020, 111, 300–323. [Google Scholar] [CrossRef] [Scilit]
- Naruei, I.; Keynia, F. A new optimization method based on COOT bird natural life model. Expert Syst. Appl. 2021, 183, 115352. [Google Scholar] [CrossRef] [Scilit]
- Dokeroglu, T.; Deniz, A.; Kiziloz, H.E. A comprehensive survey on recent metaheuristics for feature selection. Neurocomputing 2022, 494, 269–296. [Google Scholar] [CrossRef] [Scilit]
- Beiranvand, V.; Hare, W.; Lucet, Y. Best practices for comparing optimization algorithms. Optim. Eng. 2017, 18, 815–848. [Google Scholar] [CrossRef] [Scilit]
- Hendrix, E.M.T.; Lancinskas, A. On Benchmarking Stochastic Global Optimization Algorithms. Informatica 2015, 26, 649–662. [Google Scholar] [CrossRef] [Scilit]
- Wolpert, D.H.; Macready, W.G. No Free Lunch Theorems for Optimization. IEEE Trans. Evol. Comput. 1997, 1, 67–82. [Google Scholar] [CrossRef] [Scilit]
- Thango, B.A.; Moloi, K. Search-Process Benchmarking of GA, PSO, DE, ABC, GWO and WOA for PMSM Inverter Fault Diagnosis in Electric Vehicle Drives. Algorithms 2026, 19, 810. [Google Scholar] [CrossRef] [Scilit]
- Bacha, A. PMSM Inverter Fault Dataset v1.0.0. Zenodo 2024. [Google Scholar] [CrossRef]
- Bacha, A.; El Idrissi, R.; Janati Idrissi, K.; Lmai, F. Comprehensive dataset for fault detection and diagnosis in inverter-driven permanent magnet synchronous motor systems. Data Brief. 2025, 58, 111286. [Google Scholar] [CrossRef] [Scilit]
- Huang, C.-W.; Hsu, S.-H.; Chou, T.-C.; Lee, P.-H. Data-driven estimation for electric machine emulator operation in AI-driven sensorless control of electric vehicle energy networks. Int. J. Electr. Power Energy Syst. 2026, 175, 111581. [Google Scholar] [CrossRef] [Scilit]
- Dong, L.; Wei, Q.; Zeng, D.; Li, W.; Andriollo, M.; Shuai, Z. Electromagnetic vibration analysis in full frequency band of multi-unit PMSMs under fault tolerance state by magnetic field-structure coupling model. Measurement 2026, 265, 120365. [Google Scholar] [CrossRef] [Scilit]
- Friedman, M. The use of ranks to avoid the assumption of normality implicit in the analysis of variance. J. Am. Stat. Assoc. 1937, 32, 675–701. [Google Scholar] [CrossRef]
- Holm, S. A simple sequentially rejective multiple test procedure. Scand. J. Stat. 1979, 6, 65–70. [Google Scholar]
- Pudil, P.; Novovicova, J.; Kittler, J. Floating search methods in feature selection. Pattern Recognit. Lett. 1994, 15, 1119–1125. [Google Scholar] [CrossRef] [Scilit]

Disclaimer/Publisher’s Note: The statements, opinions and data contained in all publications are solely those of the individual author(s) and contributor(s) and not of MDPI and/or the editor(s). MDPI and/or the editor(s) disclaim responsibility for any injury to people or property resulting from any ideas, methods, instructions or products referred to in the content. |
© 2026 by the authors. Licensee MDPI, Basel, Switzerland. This article is an open access article distributed under the terms and conditions of the Creative Commons Attribution (CC BY) license.