


Abstract
Accurate detection and severity estimation of corrosion on metallic surfaces is essential for maintaining material integrity and ensuring operational safety in industrial systems. To address limitations in manual inspection methods, this study presents a two-stage deep learning pipeline tailored for high-resolution scanning electron microscopy images. The framework combines instance-level corrosion segmentation using the YOLOv8-seg architecture with subsequent severity classification performed by EfficientNet-B0 and ResNet18. In the segmentation stage, models are trained using both manually annotated and automatically generated binary masks, enabling robust instance mask prediction through prototype-based mask decoding. The classification stage assesses the severity of corrosion by analyzing localized regions based on morphological features, leveraging convolutional neural networks optimized for binary output. The experimental results demonstrate strong performance: the segmentation model trained on manual annotations achieves a Mean Intersection over Union (mIoU) of 89.91, a mask mAP@50 of 98.6, and an ROC-AUC of 94.69. For severity classification, EfficientNet-B0 achieves an accuracy of 93.75% and an F1-score of 93.29, outperforming ResNet18. The proposed framework connects advanced SEM with state-of-the-art machine learning. It provides a scalable, annotation-efficient way to use intelligent and automated corrosion characterization in materials science and industrial applications.
1. Introduction
Corrosion remains a critical challenge in materials science and engineering, contributing to structural degradation, safety hazards, and substantial economic losses estimated to exceed $2.5 trillion annually worldwide [1]. This issue is particularly acute in high-risk industries such as aerospace, marine, and energy sectors, where corrosion can compromise component reliability and pose serious threats to human safety [2]. The degradation of metallic materials typically arises from electrochemical and chemical reactions that progressively reduce mechanical integrity and serviceability [3]. Addressing corrosion-related challenges is therefore essential for the development of sustainable and climate-resilient infrastructure systems, as emphasized by global initiatives such as the Paris Agreement and the United Nations 2030 Agenda for Sustainable Development [4].
Conventional corrosion evaluation techniques, while reliable, often rely on manual visual inspection and subjective interpretation of microstructural features, resulting in limited reproducibility and prolonged analysis times [5]. Scanning electron microscopy (SEM) has emerged as a powerful tool in corrosion research, enabling high-resolution visualization of surface morphology, pit formation, and crack propagation [3,6]. Recent advances in three-dimensional imaging modalities, including X-ray computed tomography and focused ion beam–SEM systems, have further enhanced the ability to investigate pit-to-crack transitions and stress corrosion cracking mechanisms [7]. However, the increasing volume and complexity of SEM image data make manual analysis labor-intensive, prone to inconsistency, and difficult to scale for large datasets or industrial deployment [8].
Recent advances in artificial intelligence (AI), particularly deep learning (DL), offer promising opportunities to automate and enhance corrosion analysis [2,9,10]. DL techniques are increasingly applied to corrosion assessment and material degradation studies, with potential benefits for improving infrastructure safety, reliability, and sustainability [9,11]. Convolutional neural networks (CNNs), widely adopted in medical imaging, remote sensing, and industrial quality control, provide powerful capabilities for automated feature extraction and pattern recognition [12,13]. These capabilities are particularly well suited for SEM-based corrosion analysis, where damage features such as localized pitting, microcracks, and corrosion products often exhibit subtle, heterogeneous, and multiscale characteristics [5].
Despite growing interest in applying advanced CNN architectures—such as YOLOv8—for corrosion detection and segmentation, existing studies frequently overlook the role of hyperparameter optimization, which can significantly influence model robustness and generalizability [12,14]. Moreover, many image-based approaches rely on static feature representations or limited-quality training data, restricting their ability to capture the complex, multiscale, and time-dependent nature of corrosion processes [9]. Most existing models treat images as independent samples, neglecting temporally ordered experimental conditions that are essential for understanding corrosion progression and forecasting degradation behavior. In parallel, limited attention has been given to correlating corrosion morphology with upstream material processing parameters, such as annealing time and thermal history, which strongly influence microstructural evolution and corrosion resistance [15].
To address these limitations, this study proposes a deep learning-based framework for the automated analysis of SEM images of corroded metallic surfaces. The framework is designed to perform two primary tasks: (1) segmentation of corrosion-affected regions and (2) classification of corrosion severity. Model performance is evaluated using a systematically designed dataset comprising SEM images acquired from samples subjected to controlled annealing times (60, 90, and 120 min) and corrosion exposure durations (1, 7, 14, and 21 days). This experimental design enables direct investigation of the influence of thermal processing on corrosion behavior while providing a structured basis for evaluating model robustness and generalization.
Although prior studies have examined environmental correlations in corrosion behavior, particularly long-term exposure effects [16], most approaches still treat SEM images as static observations. Systematic modeling of temporally ordered SEM data combined with controlled thermal treatment parameters remains largely unexplored. This gap limits the ability to capture time-dependent microstructural evolution and corrosion progression. At the same time, state-of-the-art segmentation methods typically depend on extensive manual annotation to achieve high accuracy, creating significant barriers to scalability and industrial adoption. This unresolved trade-off between research-grade precision and annotation efficiency highlights the need for corrosion analysis frameworks that jointly address temporal–thermal correlation and annotation scalability [10,12,17].
The novelty of the present study lies not in the isolated use of established deep learning architectures, but in a segmentation-guided, inspection-oriented learning paradigm tailored to corrosion analysis. The proposed framework explicitly correlates annealing time, corrosion evolution, and learned spatial features, a relationship that has not been sufficiently explored in prior corrosion studies. Unlike existing approaches that either perform direct severity classification from full images or focus solely on segmentation, the proposed method decouples corrosion localization from severity assessment. Severity classification is performed exclusively on segmentation-refined corrosion regions, encouraging morphology-driven feature learning that is directly linked to corrosion extent and texture rather than background or structural context. This strategy reduces label ambiguity, improves robustness under varying conditions, and enables independent optimization and error analysis of each stage. Importantly, the framework is backbone-agnostic, allowing alternative segmentation and classification models to be integrated without altering the underlying methodology.
Overall, the AI-driven SEM analysis workflow proposed in this study aims to streamline corrosion assessment, reduce human workload, and enhance analytical consistency. By incorporating temporally ordered experimental conditions, the framework also lays the groundwork for predictive maintenance applications, including early damage detection and lifecycle forecasting in industrial systems. This work therefore contributes to a more intelligent, scalable, and interpretable corrosion characterization pipeline that bridges advanced microscopy with state-of-the-art machine learning techniques.
2. Related Work
Recent advances in deep learning have enabled increasingly sophisticated approaches for automated corrosion detection and assessment from SEM imagery [16,17,18,19,20]. This section reviews representative methods most relevant to the present study, focusing on YOLO-based corrosion localization, EfficientNet-based severity classification, and data-driven strategies for material optimization and environmental correlation. Rather than providing an exhaustive survey, the discussion highlights the practical strengths of these approaches and identifies key limitations that motivate the proposed temporal–thermal analysis framework.
YOLOv8 has emerged as a strong performer in industrial image analysis, including corrosion detection and segmentation, owing to architectural innovations such as anchor-free detection and enhanced multiscale feature aggregation [12,14]. These characteristics make YOLOv8 particularly effective for capturing the irregular and heterogeneous morphology of corrosion in SEM images. Prior studies have reported substantial improvements in segmentation accuracy over earlier YOLO variants, and pixel-level corrosion mapping has been demonstrated for localized corrosion in structural alloys [14,20]. The YOLOv8-seg architecture further enables efficient instance segmentation through prototype-based mask generation, producing pixel-wise masks via linear combinations of learned prototypes and instance-specific coefficients. Despite these advantages, existing YOLO-based corrosion studies predominantly treat SEM images as independent samples and focus on spatial accuracy, without explicitly incorporating temporally ordered experimental conditions or correlating segmentation results with material processing parameters such as annealing history.
For corrosion severity assessment, EfficientNet-B0 has been widely adopted due to its compound scaling strategy, which balances network depth, width, and resolution to achieve favorable trade-offs between accuracy and computational efficiency [12]. The use of MBConv blocks with Squeeze-and-Excitation modules allows effective recalibration of channel-wise features, facilitating the detection of subtle corrosion patterns in SEM imagery. Previous work has shown that combining YOLO-based segmentation with EfficientNet-based classification can yield comprehensive corrosion assessment pipelines [12], and transfer learning studies confirm that EfficientNet architectures outperform comparable ResNet and MobileNet models in feature representation efficiency [21]. However, most EfficientNet-based approaches formulate severity classification as a static task, without modeling degradation evolution or linking severity outcomes to upstream thermal or processing conditions, limiting their interpretability in corrosion progression analysis [22,23,24,25].
Beyond image-based methods, data-driven material optimization studies have demonstrated the value of integrating machine learning with experimental validation to improve corrosion resistance. A data-driven approach combining random forest modeling with Spearman correlation analysis has been used to optimize Sn microalloying content in low-alloy steel, achieving high predictive accuracy for corrosion current density and identifying key environmental drivers such as temperature and humidity [26]. Complementary experimental techniques, including XRD, XPS, and electrochemical testing, provided mechanistic insight into protective oxide formation. While these studies effectively link composition and environment to corrosion performance, they do not address the role of thermal processing parameters or leverage SEM-based morphological analysis in a temporally structured manner. In parallel, recent advances in generative AI and transformer-based segmentation have shown promise for addressing data scarcity and class imbalance through synthetic data generation and advanced augmentation strategies [27,28]. Although these approaches offer valuable tools for improving robustness, they have yet to be systematically applied to corrosion studies that integrate thermal history, temporal progression, and SEM-based feature learning.
Overall, existing methods provide strong capabilities for corrosion localization, severity classification, and data-driven material optimization, but they largely operate in isolation—either emphasizing spatial accuracy, compositional effects, or environmental correlation. The lack of frameworks that jointly consider temporally ordered SEM observations, thermal processing parameters, and scalable annotation strategies represents a critical gap. Addressing this gap motivates the methodology presented in the following section, which integrates segmentation-guided severity assessment with a controlled temporal–thermal experimental design to enable a more interpretable and transferable corrosion analysis framework.
3. Methodology
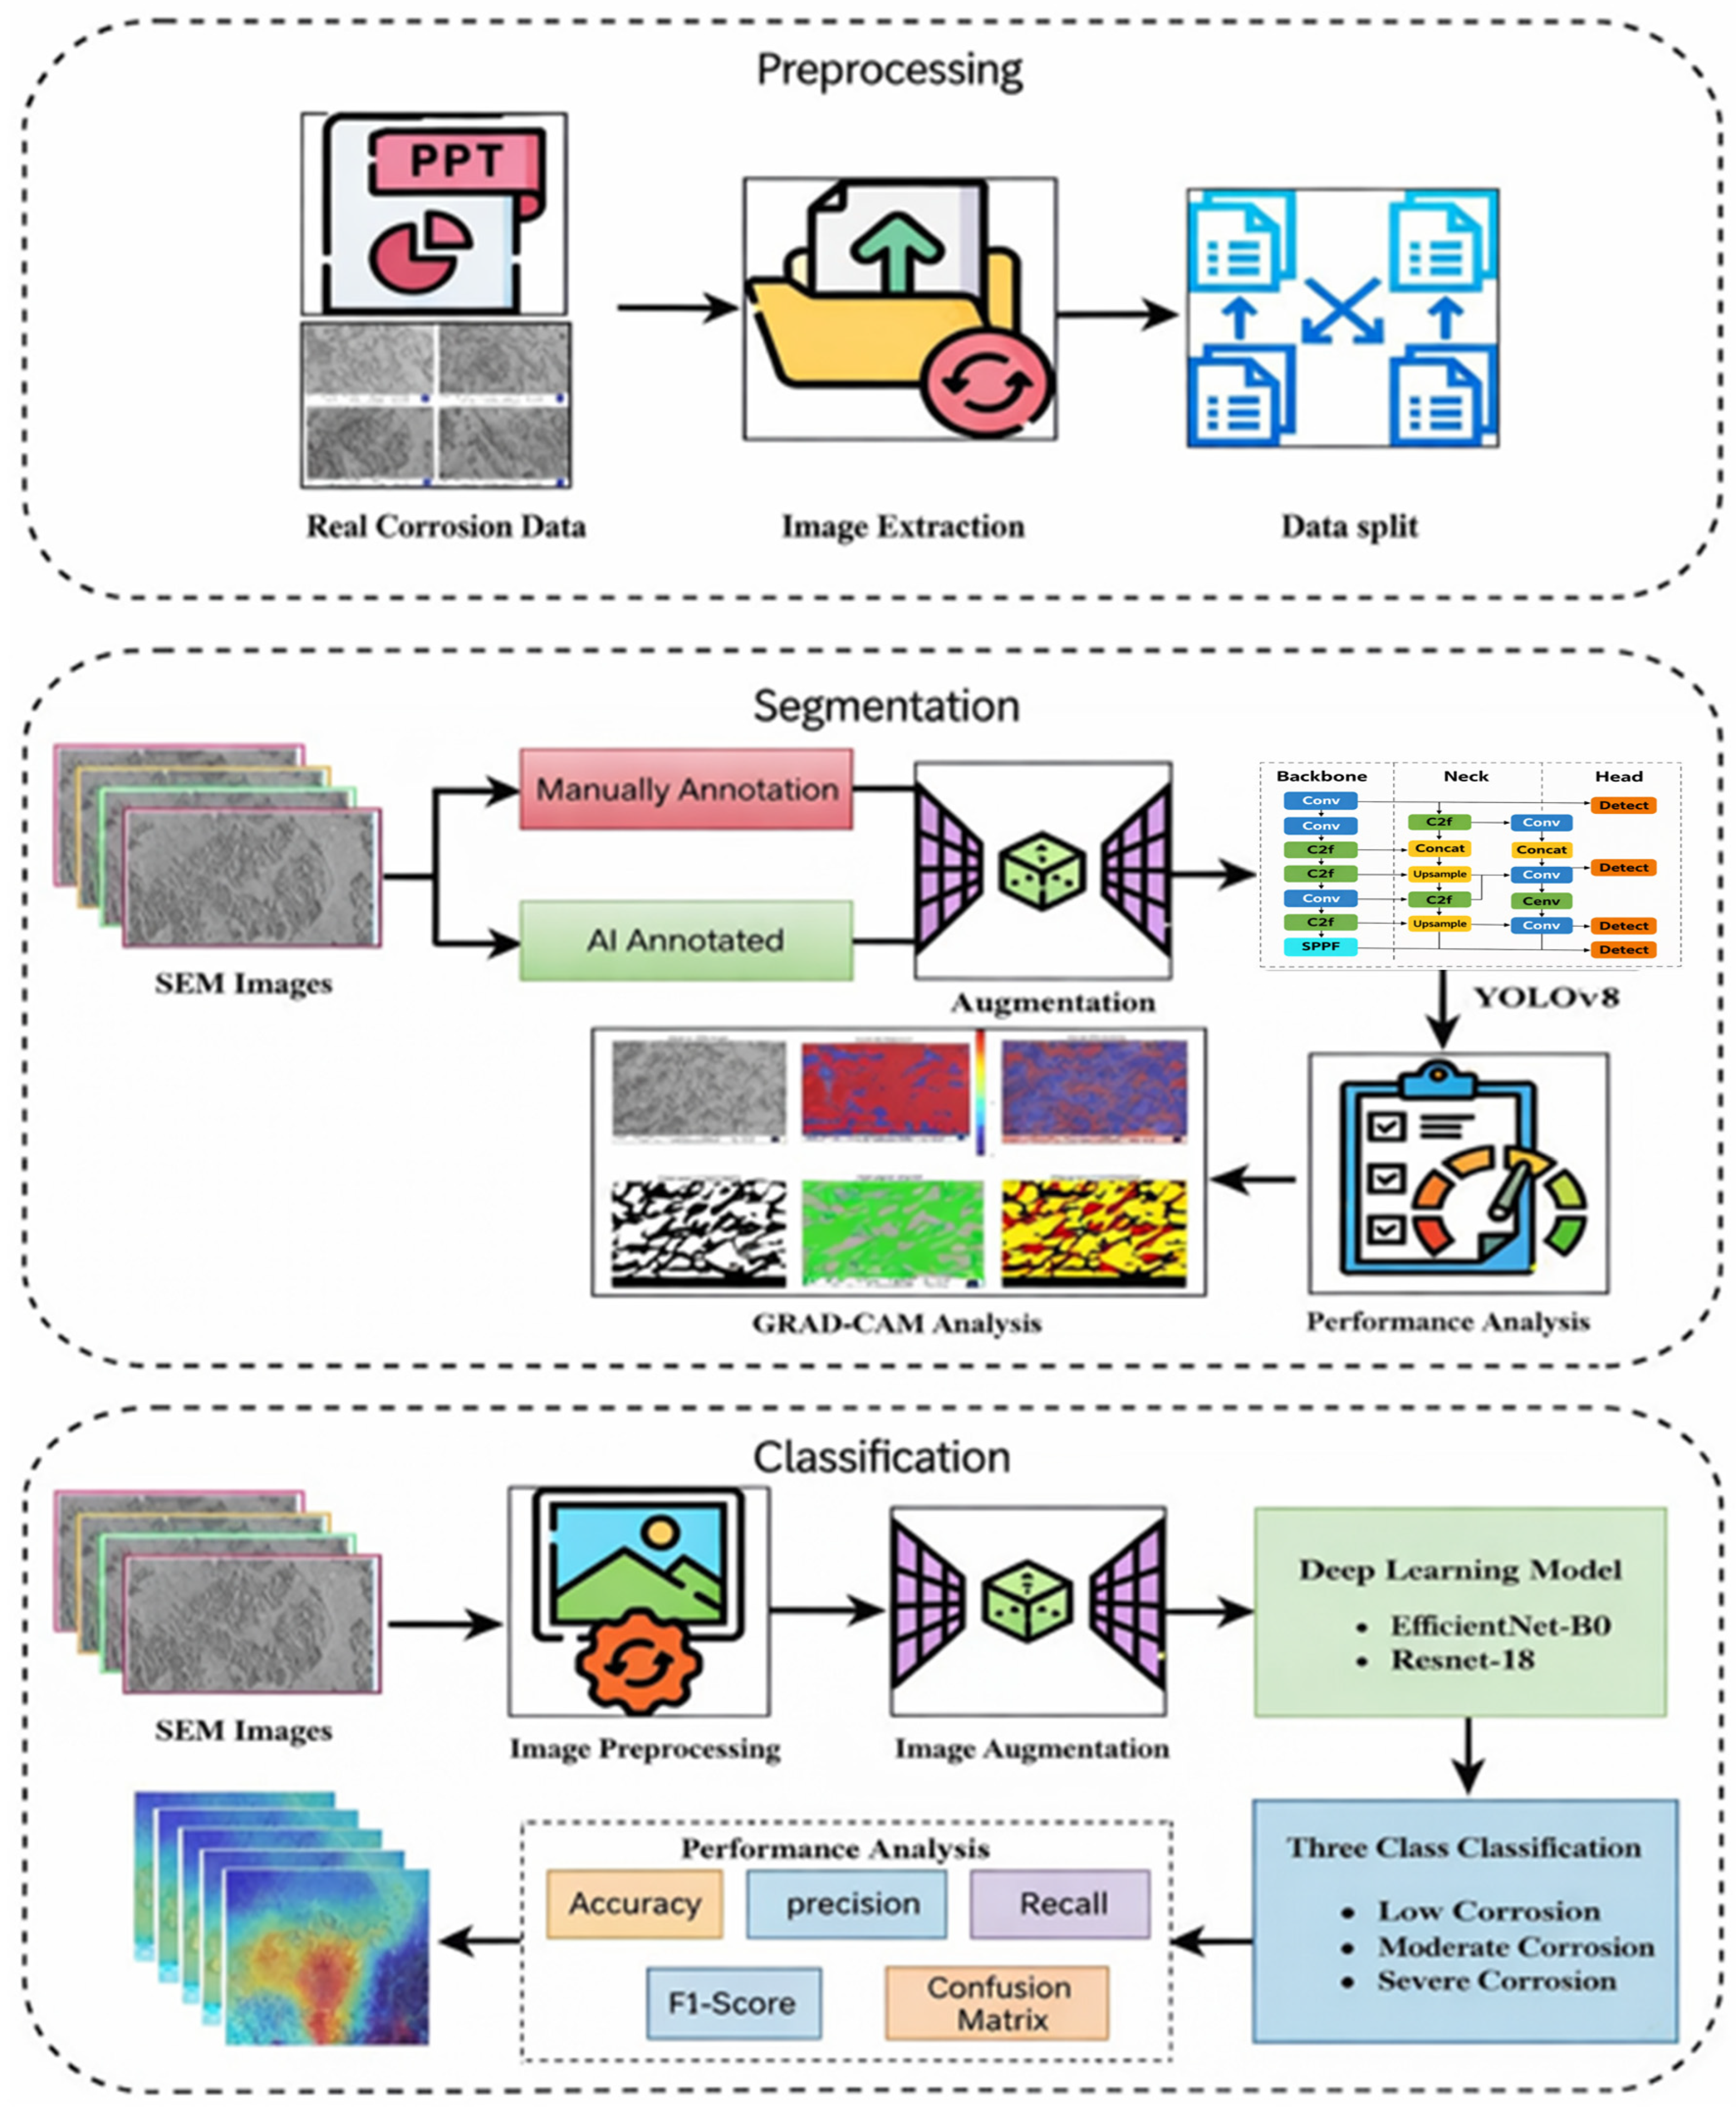
This proposed approach follows a two-stage AI framework consisting of corrosion segmentation and severity classification, preceded by a common preprocessing step for SEM image standardization. The system architecture is designed as a sequential yet modular pipeline that processes SEM images obtained under three annealing conditions (AN_60, AN_90, and AN_120), as illustrated in Figure 1. The segmentation stage enables precise spatial localization of corrosion regions, while the subsequent classification stage quantifies corrosion severity based on the segmented regions. This modular design allows the framework to operate flexibly, supporting standalone segmentation for detailed morphological analysis as well as integrated segmentation–classification for complete corrosion assessment. Such an architecture is suitable for both research-oriented applications requiring fine-grained interpretation and industrial scenarios where rapid and reliable assessment is essential. Model performance is quantitatively evaluated using standard segmentation and classification metrics to ensure objective assessment.
Figure 1.
Architecture of the framework.
3.1. Segmentation Pipeline
3.1.1. Data Preprocessing
A detailed preprocessing pipeline was developed to ensure data quality and consistency for deep learning applications. Image preprocessing operations included manual cropping to remove extraneous magnification labels, scale bars, and metadata overlays, followed by metadata normalization using standardized lookup tables for consistent parameter documentation. Quality control validation ensured uniform imaging parameters across all samples, with format standardization for deep learning framework compatibility.
In this pipeline, grayscale SEM images were replicated into three RGB channels. This conversion was adopted purely for architectural compatibility with standard pretrained CNN and transformer backbones, which are designed to accept three-channel inputs, rather than to introduce or imply color information. Because all three channels contain identical intensity values, no artificial chromatic cues are introduced, and the networks effectively operate on grayscale texture and morphology information only.
Task-specific augmentation strategies were designed to enhance dataset diversity while preserving critical corrosion morphology characteristics. Segmentation augmentation took a dual approach with manual annotation employing 4× augmentation multiplication on 96 high-quality images, generating 384 training samples through horizontal/vertical flips, controlled rotational variations, affine transformations maintaining spatial relationships, and illumination adjustments addressing imaging variability. The remaining images were annotated using the validated automated procedure to ensure consistency and scalability.
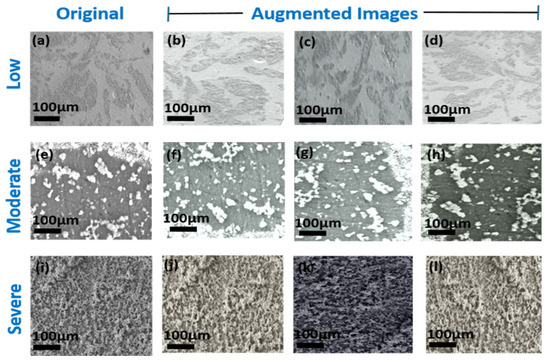
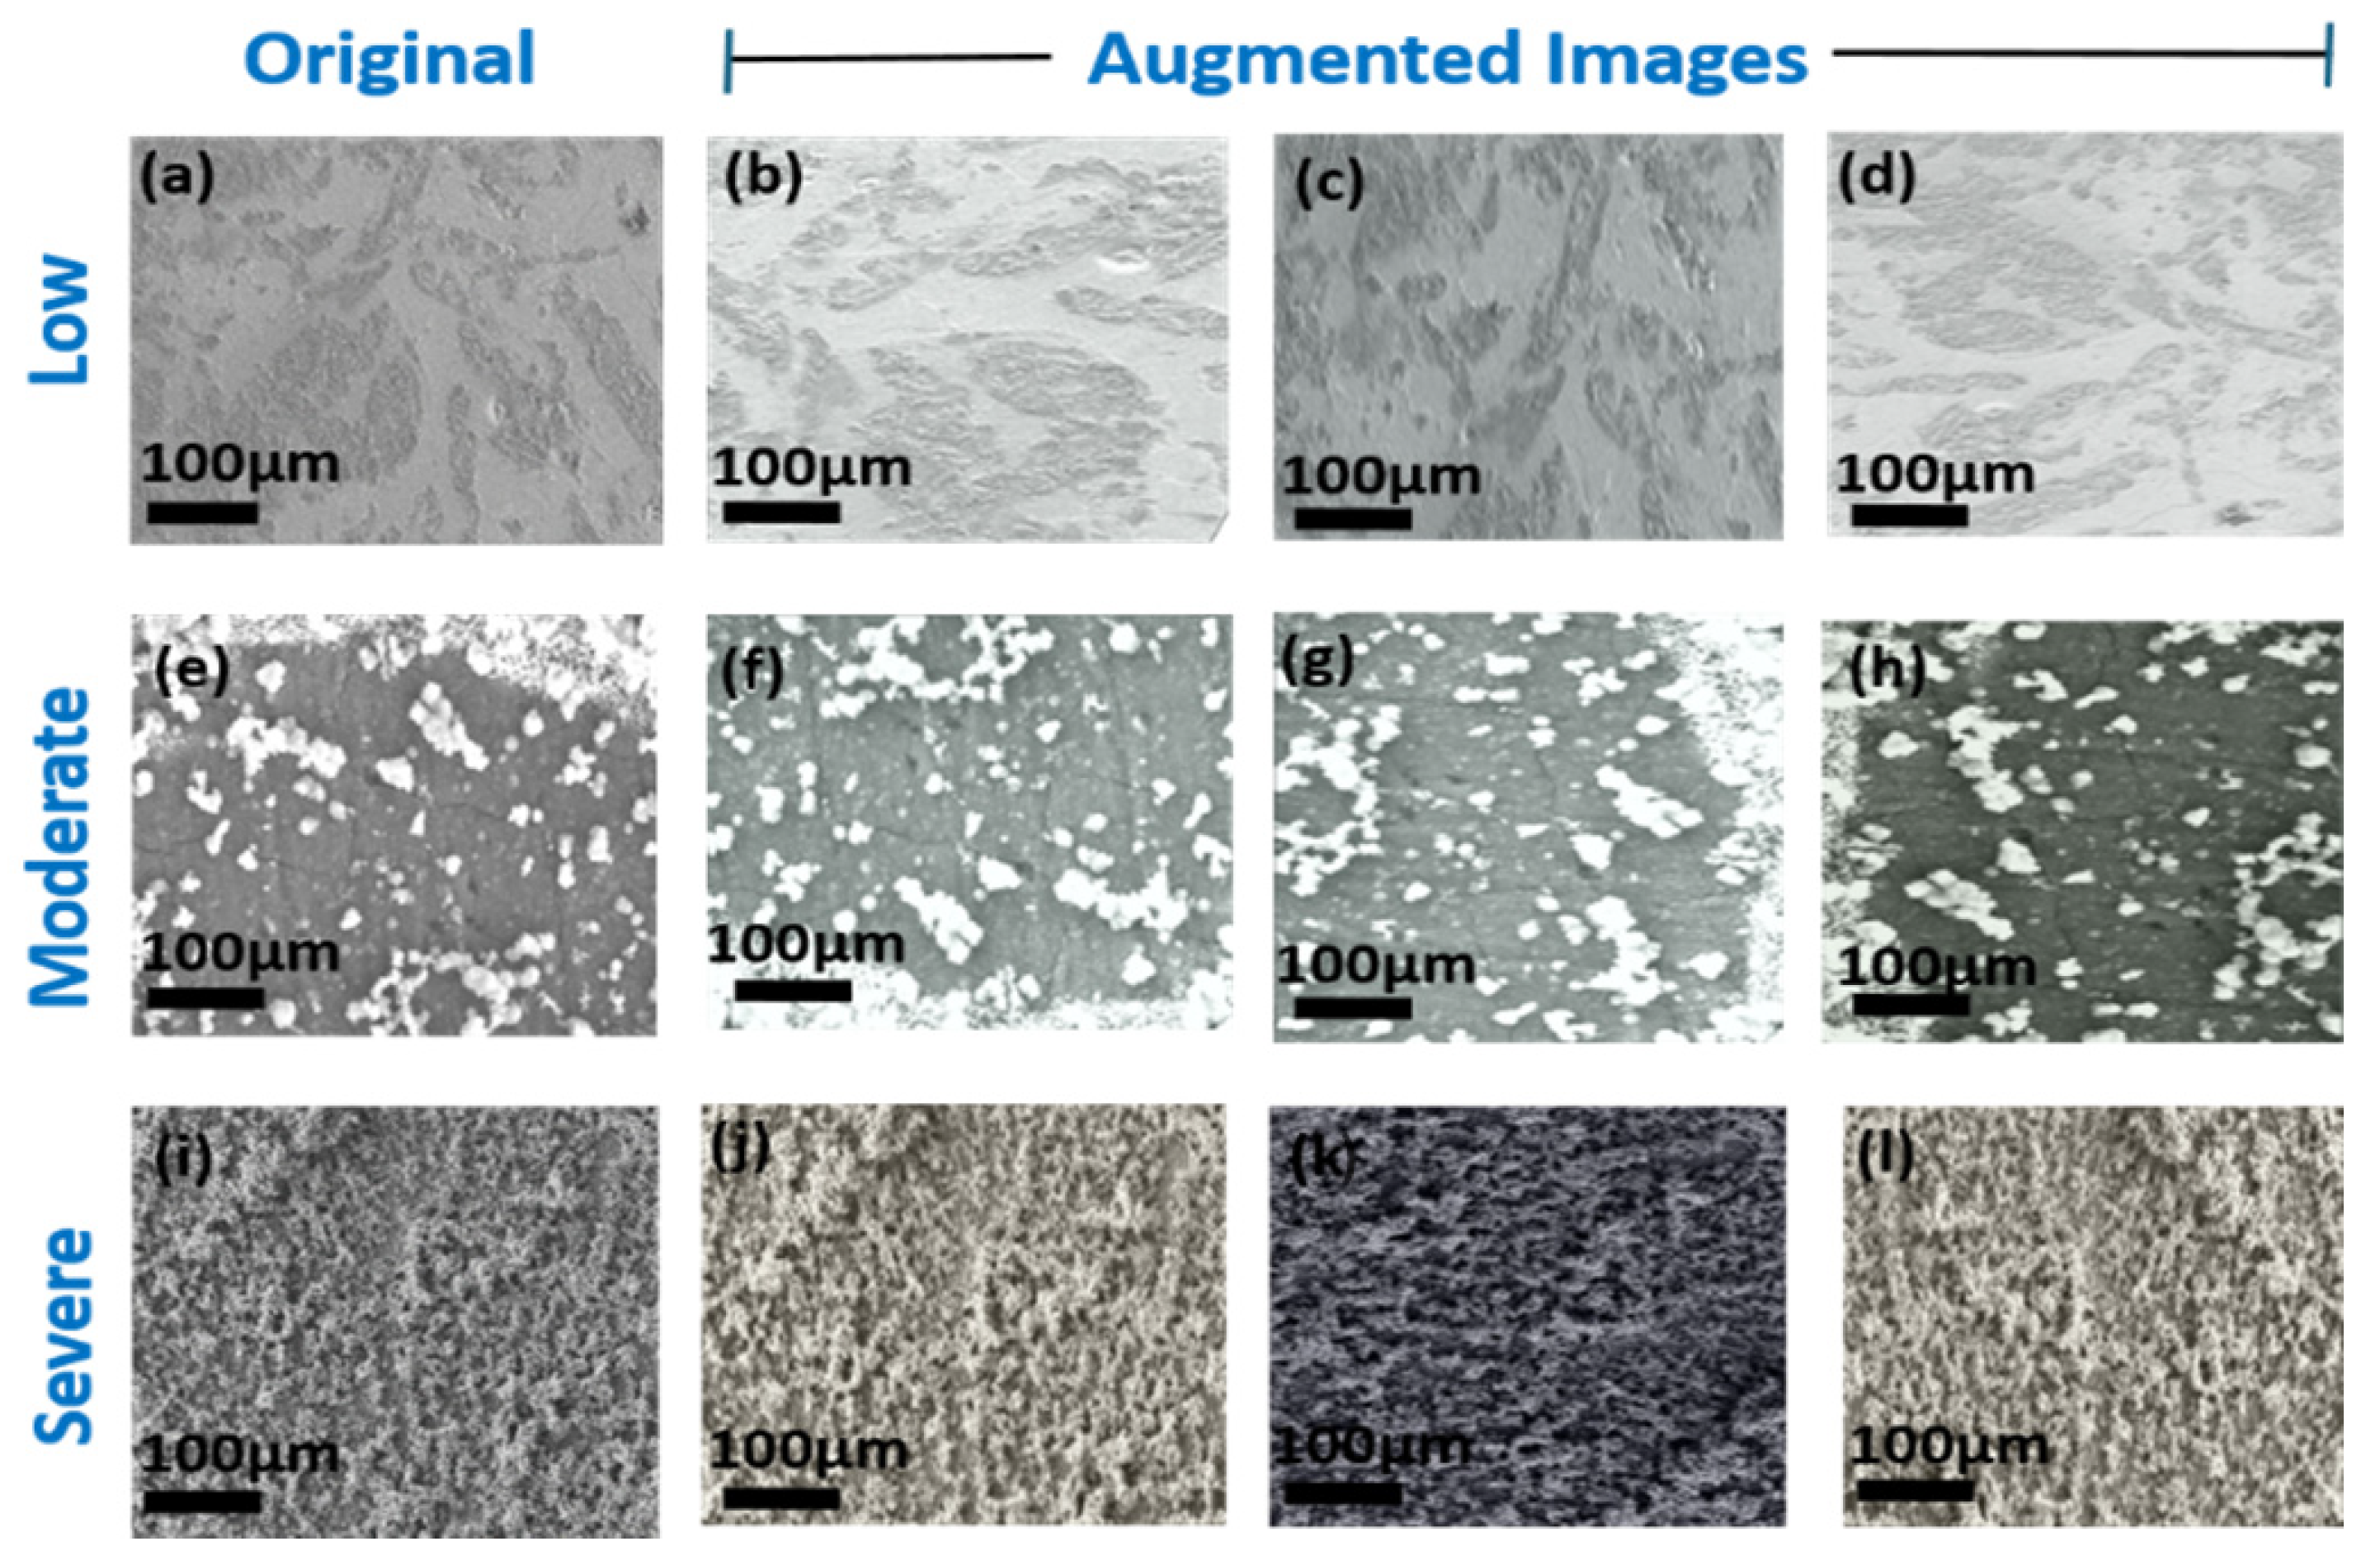
The NPY-generated masks refer to segmentation masks stored in NumPy 2.0.2 array format. These masks are generated using a deterministic, rule-based image processing pipeline applied directly to raw SEM images, based on intensity thresholding, contrast enhancement, and morphological filtering operations. This process is independent of any trained deep learning model and does not introduce circular supervision. To validate their reliability, a subset of automatically generated masks was quantitatively compared with manually annotated ground truth masks using overlap-based metrics, demonstrating consistent spatial agreement. Figure 2 shows original and augmented images across different classes.
Figure 2.
Original and augmented images across different corrosion severity classes. (a) Original low corrosion image; (b–d) augmented low corrosion images showing horizontal flip, rotation, and affine transformation; (e) original mod-erate corrosion image; (f–h) augmented moderate corrosion images with various transformations; (i) original severe corrosion image; (j–l) augmented severe corrosion images demonstrating the 4× augmentation strategy applied to en-hance dataset diversity while preserving critical corrosion morphology characteristics.
3.1.2. Model Implementation
The segmentation framework was designed to perform accurate segmentation of corrosion-affected regions for quantitative assessment of material degradation in SEM imagery. The framework employs instance segmentation methodology to distinguish between corroded and non-corroded regions at the pixel level, enabling precise boundary detection and quantitative area measurements.
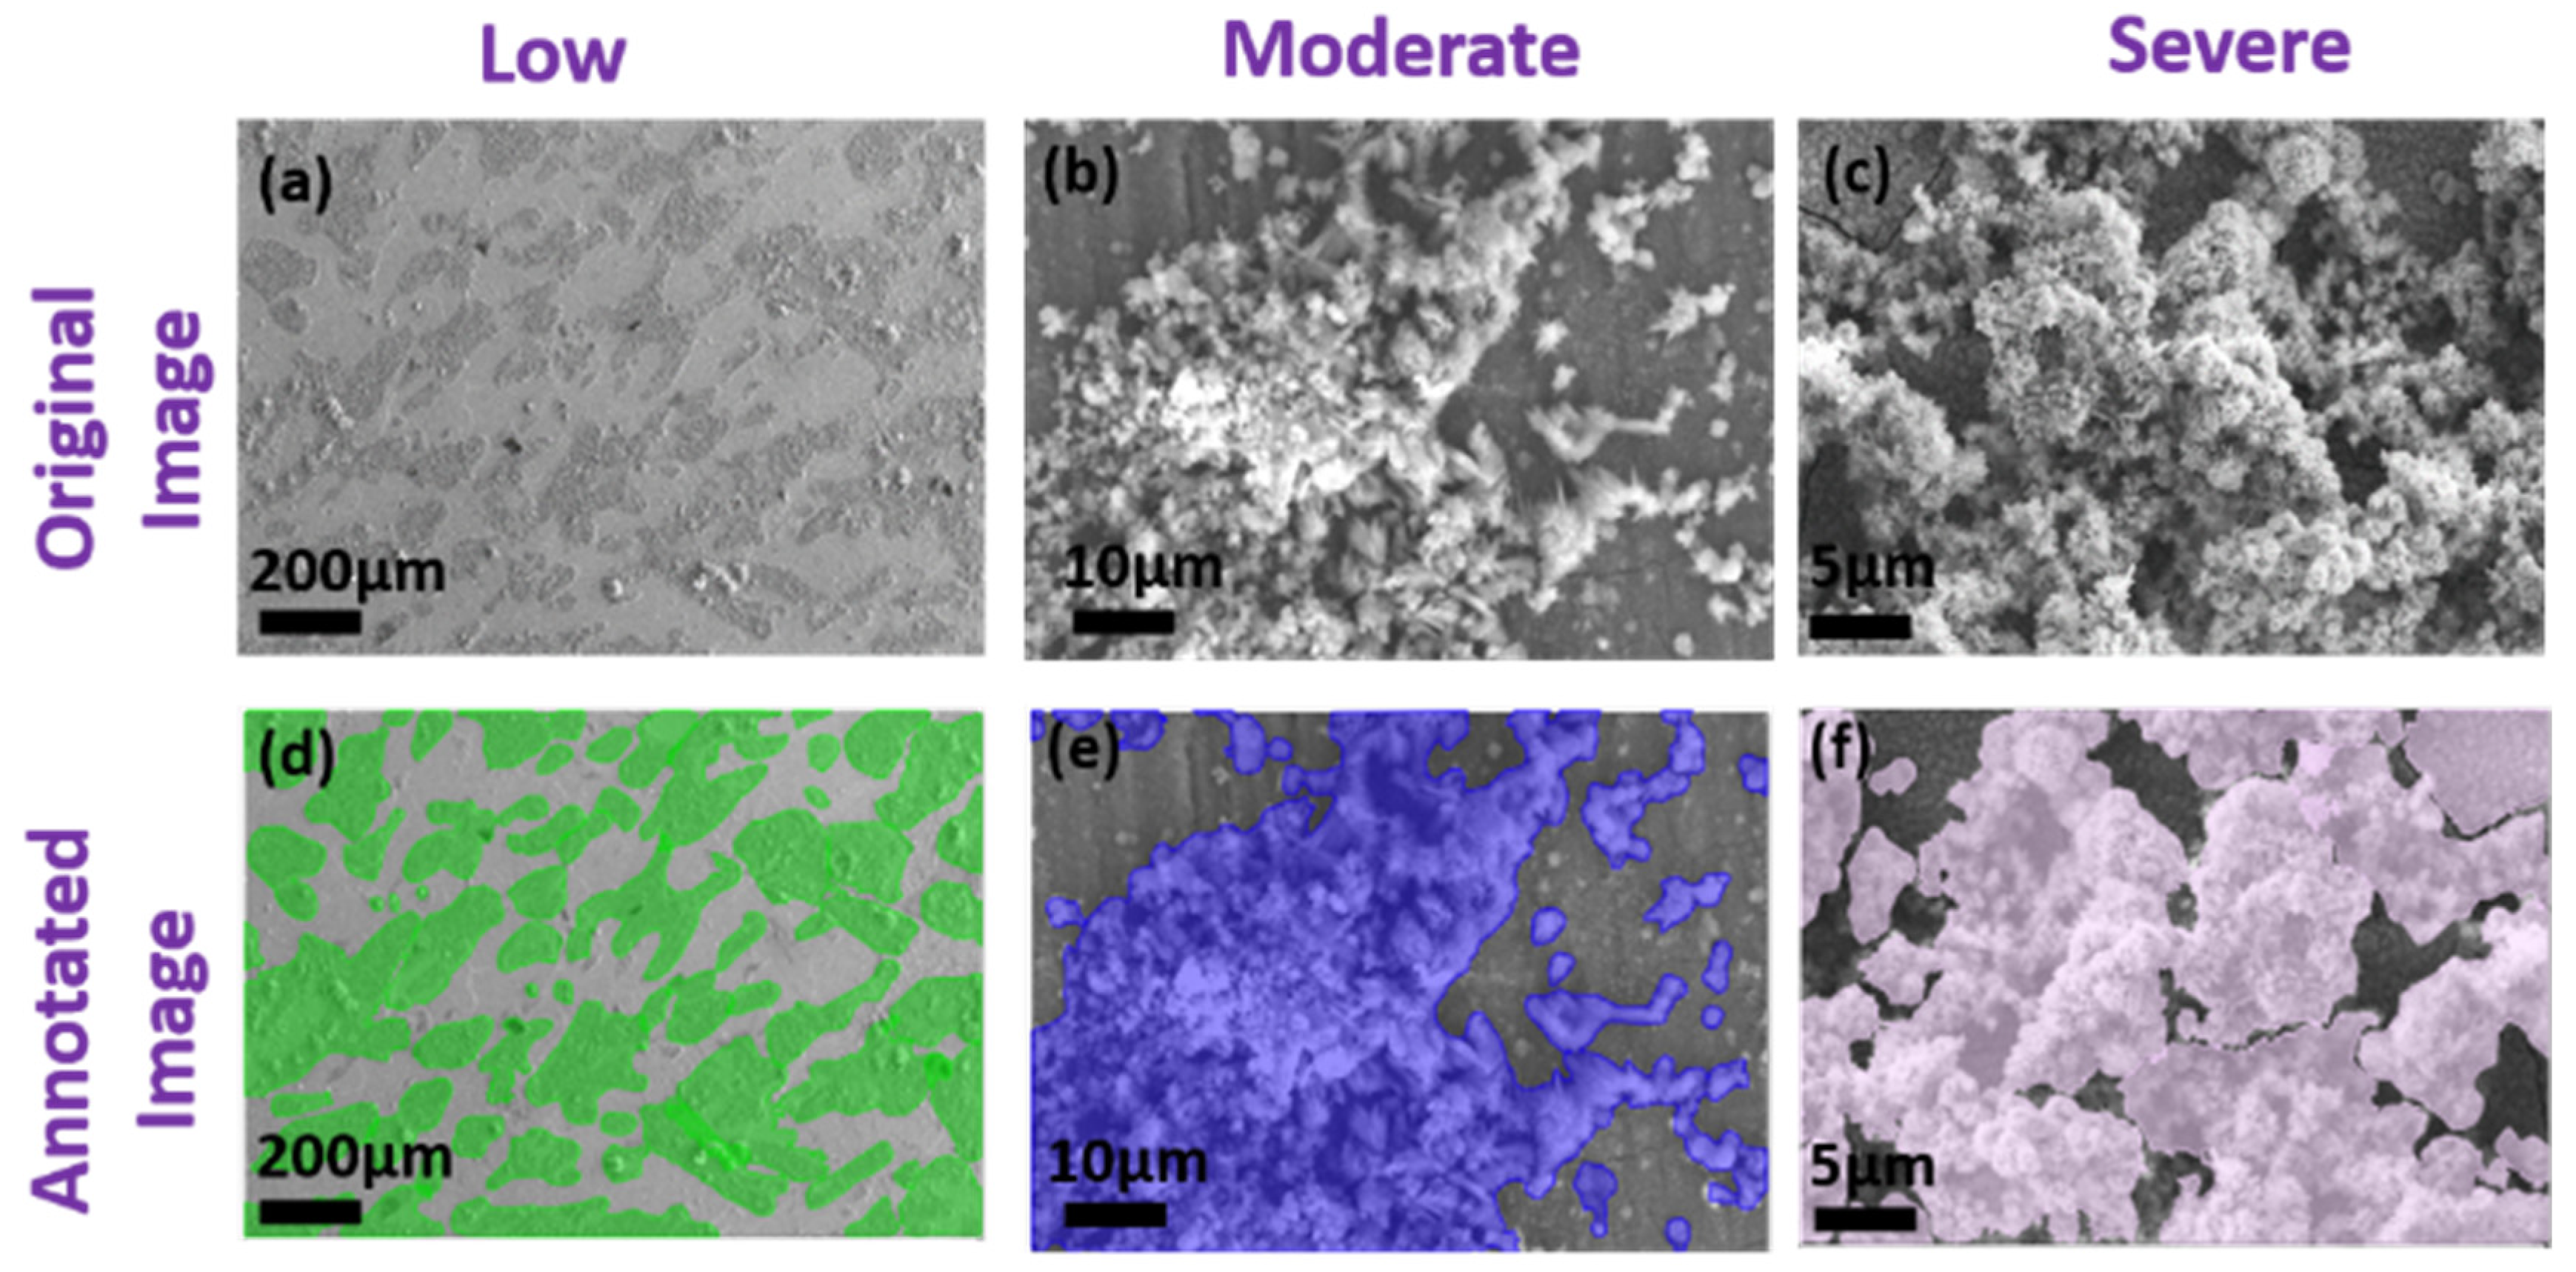
Two distinct annotation approaches were explored to evaluate performance trade-offs between operational efficiency and segmentation precision. Automated annotation utilized automatically generated ground truth from NPY segmentation masks, providing scalable processing capabilities for large datasets without manual intervention requirements targeting industrial screening applications. Manual annotation employed expert-generated ground truth masks enhanced with 4× data augmentation strategies, providing high-precision reference standards for model training and evaluation targeting research applications requiring maximum spatial accuracy. Table 1 presents the segmentation annotation strategy comparison. Figure 2 presents the original images alongside their annotated counterparts.
Table 1.
Segmentation annotation strategy comparison.
3.1.3. Training and Experimental Configuration
A complete SEM dataset consisting of 117 images was used, constructed under controlled annealing conditions (60, 90, and 120 min) and corrosion exposure durations (1 h, 7, 14, and 21 days). Although the dataset size is limited due to experimental constraints, morphological diversity was ensured through systematic variation in conditions.
Segmentation tasks utilized an 80–20% training–validation split, with four-fold cross-validation applied to improve robustness and mitigate overfitting. Segmentation prioritizes maximizing training data for pixel-level learning.
The segmentation pipeline employed YOLOv8 architecture configured for multi-class corrosion detection across three annealing conditions (AN_60, AN_90, AN_120). Both segmentation models underwent identical training protocols with different annotation strategies. YOLO Automated utilized variable dataset size with fully automated NPY-generated masks, while YOLO Augmented employed 96 base images with manual annotation enhanced through augmentation techniques, generating 384 training samples.
Training was performed using the Adam optimizer [29] with an initial learning rate of 1 × 10⁻³, batch size of 8, and up to 200 epochs. Models were initialized using pretrained ImageNet weights and trained using standard augmentation and learning rate scheduling. Experiments were conducted on an NVIDIA RTX 3090 GPU (24 GB VRAM) with 64 GB system memory (Nvidia Corporation, Santa Clara, CA, USA) using PyTorch 1.8 and the Ultralytics YOLOv8 framework. Table 2 summarizes the experimental design matrix.
Table 2.
Experimental design matrix.
3.1.4. Evaluation Protocol
Detailed evaluation employed multiple quantitative metrics for segmentation assessment. Spatial accuracy assessment utilized Mean Intersection over Union, Box/Mask Precision, Recall for boundary detection assessment, and Grad-CAM visualization for interpretability analysis.
Detection performance was evaluated using mAP50 and mAP50–95 for both box and mask detection across varying IoU thresholds. Discriminative analysis employed ROC curve analysis and AUC performance metrics for class separation evaluation. Sample-level evaluation assessed individual image performance correlation with corrosion characteristics and morphological complexity.
All segmentation models were evaluated using quantitative spatial and object-level metrics with four-fold cross-validation to ensure stability and generalizability. Gradient-weighted class activation mapping (Grad-CAM) visualization was applied to provide interpretability analysis, supporting the evaluation of segmentation performance in relation to spatial accuracy metrics.
3.1.5. Interpretability Analysis
In the context of the segmentation pipeline, Grad-CAM is used to generate spatial attention maps that highlight the regions within SEM images that most strongly influence the model’s predictions. These activation maps are analyzed alongside the predicted segmentation outputs to assess whether the model is focusing on corrosion-relevant regions that contribute to accurate boundary detection.
This interpretability analysis is directly aligned with the quantitative evaluation metrics, including Mean Intersection over Union, Precision, and Recall. Specifically, when the Grad-CAM attention maps are well-aligned with corrosion-affected regions, the model is more likely to achieve higher IoU scores due to the improved overlap between predicted and ground truth masks. Similarly, accurate localization of relevant regions supports higher precision by reducing false positives and improves recall by ensuring true corrosion regions are correctly identified.
Therefore, Grad-CAM serves as a qualitative validation tool that complements the quantitative evaluation protocol, providing insight into how the model’s attention contributes to boundary detection performance and overall segmentation accuracy.
3.2. Classification Pipeline
3.2.1. Data Preprocessing
Classification-specific preprocessing included grayscale conversion and resizing to 224 × 224 pixels with 3-channel format replication for architecture compatibility. Augmentation strategies incorporated random transforms including flips, rotations, affine transformations, and color jittering.
Class balancing was achieved using weighted sampling. Regularization techniques included mix-up and dropout for enhanced generalization.
3.2.2. Model Implementation
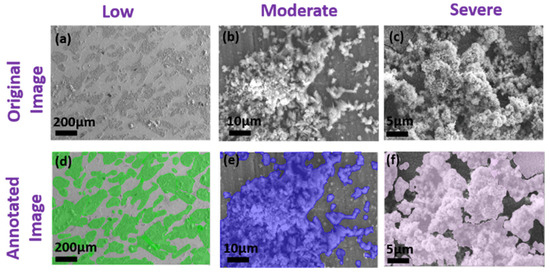
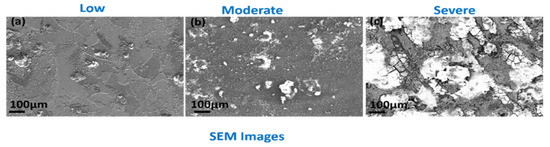
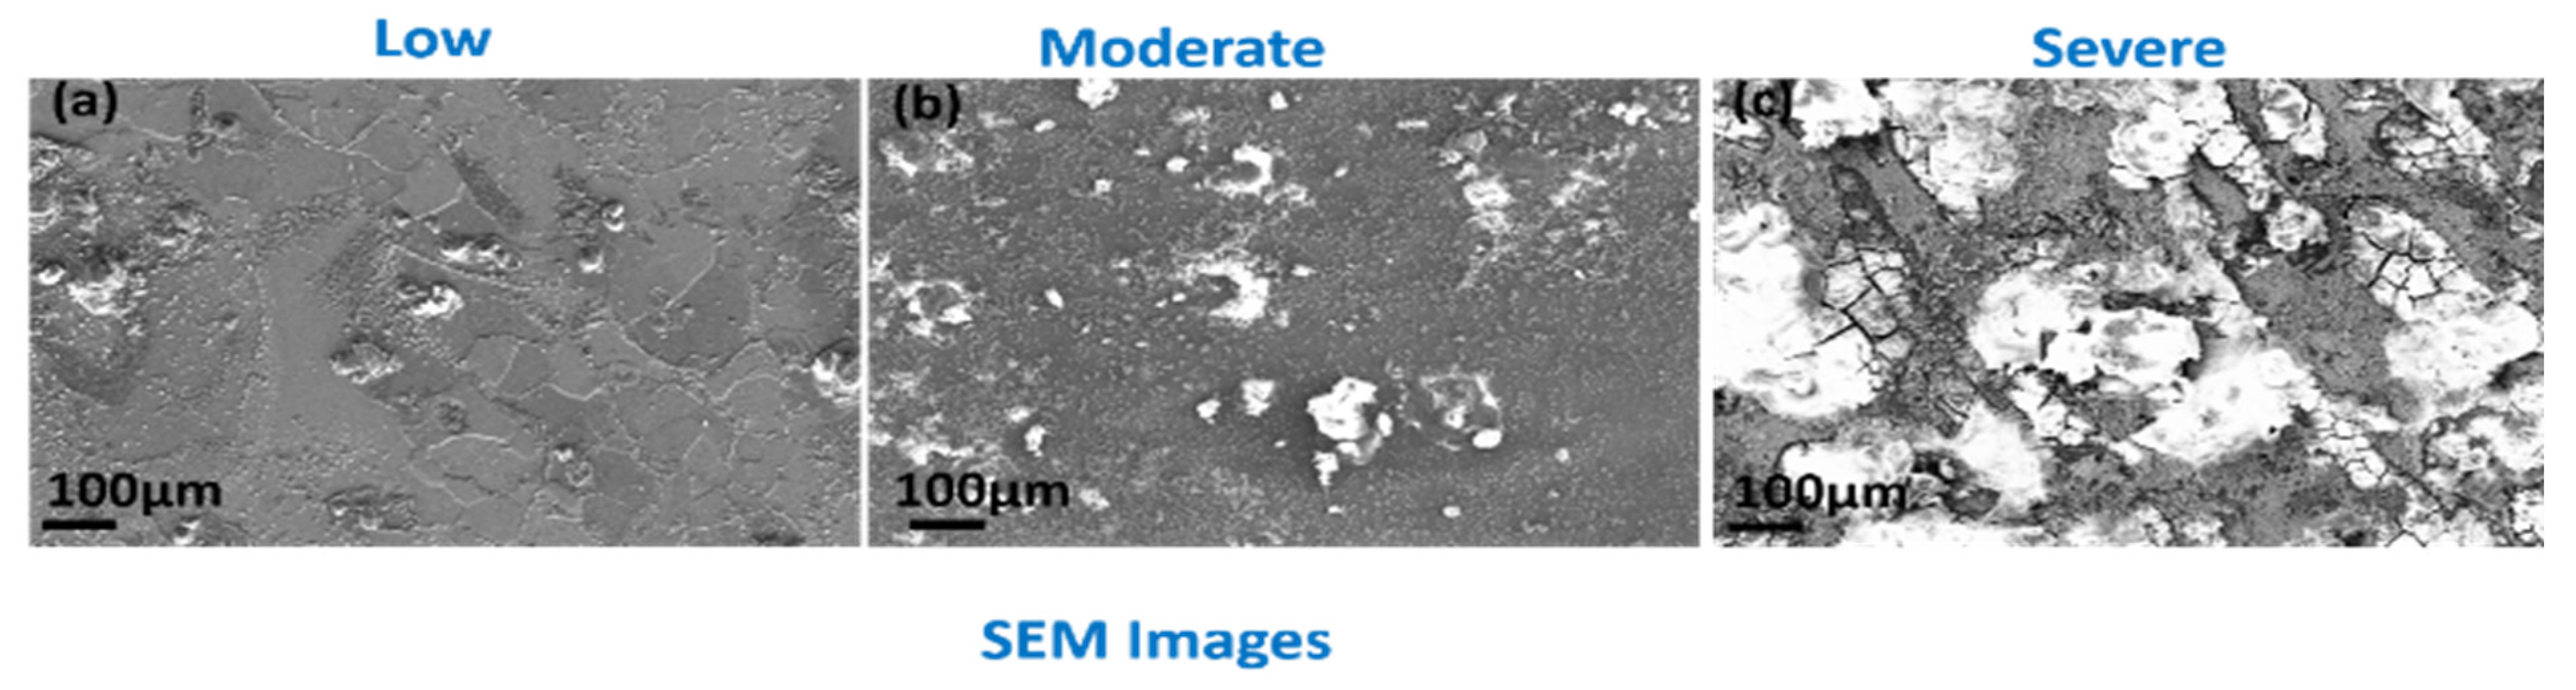
The classification system is framed as static severity classification informed by temporally ordered experimental conditions. The framework addresses early-stage corrosion (1 h exposure, Label 0), intermediate corrosion (7-day exposure, Label 1), and advanced corrosion (14–21-day exposure, Label 2). Figure 3 illustrates the original and annotated images. Figure 4 illustrates the corrosion severity categories.
Figure 3.
Original and annotated images.Figure 3. Original and annotated SEM images demonstrating the annotation pipeline. (a) Original low corrosion SEM image (200 μm scale); (b) original moderate corrosion SEM image (10 μm scale); (c) original severe corrosion SEM image (5 μm scale); (d) annotated low corrosion image with segmentation mask overlay (green); (e) annotated moderate corrosion image with segmentation mask overlay (blue); (f) annotated severe corrosion image with segmentation mask overlay (pink). The color-coded masks highlight corrosion-affected regions for training the YOLOv8-seg segmentation model.
Figure 4.
Corrosion severity categories for classification. (a) Low corrosion severity showing minimal surface degradation; (b) moderate corrosion severity displaying intermediate surface changes with visible pitting; (c) severe corrosion severity exhibiting advanced material degradation with extensive corrosion coverage. All images acquired at 100 μm scale. These three severity levels correspond to Labels 0, 1, and 2 in the classification framework.
The severity estimation task is formulated as a classification problem rather than a regression task, as the severity labels correspond to discrete, morphology-driven categories. While regression-based formulations may provide finer granularity, they require quantitatively defined ground truth severity metrics, which are not directly available in SEM-based visual analysis. Therefore, classification was adopted to ensure interpretability and consistency with domain-specific labeling practices.
Two convolutional neural network architectures were selected: EfficientNet-B0 as the primary model and ResNet-18 as the baseline. A two-phase training approach was adopted, consisting of frozen backbone training followed by end-to-end fine-tuning.
3.2.3. Training and Experimental Configuration
The dataset of 117 SEM images was split into 80% training (n = 93), 10% validation (n = 8), and 10% testing (n = 16) using stratified sampling to preserve class balance. The test set was held out and used exclusively for final evaluation.
A 4-fold cross-validation scheme was employed to assess model generalizability and prevent overfitting.
Training was conducted using the Adam optimizer with an initial learning rate of 1 × 10⁻⁴, batch size of 16, and pretrained ImageNet weights, with up to 100 epochs.
3.2.4. Evaluation Protocol
Classification performance was evaluated using accuracy and confusion matrix analysis, ensuring a clear and consistent assessment of model performance.
Accuracy provides an overall measure of classification performance by quantifying the proportion of correctly predicted samples across all corrosion severity classes. This metric offers a straightforward evaluation of the model’s general predictive capability under the given experimental conditions.
In addition, confusion matrix analysis was employed to provide a detailed, class-wise evaluation of model behavior. The confusion matrix illustrates the distribution of correct and incorrect predictions across the low, moderate, and severe corrosion categories, enabling identification of specific misclassification patterns. This allows for a deeper understanding of how well the model distinguishes between different severity levels, particularly in cases where morphological similarities between classes may lead to ambiguity.
Together, these metrics enable a comprehensive comparison between EfficientNet-B0 and ResNet-18, offering both global performance assessment and detailed insight into class-specific prediction reliability and error distribution across all corrosion severity levels.
3.2.5. Interpretability Analysis
Interpretability analysis for the classification framework is conducted based on accuracy and confusion matrix evaluation, ensuring consistency with the adopted performance metrics.
The overall accuracy provides a global measure of model performance across all corrosion severity classes, reflecting the proportion of correctly classified samples. In addition, confusion matrix analysis is employed to provide detailed insight into class-wise prediction behavior, highlighting correct classifications as well as misclassification patterns between low, moderate, and severe corrosion categories.
This analysis enables a clear understanding of how well the model distinguishes between different severity levels and identifies specific areas where class confusion may occur. By examining the distribution of predictions across classes, the model’s reliability and decision consistency are assessed in a manner aligned with the defined evaluation protocol.
4. Results
4.1. Segmentation Results
The results show that the YOLO Augmented model consistently outperforms the YOLO Automated model across all evaluated metrics, highlighting the effectiveness of enhanced data preparation. The augmented approach achieves a mean IoU of 89.91% (95% CI: 88.4–91.3%), representing a 9.24-point improvement over the automated method where mean IoU is 80.67% (95% CI: 78.8–82.5%), indicating more accurate spatial alignment between predictions and ground truth. Box-level detection performance shows particularly strong gains, with the augmented model reaching 98.6% mAP@50, compared to 86.6% for the automated approach, reflecting substantial improvements in both localization accuracy and detection reliability. These results confirm that augmentation significantly enhances model robustness and generalization, especially in applications requiring high precision and recall. Table 3 presents the mean IoU comparison, highlighting the segmentation accuracy differences between models and annotation strategies.
Table 3.
Mean IoU comparison.
The results show a substantial performance improvement of the YOLO Augmented model over the YOLO Automated model across both detection and segmentation metrics. For bounding box detection, the augmented approach achieves a Box mAP@50 of 98.6%, significantly higher than 86.6% obtained with automated training, and also demonstrates strong localization robustness with 91.2% mAP@50–95 compared to 55.1%. Similarly, segmentation performance improves markedly, with Mask mAP@50 increasing from 63.6% to 98.6% and Mask mAP@50–95 rising from 24.0% to 82.1%, indicating far superior accuracy across stricter IoU thresholds. Overall, these results confirm that augmentation leads to more consistent, high-quality predictions, particularly for tasks requiring precise localization and detailed mask boundaries. Table 4 presents the mAP@50 and mAP@50–95 comparison, evaluating segmentation performance under both relaxed and strict IoU thresholds across the compared methods.
Table 4.
mAP@50/mAP@50–95 comparison.
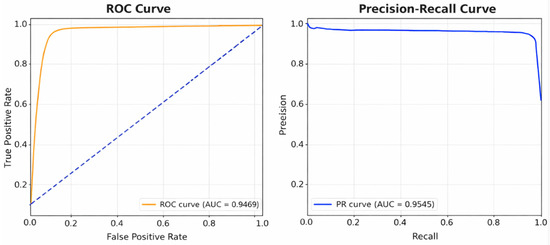
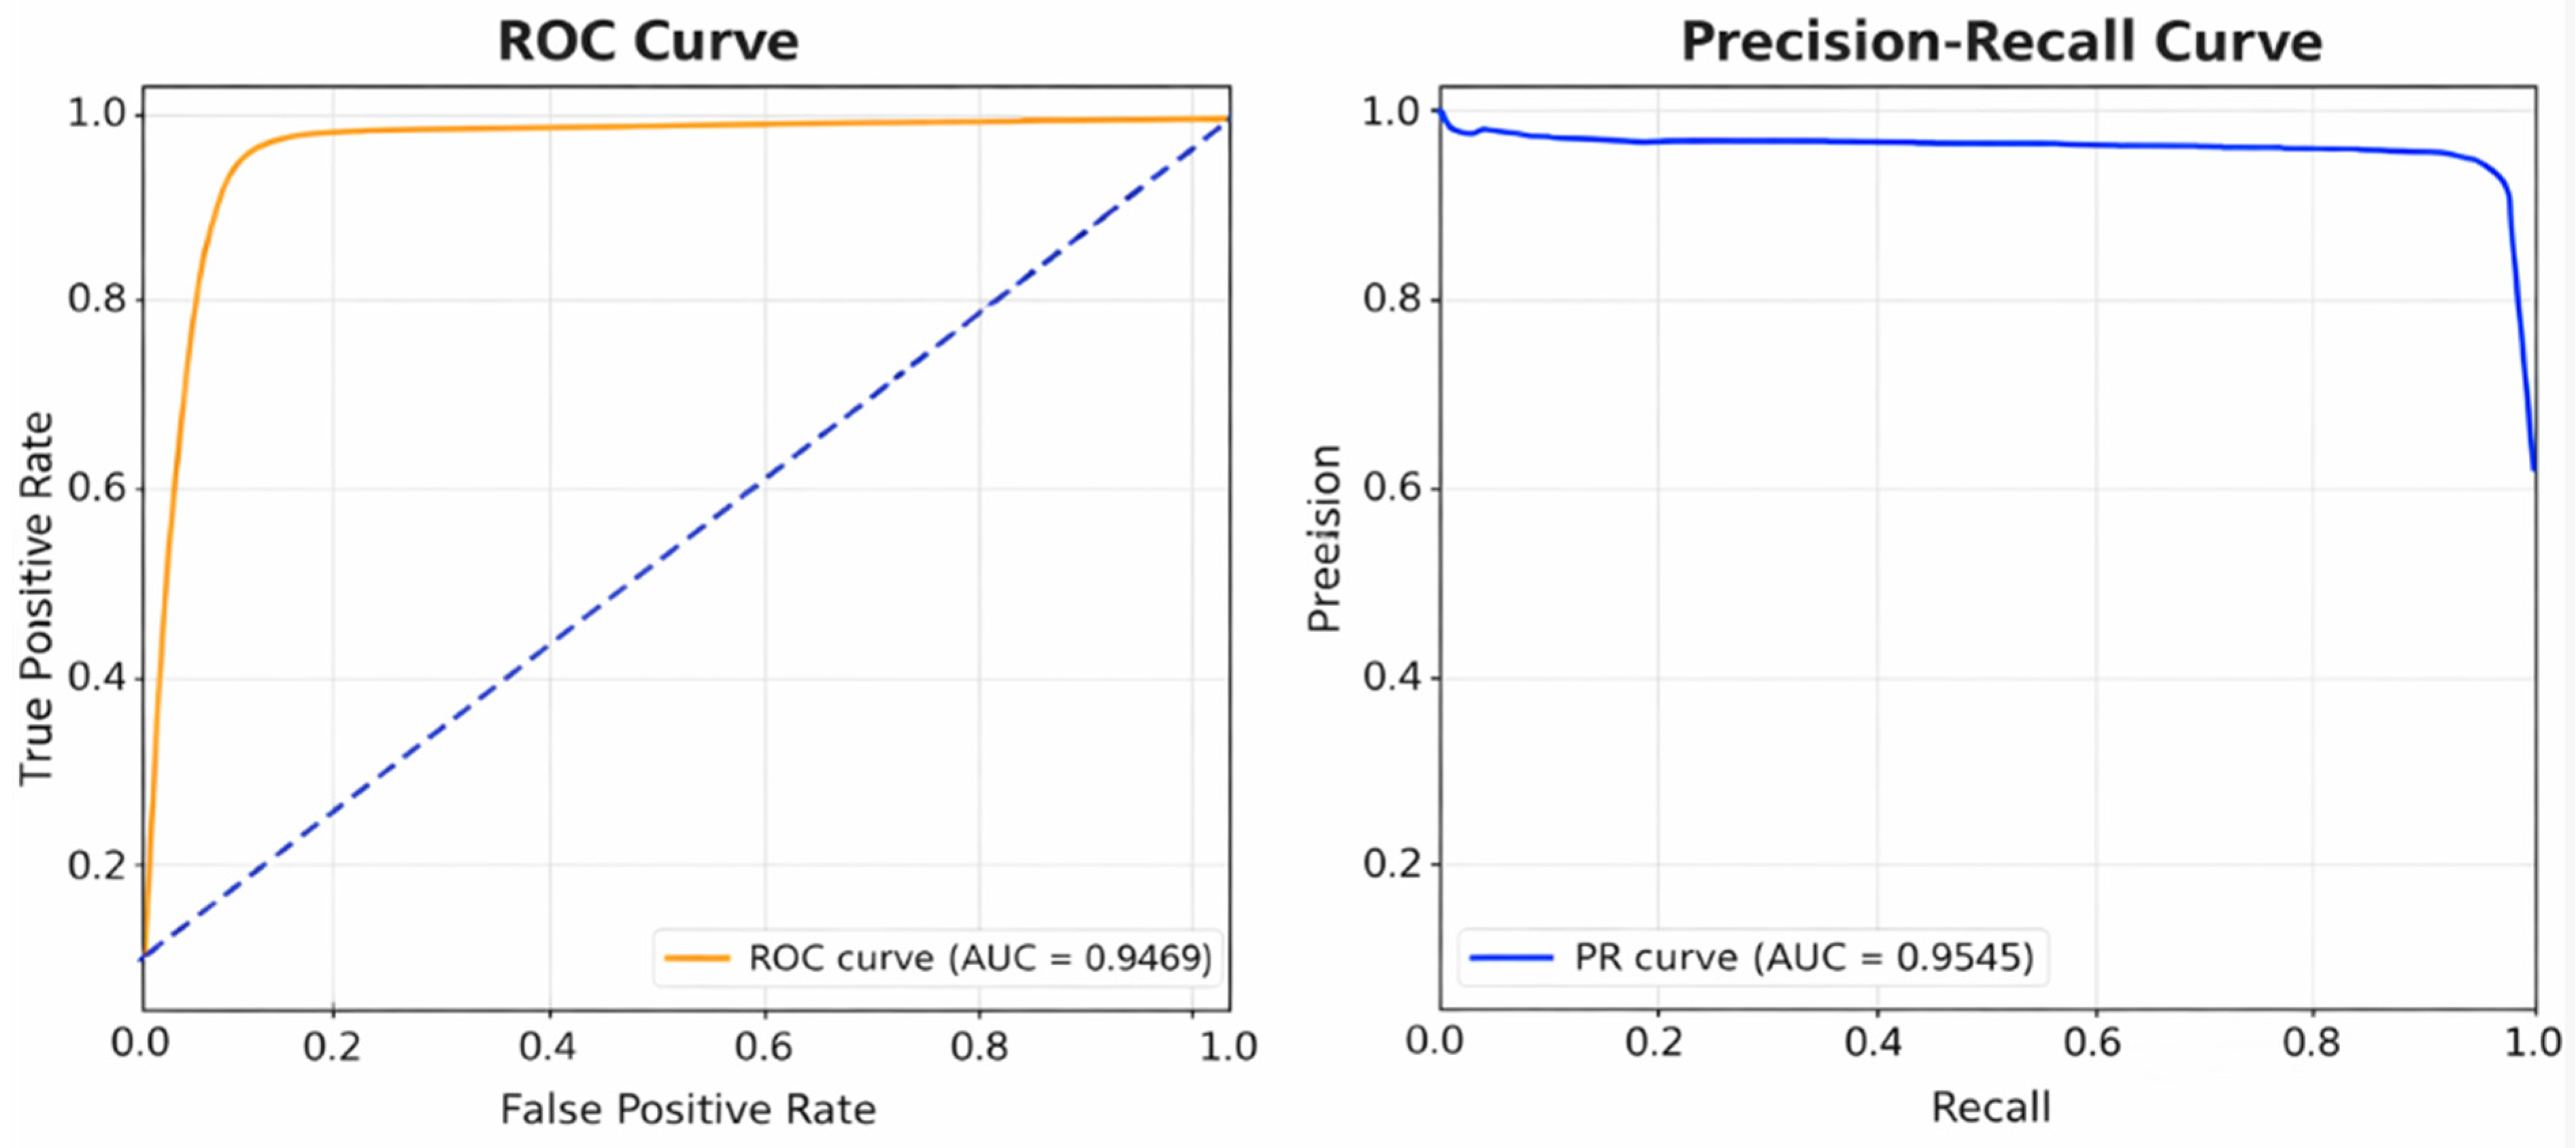
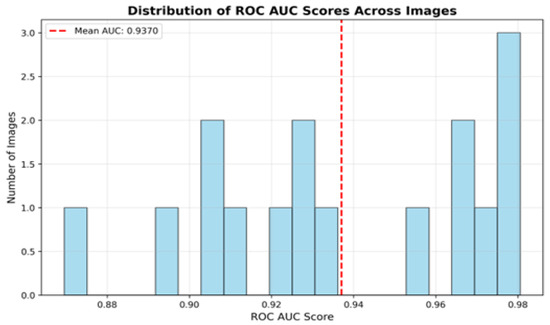
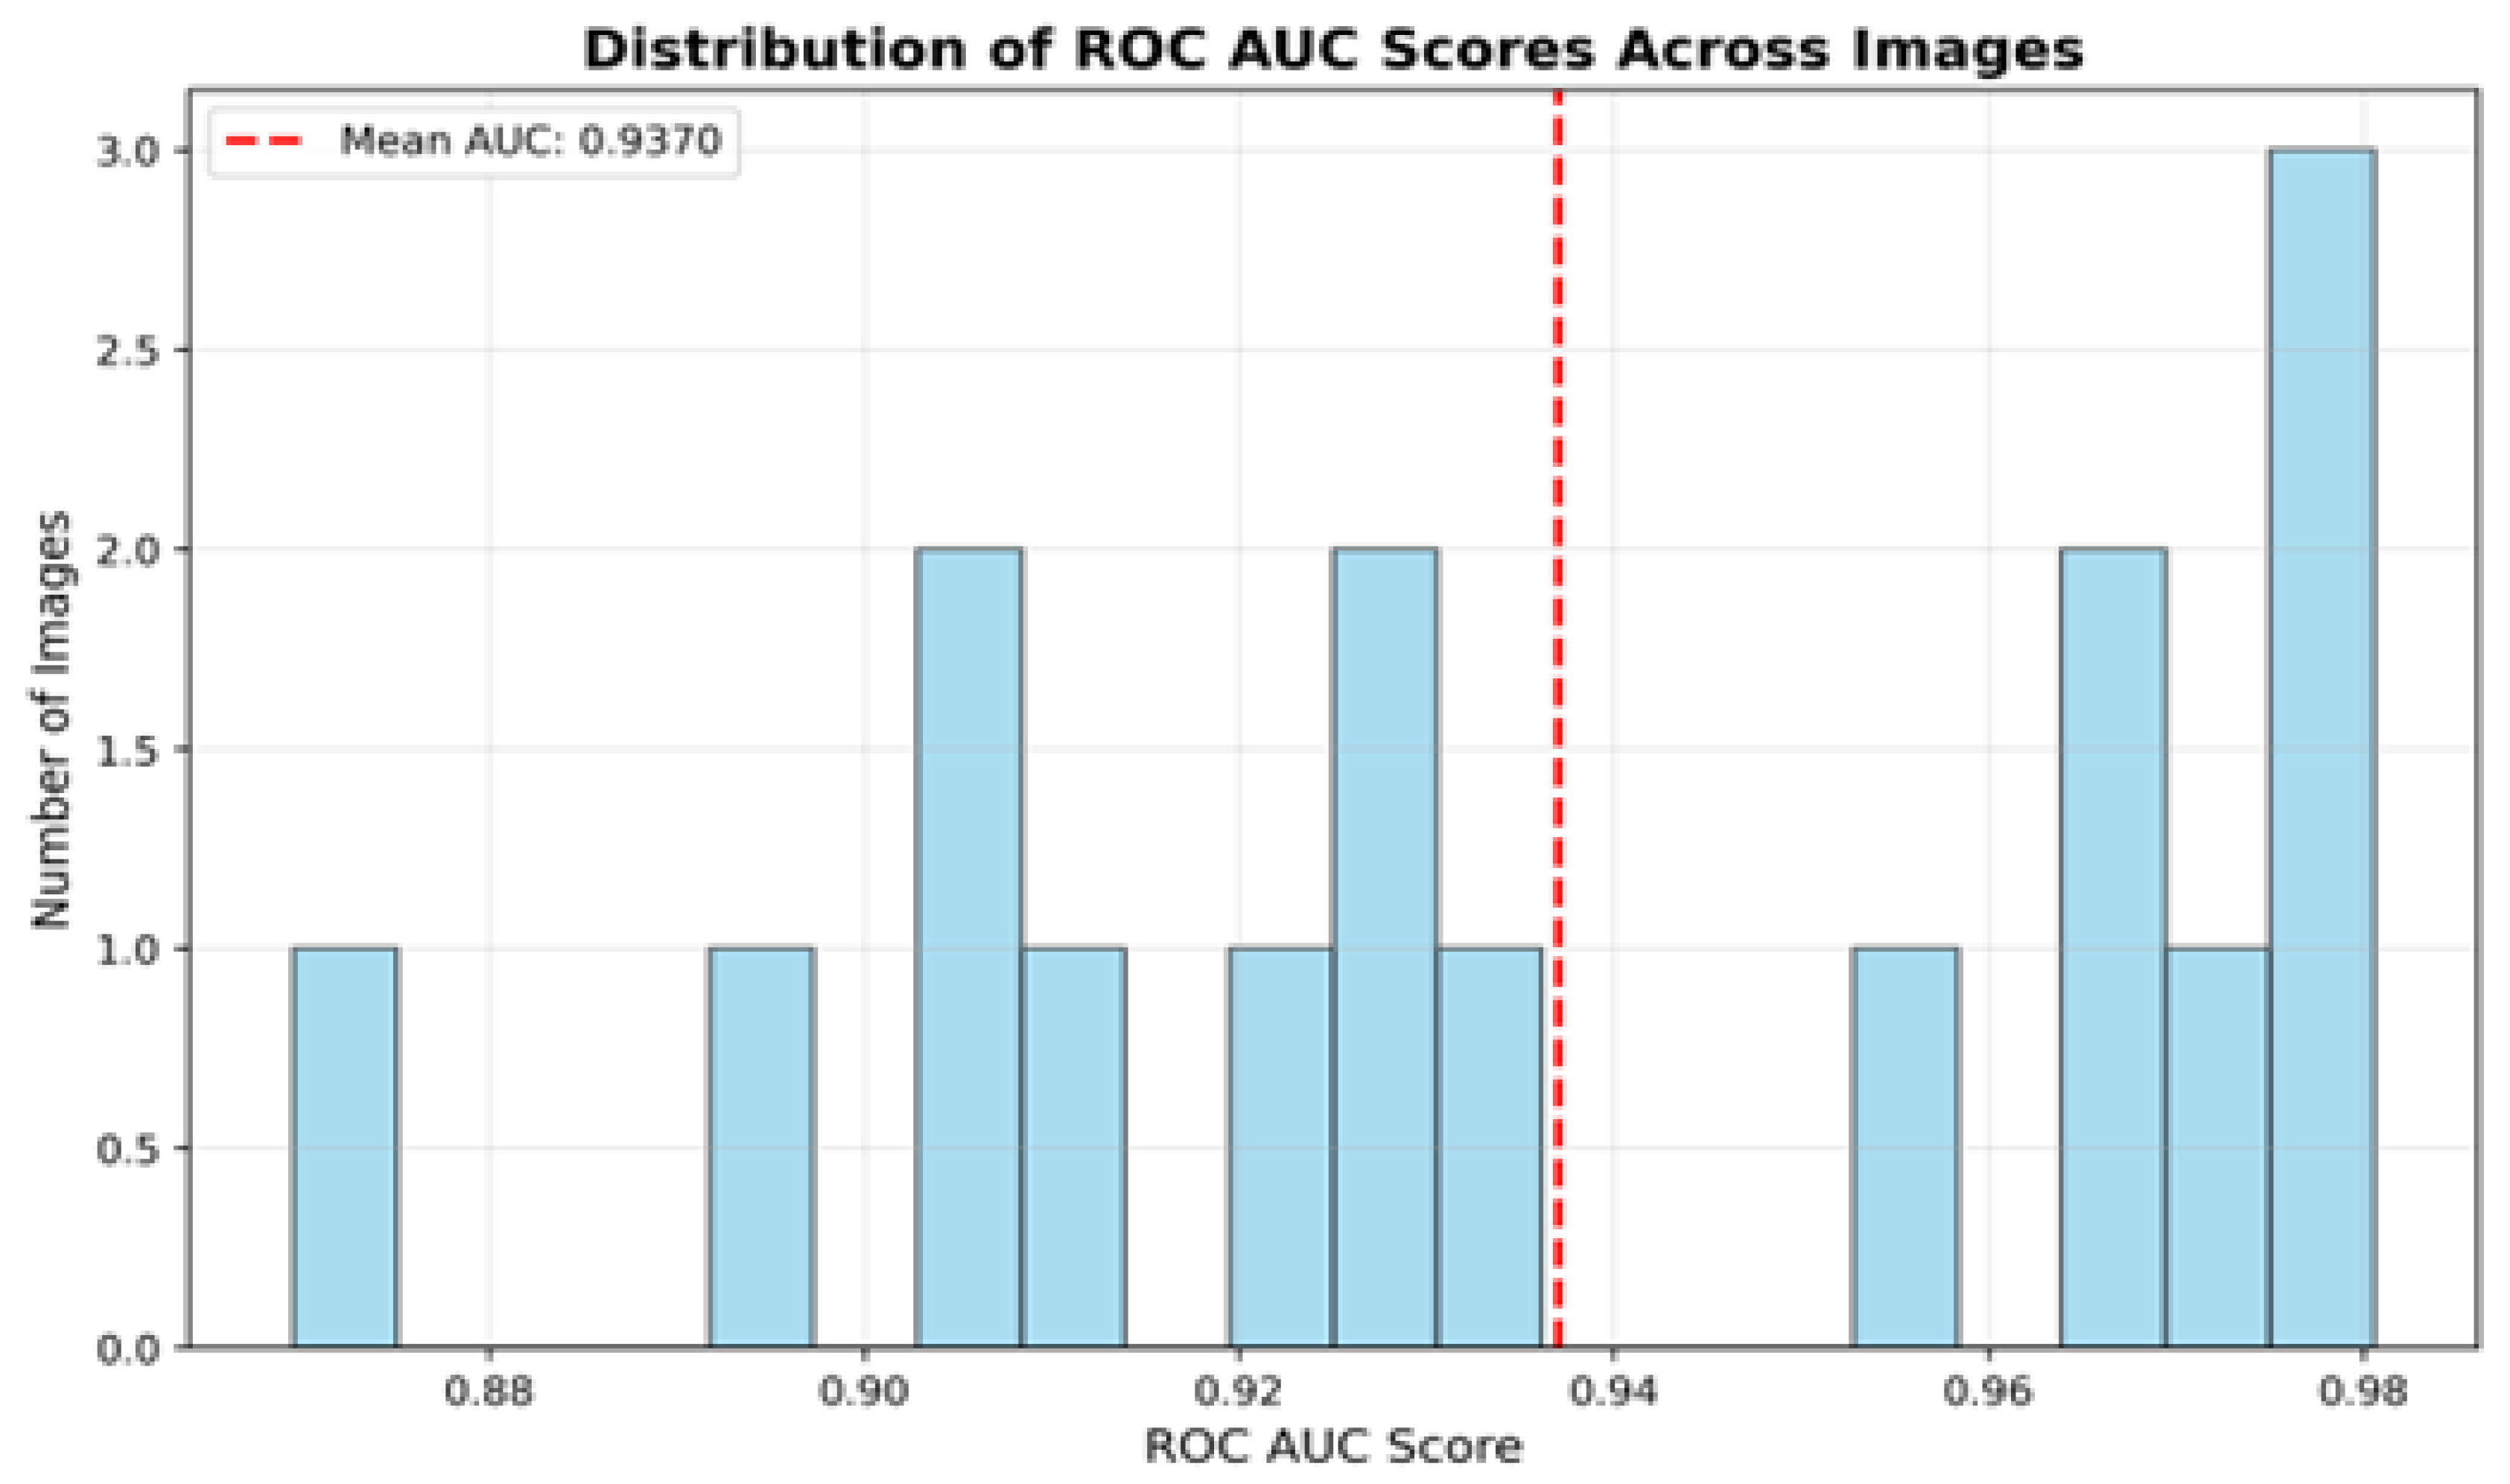
The YOLO Augmented model demonstrates strong and consistent classification performance, as evidenced by its ROC and Precision–Recall evaluation metrics. The model achieves an ROC AUC of 94.69%, indicating excellent class separability with a high true positive rate and low false positive rate across thresholds. Complementing this, the Precision–Recall AUC of 95.45% reflects a superior balance between precision and recall, which is particularly important for datasets with class imbalance. The mean AUC of 93.70% and a narrow AUC range of 88–95% further indicate stable and reliable performance across samples, with predictions tightly clustered in a high-performance region. Overall, the ROC and PR curves confirm that the augmented model provides robust, discriminative, and generalizable detection capability suitable for high-reliability applications. Table 5 summarizes the ROC AUC and Precision–Recall AUC results, highlighting the classification capability and robustness of the evaluated models across varying decision thresholds. Figure 5 shows the ROC curve, highlighting segmentation performance. Figure 6 illustrates the distribution of ROC values, showing the consistency and variability of the model’s performance.
Table 5.
ROC AUC and Precision–Recall AUC.
Figure 5.
ROC curve for the YOLO Augmented segmentation model, achieving an AUC of 94.69%. The solid orange curve represents the model’s performance, demonstrating strong class separability with a high true positive rate maintained across decision thresholds. The dashed diagonal line represents random chance performance (AUC = 0.5), providing a baseline reference. The model’s curve significantly outperforms this baseline, confirming robust discrimination between corroded and non-corroded regions in SEM imagery.
Figure 6.
Sample-level distribution of ROC-AUC values for the YOLO Augmented model (mean AUC = 93.70%, range 88–95%). The tight clustering in the high-performance region indicates consistent and stable detection capability across individual SEM images, with no significant outliers, confirming model reliability under varying corrosion morphologies and annealing conditions.
D. Grad-CAM Analysis
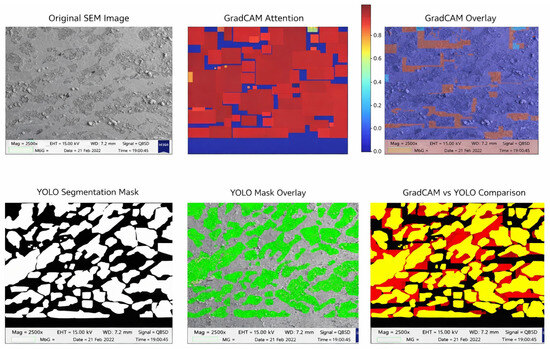
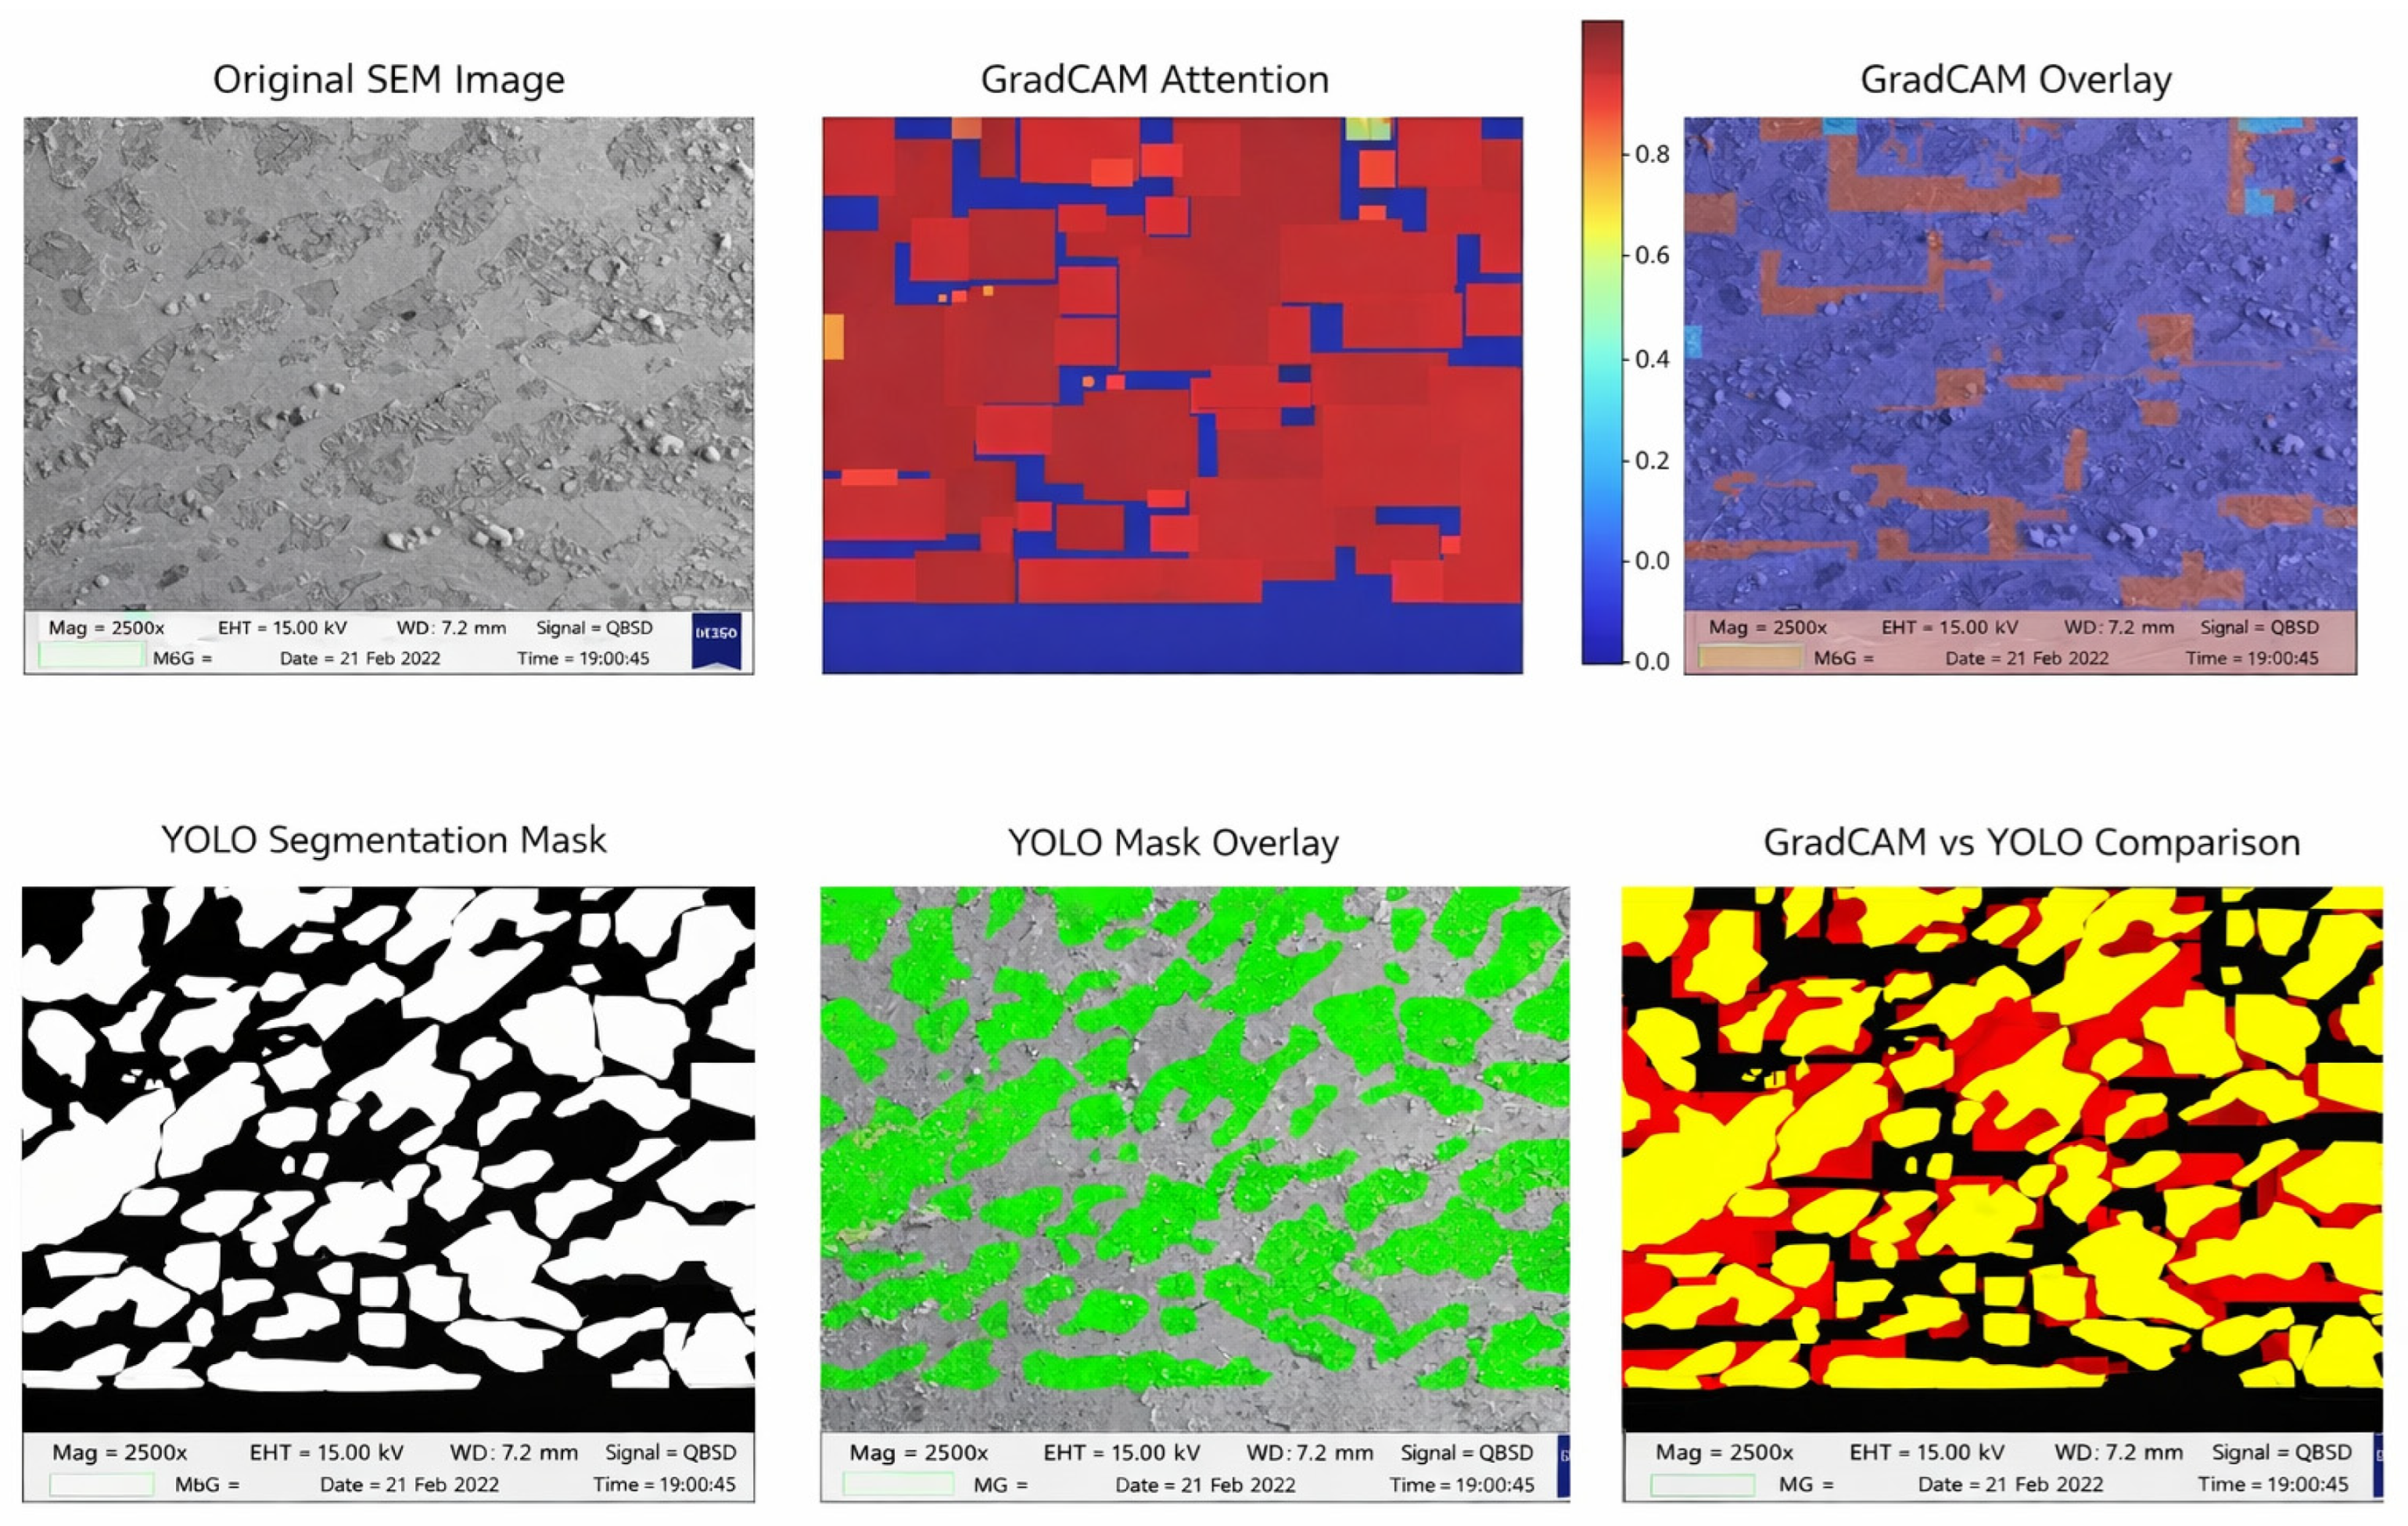
The YOLO Augmented model exhibits consistent and interpretable attention behavior in the Grad-CAM analysis, providing supportive insight into its segmentation performance. As summarized in Table 6, the model achieves a mean Grad-CAM IoU of 78.79%, with a best-case IoU of 91.47%, indicating substantial spatial overlap between activation regions and ground truth segmentation masks. Even in the lowest-performing cases, the Grad-CAM IoU remains at 67.24%, suggesting stable attention localization across samples. The observed +3.8% improvement in Grad-CAM IoU reflects the beneficial effect of data augmentation in encouraging the model to attend to corrosion-relevant regions rather than background structures. Visual overlays further illustrate that activation maps predominantly concentrate on object interiors and boundaries, offering qualitative evidence of focused feature utilization. Together, the quantitative Grad-CAM statistics (Table 6) and qualitative visualizations (Figure 7) provide complementary insight into the model’s attention behavior and help contextualize the segmentation performance without implying formal interpretability validation.
Table 6.
Grad-CAM performance.
Figure 7.
Grad-CAM activation maps overlaid on representative SEM images for the YOLO Augmented model across the three annealing conditions (AN_60, AN_90, AN_120). Warmer colors indicate higher model attention. Activations are predominantly concentrated on corrosion pit interiors and boundary regions rather than background grain structure, confirming morphology-driven feature learning. Mean Grad-CAM IoU = 78.79%; best-case IoU = 91.47%.
4.2. Classification Results
4.2.1. A. Model Results Comparison
The results demonstrate a clear performance advantage of the EfficientNet-B0 architecture over the ResNet-18 baseline. Using a two-phase fine-tuning strategy combined with temporal-based severity class definitions and grayscale preprocessing with data augmentation, EfficientNet-B0 achieves an accuracy of 93.75%, substantially outperforming the 79.60% accuracy obtained by ResNet-18 trained with standard preprocessing and training procedures. This improvement highlights the effectiveness of both the advanced training strategy and enhanced preprocessing in capturing discriminative features, while also showing that EfficientNet-B0 provides superior representational capacity and generalization compared to the baseline model. Table 7 compares the classification models, highlighting differences in accuracy and performance to identify the most effective architecture for corrosion severity classification.
Table 7.
Classification models comparison.
4.2.2. B. Confusion Matrix
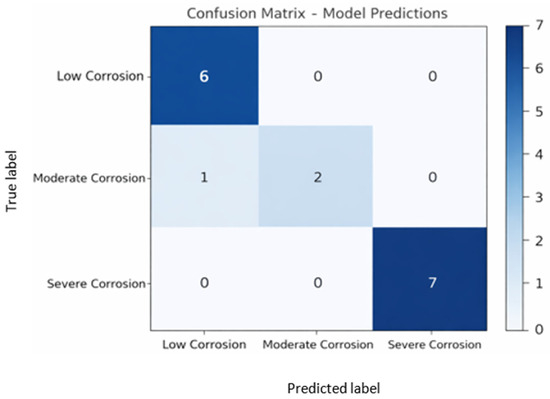
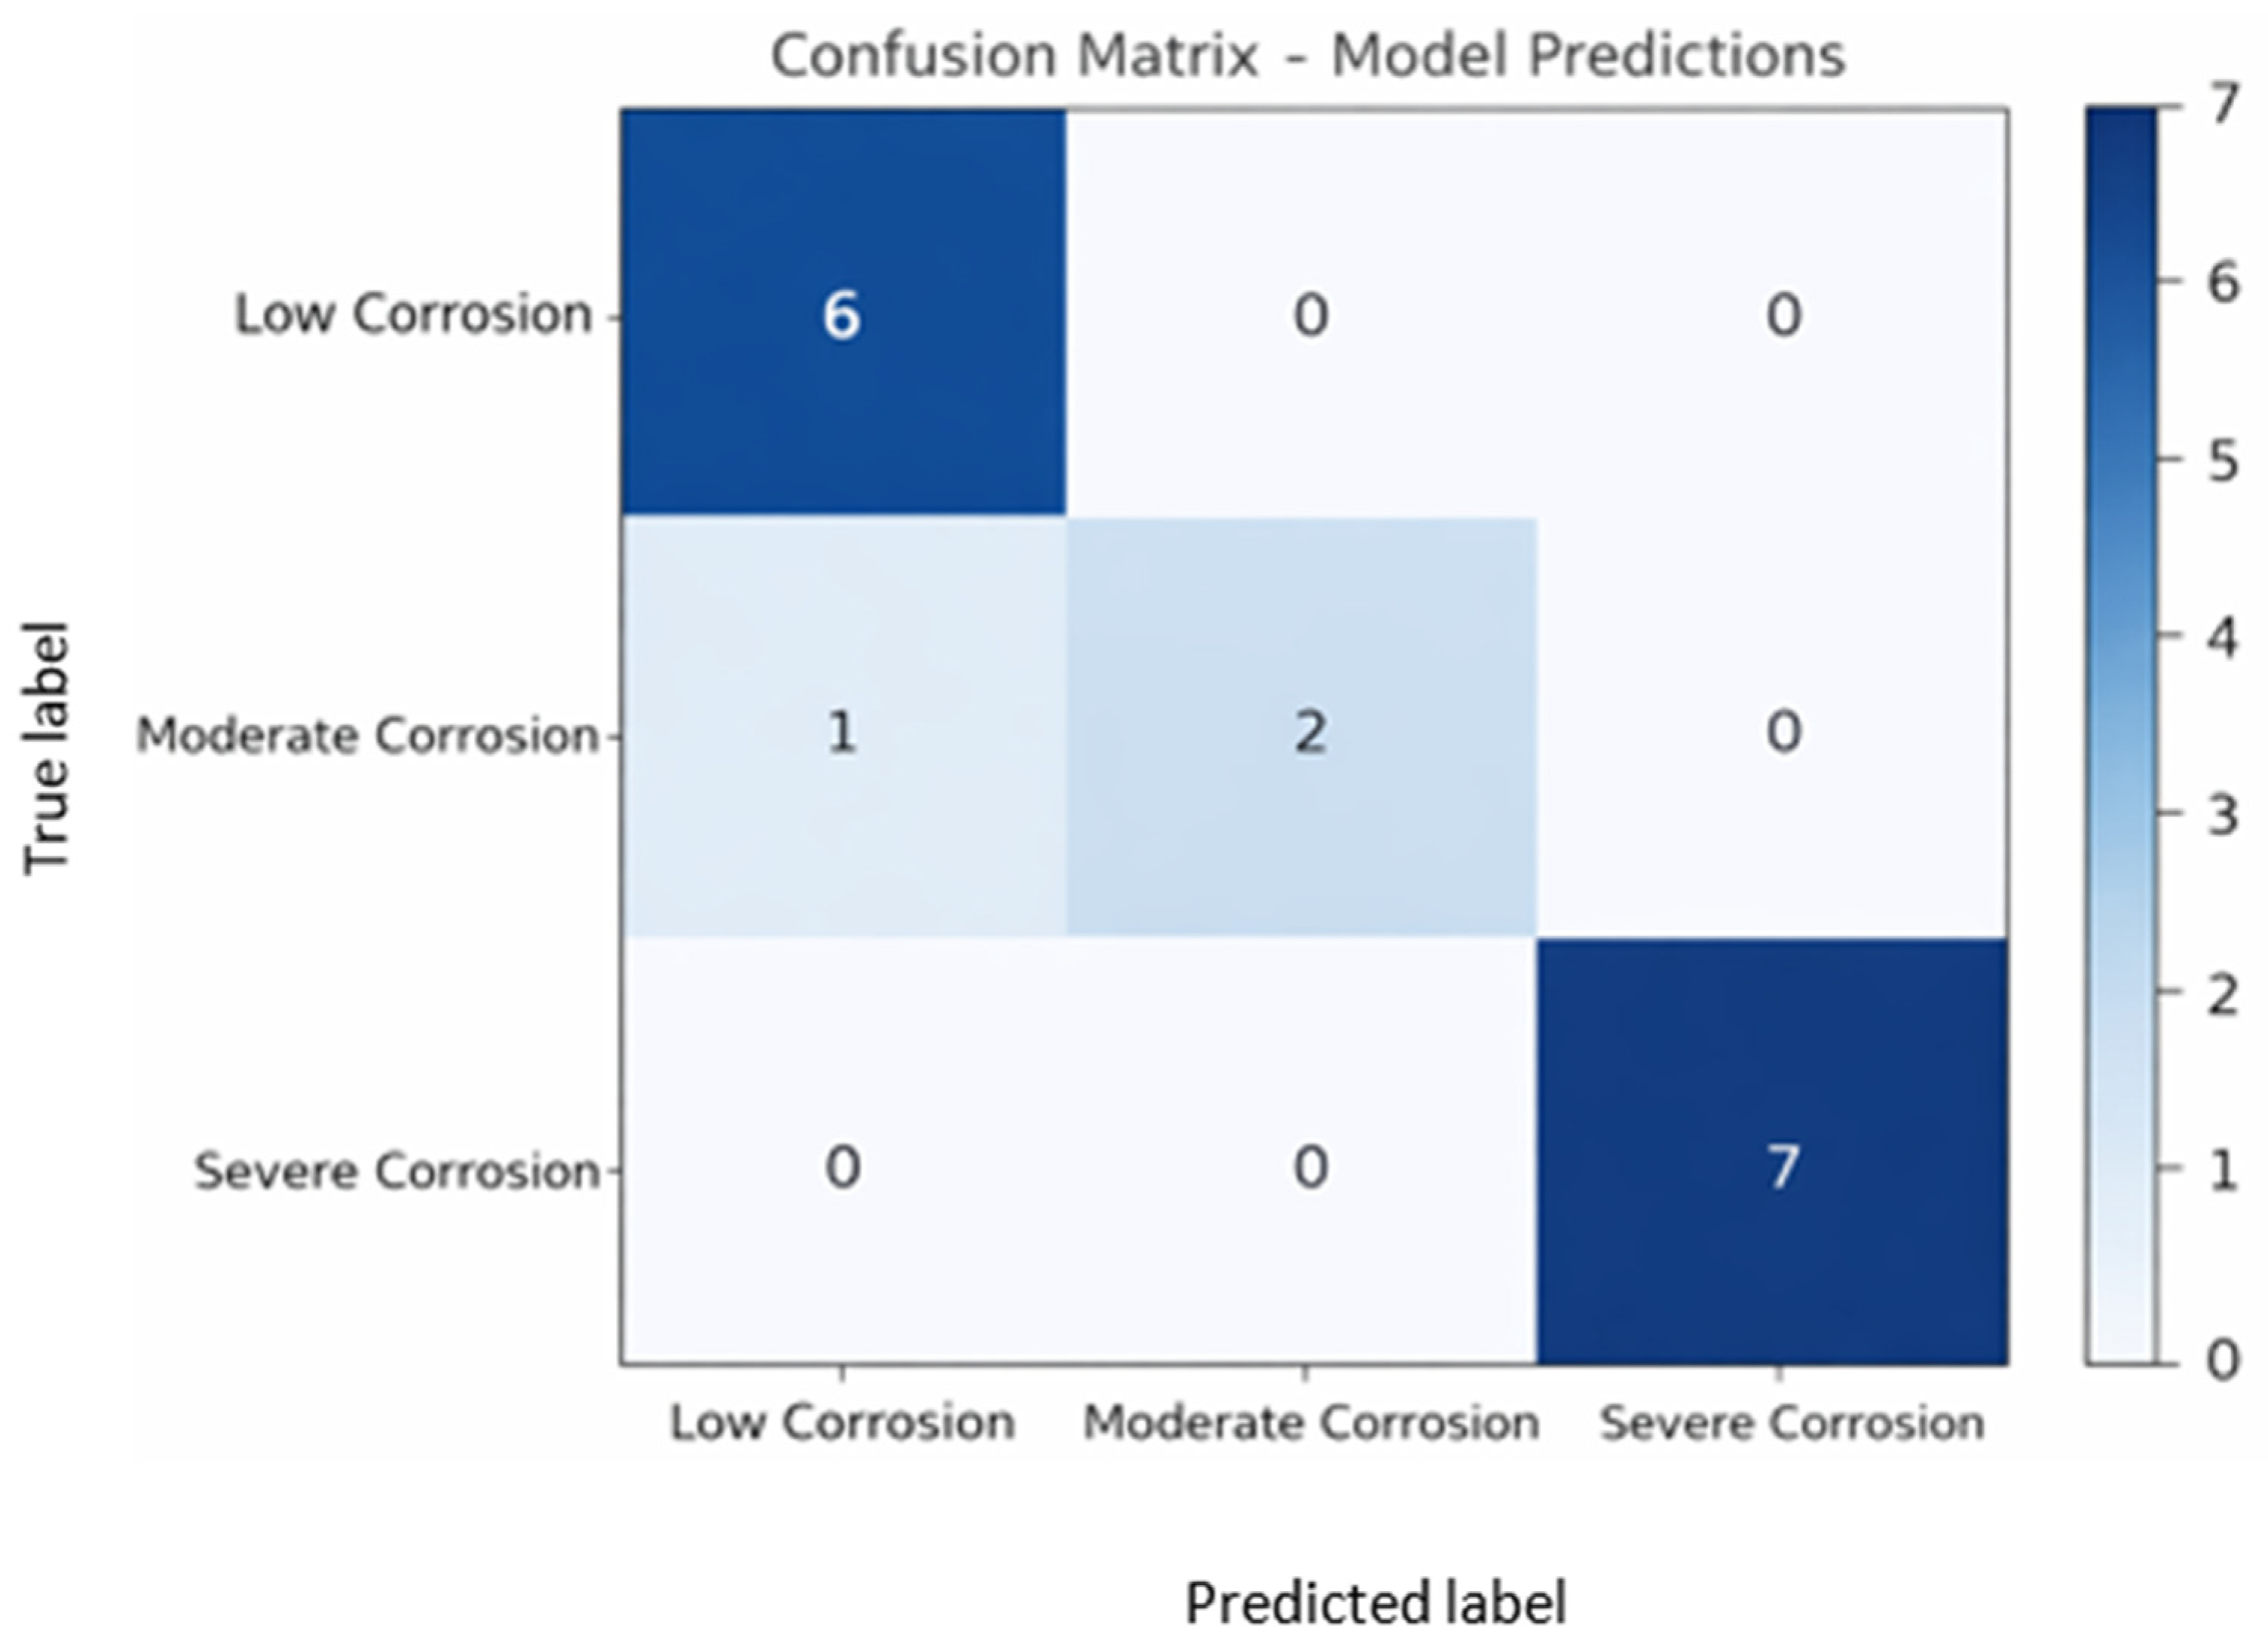
The confusion matrix summarizes the classification performance across three corrosion severity classes: low, moderate, and severe corrosion. The model shows excellent accuracy for low and severe corrosion, correctly classifying six out of six low corrosion images and seven out of seven severe corrosion images, indicating strong separability for these classes. Most misclassification occurs in the moderate corrosion category, where two images are correctly identified while one image is misclassified as low corrosion, suggesting partial overlap in visual features between low and moderate severity. Notably, there are no confusions involving the severe corrosion class, highlighting the model’s robustness in detecting critical cases. Overall, the confusion matrix indicates high classification reliability, with errors limited and primarily concentrated in adjacent severity levels, which is expected in progressive condition assessment tasks. The confusion matrix is constructed from a held-out test subset after stratified splitting across severity levels, resulting in 16 representative samples used exclusively for final evaluation to avoid data leakage given the limited dataset size. While the absolute number of test samples is small, this split was chosen to preserve class balance and ensure that all severity categories are evaluated under consistent conditions. Figure 8 shows the confusion matrix, illustrating the classification accuracy across corrosion severity classes and highlighting patterns of correct predictions and misclassifications.
Figure 8.
Confusion matrix for EfficientNet-B0 evaluated on the held-out test set (n = 16, stratified by severity class). Perfect classification is achieved for both low (6/6) and severe (7/7) corrosion classes. A single moderate severity image is misclassified as low corrosion, reflecting the inherent visual ambiguity between early-stage (1 h) and incipient (7-day) exposure. No severe-class confusions are observed, confirming reliable identification of critical degradation states.
5. Discussion
5.1. Dataset Design on Performance Analysis
While the total number of samples is relatively limited, the risk of overfitting was mitigated through extensive data augmentation, regularization strategies, and the use of pretrained network weights to improve generalization. In addition, controlled variations in annealing time and corrosion exposure duration were intentionally introduced to maximize morphological diversity within the available data, allowing the models to learn corrosion-relevant features across a broad severity spectrum. Although SEM imaging provides high-resolution and repeatable observations of corrosion mechanisms, we acknowledge that real-world corrosion may exhibit additional variability due to environmental, material, and operational factors. The SEM images in this study are intended to represent fundamental corrosion morphologies rather than all possible field conditions.
5.2. Overall Corrosion Segmentation Performance Analysis
The YOLO Augmented model is better than the automated baseline, which shows how important annotation quality is for instance segmentation tasks. The 9.24-point mIoU gain (80.67% → 89.91%) is due to more samples and better boundary labels. Manually annotated masks make sure that the model learns to tell the difference between pitting margins and oxide layers and background texture, which is something that rule-based NPY masks often do not do well. The almost perfect Mask mAP@50 of 98.6% shows that the detection is reliable even when strict IoU matching is used. This is especially important because SEM corrosion features have irregular and varied shapes. The automated model’s mAP@50–95 drop of 24.0% is much steeper than the augmented model’s drop of 82.1%. This shows that automated masks make coarser boundaries, which is fine for localization but not good enough for applications that need high accuracy. Figure 7 shows that Grad-CAM activation maps show that the augmented model’s attention is focused on the insides of corrosion and the edges of pits, not the structure of the background grain. This is clear evidence that better annotation leads to feature learning that is more semantically grounded.
5.3. Overall Classification Performance Analysis
There are two reasons why EfficientNet-B0 (93.75%) is 14.15 points more accurate than ResNet-18 (79.60%). First, EfficientNet-B0’s compound scaling, which changes the network’s depth, width, and input resolution at the same time, makes it perfect for SEM images, where corrosion severity shows up through subtle multiscale textural cues like pit density, oxide layer uniformity, and surface roughness gradients. ResNet-18, which has a fixed depth and no scaling for channel width, does not have the ability to capture these morphological signals at the same time. Second, the two-phase fine-tuning strategy lets the frozen backbone keep the low-level texture features it learned from ImageNet. The next step, end-to-end fine-tuning, adapts higher-level representations specifically to corrosion morphology, which is a change that was not made to the ResNet-18 baseline. Figure 8 shows the confusion matrix. It shows that the only misclassification happens between the low and moderate corrosion classes. This is both expected and physically meaningful because the transition from 1 h to 7-day exposure only causes incipient pitting, which makes the severity boundary unclear even to trained human annotators. The lack of severe-class confusion verifies that morphologically distinct, advanced corrosion states are consistently recognized—the paramount objective for industrial inspection processes.
5.4. Synergistic Effect of the Two-Stage Framework
This work addresses the identified gaps through a set of systematic technical innovations. In particular, a temporal–thermal correlation framework is introduced that integrates static corrosion severity classification with temporally ordered experimental conditions (1, 7, 14, and 21 days of exposure) and controlled thermal processing parameters (AN_60, AN_90, and AN_120 min of annealing). This formulation enables a structured analysis of processing–performance relationships in corrosion behavior, extending beyond existing approaches that primarily focus on compositional optimization without explicit consideration of thermal history or temporal progression [26]. The dual annotation strategy achieves flexibility between research accuracy (89.91% mIoU with manual annotation) and industrial scalability (80.67% mIoU with automated annotation), representing a 9.24% improvement over automated approaches while addressing practical deployment scalability challenges [10,20,30,31,32]. While alternative architectures such as U-Net are widely used for semantic segmentation, this study focuses on an inspection-oriented framework that integrates localization and segmentation in a unified pipeline. The objective is not to benchmark all possible architectures, but to demonstrate the feasibility of a two-stage segmentation–classification approach under controlled experimental conditions. Comparative evaluation with alternative architectures is considered an important direction for future work.
Integrated multi-modal architecture: YOLOv8-seg (640 × 640 input processing, 32 prototype-based mask generation) combined with EfficientNet-B0 classification provides unified spatial–temporal analysis within a single framework, advancing beyond environmental correlation approaches to systematic processing–performance analysis [12,31,33].
- A.
- PERFORMANCE COMPARISON WITH STATE-OF-THE-ART ARCHITECTURE
Table 8 provides a comparative evaluation of the proposed approach against representative existing methods, highlighting the advantages of the proposed approach in the context of SEM-based corrosion analysis and segmentation. The proposed framework demonstrates strong performance in temporal–thermal SEM analysis, achieving 89.91% mIoU for segmentation and 93.75% classification accuracy, while simultaneously addressing both spatial localization and temporally ordered experimental conditions. In comparison, existing studies primarily emphasize compositional optimization with high predictive accuracy but do not investigate the influence of thermal processing effects on corrosion behavior [26]. Similarly, YOLOv8-based industrial detection approaches report high accuracy and F1-scores but remain limited to static image analysis, without incorporating correlations with temporally ordered experimental conditions. High-precision SEM-based corrosion segmentation has also been demonstrated in prior work; however, temporally ordered experimental conditions are not considered in these approaches [20]. Likewise, YOLOv3- and YOLOv5-based metal surface segmentation methods improve spatial accuracy but do not incorporate annealing history or thermal correlation. Overall, this comparison demonstrates that the proposed method uniquely integrates segmentation accuracy, temporal progression awareness, and thermal relevance, positioning it favorably against existing state-of-the-art approaches.
Table 8.
Comparative analysis with existing methods.
- B.
- QUANTITATIVE TECHNICAL ADVANTAGES
Superior segmentation performance: 89.91% mIoU with manual annotation demonstrates significant improvement over the automated baseline (80.67%), with 94.69% ROC-AUC showing exceptional discriminative capability for corrosion region identification in SEM imagery [10,17].
Enhanced classification accuracy: 93.75% accuracy with EfficientNet-B0 represents a 12.5% improvement over the ResNet18 baseline, with temporal-based severity assessment (1 hr→7 days→14–21 days) enabling degradation progression analysis unavailable in existing approaches.
Industrial deployment capability: YOLOv8-seg architecture supports real-time 640 × 640 input processing with prototype-based mask generation, enabling practical industrial implementation through a dual annotation strategy balancing accuracy and scalability requirements [10,30,32].
Systematic processing–performance correlation: Controlled experimental design with systematic variation in temporally ordered experimental conditions (four exposure durations) and thermal (three annealing conditions) parameters enables quantitative annealing–corrosion relationship assessment, extending data-driven optimization approaches from compositional to thermal processing analysis.
The following methodology section details the implementation of this comprehensive temporal–thermal correlation framework, demonstrating measurable performance advances through systematic integration of material processing parameters with temporally ordered experimental conditions modeling for automated SEM-based corrosion assessment.
6. Limitations
While the proposed framework demonstrates promising results, its generalizability is inherently constrained by several factors. The primary limitation relates to the dataset size and scope: the study is based on a relatively small dataset of 117 SEM images, focuses on a single material system (Mn-based steel), and relies on SEM data acquired from a single instrumentation setup. These constraints may limit the direct transferability of the trained models to other materials, corrosion mechanisms, or imaging conditions encountered in broader industrial or field environments. Although key experimental parameters and imaging conditions are provided, further standardization across multiple materials, environments, and imaging systems is required for full reproducibility in broader industrial contexts. Therefore, this study is positioned as a proof of concept, and the results should be interpreted within this scope rather than as a fully generalized solution.
A second limitation is that the study adopts a single-scale SEM imaging protocol. This choice was made deliberately to ensure consistency across samples and to isolate the effects of controlled annealing time and corrosion exposure on surface morphology. However, the absence of multiscale imaging may restrict the framework’s ability to capture hierarchical corrosion features that manifest at different spatial resolutions.
A third limitation concerns the use of established corrosion classification and damage assessment standards. Although such standards define well-accepted parameters for evaluating corrosion mechanisms and progression, the present work only implicitly captures several of these parameters, such as surface degradation patterns, localized attack morphology, and relative severity levels, through SEM-based segmentation and severity classification. The explicit mapping between standard-defined criteria and model outputs has not been formally established in the current manuscript.
A fourth limitation of the current study is that it does not include an explicit ablation analysis on model size, memory footprint, or deployment on edge devices. The primary focus of this work is on validating the feasibility and effectiveness of the proposed segmentation–classification framework for corrosion assessment, rather than on hardware-level optimization.
A fifth limitation of the current study is that it does not include a comparative evaluation of alternative segmentation architectures (e.g., U-Net) or regression-based severity modeling. These aspects are identified as important directions for future work.
Finally, the evaluation protocol introduces an additional limitation. The confusion matrix is constructed from a held-out test subset obtained through stratified splitting across severity levels, resulting in 16 representative samples used exclusively for final evaluation to avoid data leakage. While this approach preserves class balance and ensures that all severity categories are assessed under consistent conditions, the small number of test samples limits the statistical robustness of class-wise performance analysis.
7. Future Work
Future research will focus on extending the proposed framework along several complementary directions to improve generalizability and practical applicability. First, the dataset will be expanded to include multiple material systems with different alloy compositions and corrosion susceptibilities, enabling the model to learn material-dependent corrosion patterns and reducing bias toward a single substrate. Furthermore, cross-laboratory and cross-instrument SEM validation will be conducted by incorporating data acquired using different SEM platforms, imaging settings, and operators, to assess robustness against instrument-specific variability. Finally, progression-aware modeling approaches, such as sequence-based learning or stage-aware supervision, will be investigated to capture the temporal evolution of corrosion beyond static severity classification. Together, these directions aim to enhance the scalability and real-world applicability of the proposed framework.
8. Conclusions
The proposed two-stage deep learning framework effectively addresses the challenges of corrosion detection and severity estimation on metallic surfaces, leveraging high-resolution SEM images. The integration of YOLOv8-seg for instance-level segmentation and EfficientNet-B0/ResNet18 for severity classification enabled precise identification of corrosion regions while ensuring accurate severity assessment. The use of both manually annotated and automatically generated masks strengthened the robustness of segmentation, yielding an mIoU of 89.91, a mask mAP@50 of 98.6, and an ROC-AUC of 94.69. For severity classification, EfficientNet-B0 achieved superior performance, with an accuracy of 93.75% and an F1-score of 93.29, outperforming ResNet18. These outcomes demonstrate that computationally efficient yet high-performing models can be effectively combined to deliver reliable and scalable automated corrosion analysis.
Author Contributions
Conceptualization was done by S.A., S.M. and S.N.; methodology was done by T.K., C.S., H.S., O.U.E.A., A.B., U.K., P.K.M. and S.N.; validation was done by S.A., S.M. and Y.-K.L.; formal analysis was done by S.A., S.M. and Y.-K.L.; writing—original draft was done by T.K., C.S., H.S., O.U.E.A., A.B., U.K., P.K.M. and S.N.; writing—original draft preparation, S.A. and S.M.; writing—review and editing, S.A. and S.M.; supervision, Y.-K.L.; project administration, Y.-K.L.; funding acquisition, Y.-K.L. All authors have read and agreed to the published version of the manuscript.
Funding
The authors appreciate the support provided by the Ministry of Education and Busan Metropolitan City on the project “Busan Regional Innovation and Education (RISE)”.
Data Availability Statement
The code and dataset used in this study are not publicly available due to data ownership and ongoing related research. However, all methodological details, training configurations, and evaluation protocols have been fully described in the manuscript to ensure transparency and reproducibility.
Conflicts of Interest
Author Satyabrata Aich was employed by the company Wellmatix Limited. The remaining authors declare that the research was conducted in the absence of any commercial or financial relationships that could be construed as a potential conflict of interest.
References
- Corrosion Resistance Explained. Available online: https://www.makerverse.com/resources/insights-and-trends/corrosion-resistance-explained/ (accessed on 11 April 2025).
- Forkan, A.R.M.; Kang, Y.-B.; Jayaraman, P.P.; Liao, K.; Kaul, R.; Morgan, G.; Ranjan, R.; Sinha, S. CorrDetector: A framework for structural corrosion detection from drone images using ensemble deep learning. Expert Syst. Appl. 2022, 193, 116461. [Google Scholar] [CrossRef] [Scilit]
- Mohapatra, S.; Satpathy, B.; Sarkar, A.; Kumar, S.; Aich, S. Recent advances in medium—Manganese steel: A review of key findings, challenges, and future perspectives. J. Mater. Sci. 2025, 60, 9447–9528. [Google Scholar] [CrossRef] [Scilit]
- Bender, R.; Féron, D.; Mills, D.; Ritter, S.; Bäßler, R.; Bettge, D.; De Graeve, I.; Dugstad, A.; Grassini, S.; Hack, T.; et al. Corrosion challenges towards a sustainable society. Mater. Corros. 2022, 73, 1730–1751. [Google Scholar] [CrossRef] [Scilit]
- Oyedeji, O.A.; Khan, S.; Erkoyuncu, J.A. Application of CNN for multiple phase corrosion identification and region detection. Appl. Soft Comput. 2024, 164, 112008. [Google Scholar] [CrossRef] [Scilit]
- Mohapatra, S.; Palai, D.; Satpathy, B.; Das, S.; Das, K. Electrochemical study of intercritically annealed Fe-0.18C-7Mn-4Al steel. Mater. Today Commun. 2023, 34, 105282. [Google Scholar] [CrossRef] [Scilit]
- Turnbull, A. Corrosion pitting and environmentally assisted small crack growth. Proc. R. Soc. A Math. Phys. Eng. Sci. 2014, 470, 20140254. [Google Scholar] [CrossRef] [Scilit] [PubMed]
- Li, Y.; Li, H.; Guan, Y.; Zhang, X. Dense metal corrosion depth estimation. Front. Phys. 2023, 11, 1–14. [Google Scholar] [CrossRef] [Scilit]
- Rajendran, M.; Subbian, D. Deep learning in corrosion assessment and control: A critical review of techniques and challenges. Corros. Rev. 2025, 44, 1–20. [Google Scholar] [CrossRef] [Scilit]
- Burton, B.; Nash, W.T.; Birbilis, N. RustSEG: Automated segmentation of corrosion using deep learning. arXiv 2022, arXiv:2205.05426. [Google Scholar]
- Shirsath, K.; Parjane, V.A.; Meherkhamb, A.; Ratnaparkhi, S.; Kanade, S. Review paper of deep learning for automated corrosion detection. Int. Res. J. Mod. Eng. Technol. Sci. (IRJMETS) 2022, 4, 955–958. Available online: https://www.irjmets.com/uploadedfiles/paper/issue_2_february_2022/19144/final/fin_irjmets1645179305.pdf (accessed on 15 February 2026).
- Farooqui, M.; Rahman, A.; Alsuliman, L.; Alsaif, Z.; Albaik, F.; Alshammari, C.; Sharaf, R.; Olatunji, S.; Althubaiti, S.W.; Gull, H. A Deep Learning Approach to Industrial Corrosion Detection. Comput. Mater. Contin. 2024, 81, 2587–2605. [Google Scholar] [CrossRef] [Scilit]
- You, A.; Be, M.; In, I. Estimation of rebar corrosion level using magnetic sensor array with convolutional neural network. AIP Adv. 2025, 15, 035106. [Google Scholar] [CrossRef] [Scilit]
- Casas, E.; Ramos, L.; Romero, C.; Rivas-Echeverría, F. A comparative study of YOLOv5 and YOLOv8 for corrosion segmentation tasks in metal surfaces. Array 2024, 22, 100351. [Google Scholar] [CrossRef] [Scilit]
- Xia, D.-H.; Song, S.; Tao, L.; Qin, Z.; Wu, Z.; Gao, Z.; Wang, J.; Hu, W.; Behnamian, Y.; Luo, J.-L. Review-material degradation assessed by digital image processing: Fundamentals, progresses, and challenges. J. Mater. Sci. Technol. 2020, 53, 146–162. [Google Scholar] [CrossRef] [Scilit]
- Nash, W.; Zheng, L.; Birbilis, N. Deep learning corrosion detection with confidence. npj Mater. Degrad. 2022, 6, 26. [Google Scholar] [CrossRef] [Scilit]
- Tan, L.; Chen, X.; Yuan, D.; Tang, T. DSNet: A Computer Vision-Based Detection and Corrosion Segmentation Network for Corroded Bolt Detection in Tunnel. Struct. Control Health Monit. 2024, 2024, 1898088. [Google Scholar] [CrossRef] [Scilit]
- Katsamenis, I.; Protopapadakis, E.; Doulamis, A.; Doulamis, N.; Voulodimos, A. Pixel-Level Corrosion Detection on Metal Constructions by Fusion of Deep Learning Semantic and Contour Segmentation. In Advances in Visual Computing, Proceedings of the 15th International Symposium, ISVC 2020, San Diego, CA, USA, 5–7 October 2020; Springer Nature: Berlin/Heidelberg, Germany, 2020; pp. 160–169. [Google Scholar]
- Nash, W.T.; Powell, C.J.; Drummond, T.; Birbilis, N. Automated Corrosion Detection Using Crowdsourced Training for Deep Learning. Corrosion 2019, 76, 135–141. [Google Scholar] [CrossRef] [Scilit]
- Zhao, L.; Locke, J.; Xu, F.; Yao, T.; Guo, X. Accurate segmentation of localized corrosion in structural alloys via deep learning. npj Mater. Degrad. 2025, 9, 1–10. [Google Scholar] [CrossRef] [Scilit]
- Zhao, Z.; Bakar, E.; Razak, N.; Akhtar, M.N. Assessment of Corrosion Image Rating Based on Transfer Learning. Arab. J. Sci. Eng. 2024, 50, 11803–11820. [Google Scholar] [CrossRef] [Scilit]
- Zhao, Z.; Bakar, E.B.A.; Razak, N.B.A.; Akhtar, M.N. Corrosion image classification method based on EfficientNetV2. Heliyon 2024, 10, e36754. [Google Scholar] [CrossRef] [Scilit]
- Li, X.; Liu, C.; Zhou, D.; Yu, L.; Lu, X. A unified deep learning model for thermoacoustic instability detection in swirl premixed flames based on spatial-temporal features. Aerospace Sci. Technol. 2025, 159, 109994. [Google Scholar] [CrossRef] [Scilit]
- Abdulmutaali, A.; Aldrich, C.; Lepkova, K. Unsupervised process monitoring of corrosion based on electrochemical noise and multivariate image analysis. npj Mater. Degrad. 2025, 9, 43. [Google Scholar] [CrossRef] [Scilit]
- Cantero-Chinchilla, S.; Simpson, C.A.; Ballisat, A.; Croxford, A.J.; Wilcox, P.D. Convolutional neural networks for ultrasound corrosion profile time series regression. NDT E Int. 2023, 133, 102756. [Google Scholar] [CrossRef] [Scilit]
- Yang, L.; Yang, X.; Wang, B.; Wang, Z.; Cheng, X.; Li, X. Corrosion resistance optimization of Sn-additional low-alloy high strength steel by data-driven identification and field exposure verification. J. Mater. Res. Technol. 2023, 25, 3624–3641. [Google Scholar] [CrossRef] [Scilit]
- Shao, Y.; Li, L.; Li, J.; Yao, X.; Li, Q.; Hao, H. Advancing crack detection with generative AI for structural health monitoring. Structural Health Monitoring. Struct. Health Monit. 2025, 14759217251369000. [Google Scholar] [CrossRef] [Scilit]
- Wang, R.; Shao, Y.; Li, Q.; Li, L.; Li, J.; Hao, H. A novel transformer-based semantic segmentation framework for structural condition assessment. Struct. Health Monit. 2024, 23, 1170–1183. [Google Scholar] [CrossRef] [Scilit]
- Kingma, D.P.; Ba, J. Adam: A method for stochastic optimization. In Proceedings of the International Conference on Learning Representations (ICLR), San Diego, CA, USA, 7–9 May 2015. [Google Scholar]
- Lee, H.; Shin, H.H.; Maeng, S.; Kim, D.G.; Moon, H. Efficient Semi-automatic Annotation System based on Deep Learning. IEMEK J. Embed. Syst. Appl. 2023, 18, 267–275. [Google Scholar]
- Song, G.; Fu, D.; Chang, W.; Fu, Z.; Ma, L.; Zhang, D. Corrosion resistant performance prediction in high-entropy alloys: A framework for model, interpretation and multi-dimensional visualization. Corros. Sci. 2025, 255, 113105. [Google Scholar] [CrossRef] [Scilit]
- Alviz-Meza, A.; Hadechini-Meza, L.L.; Peña-Ballesteros, D.Y. Deep neural networks for external corrosion classification in industrial above-ground storage tanks. Heliyon 2024, 10, e34882. [Google Scholar] [CrossRef] [Scilit] [PubMed]
- Wang, J.; Sun, H.; Xiong, W.; Han, G.; Wu, D. Recognition of steel bridge corrosion considering the effect of training dataset quality. Case Stud. Constr. Mater. 2024, 21, e03722. [Google Scholar] [CrossRef] [Scilit]

Disclaimer/Publisher’s Note: The statements, opinions and data contained in all publications are solely those of the individual author(s) and contributor(s) and not of MDPI and/or the editor(s). MDPI and/or the editor(s) disclaim responsibility for any injury to people or property resulting from any ideas, methods, instructions or products referred to in the content. |
© 2026 by the authors. Licensee MDPI, Basel, Switzerland. This article is an open access article distributed under the terms and conditions of the Creative Commons Attribution (CC BY) license.