


Abstract
Routing compensation can preserve a message after one node fails while leaving delivery vulnerable to joint failures. We analyze matched, identity-closed UDP message outcomes in seven-day vehicular network scenarios from Hohhot. Six message fates distinguish exposure, realized compensation, and residual service effects. The systematic component was more stable across seeds than net damage. Recovery of 6470 successful replacement paths identifies protocol-realized provider dependency. Among 336 evaluated pairs, dependency burden was positively associated with exposure-conditioned irreducible pair loss J2 (Spearman 0.516; Kendall 0.445); the fixed matched-control group-mean contrast had a date-cluster bootstrap median of 0.0066 and a 95% percentile interval [0.0024, 0.0116]. A separate triple-world analysis found residual losses beyond constituent pair-world service-loss sets: 61 of 64 evaluated triples met the stable-positive J3 criterion. Of 1315 formal J2 message instances, 1081 had identifiable constituent paths; mechanism proportions apply only to that subset. At 100–200 m, compensation and the pooled dependency–J2 association persisted, but magnitudes and date-level consistency changed materially. The conclusions are partially range-sensitive, sample-conditional, and non-causal.
1. Introduction
Vehicular communication services depend on messages reaching their destinations within application timing requirements. Vehicle mobility changes the available relays and links, while the protocol determines which of those opportunities produces a successful delivery. Surveys of vehicular networking describe the resulting differences between application requirements and communication mechanisms [1,2]. Hartenstein and Laberteaux survey VANET applications and communication challenges [3]. Network-resilience frameworks likewise evaluate whether service can be maintained under faults and disruptions [4]. Connectivity reliability is a related but distinct endpoint: Cao et al. evaluate it under node mobility and multiple failure modes, including hardware/software, energy and isolation failures [5]. Here, the endpoint is the outcome of an identified application message after a specified node removal.
Routing and relay selection can preserve communication when a link or relay becomes unsuitable. Nzouonta et al. combine road-based route representations with geographic forwarding [6], while Al-Kharasani et al. incorporate mobility and path quality into OLSR-based relay selection [7]. Bi et al. investigate multi-hop dissemination of emergency messages in urban VANETs [8]. In software-defined vehicular networks, Wijesekara and Gunawardena combine predicted link lifetime and delay with contention-aware route selection [9]. These approaches address how alternative transmission opportunities can support delivery. Successful compensation raises a further question: which nodes does that delivery now depend on, and what happens if those nodes are removed together?
Aggregate delivery rates alone cannot show whether the same messages survive different removal actions. Two actions can preserve similar delivery rates while losing different messages. Real-time cooperative routing and scheduling in software-defined vehicular networks addresses data delivery under delay and link-connectivity constraints [10]. To examine joint vulnerability, we retain each message identity across baseline and removal worlds, distinguish exposed from unexposed outcomes, and compare joint losses with the actual loss sets of constituent actions. This design connects the interpretation of compensation to delivered service rather than inferring it from connectivity alone.
Recovery mechanisms designed for a single failed component need not retain their guarantees under multiple failures; this distinction is explicit in the packet-network recovery literature [11]. We study protocol-realized compensation and joint service vulnerability in urban VANET scenarios from Hohhot. Net-damage rankings were seed-sensitive, motivating an exploratory separation of exposure, compensation and residual effects. The systematic component provided a more stable description of service risk. Successful replacement paths then identified a message-conditioned dependency burden, which we examined in relation to exposure-conditioned irreducible pair loss, . A separate, broader triple analysis asked whether complete triple-world service losses could be represented by the union of losses in the three constituent pair worlds.
The study provides a message-level account of why surviving a single-node failure can coexist with vulnerability to joint failures. Six mutually exclusive fates distinguish compensated exposure from other changes in delivery. The stability comparison separates a useful systematic-risk description from an unstable net-damage ordering. Actual replacement routes connect compensation to identifiable providers, and the pair analysis associates their realized dependency burden with irreducible loss. The triple analysis finds residual service losses beyond constituent pair-world representation. Path-level evidence then identifies masking and restructuring while locating the limits of those explanations. The contribution concerns communication-service vulnerability under the evaluated configuration, rather than a new routing or node-ranking algorithm.
The research questions are: (RQ1) How stable are message-level vulnerability quantities across stochastic realizations? (RQ2) How do successful replacement paths and providers realize single-node compensation? (RQ3) Is protocol-realized provider dependency associated with irreducible pairwise service loss? (RQ4) To what extent does constituent pair-world loss represent triple-removal loss? The communication-radius analysis tests the scope of these conclusions rather than adding a new primary endpoint. Supplementary Table S1 summarizes component stability; Table S2 records negative and boundary evidence; Table S3 reports communication-radius sensitivity; and Table S4 provides an illustrative comparison of pairwise and third-order vulnerability.
2. Materials and Methods
2.1. Dynamic Urban VANET and Analysis Domain
The study covers seven observed dates in Hohhot and an inventory of 168 hourly snapshots. Median hourly node appearances were 3504.5 taxis, 1173 buses and 1070.5 RSU-equivalent bus-stop nodes (5631 total); these are snapshot counts, not road-network density or unique-vehicle counts. Source positions are sampled at 0, 60 and 120 s for each snapshot. U150 uses a pre-fixed instantaneous 150 m geometric eligibility cutoff for vehicle–vehicle and vehicle–RSU candidate links; RSU–RSU links are excluded. This is a modeling choice, neither an optimized radio radius nor a guarantee of delivery: the PHY/channel and AODV models determine realized communication. Single-node, replacement-path, pair and triple analyses use the reported subsets of this domain.
2.2. Communication and Hard Node-Removal Model
The communication experiments used ns-3.47 with IPv4, AODV routing [12] and UDP application traffic. The configuration uses an 802.11p-compatible 10 MHz, 6 Mbps setup with YansWifiPhy and AdhocWifiMac, LogDistance propagation with exponent 2.35 and Nakagami fading. Transmit power is 23 dBm and receiver sensitivity is −90 dBm. Each run lasts 120 s and contains 16 flows with a 2 s message interval. The 300-byte application message includes a 32-byte identity header; 268 bytes refers to the remaining payload, not the full message. Table 1 retains the configuration values.
Table 1.
Communication and counterfactual configuration.
AODV provides the primary reactive routing realization: its on-demand discovery and response to link changes make it a defensible setting for examining rerouting after node removal [12]. Holding this realization fixed supports matched-message comparison and reconstruction of actual forwarding paths. The analytical definitions can be applied to other routing protocols with equivalent message and path observations; realized routes and compensation estimates remain protocol-conditioned.
Hard removal is applied to the specified node action while preserving the designated flow sources and destinations. Baseline and removal worlds are matched by scenario, protocol, seed and traffic identities. The primary seeds are 20260731–20260733; extended-seed checks additionally use 20260734–20260737. The evaluation concerns service outcomes under this fixed communication configuration.
For each snapshot, the frozen manifest deterministically selects 16 vehicle-to-vehicle flows. Eligible taxi and bus endpoints have valid positions over 0, 60 and 120 s; RSU-equivalent stops are not endpoints. Sources are rotated by spatial grid, vehicle type and stable ID; destinations are screened on the snapshot vehicle graph for static 2–4-hop candidate paths, with deterministic type, hop, grid-use, endpoint-use and ID ordering and documented fallback. The first 16 of the nested candidate sequence form the attempted demand, without a random draw or guaranteed per-snapshot type ratio. Static candidate hops are not the AODV-realized route hops. A snapshot’s manifest is reused across matched q0/removal worlds and seeds; its endpoints are protected from removal. This design targets observable multi-hop demand and is not a probability sample of citywide traffic.
2.3. Stable Message Identity and Matched Counterfactual Worlds
An application message is identified by (scene_run_id, flow_id, sequence_number). The same identity is aligned between the no-removal baseline and each applicable removal world . Comparisons operate on this matched, closed identity universe M. A successful message meets both the delivered and deadline_met criteria recorded for that message. Let denote the number of -success messages in M. Thus is neither the number of all attempted messages nor the number of rows in the full six-fate census.
Internal stable source identities and snapshot-local runtime node IDs are used for matched-world analysis; the publication display pseudonyms are separate labels. Taxi source identity may be plate-derived, bus source identity originates from a bus UUID, and RSU-equivalent stop identities are generated spatial indices rather than verified municipal station codes. The same display pseudonym denotes the same node across the panels; it does not replace an analytical identity.
Constituent comparisons retain message identity rather than subtracting aggregate delivery rates. A joint-world loss can therefore be checked against the actual identities lost under its constituent actions. The exposure-conditioned pair analysis and the broader triple analysis use this same matching principle but with distinct loss-set selectors, defined in Section 2.6.
Within the matched closed baseline-success identity universe, S0 = F1 + F2 + F3 + F4. F5 and F6 belong instead to the baseline-unsuccessful portion; absence of a message in an incomplete world must not be treated as zero loss.
2.4. Message-Fate Taxonomy and Service-Vulnerability Decomposition
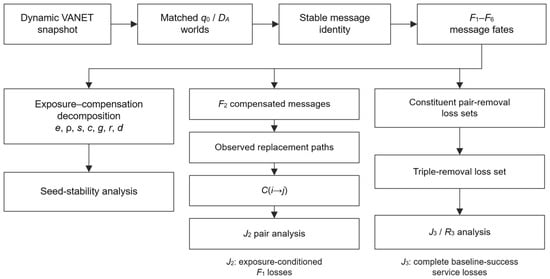
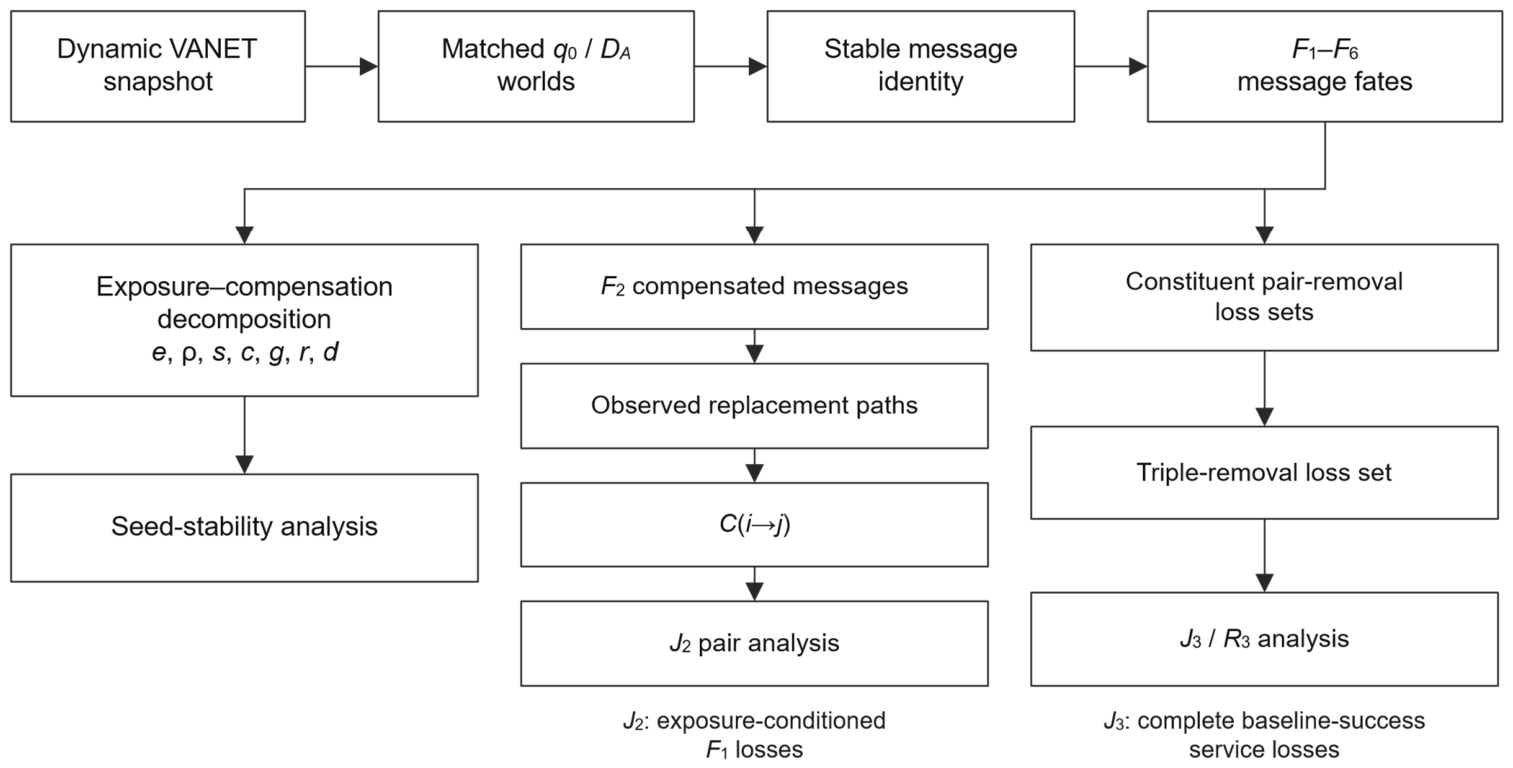
The six fates distinguish baseline success, baseline exposure to the removed action and removal-world success. Among baseline-success messages, F1 denotes exposed losses, F2 exposed messages that survive removal, F3 unexposed losses and F4 unexposed messages that remain successful. F5 denotes messages unsuccessful in but successful after removal; F6 denotes messages unsuccessful in both worlds. These categories close over M (Figure 1).
Figure 1.
Conceptual workflow for message-level counterfactual service-vulnerability analysis. A dynamic VANET snapshot defines matched baseline q0 and removal DA worlds, aligned by stable message identity and classified into F1–F6 message fates. Three separate analysis branches examine exposure–compensation decomposition (e, ρ, s, c, g, r, d) and seed stability; observed F2 replacement paths, compensation dependency C(i → j), and pairwise J2; and complete constituent pair-world and triple-world service-loss sets for J3/R3. J2 uses exposure-conditioned F1 losses, whereas J3 uses complete baseline-success service losses. Connectors indicate analysis workflow, not causation or a recursive J2-to-J3 definition.
Writing for the corresponding count, exposure and realized compensation are e = (F1 + F2)/ and ρ = F2/(F1 + F2), with ρ defined only when exposure is nonzero. The systematic component is s = F1/ = e(1 − ρ). Collateral loss and failure gain are c = F3/ and g = F5/; the residual component is r = c − g. Net damage is d = (F1 + F3 − F5)/ = s + r. These are mathematical compositions, not causal links (Figure 1). In particular, s remains protocol-conditioned service risk rather than deterministic structural damage, and ρ measures observed compensation rather than purely topological redundancy.
Illustrative fate arithmetic (not empirical data): suppose 12 matched messages include S0 = 10 baseline successes, with (F1, F2, F3, F4, F5, F6) = (2,3,1,4,1,1) after one removal. Then exposure e = (2 + 3)/10 = 0.5, realized compensation ρ = 3/(2 + 3) = 0.6, systematic risk s = F1/10 = 0.2, collateral loss c = 0.1, failure gain g = 0.1, residual r = c − g = 0 and net damage d = s + r = 0.2. These are algebraic quantities rather than distinct causal mechanisms.
2.5. Protocol-Realized Compensation Dependency
For an F2 message exposed to removal of i, the recovered successful removal-world route identifies replacement-provider nodes. The directed relation C(i → j) records this realized use of j. The extraction attributes equal weight 1/k to each of the k identified replacement providers for that message and sums attributed weights into the directional cattr edge quantity. This quantity is an attributed message burden, not a delivery probability.
For pair selection, we average the directional cattr entries over the available seed entries for the snapshot and form dependencysum as the sum of the two directional weights. The resulting burden is protocol-realized and message-conditioned, rather than a static degree or causal effect estimate. The actual replacement sequence and aggregate dependency evidence are reported in Section 3.3.
For each F2 message, eligible replacement relay IDs are deduplicated (retaining first occurrence); source, destination and removed node are excluded. Each of k distinct eligible providers receives 1/k, so a relay traversed repeatedly is counted once and each nonempty message attribution sums to one. An empty eligible provider set creates no edge. Directional entries are averaged over existing seed entries without zero-imputing absent edges; dependencysum combines both directions. This burden is dynamic, message-conditioned and protocol-realized, not causal.
2.6. Irreducible Pairwise and Third-Order Vulnerability
For the pair analysis, let be the action-specific F1 loss set. The pairwise measure is
It measures pair-F1 losses absent from both constituent single-F1 sets. The exposure condition is part of this definition and is retained throughout the pairwise results.
Having examined exposure-conditioned pairwise vulnerability, the triple analysis asks a broader question: can the complete baseline-success losses under triple removal be explained by the three constituent pair-removal worlds? Define = {m∈M: m succeeds in and fails in }. This selector does not require baseline exposure to the removed nodes; where the action-specific fate taxonomy applies, it includes F1 and F3 losses. The triple measures are
The constituent pair sets in this equation are complete service-loss sets, not the F1-conditioned sets used to calculate . is therefore a distinct higher-order residual, not a direct recursive extension of . Stable-positive requires positivity in at least two of the three primary seeds. This seed criterion does not imply that each triple was evaluated on all seven dates.
Illustrative example (not empirical data): let S0 = 10, with single-F1 loss sets Ui = {m1, m2} and Uj = {m2, m3}; if pair-F1 loss Uij = {m1, m2, m3, m4}, then J2ij = |Uij\(Ui ∪ Uj)|/10 = 1/10, contributed only by m4. Separately, if the complete pair-world service-loss union is {m1, m2, m3} and complete triple-world loss is {m1, m2, m3, m5}, then J3 = 1/10 and R3 = (1/10)/(4/10 + 10−12), approximately 0.25. The examples distinguish F1-conditioned J2 from complete service-loss J3 and preserve the formal R3 denominator offset (Table S4).
2.7. Statistical Evaluation
Seed stability was examined using independent three-versus-four-seed splits on the three dates reported in Table 2. An exploratory component analysis compared d and s within the same 105 repeated date/split units and used a paired Wilcoxon test. These comparisons are repeated within the same analysis domain and are not independent deployments.
Table 2.
Date-specific component split-Spearman summaries.
The predefined, study-specific single-node ranking-stability rule required leave-one-seed Spearman ≥ 0.85, independent 3-versus-4-seed split Spearman ≥ 0.70, and top-five Jaccard ≥ 0.60, each on at least two of the three evaluated dates. Split Spearman < 0.40 on at least two dates was predeclared clearly unsupported behavior. These are distinct checks on component rankings, not the triple stable-positive rule (J3 > 0 in at least two of three primary seeds). The three primary seeds (20260731–20260733) feed the formal J2/dependency estimates; four additional seeds (20260734–20260737) serve designated stability/QC checks, not those primary point estimates. The extra checks probe stochastic variability in this configuration; neither three nor seven seeds establish universal convergence.
Pairwise association was summarized with pooled and date-wise Spearman correlations and pooled Kendall correlation. The matched-control display and its bootstrap summary estimate different quantities: the date-wise dots are high-dependency minus matched-control differences in group medians, and the bootstrap resamples dates, retains the corresponding pair records and computes the difference in group means. The reported bootstrap median and 95% bootstrap percentile interval summarize the mean-contrast distribution, not an interval for the date-wise median differences. The original pair analysis used 5000 date-cluster resamples.
The triple analysis reports triple distributions and the date-cluster bootstrap distribution of mean , also using 5000 resamples. Path-mechanism analyses are secondary and retain their own eligible subsets and matched units. Their estimates are not substituted for the primary pair/triple effects. The pair and triple bootstrap intervals are the 2.5th and 97.5th percentiles of their respective bootstrap distributions.
Range-sensitivity validation holds seven preselected snapshots, 16-flow demand per snapshot, 168 fixed pair identities and three primary seeds constant across geometric eligibility cutoffs of 100, 150 and 200 m. The corrected, identity-closed R150 evidence is reused without simulation reruns. Baseline, required single-removal and fixed pair-removal outcomes and dependency burdens are generated at each alternative radius under the same matched-message/F1-conditioned J2 logic. Disconnected attempted flows remain in the denominator; date correlations undefined from constant inputs are reported as undefined, never zero. J3 and cross-protocol robustness are not evaluated in this panel.
Spearman assesses monotone rank association and Kendall offers a complementary ordinal summary; neither establishes causality. The 5000 bootstrap resamples draw whole dates to retain within-date grouping, improving Monte Carlo precision without creating 5000 independent observations. Seven dates remain a limited domain. Three seeds (20260731–20260733) feed the primary pair estimates; four additional seeds (20260734–20260737) serve designated stability/QC analyses, not the primary association. Detailed pair/triple candidate restrictions and deterministic matching are specified below; their inferences remain sample-conditional.
Pair sampling used 14 eligible snapshots selected within seven dates after complete-input checks: each date contributed the highest mean baseline-success snapshot and one closest to its within-date median (ID tie-break). Within each snapshot, unordered pairs of nodes with primary-seed single-world fate evidence were eligible; protected endpoints were excluded. A deterministic, non-probability selection retained 24 pairs per snapshot (48/date; 336 total): 98 strongest directed-dependency A, 9 bidirectional-dependency B, 56 high single-node F1 vulnerability C, 70 weak-dependency matched controls D, 70 deterministic-hash E, and 33 deterministic fill. The reported high-versus-control contrast uses A + B versus D; C/E/fill are not substituted into that contrast. D candidates were drawn from the snapshot’s weak-dependency pool (dependency sum at or below its 35th percentile), preferentially matching node-type combination to A/B/C targets, with fallback to all types. The fixed matching distance standardized absolute differences in the paired sums of single-world vulnerability V = F1/S0, baseline exposure count E and eligible degree on the 150 m candidate graph (excluding RSU–RSU links); ties used pair ID. This does not give every high pair a one-to-one randomized control (supplementary sampling note).
Triple sampling retained eight fixed snapshots across the seven dates and eight triples per snapshot (64 total). Candidate nodes required complete primary-seed single-world evidence; protected endpoints were excluded. The deterministic quota design yielded 17 A dependency triangles, 14 B directed chains, 12 C pairwise-weak but service-related triples, and 21 D matched non-mechanistic controls. C uses shared baseline-exposure/F2 service-flow evidence, not F2 alone; D was deterministically matched on vulnerability V, service exposure and degree, not randomly drawn. The eight snapshot IDs and detailed eligibility/stratum rules are given in the supplementary sampling note. The selected triples are neither an exhaustive enumeration nor a balanced panel of the same triples across dates, and the results are conditional on this structured sample.
3. Results
3.1. Net Service Damage Is Common but Rank-Unstable
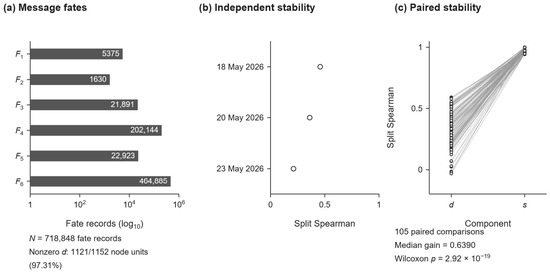
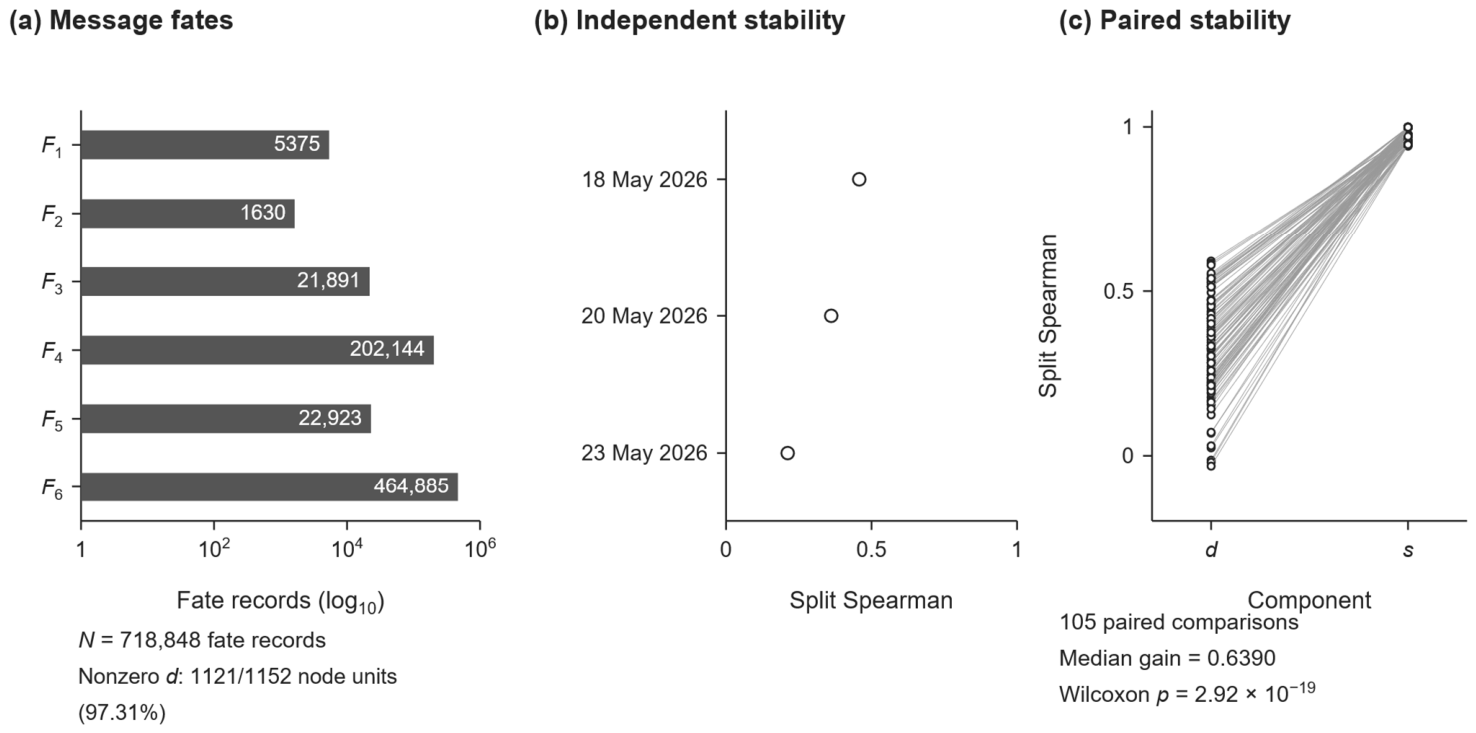
The message-fate census contains 718,848 rows. At the node level, 1121 of 1152 single-node units had nonzero net damage d (97.31%; Figure 2a). The percentage refers to node-level units, not message-fate rows, and includes signed net changes rather than only positive losses.
Figure 2.
Message fates and seed stability. (a) The fate census contains 718,848 rows; panel (a) uses a base-10 logarithmic count axis starting at 1, with exact counts printed. Equal axis distances represent count ratios, not linear count differences. Separately, 1121/1152 single-node units have nonzero d (97.31%). (b) Independent split-Spearman summaries on the three labeled dates do not meet the predefined d-stability criterion. (c) All 105 repeated paired date/split comparisons; the median gain from d to s is 0.6390 (Wilcoxon p = 2.92 × 10⁻¹⁹). These are repeated comparisons within the study domain, not independent deployments.
The independent net-damage ordering did not meet the predefined stability criterion. Split-Spearman summaries were 0.4577 on 18 May 2026, 0.3614 on 20 May 2026 and 0.2118 on 23 May 2026 (Figure 2b). Net changes in delivery were therefore common without producing a stable node ordering under this test.
3.2. Exposure–Compensation Structure Provides a More Stable Service-Risk Description
Separating the components of net damage exposed a substantial difference in seed stability. Across 105 paired date/split comparisons, the median gain in split-Spearman correlation from d to s was 0.6390 (paired Wilcoxon p = 2.92 × ; Figure 2c). Table 2 reports the date-specific component summaries. The exploratory comparison supports s as a more stable description of service risk within this communication configuration.
3.3. Successful Compensation Is Realized Through Identifiable Replacement Paths
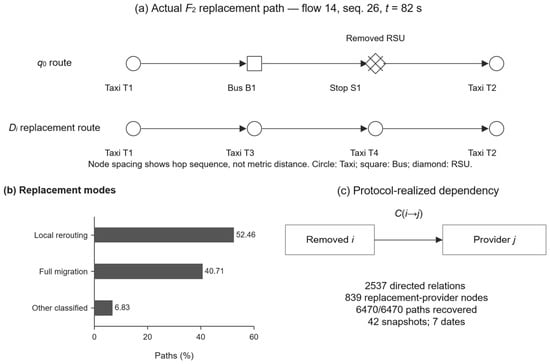
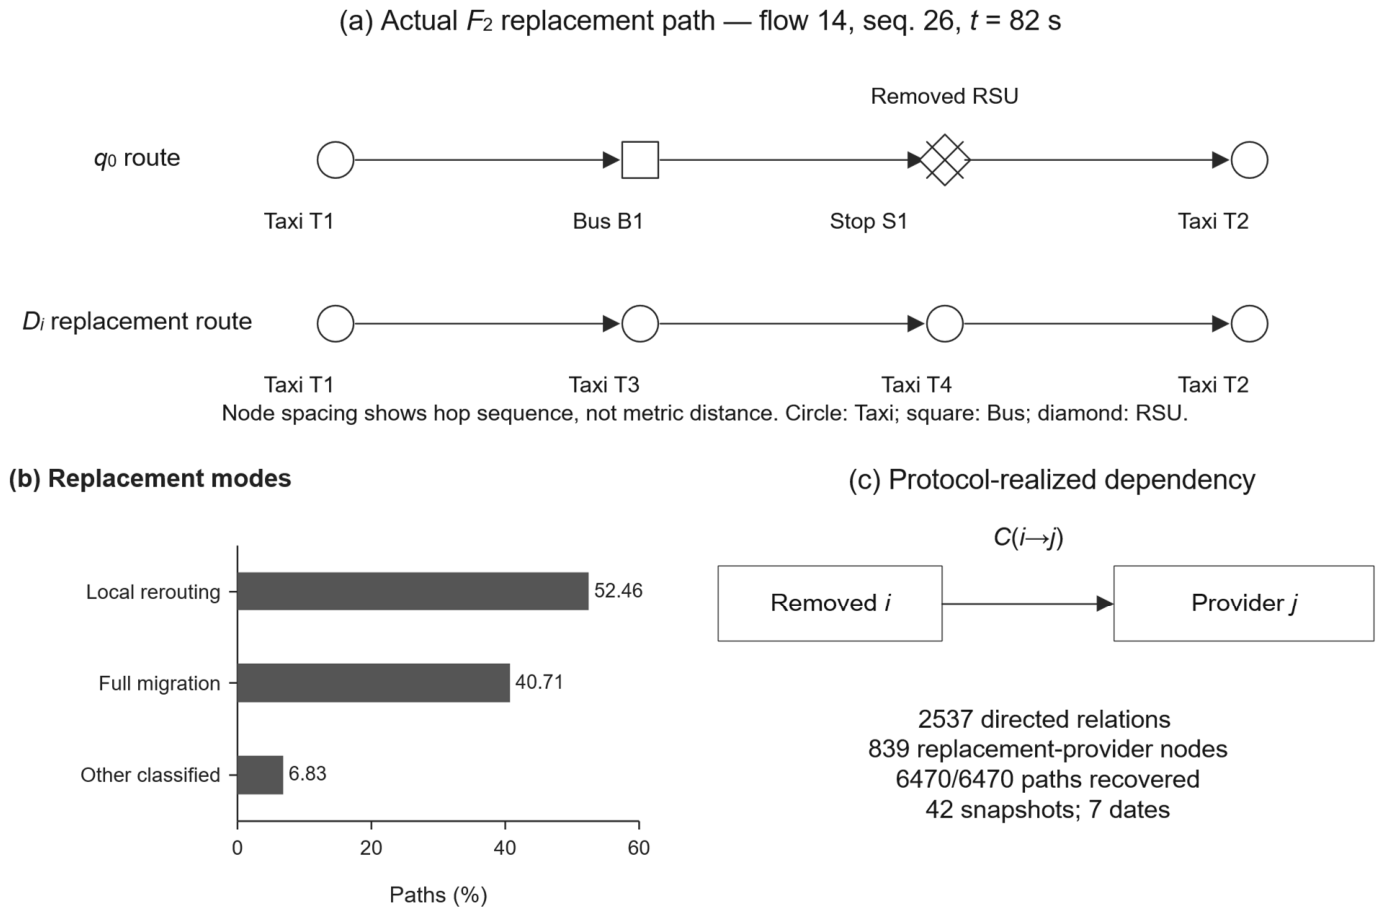
All 6470 successful F2 replacement paths in the analysis were recovered. Local rerouting accounted for 52.46%, full migration for 40.71% and other classified modes for 6.83% (Figure 3b). The example in Figure 3a shows flow 14, sequence 26 surviving removal of the RSU-equivalent stop S1 through its observed replacement route. Equal spacing represents hop sequence, not metric distance.
Figure 3.
Observed route replacement and compensation dependency. (a) Flow 14, sequence 26, transmitted at 82 s, survives removal of the RSU-equivalent stop displayed as S1 through the observed replacement sequence. Publication display pseudonyms T1–T4, B1 and S1 are consistent for the same nodes across panels; internal stable identities and snapshot-local runtime IDs remain separate. Symbols identify node type (circle: taxi; square: bus; diamond: RSU-equivalent stop). Spacing represents hop sequence, not metric distance. (b) Local rerouting, full migration and other classified modes account for 52.46%, 40.71% and 6.83%. (c) Recovery of 6470/6470 paths identifies 2537 directed relations and 839 replacement-provider nodes across 42 snapshots and seven dates; these are message-conditioned observations, not causal effects.
Across 42 snapshots and seven dates, the extraction identified 2537 directed dependency edges and 839 replacement-provider nodes (Figure 3c). The relations identify nodes used to sustain messages after the removal of another node. They describe compensation realized by the protocol for those messages.
3.4. Protocol-Realized Dependency Is Associated with Latent Pairwise Vulnerability
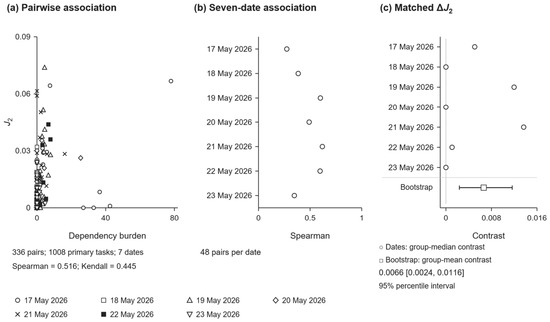
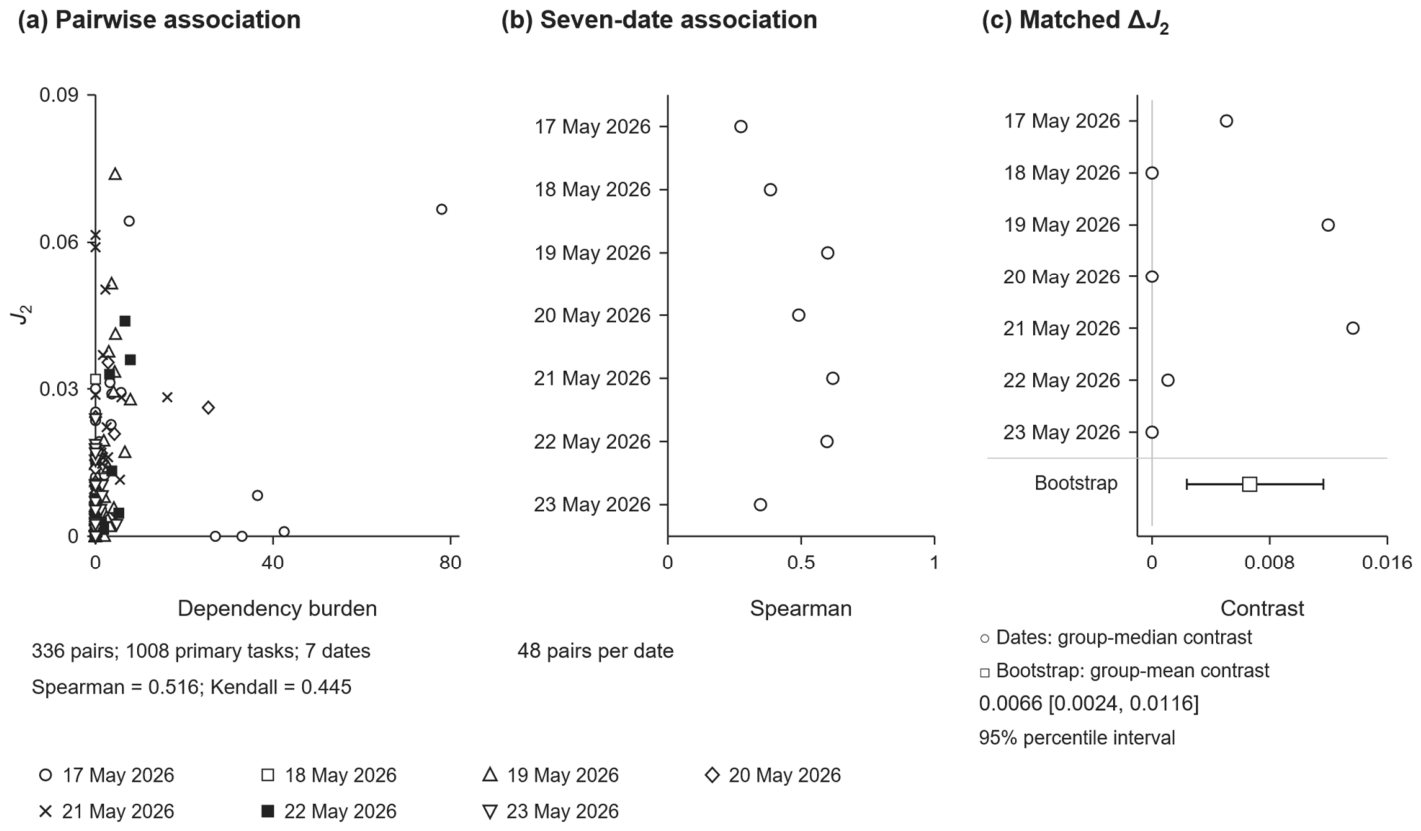
The formal primary pair analysis includes 336 pairs (48 on each of seven dates) and 1008 three-seed pair tasks; 272 additional extended/QC tasks are not included in the primary numerical estimate. Integrity-closed pair-level J2 values were positively associated with fixed dependency burden: pooled Spearman 0.516 and Kendall 0.445 (Figure 4a). The date-wise Spearman directions were positive on all seven dates (Figure 4b).
Figure 4.
Dependency-associated pairwise vulnerability. (a) Fixed dependency burden versus pair-level J2 for 336 evaluated pairs; pooled Spearman = 0.516 and Kendall = 0.445. (b) Date-wise associations; all seven directions are positive. (c) Date-wise high-minus-control group-median differences and the distinct fixed-assignment, date-cluster bootstrap group-mean contrast (median 0.0066, 95% percentile interval [0.0024, 0.0116]). The two display types are not interchangeable estimators. Marker shapes in panel (a) identify dates.
Date-wise high-minus-control differences in group medians and the date-cluster bootstrap of the fixed matched-control group-mean contrast are distinct estimators. The latter had a bootstrap median of 0.0066 and a 95% percentile interval [0.0024, 0.0116] (Figure 4c; Table 3). These observations support an association, not a causal effect, between realized replacement-provider dependency and exposure-conditioned irreducible pair loss.
Table 3.
Pairwise vulnerability and matched-control evidence.
3.5. Constituent Pair-World Losses Do Not Fully Represent Triple-World Service Loss
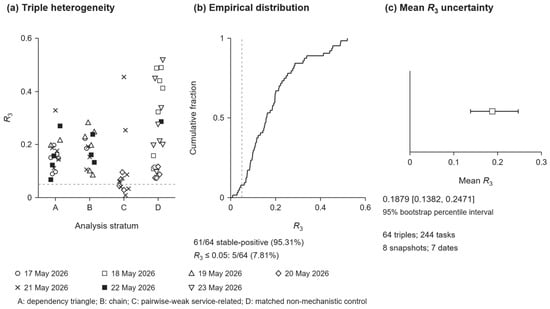
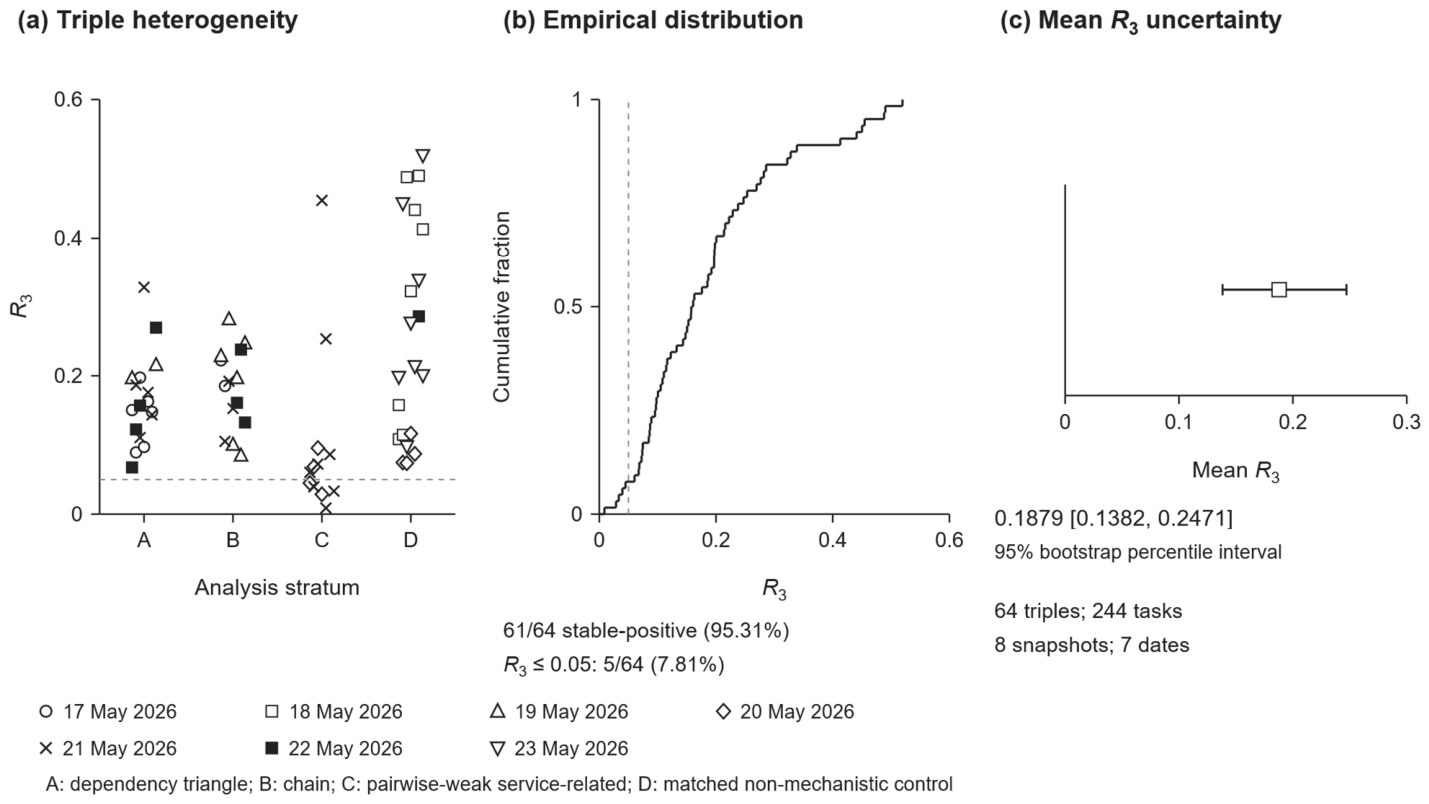
The broader triple-world question was evaluated in 64 triples over eight snapshots and seven dates, comprising 244 tasks. Of these triples, 61 met the predefined stable-positive criterion (95.31%). This residual compares complete baseline-success loss sets, as defined in Section 2.6.
The stratum-wise distribution and ECDF show heterogeneity in (Figure 5a,b). Only 5/64 triples (7.81%) had ≤ 0.05. The date-cluster bootstrap of mean yielded a median of 0.1879 and a 95% bootstrap percentile interval of [0.1382, 0.2471] (Figure 5c; Table 4). For most evaluated triples, the union of constituent pair-world losses did not fully represent triple-world service loss.
Figure 5.
Third-order service-loss residual. (a) R3 for 64 triples by analysis stratum; marker shape identifies date; D denotes matched non-mechanistic controls. (b) ECDF of the same values, with dotted threshold lines at R3 = 0.05. Of 64 triples, 61 meet the stable-positive J3 criterion (95.31%), and 5/64 (7.81%) have R3 ≤ 0.05. Stable-positive means positive in at least two of three primary seeds. (c) Date-cluster bootstrap of mean R3: median 0.1879, 95% bootstrap percentile interval [0.1382, 0.2471]. The residual compares complete baseline-success loss sets from triple and constituent pair worlds (Section 2.6); the sample spans seven dates without testing every triple on every date.
Table 4.
Triple-world service-loss residual.
3.6. Path-Level Mechanism Evidence and Its Boundaries
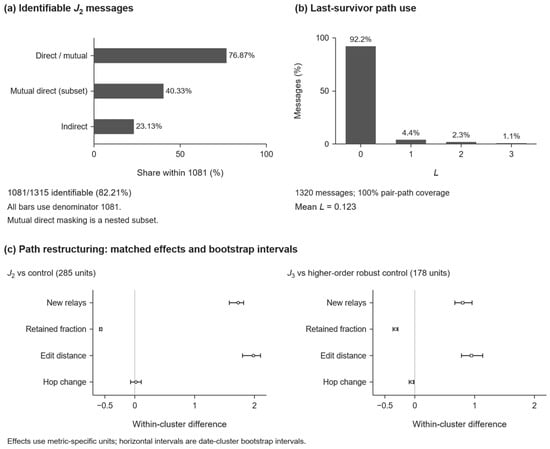
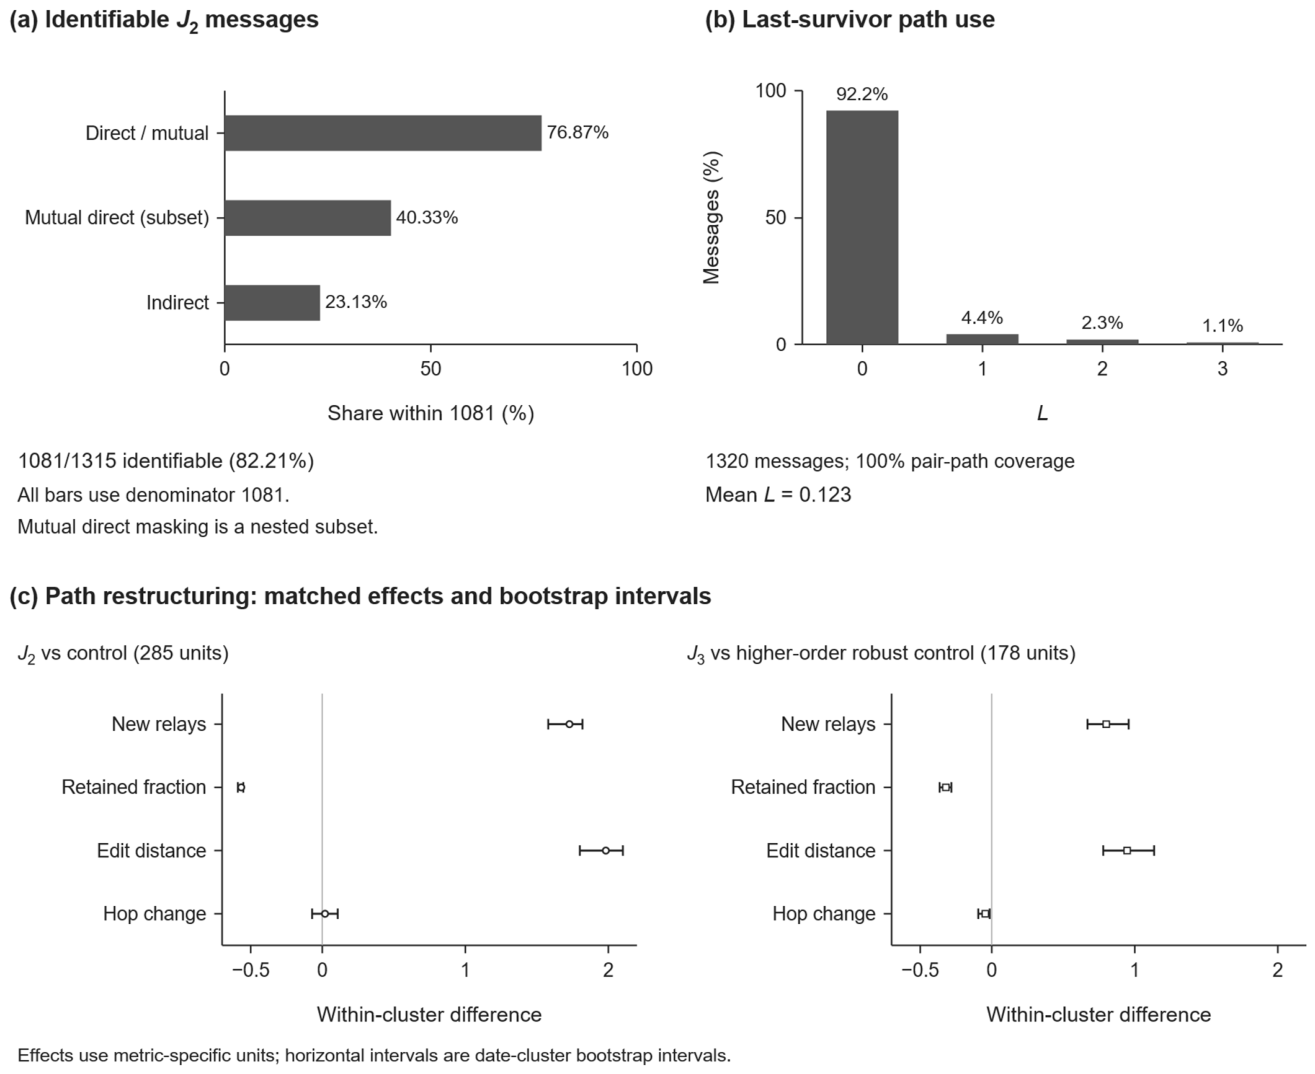
Of 1315 formal J2 message instances, 1081 (82.21%) had identifiable successful paths in both constituent single-removal worlds, while 234 were path-unidentifiable (Figure 6a). Within the identifiable subset, 831 (76.87%) showed direct or mutual masking, including a mutual-direct subset of 436 (40.33%); 250 (23.13%) showed identifiable indirect interaction. These proportions apply only to the 1081 path-identifiable instances; no mechanism was imputed for the other 234. Formal J2 membership excludes constituent F1 losses, not every possible single-world failure, so path identifiability is a separate condition.
Figure 6.
Path mechanisms and coverage: (a) Both constituent single-world paths are identifiable for 1081/1315 formal J2 instances (82.21%). Direct-or-mutual masking (831; 76.87%), its mutual-direct subset (436; 40.33%), and indirect interaction (250; 23.13%) use denominator 1081; 234 instances are path-unidentifiable. (b) All 1320 J3 messages have three-pair path coverage; mean path-use count L = 0.123 and P (L = 3) = 1.1%. L is distinct from complete service-loss sets. (c) Secondary matched effects and intervals for J2 versus control and J3 versus higher-order robust control use 285 and 178 matched cluster units. Panel (c) metrics have different units: new-relay counts, retained-relay fraction, sequence edit distance, and hop-count change; compare signs and intervals relative to zero rather than raw magnitudes.
All 1320 messages had the three constituent pair-world paths recovered. The path-use count L had mean 0.123, and P (L = 3) was 1.1% (Figure 6b). This count is distinct from the loss sets . Last-survivor use occurred, but its low prevalence limits it as an explanation of the third-order residual.
Secondary matched comparisons showed increased new-relay counts and edit distance, together with reduced relay retention, for versus control and versus higher-order robust control (Figure 6c). Hop-count contrasts were +0.019 [−0.071, 0.108] and −0.045 [−0.094, −0.014], respectively. The path evidence supports restructuring more consistently than universal path lengthening.
Communication-radius sensitivity: With identical 16-flow demand, q0 delivery was 12.69%, 39.98% and 47.18% at 100, 150 and 200 m, respectively. Successful F2 messages with valid replacement paths numbered 248/248, 1158/1158 and 999/999. In the separate fixed-168-pair panel, pooled dependency–J2 Spearman correlations were 0.436, 0.464 and 0.302; positive date-wise directions occurred on 3/7, 7/7 and 4/7 dates (some other dates were undefined owing to constant ranks). Compensation and positive pooled association thus persisted, but magnitude and date-level consistency were partially range-sensitive. The fixed-168-pair R150 estimate differs in sample from the 336-pair main estimate (0.516); J3 was not tested across radii (Table S3).
4. Discussion
4.1. From Structural Criticality to Communication-Service Vulnerability
Structural criticality and realized service vulnerability describe different endpoints. Zhang and He examine degree distributions and evolving topological properties in a V2I subnetwork model [13]. Digital-twin-based V2V analysis by Zhang et al. evaluates time-varying topology and vulnerability under deliberate and random node attacks [14]. These structural endpoints provide relevant background, but a topological ordering need not predict message losses after routing recovery. In the present analysis, nonzero net changes were frequent while the ordering of affected nodes remained seed-sensitive. Separating d into s and r retained collateral losses and gains without obscuring the more stable systematic component.
Connectivity-based reliability models remain useful for examining how mobility and component failures affect a network. Cao et al. explicitly include several failure modes in such a model [5]. Road-based routing shows how route representation can respond to vehicle movement [6], and path-aware networking tools can select among network paths using latency, throughput, and loss requirements [15]. Our matched-message approach complements these perspectives by identifying which baseline messages survive or fail under particular removal actions. It does not require treating topology as irrelevant; it requires distinguishing available connectivity from realized service.
4.2. Compensation and Latent Dependency
Cooperative vehicular networking uses alternative relays and infrastructure to support communication [2]. Recovery literature distinguishes preplanned protection from reactive restoration, and local detours from end-to-end backup paths [11]. Those categories describe recovery designs; the F2 paths here instead record the routes realized after removal in the evaluated network. A node used to preserve a message after another node is removed becomes part of that message’s replacement support. The resulting relation provides an empirical way to examine whether compensated survival leaves vulnerability concentrated in particular node pairs.
The positive dependency– association and matched-control contrast support that interpretation within the evaluated pairs. Dependency burden arises from the protocol, through traffic and paths rather than a randomized assignment, so this is not an estimate of a causal effect of dependency. Relay-selection research also considers mobility and path quality [7], but those protocol comparisons address a different question. Here, masking among the dual-path-identifiable messages provides additional mechanism evidence for the observed association.
4.3. Interpreting Pairwise and Higher-Order Vulnerability
The pair and triple analyses address related but distinct forms of joint service vulnerability. identifies exposure-conditioned pair losses beyond the constituent single-node F1 losses. The broader triple analysis asks which baseline-success losses under triple removal are absent from every constituent pair-removal world. That distinction allows the analysis to move from dependency-associated pair vulnerability to a higher-order service question without assuming identical loss universes.
For most evaluated triples, the pair-world loss union did not cover the triple-world service-loss set. Variation in shows that the relative size of the residual differs across triples. This finding concerns the representational limits of constituent pair worlds in the evaluated sample, not a universal hypergraph law or a demonstrated prediction of from compensation dependency.
The path results also resist a single-mechanism explanation. Successful constituent-world paths were recoverable for the messages, yet complete last-survivor use was uncommon. Relay replacement and edit distance support path restructuring more consistently than uniformly longer paths. These secondary observations help interpret the service-loss residual while leaving some protocol-level interactions unresolved.
4.4. Service Vulnerability Rather than a New Ranking Model
Why service vulnerability diverges from traditional topological ranking. Topological connectivity and centrality characterize available links or graph positions, but do not specify which identified application messages meet their deadlines after routing adaptation. Service damage also depends on baseline exposure, protocol-realized replacement, collateral changes, and reliance on the replacement providers. Net-damage ordering did not meet the predefined stability criterion; the more stable systematic component supports a service-risk interpretation, not a new universal node-ranking algorithm. Structural rankings need not reproduce message-level service vulnerability because exposure, routing and compensation intervene between removal and observed service.
Negative and boundary analyses further constrain the mechanism interpretation. Primary replacement-provider concentration alone did not give a consistent unified explanation (100 fixed pairs; mean-HHI–J2 Spearman −0.2933, date-cluster interval [−0.4257, 0.0654]). In a separate fixed 70-pair, three-date overlay, the high-exposure/high-compensation phase was positively associated with J2 (Spearman 0.3946, interval [0.0482, 0.4530]); this descriptive, non-causal observation does not establish seven-date stability or a validated phase predictor. Low-dimensional triple descriptors gave no single explanatory pattern (Table S2).
Sudheera et al. examine real-time cooperative routing and scheduling under delay and link-connectivity constraints [10]. Their scheduling problem and experimental units differ from ours. In the present study, evidence for a communication-service effect is separated from any claim about the incremental benefit of a particular controller.
4.5. Validity and Generalization Boundaries
The results concern one Hohhot mobility domain across seven observed dates, selected snapshots, a fixed 16-flow demand within each snapshot, AODV and hard removal with protected flow endpoints. Pair and triple results are conditional on structured, deterministic, non-probability samples rather than citywide-representative draws; the triple units do not form a balanced across-date panel. Stochastic seeds are repeated realizations rather than independent deployments. Date-cluster intervals preserve within-date grouping but cannot establish broad transportability from seven dates. The 100–200 m validation shows partial range sensitivity, not numerical invariance; triple-world J3 sensitivity, other traffic densities and mobility patterns, alternate fault models and confirmatory cross-protocol behavior remain untested. Restricted raw trajectories cannot be redistributed.
Hard removal excludes the protected flow endpoints and defines the intervention examined here. Other fault models and service endpoints require separate interpretation. For example, Feng et al. study wireless consensus with unreliable links and incorrect local readings [16], whereas this study measures application-message success after node removal. Message survival alone does not establish the correctness or safety of a higher-level vehicular decision.
Routing choice can change the paths through which service is maintained. OLSR proactively maintains link-state information and uses multipoint relays for control-message dissemination [17]; DSR uses on-demand source routing, cached routes and packet salvaging [18]; and DSDV maintains destination routes through periodic and triggered table updates [19]. These mechanisms may change route readiness, reaction latency, realized forwarding paths and replacement-provider identities, without implying a predetermined direction. Stable message identity, matched q0/removal worlds, the F1–F6 taxonomy, the definitions of exposure e, realized compensation ρ, systematic risk s, c, g, r and d, the replacement-provider construction concept, and J2/J3 matched-loss definitions can be applied to other routing realizations when equivalent message and actual-forwarding observations are available. In contrast, realized F2 membership, provider identities, C(i → j), numerical ρ, J2/J3 magnitudes and the dependency–J2 association are protocol-conditioned. The analytical definitions are protocol-transferable, whereas the numerical estimates reported here are conditioned on the AODV realization. The present numerical results should therefore be interpreted as AODV-conditioned rather than protocol-invariant. Systematic cross-protocol replication under proactive and alternative reactive routing remains important for future validation, using identical mobility, traffic, node-removal actions and stable message identities.
J2 masking proportions characterize only the dual-successful-path-identifiable subset, and triple path evidence does not establish a universal last-survivor mechanism.
5. Conclusions
Matched message-level counterfactual analysis separates exposure from realized compensation and identifies protocol-conditioned service risk that static topology alone need not rank. In the evaluated AODV scenarios, replacement-provider dependency was positively associated, non-causally, with irreducible pair loss; triple worlds exhibited additional residual service loss beyond constituent pair worlds. These findings can guide resilience screening of candidate redundancies and vulnerable node combinations but do not optimize placement or routing.
The fixed-demand 100–200 m panel retained compensation and positive pooled pairwise association but showed substantial radius and date heterogeneity. The triple result remains conditioned on U150 and the selected sample; cross-radius J3 and cross-protocol generalization were not established.
Supplementary Materials
The following supporting information can be downloaded at https://www.mdpi.com/article/10.3390/telecom7050131/s1. Table S1. Complete component-stability summary. Table S2. Negative and boundary evidence retained for interpretation. Table S3. Fixed-demand communication-radius sensitivity (seven preselected snapshots, 16 flows per snapshot, three primary seeds and 168 fixed pairs). Table S4. Illustrative J2 versus J3 comparison (not empirical data). Supplementary sampling and stability protocol note.
Author Contributions
Conceptualization, Y.L. and H.Z.; methodology, Y.L.; software, Y.L.; validation, Y.L.; formal analysis, Y.L.; investigation, Y.L.; resources, H.Z.; data curation, Y.L.; writing—original draft preparation, Y.L.; writing—review and editing, H.Z.; visualization, Y.L.; supervision, H.Z.; project administration, H.Z.; funding acquisition, H.Z. All authors have read and agreed to the published version of the manuscript.
Funding
This research was funded by the National Natural Science Foundation of China (NSFC), Grant No. 62362053.
Data Availability Statement
Raw Hohhot mobility data are not publicly available: the provider authorized research use but not public redistribution. Access to underlying trajectories requires provider authorization. The local reproducibility-support package supplies a parameter specification, selected analysis/selection scripts, identity schemas and synthetic examples for inspection and method-level testing; it is not an executable end-to-end simulation package and cannot reproduce the principal empirical results without separately authorized mobility inputs and corresponding world outputs. The communication simulations used ns-3 version 3.47. All statistical analyses were performed using Python 3.12.13.
Acknowledgments
The authors acknowledge the relevant transportation authority in Hohhot for authorizing the use of the mobility data for academic research.
Conflicts of Interest
The authors declare no conflicts of interest.
References
- Karagiannis, G.; Altintas, O.; Ekici, E.; Heijenk, G.; Jarupan, B.; Lin, K.; Weil, T. Vehicular Networking: A Survey and Tutorial on Requirements, Architectures, Challenges, Standards and Solutions. IEEE Commun. Surv. Tutor. 2011, 13, 584–616. [Google Scholar] [CrossRef] [Scilit]
- Ahmed, E.; Gharavi, H. Cooperative Vehicular Networking: A Survey. IEEE Trans. Intell. Transp. Syst. 2018, 19, 996–1014. [Google Scholar] [CrossRef] [Scilit] [PubMed]
- Hartenstein, H.; Laberteaux, K.P. A Tutorial Survey on Vehicular Ad Hoc Networks. IEEE Commun. Mag. 2008, 46, 164–171. [Google Scholar] [CrossRef] [Scilit]
- Sterbenz, J.P.G.; Hutchison, D.; Çetinkaya, E.K.; Jabbar, A.; Rohrer, J.P.; Schöller, M.; Smith, P. Resilience and survivability in communication networks: Strategies, principles, and survey of disciplines. Comput. Netw. 2010, 54, 1245–1265. [Google Scholar] [CrossRef] [Scilit]
- Cao, J.; Bian, Y.; He, C.; Liu, F.; Xu, D.; Guo, Y. Evaluation of Connectivity Reliability of VANETs Considering Node Mobility and Multiple Failure Modes. Sensors 2025, 25, 6073. [Google Scholar] [CrossRef] [Scilit] [PubMed]
- Nzouonta, J.; Rajgure, N.; Wang, G.; Borcea, C. VANET Routing on City Roads Using Real-Time Vehicular Traffic Information. IEEE Trans. Veh. Technol. 2009, 58, 3609–3626. [Google Scholar] [CrossRef] [Scilit]
- Al-Kharasani, N.M.; Zukarnain, Z.A.; Subramaniam, S.K.; Hanapi, Z.M. An Adaptive Relay Selection Scheme for Enhancing Network Stability in VANETs. IEEE Access 2020, 8, 128757–128765. [Google Scholar] [CrossRef] [Scilit]
- Bi, Y.; Shan, H.; Shen, X.S.; Wang, N.; Zhao, H. A Multi-Hop Broadcast Protocol for Emergency Message Dissemination in Urban Vehicular Ad Hoc Networks. IEEE Trans. Intell. Transp. Syst. 2016, 17, 736–750. [Google Scholar] [CrossRef] [Scilit]
- Wijesekara, P.A.D.S.N.; Gunawardena, S. A Machine Learning-Aided Network Contention-Aware Link Lifetime- and Delay-Based Hybrid Routing Framework for Software-Defined Vehicular Networks. Telecom 2023, 4, 393–458. [Google Scholar] [CrossRef] [Scilit]
- Sudheera, K.L.K.; Ma, M.; Chong, P.H.J. Real-time cooperative data routing and scheduling in software defined vehicular networks. Comput. Commun. 2022, 181, 203–214. [Google Scholar] [CrossRef] [Scilit]
- Chiesa, M.; Kamisinski, A.; Rak, J.; Retvari, G.; Schmid, S. A Survey of Fast-Recovery Mechanisms in Packet-Switched Networks. IEEE Commun. Surv. Tutor. 2021, 23, 1253–1301. [Google Scholar] [CrossRef] [Scilit]
- Perkins, C.; Belding-Royer, E.; Das, S. Ad hoc On-Demand Distance Vector (AODV) Routing; RFC 3561, Experimental; RFC Editor: Wilmington, DE, USA, 2003. [Google Scholar] [CrossRef] [Scilit]
- Zhang, H.; He, L. Modeling and Topological Properties of a V2I Sub Network in VANET Based on a Complex Network. Cybern. Inf. Technol. 2015, 15, 149–160. [Google Scholar] [CrossRef] [Scilit]
- Zhang, H.; Zheng, Z.; Li, Y.; Lu, L. Digital Twin-Based Analysis of V2V Time-Varying Complex Networks. IEEE Trans. Veh. Technol. 2025, 74, 10225–10239. [Google Scholar] [CrossRef] [Scilit]
- Boldrini, L.; Battipaglia, A.; Hesselman, C.; Grosso, P. MS4PAN: Measurement System for Path-Aware Networks. In Proceedings of the 2024 IEEE 13th International Conference on Cloud Networking (CloudNet), Rio de Janeiro, Brazil, 27–29 November 2024; pp. 1–7. [Google Scholar] [CrossRef] [Scilit]
- Feng, C.; Xu, Z.; Zhu, X.; Klaine, P.V.; Zhang, L. Wireless Distributed Consensus in Vehicle to Vehicle Networks for Autonomous Driving. IEEE Trans. Veh. Technol. 2023, 72, 8061–8073. [Google Scholar] [CrossRef] [Scilit]
- Clausen, T.; Jacquet, P. Optimized Link State Routing Protocol (OLSR); RFC 3626, Experimental; RFC Editor: Wilmington, DE, USA, 2003. [Google Scholar] [CrossRef] [Scilit]
- Johnson, D.; Hu, Y.; Maltz, D. The Dynamic Source Routing Protocol (DSR) for Mobile Ad Hoc Networks for IPv4; RFC 4728, Experimental; RFC Editor: Wilmington, DE, USA, 2007. [Google Scholar] [CrossRef] [Scilit]
- Perkins, C.E.; Bhagwat, P. Highly dynamic Destination-Sequenced Distance-Vector routing (DSDV) for mobile computers. ACM SIGCOMM Comput. Commun. Rev. 1994, 24, 234–244. [Google Scholar] [CrossRef] [Scilit]

Disclaimer/Publisher’s Note: The statements, opinions and data contained in all publications are solely those of the individual author(s) and contributor(s) and not of MDPI and/or the editor(s). MDPI and/or the editor(s) disclaim responsibility for any injury to people or property resulting from any ideas, methods, instructions or products referred to in the content. |
© 2026 by the authors. Licensee MDPI, Basel, Switzerland. This article is an open access article distributed under the terms and conditions of the Creative Commons Attribution (CC BY) license.