


Abstract
Future lunar missions require robust 5G communication links, and their design depends partly on path loss characterization, link budget planning inputs, and path prediction loss models tailored to the Moon’s environmental conditions. This work develops a site-specific 5G large-scale path loss model for Shoemaker Rim F at 5.855 GHz using a high-resolution lunar digital elevation map and 3D ray tracing in Wireless Insite. Two link configurations were studied—dipole transmitter to dipole receiver (DD) and omni transmitter to dipole receiver (OD)—under five path loss cases: measured path loss, free space path loss (FSPL) with and without antenna patterns, and excess path loss with and without antenna patterns. The close-in (CI) and floating intercept (FI) model parameters are derived to develop a mathematical model for path loss prediction for the Shoemaker RIF’s terrain on the lunar south pole. The CI and FI for the DD configuration revealed a path loss exponent of 2.5378 and RMSE values of 45.15 dB and 43.898 dB, while the CI and FI for the OD configuration yielded a path loss exponent of 4.3280 and RMSE values of 6.301 dB and 66.739 dB, indicating strong sensitivity to the transmitter radiation pattern.
1. Introduction
The next generation of lunar missions aims not only to visit the Moon, but to sustain continuous surface operations where assets and human crews require reliable broadband connectivity over rugged terrain. It is an ambitious vision to imagine these possibilities on the Moon, creating a crucial gateway toward Mars and beyond [1]. It is essential to provide access to an infrastructure that allows space exploration, scientific research, technology testing and connectivity on the lunar surface. The LunaNet framework was designed to satisfy this requirement [2]. In addition, the focus of the framework is leveraging wireless network technology to improve communications and navigation on the lunar surface. This advancement necessitates the proposed 3GPP mobile telecommunications technology as part of the lunar surface networking architecture, harnessing the mature terrestrial ecosystem [3,4,5,6,7]. Furthermore, the implementation of 5G technology is expected to play a vital role in enabling sophisticated and reliable communications on the lunar surface. The importance of achieving reliable communication systems on the lunar surface cannot be overemphasized, as loss of signal coverage during critical operations could jeopardize mission safety and cause data loss, which is a core concern in deep-space missions [8]. Consequently, communication systems capable of withstanding the Moon’s unique challenges, including the irregular terrain and the electromagnetic properties of the regolith, are needed [8,9]. This requirement is even more stringent for future missions targeting the lunar south pole, where the terrain is especially complex and obstructed [8]. Realizing such systems demands a detailed understanding of how 3GPP radio signals interact with the lunar environment, including reflection, multipath propagation, and scattering from hills, crater walls, and regolith surfaces, despite the absence of an atmosphere [10].
Reliable link budget analysis has been part of the major tools for designing and understanding wireless communication networks and helps to determine cell coverage areas for safe successful communication [11,12]. In a wireless system, a link budget quantifies all gains and losses along a propagation path with large-scale path loss between the transmitting and receiving nodes. To estimate the path loss, wireless channel models are employed to characterize the propagation behavior of radio waves in a given environment, where large-scale path loss models form a key component for predicting signal attenuation between transceivers [13]. The lunar south pole environment exhibits topography and surface characteristics that differ [14,15] from those on Earth, with highly irregular and rugged terrain features like rough terrain, mountain hills, regolith, craters and no atmospheric effects. These unique conditions motivate the development of dedicated 5G path loss models for the Moon, and the evaluation of how well the terrestrial 5G NR channel-model framework can be adapted to the lunar south pole environment to ensure successful communication for future lunar missions.
Previous works have researched and presented different cases of wireless channel models for lunar environments, from the Apollo era to more recent 3D and analytic models [16,17,18,19,20,21,22,23]. Early analytic work by [17] provided one of the first reports on lunar surface transmission loss for Apollo astronauts, modeling astronaut-to-astronaut and astronaut-to-lander links over smooth and rough lunar terrain and combining smooth-sphere propagation with knife-edge diffraction from small hills to generate transmission loss curves validated against Apollo measurements. Building on such a foundational approach, Ref. [18] adapted the Longley–Rice irregular terrain model (ITM) for lunar applications by using digital elevation data from a lunar-analog desert and modifying model parameters to represent the characteristics of the lunar surface and the geometry in the 30 MHz, 401 MHz and 2.4 GHz frequency bands. Other studies [19,20] incorporated obstacle diffraction analysis for lunar path loss prediction to capture the terrain-induced propagation effects.
The Analytical Propagation Approximation over Variable Terrain (APA) was proposed in [21] as a fast, site-specific method for predicting radio signals in lunar environments. This approach used fitted parabolic terrain profiles and Airy-function solutions to capture large-scale variations. While APA accounts for irregular terrain geometry, it does not explicitly model reflections, multipath propagation or detailed electromagnetic properties of the lunar regolith. The authors in [22] developed a radio-frequency model framework for a wireless sensor network on the lunar surface, using high-resolution digital elevation models to evaluate coverage, guide node deployment, and assess connectivity between the sensor nodes and cluster heads in cratered regions near the lunar south pole. In [23], a radio propagation model that is site-specific for coordinating lunar micro-rovers was reported. The authors generated received signal strength (RSSI) and path loss maps from digital elevation data of an Apollo 15 mission landing site to support multi-rover path planning that maintains reliable connectivity among low-height rovers. Nonetheless, most existing lunar propagation models were not developed within the 3GPP lunar 5G designated frequency bands for wireless telecommunication [3]. The summary of the aforementioned related articles findings are presented in Table 1.
Table 1.
Related studies.
This paper focuses on the mathematical development of a large-scale 5G path loss model tailored to the 3GPP cellular frequency band proposed for lunar surface wireless and network communications. In addition, the impact of receiver antenna choice on the predicted path loss is evaluated using standard error metrics. Thus, the study aims to build a deterministic large-scale 5G path loss model based on 3D ray tracing and formulate a generic path loss model at 5.855 GHz that represents the Shoemaker Rim F location on the lunar south pole. The second objective is to study the large-scale path loss characteristics of the Shoemaker Rim F location at 5.855 GHz under five different propagation scenarios. The third objective is to perform standard error analysis on the mathematically developed predicted models by comparing them with the 3D ray tracing simulated data. Finally, the fourth objective is to determine the impact of the receiver antenna choice used during the simulation on the lunar south pole.
2. Materials and Methods
2.1. Model Development Approach on Lunar Surface
This section provides information on the simulation location, the software used, and the parameters considered in the study.
2.1.1. Research Location and Attributes
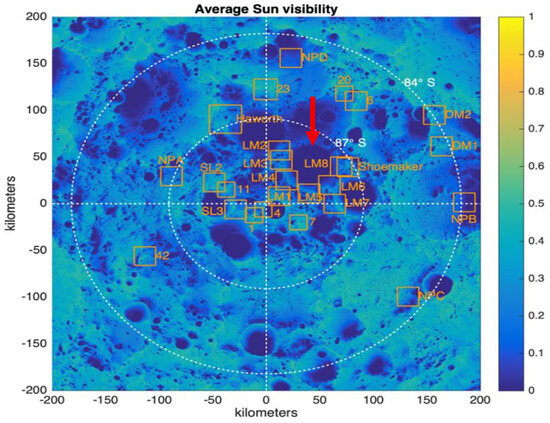
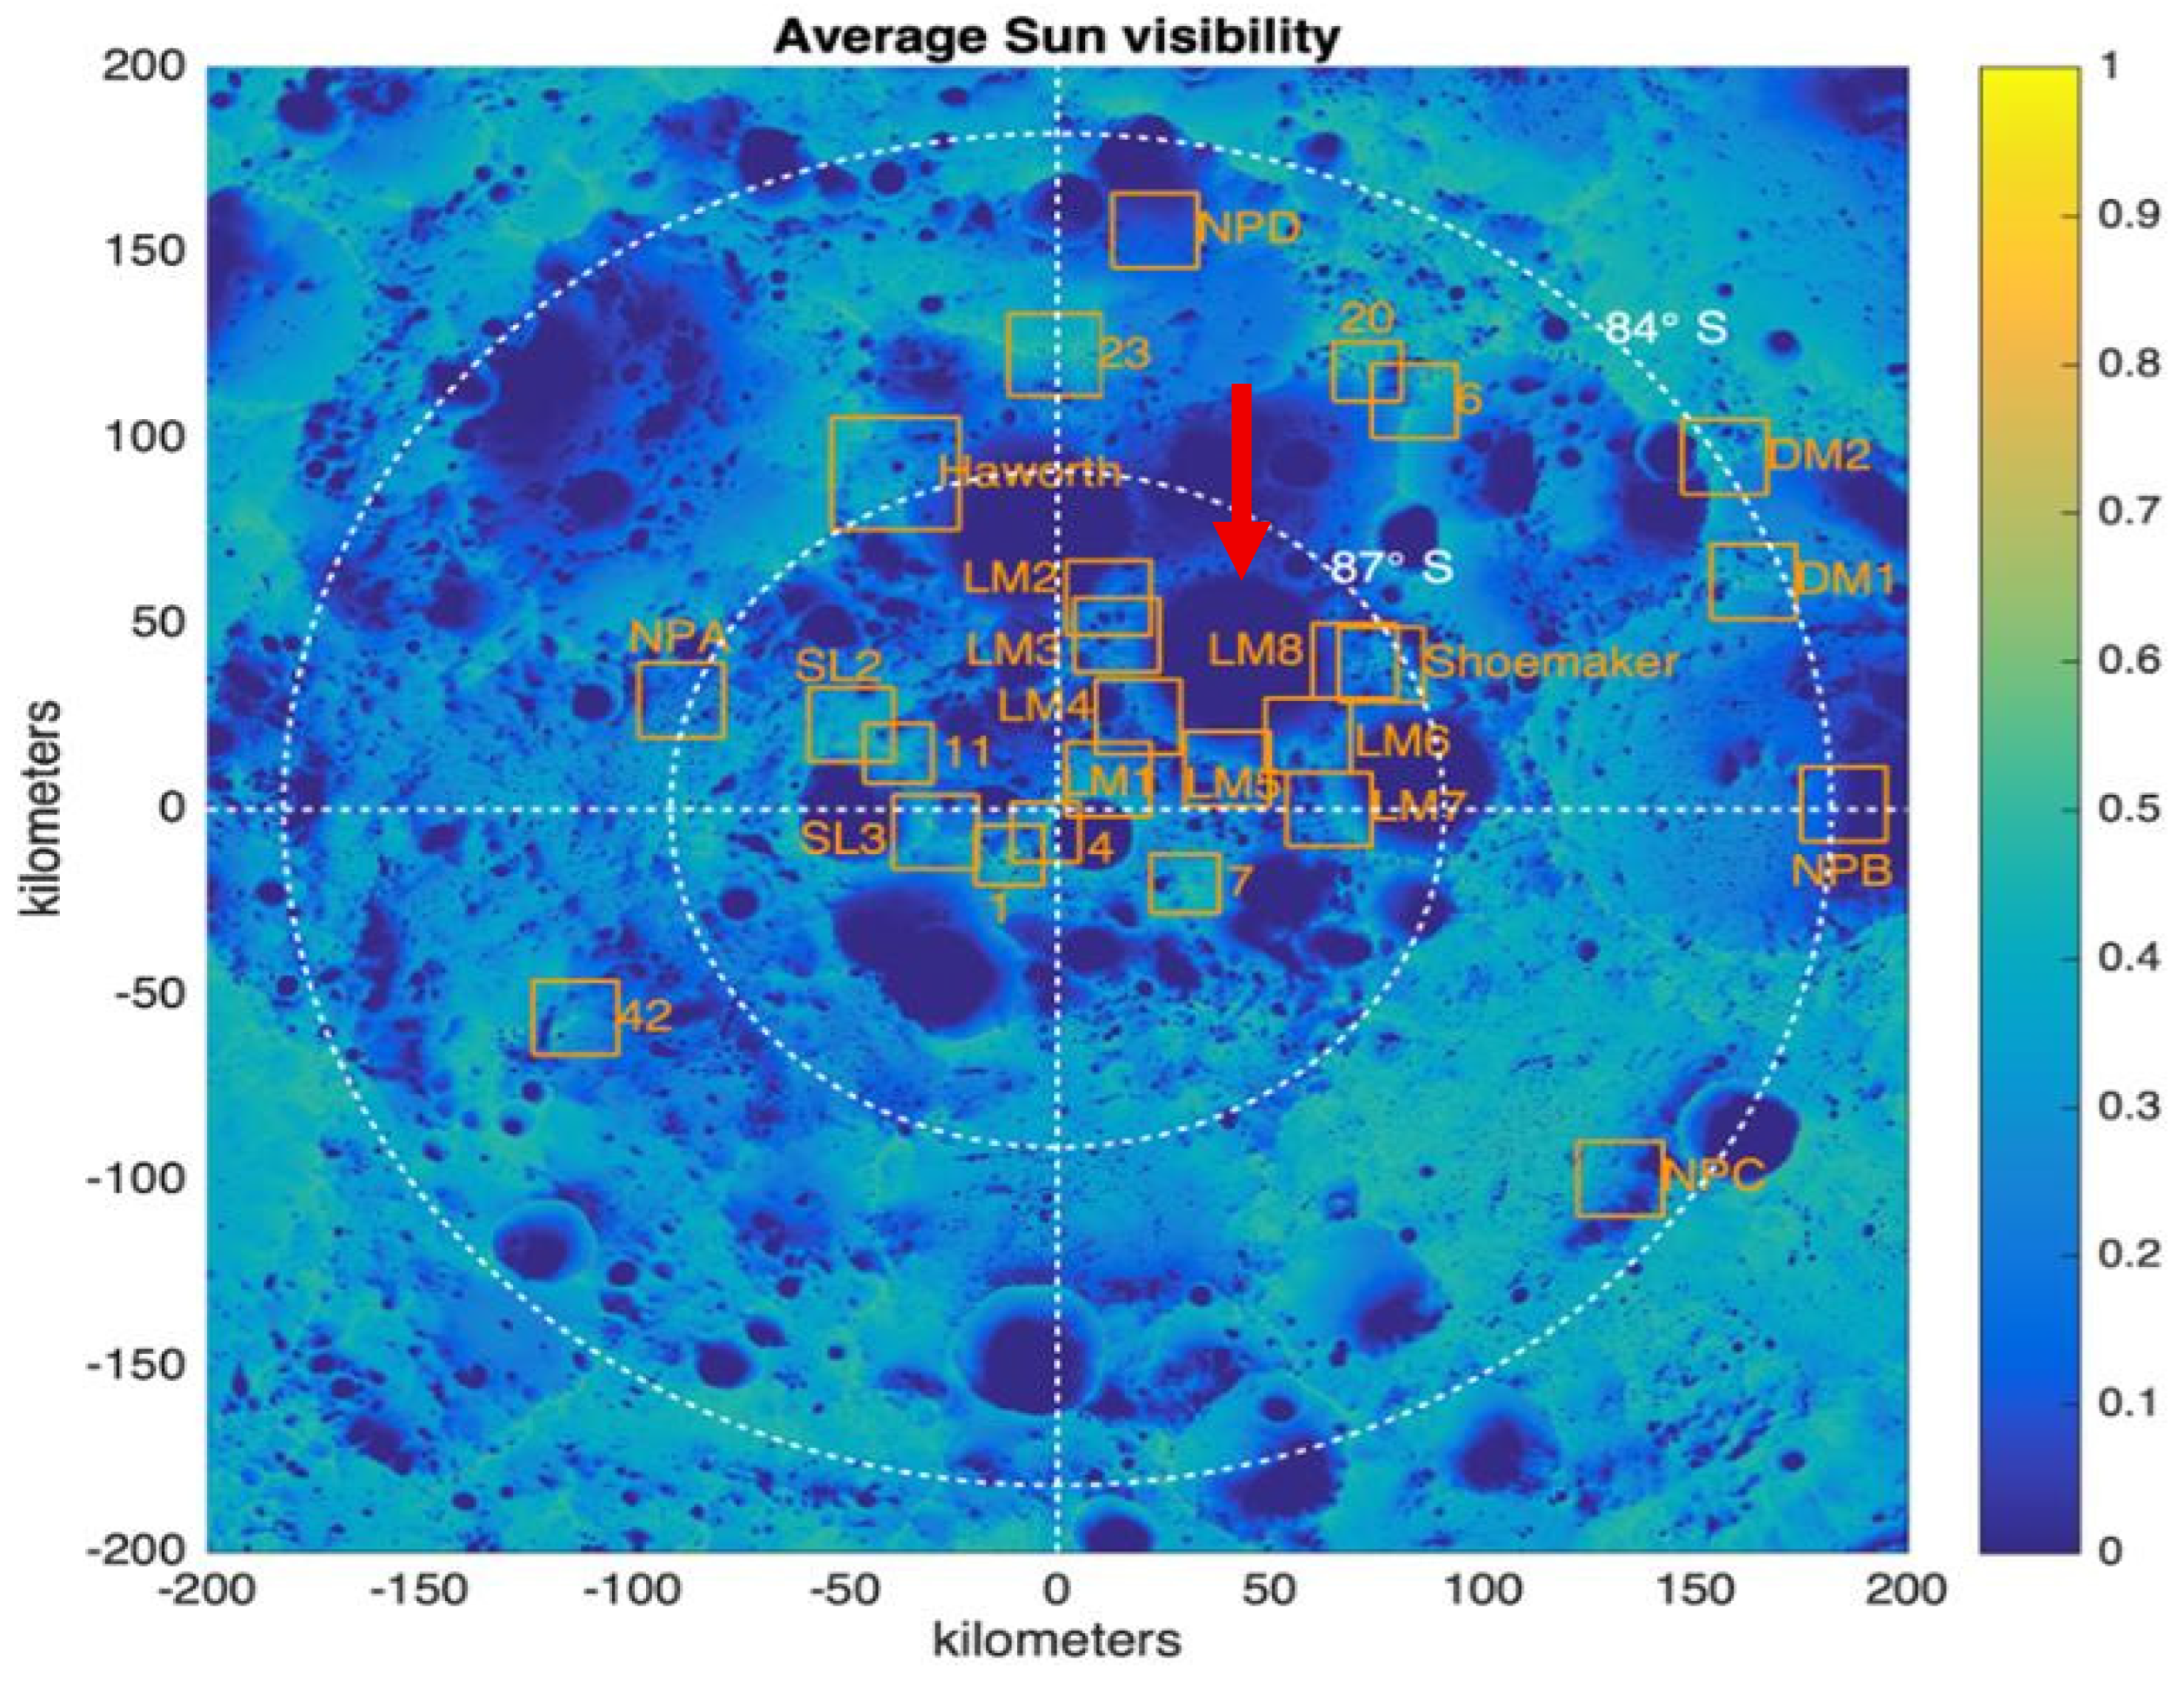
This study was carried out in the Shoemaker Rim F region (LM8) at the lunar south pole on the Moon. The Shoemaker area is part of a highly extreme environment, as the south pole is characterized by permanently shadowed craters and surrounding hills and mountains [24]. Many of these craters are believed to contain deposits of water ice, which makes the region both scientifically valuable and important for future exploration. For this work, a 5 m/pixel LOLA digital elevation model derived from LRO laser altimetry was used for the underlying topography. The LDEM map provides geodetically controlled elevations with typical vertical RMS height errors of approximately 0.3–0.5 m and slope uncertainties of approximately 1.5–2.5 degrees, which enables a realistic representation of the steep crater rim and adjacent ridges at Shoemaker Rim F [25]. In Table 2, the configuration parameters for the study are presented, while Figure 1 presents the map for the research location.
Table 2.
Model configuration variables.
Figure 1.
Representation of LOLA topography for lunar south pole sites [24].
2.1.2. Data Collection and Modeling Technique
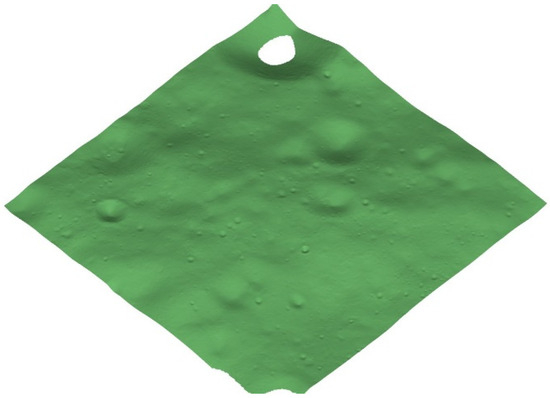
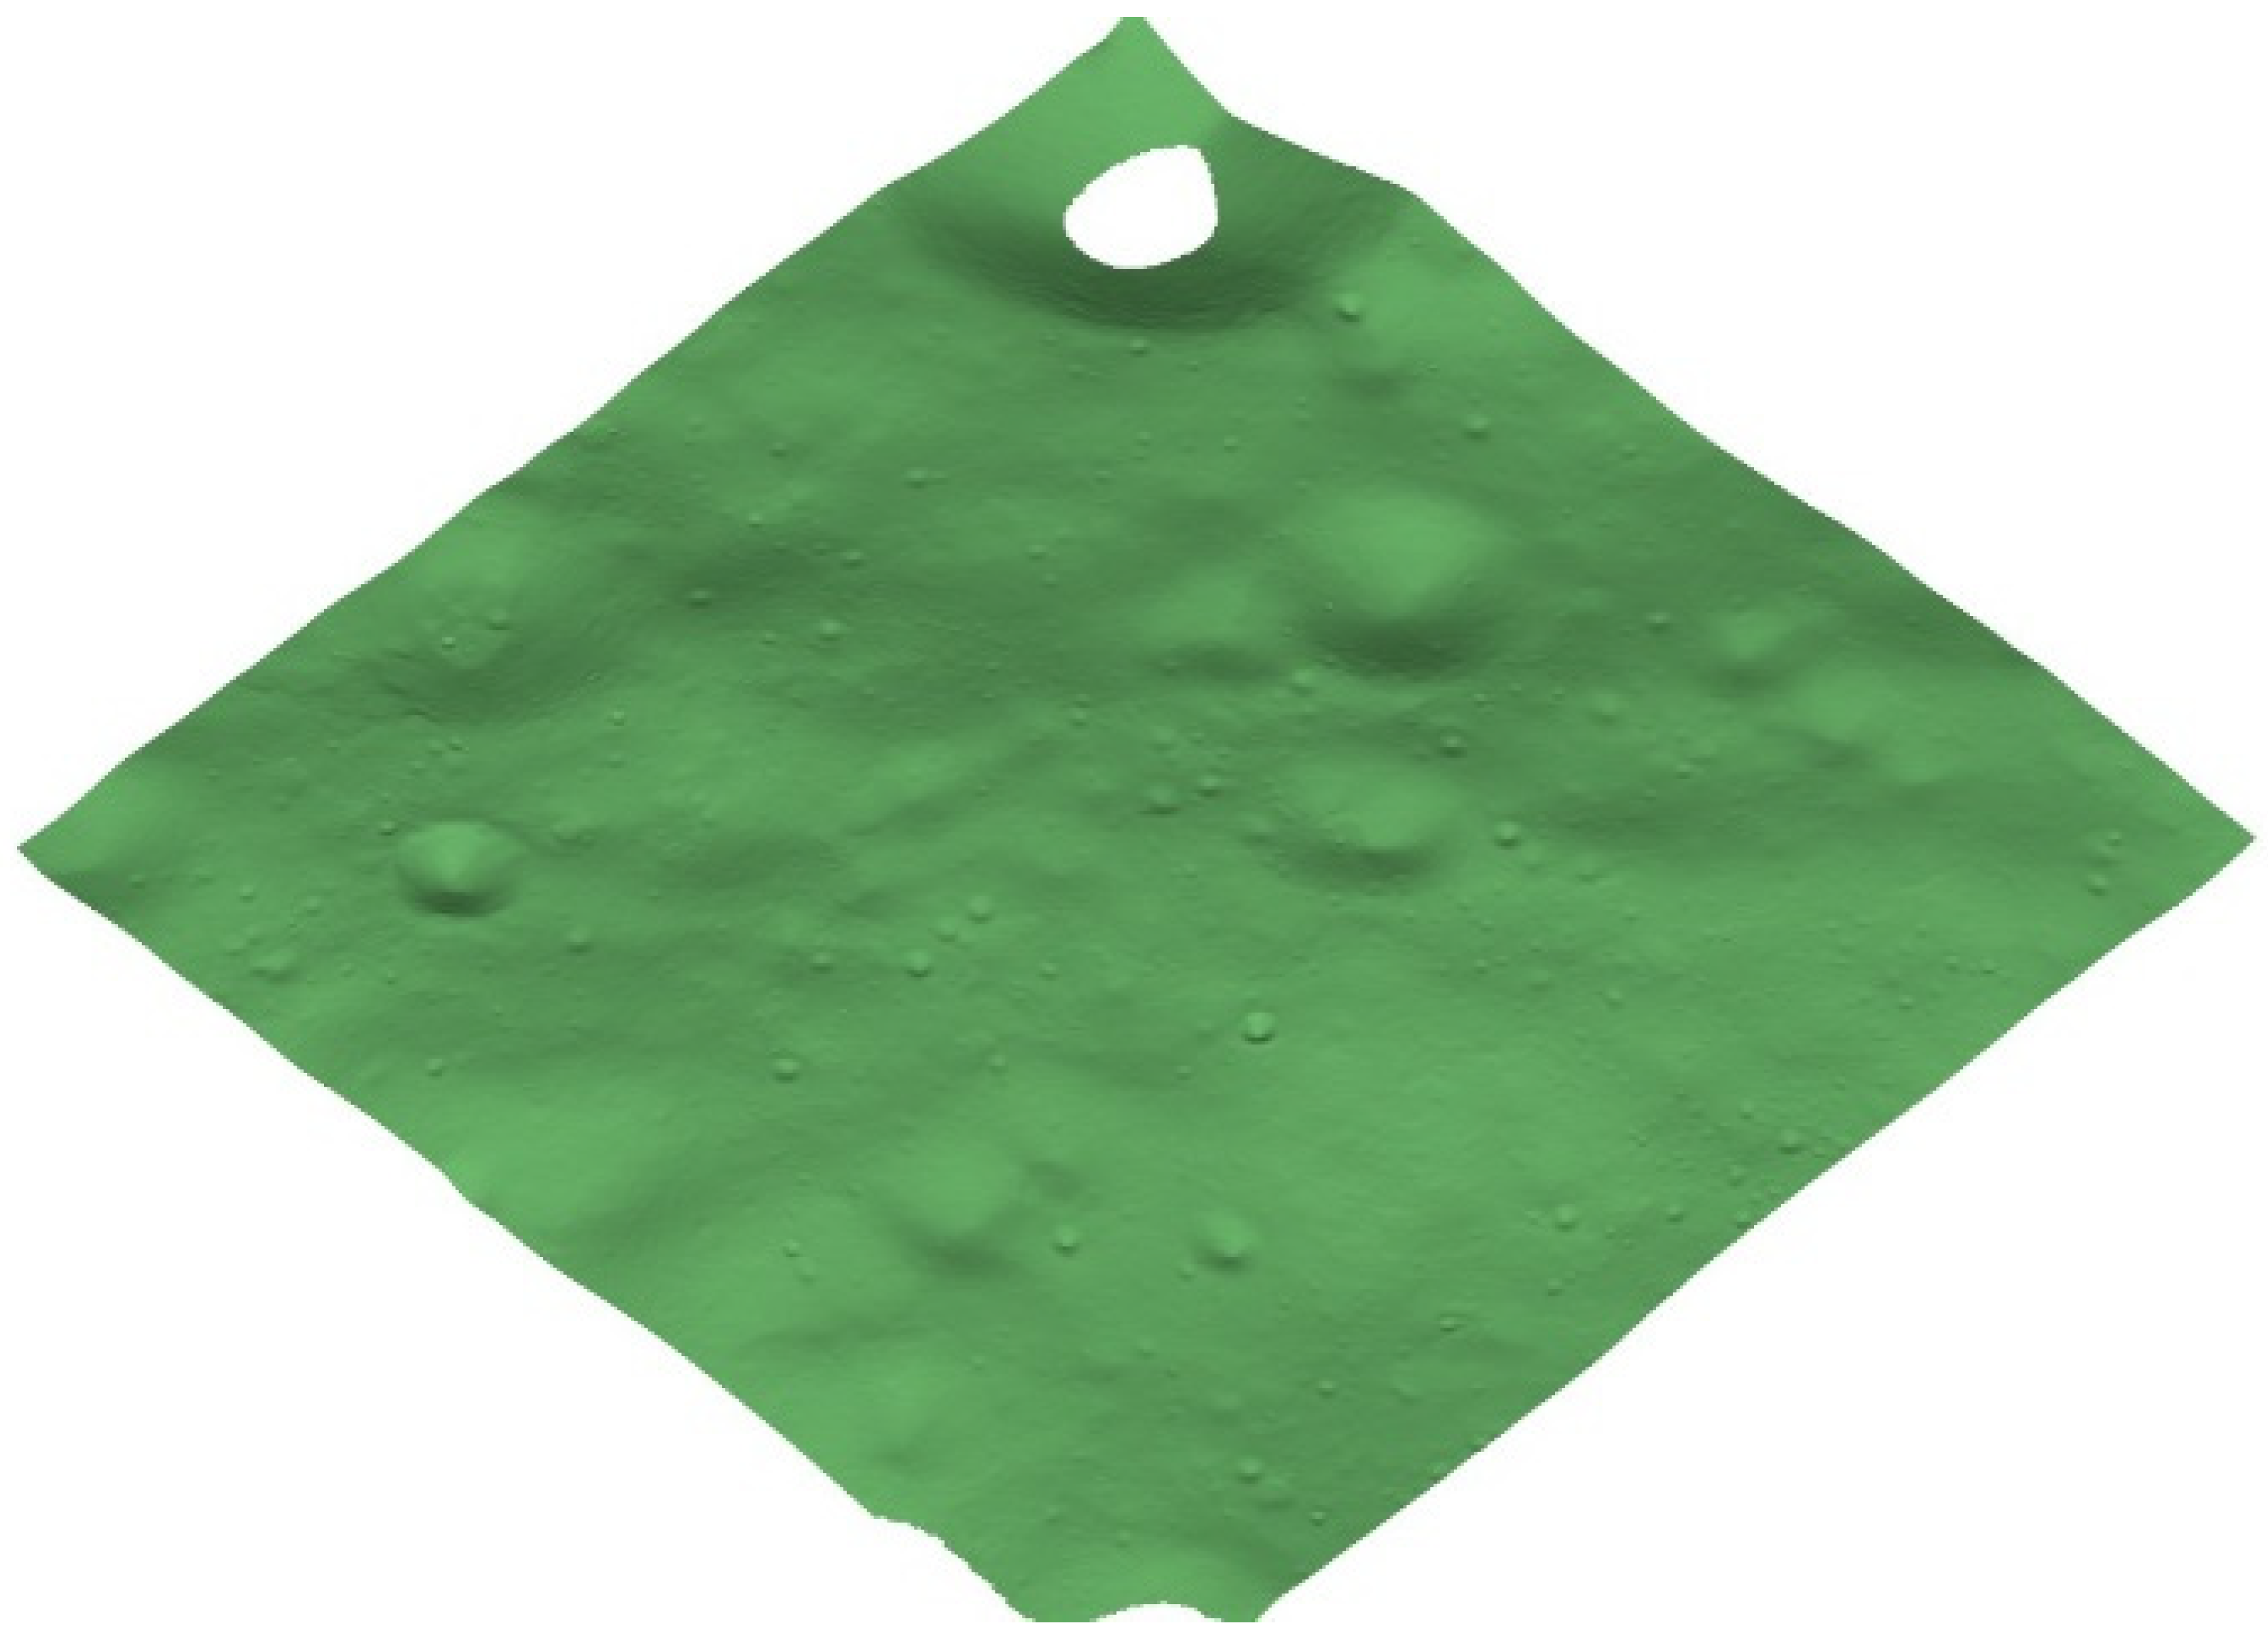
In this study, two simulation configurations were considered. The Shoemaker Rim F LDEM map as shown in Figure 2, was imported into Wireless Insite (WI), which supports frequencies from 50 MHz to 100 GHz and employs high-frequency electromagnetic methods for accurate ray tracing simulations [26].The LDEM map captures the characteristics of the lunar surface, such as mountains, hills, crater rims, and regolith. Within this domain, a 5.855 GHz base station transmitter was placed on the rim crest at a height of 50 m, and a grid of 8624 receivers, each at 3 m height, was distributed across a 2 km by 2 km area covering the surface and the surrounding slopes to capture both line-of-sight (LOS) and non-line-of-sight (NLOS) propagation. The first simulation configuration involves the transmitter (TX) antenna and the receiver (RX) antenna, which were modeled as half-wave dipole antennas, while in the second simulation, the transmitter antenna was modeled as an omnidirectional antenna while the receiver antenna remained a half-wave dipole, with the transmitter position kept identical in both scenarios.
Figure 2.
Shoemaker Rim F LDEM map on the lunar south pole.
The dipole and omni simulation scenarios were configured with vertical polarization at both the transmitter and the receiver (co-polar). Therefore, the reported path loss corresponds to co-polar received power under aligned antenna polarizations. It is evident that reflections and diffraction from the lunar south pole’s rugged cratered terrain can introduce depolarization, generating cross-polarized components, but this study does not report that effect because the terrain-induced polarization conversion is implicitly absorbed into the effective received power predicted by the ray tracing solution under the co-polarization settings. Consequently, the observed dipole-to-omni differences are interpreted primarily as antenna-pattern-to-terrain interaction effects rather than as an explicitly quantified polarization mismatch loss. Additionally, the omnidirectional pattern used in this study is modeled using Wireless Insite’s built-in realizable antenna with vertical polarization. In order to avoid any gain reference ambiguity, all antenna gains used in the simulations are interpreted on a consistent dBi basis within the ray tracing framework, and the path loss values correspond to the received power predictions under the specified antenna patterns.
The Shoemaker Rim F lunar surface was represented as a dry, well-graded silty sand regolith, with bulk density, permittivity and conductivity values derived from Apollo era measurements [27] and implemented through a customized dielectric half-space material consistent with the ITU dry Earth formulations present in Wireless Insite (WI). In this study, the regolith’s dielectric properties (permittivity and conductivity) were held fixed to isolate and quantify the impact of terrain geometry on the developed CI/FI large-scale parameters. Lunar regolith properties can vary with location and depth, and such variability can influence reflection/diffraction strength and thus the effective path loss. An extension of this study could be a sensitivity varying analysis (two to four) to further study the impact on model development. The X3D ray tracing engine in WI was configured with the APG acceleration method, allowing up to two diffractions and six reflections. The Wireless Insite version used was the v3.4.4.4.The simulation was executed on a system equipped with an Intel Core™ i7-10700 CPU at 2.90 GHz (eight cores, 16 logical processors) and an NVIDIA Quadro P2200 GPU, running on Windows 11 Pro. From the simulation, five path loss dataset scenarios were extracted in a text file format, which was later converted to a CSV file (excess path loss with and without antenna patterns, free space path loss with and without antenna patterns, and the total path loss), along with received power, transmission loss and throughput. Python programming version 3.14.2 and MATLAB 2024a version 24.2 was used for data processing, mathematical model development and model fitting and standard error analysis. Figure 3 summarizes the main simulation procedures and workflow.
2.1.3. Description of Path Loss Data
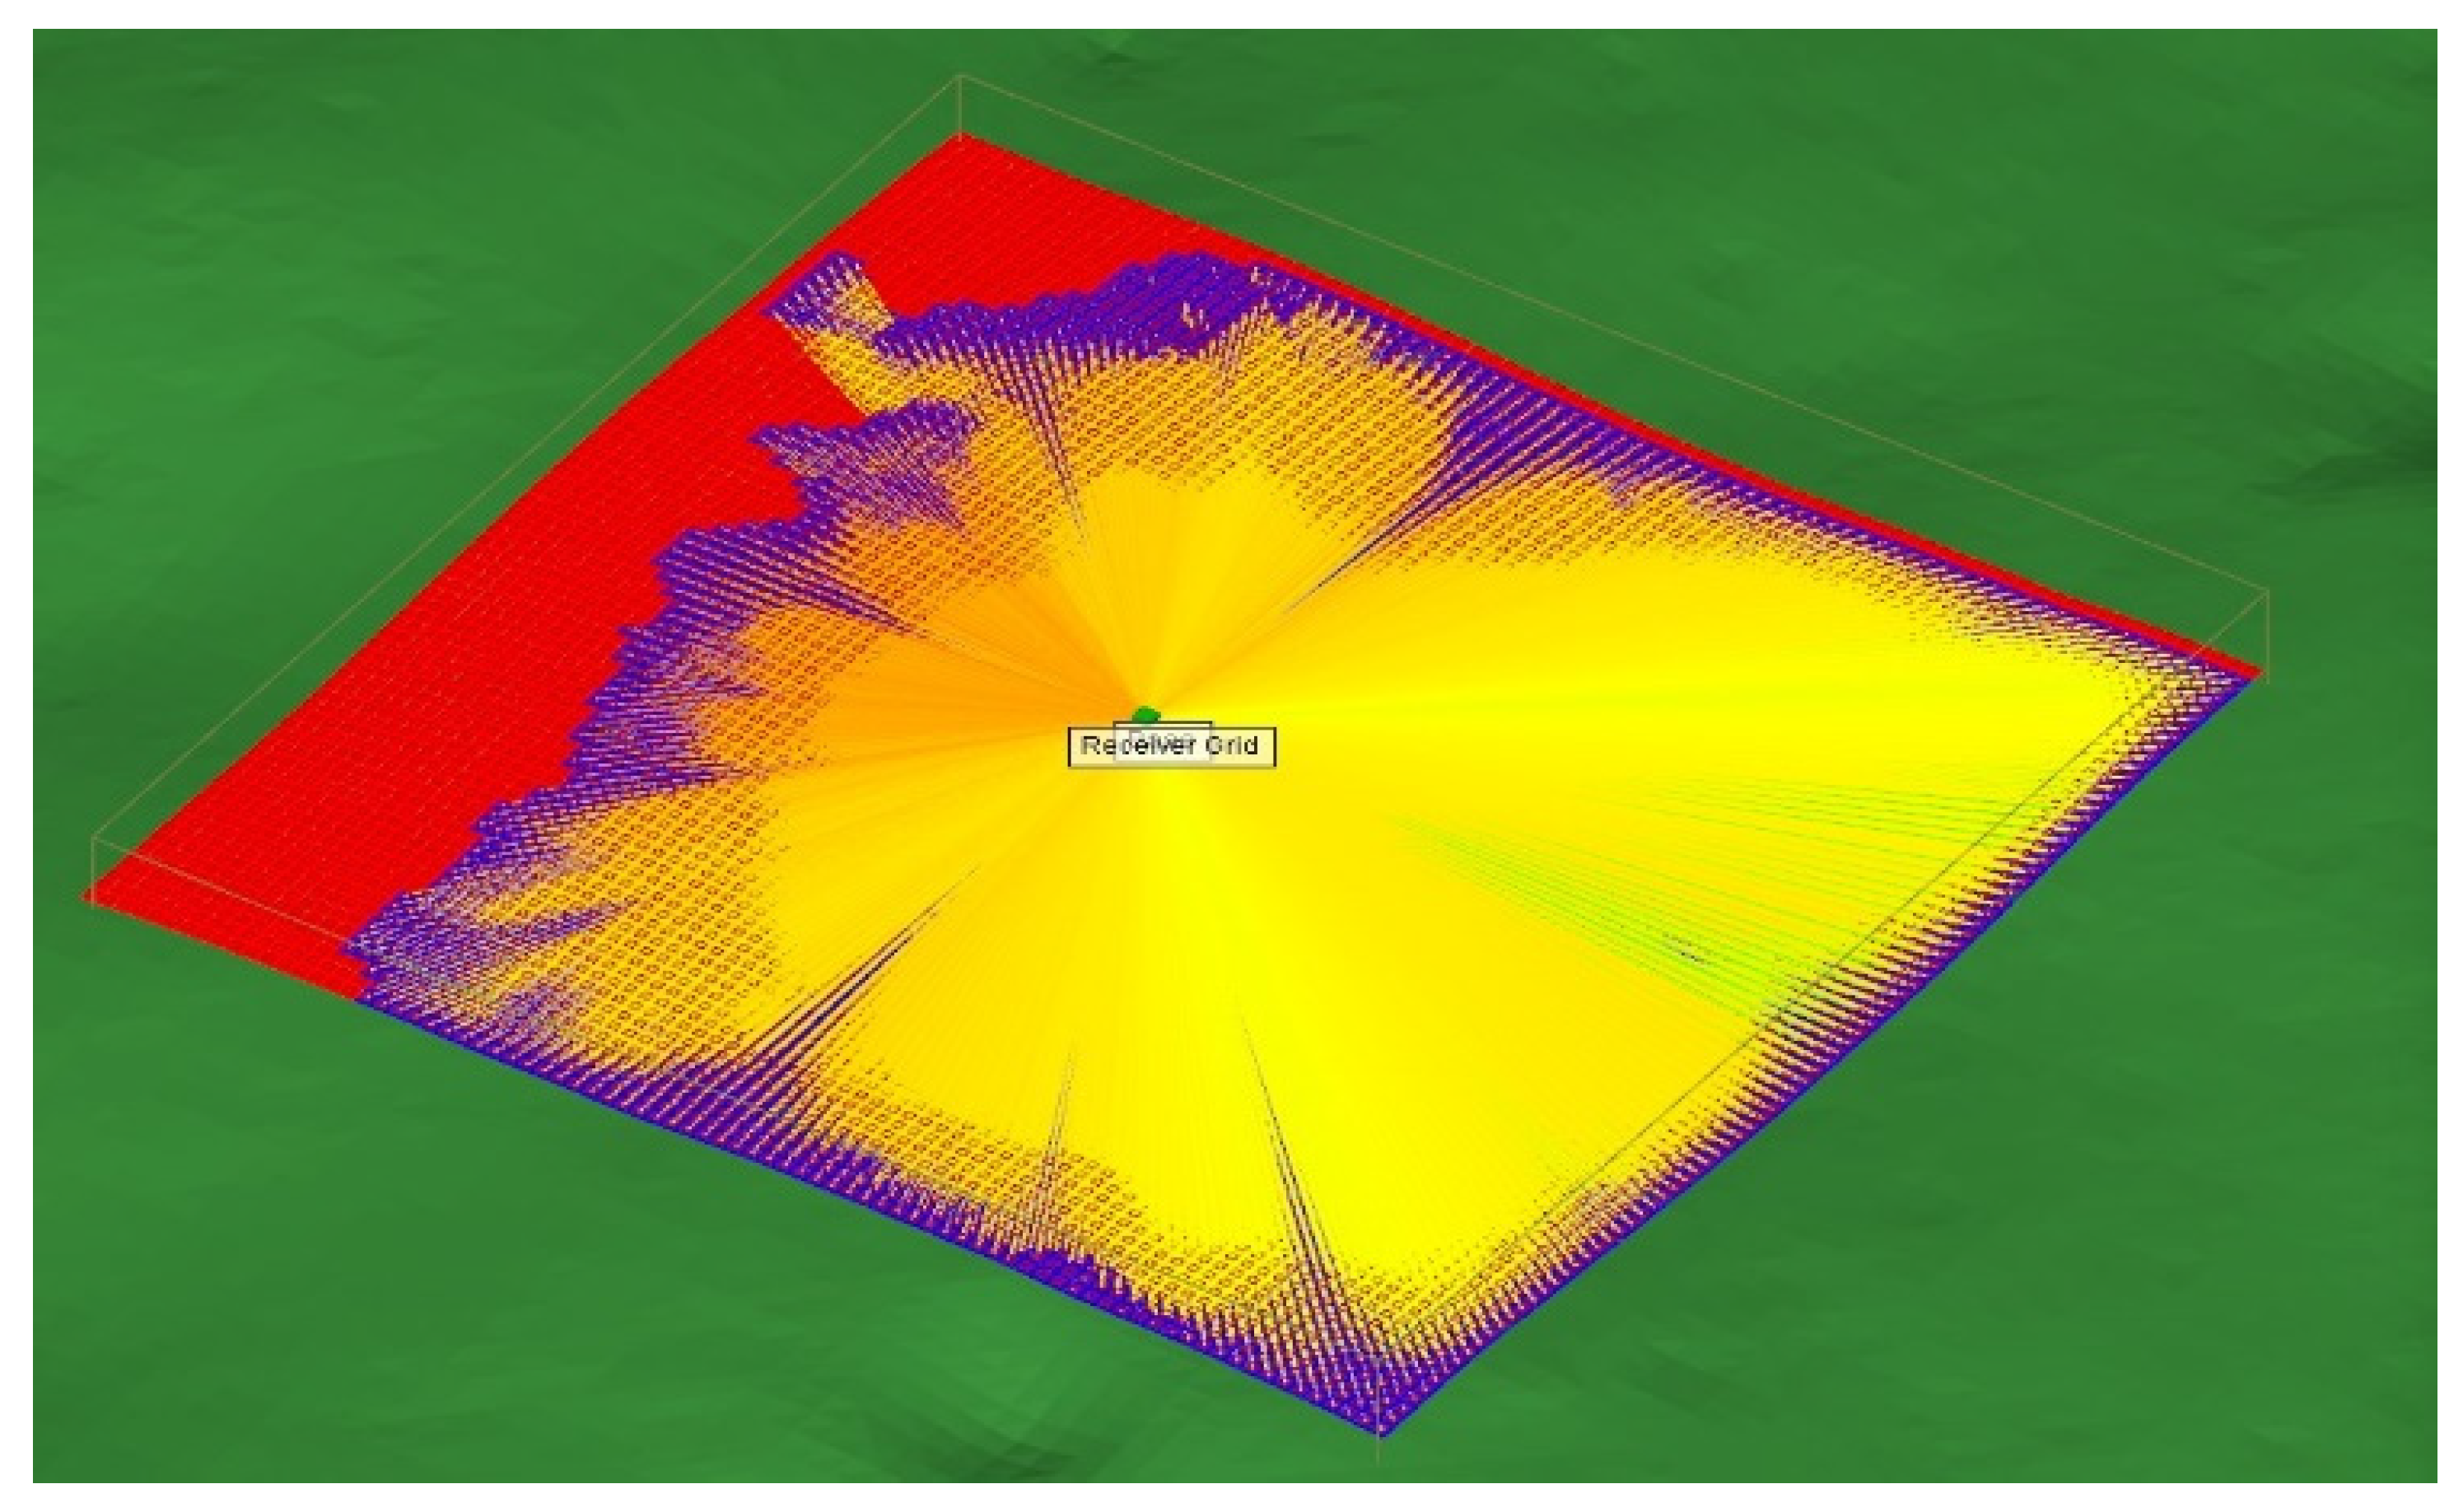
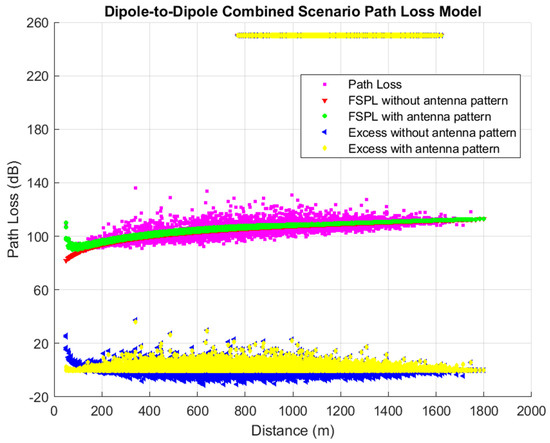
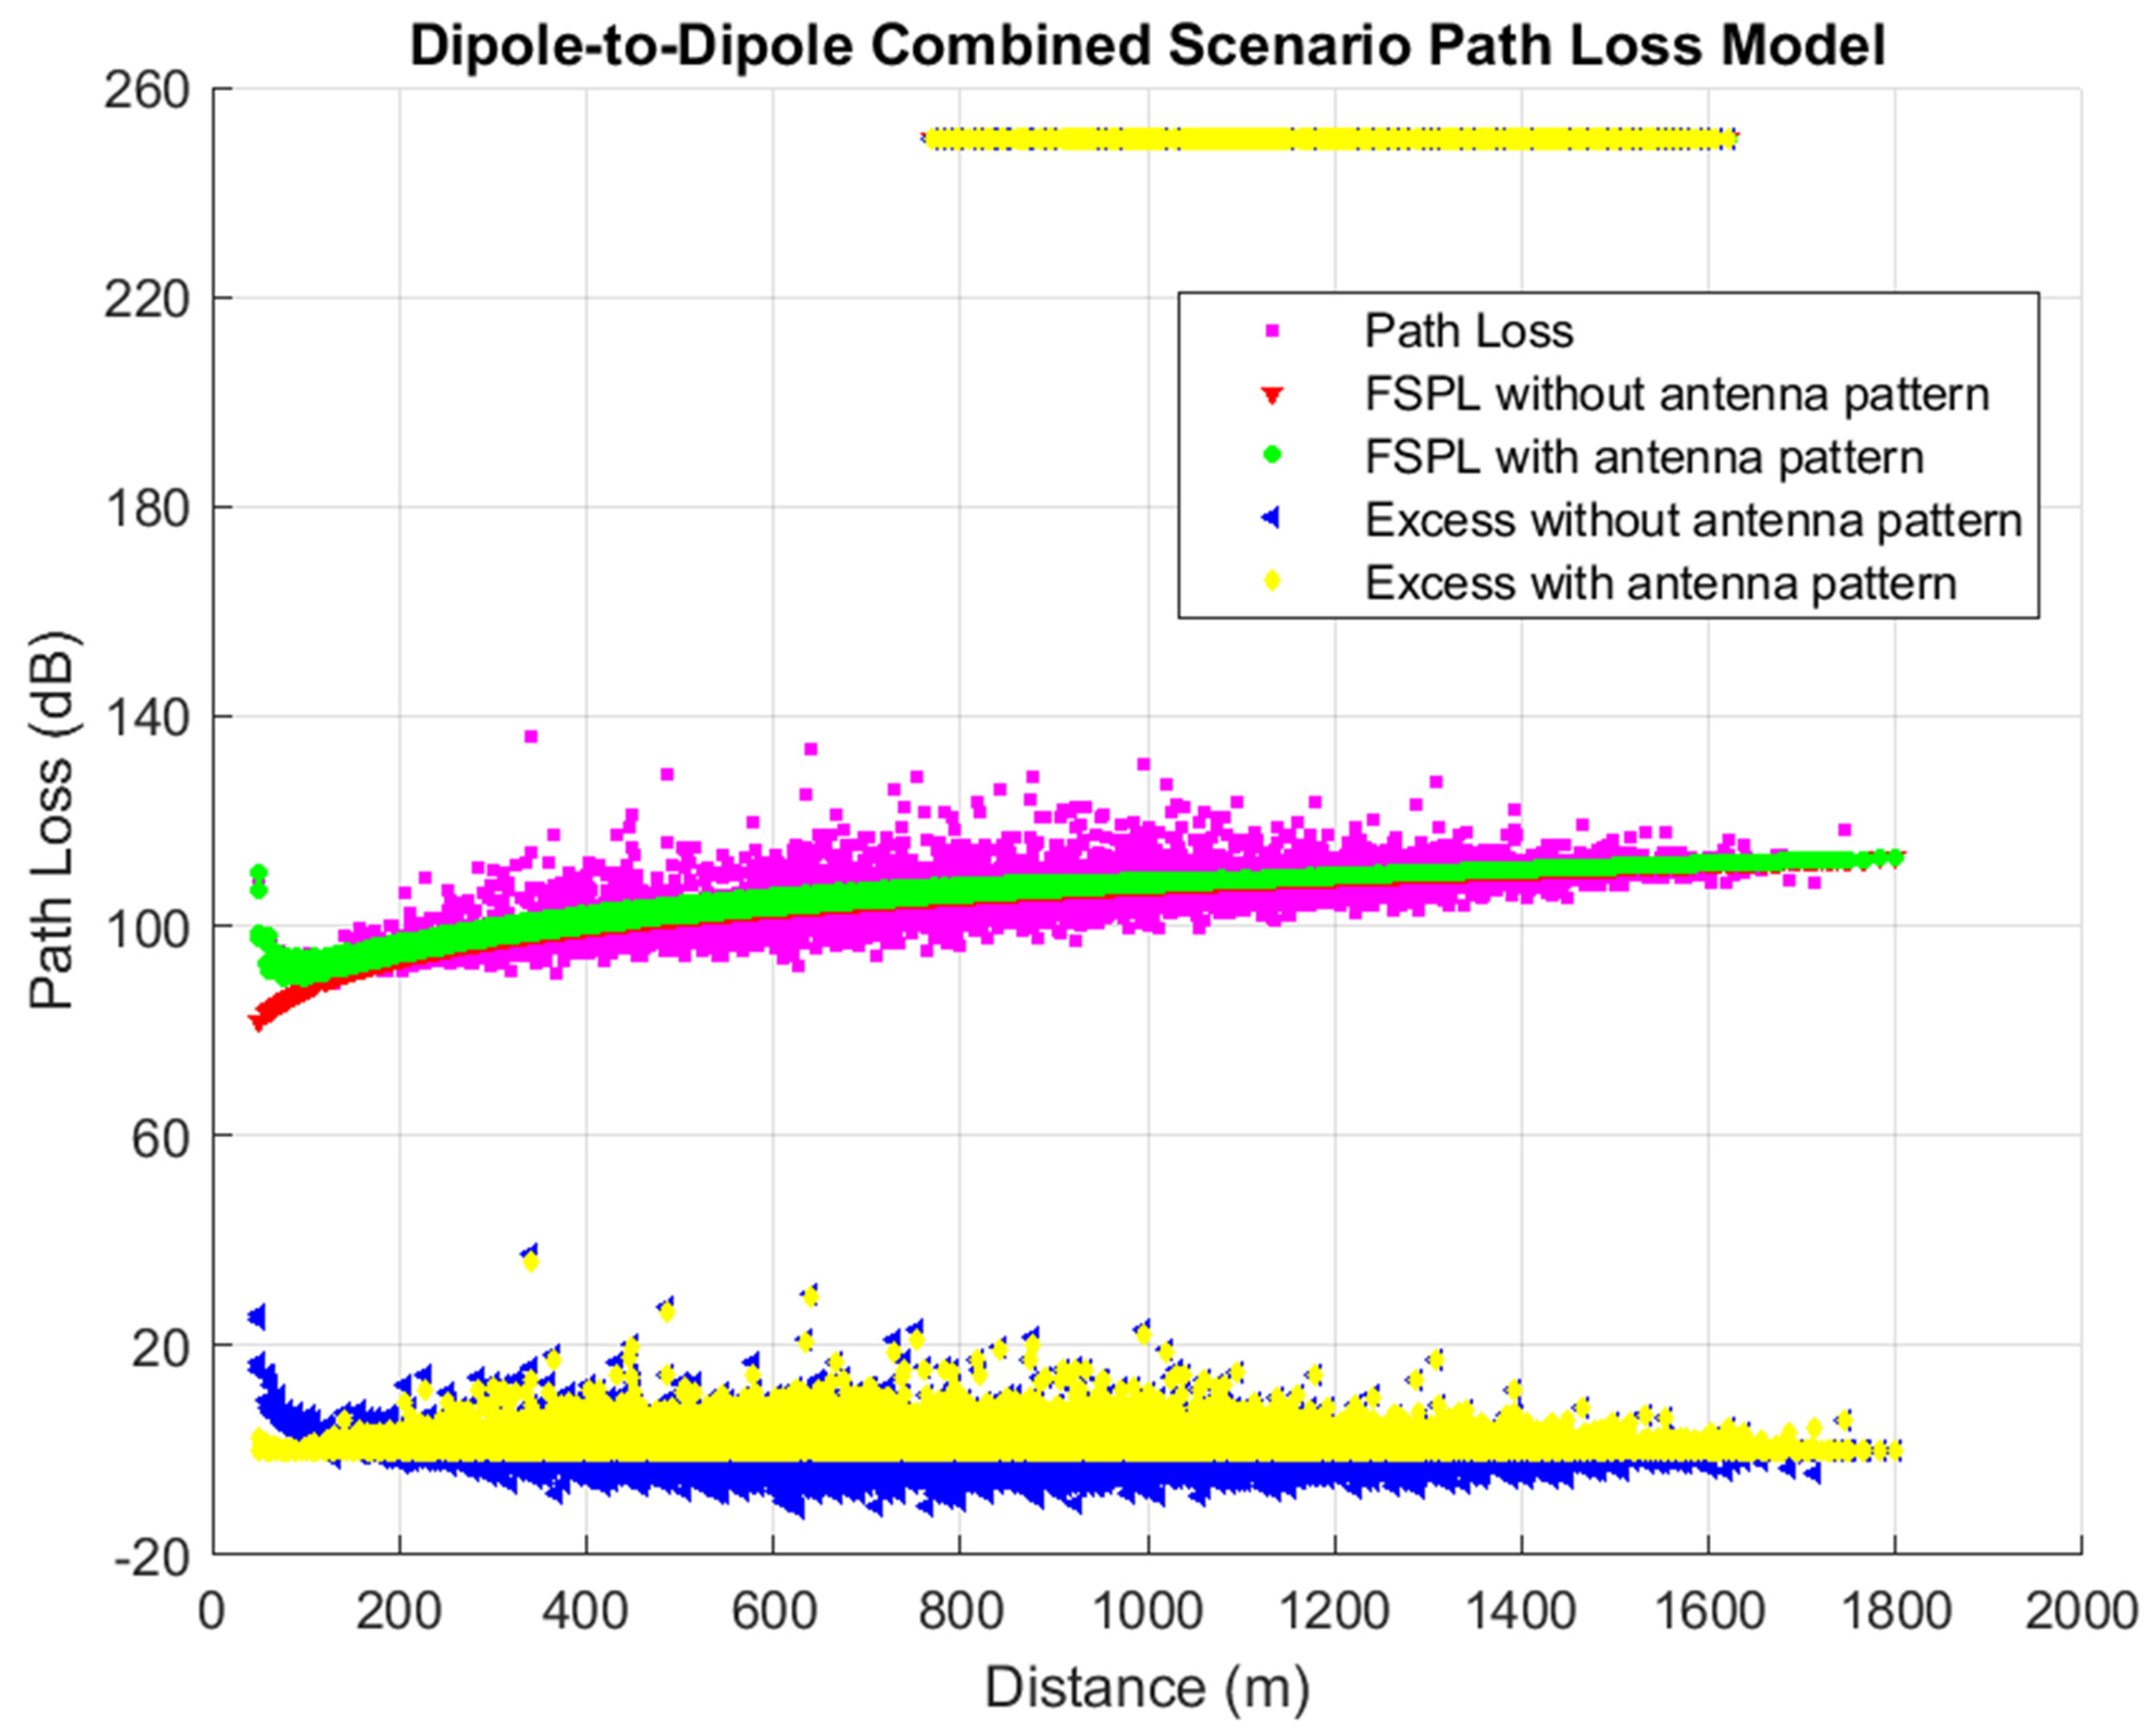
The characteristics of the measurement data obtained from the 3D ray tracing simulation explain the principles of location bias and censored data. The simulation parameters for the Wireless Insite ray tracing, as shown in Table 2, are modeled by reflection, diffraction and penetration based on geometric optics and the uniform theory of diffraction (UTD) [26]. For locations on the XY grid, the path loss value of 250 dB depicts that the loss values are not available as shown in Figure 4, i.e., the value of the data at that receiver point is censored, as referenced in [28]. For the first simulation, 91.26% of the data were uncensored while 8.74% of the data were reported to be censored. The second simulation, in which the RX antenna is an omnidirectional antenna reported a censored data percentage of 28.49% and an uncensored data percentage of 71.51%. A sample of the measurement data is shown in Table 3.
Table 3.
Measurement data point sample from Shoemaker Rim F location.
2.2. Large-Scale Path Loss Model Analysis for 5G
Path loss is postulated as the reduction in signal power as it propagates between two transceiver points [29]. Mathematically,
The free space path loss represents the attenuation of power between transceivers and is expressed as a non-negative quantity, whereas the path gain corresponds to a negative value of that path loss.
is the power transmitted out by the transmitter antenna and is the received power at the receiver antenna, represent the gain of the transmitting and receiving antennas, is the signal wavelength and is the distance between the transmitter and receiver.
Figure 3.
Diagram illustrating simulation steps.
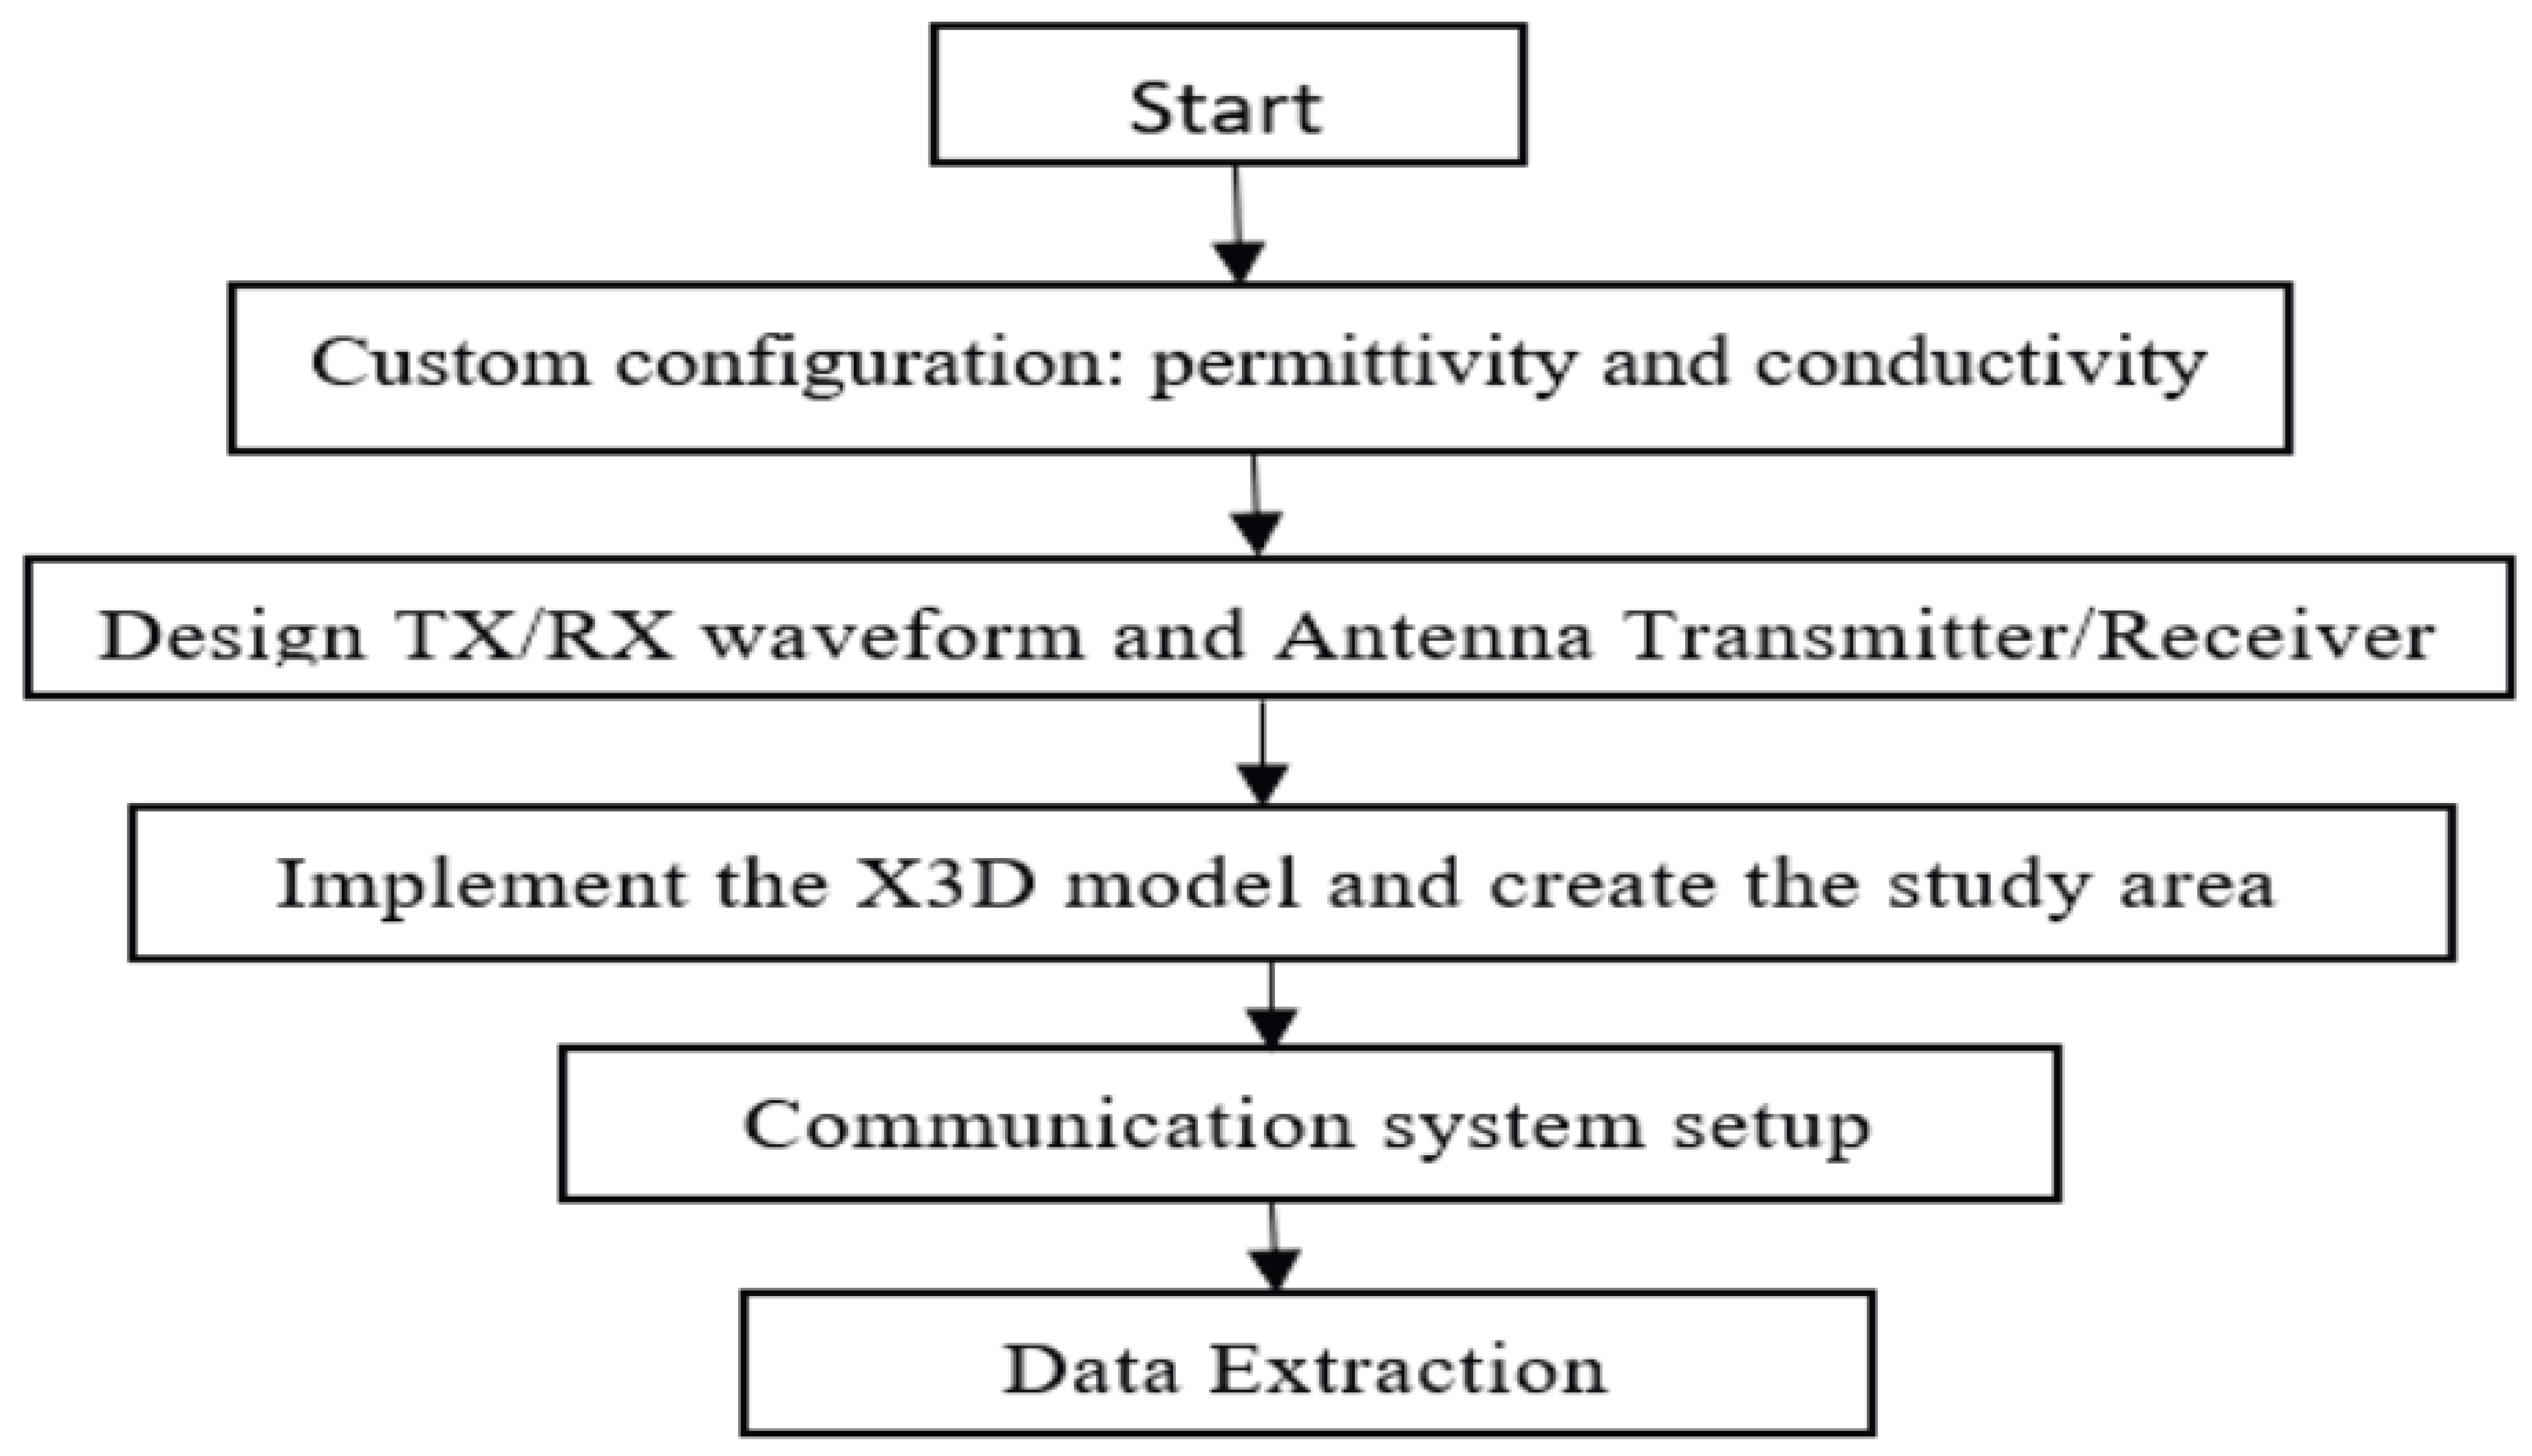
Figure 4.
Propagation paths and areas with no signals.
In a communication system design where the antenna pattern is explicitly included, the free space path loss with antenna patterns is obtained mathematically as shown below; this assumes that the transmitter and receiver antenna polarization have a perfect match.
For FSPL without antenna patterns, this is when the antenna pattern is not considered; rather, an isotropic antenna pattern is assumed; thus, this simplifies to
where is the free space path loss with and without the antenna patterns. Additionally, the excess path loss with antenna patterns and without antenna patterns is the measure of the loss above that, due to the free space losses, which is written as
Similarly, the excess path loss without antenna patterns (dB) quantifies the additional attenuation beyond the corresponding free space loss (without antenna patterns) and is given by
Equation (7) is an expression for a log-distance large-scale PL model for any given transmitter spacing and expressed as
where represents the slope and denotes the intercept.
Also, Equation (8) can be expressed in its generic form,
where PL is the path loss in dB at point d, represents the reference distance, and is the path loss exponent (PLE).
Equation (8) can be re-written to include the factor of the shadowing effect to fully show the path loss equation at reference distance .
where (dB) is the normally distributed random variable, with zero mean and standard deviation in dB representing the shadowing factor in the environment [10,29]. In addition, shadowing represents the random large-scale variation in a distance-dependent path loss model. It is an important parameter that is needed to model large-scale fading for a given environment. Shadow fading is typically modeled as a log-normal random variable around distance-dependent mean path loss. Thus, the path loss can also be expressed as
where represents the mean path loss over distances in dB, is the average FI in dB and is the slope and corresponds to the path loss exponent (n), and is the TX-TR separation distance.
The shadow factor can be derived from Equations (9) and (10) as
The standard deviation (dB) of the path loss models is calculated as
denotes the th path loss value of the whole measured dataset as a distance-dependent variable.
Furthermore, Equations (1)–(12), together with the close-in (CI) and floating intercept (FI) models [4,30] as expressed in Equations (16) and (17), were implemented in Python programming version 3.14.2 and MATLAB 2024a version 24.2 to perform the regression fitting and extract the path loss exponent, standard deviation, and CI/FI parameters and for the proposed sub-6-GHz 5G large-scale path loss model in the lunar south pole region on the Moon.
2.3. Developed Model Accuracy Evaluation for Large-Scale Path Loss
To evaluate the accuracy of the developed mathematical model, statistical error analysis for each scenario was calculated utilizing the Standard Deviation Error (SDE), Root Mean Square Error (RMSE) and Mean Absolute Error (MAE) as reported in the following equations:
where represents the simulated path loss measurement, while denotes the predicted path loss data using the CI and FI path loss models.
3. Results and Discussion
The large-scale path loss for sub-6 GHz between the transmitter and the receiver at Shoemaker Rim F on the lunar south pole is modeled as a function of distance using the log-distance path loss exponent . Terrestrial values for depend strongly on the type of environment: an urban, suburban, or obstructed environment. It has been established that values range between 2.7 and 3.7 for urban, 3 and 5 for suburban and 4 and 6 for obstructed indoor environments [28]. For LOS at 5.85 GHz, the path loss exponent was reported to be 2.2, while for NLOS it was about 4.2 for obstructed environments [31]. In contrast to the environmental conditions, the Shoemaker Rim F region is characterized by craters and regolith, amongst others, with the absence of atmosphere rather than dense building clutter. In this study, from the CI and FI fits to the ray tracing data, the resulting path loss exponent for the five path loss scenarios ranges between −0.56 and 2.5 for the half-wave dipole to half-wave dipole model development, while ranges between 2.5 and 4.3 with the omnidirectional transmitter antenna station and the half-wave dipole as the receiver antenna. Although the terrain is unchanged for the experiment, the path loss exponent differs between the DD and OD cases because the TX radiation pattern changes the angular weighting of energy launched into the cratered terrain, which changes the relative contributions of direct, reflected and diffracted components received across the receiver grid.
3.1. Measured Path Loss Evaluation
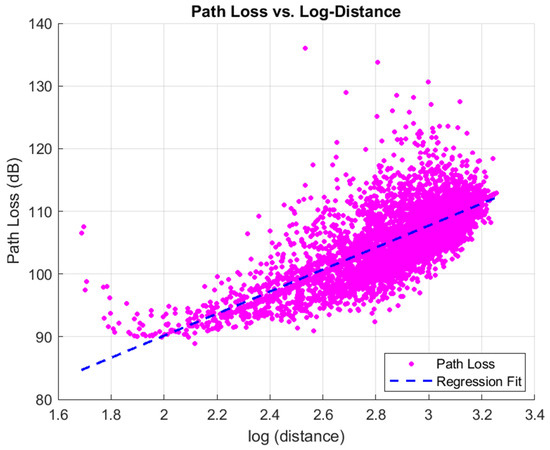
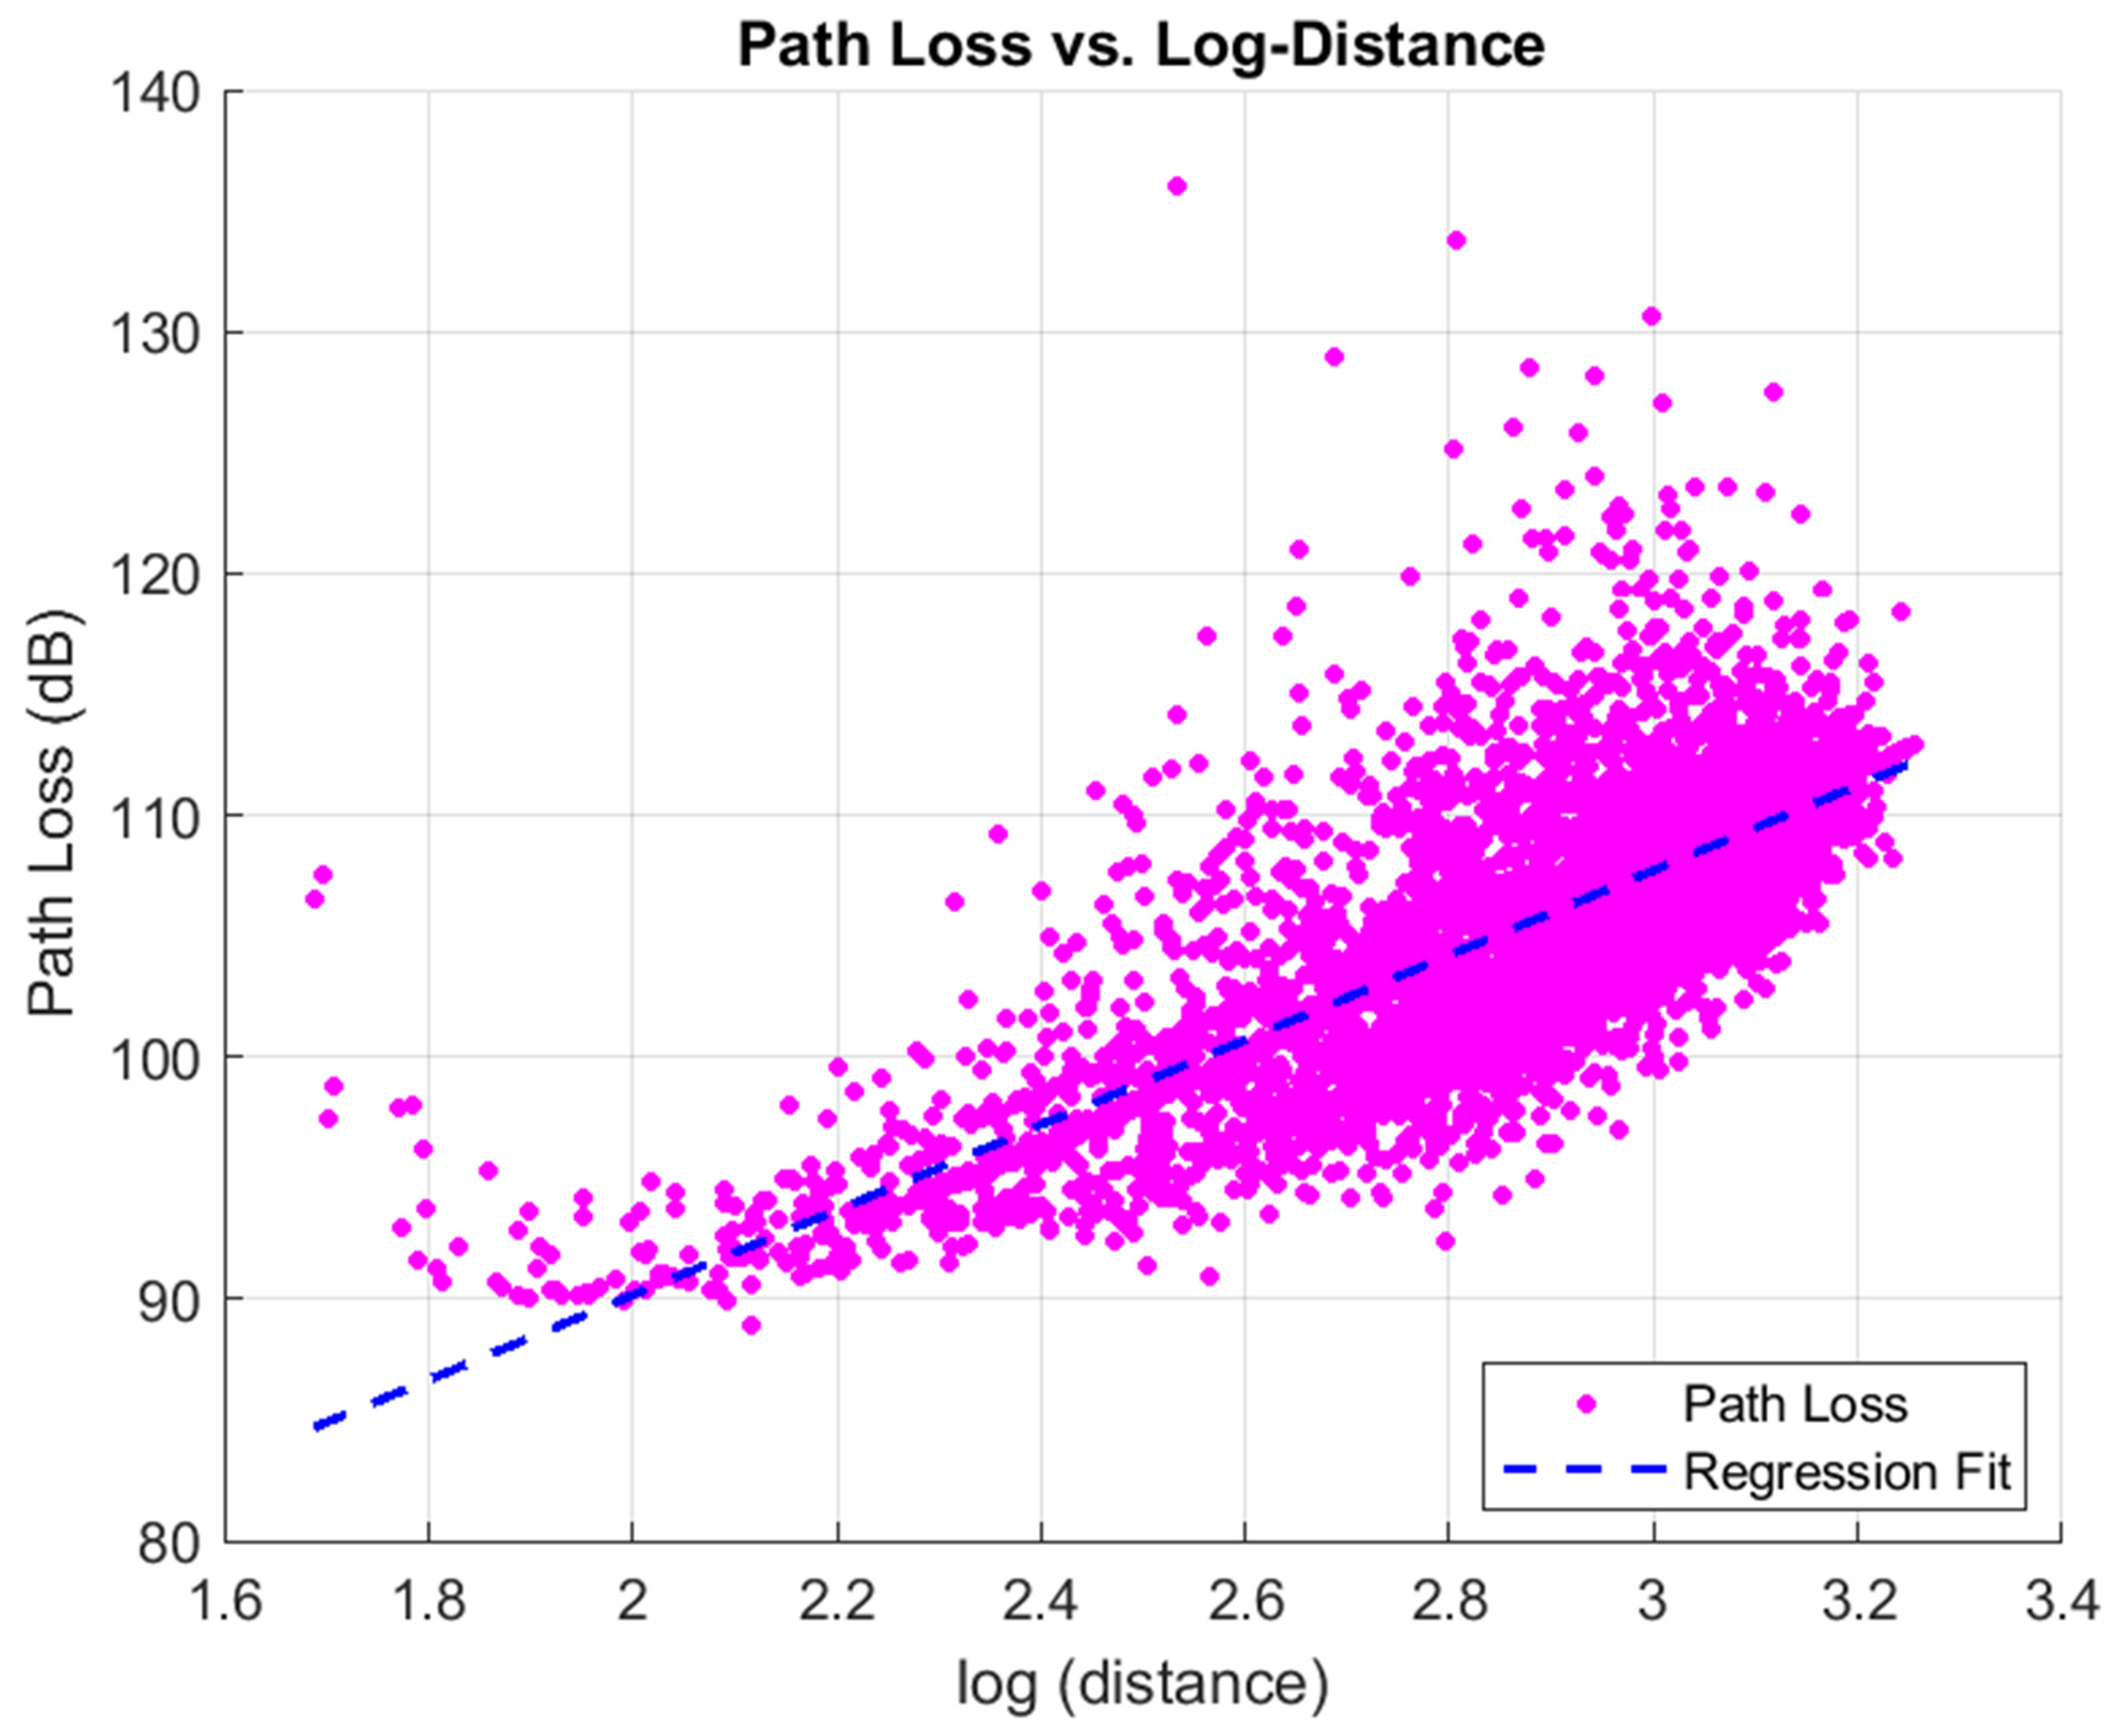
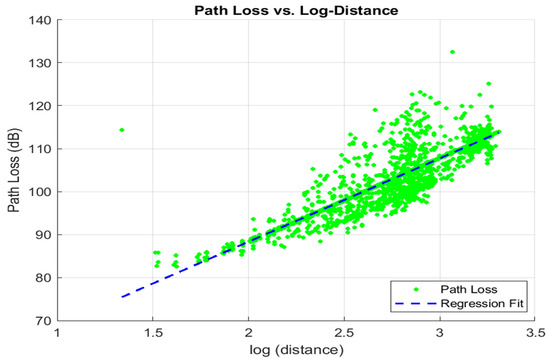
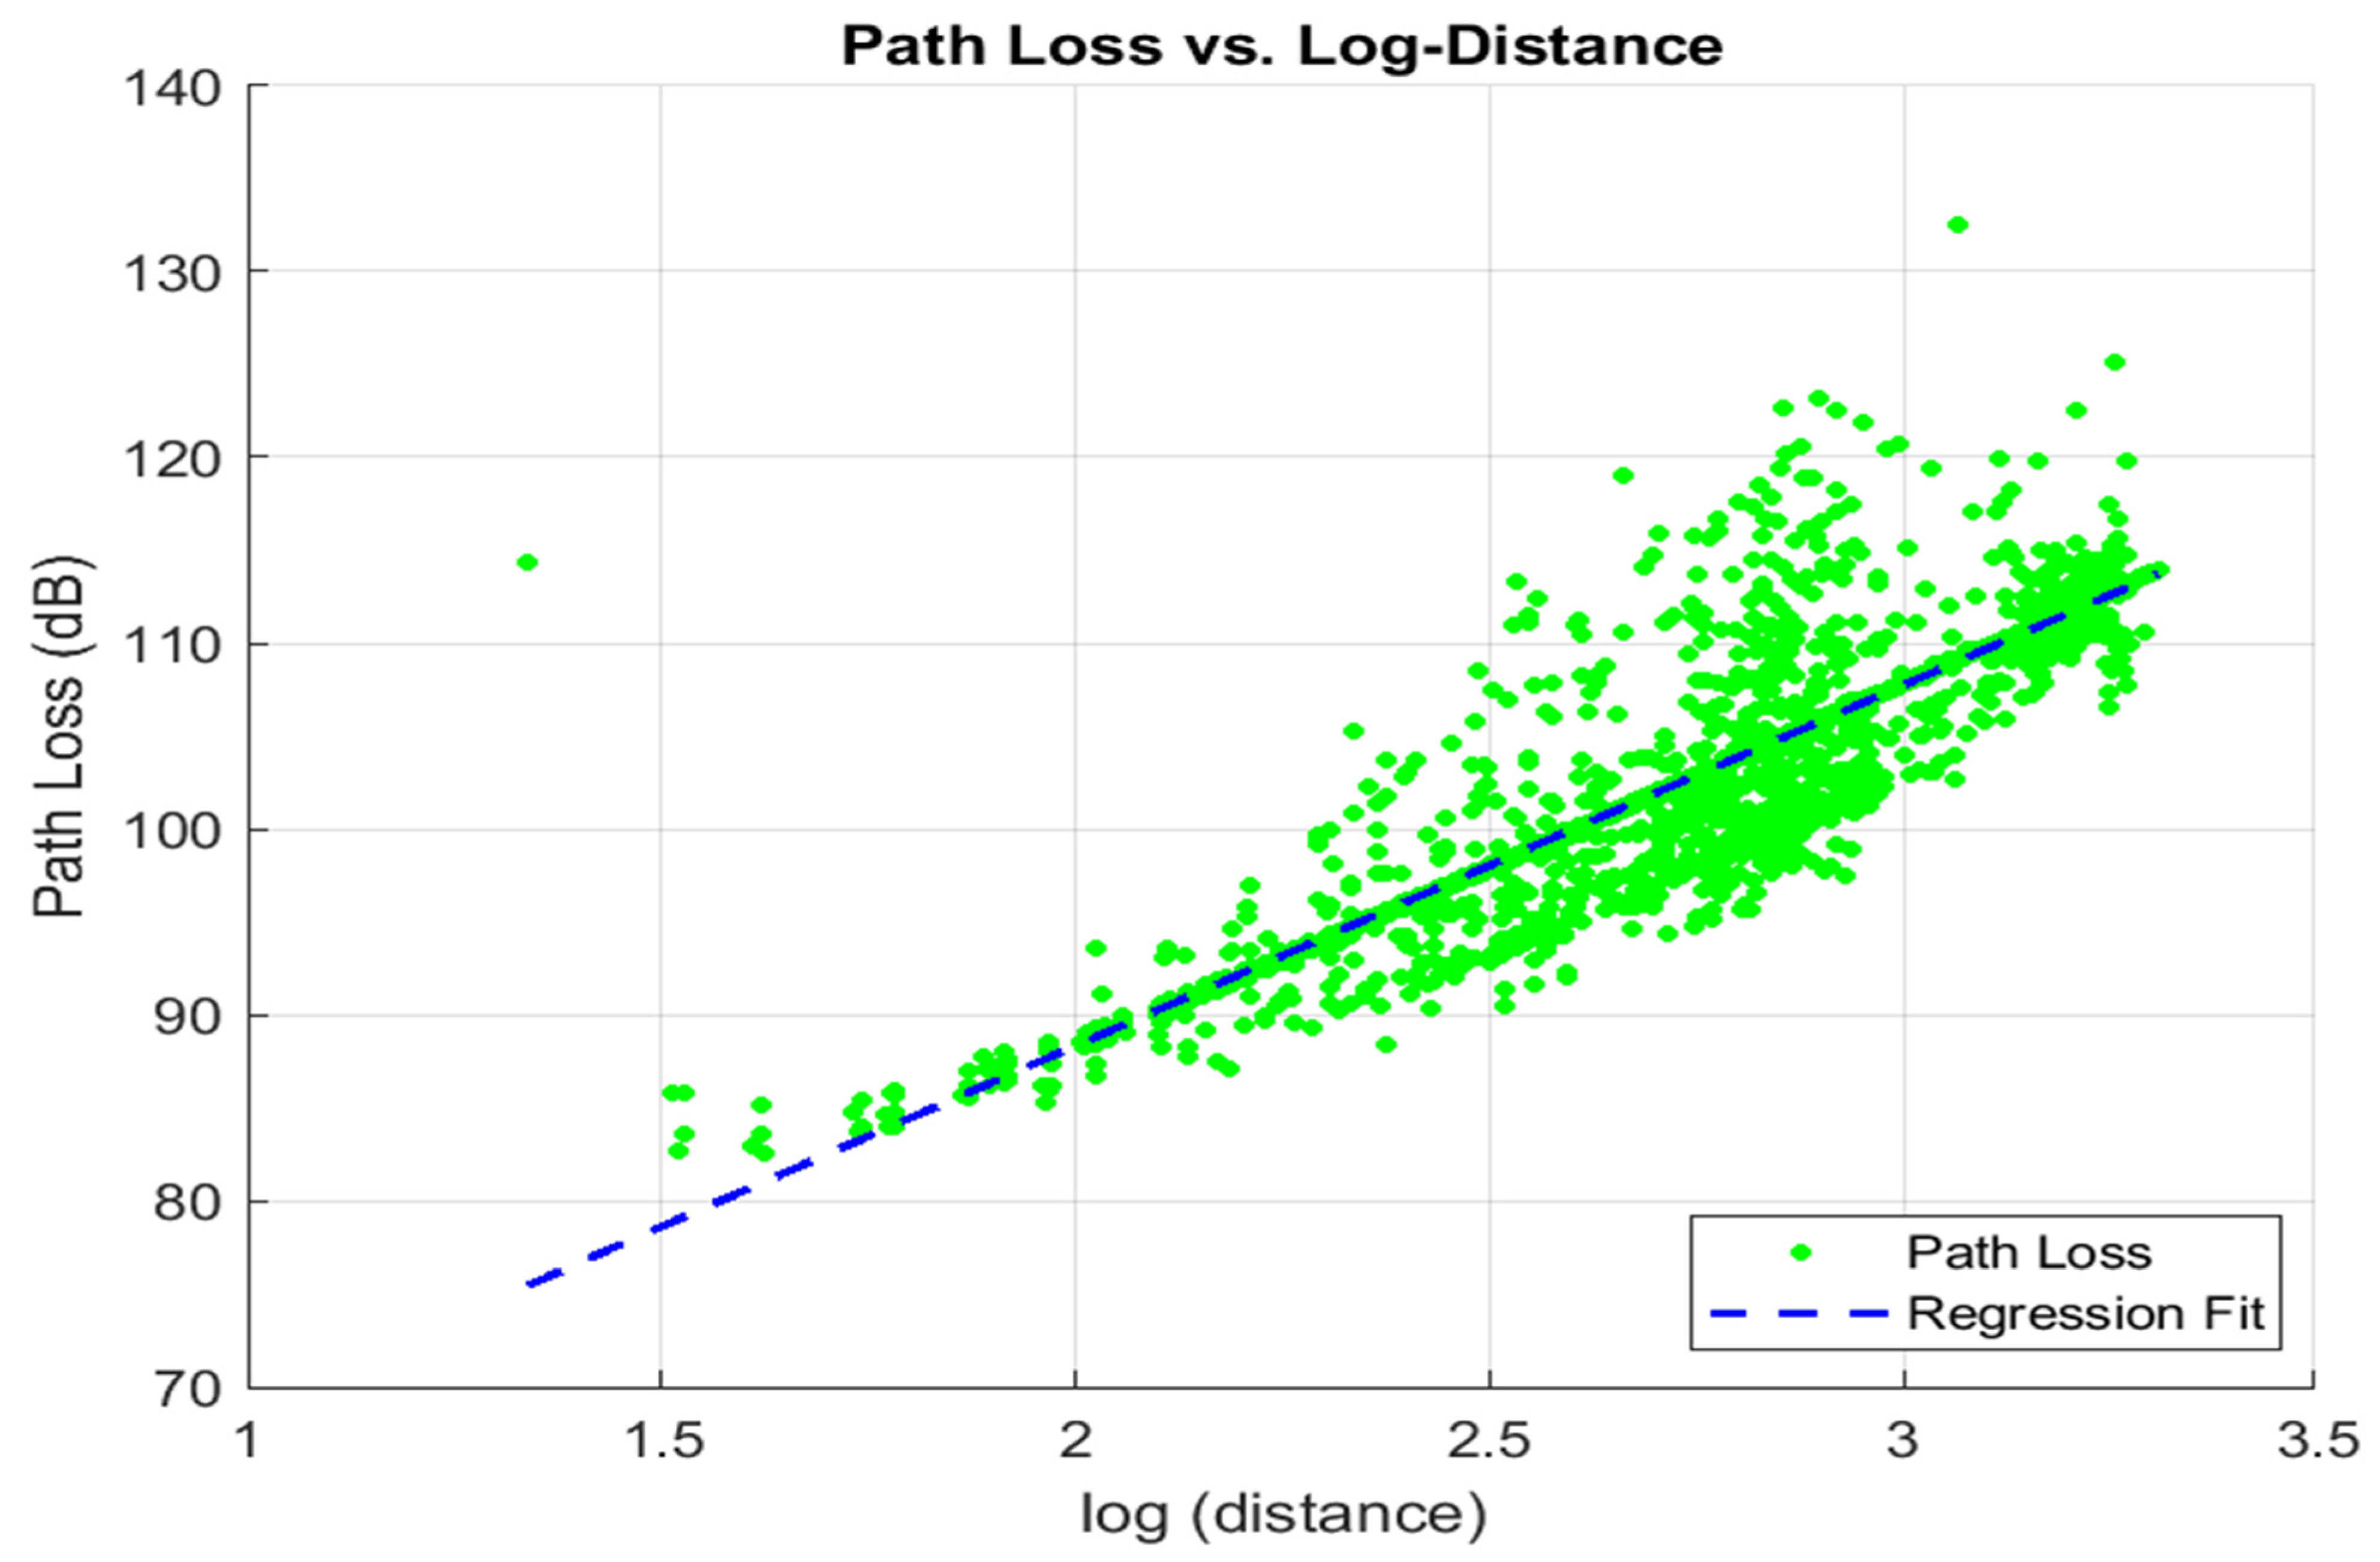
In Table 4, the evaluated mean measured path loss is presented for Shoemaker Rim F on the lunar south pole over a 2 km grid covering 8624 receiver points with the half-wave dipole transmitter to receiver antenna scenario. The TX-RX is 909.1229 m for the first simulation scenario, while for the second simulation scenario the TX-RX mean is 955.7961 m. Similarly, Figure 5 presents the path loss model at 5.855 GHz for the dipole-to-dipole simulation scenario.
Table 4.
Half-wave dipole transmitter-to-receiver scenario.
Figure 5.
Dipole-to-dipole regression fit visualization (uncensored data points).
3.2. Proposed CI-Based and FI-Based Path Loss Models
The 5G path loss model for terrestrial communication has represented the use of CI and FI models as reported by [32,33,34,35,36,37,38,39]; using Equation (1) to Equation (11), two generic path loss models were developed for the two simulation scenarios considered in this work (dipole–dipole and omni–dipole).
For the CI model, the path loss exponent and the shadowing term were obtained by applying a regression fit to simulated path loss datasets against the log of distance for the dipole-to-dipole scenario as shown in Figure 5 and omni-to-dipole shown in Figure 6. In Equation (16), denotes the path loss exponent, is the average distance between the transceivers and refers to the average shadow factor. Substituting these parameters derived from the first dipole-to-dipole simulation scenario into Equation (16), the corresponding CI path loss model for Shoemaker Rim F at 5.855 GHz is presented in Equation (17). The difference in the parameters extracted from the pathloss model scenarios is as discussed in Table 4 and Table 5.
where is the modified CI path loss model for the lunar surface and d is the distance between the transmitter and the receiver.
Figure 6.
Omni-to-dipole regression fit visualization (uncensored data points).
Table 5.
Omnidirectional to half-wave dipole transmitter-to-receiver scenario.
Similarly, the FI model made use of values for the same scenario, as seen in Table 6 for the model’s development into Equation (18).
where is the PL model in dB, is the average FI in dB and is the slope and corresponds to the path loss exponent (n).
Table 6.
CI model and FI model parameters for half-wave dipole transmitter-to-receiver scenario.
The corresponding FI path loss model for Shoemaker Rim F at 5.855 GHz is also presented in Equation (19).
Correspondingly, the omnidirectional to half-wave dipole scenario path loss values also make use of both Equations (16) and (18) to formulate the CI and FI path loss models, which result in Equations (20) and (21).
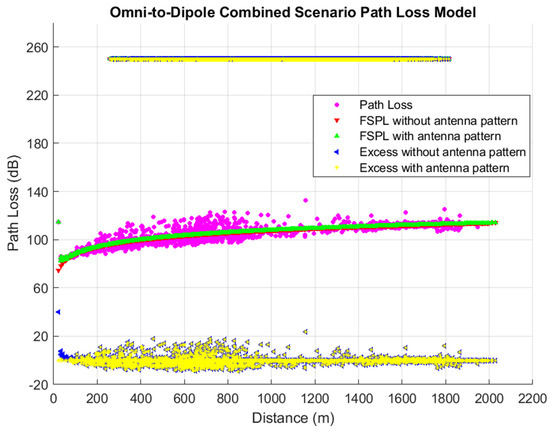
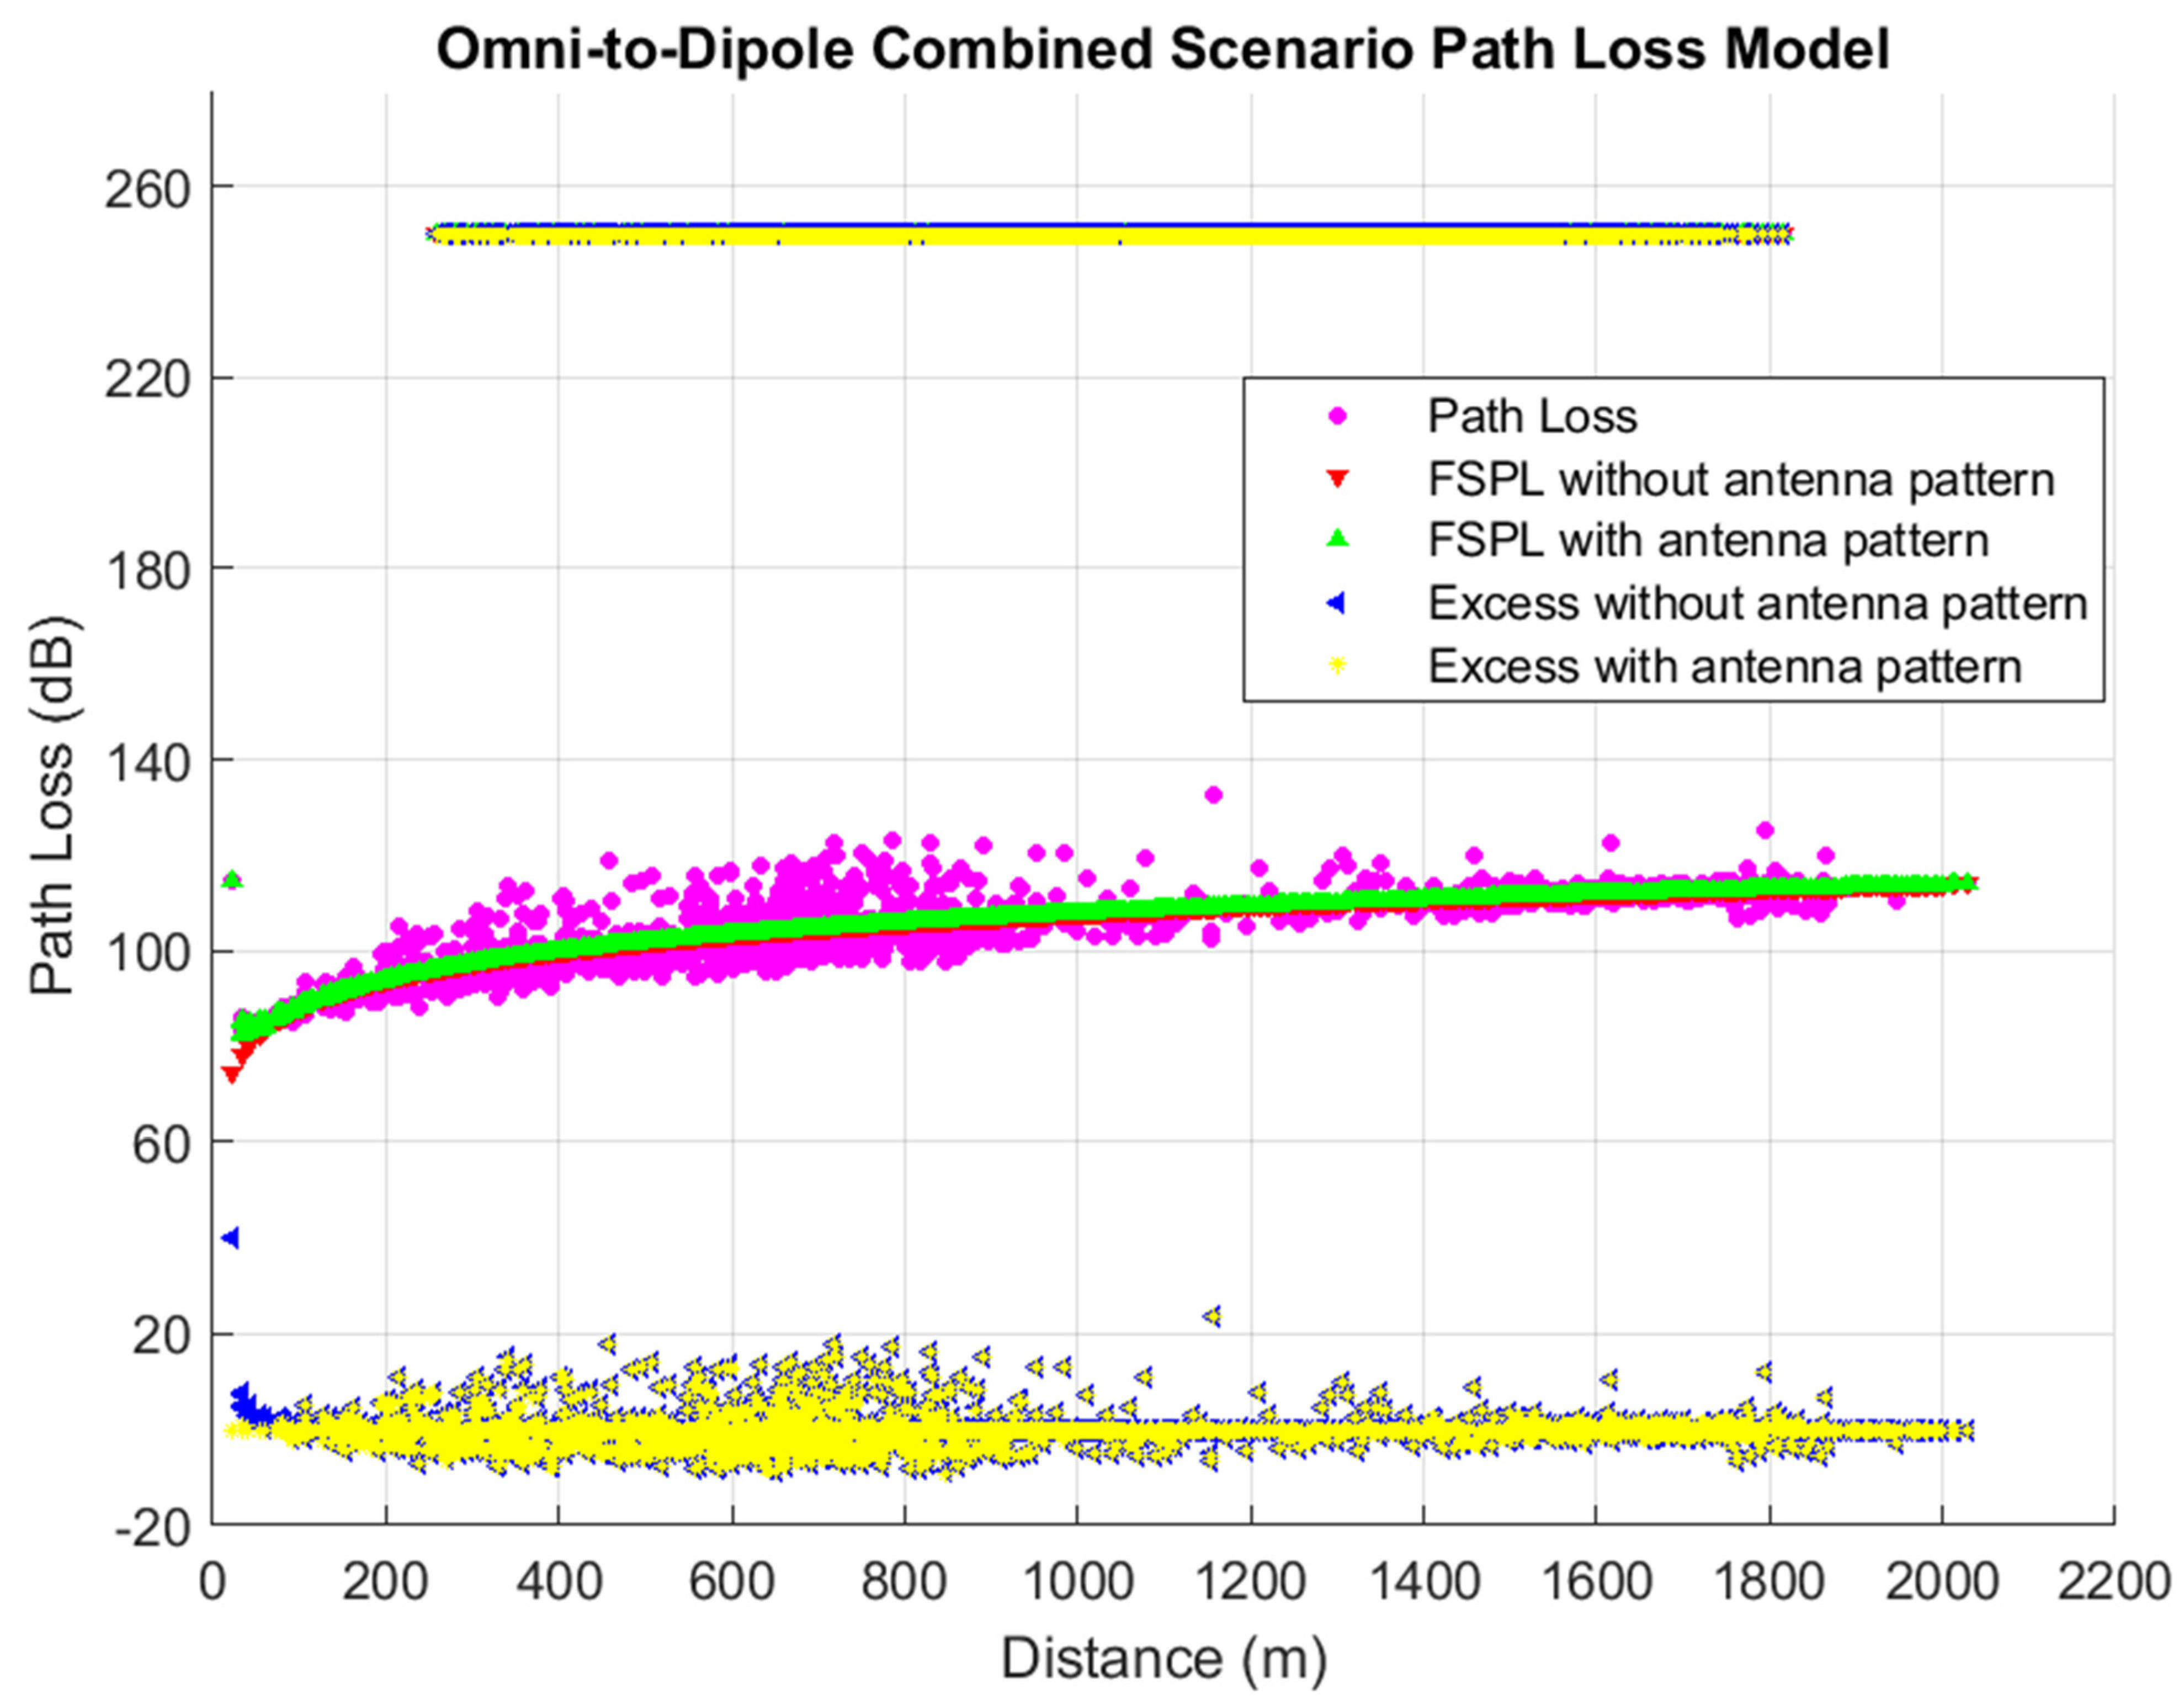
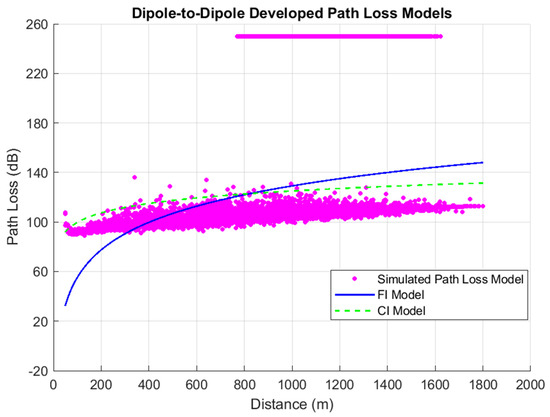
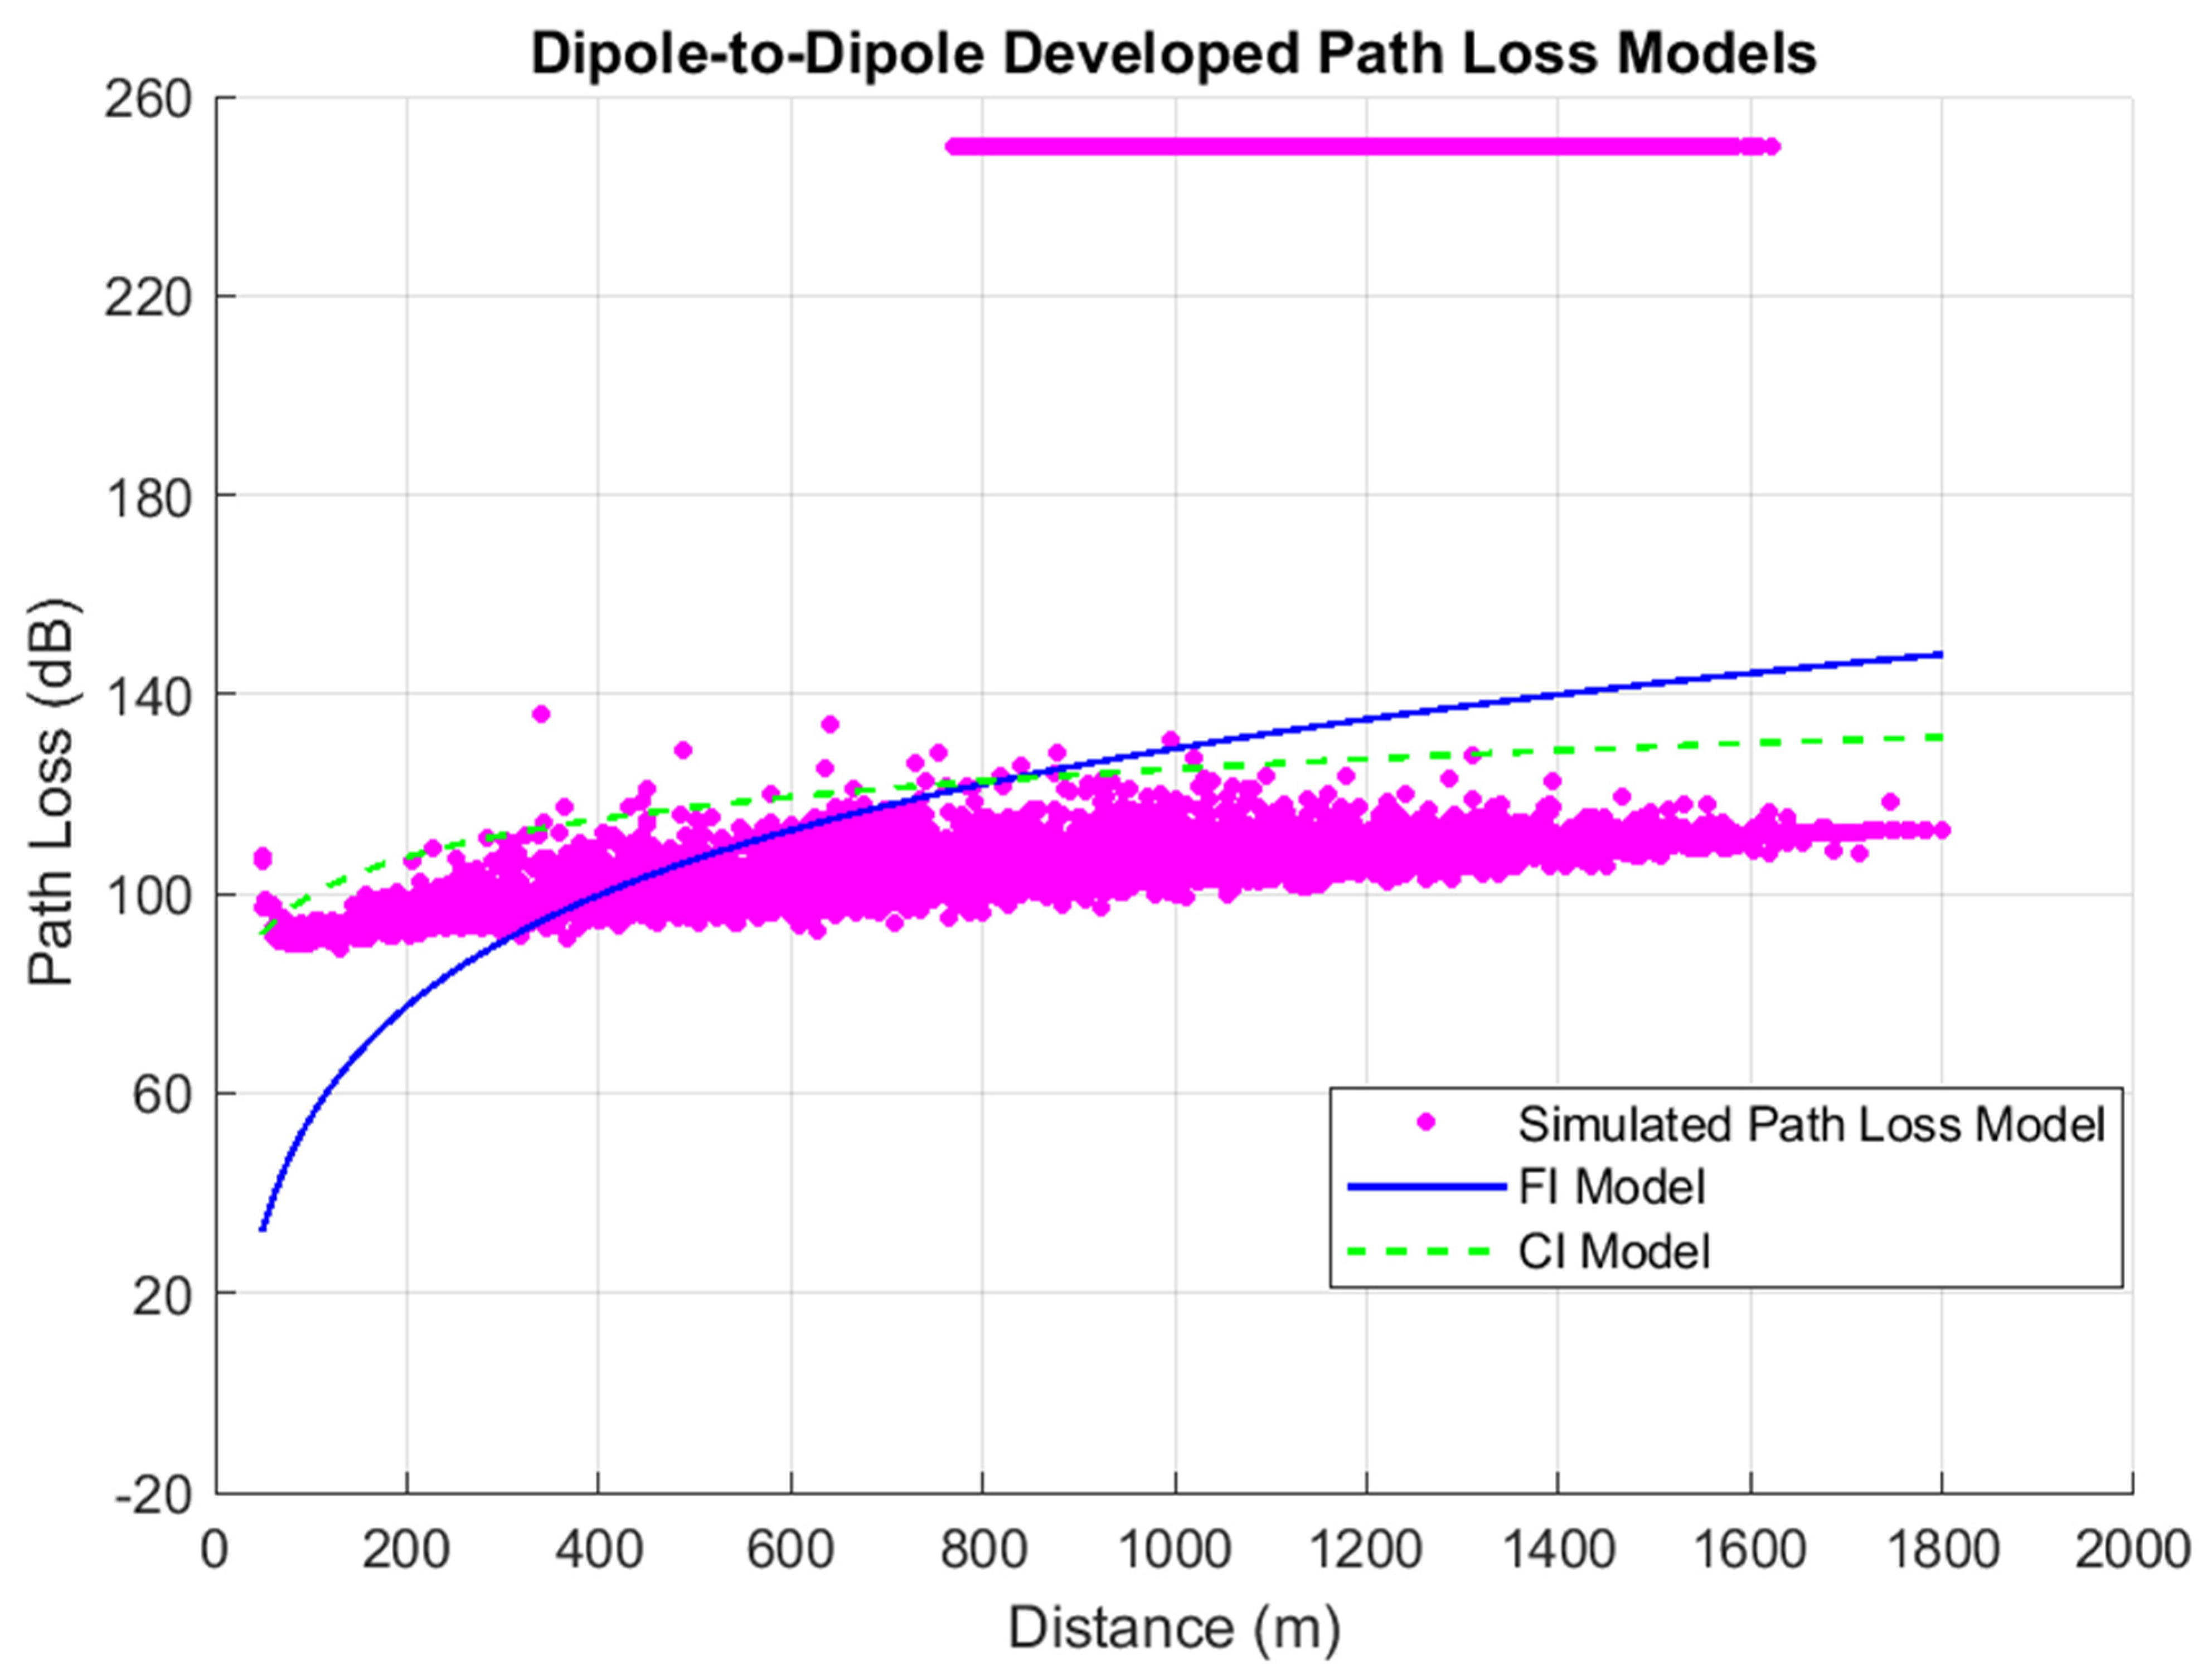
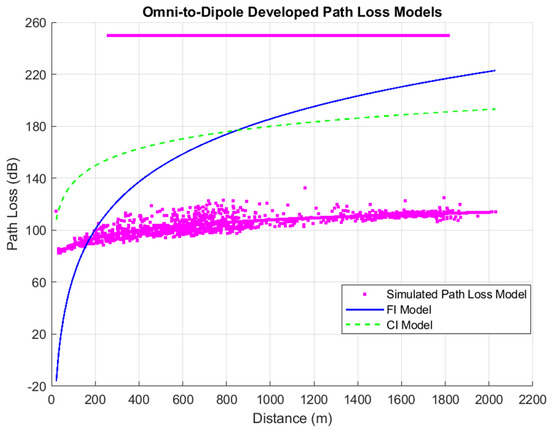
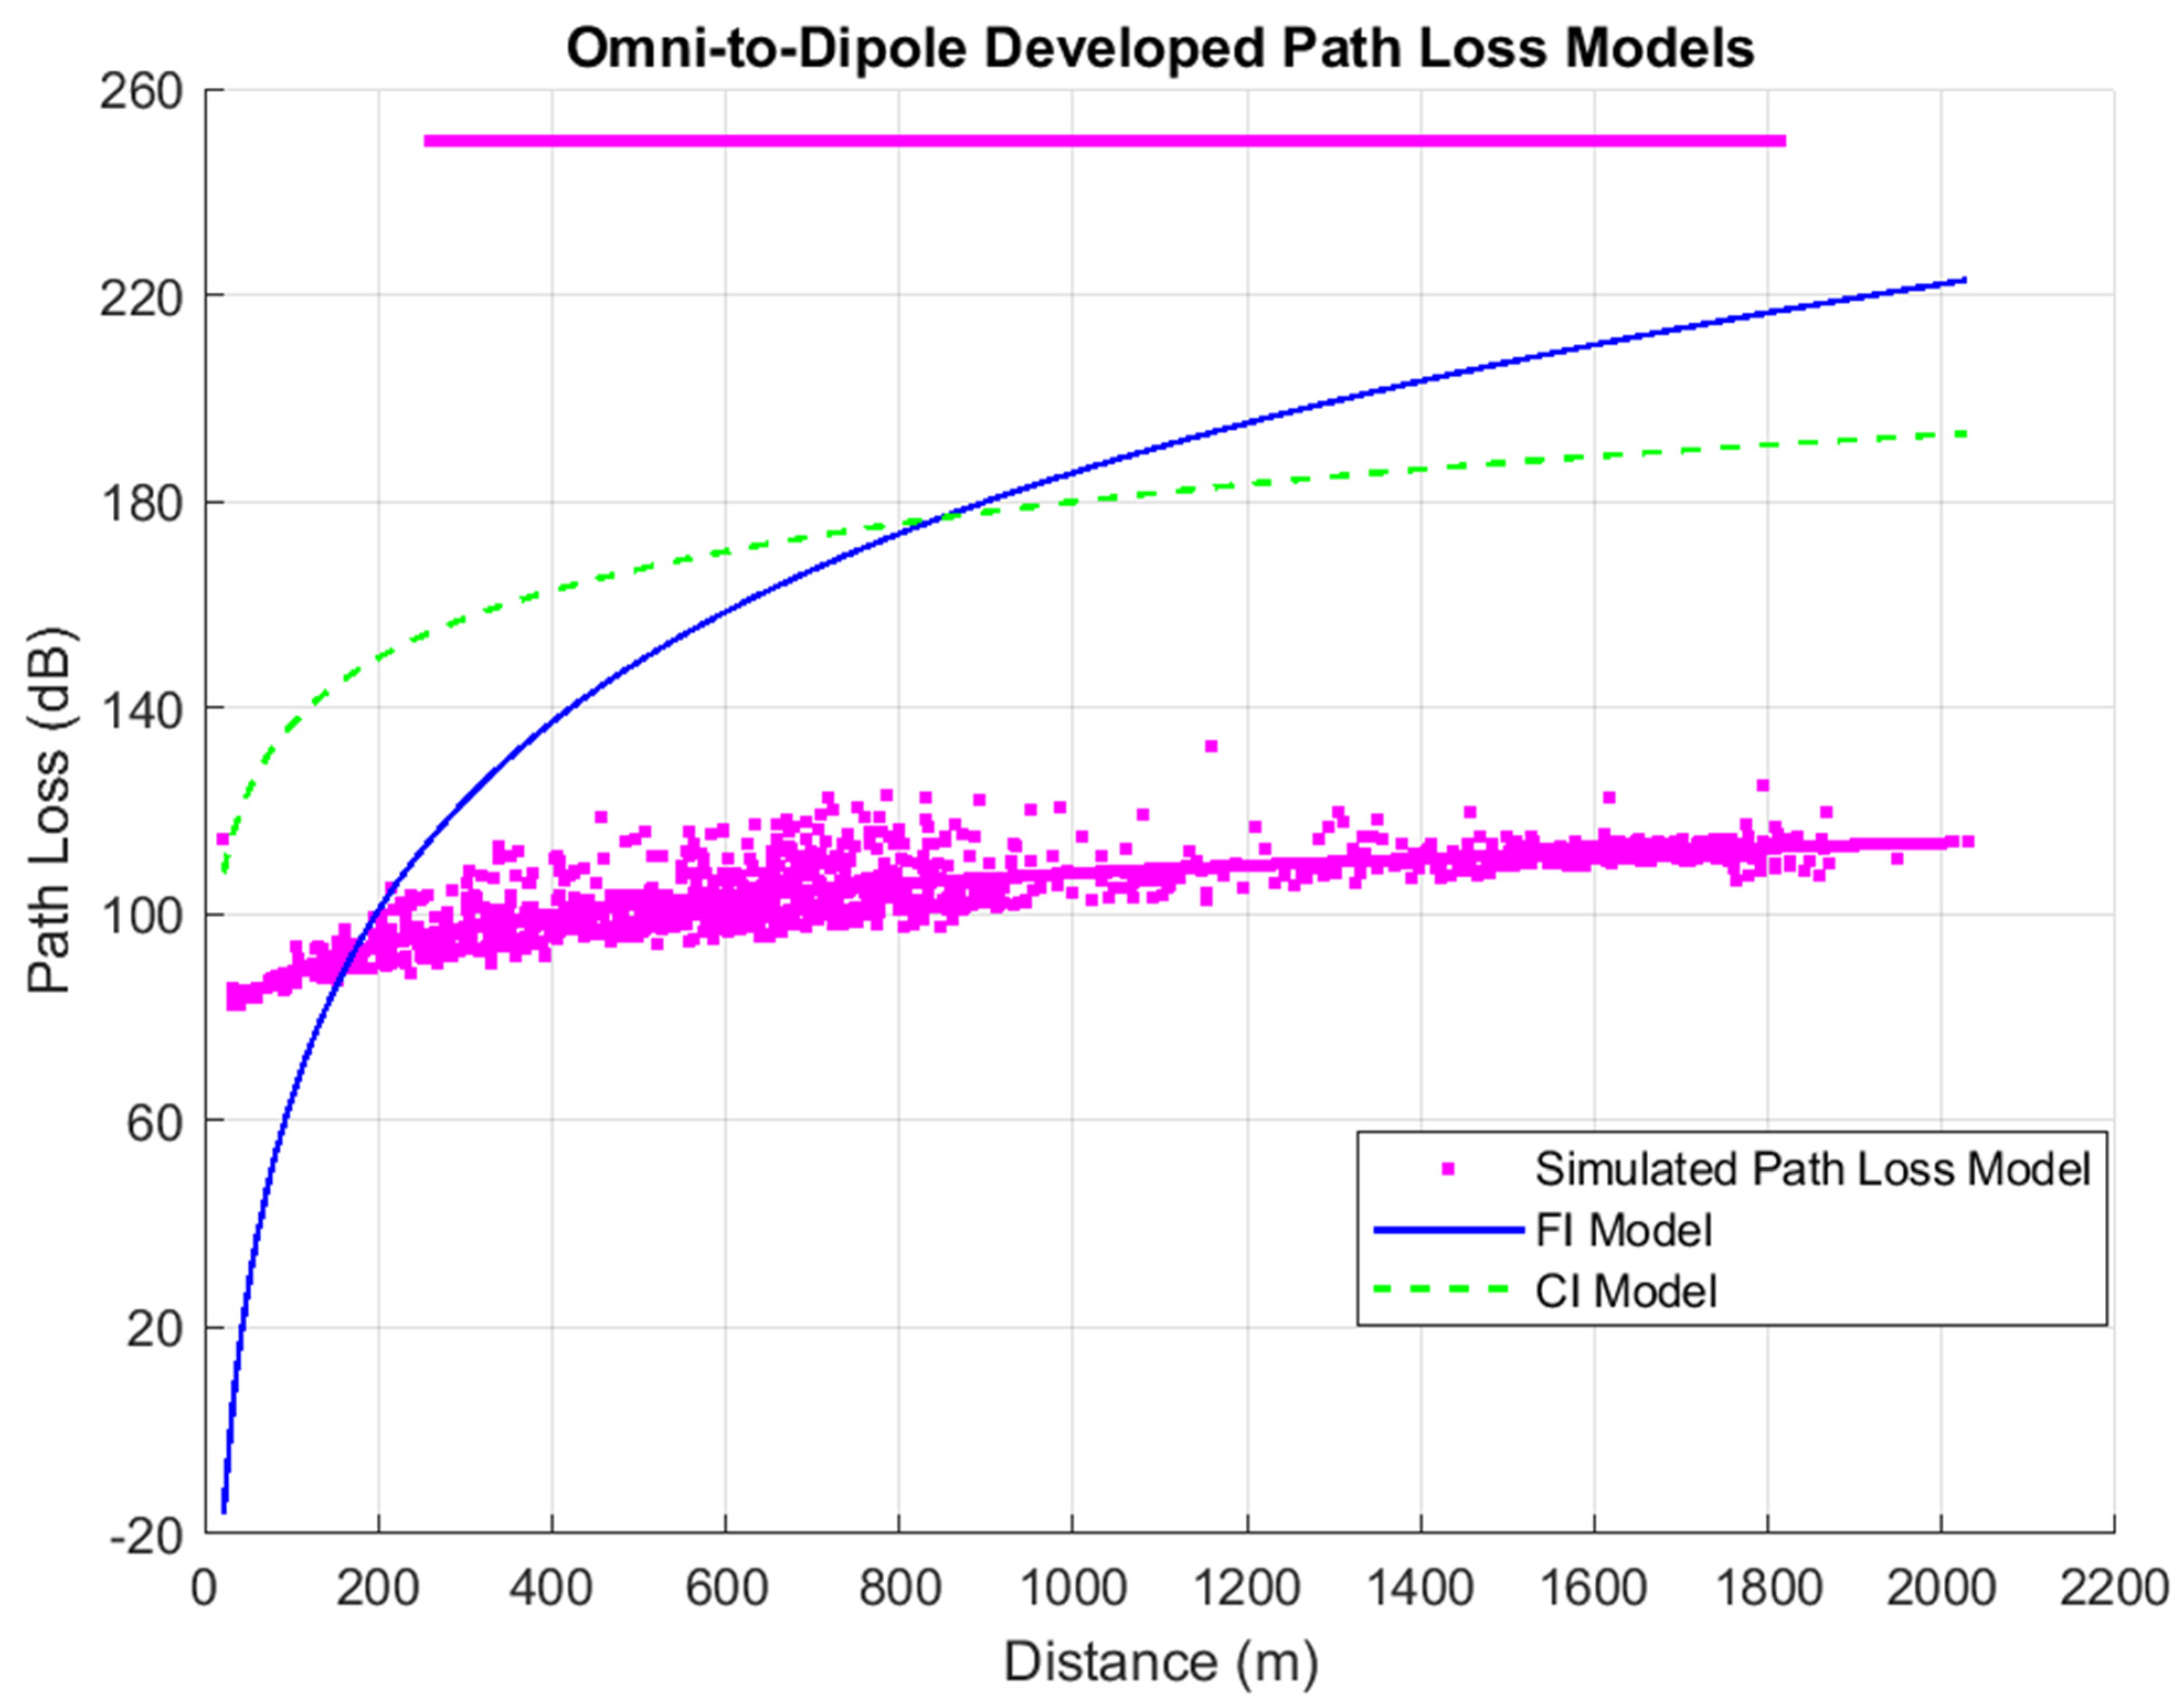
Figure 7 and Figure 8 represent the simulated path loss scenario for the dipole-to-dipole simulation and the omni-to-dipole simulation values.
Figure 7.
Simulated path loss model for the dipole-to-dipole transceiver scenario.
Figure 8.
Simulated 5G path loss model for omni-to-dipole scenarios.
3.3. Evaluation of the Large-Scale 5G Path Loss Model’s Performance
To assess the prediction performance of the path loss model, the RMSE (Root Mean Square Error), alongside other statistical indicators, was used. In general, a smaller RMSE value approaching 0 dB exhibits more accurate prediction. However, reported studies show that RMSE values of about 6–7 dB are typical for urban locations, while values up to roughly 10–15 dB are commonly accepted in suburban and rural scenarios [30,40]. CI model and FI model parameters in Table 6 and Table 7 were utilized to calculate and present the statistical error evaluation values as shown in Table 8 and Table 9 for the developed CI and FI models when compared with the simulated 3D ray tracing data on the lunar south pole.
Table 7.
CI model and FI model parameters for omnidirectional to half-wave dipole transmitter-to-receiver scenario.
Table 8.
CI and FI model performance evaluation for half-wave dipole transmitter-to-receiver scenario.
Table 9.
CI and FI model performance evaluation for omnidirectional to half-wave dipole transmitter-to-receiver scenario.
The RMSE value for the dipole-to-dipole transceiver path loss scenario for the CI model is 45.15 dB, as reported in Table 8, while for the FI model it is 43.898 dB. For FSPL, the RMSEs obtained with and without the antenna radiation pattern were 44.979 dB and 45.092 dB for the CI model, and 43.716 dB and 43.712 dB for the FI model, respectively. For excess path loss, the RMSEs with the antenna pattern were 80.467 dB (CI) and 77.19 dB (FI); without the antenna pattern, the RMSEs were 81.029 dB for the CI model and 77.798 dB for the FI model.
Similarly, as shown in Table 9, the RMSE value for the omni transmitter to dipole receiver path loss scenario for the CI model is 69.301 dB and that for the FI model is 66.739 dB. For the FSPL with antenna patterns, the RMSE for CI is 69.252 dB while that for the FI path loss model is 66.692 dB, and for the FSPL without antenna patterns the RMSE for the CI path loss model is 69.283 dB and that for the FI model is 66.693 dB. Additionally, the excess path loss with and without antenna patterns reveals an RMSE value of 122.997 dB for the CI model, 116.855 dB for the FI model, 122.963 dB for the CI model and 116.855 dB for the FI model respectively. Comparing the two simulated scenarios, the dipole-to-dipole approach and omni-to-dipole approach, the evaluated results show that the omni transmitter to dipole receiver consistently degrades the large-scale fit approach on Shoemaker Rim F. Figure 7 and Figure 8 display the corresponding plots of the developed CI and FI path loss models. The proposed FI and CI models capture the best fitting large-scale path loss behavior for each simulation scenario carried out.
The RMSEs in Table 8 and Table 9 reported higher digits than the terrestrial benchmarks because the lunar south pole includes 8.74% and 28.49% censored datasets for the first and second scenario simulations, respectively. These datasets contain many receiver locations affected by severe terrain screening and near-outage conditions. In these blocked regions, the received signal is at or below receiver sensitivity, or the dominant propagation mechanisms are suppressed by the terrain. This implies that the path loss is not observed in the same way as in the uncensored data sample; instead it is an outage value representing an unknown loss beyond a practical detection threshold. When these points were included in the error statistics, it was observed that they contributed to the high RMSE values. Importantly, the elevated RMSE observations do not indicate poor physical modeling of large-scale attenuation; the CI/FI models still reproduce the large-scale distance dependance and best fit trend for each simulation scenario, while the error values are concentrated in the blocked terrain regions where coverage is fundamentally limited. For clarity, we interpret the reported RMSE as reflecting both the model fit and the severity of the blockage or outages observed at the lunar south pole Rim F region. However, Table 10 and Table 11 show that when the CI/FI models are fitted and evaluated using only uncensored samples, the statistical metric values drop substantially, confirming that the CI/FI formulations capture the expected large-scale log-distance trend for the measurable links as also depicted in Figure 5 and Figure 6. The inclusion of the censored samples in the overall evaluation is intended to provide full representation of lunar south pole propagation, where deep terrain shadowing creates a non-negligible outage region.
Table 10.
CI and FI model performance evaluation for half-wave dipole transmitter-to-receiver scenario without censored data.
Table 11.
CI and FI model performance evaluation for omnidirectional to half-wave dipole without censored data.
In addition, the reported negative excess path loss exponents occur in the excess path loss fits (relative to free space path loss), which indicates that the additional attenuation above the FSPL reference decreases with distance over the fitted range. The lunar south pole has a strong geometry that consists of shadowed crater rims and highly undulating topography, which can block or severely weaken the direct path, and in some cases the dominant reflected components, forcing propagation to be dominated by diffraction around terrain edges and scattering from irregular slopes. As the range increases, some links transition from deep shadowing to partial clearance, which can reduce the excess penalty and yield a negative fitted exponent over that interval. This counter-intuitive result does not mean the total path loss decreases with distance, it means that over the fitted distance window, the additional penalty beyond free space becomes smaller as distance increases in this study.
4. Discussion
This study derived sub-6 GHz 5G large-scale path loss model parameters for close-in (CI) and floating intercept to develop a mathematical model that can be applied to 3D ray tracing simulation data run on the lunar south pole, specifically over Shoemaker Rim F, as highlighted in Figure 1 [2]. The purpose of this approach is to quantify how large-scale attenuation depends on the transmitter antenna pattern. The analysis considered five path loss-related cases (path loss, FSPL with/without antenna patterns, excess path loss with/without antenna patterns) for two link configurations: dipole-to-dipole (DD) and omni-to-dipole (OD). For the dipole-to-dipole configuration, the RMSE between the CI/FI models and the simulated path loss cases remains moderate for the basic and FSPL scenarios, unlike the omni-to-dipole configuration, which produces significantly high RMSE values for the basic and FSPL scenarios. The omni transmitter to dipole receiver path loss configuration yielded basic path loss values of 69.301 dB for the CI model and 66.739 dB for the FI model, while the dipole transmitter to dipole receiver revealed basic path loss values of 45.25 dB for the CI model and 43.898 dB for the FI model.
In terrestrial cellular studies, the CI/FI large-scale fits generally produce near free space slopes in LOS with path loss exponents close to 2, with relatively modest shadowing and larger exponents in NLOS, sometimes in the 2.7–3.5 range [40], reflecting blocking and the presence of scattering in built environments. These terrestrial values are typically obtained from measurement sets dominated by coverage links. In contrast, the lunar study environment is dominated by shadowed craters and highly irregular elevation profiles, which create strong location-specific terrain screening and frequent transitions between deep shadow and partial clearance for the simulation setup. Therefore, the CI/FI parameters are interpreted as site-specific large-scale trends that inherently include terrain-driven, non-stationary and outage effects, so the numerical differences from the typical terrestrial CI/FI observations are expected and do not imply poor physical modeling.
Terrestrial 5G studies have shown that CI and FI models can accurately capture large-scale trends in urban and suburban environments, with path loss exponents typically ranging between two and four and RMSE values of approximately 6–15 dB depending on the environment and frequency [4,30,40]. Comparing the DD and OD cases, switching from a dipole to omni transmitter while keeping the receiver antenna as a dipole increases the RMSE by roughly 20–25 dB for the basic and FSPL cases and by about 35–40 dB for the excess path loss scenarios, as shown in Table 6 and Table 7. The large-scale path loss on Shoemaker Rim F is highly sensitive to the transmitter antenna pattern, such that when both ends of the system use DD, the CI model’s path loss exponent remains in a moderate range, and the FI model’s slope is relatively stable, indicating that the large-scale decay is not extremely different from the terrestrial trend, as shown in Table 4 and Table 5. However, when the transmitter changes to an omni antenna while the receiver remains a dipole, the effective decay becomes much steeper; i.e., the fitted exponent increases.
The reported RMSE reflects a mixed population of censored and uncensored data (above the detection threshold) and does not imply poor physical modeling of the large-scale trend captured by the CI/FI fits as shown in Figure 9 and Figure 10. Also, retaining and utilizing the censored samples is because it reveals the practical coverage-limited behavior that a 3GPP sub-6 GHz system would experience on the cratered lunar south pole Shoemaker Rim F terrain, rather than presenting an overly optimistic coverage-only characterization.
Figure 9.
Developed 5G path loss model for half-wave dipole to half-wave dipole transmitter-to-receiver scenario.
Figure 10.
Simulated 5G path loss model for omnidirectional to half-wave dipole transmitter-to-receiver scenario.
From a propagation perspective, this behavior is consistent with the extreme topography of the lunar south pole. Deep craters, sharp rims, ridges, regolith, mountains and hills have the potential to frequently block the direct path or force propagation to rely on high-order reflections and diffractions. A dipole transmitter concentrates more energy into the main lobe pointing over the rim, which increases the probability that some of the energy reaches the receiver along favorable paths. In comparison, an omnidirectional transmitter distributes power uniformly in azimuth, so most likely a smaller fraction of the radiated power is directed toward the receiver, and more energy goes in directions where the local terrain blocks it, which makes the received signal weaker and the path loss higher, which is reflected in CI/FI exponents, larger shadowing spreads and inflated RMSE values. From a hypothetical perspective, these results reveal that the CI/FI formulations could be extended to lunar environments, but the parameters and error statistics on the lunar south pole can be significantly more extreme than typical terrestrial values due to a combination of vacuum conditions, the lack of atmospheric scattering and the strong blocking caused by craters and rims. Also, the results support the work by [41], in which samples in deep fade or below the noise floor strongly distort the fitted model if they are treated as ordinary data. In our case, the receiver points that are blocked either by craters or by hills act as near-outage samples and including them in the CI/FI fit demonstrably inflates the RMSE values and shadowing standard deviation. Thus, this study not only validates the sensitivity of lunar path loss antenna patterns but also illustrates how censored holes and censored samples must be treated carefully when developing large-scale models for mission-critical lunar links. These findings indicate that, for 5G links operating on 5.855 GHz on the lunar surface, the antenna pattern is not a secondary detail, it fundamentally shapes the effective large-scale path loss, especially in highly obstructed lunar south pole regions.
5. Conclusions
This study investigates whether terrestrial large-scale path loss CI/FI 5G models can be applied to the design of a sub-6 GHz 5G radio propagation model on the lunar surface, using a high-resolution 3D ray tracing campaign at 5.855 GHz frequency at the Shoemaker Rim F location at the lunar south pole. The results show that while the FI model achieves slightly lower RMSE values than the CI model, both reveal that the large-scale attenuation is strongly influenced by the transmitter antenna pattern and the extreme cratered topography. These findings indicate that link budget planning for lunar backhaul and access links must explicitly account for transmitter antenna patterns, beam pointing and site selection.
Another outcome of this study is the finding that including censored or near-outage samples in a single slope CI/FI regression can significantly degrade the performance of the developed models by inflating both the RMSE values and the shadowing variance. Future work will therefore explicitly address this limitation by introducing censored data-aware estimation techniques and more flexible modeling strategies. In particular, we plan to investigate Tobit (censored) maximum likelihood estimation, a robust regression method that down-weights extreme residuals and treats reliable link and outage regions differently. The performance of these formulations will be systematically compared against the single slope CI and FI fits reported in this work to quantify the improvement in the path loss model parameters.
Author Contributions
Conceptualization, Q.R.A.; methodology, Q.R.A.; formal analysis, Q.R.A.; investigation, Q.R.A.; supervision, S.O.; validation, Q.R.A. and S.O.; writing—original draft preparation, Q.R.A.; writing—review and editing, Q.R.A. and S.O. All authors have read and agreed to the published version of the manuscript.
Funding
This research received no external funding.
Data Availability Statement
The original contributions presented in this study are included in the article. Further inquiries can be directed to the corresponding author.
Acknowledgments
I would like to express sincere gratitude to Remcom and NASA for providing access to the Wireless Insite RF simulation software. This tool was essential for the simulations that greatly strengthened the quality of this work. I also appreciate the members of the Communication and Networking Research Group at Ohio University for their invaluable contributions throughout this project.
Conflicts of Interest
The authors declare no conflicts of interest.
Abbreviations
The following abbreviations are used in this manuscript:
| DD | Dipole to Dipole |
| OD | Omni to Dipole |
| FSPL | Free Space Path Loss |
| CI/FI | Close-In / Floating Intercept |
References
- Connolly, J.F.; Drake, B.; Joosten, B.K.; Williams, N.; Polsgove, T.; Merrill, R.; Rucker, M.; Stecklein, J.; Cirillo, W.; Hoffman, S.; et al. The Moon as a steppingstone to human Mars missions. In Proceedings of the International Astronautical Congress (IAC 2018), Bremen, Germany, 1–5 October 2018. [Google Scholar]
- Israel, D.J.; Gramling, C.J. Draft LunaNet Interoperability Specification; NASA Goddard Space Flight Center: Greenbelt, MD, USA, 2023. Available online: https://ntrs.nasa.gov/api/citations/20230012811/downloads/NASA%20TP%2020210021073%20Rev5.pdf (accessed on 30 November 2025).
- Edwards, B.; Wagner, R.; Zemba, M.; Millard, W.; Braham, S.; Gifford, K.; Somerlock, O. 3GPP mobile telecommunications technology on the Moon. In Proceedings of the 2023 IEEE Aerospace Conference (AERO), Big Sky, MT, USA, 4–11 March 2023; pp. 1–12. [Google Scholar]
- Adebowale, Q.R.; Ostermann, S. Expediting lunar exploration: A study of 5G mmWave communications for upcoming human missions on the Moon—Relationship between transmit power, antenna height, and path loss exponent. In Proceedings of the SoutheastCon 2024, Atlanta, GA, USA, 15–24 March 2024; pp. 995–1000. [Google Scholar]
- Kodheli, O.; Querol, J.; Astro, A.; Coloma, S.; Rana, L.; Bokal, Z.; Kumar, S.; Martinez Luna, C.; Thoemel, J.; Merlano Duncan, J.C.; et al. 5G space communications lab: Reaching new heights. In Proceedings of the 2022 18th International Conference on Distributed Computing in Sensor Systems (DCOSS), Los Angeles, CA, USA, 30 May–1 June 2022; pp. 349–356. [Google Scholar]
- Giordano, P.; Lisi, M.; Modenini, A. 5G technologies for a communications and navigation integrated infrastructure on Moon and Mars. In Proceedings of the 36th International Communications Satellite Systems Conference (ICSSC), Niagara Falls, ON, Canada, 15–18 October 2018. [Google Scholar]
- Somerlock, O.; Sharma, A.; Heckler, G.W. Adapting commercial 5G terrestrial networks for space. In Proceedings of the 2022 IEEE Aerospace Conference (AERO), Big Sky, MT, USA, 5–12 March 2022; pp. 1–7. [Google Scholar]
- Wang, H.; Wyglinski, A.M. Barren, Irregular, Chaotic Terrain Ring Model for Lunar 5G Applications. Master’s Thesis, Worcester Polytechnic Institute, Worcester, MA, USA, 2025. [Google Scholar]
- Slyuta, E.N. Physical and mechanical properties of the lunar soil (a review). Sol. Syst. Res. 2014, 48, 330–353. [Google Scholar] [CrossRef] [Scilit]
- Adebowale, Q.R.; Ostermann, S. LUNAR LTE: A Mathematical Path Loss Prediction Model for a 3GPP Sub-6 GHz Band on the Lunar Surface Using 3D Ray Tracing; Unpublished Manuscript; Ohio University: Athens, OH, USA, 2024. [Google Scholar]
- Faruk, N.; Adebowale, Q.R.; Olayinka, I.-F.Y.; Adewole, K.S.; Abdulkarim, A.; Oloyede, A.A.; Chiroma, H.; Sowande, O.A.; Olawoyin, L.A.; Garba, S.; et al. ANN-based model for multiband path loss prediction in built-up environments. Sci. Afr. 2022, 17, e01212. [Google Scholar] [CrossRef] [Scilit]
- Ahmed, O.M.; Adebowale, Q.R.; Imam-Fulani, Y.O.; Balogun, M.O.; Ajani, A.A. Qualitative comparison of Wi-Fi to femtocell (HNB) for indoor wireless data access. Zaria J. Electr. Eng. Technol. 2020, 9, 15–28. [Google Scholar]
- Adebowale, Q.R.; Udensi, F.O.; Adubi, T.; Faruk, N.; Olayinka, I.-F.Y.; Sowande, O.A.; Onidare, S.O.; Oloyede, A.A.; Olawoyin, L.A.; Garba, S.; et al. Convolutional neural network architecture training parameters impact on multi-frequency propagation channel model in the VHF and UHF bands. In Proceedings of the 2023 IEEE AFRICON, Nairobi, Kenya, 20–22 September 2023. [Google Scholar]
- Schmelzbach, C.; Stähler, S.C.; Schmerr, N.C.; Knapmeyer, M.; Sollberger, D.; Edme, P.; Khan, A.; Brinkman, N.; Ferraioli, L.; Robertsson, J.O.A.; et al. Exploring the near surface at the lunar South Pole with geophysical tools. arXiv 2020, arXiv:2009.12807. [Google Scholar] [CrossRef] [Scilit]
- Guo, D.; Fa, W.; Wu, B.; Li, Y.; Liu, Y. Millimeter-to decimeter-scale surface roughness of the Moon at the Chang’e-4 exploration region. Geophys. Res. Lett. 2021, 48, e2021GL094467. [Google Scholar] [CrossRef] [Scilit]
- Matolak, D.W.; Fiebig, U.-C. Wireless channel modeling: Challenges across the field and significance of modeling inaccuracies. In Proceedings of the 2023 17th European Conference on Antennas and Propagation (EuCAP), Florence, Italy, 26–31 March 2023; pp. 1–4. [Google Scholar] [CrossRef] [Scilit]
- Lindsey, J.F., III. Lunar Surface Transmission Loss for the Apollo Astronaut; NASA Tech. Note NASA TN D-4915; NASA: Washington, DC, USA, 1968. [Google Scholar]
- Foore, L.; Ida, N. Path Loss Prediction Over the Lunar Surface Utilizing a Modified Longley–Rice Irregular Terrain Model; NASA Tech. Memo. NASA/TM-2007-214825; NASA: Washington, DC, USA, 2007. [Google Scholar]
- Pan, H.; Zhu, Q.; Chen, X.; Yu, H. Path loss prediction over lunar surface with obstacle diffraction. In Proceedings of the 2014 IEEE Workshop on Advanced Research and Technology in Industry Applications (WARTIA), Ottawa, ON, Canada, 29–30 September 2014; pp. 1276–1280. [Google Scholar] [CrossRef] [Scilit]
- Zhu, Q.; Wang, C.; Chen, X.; Chen, C.; Wang, X.; Zhang, C. Path loss prediction model of radio propagation over lunar surface. In Communications in Computer and Information Science (CCIS); Springer: Berlin/Heidelberg, Germany, 2011; Volume 163, pp. 556–562. [Google Scholar]
- Chizhik, D.; Moilanen, J.; Klein, S.; Maestro, L.; Valenzuela, R.A. Analytic propagation approximation over variable terrain and comparison to data. In Proceedings of the 2020 14th European Conference on Antennas and Propagation (EuCAP), Copenhagen, Denmark, 15–20 March 2020; pp. 1–5. [Google Scholar] [CrossRef] [Scilit]
- Pabari, J.P.; Acharya, Y.B.; Desai, U.B.; Merchant, S.N.; Krishna, B.G. Radio frequency modelling for future wireless sensor network on surface of the Moon. Int. J. Commun. Network. Syst. Sci. 2010, 3, 395–401. [Google Scholar] [CrossRef]
- Santra, S.; Paet, L.B.; Staudinger, E.; Yoshida, K. Radio propagation modelling for coordination of lunar micro-rovers. In Proceedings of the International Symposium on Artificial Intelligence, Robotics and Automation in Space (I-SAIRAS), Virtual Conference, 19–23 October 2020; pp. 1–8. [Google Scholar]
- Barker, M.K. High-Resolution LOLA Topography for Lunar South Pole Sites; Planetary Geology, Geophysics and Geochemistry Laboratory (PGDA), NASA Goddard Space Flight Center: Greenbelt, MD, USA, 2024. Available online: https://pgda.gsfc.nasa.gov/products/78 (accessed on 18 November 2025).
- Remcom Electromagnetic Simulation Software. Available online: https://www.remcom.com/ (accessed on 2 September 2024).
- Carrier, W.D., III; Olhoeft, G.R.; Mendell, W. Physical properties of the lunar surface. In Lunar Sourcebook: A User’s Guide to the Moon; Heiken, G.H., Vaniman, D.T., French, B.M., Eds.; Cambridge University Press: Cambridge, UK, 1991; pp. 475–594. [Google Scholar]
- Goldsmith, A. Wireless Communications; Cambridge University Press: Cambridge, UK, 2005. [Google Scholar]
- Rappaport, T.S. Wireless Communications: Principles and Practice; Prentice Hall PTR: Upper Saddle River, NJ, USA, 2002. [Google Scholar]
- Karttunen, A.; Gustafson, C.; Molisch, A.F.; Wang, R.; Hur, S.; Zhang, J.; Park, J. Path loss models with distance-dependent weighted fitting and estimation of censored path loss data. IET Microw. Antennas Propag. 2016, 10, 1467–1474. [Google Scholar] [CrossRef] [Scilit]
- Phunthawornwong, M.; Pengwang, E.; Silapunt, R. Indoor location estimation of wireless devices using the log-distance path loss model. In Proceedings of the TENCON 2018—2018 IEEE Region 10 Conference, Jeju, Republic of Korea, 28–31 October 2018; pp. 499–502. [Google Scholar] [CrossRef] [Scilit]
- Durgin, G.D.; Rappaport, T.S.; Xu, H. Measurements and models for radio path loss and penetration loss in and around homes and trees at 5.85 GHz. IEEE Trans. Commun. 1998, 46, 1484–1496. [Google Scholar] [CrossRef] [Scilit]
- Al-Samman, A.M.; Abd Rahman, T.; Azmi, M.H. Indoor corridor wideband radio propagation measurements and channel models for 5G millimeter wave wireless communications at 19 GHz, 28 GHz, and 38 GHz bands. Wirel. Commun. Mob. Computing. 2018, 2018, 6369517. [Google Scholar] [CrossRef] [Scilit]
- MacCartney, G.R.; Zhang, J.; Nie, S.; Rappaport, T.S. Path loss models for 5G millimeter wave propagation channels in urban microcells. In Proceedings of the 2013 IEEE Global Communications Conference (GLOBECOM), Atlanta, GA, USA, 9–13 December 2013; pp. 3948–3953. [Google Scholar]
- Adegoke, E.I.; Kampert, E.; Higgins, M.D. Empirical indoor path loss models at 3.5 GHz for 5G communications network planning. In Proceedings of the 2020 International Conference on UK–China Emerging Technologies (UCET), Glasgow, UK, 20–21 August 2020; pp. 1–4. [Google Scholar]
- Adegoke, E.I.; Kampert, E.; Higgins, M.D. Channel modeling and over-the-air signal quality at 3.5 GHz for 5G New Radio. IEEE Access 2021, 9, 11183–11193. [Google Scholar] [CrossRef] [Scilit]
- Al-Samman, A.; Rahman, T.A.; Hindia, M.H.D.; Daho, A.; Hanafi, E. Path loss model for outdoor parking environments at 28 GHz and 38 GHz for 5G wireless networks. Symmetry 2018, 10, 672. [Google Scholar] [CrossRef] [Scilit]
- Al-Samman, A.M.; Rahman, T.A.; Azmi, M.H.; Sharaf, A.; Yamada, Y.; Alhammadi, A. Path loss model in indoor environment at 40 GHz for 5G wireless network. In Proceedings of the 2018 IEEE 14th International Colloquium on Signal Processing & Its Applications (CSPA), Penang, Malaysia, 9–10 March 2018; pp. 7–12. [Google Scholar]
- Li, S.; Liu, Y.; Lin, L.; Sun, D.; Yang, S.; Sun, X. Simulation and modeling of millimeter-wave channel at 60 GHz in indoor environment for 5G wireless communication system. In Proceedings of the 2018 IEEE International Conference on Computational Electromagnetics (ICCEM), Chengdu, China, 26–28 March 2018; pp. 1–3. [Google Scholar]
- MacCartney, G.R.; Rappaport, T.S.; Samimi, M.K.; Sun, S. Millimeter-wave omnidirectional path loss data for small cell 5G channel modeling. IEEE Access 2015, 3, 1573–1580. [Google Scholar] [CrossRef] [Scilit]
- Rappaport, T.S.; Sun, S.; Shafi, M. Investigation and comparison of 3GPP and NYUSIM channel models for 5G wireless communications. In Proceedings of the 2017 IEEE 86th Vehicular Technology Conference (VTC-Fall), Toronto, ON, Canada, 24–27 September 2017. [Google Scholar]
- Lee, W.C.Y. Mobile Communications Design Fundamentals; Wiley: New York, NY, USA, 1993. [Google Scholar]

Disclaimer/Publisher’s Note: The statements, opinions and data contained in all publications are solely those of the individual author(s) and contributor(s) and not of MDPI and/or the editor(s). MDPI and/or the editor(s) disclaim responsibility for any injury to people or property resulting from any ideas, methods, instructions or products referred to in the content. |
© 2026 by the authors. Licensee MDPI, Basel, Switzerland. This article is an open access article distributed under the terms and conditions of the Creative Commons Attribution (CC BY) license.