


Abstract
Background: Atmospheric dust is an increasingly recognized risk factor for respiratory morbidity, particularly in arid regions, yet evidence from Latin America remains limited. The Department of Ica, on the hyper-arid coast of Peru, is subject to recurrent wind-driven dust events (“Paracas winds”) that may affect respiratory health. This study aimed to evaluate the association between atmospheric dust concentration and respiratory emergency department (ED) visits, and to estimate attributable burden across the provinces of Ica. Methods: We conducted province-specific ecological time-series analyses (January 2023–May 2026) using distributed lag non-linear models (DLNMs). Exposure was defined as daily surface dust mass concentration (MERRA-2 DUSMASS). Models were adjusted for long-term/seasonal trends, day of week, holidays, temperature, and relative humidity. Cumulative relative risks (RRs) were estimated at the 90th, 95th, and 97.5th exposure percentiles relative to the province-specific median, and attributable fractions (AFs) were estimated. Results: Across 1247 days per province (94,559 respiratory ED visits overall), the most consistent positive exposure–response association was observed in Ica (97.5th-percentile RR, 1.47; 95% CI, 1.23–1.75). Chincha showed a positive association in the main model (RR, 1.39; 95% CI, 1.07–1.79), although these estimates were less robust in sensitivity analyses. Pisco showed an elevated but imprecise estimate at the 97.5th percentile (RR, 1.42; 95% CI, 1.01–1.99), whereas estimates for Nazca and Palpa did not provide consistent evidence of an association. AFs for dust above the median were 6.64% in Ica and 6.32% in Chincha, where attributable burden was distributed across moderate and high exposure intervals rather than concentrated at extremes. Conclusions: Province-specific estimates of the association between modeled atmospheric dust and respiratory ED visits varied in precision and robustness, with consistent evidence in Ica and greater uncertainty in the remaining provinces. Ground-based particulate monitoring would help improve exposure assessment and inform future dust surveillance in this region.
1. Introduction
Atmospheric dust and airborne particulate matter are important environmental determinants of population health, contributing substantially to respiratory morbidity, emergency healthcare demand and short-term positive correlation with daily mortality worldwide [1,2,3]. Arid and semi-arid landscapes act as primary global sources of mineral dust that, driven by wind erosion and atmospheric transportation, can disperse elevated concentrations of suspended particles across vast geographic regions [4]. As climate variability and anthropogenic land degradation intensify, the frequency and intensity of dust storms will continue to increase globally [2,5]. Consequently, characterizing the health burden associated with acute exposure to atmospheric dust has emerged as a vital public health priority to guide clinical preparedness and timely response [1,4].
Inhalation of mineral dust and coarse particulate matter (PM10–2.5) can produce complex inflammatory cascades throughout the human respiratory tract [2,6,7]. Inhaled particles penetrate deep into intra-alveolar areas, where the interaction between lung fluids and inhaled atmospheric dust induces macrophage activation that triggers oxidative stress, cell membrane injury, and the excessive release of pro-inflammatory cytokines such as interleukin-6 (IL-6) and tumor necrosis factor-alpha (TNF-α) [6,7,8,9,10]. These biological cascades compromise ciliary clearance, promote bronchial hyperreactivity, and exacerbate pre-existing chronic conditions, such as asthma and chronic obstructive pulmonary disease (COPD), as well as acute respiratory infections, such as pneumonia and ambient influenza [1,7]. Because these transitions from particle deposition to acute clinical manifestation can be observed in cumulative delay patterns spanning several days through physiological incubation windows [8,11,12], emergency department visits serve as a sensitive and immediate indicator for assessing acute population-level morbidity resulting from transient exposure surges [7,11]. Dust exposure may also occur together with resuspended biological material, including pollen, fungal spores, and other bioaerosols, which can contribute to allergic and infectious respiratory morbidity [13,14]. This reinforces the public-health relevance of wind-resuspension events while also underscoring the need to interpret modeled mineral-dust estimates within a broader environmental context.
The exposure–response relationships of atmospheric dust are strongly modulated by local and seasonal meteorological parameters, topography, particle mineralogy, and population susceptibility, meaning that risk estimates from major global deserts (such as the Sahara or Gobi) cannot be directly generalized to other regions [4,15,16,17]. Despite growing epidemiological research across Asia and the Middle East, evidence from low- and middle-income countries (LMICs) remains under-addressed, with important methodological heterogeneity arising from the use of different exposure metrics [8,15,18]. In Latin America, and particularly in Peru, the epidemiological evidence remains especially limited for mineral-dust exposure. Previous Peruvian studies have evaluated ambient PM2.5 and cardiorespiratory outcomes in Lima [19,20,21,22], including respiratory emergency visits, but these studies focused on urban particulate air pollution rather than atmospheric mineral dust in hyper-arid coastal environments. The gap is particularly evident in South America, where coastal desert areas experience frequent fine-particle resuspension driven by advection, yet epidemiological studies applying advanced time-series frameworks to evaluate short-term dust morbidity are still scarce [4,13,16,17].
The Department of Ica, located on the south–central coast of Peru, provides an ideal setting to investigate the public health impacts of high aeolian dust concentrations [23]. Almost the entire territory (more than 90%) consists of hyper-arid coastal plains and vast desert expanses. Due to these characteristics, the area is highly vulnerable to severe wind erosion and the constant resuspension of dust and particles into the atmosphere [23]. A distinctive and severe meteorological feature of this region is the recurrence of the “Paracas winds”, intense coastal wind storms driven by regional pressure gradients, daytime radiative heating, and complex local topography [23]. While recent atmospheric studies have characterized the physical dynamics, electrical properties, and transport trajectories of Paracas dust storms [23,24], epidemiological evidence evaluating their implications for respiratory healthcare use remains scarce. This local evidence gap is important because populations living in the Ica provinces may experience recurrent wind-driven dust resuspension in settings where continuous ground-level dust monitoring is limited and where acute respiratory morbidity can place pressure on emergency healthcare services. Specifically, multi-province investigations of atmospheric dust concentrations on emergency respiratory care have not yet been conducted in the region.
Therefore, this study aimed to evaluate the non-linear and delayed short-term associations between daily atmospheric dust concentrations and respiratory emergency department (ED) visits, as well as to estimate the attributable morbidity burden, across the five provinces of the Department of Ica, Peru (Chincha, Ica, Nazca, Palpa, and Pisco), from 2023 to 2026.
2. Materials and Methods
2.1. Study Design and Setting
We conducted an ecological time-series study in the five provinces of the Department of Ica, Peru (Chincha, Ica, Nazca, Palpa, and Pisco), from 1 January 2023, to 31 May 2026. Province-specific daily time series were analyzed independently using distributed lag non-linear models (DLNMs) to characterize the non-linear and delayed associations between atmospheric dust concentrations and respiratory ED visits [25].
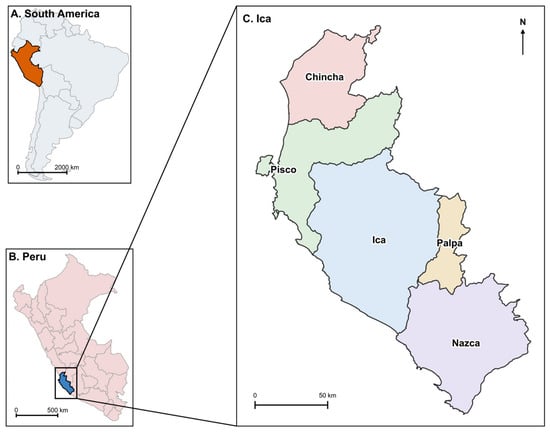
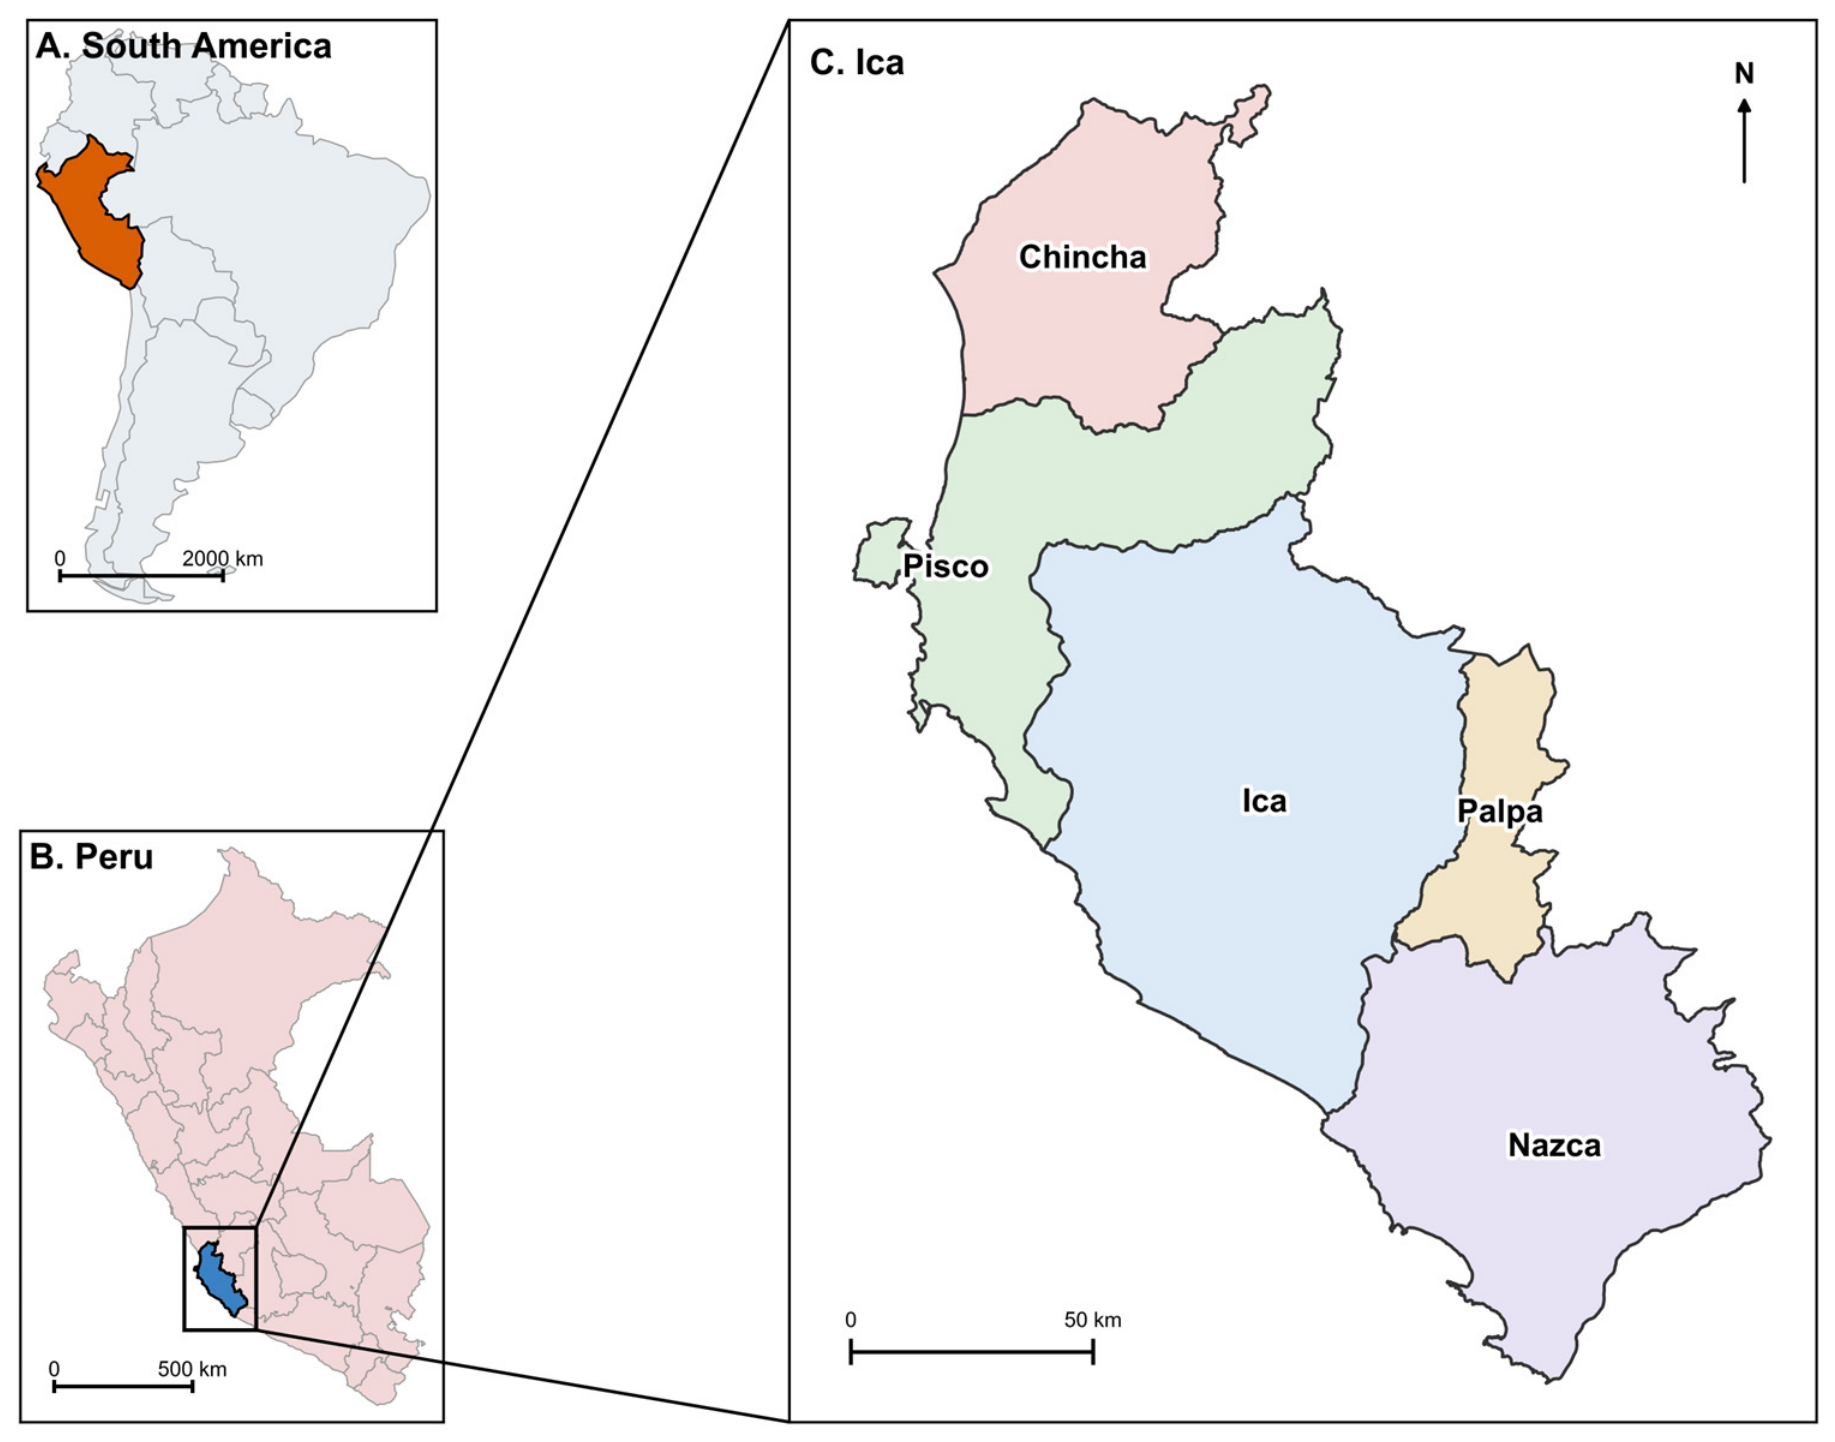
The Department of Ica is located on the south–central coast of Peru and comprises five provinces—Chincha, Ica, Nazca, Palpa, and Pisco—covering approximately 21,328 km2, including 22.32 km2 of insular surface, with elevations ranging from about 2 m above sea level in Paracas to 4893 m in the Andean areas of Chincha [26]. The location of the study area and its five provinces is shown in Figure 1. Province areas vary considerably, from 1232.88 km2 in Palpa to 7894.05 km2 in Ica; the remaining provinces cover 2987.35 km2 in Chincha, 3957.15 km2 in Pisco, and 5234.08 km2 in Nazca. The region is characterized by extensive coastal plains, deserts, and pampas, including the Lanchas and Villacurí plains and the Paracas Peninsula; four of the five provinces border the Pacific Ocean. Its population was estimated at 1,016,682 inhabitants in 2025 [27], with the largest population concentrated in Ica Province. More than 90% of the territory corresponds to desert environments, with predominantly arid surfaces susceptible to wind erosion and dust resuspension. The climate is warm and dry, with average temperatures of approximately 27 °C in summer and 18 °C in winter. A distinctive meteorological feature of the region is the occurrence of strong coastal winds, locally associated with the “Paracas winds,” which can mobilize large amounts of dust and sand and substantially reduce horizontal visibility. Such wind-driven dust events are recurrent along the Ica coast and provide an important environmental context for evaluating short-term respiratory effects of atmospheric dust [26].
Figure 1.
Geographic context of the study area in Ica, Peru. (A) Location of Peru within South America; (B) location of the Ica Department within Peru; and (C) provinces of the Ica Department.
2.2. Health Outcome
Daily counts of respiratory ED visits were obtained from the publicly available “Emergencias Hospitalarias” database of the Peruvian Ministry of Health’s National Health Information Repository (REUNIS) [28]. Respiratory visits were defined using diagnoses corresponding to Chapter X of the International Classification of Diseases, 10th Revision (ICD-10; J00–J99). Specific ICD-10 codes for COVID-19/SARS-CoV-2 available in the source database were not included in this outcome definition. This broad respiratory category was selected to characterize overall respiratory emergency healthcare utilization rather than disease-specific effects, consistent with previous environmental epidemiological studies evaluating respiratory morbidity [13,19,29,30,31]. Aggregated data were downloaded after applying filters for respiratory diagnoses and province, and daily counts were extracted separately for Chincha, Ica, Nazca, Palpa, and Pisco. Complete daily time series were then constructed for each province, including days with zero visits.
2.3. Atmospheric Dust Exposure and Meteorological Data
Atmospheric dust exposure was characterized using the Modern-Era Retrospective Analysis for Research and Applications, Version 2 (MERRA-2) Aerosol Diagnostics product (M2T1NXAER; NASA Global Modeling and Assimilation Office) [32,33], accessed through Google Earth Engine (Google LLC, Mountain View, CA, USA). The exposure metric was MERRA-2 DUSMASS, which represents the surface mass concentration of atmospheric dust in the reanalysis product, provided in kg/m3 and converted to µg/m3. For each day, hourly DUSMASS values were averaged within each MERRA-2 grid cell, and province-level atmospheric dust exposure was then estimated as the spatial mean of daily grid-cell concentrations intersecting each provincial boundary in the native MERRA-2 projection. In Peru, ground-based air-quality monitoring has historically been geographically limited, and publicly accessible historical records have been sparse [34]. Consequently, ground-based particulate matter data with comparable temporal and spatial coverage were not available across the study provinces.
Hourly 2 m air temperature and dew-point temperature were obtained from ERA5-Land (ECMWF/ERA5_LAND/HOURLY) through Google Earth Engine and converted from Kelvin to degrees Celsius. Relative humidity was calculated hourly from air temperature and dew-point temperature using the Magnus–Tetens approximation [35], constrained to 0–100%, and subsequently averaged by day. Environmental variables were defined according to Peru local time (UTC-5), with each day spanning 00:00–24:00 local time (05:00 UTC on day t to 05:00 UTC on day t + 1).
Daily environmental series were checked for completeness and duplicate dates. A single missing MERRA-2 day was identified for each province and interpolated as the mean of the immediately preceding and following daily values; this represented 0.08% of study days.
2.4. Statistical Analysis
All analyses were conducted in R version 4.6.0 (R Foundation for Statistical Computing, Vienna, Austria) using the dlnm version 2.4.10, splines version 4.6.0, dplyr 1.2.1, and sandwich version 3.1.3 packages. Attributable fractions and numbers were estimated using the published attrdl source function implementing the method of Gasparrini and Leone [36]. The study area map was created using Python version 3.14 (Python Software Foundation, Wilmington, DE, USA) with the GeoPandas version 1.1.3 and Matplotlib version 3.10.9 libraries.
Before model fitting, province-specific descriptive analyses were conducted for the outcome and environmental variables. Respiratory ED visits were summarized using total counts, mean daily counts, and the proportion of zero-visit days. Atmospheric dust concentrations, characterized using MERRA-2 DUSMASS, were summarized using the mean, median, and selected upper percentiles, while temperature and relative humidity were summarized using measures of central tendency and dispersion. Time-series plots were inspected to characterize seasonality, long-term trends, extreme exposure days, and potential anomalies.
Daily counts of respiratory ED visits were modeled using quasi-Poisson generalized linear models with a log link to account for overdispersion. The association between daily mean MERRA-2 DUSMASS and respiratory ED visits was modeled using a DLNM incorporated through a cross-basis function [25]. The exposure–response dimension was specified using a natural cubic spline with 3 degrees of freedom, allowing the relationship between atmospheric dust exposure and respiratory morbidity to vary flexibly without imposing linearity. A flexible non-linear exposure–response function was specified a priori to avoid imposing a linear concentration–response relationship, consistent with previous environmental epidemiological studies reporting potentially non-linear associations between particulate air pollution, including dust-related exposures, and respiratory morbidity [37,38]. The lag–response dimension was specified using a natural cubic spline with an intercept and 3 degrees of freedom over lags 0–14 days. This lag window was specified a priori to capture delayed short-term respiratory associations after atmospheric dust exposure.
Models were adjusted for long-term and seasonal trends using a natural cubic spline of time with 8 degrees of freedom per year, day of the week as a categorical variable, and national public holidays as a binary indicator [39]. Daily mean temperature and relative humidity were each included as natural cubic splines with 3 degrees of freedom.
The province-specific median MERRA-2 DUSMASS concentration was used as the reference because no established biological or health-based exposure threshold for DUSMASS was available for this study setting. The median was therefore used only as an analytical centering value and should not be interpreted as a safety threshold. Overall cumulative relative risks (RRs) and 95% confidence intervals (CIs) across lags 0–14 days were estimated at the province-specific 90th, 95th, and 97.5th percentiles of DUSMASS, relative to the median. These contrasts therefore represent within-province atmospheric dust exposure levels rather than equivalent absolute concentrations across provinces. Lag-specific RRs and cumulative associations across the lag period were also estimated at these percentiles to characterize the temporal pattern of the association.
2.5. Attributable Burden
The fraction and number of respiratory ED visits attributable to atmospheric dust concentrations above the province-specific median, as characterized by MERRA-2 DUSMASS, were estimated using the attributable-risk framework for DLNMs described by Gasparrini and Leone [36]. Concentrations at or below the median were set to the median as the counterfactual exposure level.
The backward perspective was used as the primary estimate, attributing each day’s outcome to the exposure history over the preceding 0–14 days. A complementary forward perspective was also estimated, attributing subsequent outcomes over lags 0–14 days to the exposure occurring on a given day. Accordingly, these estimates represent the burden associated with atmospheric dust concentrations above the province-specific median, relative to the median, and should not be interpreted as the total burden attributable to atmospheric dust exposure.
To characterize the contribution of different portions of the upper atmospheric dust exposure distribution, concentrations above the median were divided into four mutually exclusive province-specific intervals: 50th to <75th, 75th to <90th, 90th to <97.5th, and ≥97.5th percentile to the observed maximum. The forward perspective was used for this decomposition because attributable numbers can be additively partitioned across mutually exclusive exposure intervals.
Uncertainty in attributable fractions (AFs) and attributable numbers (ANs) was quantified using 5000 Monte Carlo simulations from the multivariate normal distribution of the estimated cross-basis coefficients and variance–covariance matrix. Empirical 95% CIs were defined by the 2.5th and 97.5th percentiles of the simulated estimates.
2.6. Sensitivity Analyses and Model Diagnostics
Sensitivity analyses used a shorter maximum lag of 7 days, varied temporal spline flexibility from 7 to 10 degrees of freedom per year, and omitted adjustment for relative humidity or public holidays. Newey–West heteroskedasticity- and autocorrelation-consistent 95% CIs with a maximum lag of 14 days were also estimated to assess the influence of residual serial correlation [40]. Model diagnostics included the quasi-Poisson dispersion parameter and ACF and PACF of residuals through lag 30.
2.7. Ethical Considerations
This study used exclusively publicly available, aggregated secondary data and did not involve individual-level identifiable information or direct contact with human participants. Therefore, ethics committee approval and informed consent were not required.
3. Results
3.1. Descriptive Characteristics
Each province contributed 1247 observation days, yielding 94,559 respiratory ED visits overall, with the highest counts in Ica (31,512) and Chincha (26,310) and the lowest in Palpa (3001) (Table 1). Mean daily atmospheric dust concentrations, characterized using MERRA-2 DUSMASS, varied markedly across provinces, from 17.67 µg/m3 in Palpa to 45.37 µg/m3 in Ica, with similarly wide differences at the upper end of the distribution (97.5th percentile: 32.13–87.27 µg/m3). Quasi-Poisson dispersion parameters ranged from 1.90 to 3.26, and residual autocorrelation was generally modest, although more pronounced in Chincha. Additional model diagnostics are presented in Supplementary Table S1, and province-specific daily time-series plots of respiratory ED visits, DUSMASS, mean temperature, and relative humidity are provided in Supplementary Figures S1–S5 to show seasonality, long-term trends, extreme exposure days, and potential anomalies.
Table 1.
Descriptive characteristics of respiratory emergency department visits and environmental exposures by province, Ica, Peru, 2023–2026.
3.2. Cumulative Exposure–Response Associations
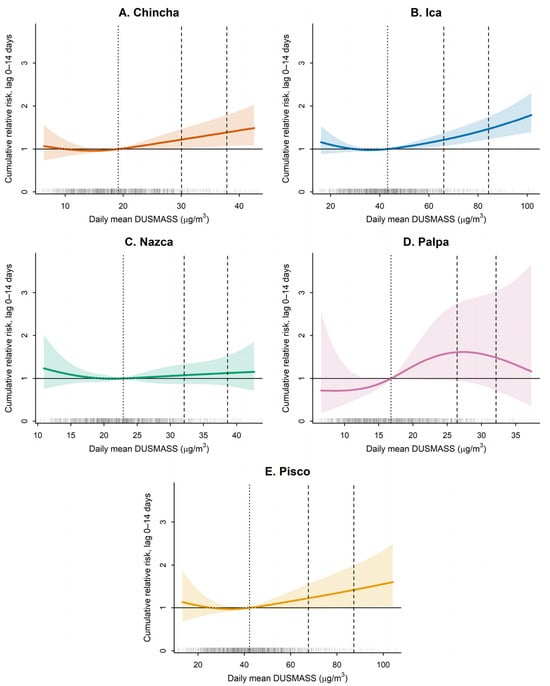
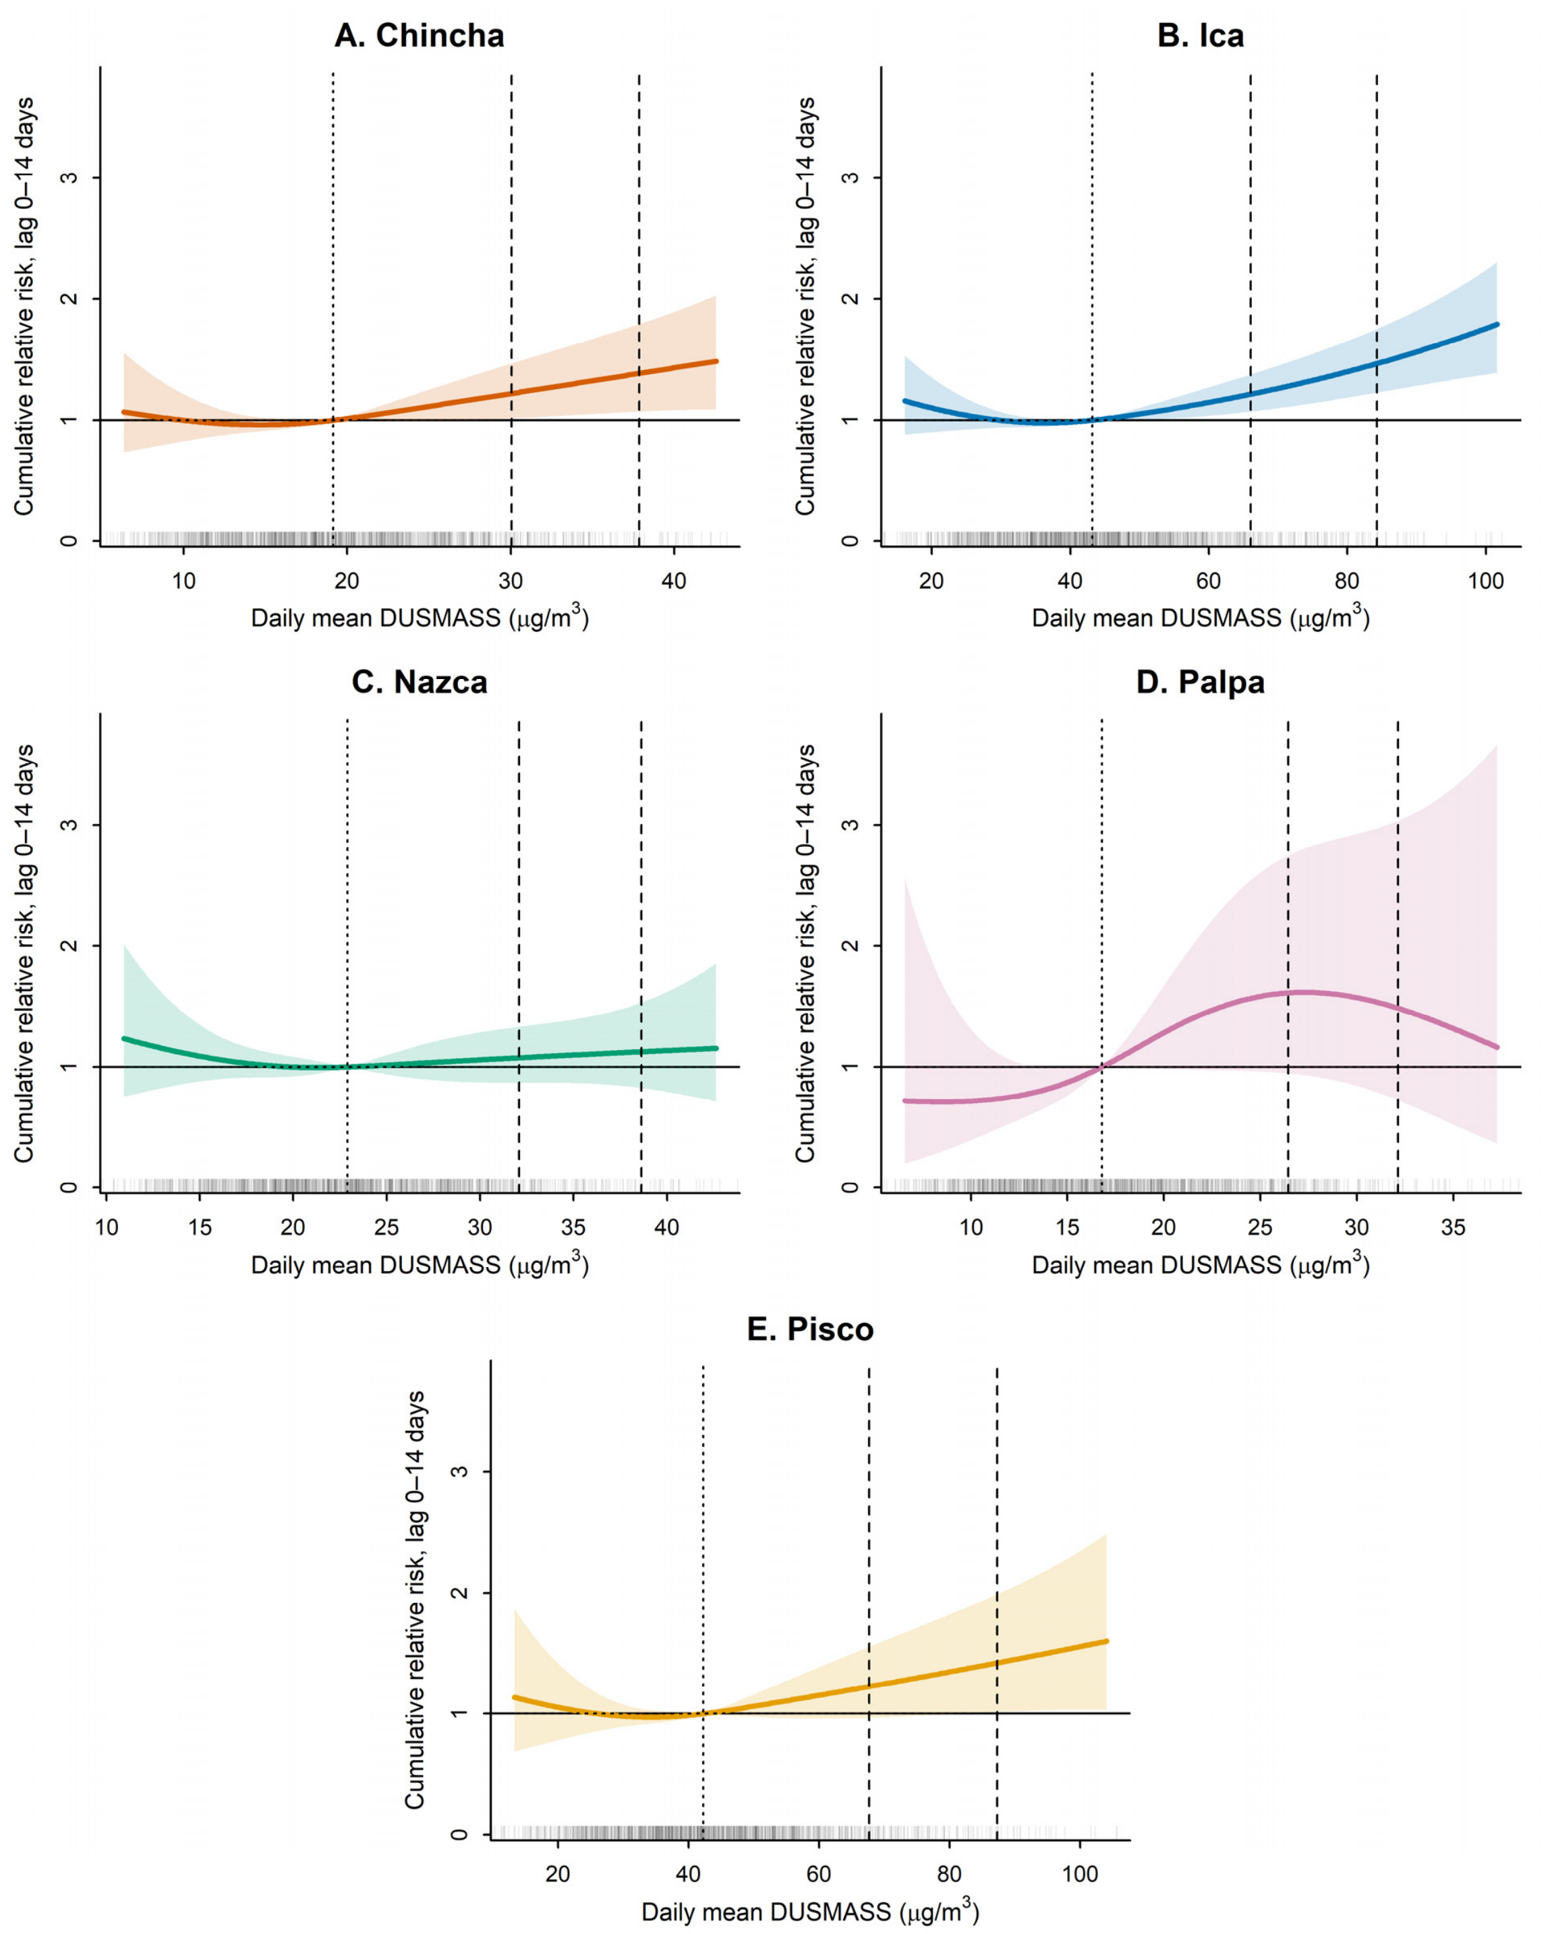
Cumulative atmospheric dust exposure–response associations over lags 0–14 days varied across provinces (Figure 2 and Table 2). The most consistent positive association was observed in Ica, where RRs increased across the upper DUSMASS distribution and the 97.5th-percentile RR was 1.47 (95% CI, 1.23–1.75). Chincha also showed positive associations in the main model, including at the 97.5th percentile (RR, 1.39; 95% CI, 1.07–1.79), although these estimates were less robust in sensitivity analyses. In Pisco, the estimate was elevated but imprecise at the 97.5th percentile (RR, 1.42; 95% CI, 1.01–1.99), while lower-percentile contrasts were more uncertain. By contrast, estimates in Nazca remained close to the null and imprecise, whereas Palpa showed larger but highly uncertain point estimates with wide CIs that included the null. Detailed estimates across all prespecified exposure percentiles and lag windows are provided in Supplementary Tables S2–S4, and province-specific three-dimensional exposure–lag–response surfaces are shown in Supplementary Figures S6–S10.
Figure 2.
Province-specific cumulative exposure–response associations between atmospheric dust and respiratory emergency department visits in Ica, Peru, 2023–2026.
Table 2.
Cumulative relative risks of respiratory emergency department visits at selected atmospheric dust percentiles, relative to the province-specific median.
Panels show estimates for (A) Chincha, (B) Ica, (C) Nazca, (D) Palpa, and (E) Pisco. Solid lines represent cumulative relative risks over lags 0–14 days and shaded areas indicate 95% confidence intervals. Estimates are centered at the province-specific median DUSMASS concentration (dotted vertical line); dashed vertical lines indicate the province-specific 90th and 97.5th percentiles. Rug marks (short black lines along the x-axis) indicate the observed distribution of daily MERRA-2 DUSMASS concentrations. Models were adjusted for long-term and seasonal trends, day of the week, national public holidays, mean temperature, and mean relative humidity. For visualization, curves are displayed over the province-specific 1st–99th percentile range of DUSMASS, focusing on exposure values with greater empirical support and avoiding visual instability at sparsely observed tail values. Observed maximum concentrations, which extended beyond the range displayed in the curves, are reported separately.
3.3. Respiratory ED Visits Attributable to Atmospheric Dust Concentrations Above the Median
Using the primary backward perspective, atmospheric dust concentrations above the province-specific median were associated with 6.32% (95% CI, 0.76% to 11.22%) of respiratory ED visits in Chincha (1663 attributable visits; 95% CI, 200 to 2953) and 6.64% (95% CI, 2.93% to 9.98%) in Ica (2091 attributable visits; 95% CI, 924 to 3146) (Table 3). Forward estimates were similar. Forward estimates were comparable in magnitude, with attributable fractions of 5.98% (95% CI, 0.61% to 10.27%) in Chincha and 6.14% (95% CI, 2.66% to 9.11%) in Ica, corresponding to 1573 (95% CI, 162 to 2703) and 1935 (95% CI, 838 to 2870) attributable visits, respectively. Backward attributable fractions were 2.19% (95% CI, −4.14% to 7.62%) in Nazca, 12.37% (95% CI, −2.16% to 22.40%) in Palpa, and 6.40% (95% CI, −0.57% to 12.61%) in Pisco, although these estimates were imprecise and included zero. Thus, the clearest evidence of attributable burden was observed in Chincha and Ica. These estimates reflect the model-based burden associated only with atmospheric dust concentrations above the province-specific median relative to the median and should not be interpreted as the total burden attributable to atmospheric dust exposure. Estimates from both the backward and forward perspectives are provided in Supplementary Table S5.
Table 3.
Respiratory emergency department visits attributable to atmospheric dust concentrations above the province-specific median.
3.4. Attributable Burden by Atmospheric Dust Exposure Interval
The forward decomposition of the attributable burden showed that attributable burden was concentrated mainly in the higher atmospheric dust exposure intervals in Chincha and was distributed across all intervals above the median in Ica (Table 4). In Chincha, the largest point estimates occurred between the 75th–90th percentile (AF, 2.06%; 95% CI, 0.01% to 3.78%) and the 90th–97.5th percentile (AF, 1.78%; 95% CI, 0.28% to 2.95%), with a smaller contribution above the 97.5th percentile. In Ica, all four atmospheric dust exposure intervals contributed positively, with the largest fractions between the 75th and 97.5th percentiles. No exposure interval showed a clearly positive attributable fraction in Nazca or Palpa, whereas Pisco showed positive but imprecise estimates across all intervals, with CIs including zero.
Table 4.
Attributable respiratory emergency department burden by mutually exclusive atmospheric dust exposure bands.
3.5. Sensitivity Analyses
Sensitivity analyses showed greater robustness of the atmospheric dust-respiratory ED visit association in Ica than in the other provinces (Table 5 and Supplementary Tables S6–S10). Reducing the maximum lag to 7 days attenuated the high-exposure associations in Chincha, Ica, and Pisco, while alternative temporal spline specifications substantially affected estimates in Chincha and Pisco but had less influence in Ica, where the 97.5th-percentile RR remained elevated across 7–10 degrees of freedom per year. Excluding relative humidity or public holidays produced minimal changes. With Newey–West covariance estimates, point estimates were unchanged but CIs widened; the association remained evident in Ica, whereas estimates in Chincha and Pisco became less precise. Overall, Ica showed the most consistent association across alternative model specifications.
Table 5.
Sensitivity analyses of the cumulative atmospheric dust–respiratory emergency department association.
4. Discussion
Province-specific estimates of the association between modeled atmospheric dust and respiratory ED visits varied in precision and robustness, with consistent evidence in Ica and greater uncertainty in the remaining provinces. At the 97.5th percentile, cumulative relative risks were 1.39, 1.47, and 1.42 in Chincha, Ica, and Pisco, respectively, compared with their province-specific medians. Consistent with these exposure–response patterns, the attributable fraction associated with concentrations above the median was estimated at 6.32% in Chincha and 6.64% in Ica. Pisco showed a similar point estimate (6.40%), although with substantially greater uncertainty (95% CI, −0.57% to 12.61%). Taken together, these findings suggest that the relationship between atmospheric dust and respiratory emergency care was not uniform across the study region, and that differences in statistical precision and healthcare-use patterns should be considered when interpreting province-specific estimates.
Our findings are broadly consistent with previous epidemiological evidence linking short-term dust exposure with increased respiratory morbidity. A systematic review and meta-analysis of 71 time-series and case-crossover studies reported an increased risk of respiratory morbidity associated with desert dust exposure (RR 1.0693, 95% CI 1.0188–1.1224) [41]. Similar patterns have been reported for acute respiratory healthcare use. In the southwestern United States, Rowan et al. observed increased respiratory ED visits following identified dust storms [42], while Zheng et al. reported increased ED visits for asthma and culture-negative pneumonia following dust storm events across Arizona, California, and Utah [43]. In Hong Kong, Tam et al. also reported increased emergency admissions for chronic obstructive pulmonary disease following Asian dust storm episodes [7]. These studies illustrate an event-based approach in which exposure is defined by identifying discrete dust events and distinguishing affected from non-affected days, thereby making the occurrence and timing of the event part of the exposure definition. In contrast, dust exposure can also be represented quantitatively as a daily concentration. For example, Pun et al. estimated daily concentrations of re-suspended mineral dust using source-apportioned PM10 and examined their association with respiratory hospitalizations [44]. In our study, dust exposure was likewise represented as a continuous concentration, with DUSMASS providing a quantitative estimate of surface mineral dust concentration for each study day, without requiring prior classification of days according to the occurrence of a dust event.
An additional consideration is that the terminology used to characterize dust-related exposures is not necessarily interchangeable. Although the health literature frequently uses the term desert dust when examining the health effects of airborne mineral dust, not all atmospheric mineral dust originates from deserts; mineral particles may also be emitted from other exposed soil surfaces, including agricultural and bare land [45]. Desert dust more specifically refers to mineral particles originating from arid and semi-arid land surfaces, whereas dust storms describe meteorological events in which substantial amounts of soil-derived particles are lifted into the atmosphere by strong turbulent winds, can be transported over long distances, and may contribute to elevated particulate matter concentrations and respiratory health risks [45,46]. This distinction is particularly relevant to our exposure definition. MERRA-2 models dust as a specific aerosol component, separately from other aerosol species such as sea salt, sulfate, black carbon, and organic carbon, and DUSMASS represents its surface mass concentration [32,33]. Accordingly, our exposure is most appropriately interpreted as MERRA-2-derived surface mineral dust concentration. Although desert dust may contribute substantially to atmospheric mineral dust in arid settings such as our study region, DUSMASS does not itself establish the geographic source of the modeled dust; therefore, our exposure should not be interpreted specifically as desert dust without additional source-attribution information.
The exposure–response and attributable burden analyses together suggest that the respiratory burden associated with above-median atmospheric dust concentrations was not concentrated at the most extreme exposure levels, particularly in Ica and Chincha. In both provinces, increasing visit rates across the upper exposure distribution were accompanied by attributable burden across several exposure ranges, with concentrations below the 97.5th percentile contributing substantially to the overall burden associated with concentrations above the median. This pattern reflects the joint influence of the magnitude of the estimated relative risk and the frequency of exposure. Although the estimated relative risk increased toward the upper end of the distribution, these extreme concentrations occurred relatively infrequently, whereas smaller elevations in risk across more commonly occurring concentrations accumulated over a larger number of days. Thus, focusing exclusively on extreme atmospheric dust concentrations could lead to a relevant component of the respiratory burden associated with more frequent, moderately elevated concentrations being overlooked. Pisco showed a broadly similar pattern in the point estimates, including an increasing exposure–response curve, an overall attributable fraction comparable in magnitude to those of Ica and Chincha, and positive estimates across exposure bands; however, the greater uncertainty surrounding these estimates limits the strength of this interpretation for Pisco. In contrast, the absence of a comparable exposure–response pattern in Nazca and the marked imprecision in Palpa do not support extending this interpretation uniformly across the study region.
The observed associations are biologically plausible within the environmental context of the Ica region. The hyper-arid coastal environment provides conditions favorable for wind-driven erosion and atmospheric transport of mineral particles. In particular, strong southerly to southeasterly winds locally known as Paracas winds can mobilize particles from the Pisco–Ica coastal desert, with atmospheric modeling and satellite observations documenting their transport and dispersion across the region [23]. Inhaled particulate matter can deposit throughout the respiratory tract and promote oxidative stress and inflammatory responses in airway epithelial cells and alveolar macrophages, providing plausible pathways through which short-term increases in mineral dust may trigger or exacerbate respiratory conditions requiring emergency care [2]. Furthermore, wind-driven dust may be transported alongside biological materials, including fungal spores and bacterial components. Experimental evidence suggests that these biological constituents may contribute to or exacerbate dust-related respiratory inflammatory responses [47]. However, environmental exposure alone does not explain the differences observed across provinces. This is particularly evident for Ica and Pisco, two geographically close provinces with remarkably similar DUSMASS distributions and similar exposure–response point estimates, but substantially different precision. Interpretation of this contrast should also consider the healthcare context. According to official population projections, the populations of Ica and Pisco were estimated at 487,385 and 190,078 inhabitants, respectively, for 2024 [36]. Ica also has greater healthcare capacity than Pisco, as reflected in official statistics on healthcare facilities, hospital beds, and healthcare personnel [48], while the respiratory ED visits analyzed in our study are geographically classified according to the healthcare facility where care was provided rather than the patient’s place of residence. In this context, the substantially larger number of respiratory emergency visits recorded in Ica may reflect not only differences in the occurrence of respiratory morbidity, but also differences in population size and healthcare availability and utilization. The larger number of events may, in turn, provide greater statistical information for characterizing the exposure–response relationship in Ica, although the precision of these estimates also depends on other characteristics of the data and model, including dispersion and exposure variability. Conversely, the marked imprecision observed in Palpa may partly reflect its much smaller population and lower number of respiratory ED visits, which reduce the statistical information available to estimate exposure–response and attributable-burden parameters and make estimates more sensitive to sparse counts or extreme exposure days. Thus, despite similar atmospheric dust distributions and exposure–response point estimates in Ica and Pisco, their differing statistical evidence should not be interpreted straightforwardly as indicating different biological responses to mineral dust. More broadly, the geographic heterogeneity observed across the study region may reflect variation in the estimated exposure–response relationships, as well as differences in the information available to characterize them and in the healthcare context underlying the observed ED counts.
These findings may have implications for environmental health surveillance in the Ica region, where respiratory diseases already represent an important source of healthcare demand. In 2023, official statistics from Peru’s Ministry of Health recorded approximately 81,000 healthcare visits for acute respiratory infections were recorded among children younger than five years in the department, and several respiratory conditions ranked among the leading causes of morbidity in children [48]. Importantly, our attributable burden analyses suggest that the respiratory burden associated with atmospheric dust may not be confined to the most extreme exposure levels. In Ica and Chincha, a substantial proportion of the estimated burden occurred across more frequently observed, moderately elevated concentrations rather than exclusively at concentrations above the 97.5th percentile. This distinction is relevant for surveillance because approaches focused only on discrete dust storms or exceptionally high-concentration days may overlook health impacts accumulating across more frequent periods of elevated mineral dust. Continuous monitoring of atmospheric dust concentrations could therefore complement event-based warning systems by characterizing variation in exposure across the full concentration distribution. However, the province-specific medians and percentiles used in our analyses were analytical reference points rather than health-based thresholds and should not be interpreted as concentrations at which public health interventions should be initiated. Ground-based PM10 monitoring could complement modeled atmospheric dust estimates, improve the characterization of absolute exposure concentrations, and provide additional evidence to inform future environmental health surveillance in the region.
This study should be interpreted in light of several limitations. First, its ecological time-series design precludes individual-level attribution of exposure and does not allow the observed associations to be interpreted as individual causal effects. Second, respiratory ED visits in REUNIS are geographically classified according to the healthcare facility where care was provided rather than the patient’s place of residence. Consequently, province-level DUSMASS concentrations may not represent the environmental exposure experienced by all patients attending facilities within that province, particularly when healthcare use involves travel across provincial boundaries. Third, atmospheric dust exposure was operationalized using MERRA-2 DUSMASS, which provides an estimate of surface mineral dust concentration, rather than direct ground-level measurements. Continuous dust-monitoring data with sufficient spatial and temporal coverage were not available across the study provinces; therefore, reanalysis-based dust estimates provide continuous spatial and temporal coverage and have been proposed as an alternative approach for epidemiological assessment of dust exposure [4]. Province-level exposure was used because the analysis was ecological and respiratory ED visits were aggregated by province. The province-level DUSMASS metric was calculated as an unweighted spatial average and was not population-weighted. Therefore, all areas within each province contributed equally to the exposure metric, regardless of the spatial distribution of the population. In addition, wind-driven dust resuspension does not occur within clearly defined administrative, urban, or facility-level boundaries; therefore, restricting exposure to monitoring locations or urban centers would not necessarily represent where patients lived, worked, or were exposed. Nevertheless, province-level MERRA-2 estimates cannot capture individual or within-province variation in exposure, including differences in elevation, local meteorology, population distribution, and land use, and the resulting exposure measurement error may affect the magnitude and precision of the estimated associations. Fourth, although the study region is highly susceptible to wind-driven erosion and dust transport, DUSMASS does not identify the geographic origin of the modeled particles. Because we did not perform source-attribution or trajectory analyses, the DUSMASS-based exposure evaluated here should not be interpreted specifically as desert dust, as the geographic origin of the modeled dust cannot be established without additional source-attribution information. Fifth, respiratory emergency visits were analyzed collectively using ICD-10 codes J00–J99. This broad outcome was intended to characterize overall respiratory emergency healthcare demand but includes conditions with different etiologies and pathophysiological mechanisms and does not allow us to determine whether the observed associations were driven by particular respiratory conditions or whether susceptibility to atmospheric dust differed across disease categories. Data on respiratory-virus circulation with sufficient temporal and geographic resolution for province-level daily analyses were unavailable. Available surveillance in Peru is largely regional, based on selected samples, and, for some pathogens, conducted at intervals that do not provide continuous province-specific measures of viral activity [49]. Although models adjusted flexibly for long-term and seasonal patterns, short-term epidemics may not have been fully captured, and residual confounding by respiratory-virus circulation cannot be excluded. Sixth, the exposure contrasts used to estimate relative risks were defined relative to province-specific DUSMASS distributions. Thus, the medians and percentiles used for comparison correspond to different absolute concentrations across provinces and should not be interpreted as common biological or health-based thresholds. Seventh, residual confounding by unmeasured co-pollutants or other environmental factors cannot be excluded despite adjustment for temporal patterns, temperature, and relative humidity. Additionally, bioaerosols such as pollen and fungal spores were not measured in this study, precluding assessment of their temporal association with DUSMASS and their potential contribution to the observed associations with respiratory emergency visits. Eighth, some estimates, particularly in Chincha and Pisco, were sensitive to the choice of maximum lag, temporal degrees of freedom, and adjustment for residual autocorrelation, indicating that their magnitude and precision depend to some extent on model specification. Although the 0–14-day lag window was specified a priori to capture delayed short-term respiratory associations, the attenuation observed in the 0–7-day sensitivity analysis suggests that the cumulative estimates depend partly on longer-lag components. Finally, the study was conducted in five provinces of a hyper-arid coastal region of Peru; therefore, the magnitude and shape of the observed exposure–response relationships may not be directly generalizable to populations with different environmental conditions, dust sources, exposure distributions, or healthcare contexts.
5. Conclusions
In this ecological time-series study of the Ica region, atmospheric dust concentrations showed heterogeneous province-specific associations with respiratory ED visits, with consistent evidence in Ica and greater uncertainty in the remaining provinces. The attributable burden in Ica and Chincha was not concentrated at the most extreme exposure levels but also occurred across more frequent, moderately elevated concentrations, suggesting that surveillance focused solely on discrete dust storm events may underestimate the cumulative respiratory burden. Given the limitations of the ecological design and the use of DUSMASS to operationalize atmospheric dust exposure, these findings should be interpreted as population-level evidence and should not be automatically generalized to other environmental settings.
Supplementary Materials
The following supporting information can be downloaded at https://www.mdpi.com/article/10.3390/epidemiologia7060149/s1, Supplementary Table S1. Model diagnostics and interpolation audit by province; Supplementary Table S2. Cumulative relative risks at all prespecified DUSMASS percentiles; Supplementary Table S3. Lag-specific relative risks at P90, P95, and P97.5; Supplementary Table S4. Cumulative relative risks across selected lag windows at P90, P95, and P97.5; Supplementary Table S5. Attributable burden above the province-specific median using backward and forward perspectives; Supplementary Table S6. Sensitivity analysis for maximum lag; Supplementary Table S7. Sensitivity analysis for time-trend flexibility; Supplementary Table S8. Sensitivity analysis for relative-humidity adjustment; Supplementary Table S9. Sensitivity analysis for national-holiday adjustment; Supplementary Table S10. Newey–West/HAC sensitivity analysis; Supplementary Figure S1. Exploratory daily time series—Chincha; Supplementary Figure S2. Exploratory daily time series—Ica; Supplementary Figure S3. Exploratory daily time series—Nazca; Supplementary Figure S4. Exploratory daily time series—Palpa; Supplementary Figure S5. Exploratory daily time series—Pisco; Supplementary Figure S6. Three-dimensional exposure–lag–response surface—Chincha; Supplementary Figure S7. Three-dimensional exposure–lag–response surface—Ica; Supplementary Figure S8. Three-dimensional exposure–lag–response surface—Nazca; Supplementary Figure S9. Three-dimensional exposure–lag–response surface—Palpa; Supplementary Figure S10. Three-dimensional exposure–lag–response surface—Pisco.
Author Contributions
Conceptualization, A.H.-V.; methodology, A.H.-V.; software, A.H.-V.; validation, A.H.-V., D.V.-D. and J.G.V.; formal analysis, A.H.-V.; investigation, A.H.-V., D.V.-D. and J.G.V.; data curation, A.H.-V.; writing—original draft preparation, A.H.-V., D.V.-D. and J.G.V.; writing—review and editing, A.H.-V., D.V.-D. and J.G.V.; visualization, A.H.-V.; supervision, A.H.-V.; project administration, A.H.-V. All authors have read and agreed to the published version of the manuscript.
Funding
This research received no external funding.
Institutional Review Board Statement
This study used exclusively publicly available, aggregated secondary data. Therefore, ethics committee approval was not required.
Informed Consent Statement
This study did not involve individual-level identifiable information or direct contact with human participants. Therefore, informed consent was not required.
Data Availability Statement
All data used in this study are publicly available. Daily counts of respiratory emergency department visits were obtained from the “Emergencias Hospitalarias” database of the Peruvian Ministry of Health’s National Health Information Repository (REUNIS), available at https://www.minsa.gob.pe/reunis/?op=3&niv=3&tbl=3 (accessed on 10 August 2026). Atmospheric dust data were obtained from the NASA Modern-Era Retrospective Analysis for Research and Applications, Version 2 (MERRA-2), using the M2T1NXAER Aerosol Diagnostics product, and meteorological data were obtained from ERA5-Land. Environmental data were accessed and processed through Google Earth Engine. No new primary data were generated during this study.
Acknowledgments
A.H.-V. gratefully acknowledges the specialized training received through the 2023 Time-Series Regression in Environmental Epidemiology course at the Pontificia Universidad Católica de Chile, the 2026 Intensive Cmourse on Time-Series Epidemiology organized by the Latin American Center of Excellence on Climate Change and Health (Clima), supported by a scholarship from the GeoHealth Hub Peru project, and the Time-series Regression for Public Health course at the Asia Summer School 2026. The knowledge and methodological expertise gained through these programs substantially contributed to the design, implementation, and interpretation of the time-series analyses presented in this study. During the preparation of this manuscript, the authors used ChatGPT, Version 5.5, to assist with English translation and language editing, including improvements to grammar, clarity, and readability. The authors reviewed and edited all AI-generated output and take full responsibility for the content of this publication.
Conflicts of Interest
The authors declare no conflicts of interest.
Abbreviations
The following abbreviations are used in this manuscript:
| ED | Emergency department |
| DLNM | Distributed lag non-linear model |
| MERRA-2 | Modern-Era Retrospective Analysis for Research and Applications, Version 2 |
| DUSMASS | Surface mass concentration of atmospheric dust (MERRA-2 aerosol diagnostic variable) |
| RR | Relative risk |
| CI | Confidence interval |
| AF | Attributable fraction |
| AN | Attributable number |
| ICD-10 | International Classification of Diseases, 10th Revision |
| LMICs | Low- and middle-income countries |
| ERA5-Land | ECMWF Reanalysis v5, land component |
| ECMWF | European Centre for Medium-Range Weather Forecasts |
| ACF | Autocorrelation function |
| PACF | Partial autocorrelation function |
| df | Degrees of freedom |
| WHO | World Health Organization |
| INEI | Instituto Nacional de Estadística e Informática |
References
- Hamidian, M.; Jor, A.; Keikhaie, K.R.; Mazidimoradi, A.; Shahabinia, Z.; Salehiniya, H. Dust air pollution and hospital visits for respiratory, cardiovascular, and eye diseases in Eastern Iran. Sci. Rep. 2025, 15, 45013. [Google Scholar] [CrossRef] [Scilit] [PubMed] [PubMed Central]
- Hu, A.; Li, R.; Chen, G.; Chen, S. Impact of Respiratory Dust on Health: A Comparison Based on the Toxicity of PM2.5, Silica, and Nanosilica. Int. J. Mol. Sci. 2024, 25, 7654. [Google Scholar] [CrossRef] [Scilit] [PubMed] [PubMed Central]
- Ma, Y.; Xiao, B.; Liu, C.; Zhao, Y.; Zheng, X. Association between Ambient Air Pollution and Emergency Room Visits for Respiratory Diseases in Spring Dust Storm Season in Lanzhou, China. Int. J. Environ. Res. Public Health 2016, 13, 613. [Google Scholar] [CrossRef] [Scilit] [PubMed] [PubMed Central]
- Tobías, A.; Stafoggia, M. Modeling Desert Dust Exposures in Epidemiologic Short-term Health Effects Studies. Epidemiology 2020, 31, 788–795. [Google Scholar] [CrossRef] [Scilit]
- Nkosi, V.; Mathee, A.; Blesic, S.; Kapwata, T.; Kunene, Z.; Du Preez, D.J.; Garland, R.; Wright, C.Y. Exploring Meteorological Conditions and Human Health Impacts during Two Dust Storm Events in Northern Cape Province, South Africa: Findings and Lessons Learnt. Atmosphere 2022, 13, 424. [Google Scholar] [CrossRef] [Scilit]
- Censi, P.; Tamburo, E.; Speziale, S.; Zuddas, P.; Randazzo, L.A.; Punturo, R.; Cuttitta, A.; Aricò, P. Yttrium and lanthanides in human lung fluids, probing the exposure to atmospheric fallout. J. Hazard. Mater. 2011, 186, 1103–1110. [Google Scholar] [CrossRef] [Scilit]
- Tam, W.W.S.; Wong, T.W.; Wong, A.H.S.; Hui, D.S.C. Effect of dust storm events on daily emergency admissions for respiratory diseases. Respirology 2012, 17, 143–148. [Google Scholar] [CrossRef] [Scilit]
- Aghababaeian, H.; Dastoorpoor, M.; Ghasemi, A.; Kiarsi, M.; Khanjani, N.; Araghi Ahvazi, L. Cardiovascular and respiratory emergency dispatch due to short-term exposure to ambient PM10 in Dezful, Iran. J. Cardiovasc. Thorac. Res. 2019, 11, 264–271. [Google Scholar] [CrossRef] [Scilit]
- Hiraiwa, K.; van Eeden, S.F. Contribution of lung macrophages to the inflammatory responses induced by exposure to air pollutants. Mediat. Inflamm. 2013, 2013, 619523. [Google Scholar] [CrossRef] [Scilit] [PubMed] [PubMed Central]
- Tapak, M.; Sadeghi, S.; Ghazanfari, T.; Mosaffa, N. Chemical exposure and alveolar macrophages responses: “The role of pulmonary defense mechanism in inhalation injuries”. BMJ Open Respir. Res. 2023, 10, e001589. [Google Scholar] [CrossRef] [Scilit] [PubMed] [PubMed Central]
- Nakamura, T.; Hashizume, M.; Ueda, K.; Shimizu, A.; Takeuchi, A.; Kubo, T.; Hashimoto, K.; Moriuchi, H.; Odajima, H.; Kitajima, T.; et al. Asian Dust and Pediatric Emergency Department Visits Due to Bronchial Asthma and Respiratory Diseases in Nagasaki, Japan. J. Epidemiol. 2016, 26, 593–601. [Google Scholar] [CrossRef] [Scilit]
- Tao, Y.; An, X.; Sun, Z.; Hou, Q.; Wang, Y. Association between dust weather and number of admissions for patients with respiratory diseases in spring in Lanzhou. Sci. Total Environ. 2012, 423, 8–11. [Google Scholar] [CrossRef] [Scilit]
- Tobias, A.; Chua, P.C.; Ith, S.; Yu, L.S.; Stafoggia, M.; Roqué, M.; Lwin, K.S.; Hashizume, M. Desert dust, sandstorms, and infectious diseases: A scoping review. Environ. Res. 2025, 285, 122582. [Google Scholar] [CrossRef] [Scilit] [PubMed]
- Rodríguez-Arias, R.M.; Rojo, J.; Fernández-González, F.; Pérez-Badia, R. Desert dust intrusions and their incidence on airborne biological content. Review and case study in the Iberian Peninsula. Environ. Pollut. 2023, 316, 120464. [Google Scholar] [CrossRef] [Scilit] [PubMed]
- Akpinar-Elci, M.; Martin, F.E.; Behr, J.G.; Diaz, R. Saharan dust, climate variability, and asthma in Grenada, the Caribbean. Int. J. Biometeorol. 2015, 59, 1667–1671. [Google Scholar] [CrossRef] [Scilit]
- Sadeghimoghaddam, A.; Khankeh, H.; Norozi, M.; Fateh, S.; Farrokhi, M. Investigating the effects of dust storms on morbidity and mortality due to cardiovascular and respiratory diseases: A systematic review. J. Educ. Health Promot. 2021, 10, 191. [Google Scholar] [CrossRef] [Scilit] [PubMed] [PubMed Central]
- Hashizume, M.; Kim, Y.; Ng, C.F.S.; Chung, Y.; Madaniyazi, L.; Bell, M.L.; Guo, Y.L.; Kan, H.; Honda, Y.; Yi, S.-M.; et al. Health Effects of Asian Dust: A Systematic Review and Meta-Analysis. Environ. Health Perspect. 2020, 128, 66001. [Google Scholar] [CrossRef] [Scilit] [PubMed] [PubMed Central]
- Annesi-Maesano, I. Air quality and respiratory health in low- and middle-income countries: The breadth of inequality. IJTLD Chronic Respir. Dis. 2026, 1, 6–11. [Google Scholar] [CrossRef] [Scilit]
- Steenland, K.; Vu, B.; Scovronick, N. Effect modification by maximum temperature of the association between PM2.5 and short-term cardiorespiratory mortality and emergency room visits in Lima, Peru, 2010–2016. J. Expo. Sci. Environ. Epidemiol. 2022, 32, 590–595. [Google Scholar] [CrossRef] [Scilit] [PubMed] [PubMed Central]
- Tapia, V.; Steenland, K.; Sarnat, S.E.; Vu, B.; Liu, Y.; Sánchez-Ccoyllo, O.; Vasquez, V.; Gonzales, G.F. Time-series analysis of ambient PM2.5 and cardiorespiratory emergency room visits in Lima, Peru during 2010–2016. J. Expo. Sci. Environ. Epidemiol. 2020, 30, 680–688. [Google Scholar] [CrossRef] [Scilit] [PubMed] [PubMed Central]
- Tapia, V.; Steenland, K.; Vu, B.; Liu, Y.; Vásquez, V.; Gonzales, G.F. PM2.5 exposure on daily cardio-respiratory mortality in Lima, Peru, from 2010 to 2016. Environ. Health 2020, 19, 63. [Google Scholar] [CrossRef] [Scilit] [PubMed] [PubMed Central]
- Vu, B.N.; Tapia, V.; Ebelt, S.; Gonzales, G.F.; Liu, Y.; Steenland, K. The association between asthma emergency department visits and satellite-derived PM2.5 in Lima, Peru. Environ. Res. 2021, 199, 111226. [Google Scholar] [CrossRef] [Scilit] [PubMed] [PubMed Central]
- Briceño-Zuluaga, F.; Castagna, A.; Rutllant, J.A.; Flores-Aqueveque, V.; Caquineau, S.; Sifeddine, A.; Velazco, F.; Gutierrez, D.; Cardich, J. Paracas dust storms: Sources, trajectories and associated meteorological conditions. Atmos. Environ. 2017, 165, 99–110. [Google Scholar] [CrossRef] [Scilit]
- Romero, R.M.; Loayza, R.; Huaman, G.; Calderón, D.; Buleje, Y.; Arroyo, J.; Tasayco, M.; Torres, C.; Tacza, J.; Szpigel, S.; et al. Electrical lead time during an extreme haboob-like dust-front intrusion in Ica, Peru. Atmos. Res. 2026, 342, 109171. [Google Scholar] [CrossRef] [Scilit]
- Gasparrini, A.; Armstrong, B.; Kenward, M.G. Distributed lag non-linear models. Stat. Med. 2010, 29, 2224–2234. [Google Scholar] [CrossRef] [Scilit]
- Centro Nacional de Planeamiento Estratégico (CEPLAN). Ica: Información para el Planeamiento con Enfoque Territorial; Centro Nacional de Planeamiento Estratégico (CEPLAN): Lima, Perú, 2025; pp. 1–129. Available online: https://cdn.www.gob.pe/uploads/document/file/9232982/7576815-ica_informacion-para-el-planeamiento-con-enfoque-territorial.pdf?v=1767215247 (accessed on 11 October 2026).
- Instituto Nacional de Estadística e Informática. Perú: Censos Nacionales 2025: XIII de Población, VIII de Vivienda y IV de Comunidades Indígenas. Resultados a Nivel Departamental, Provincial y Distrital [Internet]; Instituto Nacional de Estadística e Informática: Lima, Perú, 2026; Available online: https://proyectos.inei.gob.pe/dir-segmentacion-ci/postcensal/prod/adjuntos/publicaciones/Publicacion_nacional_de_los_censos_nacionales.pdf (accessed on 11 October 2026).
- Ministerio de Salud del Perú; Repositorio Único Nacional de Información en Salud (REUNIS) [Internet]. Emergencias Hospitalarias. Ministerio de Salud del Perú: Lima, Perú, 2026. Available online: https://www.minsa.gob.pe/reunis/?op=3&niv=3&tbl=3 (accessed on 4 September 2026).
- Zaib, S.; Lu, J.; Yan, G.; Yin, X.; Lei, X.; Shahid, M.Z.; Siddique, A.; Al-Nesf, M.A.Y. Characterization of ambient air quality and its relationship with respiratory morbidity in typical cities of Northwest China (NWC). Air Qual. Atmos. Health 2025, 18, 3551–3565. [Google Scholar] [CrossRef] [Scilit]
- Howlett-Downing, C.; Boman, J.; Molnár, P.; Shirinde, J.; Wichmann, J. Case-crossover study for the association between increased hospital admissions for respiratory diseases and the increase in atmospheric PM2.5 and PM2.5-bound trace elements in Pretoria, South Africa. Int. J. Environ. Health Res. 2024, 34, 1551–1565. [Google Scholar] [CrossRef] [Scilit]
- Taj, T.; Malmqvist, E.; Stroh, E.; Oudin Åström, D.; Jakobsson, K.; Oudin, A. Short-Term Associations between Air Pollution Concentrations and Respiratory Health—Comparing Primary Health Care Visits, Hospital Admissions, and Emergency Department Visits in a Multi-Municipality Study. Int. J. Environ. Res. Public Health 2017, 14, 587. [Google Scholar] [CrossRef] [Scilit]
- Gelaro, R.; McCarty, W.; Suárez, M.J.; Todling, R.; Molod, A.; Takacs, L.; Randles, C.; Darmenov, A.; Bosilovich, M.G.; Reichle, R.; et al. The Modern-Era Retrospective Analysis for Research and Applications, Version 2 (MERRA-2). J. Clim. 2017, 30, 5419–5454. [Google Scholar] [CrossRef] [Scilit] [PubMed] [PubMed Central]
- Randles, C.A.; Da Silva, A.M.; Buchard, V.; Colarco, P.R.; Darmenov, A.; Govindaraju, R.; Smirnov, A.; Holben, B.; Ferrare, R.; Hair, J.; et al. The MERRA-2 Aerosol Reanalysis, 1980—Onward, Part I: System Description and Data Assimilation Evaluation. J. Clim. 2017, 30, 6823–6850. [Google Scholar] [CrossRef] [Scilit] [PubMed] [PubMed Central]
- Hernández-Vásquez, A.; Díaz-Seijas, D. Contaminación ambiental y repositorios de datos históricos de contaminantes atmosféricos en Perú. Salud Publica Mex. 2017, 59, 507. [Google Scholar] [CrossRef] [Scilit]
- Alduchov, O.A.; Eskridge, R.E. Improved Magnus Form Approximation of Saturation Vapor Pressure. J. Appl. Meteor. 1996, 35, 601–609. [Google Scholar] [CrossRef] [Scilit]
- Gasparrini, A.; Leone, M. Attributable risk from distributed lag models. BMC Med. Res. Methodol. 2014, 14, 55. [Google Scholar] [CrossRef] [Scilit]
- Aghababaeian, H.; Ostadtaghizadeh, A.; Ardalan, A.; Asgary, A.; Akbary, M.; Yekaninejad, M.S.; Stephens, C. Global Health Impacts of Dust Storms: A Systematic Review. Environ. Health Insights 2021, 15, 11786302211018390. [Google Scholar] [CrossRef] [Scilit]
- Shafqat, A.; Park, E. Broad Applications of Distributed Lag Non-Linear Model in Public Health: A Comprehensive Review. Geohealth 2025, 9, e2025GH001608. [Google Scholar] [CrossRef] [Scilit] [PubMed] [PubMed Central]
- Bhaskaran, K.; Gasparrini, A.; Hajat, S.; Smeeth, L.; Armstrong, B. Time series regression studies in environmental epidemiology. Int. J. Epidemiol. 2013, 42, 1187–1195. [Google Scholar] [CrossRef] [Scilit] [PubMed] [PubMed Central]
- Newey, W.K.; West, K.D. A Simple, Positive Semi-Definite, Heteroskedasticity and Autocorrelation Consistent Covariance Matrix. Econometrica 1987, 55, 703. [Google Scholar] [CrossRef] [Scilit]
- Tobías, A.; Querol, X.; Roqué, M.; Suu Lwin, K.; Yuan, L.; Ith, S.; Zin Wai, H.; Lester Chua, P.; Solá, I.; Renzi, M.; et al. Short-term exposure to desert dust and sandstorms and all-cause and cause-specific mortality and morbidity: A systematic review and meta-analysis. Environ. Int. 2025, 196, 109277. [Google Scholar] [CrossRef] [Scilit]
- Rowan, C.; R D’Souza, R.; Zheng, X.; Crooks, J.; Hohsfield, K.; Tong, D.; Chang, H.H.; Ebelt, S. Dust storms and cardiorespiratory emergency department visits in three Southwestern United States: Application of a monitoring-based exposure metric. Environ. Res. Health 2024, 2, 031003. [Google Scholar] [CrossRef] [Scilit] [PubMed] [PubMed Central]
- Zheng, X.; Chang, H.H.; Ebelt, S.T.; D’Souza, R.; Hohsfield, K.; Crooks, J.L. Dust Storms and Emergency Department Visits in 3 Southwestern States Using NWS Storm Reports. JAMA Netw. Open 2025, 8, e2457666. [Google Scholar] [CrossRef] [Scilit]
- Pun, V.C.; Tian, L.; Ho, K. Particulate matter from re-suspended mineral dust and emergency cause-specific respiratory hospitalizations in Hong Kong. Atmos. Environ. 2017, 165, 191–197. [Google Scholar] [CrossRef] [Scilit]
- World Health Organization. Sand and Dust Storms; World Health Organization: Geneva, Switzerland, 2025; Available online: https://www.who.int/news-room/fact-sheets/detail/sand-and-dust-storms (accessed on 4 September 2026).
- World Health Organization. WHO Global Air Quality Guidelines: Particulate Matter (PM2.5 and PM10), Ozone, Nitrogen Dioxide, Sulfur Dioxide and Carbon Monoxide [Internet]; World Health Organization: Geneva, Switzerland, 2021; Available online: https://www.who.int/publications/i/item/9789240034228 (accessed on 3 September 2026).
- Fussell, J.C.; Kelly, F.J. Mechanisms underlying the health effects of desert sand dust. Environ. Int. 2021, 157, 106790. [Google Scholar] [CrossRef] [Scilit] [PubMed] [PubMed Central]
- Instituto Nacional de Estadística e Informática. Compendio Estadístico, Ica 2024. 2025. Available online: https://www.gob.pe/institucion/inei/informes-publicaciones/6494920-compendio-estadistico-ica-2024 (accessed on 3 September 2026).
- Padilla-Rojas, C.; Hurtado, V.; Lizarraga, W.; Jimenez-Vasquez, V.; Molina, I.S.; Barcena-Flores, L.; Nuñez, A.; Sevilla, N.; Acedo-Lazo, S.V.; Huamán-Angeles, E.; et al. Implementation of a SARS-CoV-2 genomic surveillance network as a strategy to face other health challenges in Peru. Rev. Peru. Med. Exp. Salud Publica 2026, 43, 110–118. [Google Scholar] [CrossRef] [Scilit] [PubMed] [PubMed Central]

Disclaimer/Publisher’s Note: The statements, opinions and data contained in all publications are solely those of the individual author(s) and contributor(s) and not of MDPI and/or the editor(s). MDPI and/or the editor(s) disclaim responsibility for any injury to people or property resulting from any ideas, methods, instructions or products referred to in the content. |
© 2026 by the authors. Licensee MDPI, Basel, Switzerland. This article is an open access article distributed under the terms and conditions of the Creative Commons Attribution (CC BY) license.