


Abstract
A planar copper-on-epoxy interdigital capacitor (IDC) was investigated as a direct multi-frequency electrical transducer for assessing honey–syrup mixtures. Eleven syrup volume fractions from 0% to 100% (), each prepared separately at a total volume of 200 mL, were measured at 100 Hz, 1 kHz, 10 kHz, 100 kHz, 1 MHz, and 2 MHz using a MATRIX MCR-8200H LCR meter in parallel-capacitance/dissipation-factor (–D) mode. Thirty repeated measurement cycles were performed at each composition and frequency and averaged, and the measured was treated as the equivalent response of the complete IDC–sample system. Among the six frequencies, 1 kHz showed the strongest individual linear relation with syrup volume fraction. Under leave-one-out cross-validation, the 1 kHz linear model yielded , RMSE = 8.22 percentage points, and MAE = 7.34 percentage points. Six-frequency PLSR did not improve prediction, whereas SVR achieved , RMSE = 6.93 percentage points, and MAE = 5.66 percentage points. In a matched-model comparison using the same nested LOOCV procedure, a 1 kHz SVR yielded , RMSE = 17.53 percentage points, and MAE = 11.08 percentage points, whereas the six-frequency SVR retained the lower error. The six-frequency SVR produced numerically lower internal cross-validation errors than the 1 kHz linear reference; however, because the analysis contains only eleven independent concentration-level observations, this difference is treated as descriptive rather than as evidence of statistical superiority. Because the analysis is based on eleven concentration-level observations from one preparation series, further validation with independently prepared batches is required to establish between-batch reproducibility and external predictive performance.
1. Introduction
Honey is a chemically complex natural product with high commercial value and is therefore susceptible to economically motivated adulteration, particularly through the addition of inexpensive sugar syrups. Conventional authentication methods based on chromatography, spectroscopy, isotope analysis, and other laboratory techniques can provide high analytical specificity, but they generally require sample preparation, specialized instrumentation, and trained personnel. These practical constraints continue to motivate the development of compact electrical and electromagnetic sensing methods capable of responding directly to composition-dependent changes in liquid samples.
From an electronic-device perspective, planar capacitive sensors are attractive because the material under test becomes part of the electric-field environment of the sensing structure. In an interdigital capacitor (IDC), the electric field is concentrated between adjacent coplanar fingers and extends above the electrode surface. The resulting capacitance therefore depends not only on electrode geometry, but also on substrate properties, field penetration, sample permittivity and conductivity, excitation frequency, and parasitic contributions. The fundamental behavior of interdigital sensors was described by Mamishev et al. [1], who showed that their response is strongly governed by the interaction between device geometry and the electromagnetic properties of the material surrounding the electrodes.
The importance of the complete electrode–substrate–sample system has been demonstrated in several capacitive sensing studies. Martinez-Lopez et al. [2] developed an interdigitated coplanar device for liquid sensing and explicitly modeled the contributions of the substrate and parasitic capacitances. Seidenath et al. [3] recently demonstrated an interdigitated copper sensor fabricated on a printed-circuit board for in situ parylene-thickness monitoring, where changes in dielectric loading above the electrode surface produced measurable capacitance changes. Direct IDC sensing has also been applied to liquid-level measurement by Ali and Mandal [4], while Liu et al. [5] used an interdigitated capacitive probe for assessing frying-oil degradation. These studies establish planar interdigitated electrodes as practical transducers for converting material-dependent electrical loading into a directly measurable capacitance.
Composition-dependent liquids provide a particularly relevant application for such devices. Angkawisittpan and Manasri [6] demonstrated that sugar concentration in aqueous solutions can be determined from changes in IDC capacitance, providing a low-frequency precedent for composition sensing. In honey, the electrical response is affected by water content, dissolved sugars, minor constituents, and added adulterants. Consequently, changes in honey composition can alter both dielectric storage and dielectric loss, although the magnitude of the measured response depends on the excitation frequency and the sensing configuration.
Low-frequency impedimetric studies provide additional context for the electrode–sample interface in honey sensing. Elamine et al. [7] developed an impedance-based electronic tongue for botanical-origin discrimination using bare Au, carbon, ITO, and doped-Si electrodes over approximately 60 Hz–1 MHz and showed that sensitivity was strongly influenced by interfacial capacitance and the electrical double layer at the direct electrode–honey-solution interface. More recently, Ben Halima et al. [8] applied electrochemical impedance spectroscopy to honey adulterated with sugar syrup over a low-frequency-to-radio-frequency range and interpreted the response using an equivalent circuit containing bulk-resistance, double-layer, and diffusion-related terms. These studies demonstrate that low-frequency electrical measurements in honey can be strongly affected by both bulk conductivity and electrode/interface phenomena. They are therefore relevant to the interpretation of the present measurements, although the present coated IDC differs fundamentally because the insulating layer prevents direct metal–liquid contact.
Most recent electronic sensing studies for honey and other dielectric liquids, however, have concentrated on microwave methods. Piekarz et al. [9] developed a plug-and-measure microwave platform for honey–syrup analysis, Chaisaeng et al. [10] investigated a non-contact microwave system over 2–12 GHz, and Małek et al. [11] studied an IDC-based microwave sensor for honey adulteration in the 1–2 GHz range. Related IEEE work has shown how interdigital structures can be integrated with microwave resonators to increase electric-field concentration in liquid sensing. Govind and Akhtar [12] incorporated an IDC in a split-ring-resonator microfluidic sensor for aqueous glucose measurement. Martinic et al. [13] later used an impedance-matched IDC–CSRR structure for glucose-concentration sensing, while Wang and Liu [14] introduced an interdigital electrode into an electric-LC resonator for solid and liquid material identification. These approaches demonstrate the effectiveness of interdigital field concentration, but their sensing observables are resonant frequency, attenuation, impedance, or scattering parameters rather than direct low-frequency parallel capacitance.
This distinction is important for the present study. The parallel capacitance reported by an LCR meter is an equivalent response of the complete sensor–sample system and should not be interpreted directly as intrinsic sample permittivity. In a liquid-loaded IDC, dielectric polarization, conductive loss, electrode–sample interaction, substrate loading, and fixture parasitics can contribute differently as the excitation frequency changes. A capacitance value obtained at one frequency may therefore contain different composition-related information from that obtained at another frequency. This motivates treating a discrete set of capacitance measurements as a frequency-dependent electrical response rather than selecting a single operating point a priori.
Because each sample is interrogated at several excitation frequencies, the resulting measurements form a multivariable electrical-response vector rather than a single sensing variable. Multivariable regression is therefore introduced here specifically as an analysis tool for the frequency-dependent IDC response, not as a separate sensing modality. Related honey-authentication studies have shown that multidimensional measurements can contain useful composition information. Phillips and Abdulla [15] applied machine learning to hyperspectral data, while Razavi and Esmaeilzadeh Kenari [16] used partial least-squares regression (PLSR) and support vector regression (SVR) with UV–visible spectra for quantitative adulteration analysis. Calle et al. [17] reported Vis–NIR sensing combined with machine learning, Punta-Sanchez et al. [18] applied regression algorithms to ultra-fast gas chromatographic data, and electronic-nose and gas-sensor responses have also been analyzed using machine-learning methods [19,20]. These studies provide the methodological context for testing whether the six direct IDC capacitance measurements contain useful joint information, while the sensing input in the present study remains purely electrical.
A clear gap therefore remains between direct low-frequency IDC sensing and multivariable quantitative analysis. Relatively little attention has been given to whether capacitance values obtained from the same planar IDC at several excitation frequencies contain useful information beyond that available from the strongest single-frequency response. Addressing this gap does not require extraction of intrinsic dielectric properties. Instead, the IDC and the loaded sample can be considered together as a frequency-dependent electronic transducer whose measured parallel-capacitance response is used directly for analysis.
Accordingly, this work investigates a planar copper IDC fabricated on an epoxy-based printed-circuit substrate and interrogated directly with an LCR meter at 100 Hz, 1 kHz, 10 kHz, 100 kHz, 1 MHz, and 2 MHz. Honey–syrup mixtures are used as a controlled liquid-loading series. The 1 kHz response is first evaluated as the single-frequency linear reference, while the six measured capacitance values are subsequently considered jointly using PLSR and SVR. Model performance is evaluated using leave-one-level-out cross-validation and quantified by , RMSE, and MAE.
The contribution of this study is threefold. First, it characterizes the frequency-dependent direct parallel-capacitance response of a planar IDC over the 100 Hz–2 MHz range for a controlled honey–syrup series. Second, it examines whether the information distributed across six excitation frequencies improves concentration estimation relative to the strongest single-frequency calibration. Third, it compares linear and nonlinear regression while explicitly distinguishing technical measurement repetitions from independent physical samples. The present work is therefore positioned as a device-response proof of concept rather than as an intrinsic permittivity-extraction method or a fully generalized honey-authentication model.
Table 1 summarizes representative state-of-the-art work and positions the present method with respect to sensing structure, measurement regime, and analysis strategy.
Table 1.
State-of-the-art comparison of representative direct-capacitance, microwave, and data-driven sensing approaches relevant to the present work.
2. Materials and Methods
2.1. IDC Sensor Structure and Sensing Principle
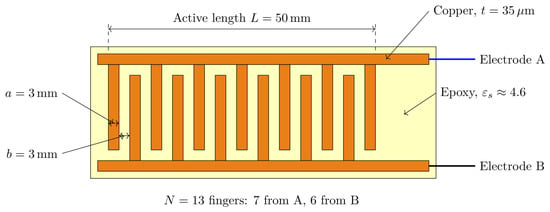
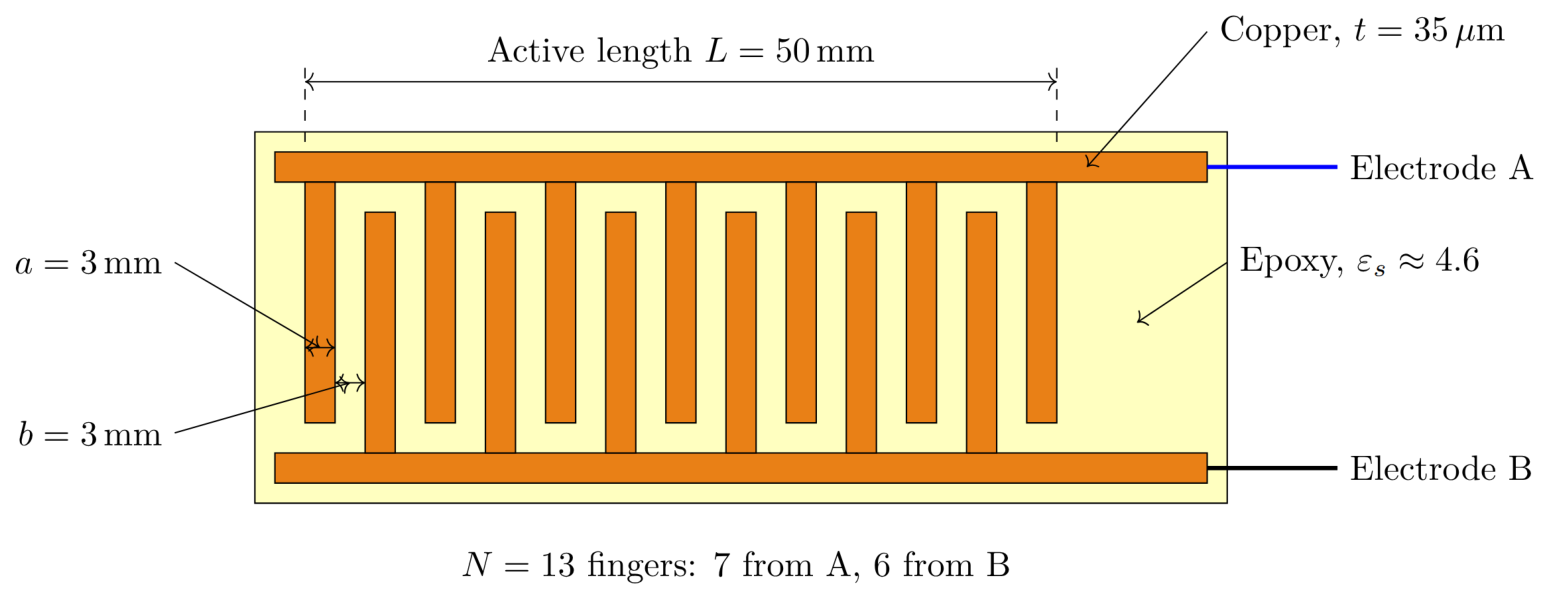
The sensing element used in this study is a planar interdigital capacitor (IDC) fabricated on an epoxy-based printed-circuit substrate. As shown in Figure 1, the sensor consists of two electrically isolated copper electrodes, denoted Electrode A and Electrode B. Each electrode comprises a longitudinal bus conductor connected to a set of parallel fingers extending toward the opposite electrode. The fingers are arranged alternately to form the interdigital sensing region, while a finite separation is maintained between adjacent conductors and between each finger tip and the opposite bus conductor. Thus, the two electrodes are not directly connected by a metallic path.
Figure 1.
Dimensioned top-view schematic of the planar interdigital capacitor showing Electrode A and Electrode B. The verified geometrical parameters are a total of fingers (7 connected to Electrode A and 6 connected to Electrode B), active finger length mm, finger width mm, and edge-to-edge inter-finger gap mm. The conductive pattern is copper with thickness m on an epoxy-based PCB substrate having a nominal relative permittivity of approximately . No substrate-thickness value is shown because it cannot be verified from the retained fabrication record. The schematic is a technical illustration based on the verified sensor dimensions and is not used as photographic evidence of undocumented experimental conditions.
The fabricated IDC contains a total of interdigitated fingers, with seven fingers connected to Electrode A and six fingers connected to Electrode B. The active finger length is mm, the finger width is mm, and the edge-to-edge separation between adjacent fingers belonging to opposite electrodes is mm. The conductive pattern is formed from copper with a thickness of m on an epoxy-based printed-circuit substrate having a nominal relative permittivity of approximately . The available fabrication record does not provide a traceable commercial laminate designation or a verified substrate-thickness value; therefore, these parameters are not specified beyond the documented epoxy-based substrate and its nominal relative permittivity. Figure 2 was redrawn as a dimensioned technical schematic using only these verified geometrical and material parameters; no unverified substrate thickness or additional geometric dimension is assigned.
Figure 2.
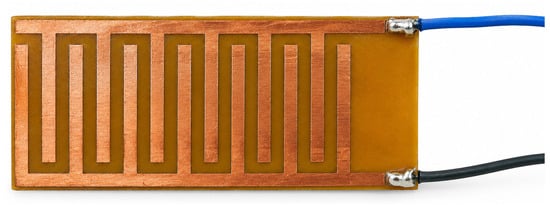
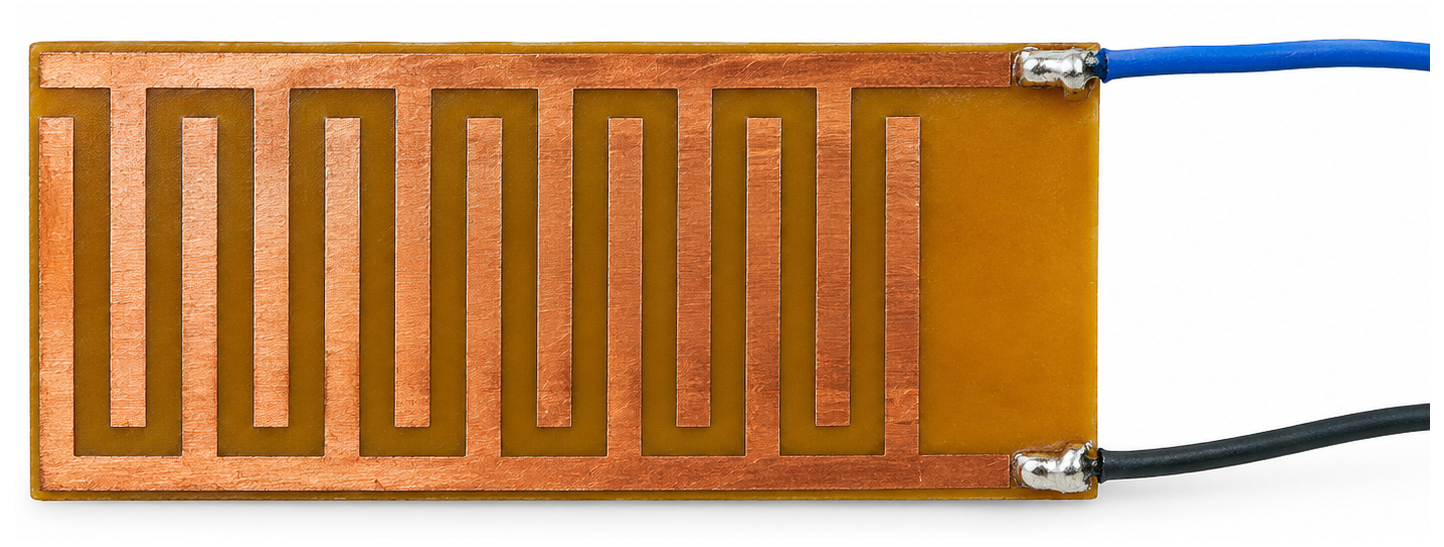
Authentic photograph of the fabricated planar IDC sensor used in the reported honey–syrup measurements.
The sensing mechanism is based on the fringing electric field established between adjacent fingers belonging to opposite electrodes. When an electrical potential is applied between Electrode A and Electrode B, electric-field lines extend across the inter-finger gaps and partly penetrate the material located above the electrode plane. In the reported measurements, the copper interdigital electrodes were not in direct contact with the honey–syrup samples. The copper fingers and bus conductors in the active sensing region were covered by a thin insulating coating before liquid measurements. Thus, the relevant interface was a liquid–insulating-layer–copper IDC configuration rather than a direct liquid–copper interface. The terminal pads, solder joints, and external electrical connections were kept outside the wetted region and did not contact the sample. The available fabrication record does not retain a traceable specification of the coating material or its exact thickness; therefore, these two coating parameters are not assigned retrospectively. Accordingly, the LCR-meter output is interpreted as the equivalent parallel response of the complete coated-IDC–sample–fixture system rather than as a direct measure of intrinsic sample permittivity.
When a honey–syrup sample is introduced over the active sensing region, the sample modifies the electric-field distribution and hence the effective capacitance between the two electrodes. The magnitude of this change depends on the electrical properties of the sample, the electrode dimensions, the inter-finger spacing, the substrate properties, and the excitation frequency [1,2].
The frequency-dependent electrical behavior of the sample may be represented conceptually by the complex relative permittivity
where and denote the dielectric storage and loss components, respectively. These quantities are not extracted directly in the present experiment.
For a fixed electrode geometry, the measured parallel capacitance may be represented conceptually as
where S denotes the syrup volume fraction and represents fixture, contact, lead, and other parasitic contributions. This expression is used only to describe the factors governing the measured response; it is not used to extract the intrinsic complex permittivity of the sample.
2.2. Equivalent Electrical Measurement
Capacitance measurements were obtained using a MATRIX MCR-8200H LCR meter (Huachuangda Culture and Technology Industrial Park, Shenzhen, China) operated in parallel-capacitance/dissipation-factor (–D) mode. In this representation, the sensor–sample system is described by the equivalent parallel admittance
where is the equivalent parallel conductance, is the susceptance, , and is the parallel capacitance reported by the instrument. Hence,
For the same parallel equivalent circuit, the dissipation factor is
Equations (3)–(5) illustrate why the response of a practical liquid-loaded IDC cannot be described by a single frequency-independent capacitance. Changes in dielectric polarization, loss, conductivity, interfacial effects, and parasitic admittance can alter the equivalent and as the excitation frequency changes.
The D relation is included only to define the –D equivalent measurement mode used by the LCR meter and to make explicit the relation between the reported capacitance and the parallel loss term. The present regression analysis does not use D as an input variable. Although both and D were available from the instrument display, only was retained as the sensing variable in the present analysis. Accordingly, all subsequent references to capacitance denote the equivalent parallel capacitance under the specified measurement condition, rather than a direct estimate of intrinsic sample permittivity.
Because the copper conductors were separated from the liquid by the insulating coating, the present configuration is not interpreted as a bare metal–electrolyte interface. Accordingly, a classical electrical double layer formed directly at the copper–liquid boundary is not invoked as the primary mechanism of the reported response. Instead, the measured equivalent admittance may contain contributions from the coating capacitance, polarization at the coating–liquid interface, the frequency-dependent dielectric and conductive properties of the honey–syrup sample, substrate loading, and fixture/lead parasitics. The present -only data do not permit these individual contributions to be separated quantitatively.
2.3. Sample Series and Measurement Procedure
Honey–syrup mixtures were prepared at eleven syrup volume fractions from 0% to 100% syrup in increments of 10%. Each composition was prepared separately to a total volume of 200 mL at room temperature (approximately 25 °C). The syrup fraction was defined on a volume basis as
where and are the measured component volumes. Thus, 0% corresponds to 200 mL honey and 0 mL syrup, whereas 100% corresponds to 0 mL honey and 200 mL syrup. The intermediate mixtures were prepared according to Table 2.
Table 2.
Preparation of the honey–syrup mixtures on a volume-fraction basis. Each mixture had a total volume of 200 mL.
The eleven mixtures were prepared as separate samples rather than by sequential addition. The honey and sugar syrup were commercially available food-grade products purchased from modern-trade retail outlets in Thailand. The retained experimental record does not preserve the specific brand names, manufacturers, production lots, or detailed compositional specifications; therefore, these details are not reconstructed retrospectively. Measurements were carried out at approximately 25 °C. After the coated IDC sensing region was immersed horizontally and fully covered by the sample, approximately 2–3 min were allowed for the reading to stabilize before values were recorded. Thirty repeated measurement cycles were performed for each prepared composition. Between repeated measurement cycles, the coated sensing surface was removed from the sample, wiped clean with commercially available standard cleaning material used for the experiment, and then reintroduced for the next measurement. The specific formulation and manufacturer of the cleaning material were not retained in the experimental record and are therefore not assigned retrospectively. The same cleaning and reloading procedure was applied throughout the series. Measurements proceeded in ascending syrup volume fraction from 0% to 100%.
The electrical response was measured using a MATRIX MCR-8200H LCR meter with a nominal measurement-frequency range of 20 Hz–2 MHz. The instrument was operated in –D mode, and the same IDC structure was used throughout the complete measurement series. Kelvin clip leads connected the two IDC terminals to the LCR meter. During measurement, the sensor was positioned horizontally and immersed in the liquid sample so that the active interdigital sensing region was fully covered by the honey–syrup mixture. Only the coated IDC sensing region was placed in the wetted zone; the terminal pads, solder joints, and external electrical connections remained outside the liquid. The same horizontal orientation and the same general immersion configuration were maintained throughout the measurement series to keep the active sensing region consistently covered between measurements. A numerical clearance from the vessel bottom was not retained in the experimental record and is therefore not reported. The AC excitation amplitude was not available as a recorded numerical parameter from the measurement procedure, and no separate record of this setting was retained. Therefore, an excitation-amplitude value is not assigned retrospectively. The archived record does not preserve the DC bias, measurement-speed setting, or the complete lead-compensation procedure.
Measurements were obtained at six discrete excitation frequencies,
These frequencies span four orders of magnitude and were treated as discrete electrical interrogation conditions. The resulting plots are discrete parallel-capacitance frequency responses rather than complete impedance spectra. The experiment was not intended to reconstruct a continuous dielectric spectrum. Instead, the objective was to determine whether capacitance values measured at several excitation frequencies contain complementary composition-related information.
At each syrup volume fraction and excitation frequency, 30 repeated measurement cycles were performed using the same separately prepared mixture. These cycles included removal, cleaning of the coated sensing surface, and reloading before the next measurement. They therefore characterize repeated measurement of the same prepared composition and are not 30 independently prepared physical samples. The mean parallel capacitance was calculated as
where is the ith parallel-capacitance reading obtained for syrup volume fraction S at excitation frequency f.
Averaging was applied only to reduce short-term reading variation within the same measurement condition. It does not increase the number of independent sample preparations. Consequently, the regression data set contains eleven concentration-level observations rather than independent samples.
The present revision establishes the mixture basis, total prepared volume, room-temperature condition, repeated-measurement count, stabilization interval, and cleaning/reloading procedure. Remaining undocumented items are limited to instrument-specific settings for which a numerical record has not yet been transcribed, as noted above.
2.4. Frequency-Dependent Response Characterization
Before constructing multivariable regression models, the frequency-dependent sensor response was examined independently at each excitation frequency. For a given frequency f, the mean capacitance response was approximated by
where is the slope of the capacitance response with respect to syrup volume fraction and is the intercept. The quantity , expressed in pF per percentage point of syrup volume fraction, is used as an empirical sensitivity measure for the linear response at each frequency.
The endpoint capacitance change was also defined as
and the corresponding normalized endpoint response as
These quantities are used only to characterize the electrical response of the sensor and should not be confused with the inverse regression models used for estimating syrup level. In particular, the forward relationship in Equation (9) describes how capacitance changes with S, whereas the predictive models described below estimate S from one or more measured capacitance values.
2.5. Multi-Frequency Input Representation
For regression analysis, each syrup volume fraction was represented by the six mean capacitance values measured at the corresponding excitation frequencies. The feature vector for observation j was defined as
with the corresponding target
The complete predictor matrix therefore has the form
Thus, the six input variables do not represent six independent sensors. Rather, they are six electrical observations of the same physical IDC–sample system under different excitation frequencies.
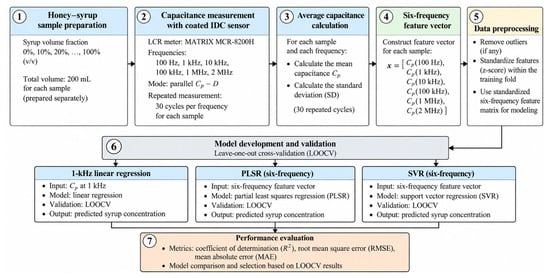
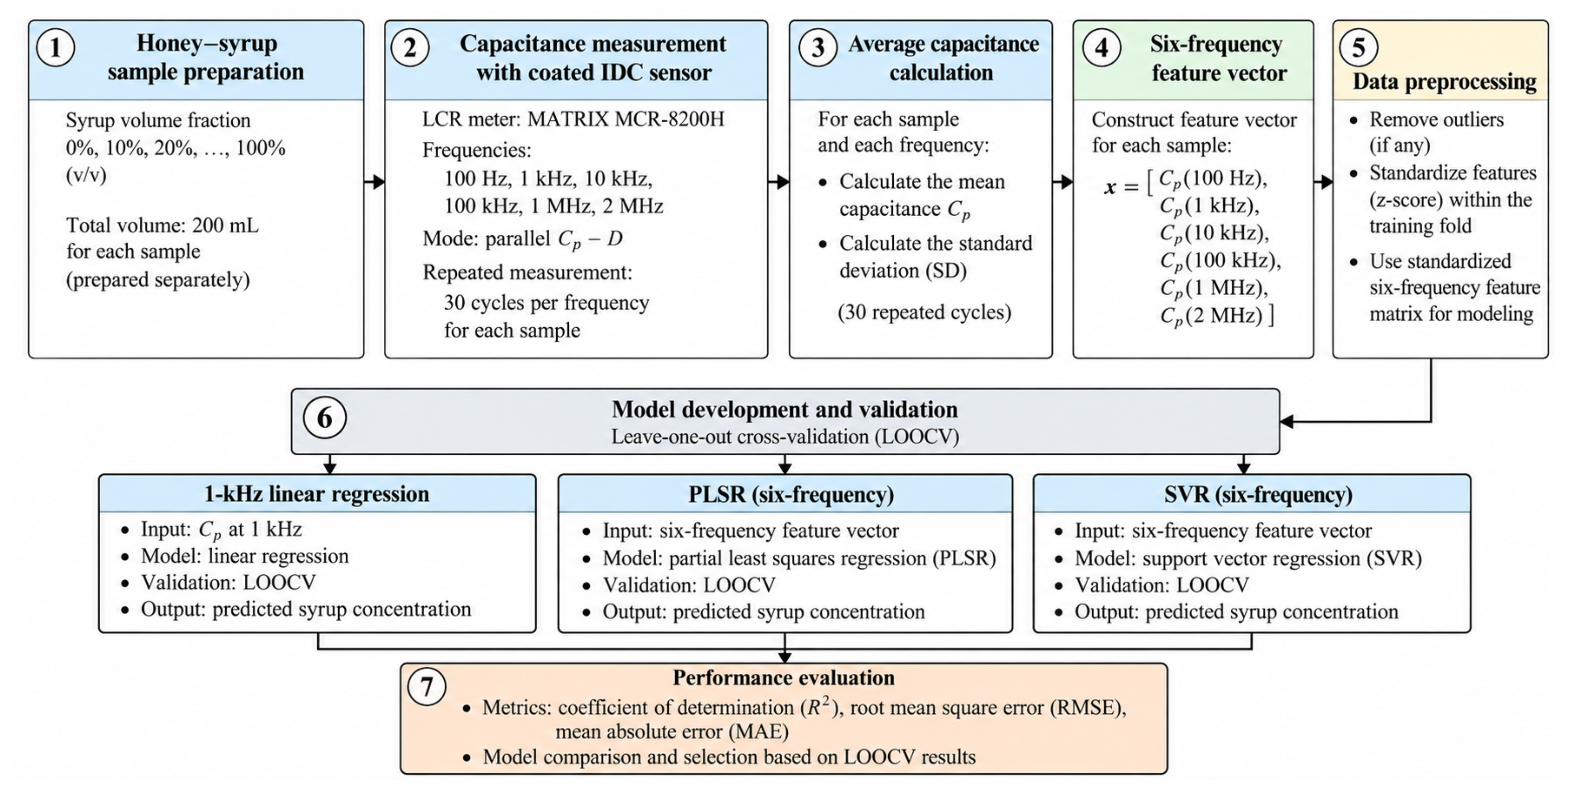
The complete experimental data-processing and regression workflow is summarized in Figure 3. To avoid ambiguity regarding image provenance, the revised figure is presented solely as a schematic workflow and contains no embedded photographs, reconstructed experimental images, or illustrative regression plots.
Figure 3.
Schematic workflow of the experimental data processing and regression analysis. Separately prepared honey–syrup mixtures spanning 0–100% syrup volume fraction (v/v) were measured using the coated IDC sensor at 100 Hz, 1 kHz, 10 kHz, 100 kHz, 1 MHz, and 2 MHz. Thirty repeated measurement cycles were performed at each composition and frequency, and the resulting capacitance values were averaged to construct the six-frequency feature vector. The data were then processed within the validation framework and evaluated using 1 kHz linear regression, six-frequency PLSR, and six-frequency SVR under leave-one-out cross-validation. Model performance was quantified using , RMSE, and MAE. The figure is a schematic workflow only and is not presented as photographic evidence of the experimental setup.
All quantitative regression-performance values are reported only in the Results section. No performance values or illustrative prediction ranges are embedded in Figure 3, thereby avoiding inconsistencies between the workflow illustration and the validated numerical results.
2.6. Regression Models
Three regression approaches were evaluated to determine whether the multi-frequency electrical response contained useful information beyond the strongest individual frequency.
2.6.1. Single-Frequency Linear Regression
The 1 kHz capacitance was selected as the single-frequency reference after comparing the linear-response slope, coefficient of determination, endpoint capacitance change, and normalized endpoint response at all six frequencies. As shown in Section 2.4, 1 kHz provided the highest linear slope and the highest , while also showing the largest normalized endpoint response. For prediction, the inverse linear model was written as
where is the estimated syrup volume fraction and and are fitted regression coefficients. For the full eleven-level data set, the illustrative 1 kHz inverse calibration is . No clipping to the 0–100% interval was applied when evaluating regression outputs; values outside this range were retained as model predictions. This full-data equation is provided for transparency and is not a substitute for the fold-specific models used in cross-validation.
2.6.2. Partial Least-Squares Regression
Partial least-squares regression (PLSR) was used because the six capacitance variables originate from the same sensor and are therefore expected to be strongly correlated. PLSR represents the predictor matrix through a reduced set of latent variables while maximizing the covariance between the predictor and response spaces [21]. A general PLS representation can be written as
and
where contains the latent scores, contains the predictor loadings, contains the response loadings, and and are residual terms.
In the present application, PLSR evaluates whether a lower-dimensional linear combination of the six frequency-dependent capacitance measurements can improve prediction relative to a single-frequency linear model.
2.6.3. Support Vector Regression
Support vector regression (SVR) was additionally evaluated because the relationship between the multi-frequency capacitance vector and syrup volume fraction need not be strictly linear. In its general form, SVR estimates a function
where maps the input vector into a feature space, is the regression weight vector, and b is the bias term [22].
The standard -insensitive SVR formulation balances model complexity and prediction error according to
subject to
where C controls the trade-off between model complexity and errors outside the -insensitive region. This formulation provides a regularized nonlinear regression framework suitable for evaluating whether the combined frequency response contains information that cannot be represented adequately by one linear capacitance variable [22].
Because the present data set is small, SVR is used here as a comparative regression model rather than as evidence of a generally applicable machine-learning predictor.
To isolate the effect of input dimensionality from the effect of model class, a matched SVR comparison was additionally performed. The same RBF-SVR pipeline, predictor standardization, hyperparameter grid, inner model-selection procedure, and outer LOOCV procedure were applied to (i) a single predictor, , and (ii) the complete six-frequency capacitance vector. Thus, the 1 kHz SVR and six-frequency SVR differed only in the predictor set.
2.7. Preprocessing and Cross-Validation
Before fitting multivariable models, each capacitance variable was standardized within the training data of each validation cycle. For predictor j, standardization was performed as
where and are the mean and standard deviation calculated only from the training observations. The same training-derived parameters were then applied to the held-out observation. This procedure prevents information from the test observation from entering the preprocessing stage.
The 1 kHz reference frequency had been selected from the complete eleven-level data set using the single-frequency response comparison before the LOOCV performance analysis. Frequency selection was therefore not repeated within each outer training fold. Consequently, the reported 1 kHz linear and 1 kHz SVR performance values should be interpreted as conditional internal-validation results for a preselected 1 kHz input rather than as fully nested estimates of a complete frequency-selection procedure. In contrast, the six-frequency models used the same fixed set of all six measured frequencies in every outer fold, so no frequency subset selection was performed for those models.
Because the complete data set contains only eleven concentration-level observations, leave-one-out cross-validation (LOOCV) was used as an initial assessment of model performance. In validation cycle i, observation i was excluded from model fitting, and the remaining ten observations were used as the training set. The fitted model was then applied to the held-out observation to produce the cross-validated prediction
where the superscript indicates that observation i was not used for training.
The procedure was repeated for all eleven observations. Importantly, the 30 repeated measurement cycles at each syrup volume fraction had already been averaged before regression and were not treated as independent samples. Therefore, LOOCV was performed across the eleven syrup volume fractions, not across the individual repeated measurements.
2.8. Performance Metrics
Model performance was evaluated from the complete set of cross-validated predictions using the coefficient of determination, root-mean-square error, and mean absolute error. The cross-validated coefficient of determination was calculated as
where is the mean syrup volume fraction.
The corresponding cross-validated RMSE was
and the MAE was
Higher together with lower and indicate closer agreement between the estimated and syrup volume fractions. Because the target variable is expressed on the 0–100% (v/v) syrup-volume-fraction scale, RMSE and MAE are reported in percentage points.
These metrics are interpreted as internal cross-validation results for the available eleven-level calibration series. They should not be interpreted as external-validation accuracy or between-batch reproducibility because the experiment did not contain independently prepared replicate batches.
Accordingly, the numerical prediction errors reported here are conditional on this single preparation series and should not be assumed to represent the accuracy expected for unseen honey batches or for honeys of different botanical or geographical origin. External validation with physically independent batches and additional honey sources is required before such transferability can be claimed.
3. Results
3.1. Unloaded-Sensor Baseline
An archived unloaded-sensor data set was available for the same IDC–meter measurement system and was added to characterize the baseline response before interpreting the liquid-loaded measurements. Five readings were recorded in air at each of the six excitation frequencies. Table 3 shows that the unloaded mean varied with frequency, while the within-condition coefficient of variation remained below 2%.
Table 3.
Unloaded IDC parallel capacitance measured in air.
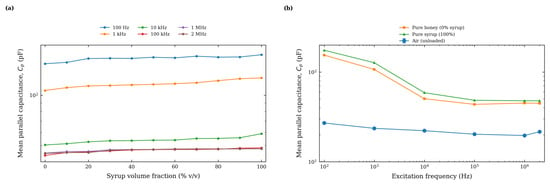
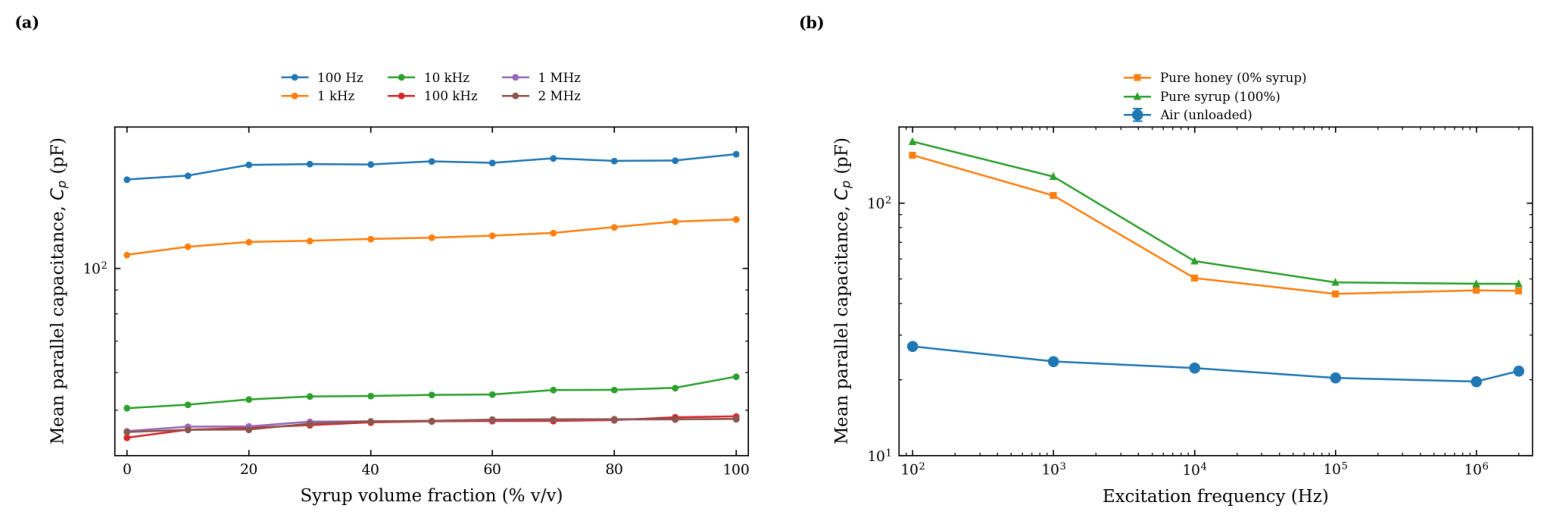
The unloaded response is compared directly with the pure-honey and pure-syrup responses in Figure 4b using a common frequency axis. The preserved air-baseline error bars denote one sample standard deviation from five air measurements. The unloaded response confirms that the sensor–lead–instrument system is itself frequency dependent. Consequently, the much larger values observed with honey and syrup cannot be interpreted as intrinsic sample permittivity. No traceable known-liquid reference measurement was retained in the archived experiment; this remains a limitation of the present data set.
Figure 4.
Parallel-capacitance frequency responses of the coated IDC. (a) Mean parallel capacitance versus syrup volume fraction at the six discrete excitation frequencies. (b) Comparison of the unloaded air response with pure honey (0% syrup) and pure syrup (100% syrup) using logarithmic frequency and capacitance axes. Air-baseline error bars denote one sample standard deviation from five unloaded measurements. Loaded-sample error bars are not shown because the retained analysis data used for this revision contain concentration-level means rather than the corresponding repeat-level values.
3.2. Frequency-Dependent Capacitance Response
Table 4 summarizes the mean parallel capacitance at the six excitation frequencies. Each value is the mean of 30 repeated measurement cycles at a given syrup volume fraction and frequency. The response depends strongly on both sample composition and excitation frequency.
Table 4.
Mean parallel capacitance (pF) measured at different syrup volume fractions and excitation frequencies.
To make the single-frequency selection explicit, Table 5 compares the forward linear response at all six excitation frequencies.
Table 5.
Single-frequency response characteristics used to select the 1 kHz reference condition.
The measured parallel-capacitance frequency responses are shown in Figure 4. At 100 Hz, the absolute endpoint change was slightly larger than at 1 kHz, but the response showed noticeable reversals at intermediate syrup levels and a substantially lower . In contrast, 1 kHz combined the highest linear slope (0.1778 pF per percentage point), the highest (0.9524), and the largest normalized endpoint response (18.87%). These metrics, rather than capacitance magnitude alone, were therefore used to select 1 kHz as the single-frequency reference.
At higher frequencies, the endpoint difference became smaller: 8.432 pF at 10 kHz, 4.814 pF at 100 kHz, 2.806 pF at 1 MHz, and 2.962 pF at 2 MHz. This decrease shows that the electrical response of the liquid-loaded IDC is strongly frequency dependent.
The 100 Hz response is not strictly monotonic. For example, the mean changes from 166.488 pF at 30% to 166.208 pF at 40% and then to 168.800 pF at 50%. Additional reversals occur at other intermediate levels. Because the experiment records only the equivalent parallel capacitance, the present data cannot identify a unique physical cause for these fluctuations. Given the insulating coating, these fluctuations are not attributed to a bare copper–liquid electrode-polarization mechanism. More plausible system-level contributors include polarization at the coating–liquid interface, the coating capacitance, bulk dielectric/conductive behavior of the sample as represented in the equivalent admittance, small variations in sample loading or placement, and fixture parasitics. They reinforce the need to interpret the 100 Hz data as a system-level parallel-capacitance response rather than as evidence of a resolved dielectric relaxation.
3.3. Single- and Multi-Frequency Regression
The revised workflow figure does not contain embedded regression plots or numerical performance values. The values reported below and in Table 6 are therefore the sole quantitative reference for model performance. The 1 kHz capacitance response was used as the single-frequency reference, whereas the PLSR and SVR models used the six-frequency capacitance vector. The LOOCV results are summarized in Table 6. The 1 kHz linear model yielded , an RMSE of 8.22 percentage points, and an MAE of 7.34 percentage points. The matched 1 kHz SVR yielded , an RMSE of 17.53 percentage points, and an MAE of 11.08 percentage points. The six-frequency PLSR model yielded , an RMSE of 10.58 percentage points, and an MAE of 8.08 percentage points, indicating that linear multivariable combination did not improve prediction relative to the 1 kHz linear reference. In contrast, the six-frequency SVR model achieved , an RMSE of 6.93 percentage points, and an MAE of 5.66 percentage points.
Table 6.
Leave-one-out cross-validation performance of the single- and multi-frequency regression models.
These results show that the benefit of multi-frequency input is model-dependent: improvement was observed for the nonlinear SVR model but not for the linear PLSR model. In addition, because 1 kHz was selected after examining the complete eleven-level data set, comparisons involving the 1 kHz reference are conditional on that pre-selection and are not fully nested estimates of an end-to-end frequency-selection procedure.
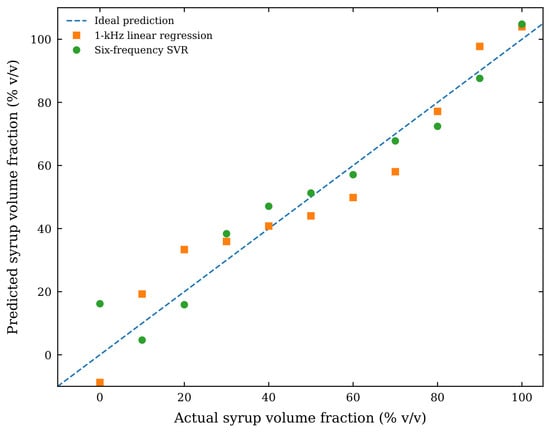
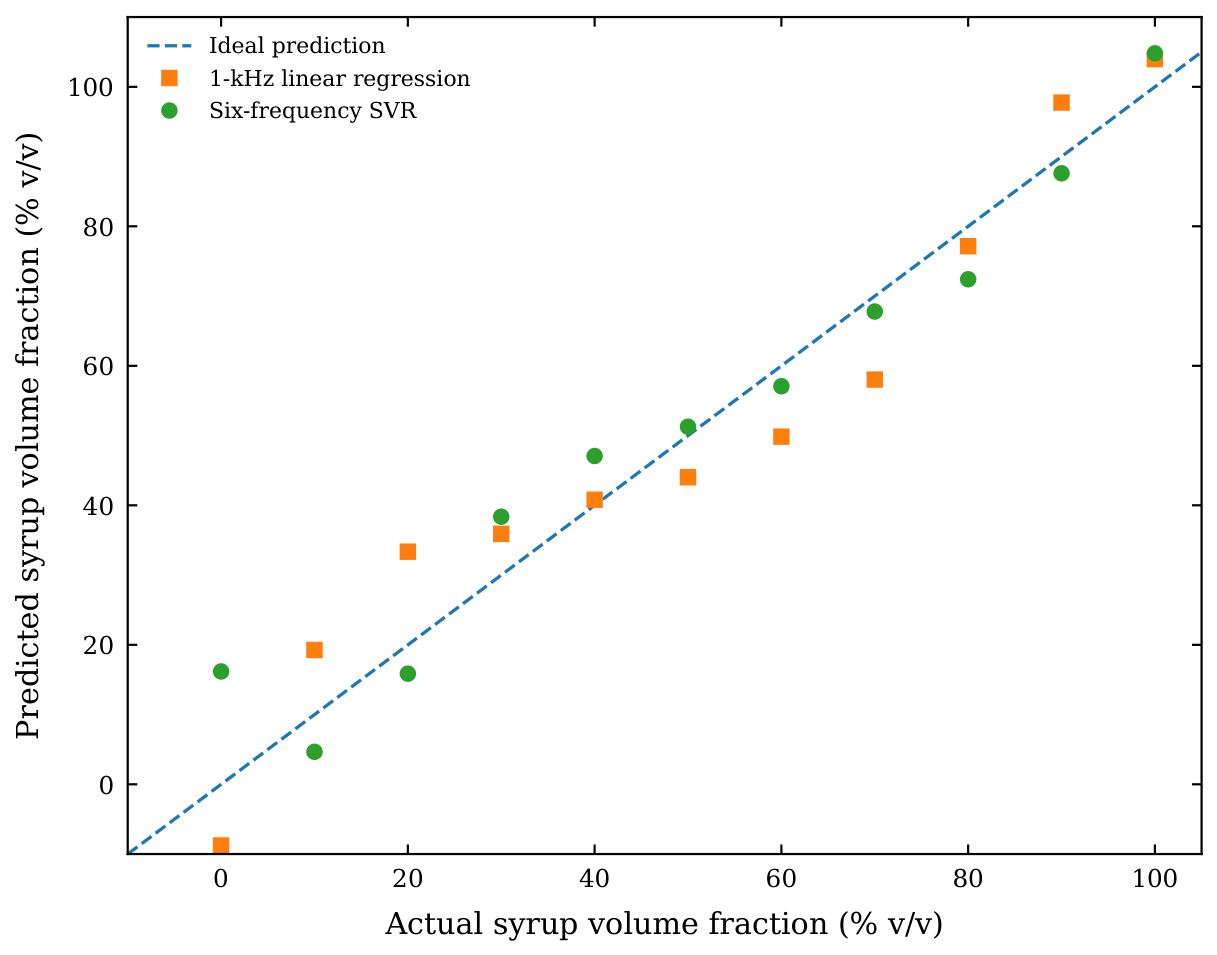
Model selection was performed within the training data of each outer LOOCV cycle. For PLSR, the number of latent components was selected from 1–6 using an inner leave-one-out procedure that minimized RMSE. For SVR, a radial basis function (RBF) kernel was used. The inner search considered , , and . Predictor standardization was included within the training pipeline so that the outer held-out observation did not contribute to scaling or model selection. The model selected in each inner procedure was refitted to the complete outer-training set and evaluated on the held-out observation. The eleven outer predictions were then pooled for calculation of , RMSE, and MAE. PLSR did not improve prediction relative to the 1 kHz linear reference. The matched SVR comparison showed a stronger contrast: using the same RBF-SVR model and nested validation procedure, the six-frequency input reduced RMSE from 17.53 to 6.93 percentage points (60.4% reduction) and MAE from 11.08 to 5.66 percentage points (48.9% reduction) relative to 1 kHz SVR, while increased from 0.6928 to 0.9519. Within this eleven-level data set, these results indicate that the additional frequency-dependent predictors provided useful information to the nonlinear SVR model. However, because the 1 kHz frequency itself was selected using the complete data set and the sample size is small, the comparison remains an internal, conditional assessment and does not establish external superiority. The actual-versus-predicted relationship is shown in Figure 5. The held-out predictions and residuals for the matched 1 kHz and six-frequency SVR models are provided in Supplementary Table S1.
Figure 5.
Actual versus predicted syrup volume fraction obtained using the 1 kHz linear regression and six-frequency SVR models under leave-one-out cross-validation. Axis, tick, font, and legend styling is consistent with the quantitative plots in Figure 4.
4. Discussion
The experimental results demonstrate that the electrical response of the planar IDC is strongly dependent on excitation frequency. Although the same copper electrode geometry and epoxy-based substrate were used throughout the experiment, both the absolute value of the measured parallel capacitance and its variation with syrup volume fraction changed markedly over the 100 Hz–2 MHz range. The capacitance increased from 154.418 to 174.828 pF at 100 Hz and from 106.816 to 126.972 pF at 1 kHz, whereas the endpoint changes at 10 kHz, 100 kHz, 1 MHz, and 2 MHz were progressively smaller [1]. These results indicate that the liquid-loaded IDC cannot be represented adequately by a single frequency-independent capacitance.
From an electronic-device perspective, the measured represents the combined response of the copper electrodes, insulating coating, substrate, sample, and measurement fixture. The fringing electric field generated between adjacent interdigital fingers penetrates through the thin insulating layer and into the material above the electrode plane, so a change in sample composition modifies the electrical loading of the device. Because the copper was electrically isolated from the liquid by the coating, the reported configuration does not correspond to a bare copper–liquid interface. The insulating layer forms part of the sensing stack and contributes to the effective capacitance while suppressing direct ionic conduction to the copper. Consequently, classical double-layer charging at a direct copper–electrolyte interface is not used to explain the measured response. Possible contributions instead include the coating capacitance, polarization at the coating–liquid interface, the frequency-dependent dielectric and conductive behavior of the liquid, substrate loading, and fixture/lead parasitics. The present capacitance-only measurements do not independently resolve these contributions or identify a specific relaxation process. Therefore, the 1 kHz condition is treated strictly as an empirically useful operating frequency selected from the observed sensitivity and linearity; it is not assigned to Maxwell–Wagner relaxation, diffusion-related transport, or any other specific physical transition. Establishing such a mechanism would require additional measurements, for example, full complex impedance/admittance data over a denser frequency range together with characterization of the insulating coating and controlled interface experiments. The observed frequency dependence is consistent with the established behavior of liquid-loaded interdigital and coplanar capacitive structures [1,2,3]. The measured should therefore not be interpreted as an intrinsic dielectric constant or complex permittivity of the honey–syrup mixture.
This interface interpretation is also consistent with the broader low-frequency honey-sensing literature, while highlighting an important difference in electrode configuration. Impedance-based electronic tongues with bare electrodes can deliberately exploit the electrical double layer and small conductivity differences between honey samples [7]. EIS studies of honey–syrup adulteration likewise model both bulk and interfacial contributions using complete complex-impedance data [8]. In the present work, by contrast, the insulating coating suppresses direct metal–liquid contact, and only equivalent parallel capacitance was retained. Accordingly, these prior studies inform the possible origin of low-frequency electrical sensitivity but do not justify assigning the present response to the same bare-electrode double-layer mechanism.
Accordingly, the six-frequency vector is treated as an empirical electrical feature of the complete coated-electrode–substrate–sample–fixture system. The six discrete measurements do not constitute a physically resolved dielectric or impedance spectrum, and the present experiment does not deconvolute coating capacitance, coating–liquid interfacial polarization, sample dielectric/conductive contributions, substrate capacitance, and fixture parasitics.
The choice of 1 kHz as the single-frequency reference is supported by the quantitative comparison in Table 5. Although 100 Hz produced the largest absolute endpoint change ( pF), its response was less regular (). The 1 kHz response provided the highest slope (0.1778 pF per percentage point), the highest (0.9524), and the largest normalized endpoint response (18.87%). Thus, 1 kHz was selected on the basis of combined sensitivity and linearity rather than absolute capacitance magnitude alone.
The regression analysis further shows that the use of several excitation frequencies does not, by itself, guarantee improved estimation. Under LOOCV, the 1 kHz linear regression produced , an RMSE of 8.22 percentage points, and an MAE of 7.34 percentage points. The six-frequency PLSR model performed less favorably, with , an RMSE of 10.58 percentage points, and an MAE of 8.08 percentage points. In contrast, the six-frequency SVR model achieved the lowest prediction errors, with , an RMSE of 6.93 percentage points, and an MAE of 5.66 percentage points. These cross-validated results indicate that the six capacitance variables are strongly correlated and that combining them through a linear latent-variable model does not necessarily provide additional predictive information beyond the strongest individual frequency.
To separate input dimensionality from regression form, the matched SVR analysis used the same nonlinear model class and identical nested LOOCV procedure for 1 kHz and six-frequency inputs. The 1 kHz SVR yielded , RMSE = 17.53 percentage points, and MAE = 11.08 percentage points, whereas the six-frequency SVR yielded , RMSE = 6.93 percentage points, and MAE = 5.66 percentage points. This matched comparison supports a predictive benefit from the additional frequency-dependent inputs within the available data set rather than attributing the difference solely to nonlinear model capacity. Nevertheless, the inference remains limited. The 1 kHz input was selected from the complete data set before cross-validation, only eleven composition-level observations are available, and no independent batch was held out. The matched result is therefore interpreted as conditional internal evidence rather than proof of general superiority of multi-frequency sensing.
This distinction is important when positioning the present work relative to existing IDC and microwave sensing studies. Previous research has shown that interdigital or strongly localized electric-field structures can provide high sensitivity to composition-dependent changes in liquids [6,12,13]. In microwave implementations, the measurable quantity is commonly a resonant-frequency shift, impedance variation, transmission coefficient, or reflection coefficient [9,11]. The present approach uses a simpler electrical interrogation scheme in which the directly measured quantity is the equivalent parallel capacitance obtained from an LCR meter. The practical advantage is that neither resonance tracking nor S-parameter acquisition is required. The trade-off is that the measured represents the complete sensor–sample system and does not provide intrinsic dielectric parameters without additional calibration or field modeling.
The present results therefore support the use of a printed IDC as a multi-frequency electrical transducer rather than as a single-frequency capacitive element. The six excitation frequencies provide different electrical views of the same sample, and these responses can be treated as a compact electrical signature. This interpretation is consistent with the broader development of multi-frequency and field-enhanced sensing architectures, in which the information carried by the response distribution can be more useful than the value obtained at one operating point. In the present case, however, the improvement was model dependent: PLSR did not improve the estimation, whereas SVR did. This observation emphasizes that multi-frequency acquisition and multivariable analysis should be considered as separate design choices. The magnitude of the cross-validated errors must also be considered relative to the 10-percentage-point spacing between neighboring syrup-volume-fraction levels. The reported six-frequency SVR RMSE of 6.93 percentage points is of the same order as this spacing. Therefore, the present RMSE should not be interpreted as evidence of a 10-percentage-point analytical resolution, and reliable discrimination between neighboring syrup-adulteration levels cannot be guaranteed from the current data. Accordingly, the present results support an overall composition-related trend across the series rather than fine-resolution classification of every adjacent concentration level. The held-out predictions and residuals are provided in Supplementary Table S1 for transparent inspection of the internal prediction errors.
The numerical results must also be interpreted in relation to the experimental unit. The regression data set contains eleven syrup-volume-fraction observations, while the 30 repeated measurement cycles recorded at each level and frequency are repetitions of the same separately prepared composition condition rather than independently prepared physical samples. Accordingly, LOOCV evaluates the internal predictive consistency of the available calibration series but does not establish between-batch reproducibility, external predictive accuracy, or generalization to honey samples of different botanical or geographical origin. Because only one honey source was represented in the present calibration series, the influence of botanical or geographical origin cannot be separated from the mixture-composition effect and remains to be evaluated with independently sourced honeys. The use of six predictor variables with only eleven concentration-level observations also makes careful preprocessing and model selection essential. Standardization and any selection of model parameters must therefore be performed using training data only within each validation cycle to prevent information leakage.
The most important extension of the present study is not simply to increase the number of repeated instrument readings, but to introduce independently prepared sample batches at each syrup volume fraction. Such a design would allow the variability associated with sample preparation to be separated from short-term measurement repeatability and would permit validation at the physical-sample level using grouped or nested cross-validation. Future experiments should include independently prepared replicate batches and retain complete traceable records of all instrument-specific settings, coating specifications, fixture compensation, placement, and measurement timing. Future work should also acquire full complex admittance or impedance over a denser frequency range. Physically constrained equivalent-circuit fitting could then be used to test whether distinct terms associated with the coating, bulk sample conductance/capacitance, coating–liquid interfacial polarization, and fixture/lead parasitics can be separated. Such deconvolution should be supported by parameter-identifiability checks and independent reference or validation measurements rather than inferred from alone. These controls would provide the basis for evaluating reproducibility, between-batch variability, physical interpretation, and eventual transfer of the method to unknown samples.
Planar electrical structures have also been applied to liquid sensing using other transduction mechanisms. For example, Sonasang et al. [23] investigated liquid-level sensing using microstrip parallel-coupled lines and frequency-dependent electromagnetic responses. Although the sensing structure and frequency range differ from those of the present IDC, such results further illustrate the general sensitivity of planar electric-field structures to liquid loading.
Overall, the principal engineering result of this study is that a simple copper-on-epoxy planar IDC provides a measurable frequency-dependent electrical response to changes in the investigated honey–syrup mixture. A single measurement at 1 kHz provides the clearest linear calibration, whereas the complete six-frequency response contains additional information that can be exploited by nonlinear regression. Within the limits of the present proof-of-concept data set, the results support multi-frequency direct capacitance measurement as a practical approach for extracting composition-dependent information from a complex liquid without requiring a microwave resonator or vector-network-analyzer measurement.
5. Conclusions
A planar copper-on-epoxy IDC was evaluated as a direct multi-frequency electrical transducer for a controlled honey–syrup mixture series over 100 Hz–2 MHz. Among the six excitation frequencies, 1 kHz provided the strongest single-frequency linear response, with a slope of 0.1778 pF per percentage point, , and a normalized endpoint response of 18.87%. Under LOOCV, the 1 kHz linear model yielded , RMSE = 8.22 percentage points, and MAE = 7.34 percentage points, whereas the six-frequency SVR yielded , RMSE = 6.93 percentage points, and MAE = 5.66 percentage points. Under the matched SVR comparison, the corresponding 1 kHz SVR produced , RMSE = 17.53, and MAE = 11.08 percentage points, indicating that the multi-frequency input provided additional predictive information for the nonlinear model within the present internal validation.
The measured should be interpreted as the equivalent response of the complete coated IDC–sample–measurement system rather than as intrinsic sample permittivity. The present data set contains eleven preparation levels from one honey source, and the 30 measurement cycles at each level are repeated measurements of the same prepared composition, not independent physical samples. The results therefore establish a proof-of-concept calibration within the tested series but do not establish between-batch reproducibility or generalization across honey origins. Additional independently prepared batches at each syrup volume fraction, together with validation using additional honey sources, are required before broader quantitative use is claimed. Accordingly, the reported internal-validation errors should not be interpreted as expected accuracy for unseen honey batches or different botanical origins. The multi-frequency values should further be regarded as empirical system-level features rather than a resolved dielectric spectrum. The present work is therefore limited to proof-of-concept composition sensing of a controlled honey–syrup series and does not establish a generalized honey-authentication method. In addition, although the experiment establishes that the copper was insulated from the liquid, the present -only data do not separate the individual contributions of the coating, coating–liquid interface, bulk sample response, substrate, and parasitic admittance, nor do they identify a specific dielectric-relaxation mechanism. The present data also do not demonstrate dependable separation of every adjacent 10-percentage-point syrup-volume-fraction level, because the six-frequency SVR RMSE of 6.93 percentage points is already comparable with the 10-percentage-point spacing between neighboring samples. These points require independently prepared replicate batches, complete coating specifications, full complex impedance/admittance measurements, and controlled placement/timing experiments in a follow-up validation.
Supplementary Materials
The following supporting information can be downloaded at https://www.mdpi.com/article/10.3390/electronicmat7040030/s1, Supplementary Table S1 contains the outer-LOOCV held-out predictions and signed residuals for the matched 1 kHz SVR and six-frequency SVR analyses.
Author Contributions
Conceptualization, B.Y. and S.S.; methodology, B.Y. and S.S.; software, B.Y., S.S.; validation, B.Y., Y.S. and S.S.; formal analysis, B.Y., Y.S. and S.S.; investigation, B.Y., Y.S. and T.P.; resources, N.A., S.S. and T.P.; data curation, B.Y. and Y.S.; writing—original draft preparation, B.Y. and S.S.; writing—review and editing, N.A., S.S. and T.P.; visualization, B.Y. and Y.S.; supervision, N.A. and S.S.; project administration, S.S. All authors have read and agreed to the published version of the manuscript.
Funding
This research received no external funding.
Data Availability Statement
The concentration-level mean capacitance data supporting the findings of this study are contained within the article. The reported loaded-sample means were obtained from 30 repeated measurement cycles for each separately prepared syrup volume fraction. The corresponding experimental measurement records are retained by the authors.
Acknowledgments
During the preparation of this manuscript, the authors used ChatGPT (GPT-5.6 Sol, OpenAI) to assist with manuscript organization and language refinement. The revised sensor schematic and analytical workflow figure were prepared as technical illustrations from the verified device dimensions and documented analysis steps, respectively. Both were reviewed by the authors for technical consistency and are not presented as photographic evidence of the experimental setup. All technical content, numerical results, interpretations, and final wording were reviewed and verified by the authors, who take full responsibility for the content of the publication.
Conflicts of Interest
The authors declare no conflicts of interest.
References
- Mamishev, A.V.; Sundara-Rajan, K.; Yang, F.; Du, Y.; Zahn, M. Interdigital sensors and transducers. Proc. IEEE 2004, 92, 808–845. [Google Scholar] [CrossRef] [Scilit]
- Martinez-Lopez, A.G.; Guzman-Caballero, D.E.; Mejia, I.; Tinoco, J.C. Silicon based coplanar capacitive device for liquid sensor applications. Sensors 2021, 21, 5958. [Google Scholar] [CrossRef] [Scilit] [PubMed]
- Seidenath, M.; Jäger, D.; Wilhelm, J.; Rauh, H.; März, M. In situ coating thickness measurement of parylene using a capacitive sensor. Electron. Mater. 2026, 7, 11. [Google Scholar] [CrossRef] [Scilit]
- Ali, S.F.; Mandal, N. Design and development of an electronic level transmitter using inter digital capacitor. IEEE Sens. J. 2019, 19, 5179–5185. [Google Scholar] [CrossRef] [Scilit]
- Liu, M.; Qin, X.; Chen, Z.; Tang, L.; Borom, B.; Cao, N.; Barnes, D.; Cheng, K.; Chen, J.; Wang, T.; et al. Frying oil evaluation by a portable sensor based on dielectric constant measurement. Sensors 2019, 19, 5375. [Google Scholar] [CrossRef] [Scilit] [PubMed]
- Angkawisittpan, N.; Manasri, T. Determination of sugar content in sugar solutions using interdigital capacitor sensor. Meas. Sci. Rev. 2012, 12, 8–13. [Google Scholar] [CrossRef] [Scilit]
- Elamine, Y.; Inácio, P.M.C.; Lyoussi, B.; Anjos, O.; Estevinho, L.M.; Miguel, M.d.G.; Gomes, H.L. Insight into the sensing mechanism of an impedance based electronic tongue for honey botanic origin discrimination. Sens. Actuators B Chem. 2019, 285, 24–33. [Google Scholar] [CrossRef] [Scilit]
- Ben Halima, H.; Sezgintürk, M.K.; Jaffrezic-Renault, N. Electrochemical impedance spectroscopy for detecting honey adulteration by sugar syrup. Discov. Electrochem. 2026, 3, 36. [Google Scholar] [CrossRef] [Scilit]
- Piekarz, I.; Sorocki, J.; Delmonte, N.; Silvestri, L.; Bozzi, M. Low-cost honey adulteration detection platform with a plug-and-measure microwave sensor. Measurement 2025, 246, 116692. [Google Scholar] [CrossRef] [Scilit]
- Chaisaeng, P.; Rasrikul, A.; Leekul, P. Development of a non-contact microwave sensor system specifically for the detection of honey adulteration with syrup. Prog. Electromagn. Res. C 2026, 166, 209–216. [Google Scholar] [CrossRef] [Scilit]
- Małek, A.; Piekarz, I.; Rydosz, A.; Sorocki, J. On the performance aspect of a low-cost interdigital capacitor microwave sensor for honey adulteration detection. In Proceedings of the 2026 26th International Microwave and Radar Conference (MIKON), Krakow, Poland, 18–21 May 2026; pp. 286–290. [Google Scholar] [CrossRef] [Scilit]
- Govind, G.; Akhtar, M.J. Metamaterial-inspired microwave microfluidic sensor for glucose monitoring in aqueous solutions. IEEE Sens. J. 2019, 19, 11900–11907. [Google Scholar] [CrossRef] [Scilit]
- Martinic, M.; Mertens, M.; Schreurs, D.; Nauwelaers, B.; Vandenbosch, G.A.E.; Markovic, T. Highly sensitive impedance-matched microwave dielectric sensor for glucose concentration measurements. IEEE Sens. J. 2025, 25, 7962–7972. [Google Scholar] [CrossRef] [Scilit]
- Wang, X.; Liu, G. A microwave sensor for solid and liquid material identification based on improved ELC with ring resonators and interdigital electrode. IEEE Sens. J. 2026, 26, 3967–3974. [Google Scholar] [CrossRef] [Scilit]
- Phillips, T.; Abdulla, W. A new honey adulteration detection approach using hyperspectral imaging and machine learning. Eur. Food Res. Technol. 2023, 249, 259–272. [Google Scholar] [CrossRef] [Scilit]
- Razavi, R.; Esmaeilzadeh Kenari, R. Ultraviolet–visible spectroscopy combined with machine learning as a rapid detection method to predict adulteration of honey. Heliyon 2023, 9, e20973. [Google Scholar] [CrossRef] [Scilit] [PubMed]
- Calle, J.L.P.; Punta-Sanchez, I.; Gonzalez-de-Peredo, A.V.; Ruiz-Rodriguez, A.; Ferreiro-Gonzalez, M.; Palma, M. Rapid and automated method for detecting and quantifying adulterations in high-quality honey using Vis-NIRs in combination with machine learning. Foods 2023, 12, 2491. [Google Scholar] [CrossRef] [Scilit] [PubMed]
- Punta-Sanchez, I.; Dymerski, T.; Perez Calle, J.L.; Ruiz Rodriguez, A.; Ferreiro Gonzalez, M.; Palma Lovillo, M. Detecting honey adulteration: Advanced approach using ultra-fast gas chromatography (UF-GC) coupled with machine learning. Sensors 2024, 24, 7481. [Google Scholar] [CrossRef] [Scilit] [PubMed]
- Gonçalves, W.B.; Teixeira, W.S.R.; Cervantes, E.P.; Mioni, M.S.R.; Sampaio, A.N.C.E.; Martins, O.A.; Gruber, J.; Pereira, J.G. Application of an electronic nose as a new technology for rapid detection of adulteration in honey. Appl. Sci. 2023, 13, 4881. [Google Scholar] [CrossRef] [Scilit]
- Milli, M.; Soylemez Milli, N.; Parlak, I.H. Rapid detection of honey adulteration using machine learning on gas sensor data. npj Sci. Food 2025, 9, 74. [Google Scholar] [CrossRef] [Scilit] [PubMed]
- Wold, S.; Sjöström, M.; Eriksson, L. PLS-regression: A basic tool of chemometrics. Chemom. Intell. Lab. Syst. 2001, 58, 109–130. [Google Scholar] [CrossRef] [Scilit]
- Smola, A.J.; Schölkopf, B. A tutorial on support vector regression. Stat. Comput. 2004, 14, 199–222. [Google Scholar] [CrossRef] [Scilit]
- Sonasang, S.; Phromloungsri, R.; Srisawat, S.; Rattanangam, W.; Angkawisittpan, N. Liquid level measurement using sensors with microstrip parallel coupled lines. In Proceedings of the 2019 IEEE 2nd International Conference on Power and Energy Applications (ICPEA), Singapore, 27–30 April 2019; pp. 106–109. [Google Scholar] [CrossRef] [Scilit]

Disclaimer/Publisher’s Note: The statements, opinions and data contained in all publications are solely those of the individual author(s) and contributor(s) and not of MDPI and/or the editor(s). MDPI and/or the editor(s) disclaim responsibility for any injury to people or property resulting from any ideas, methods, instructions or products referred to in the content. |
© 2026 by the authors. Licensee MDPI, Basel, Switzerland. This article is an open access article distributed under the terms and conditions of the Creative Commons Attribution (CC BY) license.