


Abstract
Reliable prediction of concrete strength development is important for mixture design and performance assessment, yet conventional experimental–statistical approaches often describe strength at discrete curing ages or require separate calibration for different material systems. This study develops and evaluates an experimental–statistical model for describing time-dependent compressive and flexural strength evolution by integrating mixture composition, curing age, and strength normalization within a common regression formulation. Self-compacting concrete incorporating recycled brick powder, recycled fine aggregate, and Na2SO4 activation was used as the primary experimental system. The experimental database combined the previously investigated mixtures with newly obtained 90-day compressive and flexural strength data. Using the resulting dataset, strength development was normalized with respect to the corresponding 28-day reference strengths and represented using alternative time-dependent functions. A second-order logarithmic function provided the best representation of the normalized strength trajectories, with R2 values of 0.999 for compressive strength and 0.983 for flexural strength. Unified regression models incorporating mixture-design factors, curing age, and composition–time interactions were subsequently developed for the investigated experimental system. Model performance and applicability were assessed through leave-one-mixture-out cross-validation, blind validation, and independent literature datasets covering different mixture compositions, experimental designs, and curing-age ranges. The results show that normalization provides a common representation of relative strength development across the investigated cement-based systems, while mixture composition remains relevant to the evolution of normalized strength. The findings support the use of the proposed experimental–statistical model as an engineering modeling framework for describing and predicting normalized compressive and flexural strength development from experimentally available data. When combined with a reference strength, the formulation can also be used to estimate absolute strength over the investigated curing-age range.
1. Introduction
In recent years, the advancement of building materials has been increasingly driven by the imperative to mitigate the environmental impact of their production. It is widely acknowledged that Portland cement manufacturing remains one of the largest sources of anthropogenic CO2 emissions in the construction sector, which has spurred ongoing research into alternative binders and strategies for partial cement replacement with secondary materials [1,2,3]. Within this framework, mineral waste streams from the construction industry—including fine-grained products derived from recycled ceramics and concrete crushing waste—are of particular interest, as they can be effectively reintegrated into cementitious composites [4,5,6].
A promising avenue in this regard involves the use of fine powder generated during the recycling of ceramic brick. This material exhibits pozzolanic activity and is capable of partially substituting cement, thereby reducing its consumption and, consequently, the carbon footprint of the resulting composite [7,8,9]. However, the application of ceramic brick powder is subject to several constraints, primarily associated with its reduced reactivity during the early stages of hardening, as well as its potential effects on the rheological behavior of fresh mixtures [10,11]. To enhance hydration kinetics and stimulate pozzolanic reactions, chemical additives may be employed. In particular, sodium sulfate (Na2SO4) has been shown to accelerate the hydration kinetics of cement by shortening the induction period and increasing the rate of hydrate phase formation [12,13].
In parallel, significant advances have been made in the utilization of recycled aggregates derived from concrete crushing waste. The use of such aggregates enables a considerable reduction in the consumption of natural resources and a decrease in construction waste volumes; however, their application entails a number of technological specificities. Notably, these materials exhibit elevated porosity and water absorption capacity, along with the presence of residual cement paste, which collectively alter the properties of the interfacial transition zone (ITZ) [14,15]. These factors exert a multifaceted influence on composite performance, manifesting in reduced density, modified rheological behavior, and variations in mechanical strength, particularly at high replacement levels of natural aggregates.
The relevance of the aforementioned approaches becomes particularly pronounced in the context of developing self-compacting concrete (SCC), which imposes stringent requirements on rheological properties, segregation resistance, and structural homogeneity [16]. Unlike conventional concretes, SCC is highly sensitive to changes in particle size distribution and the characteristics of fine fractions, rendering the incorporation of secondary materials both a promising and technologically challenging endeavor [17]. Consequently, the development of SCC incorporating ceramic brick powder and recycled aggregates represents a multi-parameter optimization problem that necessitates a comprehensive assessment of the compositional effects on the resulting performance characteristics.
The simultaneous incorporation of multiple secondary components, each possessing distinct physicochemical properties, substantially complicates the mix design of SCC. In such multicomponent systems, the effect of any individual constituent is not independent but is rather accompanied by pronounced interaction effects—both among the components themselves and with the cementitious matrix and other composition parameters. Conventional mix design approaches, which rely on varying one factor at a time while keeping others fixed, prove inadequate for describing such systems, as they fail to account for these interactions. In this regard, experimental–statistical modeling based on the design of experiments (DoE) and response surface methodology (RSM) proves to be an effective tool [18,19,20,21]. RSM has also been widely applied for the optimization of cementitious mixtures, providing a systematic framework for relating mixture variables to multiple fresh and hardened concrete responses and for identifying feasible and optimal mixture regions [22]. This methodological framework enables quantitative assessment of individual factor effects, detection of their interactions, and construction of predictive empirical models for material properties within a given factor space. Nevertheless, established RSM-based approaches are typically limited to analyzing material properties at discrete, fixed time points, whereas the explicit integration of mixture-design variables with a continuous curing-age function remains less commonly addressed.
A number of fundamental models have been developed to describe the evolution of concrete strength over time, and these are widely employed in engineering practice. In particular, the fib Model Code 2010 [23] represents strength as a time-dependent function through a development coefficient that depends on cement type and hydration kinetics. Earlier empirical relationships, including hyperbolic functions, were proposed within the CEB-FIP Model Code 1990 [24] and have since been systematized in the classical monographs by A. M. Neville [25] and P. Kumar Mehta [26]. In RILEM recommendations, the evolution of strength is primarily addressed through the concepts of maturity and degree of hydration [27]. An alternative approach is the maturity method, standardized in ASTM C1074 [28], which is based on the concept of time–temperature equivalence originally proposed by Nurse and Saul [29,30] and subsequently extended by Freiesleben-Hansen and Pedersen using Arrhenius-type relationships to account for activation energy [31]. This method enables the influence of temperature regime on strength development to be taken into account; however, it requires experimental calibration and is primarily intended to describe strength development through maturity-related parameters rather than through an explicit DoE representation of multiple mixture-design factors.
Recent studies have demonstrated that the fib Model Code 2010 [23] can be adapted for concretes containing mineral admixtures, such as slag and fly ash, by adjusting the model parameters and introducing the concepts of equivalent age and apparent activation energy [32,33,34]. The maturity method has also been further extended to various cement types and mineral admixtures [35,36], its scope now encompassing the effect of elevated curing temperatures at early ages [37]. Nevertheless, these approaches require additional calibration and generally do not provide a direct response-surface representation in which mixture-design factors and their interactions with curing time can be incorporated within a single regression formulation.
The kinetics of strength gain in concrete represent a nonlinear process governed by the succession of dominant hydration and structure-formation mechanisms. Early stages are characterized by high chemical reaction rates, whereas at later stages strength development becomes diffusion-controlled [38,39,40,41,42,43,44,45]. Similar mechanisms underpin numerical hydration models, such as HYDCEM and CEMHYD3D, which enable the evolution of microstructure and strength in cementitious systems to be described [46,47]. Despite the considerable body of research available, the majority of existing relationships are confined to narrow composition ranges and fixed age intervals, most commonly 28 days [48,49].
While compressive strength has traditionally been regarded as the primary performance indicator for concrete, it is flexural strength that governs the material’s resistance to tensile stresses, which develop as early as the initial stages of crack formation. Compared to compressive strength, flexural strength exhibits significantly greater sensitivity to variations in the microstructure of the cement paste, the quality of the ITZ, and the presence of microdefects—particularly those arising from the incorporation of mineral admixtures and secondary materials. Accordingly, predicting the evolution of flexural strength constitutes a research question in its own right and affords a more comprehensive understanding of the structure-formation kinetics of cementitious composites.
A substantial number of empirical relationships have been proposed for estimating flexural strength, the majority of which express it as a function of compressive strength. The best-known models are codified in normative documents [23,50,51] and have been extensively examined in studies on high-strength concretes and advanced cementitious composites [52,53]. However, these relationships typically describe strength at a specific age and do not explicitly account for the evolution of flexural strength over time. Moreover, existing models based on maturity and hydration parameters have been developed predominantly for compressive strength, whereas DoE-compatible formulations explicitly describing the time-dependent evolution of flexural strength remain comparatively limited.
Despite the considerable advances made in the field of concrete strength prediction, there remains a methodological gap in approaches that simultaneously represent mixture composition, curing age, and the evolution of normalized strength within a DoE framework. In particular, a modeling strategy is needed that can retain the advantages of RSM-based mixture modeling while representing curing age as a continuous variable and allowing composition–time interactions to be identified statistically. Recent years have witnessed attempts to develop more versatile models, including strategies grounded in hydration kinetics [54], the concept of degree of reaction [55], and machine learning methods [56,57]. Nevertheless, these models either require extensive input data or suffer from limited interpretability and restricted practical applicability.
There thus exists a need for approaches that combine the advantages of DoE mix design modeling with the capability of describing continuous strength evolution over time, which is particularly relevant for systems incorporating secondary materials and chemical activation. Accordingly, the present study focuses on the development and evaluation of an engineering modeling framework rather than on the characterization of a particular SCC mixture system. The SCC system investigated experimentally provides the engineering material context for developing, calibrating, and evaluating the proposed modeling methodology.
The present study is based on the hypothesis that normalization of strength by the experimentally determined 28-day reference strength can reduce the influence of the absolute strength level on its time-dependent evolution, while retaining composition-related effects through composition–time interaction terms. This model allows the influence of mixture composition and curing age to be represented within a common regression structure without assuming composition-independent strength kinetics.
The objective of this study is to develop and evaluate a generalized engineering-oriented experimental–statistical methodology for describing time-dependent compressive and flexural strength using DoE, 28-day strength normalization, and a continuous time-dependent regression function. The proposed methodology is demonstrated using SCC incorporating ceramic brick powder, recycled fine aggregate, and sodium sulfate as representative mixture-design variables.
To achieve the stated objective, the following tasks were undertaken:
- –
- Development of a generalized regression structure that incorporates mixture-design factors, curing age, and composition–time interaction terms through normalization by the experimentally determined 28-day strength;
- –
- Evaluation of the ability of the proposed model to represent strength development for mixtures excluded from model calibration using leave-one-mixture-out cross-validation;
- –
- Independent blind assessment using an additional concrete mixture not included in model development;
- –
- Assessment of the applicability of the generalized model structure to independent literature datasets involving different mixture-design factors, experimental designs, and curing-age ranges;
- –
- Comparison of the temporal behavior of compressive and flexural strength within the proposed modeling strategy.
2. Materials and Methods
2.1. Raw Materials
The following materials were used in this study: slag Portland cement CEM III/A 42.5 N manufactured by Heidelberg Cement AG (Heidelberg, Germany) and ceramic red brick powder waste (BP) from Lücking GmbH & Co. Ltd. (Warburg, Germany) with an average particle size of 63 µm. The chemical characteristics of the CEM III/A cement and the BP used in the present study were previously investigated by XRF analysis [7]. The CEM III/A cement contained 27.04% SiO2, 52.35% CaO, 8.71% Al2O3 and 1.47% Fe2O3, while the BP contained 56.68% SiO2, 8.33% CaO, 16.87% Al2O3 and 6.30% Fe2O3. The combined content of SiO2 + Al2O3 + Fe2O3 in the BP was 79.85%, exceeding the 70% criterion used for classification as an active mineral additive. The strength activity index (SAI) determined at 7 and 28 days in blended cement systems further confirmed the activity of the investigated BP; for CEM III, the investigated BP compositions generally exceeded the 75% SAI criterion, except for the 30% replacement.
Quartz sand (QS) had a fineness modulus of 2.89, and recycled sand (RS) derived from construction and demolition waste, produced by Heidelberg Materials AG (Heidelberg, Germany), had a fineness modulus of 2.46. The SCC compositions incorporated SH Compact filler (SH Minerals GmbH, Heidenheim an der Brenz, Germany), a natural calcium carbonate material. The targeted workability of the SCC mixtures was achieved using MC-Power Flow 1102 polycarboxylate superplasticizer (SP) from MC-Bauchemie GmbH & Co. Ltd. (Bottrop, Germany) and tap water for mixing. Anhydrous sodium sulfate (Na2SO4) produced by Cordenka GmbH & Co. Ltd. (Erlenbach am Main, Germany) was employed as a chemical activator (CA).
Detailed material characterization and experimental procedures are reported in our previous study [58]. All SCC mixtures were designed to attain a uniform slump flow range of 870 to 880 mm. Furthermore, all SCC mixtures met the criteria for passing ability (J-ring test) and segregation resistance. As a result, all investigated mixtures fulfilled the relevant standard specifications for SCC [59,60,61].
2.2. Mixture Design
The experimental program was designed using DoE methodology [18,19]. A three-factor D-optimal design was employed, which enables efficient investigation of the effects of variable mix parameters with a minimum number of trials [20,21]. The following factors were selected:
X1—BP content, corresponding to 0–30% cement replacement by mass;
X2—volumetric substitution rate of QS by RS, ranging from 0 to 100% (due to the lower density of RS compared to QS, all mixtures were prepared with a constant total aggregate volume);
X3—CA content, ranging from 0 to 1% by mass of the total binder (cement + BP).
In addition to the 15 calibration mixtures, Mixture A was prepared as a blind-validation mixture within the investigated factor space (Table 1). This mixture was not used for model calibration or parameter estimation. Its composition was selected to combine a high level of BP replacement and RS substitution with a rational CA dosage, while maintaining the required fresh-state properties and targeting strength characteristics comparable to those of the reference concrete [58]. Mixture A therefore provided an independent test point within the experimental design domain rather than an additional calibration point.
Table 1.
Experimental design matrix (factors and levels) and corresponding mix proportions for the investigated SCC compositions.
2.3. Testing Methods
The experimental program included the characterization of fresh and hardened SCC properties. Slump flow, J-ring flow, segregation resistance, air content, fresh density, and open time were determined according to the procedures described in [58]. The corresponding fresh-state characteristics were used to confirm the suitability of the mixtures for SCC and are not treated as model responses in the present study.
For hardened concrete, compressive strength and flexural strength were considered as the principal mechanical responses. Experimental results at 1, 3, 7, and 28 days were obtained from the experimental database reported in [58]. To extend the investigated curing period and enable assessment of the later-age portion of the strength-development trajectory, additional tests were performed at 90 days for all investigated mixtures in Table 1.
The 90-day tests were performed using the same specimen types, curing conditions, loading procedures, and testing standards as those applied to the earlier-age measurements reported in [58].
The resulting dataset for the 15 calibration mixtures comprised five curing ages (1, 3, 7, 28, and 90 days), corresponding to 75 observations for each mechanical response. Mixture A was treated separately and was not included in the calibration dataset. Its five age-specific observations were reserved for blind validation of the final model.
2.4. Response Surface Methodology and Experimental–Statistical Modeling
To describe the effects of the factors on the investigated concrete properties, RSM was employed. The experimental data were approximated using second-order polynomial models:
where Y denotes the response variable; xi are dimensionless coded factors; and b0, bi, bii, and bij are regression coefficients. Since the factors are dimensionless, the regression coefficients are expressed in the same units as the response variable.
Y = b0 + b1x1 + b2x2 + b3x3 + b11x12 + b22x22 + b33x32 + b12x1x2 + b13x1x3 + b23x2x3
Experimental–statistical (ES) models describing the effects of mixture composition parameters on the investigated responses were developed using the COMPEX software package v1.1, which implements the methodology of DOE and RSM analysis. The regression coefficients were estimated considering a one-sided risk level of α = 0.10, as is commonly adopted in construction materials research [18,19].
The statistical significance of each regression coefficient was evaluated using the Gaussian precision criterion. Coefficients that were not significantly different from zero at the selected significance level were sequentially eliminated from the model. Following each elimination step, the regression equation was recalculated, and the significance analysis was repeated. This iterative procedure continued until only statistically significant coefficients remained in the final model.
The adequacy of the resulting ES models was subsequently verified using Fisher’s F-test. The calculated F-statistic was compared with the corresponding critical value for the adopted significance level and the relevant degrees of freedom. Models satisfying the adequacy criterion (Fcalc < Fcrit) were considered statistically adequate and were accepted for further interpretation and analysis. The final ES models were expressed as second-order polynomial equations containing only statistically significant terms, while coefficients associated with excluded terms were assigned a value of zero.
2.5. Time-Dependent Strength Modeling
To describe strength development over curing time while accounting for mixture composition, the RSM-based modeling approach was extended by introducing a dimensionless strength-development function. For each mixture, the normalized strength was defined as:
where
f(t)—compressive/flexural strength of concrete at a given age (1, 3, 7, 28 and 90 days).
f28—experimentally measured 28-day compressive/flexural strength of the corresponding mixture. Separate normalized responses were defined for compressive strength, Rc(t), and flexural strength, Rf(t).
The normalization provides a dimensionless measure of relative strength development and reduces the direct effect of differences in absolute strength magnitude between mixtures. It does not imply that mixture composition is independent of strength-development kinetics; composition-dependent time effects were therefore explicitly considered in the subsequent regression formulation. This eliminates the influence of the absolute strength level and directs attention to the kinetics of its development.
Importantly, normalization does not remove the experimentally observed differences in strength development at individual curing ages. The measured strengths at 1, 3, 7, 28 and 90 days are retained in the normalized dataset and are represented through the curing-age terms and composition–time interaction terms of the unified model.
The time-dependent term was introduced into the model in the form of the logarithmic function ln(t), which is justified by the nonlinear nature of hydration processes and is widely used in modeling strength kinetics [40,41]. To improve the accuracy of the description at different stages of hardening, the terms ln2(t) and 1/t were additionally considered, reflecting the deceleration of processes at later stages and the intense kinetics of early hydration, respectively. The optimal representation was selected based on statistical significance criteria and predictive accuracy; it is presented in Section 3.
The present study uses experimentally measured 28-day strength values. The resulting model should therefore be interpreted as a model for composition-dependent relative strength development and subsequent reconstruction of absolute strength, rather than as a stand-alone model that predicts absolute strength solely from mixture composition and curing time.
2.6. Model Validation and Applicability Assessment
The performance and applicability of the developed strength-modeling framework were assessed using a hierarchical evaluation strategy comprising model calibration, leave-one-mixture-out cross-validation (LOMO CV), blind validation, and assessment against independent literature datasets. The same evaluation procedure was applied to both compressive and flexural strength.
The initial model calibration was performed using the 15 mixture compositions investigated in the present study (Table 1). The 28-day strength was used as the reference value for normalization, and the normalized strength was defined by Equation (2). Consequently, the 28-day observation represents the normalization anchor rather than an independent temporal prediction point.
To assess the ability of the model to describe the strength-development trajectory of a mixture excluded from model calibration, LOMO-CV was performed. The 15 mixtures of the calibration dataset were treated as 15 validation groups. In each iteration, all five observations corresponding to one mixture were excluded from model calibration, while the remaining 14 mixtures (70 observations) were used to estimate the regression coefficients of the generalized time-dependent model. The resulting model was then applied to the excluded mixture using its coded composition factors, and strength was predicted at 1, 3, 7, 28, and 90 days. The procedure was repeated until each mixture had been excluded once, resulting in 75 out-of-sample predictions. Since the complete set of observations for a given mixture was withheld in each iteration, the procedure evaluates prediction for an unseen mixture composition rather than merely for an unseen individual observation.
In addition to LOMO-CV, a blind validation was performed using Mixture A, which was not included in the development of the experimental–statistical models. Mixture A was located within the investigated factor space and was experimentally produced and tested independently of the 15 calibration mixtures. Its coded factor levels were supplied to the final model without recalibration, and the resulting predictions were compared with the experimentally measured strength values at the investigated curing ages. This procedure provided an independent test of the model within the factor domain covered by the experimental design.
A further assessment was conducted using independent datasets reported in the scientific literature. These datasets differed from the present experimental system in terms of mixture composition, number and type of design factors, experimental design, and curing-age range. For each literature dataset, the generalized model formulation was retained, while the regression coefficients were estimated from the corresponding experimental dataset using its own coded mixture factors. The resulting equations were then used to represent the normalized strength evolution reported in the respective study. Therefore, this analysis was not treated as blind external prediction of previously unseen observations. Instead, it was used to assess whether the proposed mathematical framework and its normalization–time-function structure could be applied to and adequately represent strength-development data obtained from independent concrete systems with different experimental designs and factor combinations.
Model performance was evaluated using the coefficient of determination (R2), root mean square error (RMSE), mean absolute percentage error (MAPE), and bias. Absolute percentage errors (APE) were calculated relative to the corresponding experimentally measured strength values. Parity plots of experimental versus predicted strength were additionally used to provide a graphical assessment of agreement and systematic deviations.
Given that the 28-day strength serves as the normalization reference, performance metrics were reported both for the complete set of evaluated ages and after exclusion of the 28-day observations. The latter analysis provides a more stringent assessment of temporal strength-development performance because it excludes the normalization anchor from the statistical evaluation. Age-specific prediction errors were also examined to identify differences in model performance across the investigated curing ages.
The validation and applicability assessments were conducted using the same generalized model formulation, without modification of its mathematical structure for individual validation datasets.
3. Results and Discussion
3.1. Mechanical Properties: Baseline Analysis
The evolution of compressive and flexural strength from 1 to 28 days was previously discussed in [58]. Therefore, only a concise overview of these previously reported results is provided here, with emphasis on the newly obtained 90-day data, as summarized in Table 2.
Table 2.
Compressive and flexural strength of SCC mixtures at 1, 3, 7, and 28 days (adapted from [58]) and at 90 days (present study); ‘±’ denotes standard deviation.
3.2. Compressive Strength at 90 Days
Based on the experimental results presented in Table 2, ES-model (3) describing the concrete compressive strength at 90 days was developed. The corresponding response surface illustrating the combined effects of varied factors is presented in Figure 1. Additional two-dimensional contour plots illustrating the combined effects of pairs of mixture-design factors at different fixed levels of the third factor are provided in the Appendix A (Figure A1, Figure A2 and Figure A3).
fc90 (MPa) = 93.82 − 2.05x1 − 2.23x22 + 5.03x3 − 1.55x2x3
Figure 1.
Response surface for 90-day compressive strength as a function of SCC mix composition parameters.
The obtained relationships indicate that the 90-day compressive strength is influenced by the three investigated factors, with BP and CA exhibiting statistically significant linear effects, whereas the effect of RS substitution is nonlinear. The model also reveals a statistically significant interaction between RS substitution and CA dosage. Among the factors investigated, the BP content exerts the most pronounced influence on the absolute strength level. An increase in the degree of cement replacement is associated with a reduction in compressive strength, which is consistent with the lower clinker content of the binder system. At the same time, increasing the CA dosage partially counteracts this reduction in strength, which may be associated with enhanced hydration and increased reactivity of the BP content. Moreover, increasing the CA dosage is associated with higher predicted 90-day strength, with values of approximately 90–95 MPa retained at elevated BP contents within the investigated factor space. The effect of RS, as noted above, is nonlinear and is characterized by an optimal content range. As its quantity increases to approximately 529 kg/m3, strength increases across almost the entire range of the other factors. This is likely attributable to the densification of the particle size distribution of the concrete mix and the positive contribution of the residual cement paste adhering to the surface of the RS. Simultaneously, the presence of a statistically significant x2x3 interaction term indicates an interdependent influence of RS and the CA. Consequently, the effectiveness of using RS is determined not only by its content but also by the level of chemical activation of the cementitious system, which must be taken into account when designing the concrete mix.
3.3. Flexural Strength at 90 Days
Using the experimental data from Table 2, the ES-model (4) describing the concrete flexural strength at 90 days was developed. The resulting response surface showing the combined effects of varied factors is presented in Figure 2. Additional two-dimensional contour plots illustrating the combined effects of pairs of mixture-design factors at different fixed levels of the third factor are provided in the Appendix A (Figure A4, Figure A5 and Figure A6).
ff90 (MPa) = 14.16 − 0.35x1 + 0.32x2 − 0.26x22 + 0.54x3 − 0.4x2x3
Figure 2.
Response surface for 90-day flexural strength as a function of SCC mix composition parameters.
Response surface analysis reveals that the general trend in factor effects on 90-day flexural strength is largely consistent with that observed for compressive strength. The BP content remains the dominant factor: increasing its proportion reduces flexural strength as a consequence of the lower clinker content. This reduction, however, can be partly compensated for by increasing the CA dosage, with flexural strength remaining in the range of approximately 13.5–14 MPa within the investigated factor space. The RS effect continues to exhibit a distinct nonlinear pattern, with the response surface indicating a region of comparatively higher flexural strength at an intermediate RS content of approximately 529 kg/m3. Thus, the trends identified for flexural strength show several qualitative similarities to those obtained for compressive strength, pointing to a unified mechanism by which RS influences the long-term mechanical behavior of the SCC under study.
Yet, it should be noted that this type of behavior may be attributable to the simultaneous manifestation of two opposing mechanisms. On the one hand, the residual cement paste adhering to the surface of RS promotes additional hydration processes and improves aggregate–paste bonding [62]. On the other hand, the increased porosity of the RS and the presence of the old ITZ may reduce its intrinsic mechanical efficiency [63]. The interplay of these processes may contribute to the observed intermediate range of RS contents associated with higher measured strength. The obtained results indicate that even at high cement replacement levels with BP (165–205 kg/m3), the use of CA and a rational RS content ensures flexural strength on the order of 14 MPa. Further increases in BP content are not accompanied by strength growth; however, they do allow the achieved level of mechanical properties to be maintained while simultaneously reducing Portland cement consumption.
3.4. Strength Development and Time Normalization
The experimental results showed that the investigated mixtures exhibited substantially different compressive and flexural strength values throughout the hardening period. At the same time, it remains unclear whether these differences are attributable solely to the absolute strength levels or whether they are associated with the kinetics of strength development itself. To separate the effect of the time-dependent strength evolution from the absolute strength level, all experimental data were normalized relative to the corresponding strength values at 28 days. This approach enables direct comparison of strength evolution trajectories for mixtures with different absolute strength levels and provides a basis for assessing whether a common empirical time-dependent function can describe the normalized strength development within the investigated experimental domain.
3.4.1. Normalized Strength Evolution
The normalized data obtained from Equation (2) were analyzed to determine whether concrete mixtures with different compositions follow a common strength-development pattern. Particular attention was paid not to the absolute strength values but to the similarity of the normalized kinetics. To this end, the normalized compressive strength Rc(t) and the normalized flexural strength Rf(t) were analyzed for all investigated mixtures throughout the entire hardening period—from 1 to 90 days, as presented in Figure 3. For each testing age, the mean normalized strength, standard deviation (SD), and coefficient of variation (CoV) were calculated; the results are summarized in Table 3. This approach makes it possible to quantify the relative convergence of the normalized compressive and flexural strength trajectories at different curing ages and provides a quantitative basis for evaluating whether their strength development can be represented by a common time-dependent relationship within the investigated experimental domain.
Figure 3.
Normalized strength evolution of all investigated SCC mixtures: compressive strength (a) and flexural strength (b).
Table 3.
Statistical evaluation of the normalized compressive and flexural strength development.
Figure 4 illustrates the evolution of the CoV of the normalized strength response and provides a quantitative representation of the variation among the investigated mixtures at different curing ages.
Figure 4.
CoV evolution of normalized compressive and flexural strength with curing age.
The CoV decreases substantially from 1 to 28 days for both compressive and flexural strength, reaching zero at 28 days as a direct consequence of the normalization procedure. At 90 days, the CoV increases again but remains substantially lower than at 1 day. Thus, the normalized strength response exhibits markedly lower relative variability at later curing ages than at the earliest investigated age, although the variability does not decrease monotonically over the entire curing period. This age-dependent variation provides a quantitative basis for assessing the relative convergence of normalized strength trajectories at different curing ages and supports the use of normalized strength as a basis for describing the common temporal component of strength development within the investigated experimental domain. Despite the differences in absolute compressive and flexural strength values, the obtained results support the hypothesis that the normalized strength gain can be described by a common empirical time-dependent form within the investigated factor space, while composition-dependent differences in the temporal response can be represented through composition–time interaction terms included in the regression model. Therefore, within the investigated factor space, the normalized experimental data exhibit a common overall strength-development pattern, while retaining measurable composition-dependent variation in the rate of strength gain.
The normalized strength values provide additional insight into strength evolution beyond the absolute 90-day response surfaces. As shown in Table 3, the mean normalized compressive strength increased from 1.000 at 28 days to 1.051 at 90 days, while the corresponding flexural strength reached 1.029. Thus, the 28-day reference value does not represent the endpoint of strength development, with further gains occurring during subsequent curing. This behavior is consistent with continued hydration and ongoing development of the cementitious matrix. In mixtures containing BP, secondary pozzolanic reactions may additionally contribute to the formation of binding phases over this period. The CA may further contribute to the continued development of the cementitious matrix by increasing the reactivity of the binder system. At the aggregate scale, residual cementitious paste associated with RS may contribute to changes in the interfacial region during continued curing. The combined contribution of these mechanisms provides a plausible explanation for the moderate increase in normalized strength observed between 28 and 90 days.
In addition to the individual normalized strength curves, averaged normalized strength curves were constructed together with the boundaries corresponding to ± SD (Figure 5).
Figure 5.
Average normalized strength development and variability envelope (mean ± SD) for all investigated SCC mixtures: compressive strength (a) and flexural strength (b).
The resulting plots clearly illustrate the variability attributable to differences in mixture composition and allow the consistency of the normalization-based approach to be assessed. The relatively narrow range of deviations indicates a similar overall normalized strength-development pattern across most mixtures, despite differences in constituent materials and their proportions. However, the remaining variation and the statistically significant interaction terms involving composition and time indicate that the normalized kinetics should be regarded as broadly similar rather than strictly composition-independent.
3.4.2. Selection of the Time-Dependent Function
To obtain a generalized mathematical description of the normalized compressive and flexural strength development, a number of time functions commonly used in concrete technology were analyzed. The aim was to determine whether a single time function could adequately describe the averaged normalized strength kinetics for both compression and flexural strength across all investigated mixtures. The quality of fit for each function was assessed using the R2 and RMSE. The results are presented in Table 4.
Table 4.
Statistical performance of different time functions describing normalized compressive and flexural strength evolution.
A simple logarithmic function provided an acceptable fit to the experimental data for compression (R2 = 0.907; RMSE = 0.08) and for flexural strength (R2 = 0.874; RMSE = 0.088), confirming that the strength gain rate generally follows a logarithmic relationship. However, notable deviations were observed at early ages, indicating that a single logarithmic term is insufficient to fully capture the nonlinear kinetics of strength development. The introduction of an additional time-dependent component substantially improved predictive accuracy. The inclusion of a reciprocal time term, 1/t, increased the coefficient of determination and reduced the prediction error for both compression and flexural strength. The highest goodness of fit to the mean normalized strength trajectories was obtained with the second-order logarithmic function containing both ln(t) and ln2(t) terms. This function yielded R2 = 0.999 and RMSE = 0.009 for compressive strength, and R2 = 0.983, RMSE = 0.028 for flexural strength. These results indicate that this functional form closely represents the average normalized strength-development trends of the investigated mixtures.
The comparison indicates that the simple logarithmic function provides a less accurate representation of the normalized strength-development data than the extended formulations considered. The inclusion of a second nonlinear time-dependent term substantially enhances the accuracy of the model. Among the functions considered, the second-order logarithmic relationship provided the best fit to the experimental data and was consequently selected as the common empirical time-dependent form for the subsequent unified regression model:
R(t) = a + b × ln(t) + c × ln2(t)
3.5. Unified Strength-Evolution Models
The analysis presented in Section 3.4 indicated that the normalized strength trajectories of the investigated SCC mixtures showed a broadly similar temporal pattern, despite differences in mixture composition. Furthermore, the evolution of normalized strength over time was well described by a second-order logarithmic function for the averaged normalized responses in both compression and flexural strength. These findings suggest that normalized strength development can be described through a temporal component coupled with mixture-design effects, including composition–time interactions. On this basis, a unified regression model was formulated to describe normalized strength as a function of mixture composition and curing time:
R = f (x1, x2, x3, t)
To develop a unified regression model describing the time-dependent evolution of normalized strength as a function of mixture composition and curing time, a combined dataset (Table 5) was used. For the three-factor experimental design adopted in the present study, the unified 4D regression model takes the following form:
where
R(t) = b0 + btln(t) + bttln2(t) + b1x1 + b2x2 + b3x3 + b1tx1ln(t) + b2tx2ln(t) + b3tx3ln(t)
R(t)—normalized compressive/flexural strength;
x1–x3—coded mixture-design factors;
t—curing time in days.
The terms describing the interaction between the composition variables and the logarithmic function of time allow the model to account for composition-dependent differences in the normalized strength-development rate.
For a selected mixture, the corresponding coded values of x1, x2, and x3 are substituted into Equation (7), together with the selected curing age t, to obtain the normalized strength R(t). The normalized value is then converted into absolute strength using the experimentally determined 28-day reference strength of the same mixture, according to f(t) = R(t)f28. Thus, the model predicts the relative strength-development trajectory, whereas the absolute strength scale is established by the mixture-specific 28-day reference value.
Although Equation (7) is presented for the three-factor experimental design considered in this study, the same modeling structure can be extended to a different number of mixture-design variables by adding the corresponding composition terms and composition–time interaction terms. In its generalized form, the proposed strength evolution model can be written as:
where n denotes the number of coded mixture design variables. The generalized formulation preserves the same modeling principle: the time-dependent terms represent the common temporal trend identified within the modeled system, while the factor terms and their interactions with ln(t) represent composition-dependent differences in the normalized response and its temporal development. The application algorithm of the proposed model is shown in Figure 6.
Figure 6.
Practical workflow for application of the proposed strength evolution model.
The workflow illustrates how the generalized formulation can be applied in principle to different numbers of mixture-design variables. For the present three-factor system, once the mixture composition and reference 28-day strength are known, the normalized strength at a selected curing age within the investigated factor space and model application range can be estimated and subsequently converted into absolute strength.
Table 5.
Structure of the unified dataset used for development of the 4D strength model.
For brevity, only the combined dataset corresponding to Mixture No. 1 is presented here. The full experimental dataset used for model development (mixtures №2-15) and the blind validation Mixture A data are provided in Appendix A (Table A1). The appendix reports the coded composition variables and normalized strength values for all mixtures, whereas the remaining time-dependent and interaction terms can be directly obtained according to the unified data structure presented in Table 5.
The coefficients of the normalized compressive and flexural strength models were estimated using multiple regression analysis (Table 6).
Table 6.
Regression coefficients of the unified 4D strength model.
Based on the statistical significance analysis, non-significant composition and composition–time terms were excluded from the final models in accordance with the model-reduction procedure described in Section 2.4. The resulting final models for normalized compressive and flexural strength are given in Equations (9) and (10), respectively:
Rc(t) = 0.395 + 0.302ln(t) − 0.035ln2(t) − 0.054x1 + 0.0128x2 + 0.0153x1ln(t) − 0.0054x2ln(t)
Rf(t) = 0.4537 + 0.2813ln(t) − 0.0342ln2(t) − 0.0478x1 + 0.0125x1ln(t)
The obtained models indicate that curing time provides the main common temporal component of normalized strength development, while composition-dependent terms account for measurable differences in the temporal response within the investigated factor space. The logarithmic terms represent the common temporal trend identified for the investigated mixtures, whereas the composition and composition–time terms allow the predicted normalized trajectory to vary with the factor levels. The resulting equations therefore provide an empirical basis for estimating the time-dependent normalized compressive and flexural strength of the investigated SCC mixtures while explicitly retaining composition-dependent effects.
3.6. Model Validation
The predictive performance and applicability of the proposed strength evolution methodology were assessed at three progressively broader levels. First, LOMO-CV was used to evaluate the prediction of mixture compositions excluded from model calibration within the investigated experimental domain. Second, an additional Mixture A, which was completely excluded from model development and cross-validation, was used for blind validation. Third, independent experimental datasets reported in the literature were considered to assess the applicability of the generalized model formulation to concrete systems characterized by different mixture-design variables and curing-age ranges. The results of these validation levels are presented below.
3.6.1. Leave-One-Mixture-Out Cross-Validation
Table 7 summarizes the overall performance of the LOMO-CV for compressive and flexural strength. The individual prediction errors for the 15 mixtures are provided as APE in Appendix A Table A2 and Table A3, respectively. The 28-day strength represents the reference age used for normalization and is therefore not considered an independent age for the assessment of temporal prediction accuracy.
Table 7.
Statistical performance of the compressive and flexural strength LOMO-CV.
The LOMO-CV results demonstrate a high predictive accuracy of the proposed framework for mixture compositions excluded from model calibration. For compressive strength, the MAPE was 4.15% when all 75 observations were considered and increased only moderately to 4.81% after exclusion of the 28-day reference observations. Similarly, for flexural strength, the MAPE increased from 4.99% to 6.03%. The corresponding R2 values remained high, decreasing from 0.982 to 0.979 for compressive strength and from 0.957 to 0.949 for flexural strength. The prediction bias remained close to zero in both cases, indicating no pronounced systematic overestimation or underestimation.
Overall, the limited change in the statistical performance after exclusion of the normalization reference indicates that the predictive accuracy is not governed primarily by the 28-day anchor. The LOMO-CV therefore confirms that the proposed model can reproduce the strength-development behavior of mixture compositions that were not included in model calibration, for both compressive and flexural strength.
3.6.2. Blind Validation Using Mixture A
As an additional independent test of the predictive capability, Mixture A was used for blind validation. This mixture was completely excluded from the model-development dataset and was not used for determination of the regression coefficients. Its coded composition factors were subsequently introduced into the calibrated model, and the normalized compressive and flexural strength values were predicted at the five investigated curing ages.
The experimental and predicted normalized strength values, together with the corresponding prediction errors, are summarized in Table 8. The comparison provides a direct assessment of the framework’s ability to reproduce the strength-development trajectory of a mixture not included in model calibration.
Table 8.
Blind validation of the proposed unified 4D strength prediction model using Mixture A.
The measured and predicted normalized strength trajectories for Mixture A are additionally compared in Figure 7.
Figure 7.
Blind validation curves of Mixture A: compressive strength (a) and flexural strength (b).
The experimental and predicted trajectories show close agreement over the investigated curing period for both compressive and flexural strength. The largest deviations were observed at 1 day, with errors of 14.17% for compressive strength and 15.05% for flexural strength. This is consistent with the lower predictive accuracy observed for the earliest curing age in the LOMO-CV analysis. At 1 day, ln(t) = 0 and ln2(t) = 0; consequently, the time-dependent and composition–time interaction terms of the model do not contribute to the predicted value at this specific age. This represents a structural feature of the selected logarithmic formulation rather than a separate physical interpretation of the observed deviation. From 3 days onward, the prediction errors were substantially lower, remaining below 7% for both strength types. At 28 and 90 days, the deviations ranged from 0.12% to 5.69%. The blind validation therefore confirms that the proposed framework can reproduce the normalized strength-development trajectory of a mixture excluded from model development, with the largest deviations concentrated at the earliest investigated curing age.
3.6.3. Assessment of the Model Structure Using Independent Literature Datasets
To further assess the applicability of the proposed model structure beyond the experimental system used for its development, independent datasets reported in the literature were analyzed. The selected studies comprise Portland cement-based concrete systems investigated using different experimental designs, mixture compositions, and combinations of design factors. Depending on the individual study, the investigated factors included water-to-cement ratio, supplementary cementitious materials, fibers, accelerators, and other mixture constituents.
As summarized in Table 9, the external datasets covered two- to six-factor experimental designs, 374 distinct mixture compositions, and curing ages ranging from 1 to 360 days. In total, the datasets comprised 977 experimental observations of compressive strength, providing a broad basis for assessing the applicability of the proposed model structure across different mixture systems, experimental designs, and curing-age ranges.
Table 9.
Independent literature datasets used to assess the compressive strength model.
For each independent dataset, the generalized model formulation described in Section 2 was retained, while the regression coefficients were estimated from the corresponding experimental data using the coded mixture-design factors of that dataset. Thus, the assessment focused on the applicability of the proposed model structure and normalization–time relationship across independent datasets, rather than on direct prediction using coefficients calibrated from the present experimental dataset. Model performance for each literature dataset was evaluated using R2, MAPE, RMSE, and prediction bias, as summarized in Table 10.
Table 10.
Statistical performance of the unified compressive strength model on independent datasets.
The results demonstrate that the proposed model structure can be successfully refitted to a wide range of independent concrete datasets. For most datasets, MAPE remained below 5%, while R2 exceeded 0.95, indicating a close agreement between experimental and predicted normalized compressive strength values. Prediction bias was generally small, with both positive and negative values occurring across the datasets, indicating no consistent tendency toward systematic overprediction or underprediction.
The largest MAPE values were obtained for Hamada et al. [70] (17.25%), Zhitkovsky et al. [71] (10.77%), Kos et al. [64] (8.24%), and Simon [81] (7.27%). The datasets reported by Kos et al. [64], Zhitkovsky et al. [71], and Simon [81] contain measurements at only two curing ages, which limits the information available for describing the temporal evolution of normalized strength. The highest error was obtained for Hamada et al. [70], which extends the curing period to 360 days, substantially beyond the 90-day range reflected in the present experimental dataset. Despite the increased MAPE for this dataset, the corresponding R2 remained high (0.961), indicating that the overall strength-development trend was still adequately represented.
Importantly, the 28-day observations were retained in the calculation of MAPE, RMSE, bias, and R2 for the external datasets. This provides a consistent statistical assessment of the complete datasets, while the LOMO-CV results presented in Section 3.6.1 demonstrated that inclusion of the 28-day normalization reference produces only a limited change in the overall error metrics.
Figure 8 presents the relationship between experimentally measured and predicted normalized compressive strength values for the 977 observations obtained from the independent literature datasets listed in Table 10.
Figure 8.
Experimental versus predicted normalized compressive strength values for the independent literature datasets.
As shown in Figure 8, most experimental points are located close to the line of perfect agreement, indicating a high degree of agreement between the experimental and predicted normalized compressive strength values. The linear relationship between the experimental and predicted values is described by Rc.exp = 1.0069Rc, pred, with R2 = 0.9471. The slope close to unity indicates a low overall systematic deviation between the predicted and experimental values. These results further support the ability of the proposed unified framework to represent normalized compressive strength development across independent concrete datasets with different mixture compositions and experimental conditions.
Taking the results together, the independent-dataset assessment demonstrates that the proposed model provides consistent predictions across a broad range of cement-based concrete systems. For most datasets, the prediction error remained below 10%, and R2 exceeded 0.95, while the relatively larger errors were mainly associated with datasets containing only two curing ages or extending substantially beyond the 90-day range of the calibration data. Despite these limitations, the model maintained a high degree of agreement with the experimental data. The analysis of 977 independent observations from 19 literature datasets therefore provides evidence that the proposed normalization–time model structure can be successfully applied and refitted across a broad range of cement-based concrete systems.
To further assess the applicability of the proposed methodology for normalized flexural strength development, independent experimental datasets reported in the literature were analyzed. The selected studies cover different experimental designs, including two-, three-, and four-factor plans, a range of binder systems and mixture compositions, different replacement levels of the supplementary materials, and curing periods extending from 1 to 360 days. These datasets therefore provide an assessment of the model under experimental conditions substantially different from those used for model development.
Summary information on the external datasets used for the flexural strength assessment is presented in Table 11. In total, the analysis comprises 417 individual flexural strength observations obtained from eight independent datasets, covering mixture compositions with different numbers of design factors and testing ages. The corresponding statistical performance metrics are presented in Table 12.
Table 11.
Independent literature datasets used to assess the flexural strength model.
Table 12.
Statistical performance of the unified flexural strength model on independent datasets.
The results in Table 12 demonstrate that the proposed model generally provides good agreement with the independent experimental data. MAPE values below 5% were obtained for five of the eight datasets, with the corresponding R2 values ranging from 0.871 to 0.997. Particularly close agreement was observed for the datasets reported in [74] and [84], for which MAPE values of 1.30% and 2.22% and R2 values of 0.997 and 0.981, respectively, were obtained. The corresponding prediction bias values were close to zero, indicating no appreciable systematic over- or under-prediction.
For the datasets reported in [69,75,82], the MAPE values were 4.02%, 4.05%, and 5.04%, respectively. Despite the relatively low MAPE values, the corresponding R2 values were 0.886, 0.871, and 0.897. These values indicate that R2 is more sensitive to the limited variation in the experimental strength data and, therefore, should be interpreted together with MAPE, RMSE, and bias rather than as an isolated measure of predictive accuracy.
The dataset reported in [83] yielded a MAPE of 5.10% and an RMSE of 0.52 MPa, while the corresponding R2 was 0.639. The relatively low R2 is associated with the limited range of the measured flexural strength values, for which relatively small absolute prediction errors can result in a substantial reduction in the coefficient of determination. The low RMSE and moderate MAPE nevertheless indicate that the magnitude of the prediction errors remained limited.
The largest prediction error was obtained for the dataset reported in [80], with a MAPE of 15.14%, an RMSE of 2.60 MPa, and a positive bias of 1.79 MPa. At the same time, the model retained a high R2 of 0.966, indicating that the overall trend of flexural strength development was reproduced well despite a systematic overestimation of the absolute strength values. This deviation may reflect differences in material characteristics and strength-development behavior between the corresponding concrete system and the experimental domain used for model development.
The dataset reported in [64] also exhibited a comparatively higher MAPE of 9.64%. Similar to [83], this dataset contains measurements at only two curing ages. The limited number of temporal observations provides insufficient information to characterize the curvature of the time-dependent function and therefore restricts the accuracy with which the complete strength-development trajectory can be represented.
Overall, the independent flexural-strength datasets demonstrate that the proposed model structure can be applied to concrete systems with substantially different mixture compositions, experimental designs, and curing-age ranges. Although the prediction accuracy varies between datasets, particularly where only two curing ages are available or where the material response differs from the calibration domain, the model generally maintains low prediction bias and provides a satisfactory representation of normalized flexural strength development.
For a graphical assessment of model performance, the experimental and predicted normalized flexural strength values from the independent datasets were combined in a single parity plot (Figure 9). The analysis comprises 417 observations.
Figure 9.
Experimental versus predicted normalized flexural strength values for the independent literature datasets.
As shown in Figure 9, the majority of experimental and predicted values are distributed close to the line of perfect agreement. For the pooled dataset, the linear regression between experimental and predicted normalized flexural strength values yielded a regression equation of y = 1.026x, with R2 = 0.8994. The slope close to unity indicates a good overall agreement between experimental and predicted values and does not reveal a pronounced systematic deviation across the considered strength range. These results further demonstrate that the proposed framework provides a consistent representation of normalized flexural strength development across independent literature datasets with different mixture compositions, experimental designs, and curing-age ranges.
4. Discussion
4.1. Interpretation of the Normalized Strength Development
The results indicate that the temporal evolution of strength in the investigated cement-based mixtures can be represented using a normalized form despite substantial differences in absolute strength levels. Normalization with respect to the 28-day strength reduces the scale effect associated with differences in mixture strength and expresses the response as a relative measure of strength gain with curing age. This provides a common basis for comparing mixtures with different compositions and absolute strength levels.
An important consequence of this methodology is that mixture composition and temporal strength development can be considered within the same modeling structure. The composition variables determine the position and characteristics of the response within the experimental domain, whereas the time-dependent component describes the evolution of normalized strength. The results obtained for both compressive and flexural strength indicate that this representation can capture common features of strength development across the investigated mixtures, although the prediction accuracy varies among datasets and curing ages.
The normalization procedure should therefore not be interpreted as demonstrating that concrete mixtures exhibit identical hardening mechanisms. Rather, it provides a mathematical representation in which differences in absolute strength are separated from the relative evolution of strength with time. This distinction is important because the proposed framework describes the experimentally observed strength-development response and does not explicitly resolve the underlying hydration, microstructural, or transport processes.
The time-dependent behavior predicted by the unified model should therefore be interpreted in the context of the investigated material system. CEM III/A is a slag-rich binder, and continued strength development beyond the early curing period is expected. BP replacement and RS affect the cementitious matrix and aggregate skeleton, respectively, while Na2SO4 was investigated as an activator of the slag-containing binder system. Accordingly, the effects of the mixture factors need not remain constant with curing age, which provides the material basis for including composition–time interaction terms.
The successful application of the normalized formulation to both compressive and flexural strength further suggests that the relative evolution of these two strength characteristics can be represented using the same general modeling concept. This does not imply identical absolute strength-development behavior or identical governing mechanisms; instead, it indicates that normalization provides a useful common representation of their temporal evolution.
4.2. Relation to Existing Strength Development Approaches
The proposed methodology belongs to the class of empirical–statistical approaches to strength development but differs from conventional age–strength relationships in the way mixture composition and curing age are incorporated into the model. Its relationship to established approaches can be considered from three complementary perspectives: code-based strength-development functions, maturity methods, and hydration-based models.
- -
- Comparison with fib Model Code [23]:
fcm(t) = βcc(t) ∙ fcm28
- with
- where
fcm(t)—mean compressive strength in MPa at an age t in days;
fcm—mean compressive strength in MPa at an age of 28 days;
βcc(t)—a function to describe the development with time;
t—the concrete age in days, taking into account the temperature during curing;
s—coefficient which depends on the strength class of cement.
This concept is closely related to the normalization principle adopted in the present study because both approaches describe strength at a given age relative to a reference strength. The principal difference lies in how the time-dependent function is established. In the fib Model Code, the shape of the strength-development function is prescribed through a standardized formulation primarily related to cement and curing characteristics. The present methodology instead determines the time dependence empirically from the available experimental strength data while simultaneously incorporating mixture-design factors into the statistical model.
Extensions of the fib approach have been proposed for concretes containing supplementary cementitious materials and other modifications [32,33,34,35]. Such approaches generally require additional parameters or adjustments to account for material-specific strength-development behavior. In contrast, the proposed framework uses the experimentally observed response and the corresponding mixture factors directly within the regression structure. Its advantage is therefore not that it replaces the fib Model Code for structural design, but that it provides a flexible experimental–statistical methodology for analyzing strength development in compositionally diverse mixtures.
- -
- Comparison with Maturity Methods [27,28,29,30,31]:
Another widely used class of strength prediction methods is based on the concept of concrete “maturity,” as employed in the RILEM recommendations [27] and the ASTM C1074 standard [28]. The classical approach [29,30] relates strength gain to the integrated temperature–time factor (12), whereas more advanced techniques rely on the concept of equivalent age grounded in Arrhenius-type kinetics—for example, the Freiesleben-Hansen and Pedersen model [31], given by Equation (13).
where
M(t) = Σ (Ta − T0)Δt
M(t)—temperature-time factor at age t, °C × days;
Δt—time interval, days;
Ta—average concrete temperature during time interval Δt, °C;
T0—datum temperature, °C.
where
te—equivalent age at a specified temperature Ts, days;
Q—activation energy divided by the gas constant, K;
Ta—average temperature of concrete during time interval Δt, K;
Δt—time interval, days.
These methods, along with their modifications accounting for the accelerating effect of elevated temperatures [37], refined models describing the influence of binder type [36], and specialized approaches for high-performance concretes [35], are successfully used to predict in situ strength development under variable curing temperatures and are widely employed in construction practice. Their application, however, requires temperature measurements and an appropriate maturity–strength relationship for the concrete under consideration.
The proposed methodology addresses a different problem. It does not attempt to replace temperature-dependent maturity models or reproduce the effect of variable curing temperature. Instead, it is intended to describe strength development from experimentally measured strength data while accounting for mixture composition. Consequently, temperature history, activation-energy parameters, and maturity calibration are not required as model inputs. This makes the procedure particularly suitable for laboratory datasets and retrospective analysis of published experimental results, where detailed temperature histories are often unavailable.
- -
- Comparison with Hydration Models [38,41,42,43,44,46,47]:
Hydration-based models provide a more physically detailed description of cementitious strength development by relating mechanical properties to hydration kinetics, degree of hydration, reaction rates, pore structure, and related physicochemical processes. Such models are valuable when the objective is to describe or predict the underlying mechanisms of hardening.
The proposed framework follows a different modeling rationale. It does not explicitly model cement hydration or attempt to identify the physicochemical mechanisms responsible for strength development. Instead, it represents the experimentally observed evolution of normalized strength using a relatively compact statistical formulation. Consequently, the model sacrifices part of the mechanistic detail of hydration-based approaches in exchange for lower data and parameter requirements and direct compatibility with experimental mixture-design data.
Thus, the proposed framework should not be considered a mechanistic alternative to hydration or maturity models. Rather, it provides a complementary empirical–statistical approach for situations in which the primary objective is to quantify and predict strength development as a function of mixture composition and curing age using experimentally available data. Recent developments in computational materials modeling further demonstrate the growing role of regression and surrogate-based techniques in the prediction and probabilistic assessment of concrete performance, particularly when advanced physics-based simulations are computationally demanding [85]. Such approaches complement mechanistic modeling by providing efficient predictive or surrogate representations, although their objectives and methodological foundations differ from the experimental–statistical formulation proposed in the present study.
4.3. Methodological Characteristics and Contribution of the Proposed Framework
The methodological contribution of the present study is primarily associated with the integration of normalization, mixture composition, and curing age within a single experimental–statistical structure. In a conventional DoE/RSM analysis, the response is commonly modeled at a specified curing age, for example:
and separate response surfaces may consequently be required for different ages. In the present methodology, curing age is incorporated directly into the model together with the mixture-design factors, resulting conceptually in a formulation of the form:
fc = f (x1, x2, …, xn)
fc = f (x1, x2, …, xn, t)
The use of normalized strength further separates the relative temporal development from the absolute strength scale. This allows mixtures with substantially different strength levels to be analyzed within a common response framework. In practical application, the proposed framework is intended for situations in which the 28-day strength of the considered mixture is available or can be experimentally established. The unified model then provides the composition-dependent relative strength development over the investigated curing-age range, from which absolute strength can be reconstructed.
The resulting model should not be regarded as a fundamentally new mathematical class of regression. Its contribution lies instead in the application and integration of established experimental–statistical principles to the problem of strength development. In particular, the approach combines regression terms describing mixture effects with an explicit temporal function and response normalization, allowing mixture composition and curing age to be represented simultaneously rather than through separate models fitted at individual ages.
A further methodological feature is that the same general model structure was evaluated for both compressive and flexural strength. The applicability of the framework was assessed hierarchically through LOMO-CV, blind validation using Mixture A, and analysis of independent literature datasets. The external datasets covered different numbers of experimental design factors and curing-age ranges, including datasets extending to 360 days. This combination of validation procedures provides evidence for the predictive performance of the proposed modeling strategy within the investigated experimental domain, while the external-dataset analysis specifically evaluates the ability to refit the model structure to independent concrete systems with different mixture compositions.
The principal characteristics of the proposed methodology in relation to established strength-prediction approaches are summarized in Table 13.
Table 13.
Comparison of the proposed methodology with conventional strength-development approaches.
The main distinction of the proposed framework is therefore not the introduction of time as an additional regression variable, which is mathematically straightforward, but the integration of time-dependent normalized strength development with mixture-design factors within a common experimental–statistical formulation. This structure enables the evolution of normalized strength to be analyzed across different mixture compositions without requiring separate response models for each curing age. At the same time, the framework remains data-driven and does not seek to replace mechanistic hydration or maturity approaches. Its principal value lies in providing a relatively simple and applicable methodology for analyzing strength development from experimental mixture-design data, with demonstrated applicability to both compressive and flexural strength.
4.4. Model Accuracy, Applicability and Limitations
The proposed methodology should be interpreted as an empirical–statistical approach for describing normalized strength development within the material, curing, and experimental domains represented by the available calibration and validation data. The main limitations identified in the present study and corresponding directions for further development are summarized below.
- -
- Early age prediction. The largest prediction deviations were generally associated with the earliest investigated ages, particularly at 1–2 days, when strength development is strongly affected by rapid hydration, setting, and early microstructural formation. The logarithmic component also provides limited flexibility at the initial stage. Further research should therefore investigate alternative or additional early-age terms to improve the representation of rapid strength development where early-age performance is of primary interest.
- -
- Limited number of curing ages. The second-order logarithmic time function requires a sufficient number of independent curing ages to reliably identify its curvature. The external datasets containing only two testing ages showed higher prediction errors, illustrating this limitation. Future studies should investigate reduced-data formulations and uncertainty-based approaches that could provide reliable predictions when only a limited number of curing ages are available.
- -
- Long-term extrapolation. Although the methodology was evaluated using datasets extending to 360 days, its applicability beyond the validated age range remains uncertain. At extended curing ages, continued pozzolanic and hydraulic reactions, carbonation, and microstructural evolution may alter the strength-development kinetics. Longer-term datasets covering one to several years should therefore be used to assess whether the current time function remains adequate or requires modification.
- -
- Dependence on the reference age. The proposed normalization uses the 28-day strength as the reference value. Although this age is widely adopted as an engineering reference, the choice of normalization age may influence the resulting model coefficients and the representation of strength-development trajectories. Future studies should examine alternative reference ages, particularly 56 and 90 days, to determine whether the observed normalization behavior remains consistent.
- -
- Material and technological domain. The present validation primarily covers normal-weight cement-based concretes and related cementitious systems produced under conventional laboratory curing conditions. One lightweight-concrete dataset was included among the independent data [82]; however, the available evidence is insufficient to establish the applicability of the framework to lightweight concretes in general. A broader validation covering different aggregate types, densities, and internal-curing conditions is therefore required. Similarly, cellular concretes, including aerated and foam concretes, require dedicated investigation because their strength development is strongly influenced by pore structure and density evolution.
- -
- Curing conditions and processing technology. The available validation data do not provide a sufficient basis for generalizing the framework to steam-cured or otherwise thermally accelerated concretes. Elevated curing temperatures can substantially modify hydration kinetics and may alter the normalized strength-development trajectory. Future work should therefore investigate whether curing temperature can be incorporated as an additional variable or coupled with maturity- or activation-energy-based descriptions. Similar consideration is required for intensively compacted and pressed low-workability materials, where changes in particle packing and porosity caused by mechanical compaction may contribute substantially to strength development.
- -
- Alternative binder systems. The available validation database includes the alkali-activated mixture investigated in the present study and the independent dataset reported in [76]. Nevertheless, the available data remain insufficient to establish the applicability of the methodology across the full range of alternative binder systems. Materials governed by substantially different hardening mechanisms, including geopolymers, magnesia-based binders, sulfoaluminate cements, and carbonation-hardening materials, require dedicated cross-material validation. Such studies would help determine whether the observed normalization behavior extends beyond the binder systems represented in the present database.
Overall, the identified limitations primarily reflect the range and density of the available experimental data rather than a demonstrated failure of the normalization concept. The validation results support the applicability of the framework within the investigated domain, while the identified limitations define the conditions under which its predictions should currently be interpreted with caution. Expanding the database toward earlier and longer curing ages, alternative reference ages, broader material classes, and non-standard curing and processing conditions represents the principal direction for further development of the methodology.
5. Conclusions
This study developed and evaluated an experimental–statistical methodology for describing the time-dependent development of compressive and flexural strength by combining mixture-design variables with curing age in a unified regression model. The main conclusions are as follows:
- Normalization of strength by the 28-day reference value provided a common basis for comparing mixtures with different absolute strength levels. The results indicate that the normalized strength-development trajectories can be represented by a common time-dependent relationship across the investigated mixture compositions, while the absolute strength level remains dependent on mixture composition.
- The second-order logarithmic time function provided the most suitable representation among the functions considered in this study. The developed model enabled the temporal evolution of normalized strength to be incorporated directly into the regression model together with the mixture-design factors.
- The developed model provided a common representation of strength evolution for both compressive and flexural strength. Incorporating curing age directly into the regression structure allowed the temporal development of normalized strength to be described together with the effects of mixture composition rather than through independently fitted models for each curing age.
- The validation results demonstrated good predictive performance for mixture compositions excluded from model calibration, as shown by leave-one-mixture-out cross-validation and blind validation. The independent literature datasets were additionally used to assess the applicability of the generalized model structure across different mixture-design variables, experimental designs, and curing-age ranges, supporting its use as an engineering modeling framework beyond the specific experimental SCC system.
- The applicability of the framework is currently bounded by the available experimental evidence. The largest deviations were associated primarily with early curing ages and datasets containing only two testing ages, while broader material classes, non-standard curing conditions, and longer-term strength development require additional validation.
- The principal methodological contribution is the integration of normalized strength development and mixture-design variables within a common experimental–statistical model structure. The developed model provides a data-driven means of describing strength evolution for both compressive and flexural strength while requiring neither temperature-history data nor extensive material-specific kinetic parameters.
In summary, the results support the use of strength normalization combined with time-dependent experimental–statistical modeling as a practical approach for analyzing strength development across compositionally diverse cement-based mixtures. The demonstrated validation results provide a basis for further extension of the methodology to broader material systems, curing conditions, and longer-term strength development.
Funding
The research was funded by the Philipp Schwartz Initiative of TU Dortmund University.
Institutional Review Board Statement
Not applicable.
Informed Consent Statement
Not applicable.
Data Availability Statement
The data supporting this study are available from the author on request.
Conflicts of Interest
The author declares no conflicts of interest.
Appendix A
Figure A1.
Two-dimensional contour plots of 90-day compressive strength for X1 and X2: at fixed levels of X3 = −1 (a), X3 = 0 (b), X3 = +1 (c).
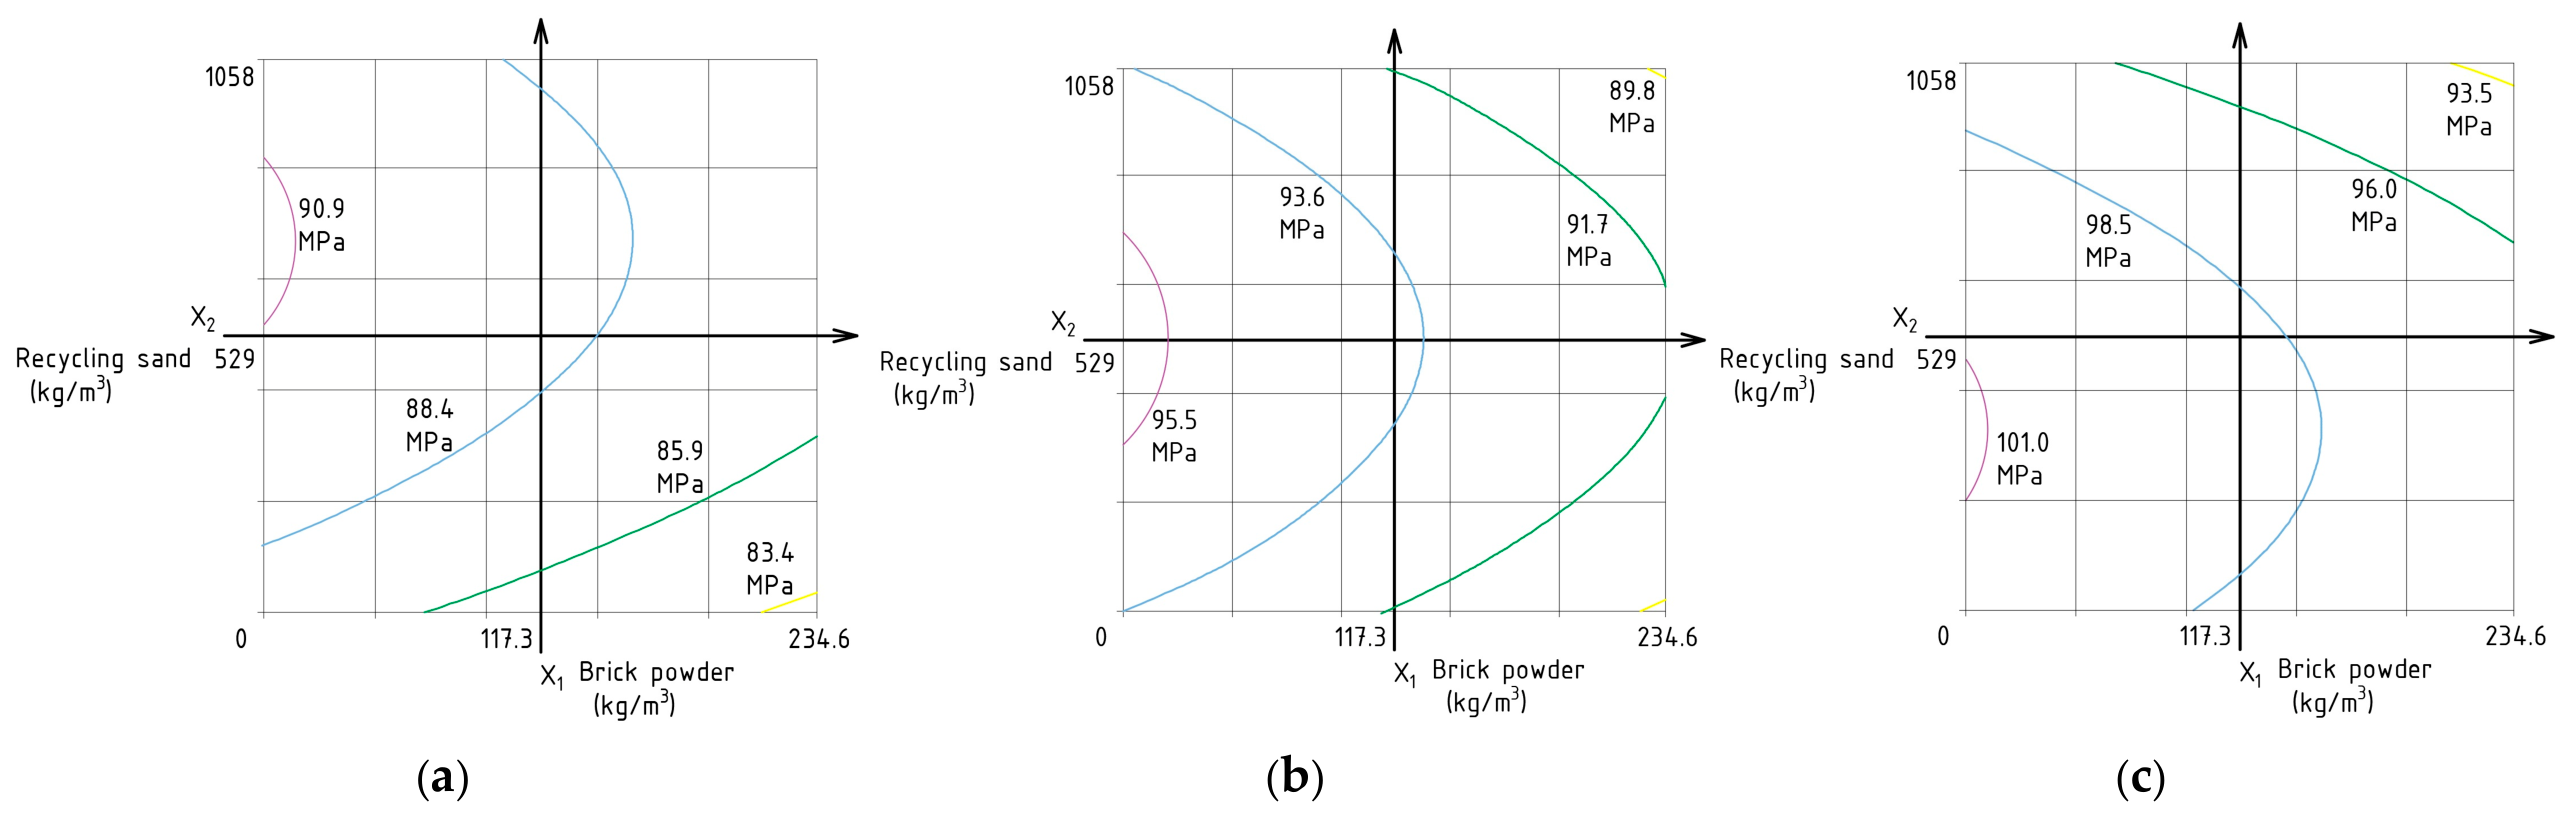
Figure A2.
Two-dimensional contour plots of 90-day compressive strength for X1 and X3: at fixed levels of X2 = −1 (a), X3 = 0 (b), X3 = +1 (c).
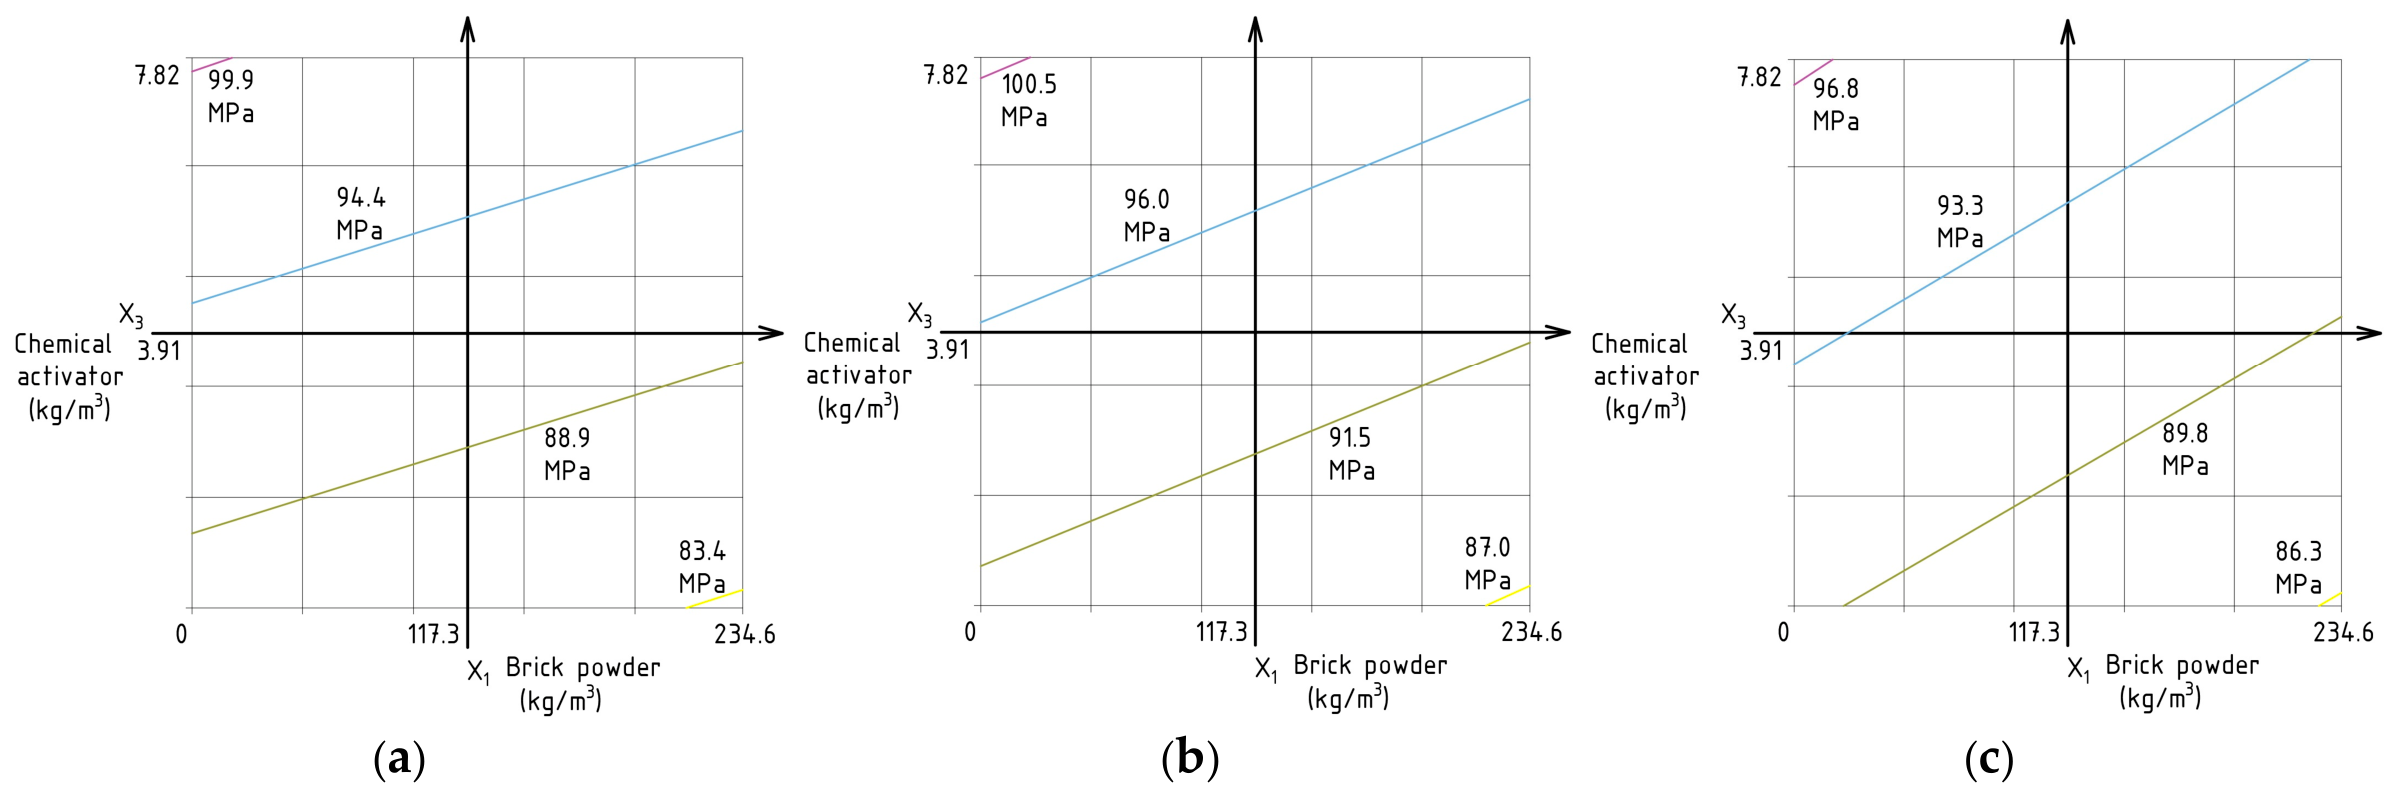
Figure A3.
Two-dimensional contour plots of 90-day compressive strength for X2 and X3: at fixed levels of X1 = −1 (a), X3 = 0 (b), X3 = +1 (c).
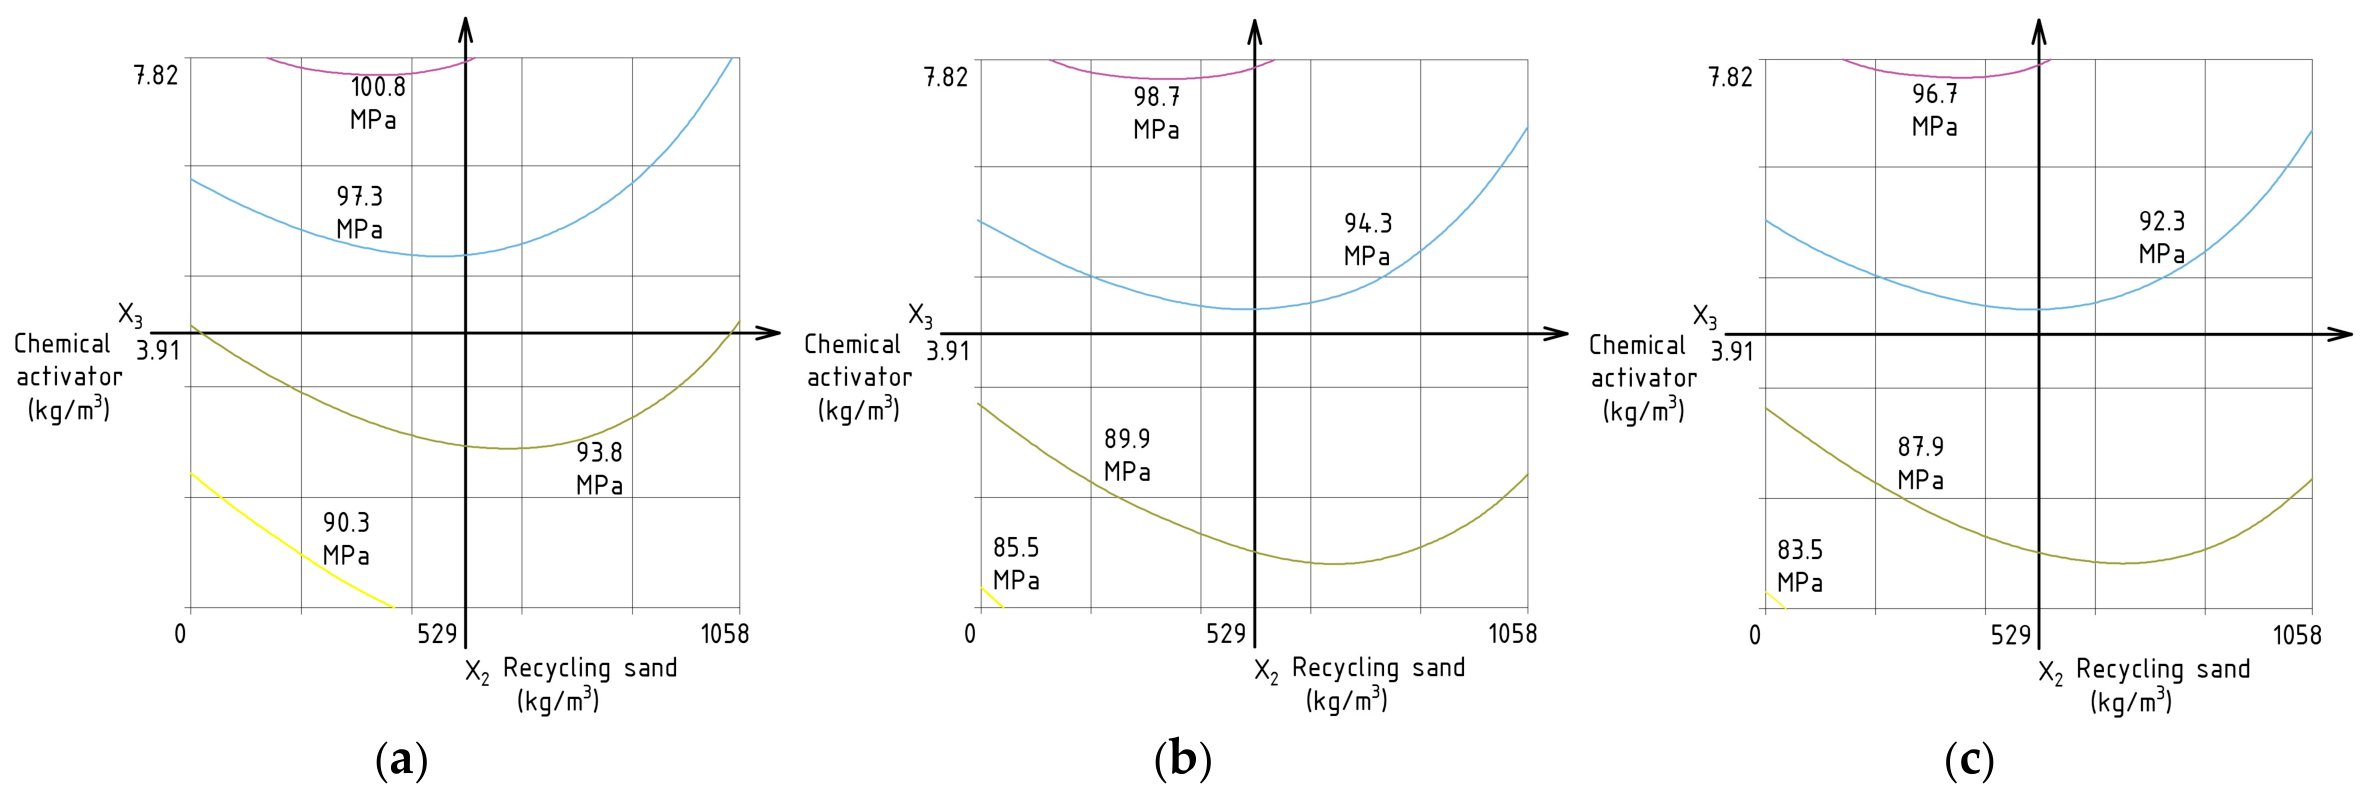
Figure A4.
Two-dimensional contour plots of 90-day flexural strength for X1 and X2: at fixed levels of X3 = −1 (a), X3 = 0 (b), X3 = +1 (c).
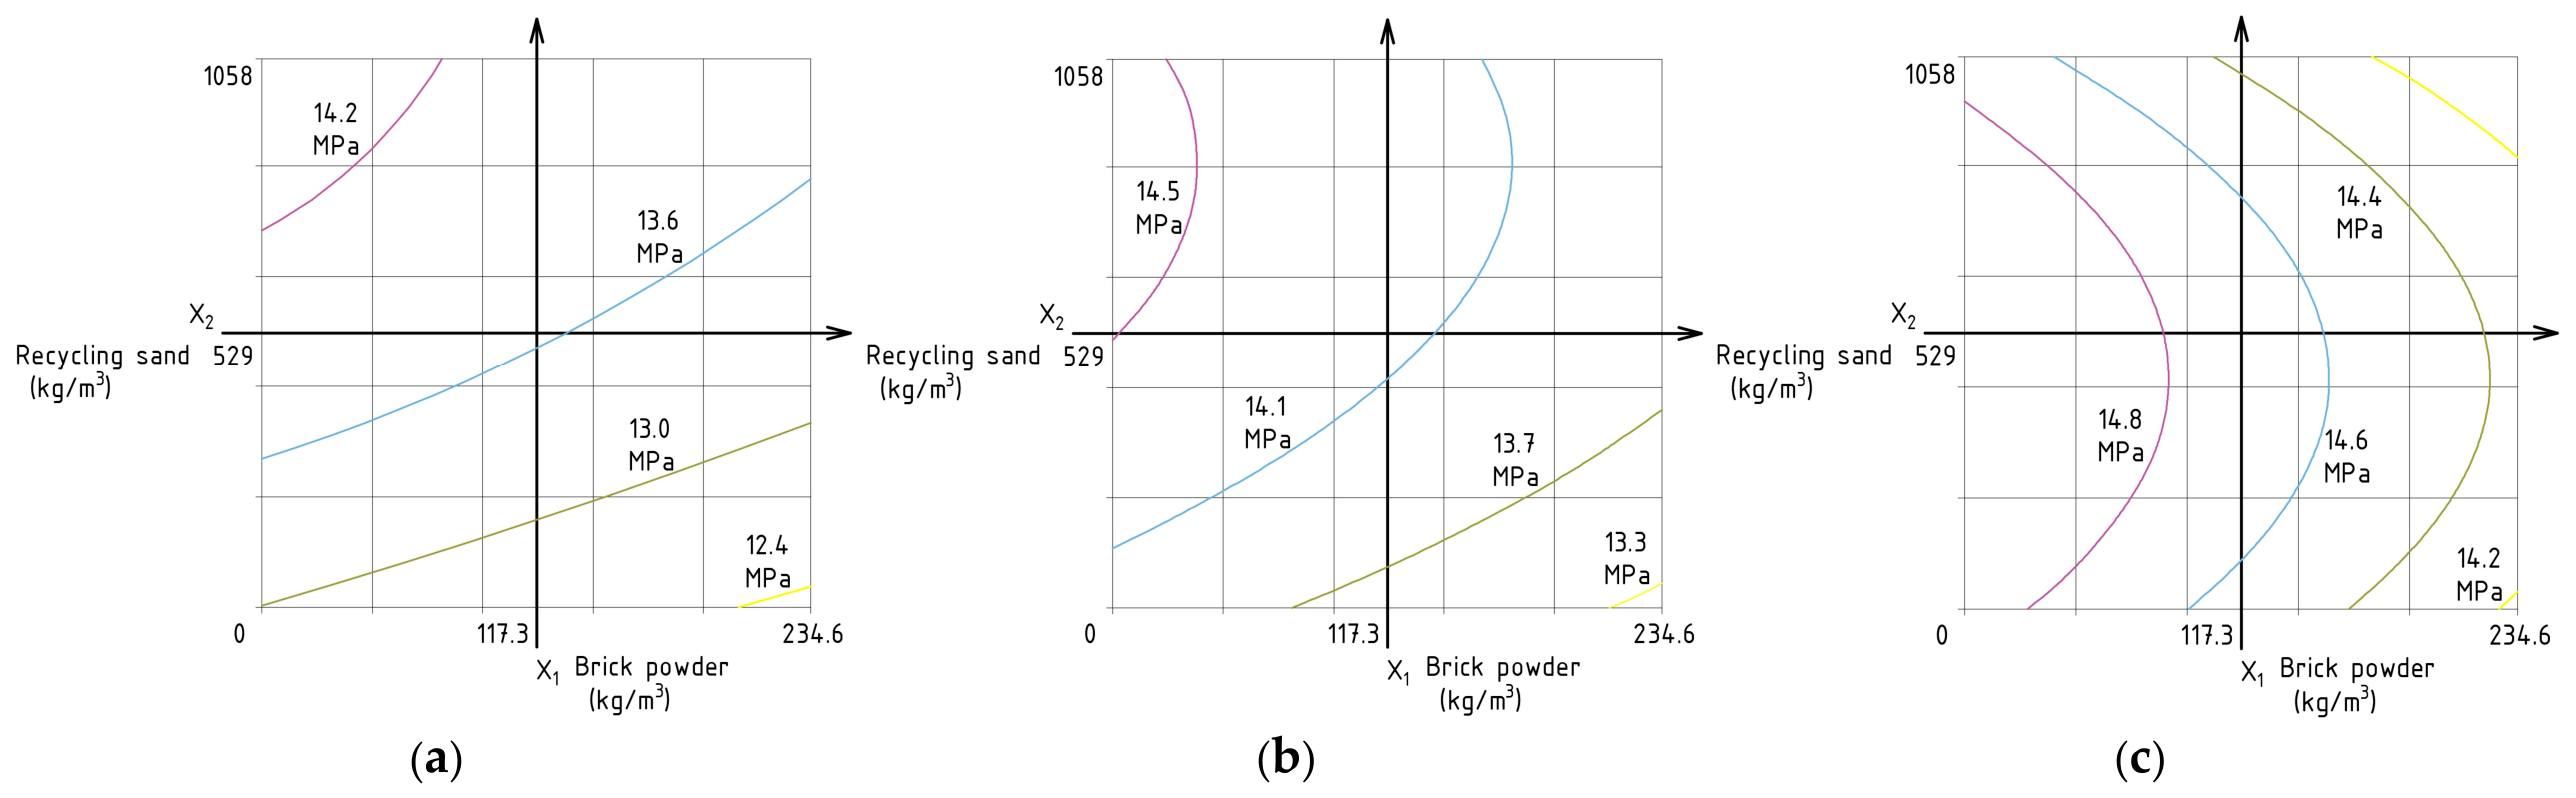
Figure A5.
Two-dimensional contour plots of 90-day flexural strength for X1 and X3: at fixed levels of X2 = −1 (a), X3 = 0 (b), X3 = +1 (c).
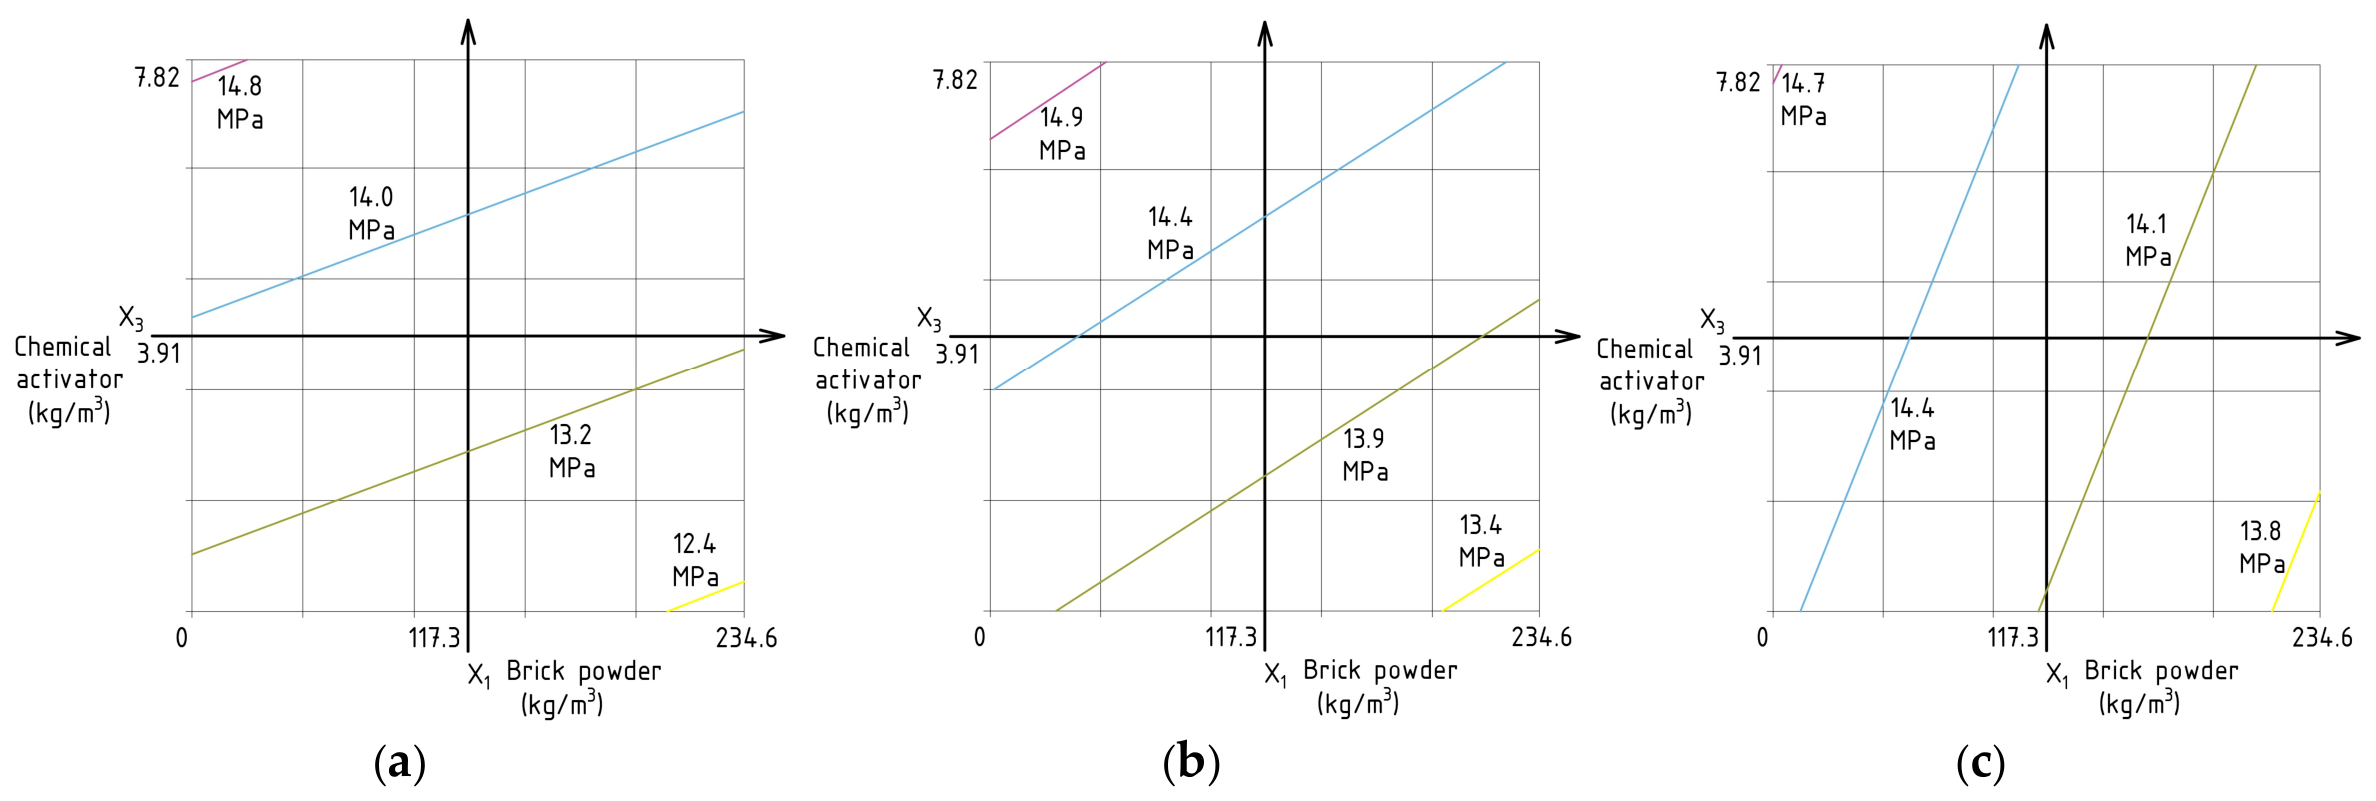
Figure A6.
Two-dimensional contour plots of 90-day flexural strength for X2 and X3: at fixed levels of X1 = −1 (a), X3 = 0 (b), X3 = +1 (c).
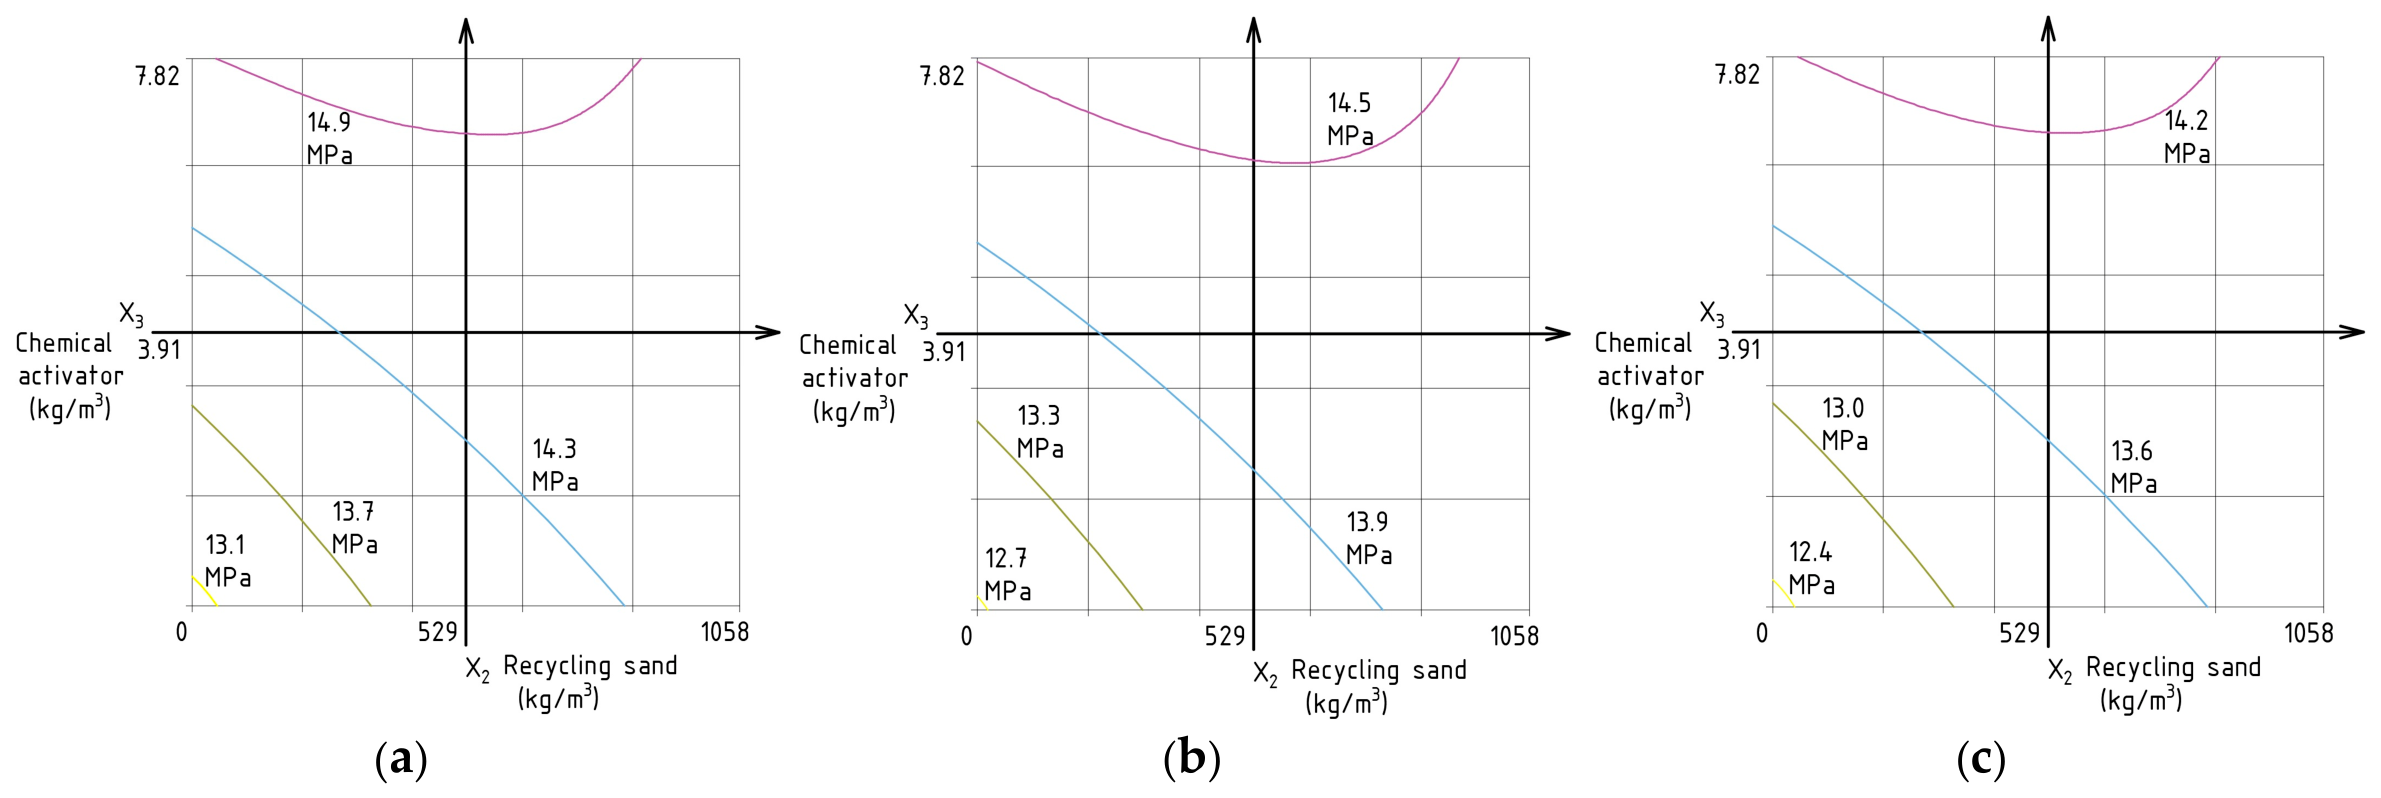
Table A1.
Complete unified dataset used for development of the proposed compressive and flexural strength models.
Table A2.
LOMO-CV prediction errors for compressive strength of individual mixtures.
Table A3.
LOMO-CV prediction errors for flexural strength of individual mixtures.
References
- Marandi, N.; Shirzad, S. Sustainable cement and concrete technologies: A review of materials and processes for carbon reduction. Innov. Infrastruct. Solut. 2025, 10, 408. [Google Scholar] [CrossRef] [Scilit]
- Sanytsky, M.A.; Rusyn, B.G.; Kropyvnytskyi, T.S.; Trefler, R.Y. Low-carbon nanomodified rapid-hardening high-performance concretes. Mater. Sci. 2025, 61, 23–27. [Google Scholar] [CrossRef] [Scilit]
- Dvorkin, L.; Zhitkovsky, V.; Lushnikova, N.; Rudoi, V. Influence of Processing and Mix Design Factors on the Water Demand and Strength of Concrete with Recycled Concrete Fines. Materials 2026, 19, 237. [Google Scholar] [CrossRef] [Scilit] [PubMed]
- Noel, N.; Gierth, A.Z.; Helmich, S.; Mielke, T.; Nawrath, S.; Landgraf, P.; Lieberwirth, H.; Lupascu, D.C. Role of ground blast furnace slag (GBFS) as a micro-milling and micro-aggregating agent in reactivated cement fines (RCFs). J. Sustain. Cem.-Based Mater. 2026, 15, 495–516. [Google Scholar] [CrossRef] [Scilit]
- Zajac, M.; Skocek, J.; Ben Haha, M.; Dienemann, W. Performance and hydration of ternary cements based on Portland clinker, carbonated recycled concrete paste (cRCP) and calcined clay. J. Sustain. Cem.-Based Mater. 2024, 13, 338–350. [Google Scholar] [CrossRef] [Scilit]
- Joyklad, P.; Nawaz, A.; Islam, J.; Tufail, R.F.; Chaimahawan, P.; Ahmad, A.; Chatveera, B. Advancements in Sustainable Green Buildings: The Multifaceted Benefits of Brick Powder as a Cement Alternative. Buildings 2026, 16, 833. [Google Scholar] [CrossRef] [Scilit]
- Kryzhanovskyi, V.; Orlowsky, J.; Skocek, J.; Macias Barrientos, M. Utilization of Brick Powder in Blended Cement Compositions: Rheological, Mechanical, and Microstructural Properties. Materials 2025, 18, 5120. [Google Scholar] [CrossRef] [Scilit] [PubMed]
- Kambale, K.M.; Abbas, M.A.A.M.; Gabi, B.J.; Martha, C. Sustainable mix design of ultra-high performance concrete incorporating recycled brick powder: Mechanical, durability, and microstructural effects. J. Sustain. Cem.-Based Mater. 2026, 15, 1646–1661. [Google Scholar] [CrossRef] [Scilit]
- Bertelsen, I.M.G.; Kahr, S.A.; Kunther, W.; Ottosen, L.M. Clay Brick Powder as Partial Cement Replacement. In International RILEM Conference on Synergising Expertise Towards Sustainability and Robustness of Cement-Based Materials and Concrete Structures. SynerCrete 2023; Jędrzejewska, A., Kanavaris, F., Azenha, M., Benboudjema, F., Schlicke, D., Eds.; RILEM Bookseries; Springer: Cham, Switzerland, 2023; Volume 44. [Google Scholar] [CrossRef] [Scilit]
- Luo, X.; Gao, J.; Li, S.; Xu, Z.; Chen, G. Experimental study on the early-age properties of cement pastes with recycled brick powder. Constr. Build. Mater. 2022, 347, 128584. [Google Scholar] [CrossRef] [Scilit]
- Shao, J.; Gao, J.; Zhao, Y.; Chen, X. Study on the pozzolanic reaction of clay brick powder in blended cement pastes. Constr. Build. Mater. 2019, 213, 209–215. [Google Scholar] [CrossRef] [Scilit]
- Robayo-Salazar, R.; Martínez, F.; Vargas, A.; Mejía de Gutiérrez, R. 3D Printing of Hybrid Cements Based on High Contents of Powders from Concrete, Ceramic and Brick Waste Chemically Activated with Sodium Sulphate (Na2SO4). Sustainability 2023, 15, 9900. [Google Scholar] [CrossRef] [Scilit]
- Zou, Z.; Provoost, S.; Gruyaert, E. Utilization of Waste Brick Powder as a Partial Replacement of Portland Cement in Mortars. Sustainability 2024, 16, 624. [Google Scholar] [CrossRef] [Scilit]
- Zhang, M.; Zhu, W.; Wu, Q.; Liao, D. Insights into Performance Enhancement of Recycled Sand Concrete via Water Compensation and Recycled Powder Regulation. Coatings 2026, 16, 192. [Google Scholar] [CrossRef] [Scilit]
- Kailani, H.Y.; Irshidat, M.R. Recycled sand from construction and demolition waste: Comprehensive characterization and potential utilization in sustainable mortar production. Emergent Mater. 2026, 9, 96. [Google Scholar] [CrossRef] [Scilit]
- Carro-López, D.; González-Fonteboa, B.; Martínez-Abella, F.; González-Taboada, I.; de Brito, J.; Varela-Puga, F. Proportioning, Microstructure and Fresh Properties of Self-compacting Concrete with Recycled Sand. Procedia Eng. 2017, 171, 645–657. [Google Scholar] [CrossRef] [Scilit]
- Santos, S.; da Silva, P.R.; de Brito, J. Self-compacting concrete with recycled aggregates—A literature review. J. Build. Eng. 2019, 22, 349–371. [Google Scholar] [CrossRef] [Scilit]
- Dvorkin, L.; Dvorkin, O.; Ribakov, Y. Multi-Parametric Concrete Compositions Design; Nova Science Publishers: New York, NY, USA, 2013; 223p. [Google Scholar]
- Lyashenko, T.V.; Voznesenskiy, V.A. Composition-Process Fields Methodology in Computational Building Materials Science; Astroprint: San Diego, CA, USA, 2017; 168p. [Google Scholar]
- Jeff Wu, C.F.; Hamada, M.S. Experiments: Planning, Analysis, and Optimization, 3rd ed.; Wiley & Sons: Hoboken, NJ, USA, 2021; 736p. [Google Scholar]
- Myers, R.H. Response Surface Methodology: Process and Product Optimization Using Designed Experiments, 4th ed.; Myers, R.H., Montgomery, D.C., Anderson-Cook, C.M., Eds.; John Wiley & Sons: Hoboken, NJ, USA, 2016; 864p. [Google Scholar]
- Hurtado-Alonso, N.; Manso-Morato, J.; Revilla-Cuesta, V.; Skaf, M.; Ortega-Lopez, V. Optimization of cementitious mixes through response surface method: A systematic review. Arch. Civ. Mech. Eng. 2025, 25, 54. [Google Scholar] [CrossRef] [Scilit]
- fib Model Code 2010. International Federation for Structural Concrete (fib), Model Code 2010; fib: Lausanne, Switzerland, 2013. [Google Scholar]
- CEB-FIP Model Code 1990. Comité Euro-International du Béton (CEB) and Fédération Internationale de la Précontrainte (FIP), CEB-FIP Model Code 1990; Thomas Telford: London, UK, 1993. [Google Scholar]
- Neville, A.M. Properties of Concrete, 5th ed.; Pearson Education Limited: Harlow, UK, 2011; 846p. [Google Scholar]
- Mehta, P.K.; Monteiro, P.J.M. Concrete: Microstructure, Properties, and Materials, 4th ed.; McGraw-Hill Education: New York, NY, USA, 2014; 704p. [Google Scholar]
- Reinhardt, H.W.; Grosse, C.U. (Eds.) Advanced Testing of Cement-Based Materials during Setting and Hardening: Final Report of RILEM Technical Committee 185-ATC; RILEM Publications S.A.R.L.: Bagneux, France, 2005; 341p. [Google Scholar]
- ASTM C 1074-17; Standard Practice for Estimating Concrete Strength by the Maturity Method. ASTM International: West Conshohocken, PA, USA, 2017.
- Nurse, R.W. Steam curing of concrete. Mag. Concr. Res. 1949, 1, 79–88. [Google Scholar] [CrossRef] [Scilit]
- Saul, A.G.A. Principles underlying the steam curing of concrete at atmospheric pressure. Mag. Concr. Res. 1951, 2, 127–140. [Google Scholar] [CrossRef] [Scilit]
- Freiesleben Hansen, P.; Pedersen, J. Maturity computer for controlled curing and hardening of concrete. Nord. Betongfoerb. 1977, 1, 19–34. [Google Scholar]
- Vollpracht, A.; Soutsos, M.; Kanavaris, F. Strength development of GGBS and fly ash concretes and applicability of fib model code’s maturity function—A critical review. Constr. Build. Mater. 2018, 162, 830–846. [Google Scholar] [CrossRef] [Scilit]
- Sun, Y.; Lee, H.S. Determination of coefficient “s” and apparent activation energy for fib model code’s maturity-based strength function when applied to fly ash concrete. Constr. Build. Mater. 2023, 409, 133643. [Google Scholar] [CrossRef] [Scilit]
- Soutsos, M.; Vollpracht, A.; Kanavaris, F. Applicability of fib model code’s maturity function for estimating the strength development of GGBS concretes. Constr. Build. Mater. 2020, 264, 120157. [Google Scholar] [CrossRef] [Scilit]
- Zhang, J.; Cusson, D.; Monteiro, P.; Harvey, J. New perspectives on maturity method and approach for high performance concrete applications. Cem. Concr. Res. 2008, 38, 1438–1446. [Google Scholar] [CrossRef] [Scilit]
- Karavelić, E.; Hajdo, E.; Hadzalic, E.; Imamovic, I.; Ademović, N. Enhanced Maturity-Strength Model for Predicting Concrete Compressive Strength. In Advanced Technologies, Systems, and Applications IX; Ademović, N., Akšamija, Z., Karabegović, A., Eds.; IAT 2024, Lecture Notes in Networks and Systems 2024; Springer: Cham, Switzerland, 2024; Volume 1143. [Google Scholar] [CrossRef] [Scilit]
- Soutsos, M.; Kanavaris, F. The modified nurse-saul (MNS) maturity function for improved strength estimates at elevated curing temperatures. Case Stud. Constr. Mater. 2018, 9, e00206. [Google Scholar] [CrossRef] [Scilit]
- Brouwers, H.J.H. A Hydration Model of Portland Cement Using the Work of Powers and Brownyard; Eindhoven University of Technology: Eindhoven, The Netherlands, 2011. [Google Scholar]
- Taylor, H. Cement Chemistry; Thomas Telford: London, UK, 1997; 459p. [Google Scholar]
- Scrivener, K.L.; Ouzia, A.; Juilland, P.; Muhamed, A.K. Advances in understanding cement hydration mechanisms. Cem. Concr. Res. 2019, 124, 105823. [Google Scholar] [CrossRef] [Scilit]
- Thomas, J.J.; Biernacki, J.J.; Bullard, J.W.; Bishnoi, S.; Dolado, J.S.; Scherer, G.W.; Luttge, A. Modeling and simulation of cement hydration kinetics and microstructure development. Cem. Concr. Res. 2011, 41, 1257–1278. [Google Scholar] [CrossRef] [Scilit]
- Gao, P.; Ye, G.; Wei, J.; Yu, Q. Extension of the Hymostruc3D model for simulation of hydration and microstructure development of blended cements. Heron 2019, 64, 125–148. [Google Scholar]
- Ye, G.; Liu, X.; Poppe, A.M.; De Schutter, G.; van Breugel, K. Numerical simulation of the hydration process and the development of microstructure of self-compacting cement paste containing limestone as filler. Mater. Struct. 2007, 40, 865–875. [Google Scholar] [CrossRef] [Scilit]
- Tomosawa, F.; Noguchi, T.; Hyeon, C. Simulation model for temperature rise and evolution of thermal stress in concrete based on kinetic hydration model of cement. In Proceedings of the Tenth International Congress on the Chemistry of Cement, Gothenburg, Sweden, 2–6 June 1997; Chandra, S., Ed.; Amarkai AB: Gothenburg, Sweden, 1997; Volume 4, pp. 72–75. [Google Scholar]
- Powers, T.C.; Brownyard, T.L. Studies of the physical properties of hardened Portland cement paste. J. Am. Concr. Inst. Proc. 1947, 43, 549–602. [Google Scholar] [CrossRef] [Scilit] [PubMed]
- Holmes, N.; Kelliher, D.; Tyrer, M. Simulating cement hydration using HYDCEM. Constr. Build. Mater. 2020, 239, 117811. [Google Scholar] [CrossRef] [Scilit]
- Bentz, D.P. CEMHYD3D: A Three-Dimensional Cement Hydration and Microstructure Development Modeling Package, Version 3.0; NIST Interagency/Internal Report (NISTIR) 7232; National Institute of Standards and Technology: Gaithersburg, MD, USA, 2005. [Google Scholar] [CrossRef] [Scilit]
- Carino, N.J.; Lew, H.S. The maturity method: From theory to application. In Proceedings of the Structures Congress & Exposition 2001; American Society of Civil Engineers (ASCE): Washington, DC, USA, 2001. [Google Scholar] [CrossRef] [Scilit]
- Nithurshan, M.; Elakneswaran, Y. A systematic review and assessment of concrete strength prediction models. Case Stud. Constr. Mater. 2023, 18, e01830. [Google Scholar] [CrossRef] [Scilit]
- ACI Committee 318. Building Code Requirements for Structural Concrete (ACI 318-25) and Commentary; American Concrete Institute: Farmington Hills, MI, USA, 2025. [Google Scholar]
- EN 1992-1-1:2023; Eurocode 2: Design of Concrete Structures. European Committee for Standardization: Brussels, Belgium, 2023.
- Kępniak, M.; Woyciechowski, P. The Statistical Analysis of Relation between Compressive and Tensile/Flexural Strength of High Performance Concrete. Arch. Civ. Eng. 2016, 62, 95–108. [Google Scholar] [CrossRef] [Scilit]
- Ahmed, M.; Mallick, J.; Hasan, M.A. A study of factors affecting the flexural tensile strength of concrete. J. King Saud Univ.-Eng. Sci. 2016, 28, 147–156. [Google Scholar] [CrossRef] [Scilit]
- Luo, X.; Liu, C.; Zhang, G.; Zhang, L.; Liu, L.; Gao, J. Thermodynamic modelling of the effect of recycled brick powder on the hydration process of cement-based materials. J. Build. Eng. 2025, 101, 111863. [Google Scholar] [CrossRef] [Scilit]
- Cotes-Prieto, D.; Buasiri, T.; Cwirzen, A. Strength and heat development models including an aging activation energy for hardening Low-Carbon Concrete. Constr. Build. Mater. 2026, 508, 145094. [Google Scholar] [CrossRef] [Scilit]
- Olvera-Mayorga, C.E.; López-Martínez, M.d.J.; Rodríguez Rodríguez, J.A.; Vázquez-Reyes, S.; Solís-Sánchez, L.O.; de la Rosa-Vargas, J.I.; Duarte-Correa, D.; GonzálezAviña, J.V.; Olvera-Olvera, C.A. AI Based Inference System for Concrete Compressive Strength: Multi-Dataset Analysis of Optimized Machine Learning Algorithms. Appl. Sci. 2025, 15, 12383. [Google Scholar] [CrossRef] [Scilit]
- Dhengare, S.; Waghe, U.; Yenurkar, G.; Shyamala, A. A comprehensive model for concrete strength prediction using advanced learning techniques. Discov. Appl. Sci. 2025, 7, 551. [Google Scholar] [CrossRef] [Scilit]
- Kryzhanovskyi, V.; Orlowsky, J. Sustainable Alkali-Activated Self Compacting Concrete for Precast Textile-Reinforced Concrete: Experimental–Statistical Modeling Approach. Materials 2024, 17, 6280. [Google Scholar] [CrossRef] [Scilit] [PubMed]
- EFNARC (European Federation of Producers and Applicators of Specialist Products for Structures). Specification and Guidelines for Self-Compacting Concrete; EFNARC: Farnham, UK, 2002; 32p. [Google Scholar]
- EFNARC (European Federation of Producers and Applicators of Specialist Products for Structures. Specification and Guidelines for Self-Compacting Concrete—Specification, Production and Use; EFNARC: Farnham, UK, 2005; 63p. [Google Scholar]
- ACI 237R-07; Self-Consolidating Concrete (Reapproved 2019). American Concrete Institute: Farmington Hills, MI, USA, 2007; 30p.
- Lu, D.; Qu, F.; Su, Y.; Cui, K. Nano-engineered the interfacial transition zone between recycled fine aggregates and paste with graphene oxide for sustainable cement composites. Cem. Concr. Compos. 2024, 154, 105762. [Google Scholar] [CrossRef] [Scilit]
- Yang, Y.; Chen, B.; Su, Y.; Chen, Q.; Li, Z.; Guo, W.; Wang, H. Concrete Mix Design for Completely Recycled Fine Aggregate by Modified Packing Density Method. Materials 2020, 13, 3535. [Google Scholar] [CrossRef] [Scilit] [PubMed]
- Kos, Ž.; Kroviakov, S.; Kryzhanovskyi, V.; Grynyova, I. Research of Strength, Frost Resistance, Abrasion Resistance and Shrinkage of Steel Fiber Concrete for Rigid Highways and Airfields Pavement Repair. Appl. Sci. 2022, 12, 1174. [Google Scholar] [CrossRef] [Scilit]
- Haque, M.; Ray, S.; Mita, A.F.; Mozumder, A.; Karmaker, T.; Akter, S. Prediction and optimization of hardened properties of concrete prepared with granite dust and scrapped copper wire using response surface methodology. Heliyon 2024, 10, e24705. [Google Scholar] [CrossRef] [Scilit] [PubMed]
- Dvorkin, L.; Konkol, J.; Marchuk, V.; Huts, A. Effectiveness of Polymer Additives in Concrete for 3D Concrete Printing Using Fly Ash. Polymers 2022, 14, 5467. [Google Scholar] [CrossRef] [Scilit] [PubMed]
- Aldahdooh, M.A.A.; Muhamad Bunnori, N.; Megat Johari, M.A. Development of green ultra-high performance fiber reinforced concrete containing ultrafine palm oil fuel ash. Constr. Build. Mater. 2013, 48, 379–389. [Google Scholar] [CrossRef] [Scilit]
- Olukayode, O.M.; Akinwande, A.A.; Balogun, O.A.; Oyediran, A.O.; Mosuru, S.G.; Abdulwahid, M.Y.; Romanovski, V. Applicability of the response surface method in the optimization of compressive strengths of banana-fiber-reinforced concrete using waste glass as partial cement replacement. Innov. Infrastruct. Solut. 2023, 8, 207. [Google Scholar] [CrossRef] [Scilit]
- Hassan, W.N.F.W.; Ismail, M.A.; Lee, H.S.; Meddah, M.S.; Singh, J.K.; Hussin, M.W.; Ismail, M. Mixture optimization of high-strength blended concrete using central composite design. Constr. Build. Mater. 2020, 243, 118251. [Google Scholar] [CrossRef] [Scilit]
- Hamada, H.M.; Al-Attar, A.; Shi, J.; Yahaya, F.; Al Jawahery, M.S.; Yousif, S.T. Optimization of sustainable concrete characteristics incorporating palm oil clinker and nano-palm oil fuel ash using response surface methodology. Powder Technol. 2023, 413, 118054. [Google Scholar] [CrossRef] [Scilit]
- Zhitkovsky, V.; Dvorkin, L.; Kochkarev, D.; Ribakov, Y. Using Experimental Statistical Models for Predicting Strength and Deformability of Self-Compacting Concrete with Ground Blast-Furnace Slag. Materials 2022, 15, 4110. [Google Scholar] [CrossRef] [Scilit] [PubMed]
- Kroviakov, S.; Kryzhanovskyi, V.; Shymchenko, P.; Aksyonova, I. Multi-Objective Optimization of Rigid Pavement Concrete Using Industrial By-Products and Polypropylene Fibers. Modelling 2026, 7, 52. [Google Scholar] [CrossRef] [Scilit]
- Dvorkin, L.; Konkol, J.; Marchuk, V.; Huts, A. Efficient, Fine-Grained Fly Ash Concrete Based on Metal and Basalt Fibers. Materials 2023, 16, 3969. [Google Scholar] [CrossRef] [Scilit] [PubMed]
- Dvorkin, L.; Zhitkovsky, V.; Ribakov, Y.; Rudoi, V. Comparative characteristics of reactive powder concretes using fly ash and microsilica. Rom. J. Mater. 2023, 53, 306–315. [Google Scholar]
- Dvorkin, L.; Zhitkovsky, V.; Marchuk, V.; Ribakov, Y. Substantiation of high-strength ash-containing mortars effective compositions using mathematical models. Rom. J. Mater. 2022, 52, 177–184. [Google Scholar]
- Kanta, N.R.; Ponnada, M.R.; Mishra, K. Application of response surface method for optimization of alkali activated slag concrete mix with used foundry sand as partial replacement of sand. Sādhanā 2022, 47, 269. [Google Scholar] [CrossRef] [Scilit]
- Hammoudi, A.; Moussaceb, K.; Belebchouche, C.; Dahmoune, F. Comparison of artificial neural network (ANN) and response surface methodology (RSM) prediction in compressive strength of recycled concrete aggregates. Constr. Build. Mater. 2019, 209, 425–436. [Google Scholar] [CrossRef] [Scilit]
- Li, H.; Zhang, L.; Liu, J.; Chu, F.; Tian, Y. Study on the Characteristics of Composite Recycled Aggregate Concrete Based on Box–Behnken Design Response Surface Model. Fractal Fract. 2023, 7, 648. [Google Scholar] [CrossRef] [Scilit]
- Sridhar, J.; Jegatheeswaran, D.; Gobinath, R. A DOE (Response Surface Methodology) Approach to Predict the Strength Properties of Concrete Incorporated with Jute and Bamboo Fibres and Silica Fumes. Adv. Civ. Eng. 2022, 13, 1150837. [Google Scholar] [CrossRef] [Scilit]
- Dvorkin, L.; Bordiuzhenko, O.; Tekle, B.H.; Ribakov, Y. A Method for the Design of Concrete with Combined Steel and Basalt Fiber. Appl. Sci. 2021, 11, 8850. [Google Scholar] [CrossRef] [Scilit]
- Simon, M.J. Concrete Mixture Optimization Using Statistical Methods; Final Report FHWA-RD-03-060; Federal Highway Administration: McLean, VA, USA, 2003; 167p.
- Hamada, H.M.; Al-Attar, A.A.; Tayeh, B.; Yahaya, F.B.M. Optimizing the concrete strength of lightweight concrete containing nano palm oil fuel ash and palm oil clinker using response surface method. Case Stud. Constr. Mater. 2022, 16, e01061. [Google Scholar] [CrossRef] [Scilit]
- Kos, Ž.; Kroviakov, S.; Mishutin, A.; Poltorapavlov, A. An Experimental Study on the Properties of Concrete and Fiber-Reinforced Concrete in Rigid Pavements. Materials 2023, 16, 5886. [Google Scholar] [CrossRef] [Scilit] [PubMed]
- Song, M.; Song, N.; Zhang, Y.; Wang, J. Mechanical Properties of Polypropylene-Fiber-Reinforced High-Performance Concrete Based on the Response Surface Method. Adv. Mater. Sci. Eng. 2022, 18, 9802222. [Google Scholar] [CrossRef] [Scilit]
- Dong, B.; Zhao, S.; Zhang, Y.; Zhang, Y.; Yu, Y.; Yang, J. Physics-based probabilistic analysis of corrosion initiation in alkali-activated slag concrete assisted by machine learning. Constr. Build. Mater. 2025, 471, 140661. [Google Scholar] [CrossRef] [Scilit]
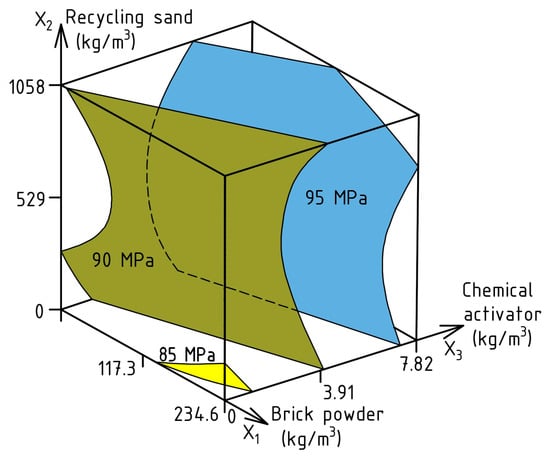
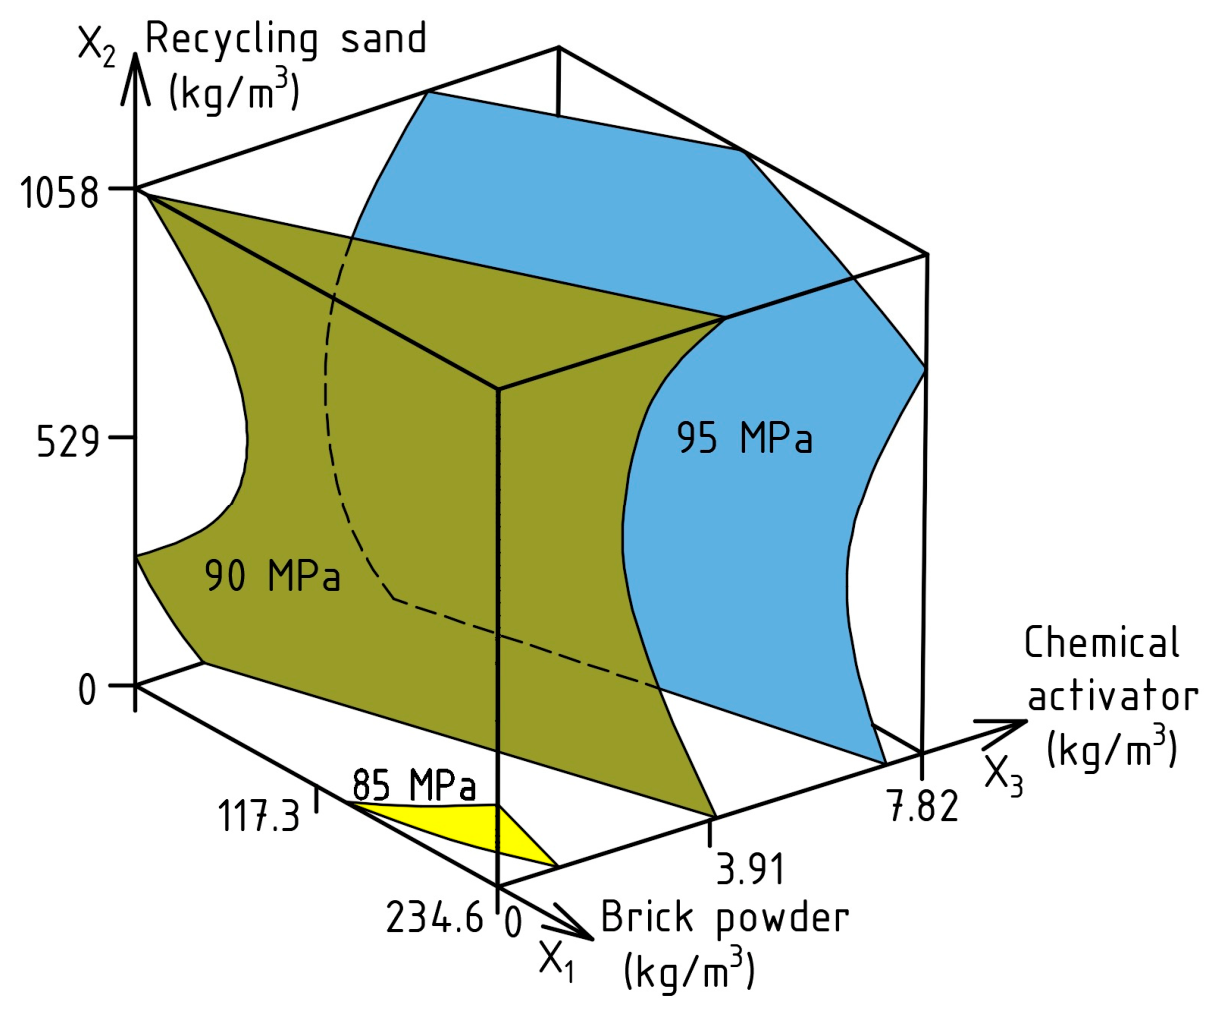
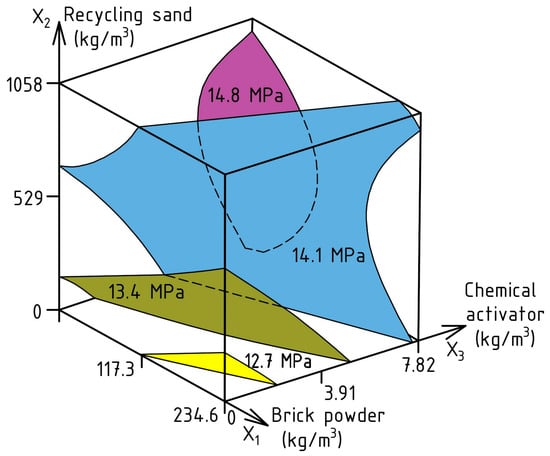
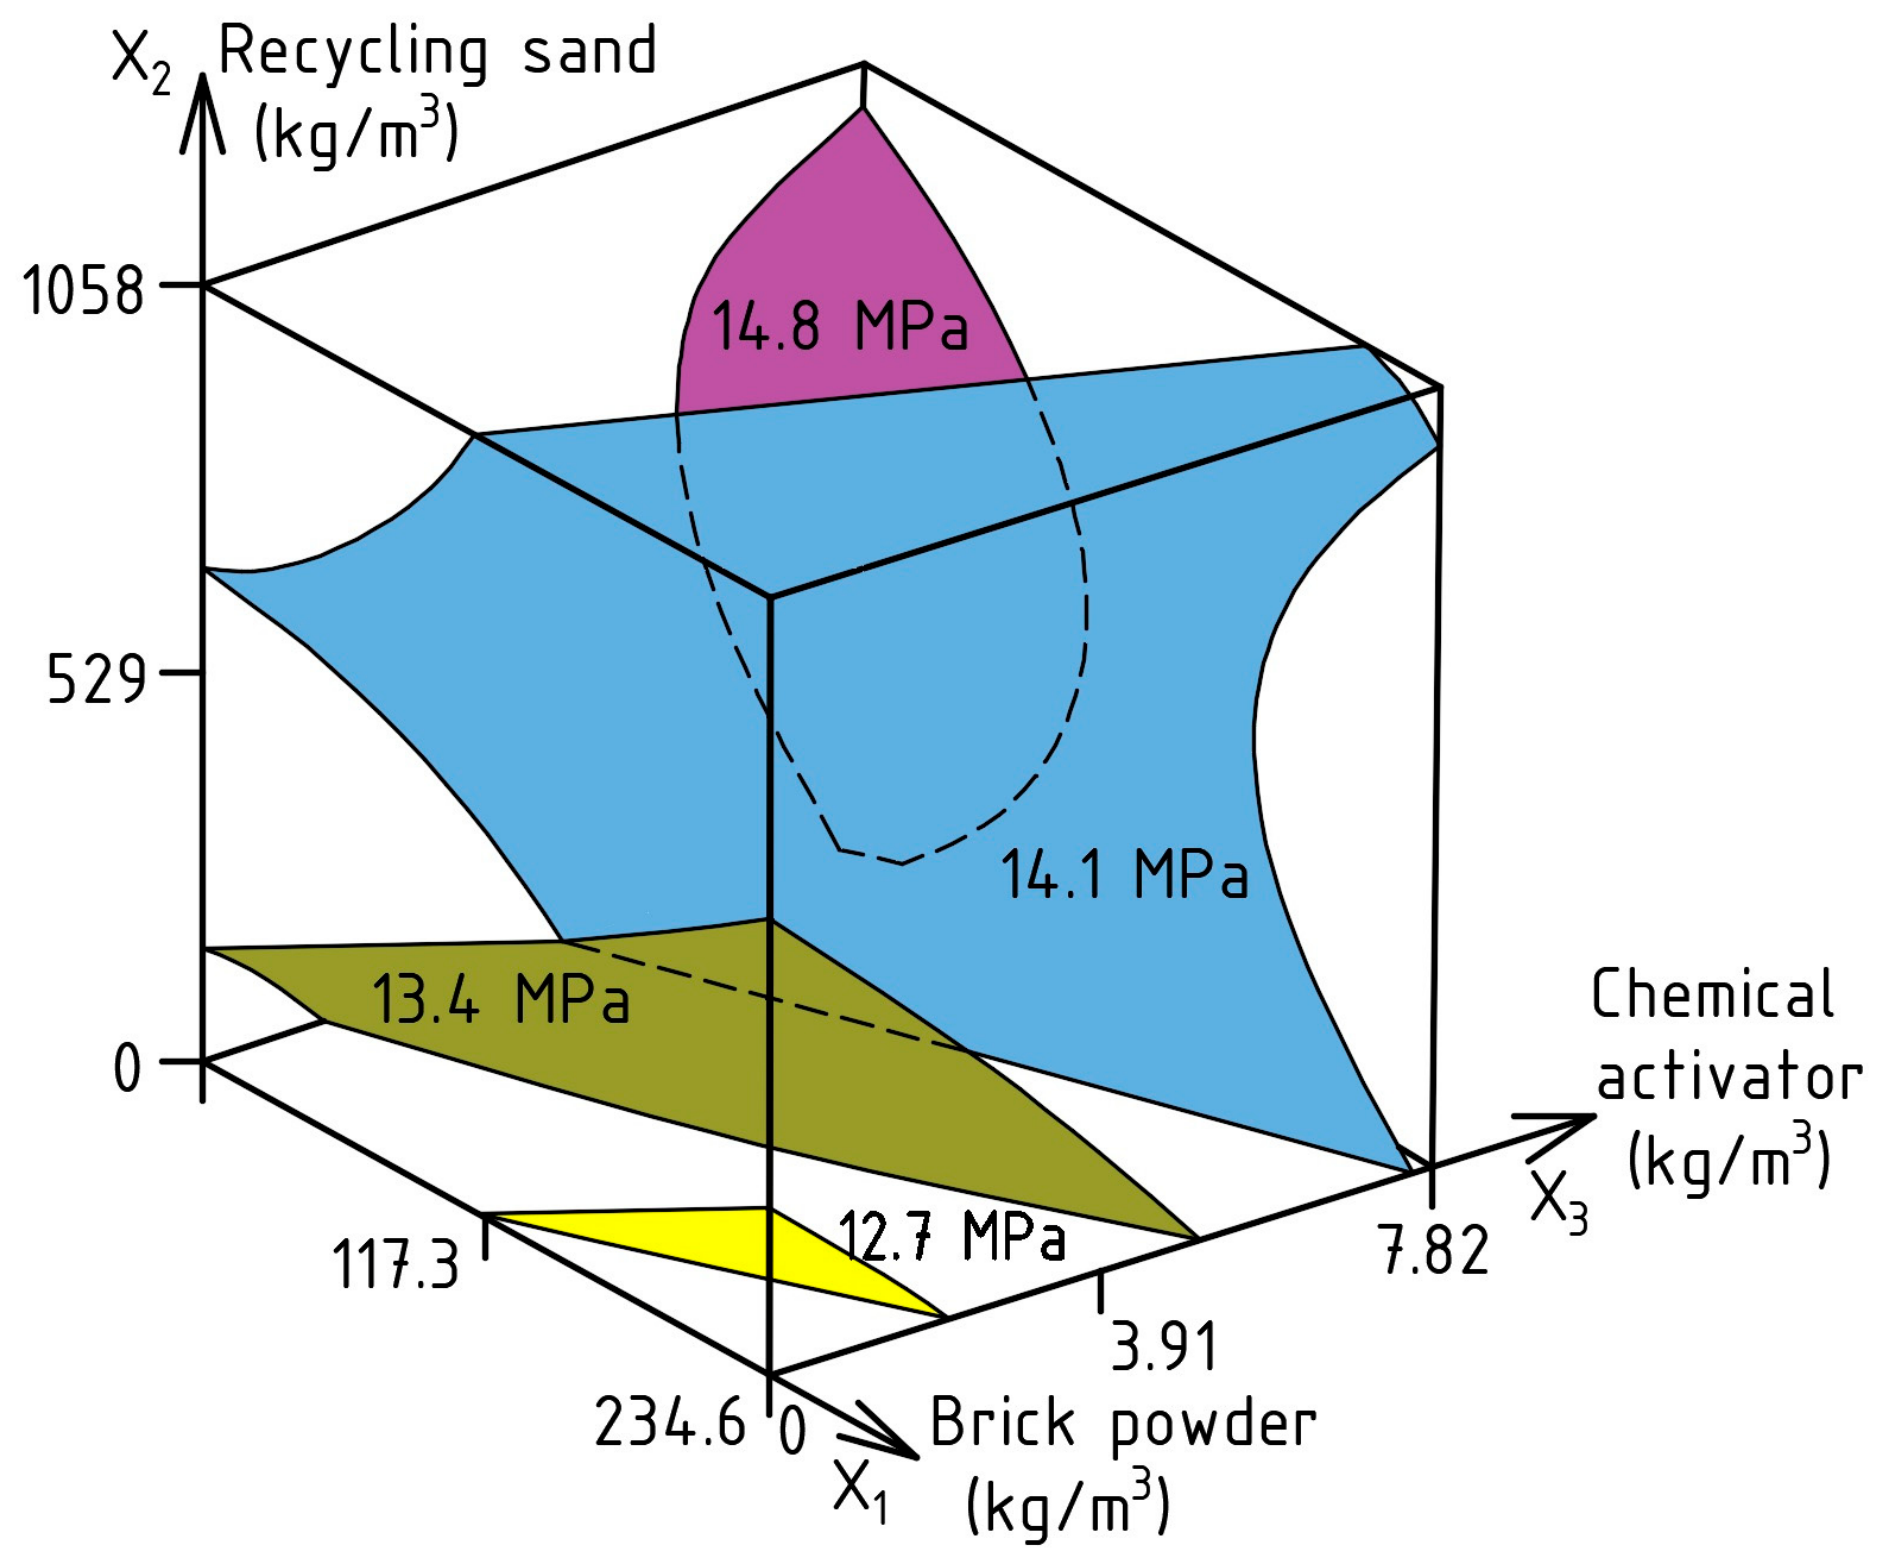
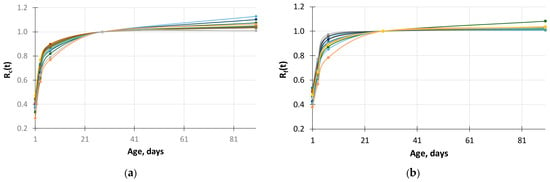
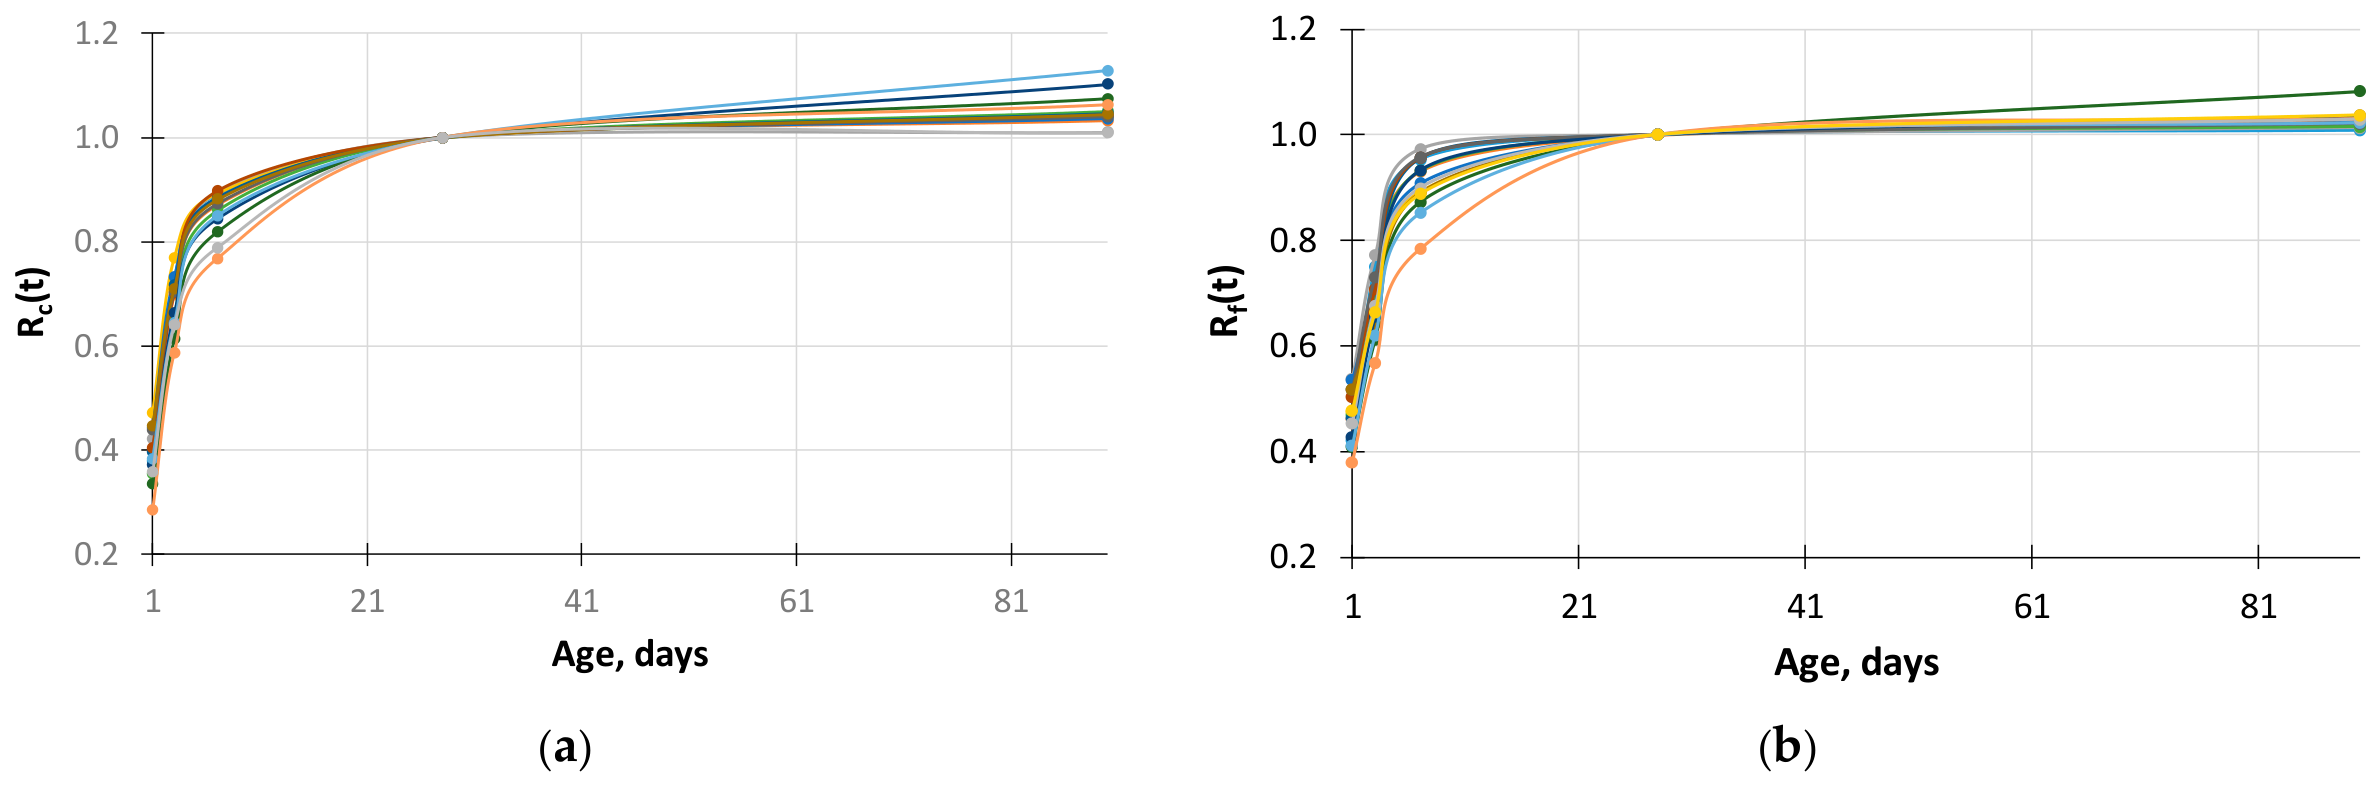
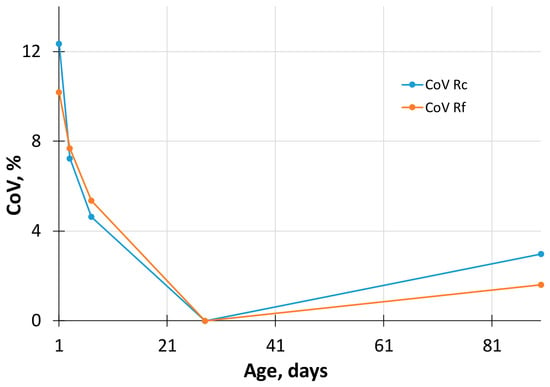
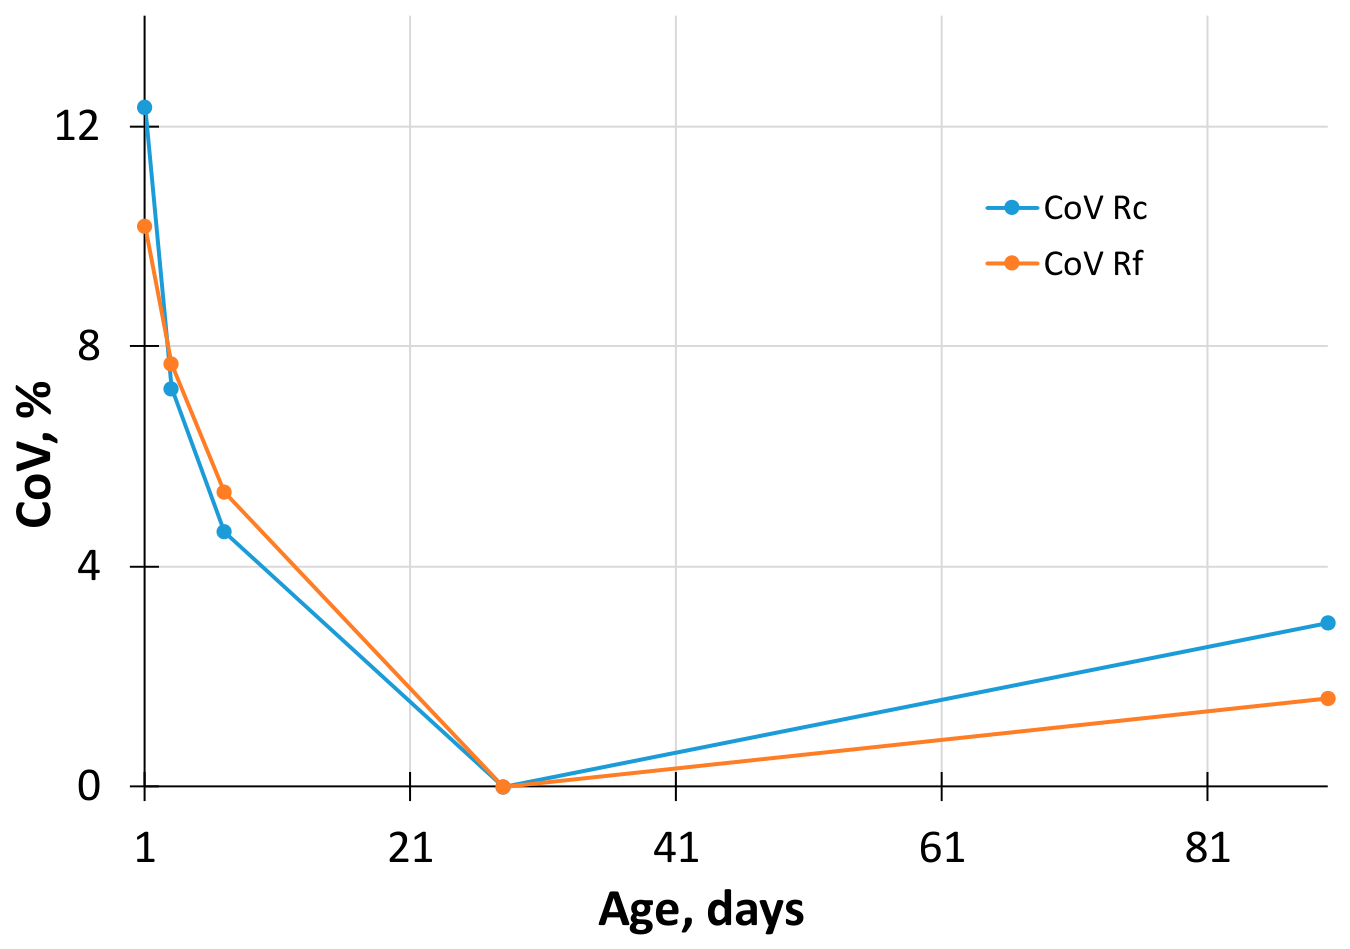
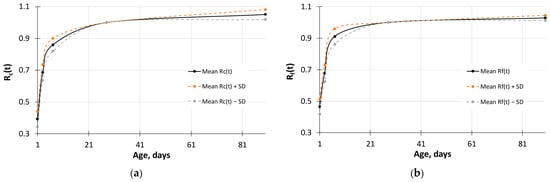
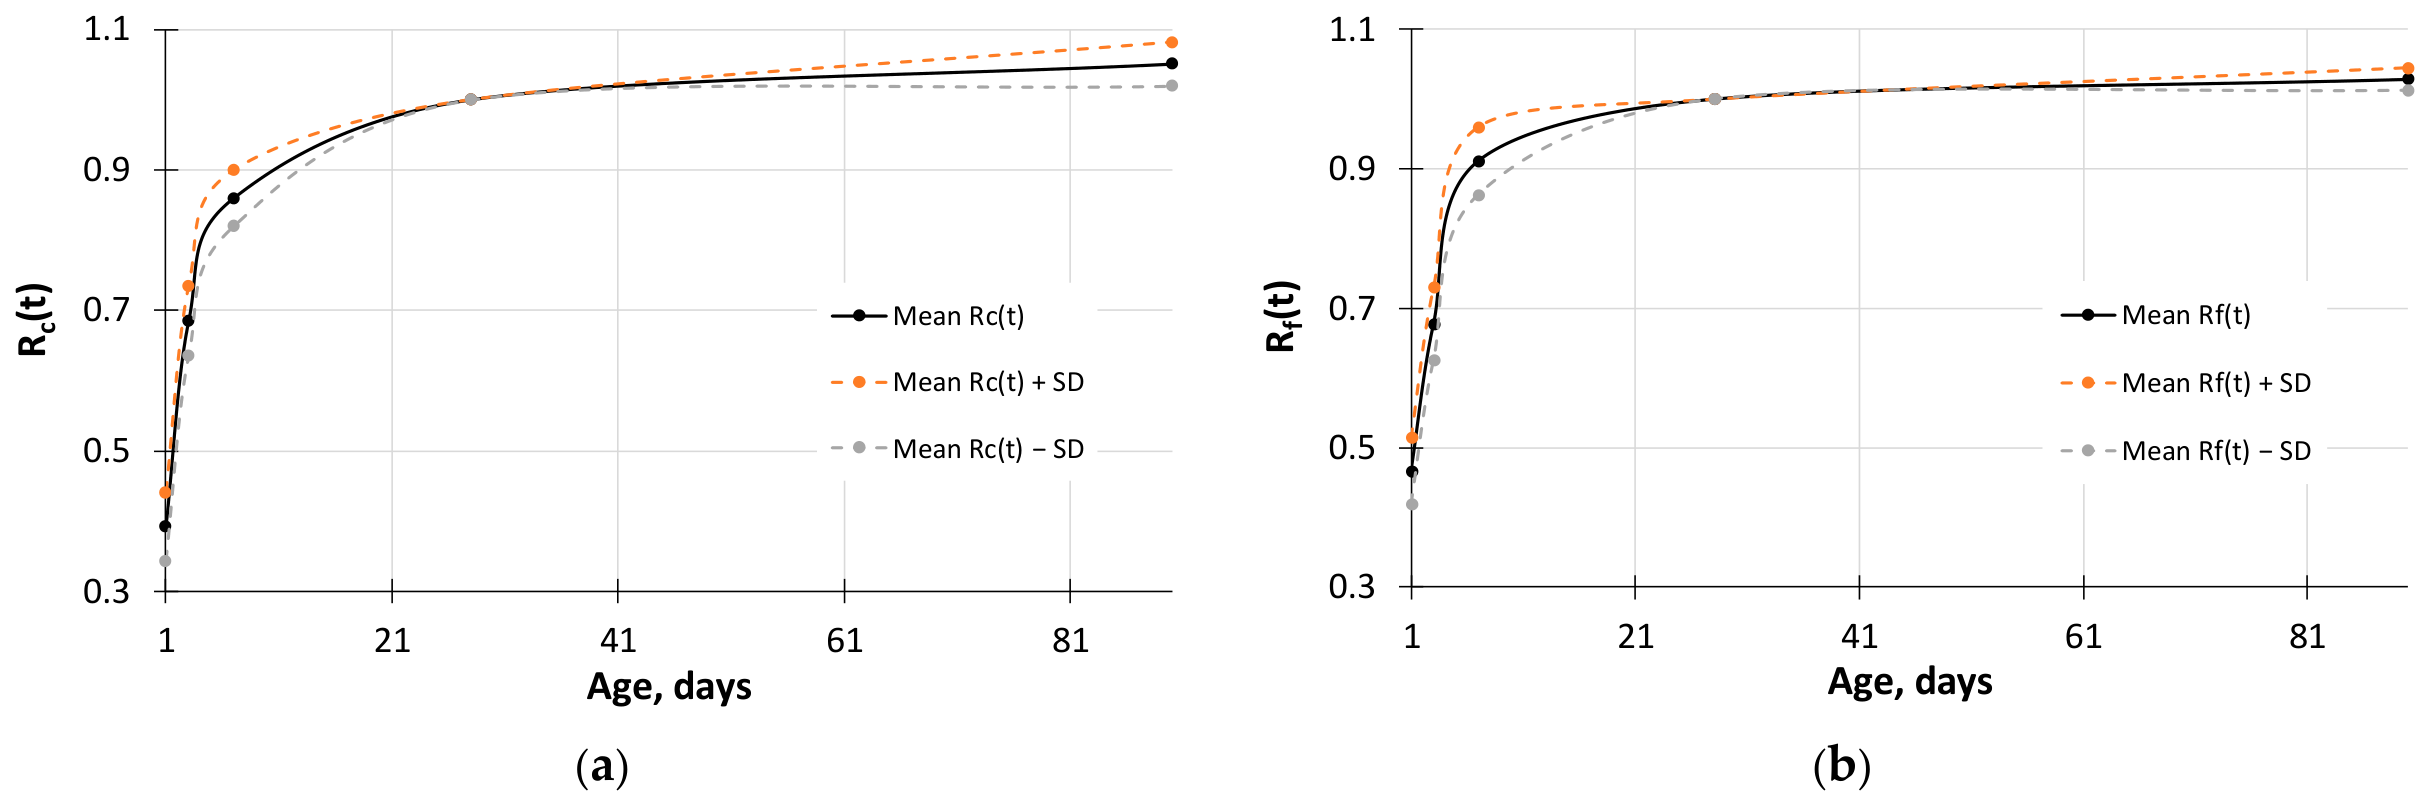
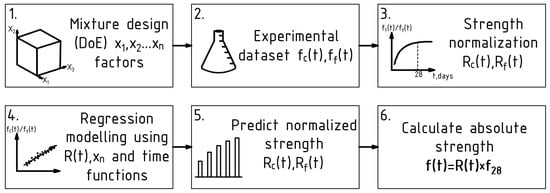
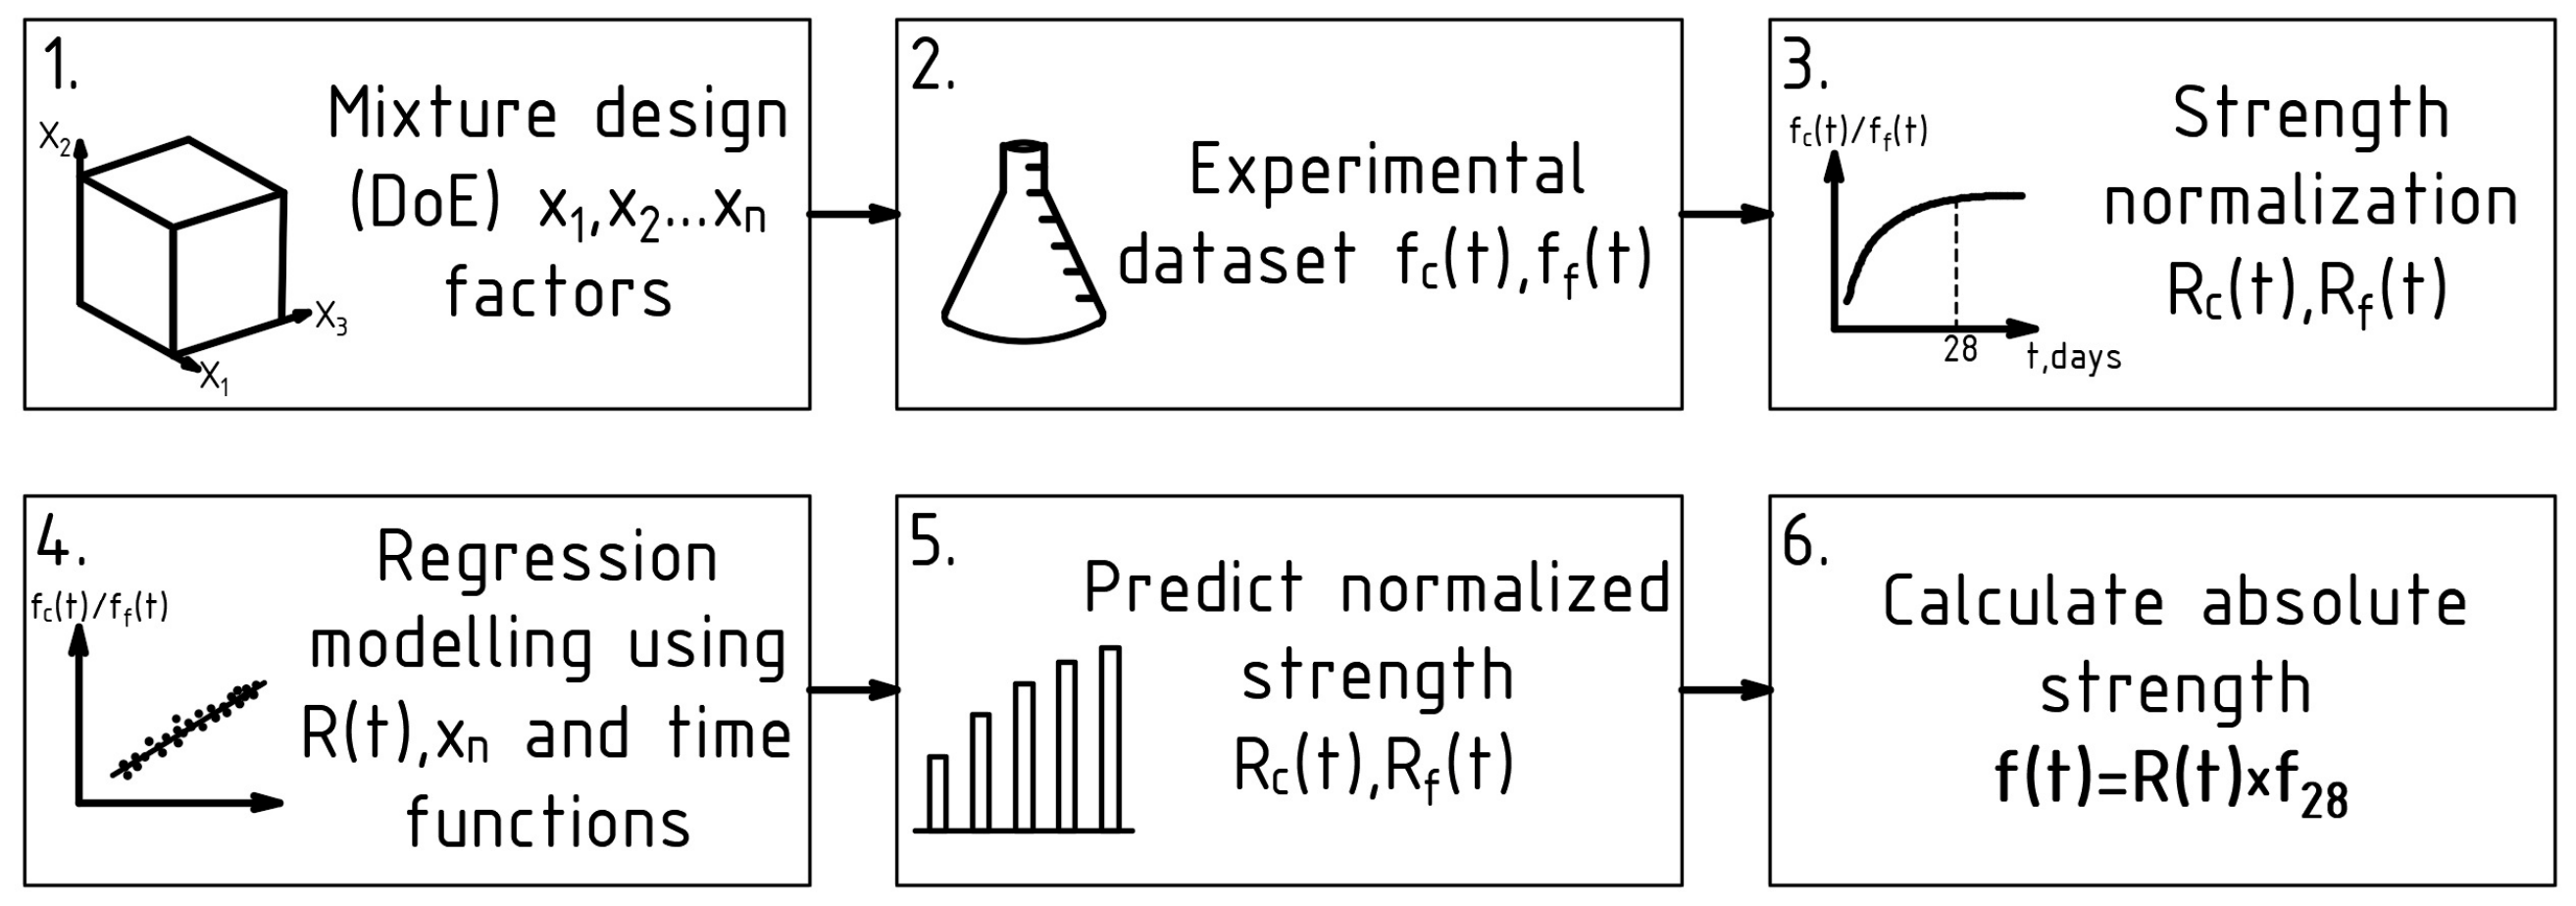
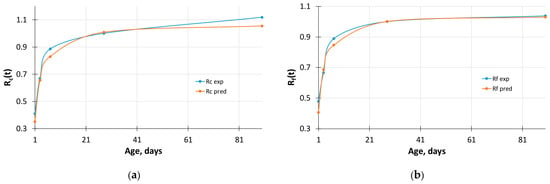
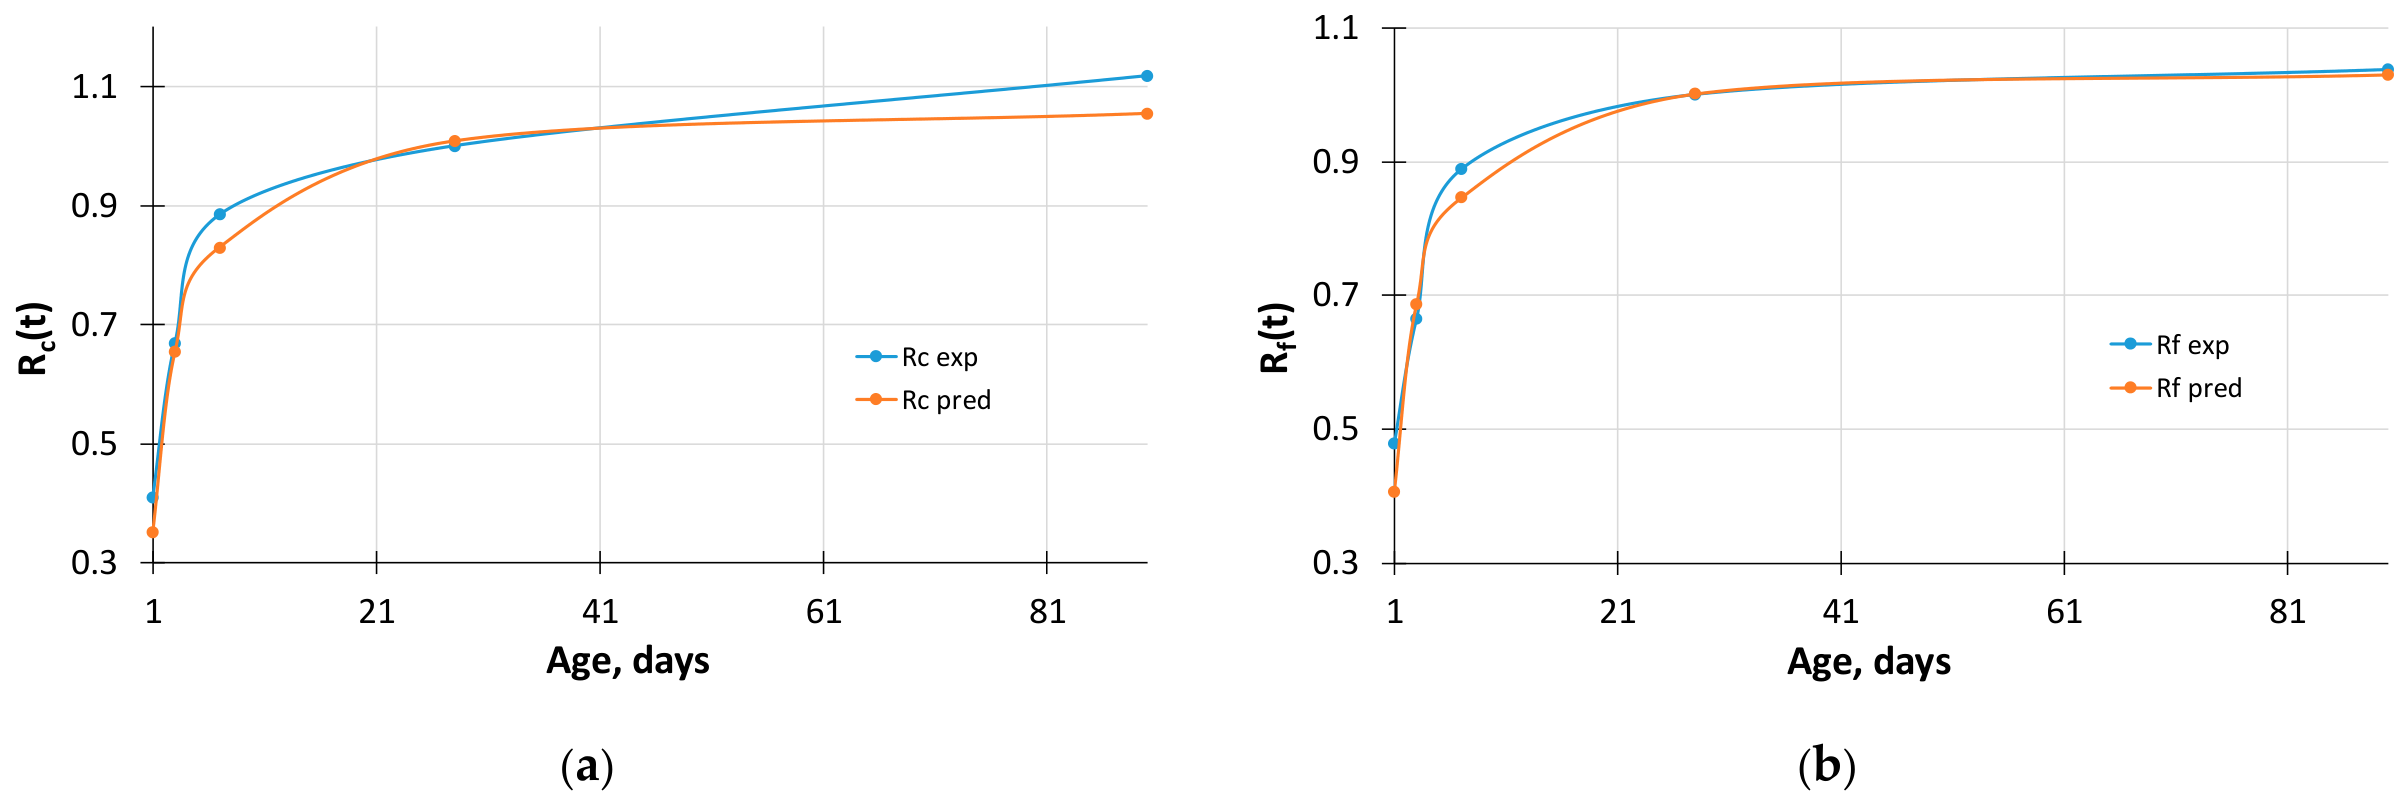
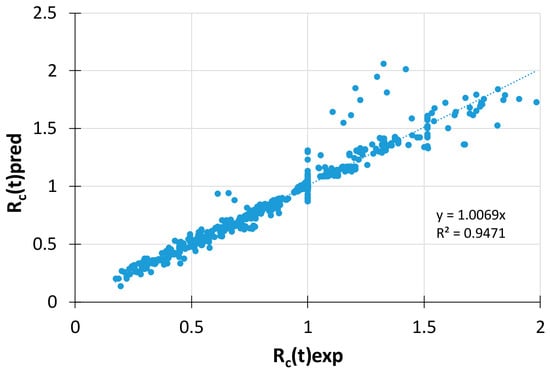
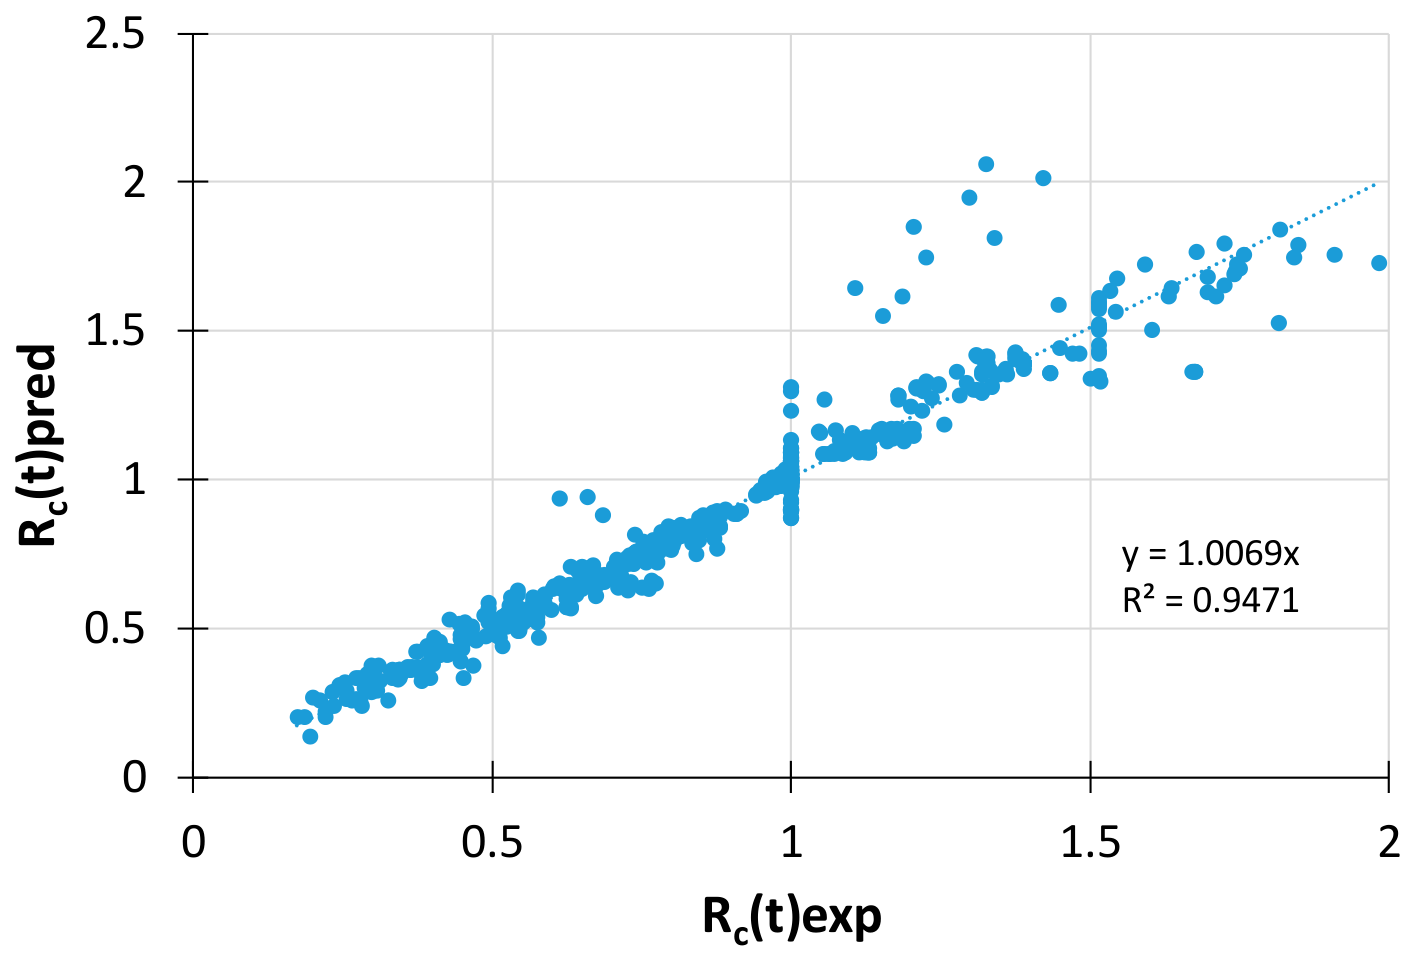
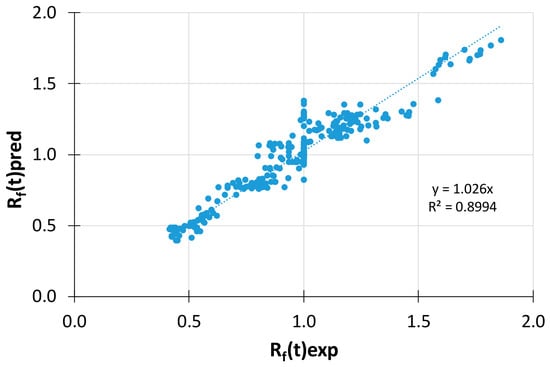
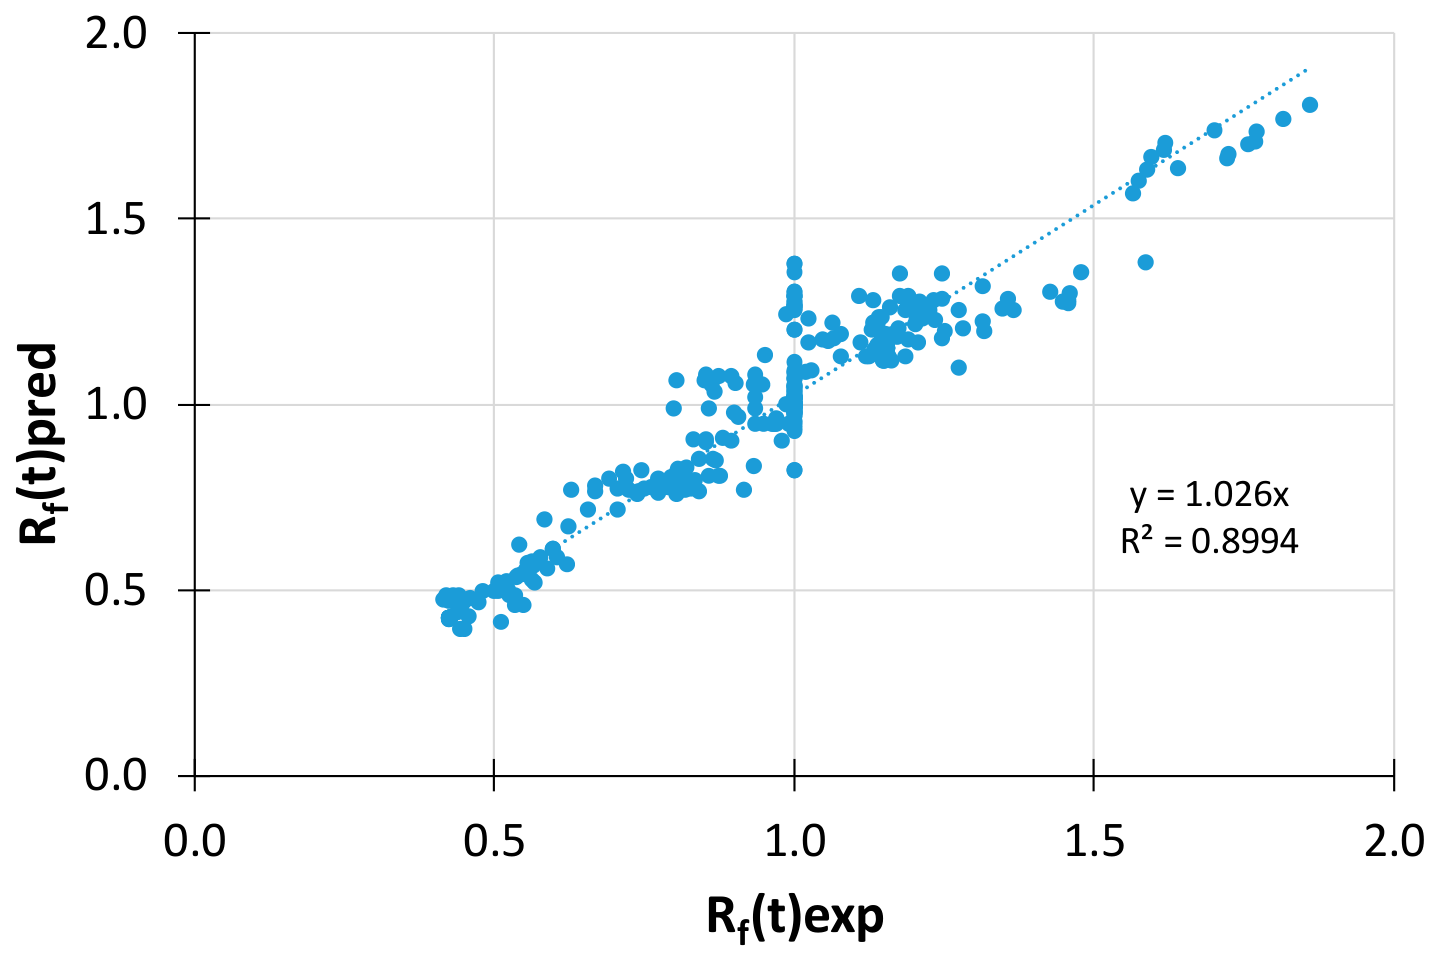

Disclaimer/Publisher’s Note: The statements, opinions and data contained in all publications are solely those of the individual author(s) and contributor(s) and not of MDPI and/or the editor(s). MDPI and/or the editor(s) disclaim responsibility for any injury to people or property resulting from any ideas, methods, instructions or products referred to in the content. |
© 2026 by the author. Licensee MDPI, Basel, Switzerland. This article is an open access article distributed under the terms and conditions of the Creative Commons Attribution (CC BY) license.