


Abstract
Wheel-region flow has a substantial influence on the aerodynamic drag of passenger cars; however, wheel-specific aerodynamic responses under varying inflow speeds, crosswind, and steady-state platooning conditions have not yet been sufficiently characterized. In this study, a previously validated numerical framework based on a 1:2.5-scale DrivAer fastback model was employed to perform three-dimensional, steady-state, incompressible Reynolds-averaged Navier–Stokes simulations using the realizable - turbulence model. The parametric analysis considered inflow speeds of 10–40 m/s, spoke-closure ratios of 0–100%, yaw angles of 0–20°, bilateral front-wheel air deflectors with full-scale heights of 10–60 mm, and steady two-vehicle platooning with an inter-vehicle spacing of . Variations in inflow speed and spoke closure had only limited effects on the total-vehicle drag coefficient, whereas the drag coefficients of individual wheels exhibited non-monotonic behavior. Under crosswind conditions, the lateral redistribution of underbody flow and shielding effects between the wheels produced pronounced left–right asymmetry in wheel drag. As the air-deflector height increased, the total-vehicle drag coefficient decreased monotonically from 0.2447 for the baseline configuration to 0.2213 for the 60 mm configuration, with the drag-reduction effect approaching saturation between 50 and 60 mm. The 60 mm air deflector reduced the total-vehicle and front-left-wheel drag coefficients by 9.6% and 70.8%, respectively, while increasing the rear-left-wheel drag coefficient by 34.2%. Under the combined condition of a 60 mm air deflector and a yaw angle of , the total-vehicle and front-left-wheel drag coefficients further decreased to 0.2186 and 0.002045, respectively, whereas the rear-left-wheel drag coefficient increased to 0.007489, demonstrating that the combined effect varied with wheel position. In steady-state platooning with a spacing of , the front-left- and rear-left-wheel drag coefficients of the following vehicle decreased by 66.0% and 31.6%, respectively, relative to the isolated-vehicle condition. Furthermore, installing the 60 mm air deflector on the leading vehicle produced additional reductions of 35.5% and 19.3% in the front-left- and rear-left-wheel drag coefficients of the following vehicle, respectively, compared with the platooning condition without the air deflector. These results demonstrate that direct control of wheel-arch inflow is more effective than spoke closure for reducing total-vehicle and front-wheel drag, and that the aerodynamic effects of the air deflector vary among individual wheels depending on its height, crosswind conditions, and inter-vehicle aerodynamic interactions.
1. Introduction
At high vehicle speeds, aerodynamic drag becomes the dominant component of road-load power demand; therefore, even a small reduction in drag can improve fuel economy and extend the driving range of electric vehicles. The total aerodynamic drag of a passenger car does not originate solely from the vehicle body. Rotating wheels, wheelhouses, underbody components, and their interactions induce strong flow separation, recirculation, and pressure losses. Consequently, wheel-region flow has traditionally been regarded as an important but challenging design issue in road-vehicle aerodynamics [1,2,3].
Rotating wheels and wheelhouses are not merely localized flow regions but key aerodynamic components that directly affect underbody flow rate, pressure distribution, wake structure, and the overall drag and lift of a vehicle. In recent years, experimental and computational fluid dynamics (CFD) studies have investigated how wheel rotation alters the underbody mass flow rate, vortex topology, and surface-pressure distribution, thereby influencing the overall vehicle flow field. Wang et al. experimentally demonstrated that interactions between the wheels and vehicle body modify the vehicle wake and aerodynamic performance [4]. Based on numerical simulations and wind-tunnel tests, Wäschle showed that the effects of wheel rotation propagate not only around the front wheels but also to the rear wheels and downstream vehicle flow [5]. Regert and Lajos analyzed recirculating flow and vortex structures inside wheelhouses and explained that wheelhouse geometry and opening conditions govern the surrounding wheel flow [6]. Nabutola and Boetcher emphasized that the appropriate selection of a turbulence model and validation against experimental data are essential for accurately predicting such complex flows [7]. Therefore, aerodynamic analyses of wheel regions should comprehensively consider wheel rotation, internal wheelhouse flow, wheel–body interactions, and numerical-model validation.
The aerodynamic performance of passenger-car wheels is influenced by a combination of factors, including the closed area of the rim, the size and arrangement of spoke openings, spoke geometry, and ventilation drag generated by wheel rotation. Brandt et al. reported that the closed area is one of the most influential rim-design parameters affecting drag because it alters the flow through the rim, wheelhouse pressure, and wake vortices [8]. Vdovin et al. showed that pressure and shear forces acting on the rim and tire generate ventilation torque and that relatively simple modifications to rim geometry can reduce aerodynamic energy losses [9]. Landström et al. independently varied the shielding areas of the front and rear rims and compared their drag characteristics. They found that a high shielding ratio was effective for drag reduction at the rear wheels, whereas limited shielding of the outer radial region could be more advantageous at the front wheels [10]. Bolzon et al. experimentally investigated the effects of wheel rotation, rim-shielding area, fan-shaped spokes, and spoke-edge geometry on wheel-region flow and vehicle drag [11]. Gleason et al. compared full-width moving-belt wind-tunnel measurements with CFD results and demonstrated that accurately reproducing rotating-wheel and moving-ground conditions is essential for reliable prediction of wheel-region flow and vehicle aerodynamics [12]. Therefore, increasing the spoke-closure ratio does not necessarily produce a monotonic reduction in drag, and wheel designs should be evaluated under full-vehicle conditions that include rotating wheels and wheelhouses.
In actual driving, vehicles are also exposed to inflow conditions with nonzero yaw angles. Crosswinds change the effective angle of incidence, generate windward–leeward pressure asymmetry, and can significantly alter the flow entering each wheelhouse. Guilmineau et al. applied detached-eddy simulation to the flow around a simplified vehicle under crosswind yaw angles of 0–30° and compared the results with experimental data, analyzing the asymmetric wake and changes in aerodynamic coefficients with increasing yaw angle [13]. Through Ahmed-body experiments, Meile et al. observed asymmetric bistable wakes depending on rear-body geometry and yaw angle, with particularly abrupt changes in aerodynamic forces and moments over yaw angles of approximately 10–15° for the 35° slant model [14]. During the development of a new electric hatchback, Iinuma et al. evaluated not only the zero-yaw condition but also a small yaw angle of 4° representative of real-world driving and optimized rear-side spoilers to control the asymmetric wake and rear low-pressure region [15]. Therefore, reducing crosswind sensitivity requires a design approach that simultaneously considers yaw-dependent wake asymmetry, surface-pressure distributions, and aerodynamic coefficients.
Deflectors or spoilers installed ahead of the front wheels are effective passive flow-control devices that restrict direct underbody-flow entry into the front-wheel and wheelhouse regions and alter the stagnation location and pressure distributions across the wheels, thereby reducing vehicle drag. Sebben reported that total drag could be reduced by approximately 4%, depending on the geometry and installation position of the deflector; however, because the deflector itself also generates drag, geometric optimization is necessary [16]. Using the DrivAer model, Nabutola and Boetcher compared conventional air deflectors with air-jet deflectors and showed that a reduction in front-wheel drag does not necessarily lead to a reduction in total-vehicle drag [17].
Previous platooning studies have primarily focused on changes in total-vehicle drag associated with the number of vehicles, inter-vehicle spacing, body geometry, and vehicle arrangement. The present study extends beyond these macroscopic aerodynamic characteristics by focusing on changes in individual wheel-region drag and the influence of a front-wheel air deflector on the leading vehicle on the wheel flow of the following vehicle. Zabat et al. demonstrated through wind-tunnel testing that the average drag of a vehicle platoon decreases as the number of vehicles increases and the inter-vehicle spacing decreases [18]. Ebrahim et al. reported that the wake of a leading vehicle reduces the incoming momentum and power consumption of the following vehicle in an electric-vehicle platoon [19]. Ebrahim and Dominy showed that the drag-reduction effects on leading and following DrivAer vehicles depend on rear-body geometry and vehicle arrangement [20]. Kim et al. identified vehicle type and inter-vehicle spacing as major factors governing the pressure distribution and wake interactions between vehicles [21]. Meanwhile, Zhang et al. analyzed substantial variations in drag, side force, and yawing moment with relative vehicle position during an overtaking maneuver involving the same DrivAer platoon [22]. However, the wheel-resolved aerodynamic response arising from the interaction between local front-wheel flow control and inter-vehicle aerodynamic interference remains insufficiently understood, particularly whether a front-wheel air deflector on the leading vehicle alters the drag of individual wheels on the following vehicle.
The present study addresses this gap within a unified wheel-resolved numerical framework. The specific objectives are to: (i) quantify the sensitivity of wheel-region flow to inflow speed and spoke closure, (ii) characterize asymmetric wheel-drag responses under crosswind conditions, (iii) evaluate the height dependence and operating mechanism of front-wheel air deflectors, and (iv) determine whether the wheel-level aerodynamic benefits of the air deflector are retained during steady-state two-vehicle platooning. The main contributions are to quantify the position-dependent responses of the front and rear wheels and to demonstrate the downstream influence of a leading-vehicle front-wheel air deflector on the wheel-level drag of the following vehicle.
2. Numerical Methods
2.1. Vehicle Model and Computational Domain
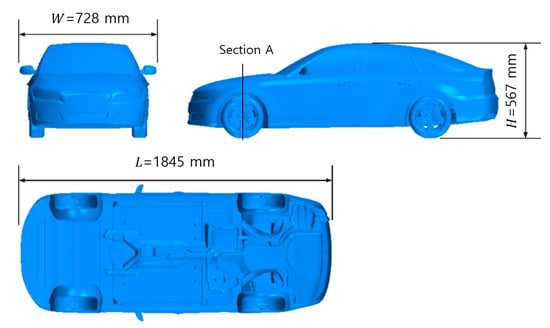
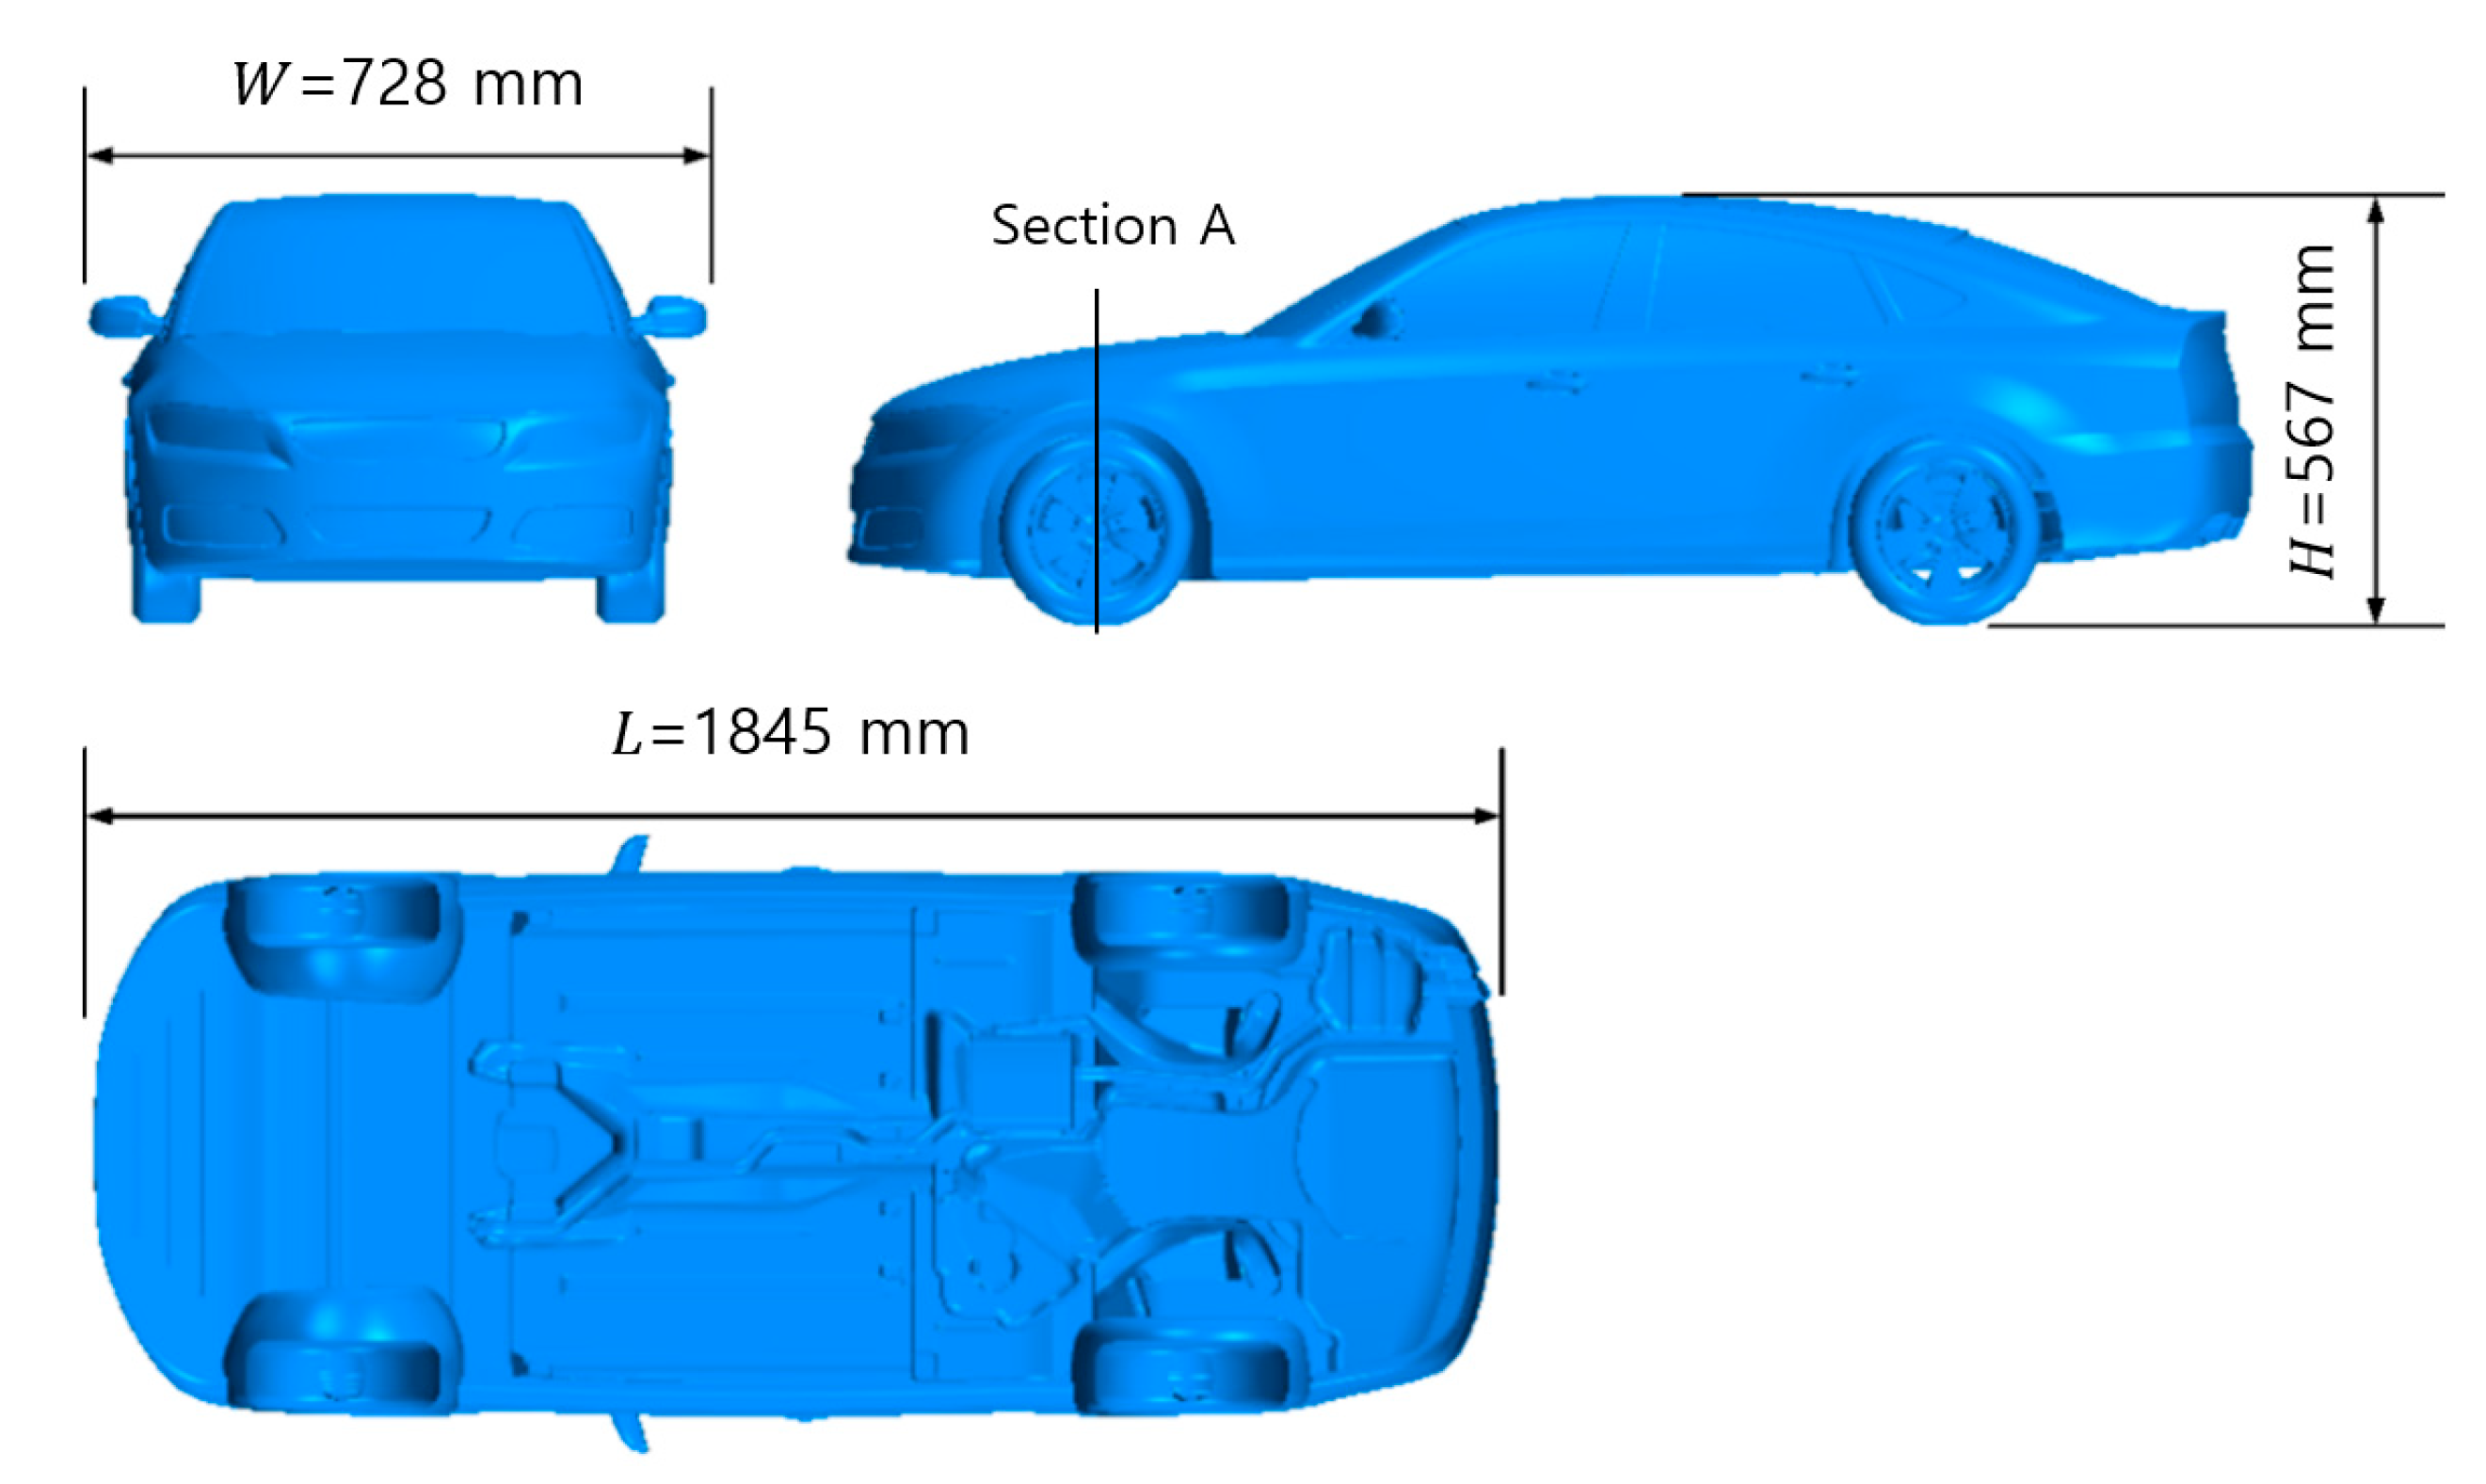
The baseline vehicle geometry, computational domain, mesh configuration, and numerical framework used in the present study were based on the model developed and validated for the aerodynamic analysis of vehicle overtaking in the authors’ previous study [22]. The present study employed the same validated model while extending the scope of the analysis to varying inflow speeds, spoke-closure ratios, crosswind conditions, front-wheel air-deflector heights, and wheel-resolved drag characteristics. The fastback configuration of the open-source DrivAer model was selected because it includes realistic body surfaces, side mirrors, rotating wheels, wheelhouses, and a detailed underbody [23]. The geometry was scaled to 1:2.5, resulting in a model length of m, width of m, and height of m. To focus on external aerodynamics, the grille was closed, and cooling flow was not considered. The vehicle model and computational domain are presented in Figure 1.
Figure 1.
Dimensions and detailed underbody of the 1:2.5-scale DrivAer fastback model and location of Section A for the wheel-region cross-sectional analysis.
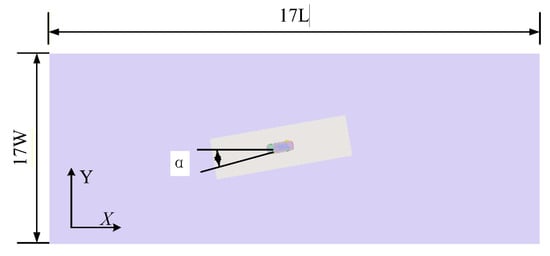
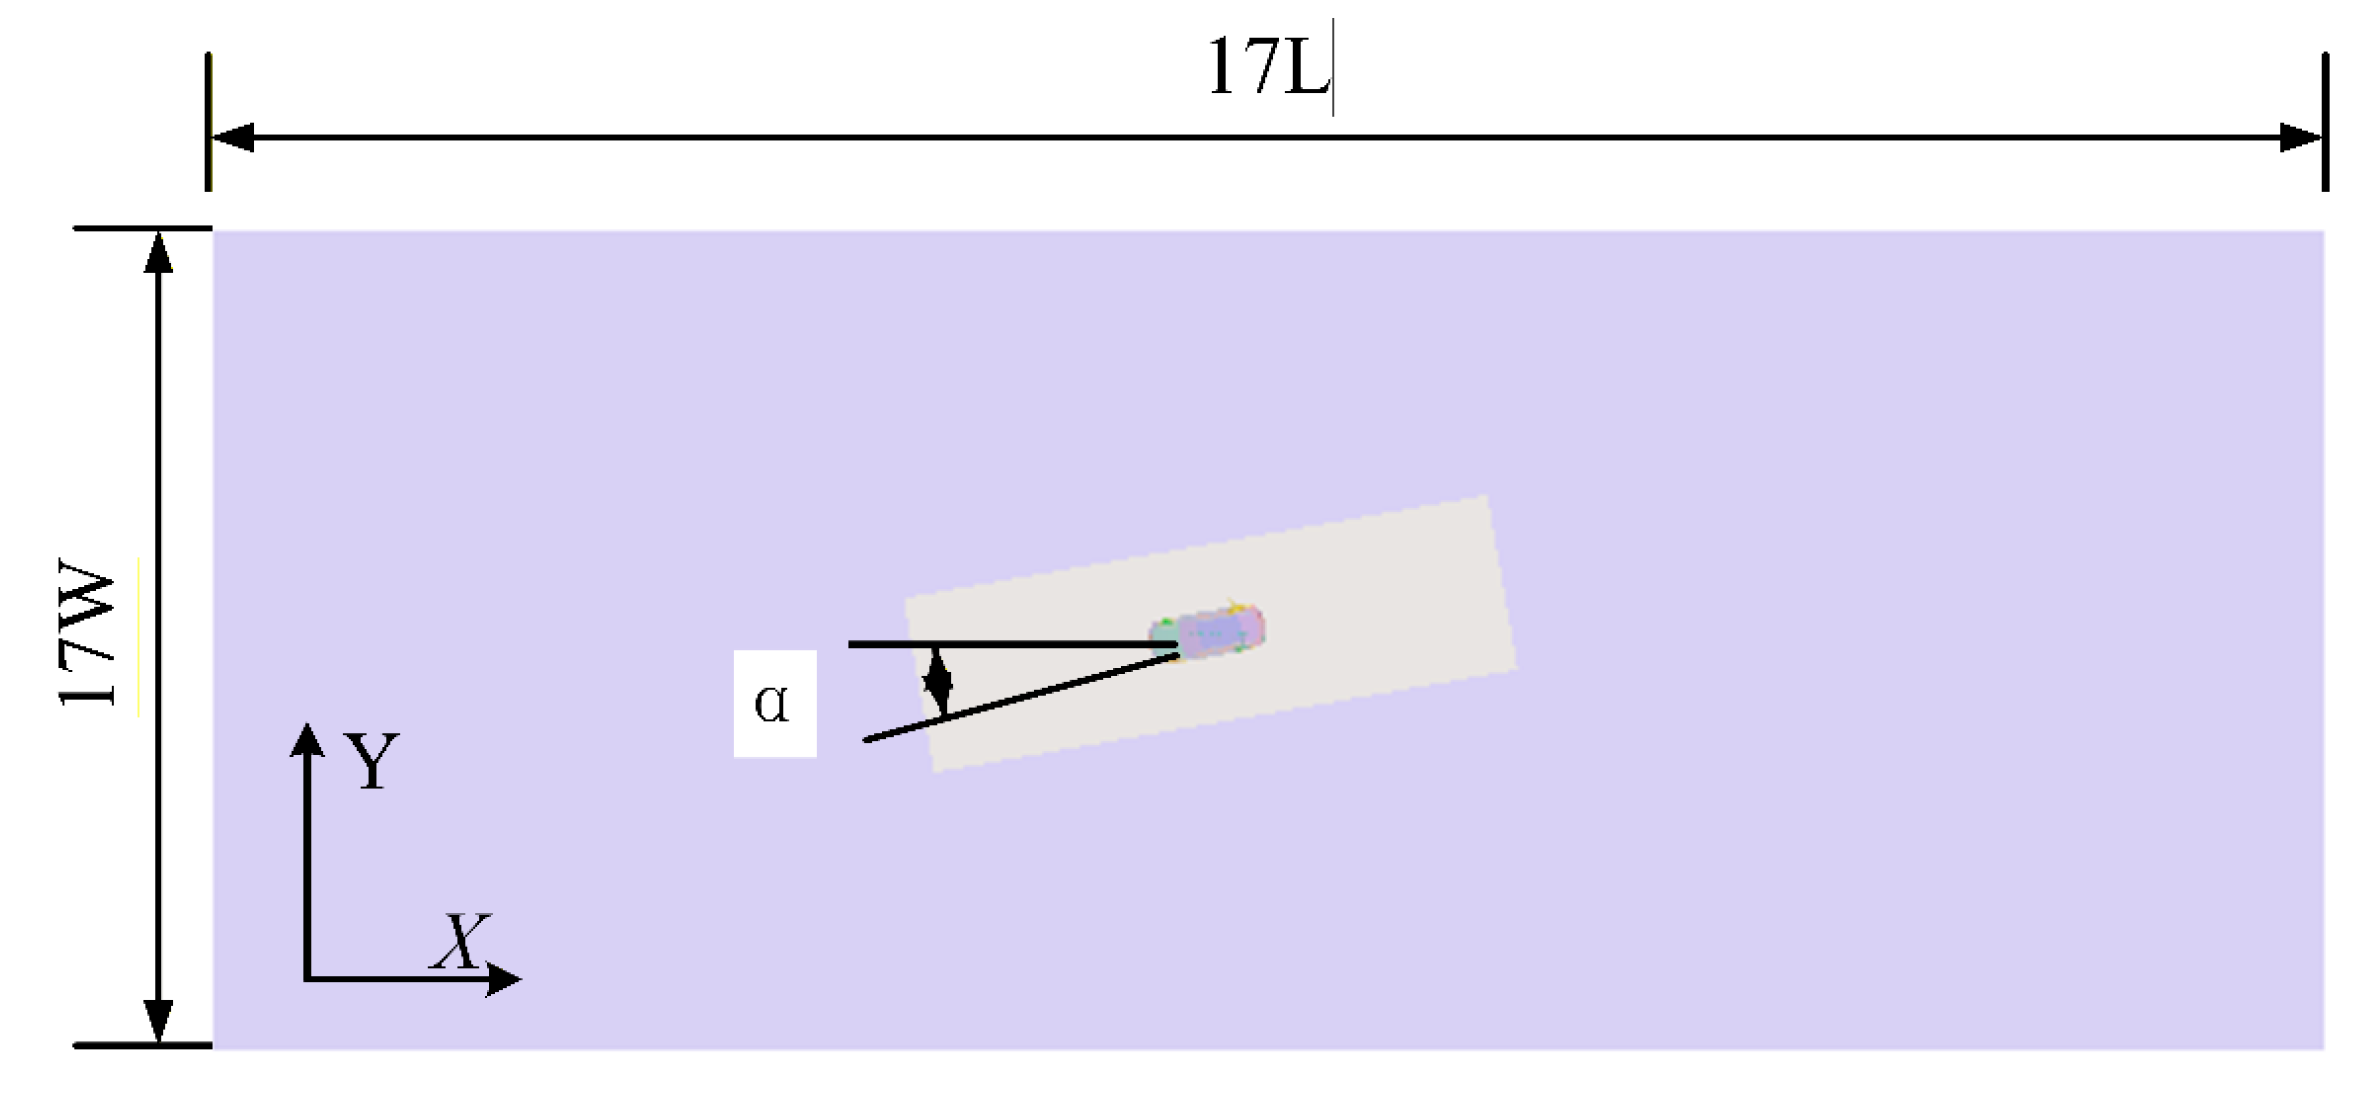
Figure 2 illustrates the CFD computational domain for an arbitrary yaw angle, . Under the zero-yaw condition , the rectangular external-flow domain extended upstream from the front of the vehicle and downstream from the rear of the vehicle. The overall domain dimensions were approximately in length, in width, and in height, resulting in a blockage ratio of less than 1%. As shown in Figure 2, for the crosswind simulations, the vehicle and moving belt were rotated relative to the fixed inlet-flow direction. Rotating the vehicle relative to the fixed inlet is kinematically equivalent to prescribing a yawed freestream while retaining a uniform inlet condition. At the maximum yaw angle of , the projected vehicle width remains sufficiently separated from the lateral boundaries, with a lateral clearance of approximately , or , on each side. The same computational domain configuration was employed for the two-vehicle platooning simulations, with the longitudinal bumper-to-bumper spacing set to .
Figure 2.
Schematic of computational domain dimensions.
2.2. Governing Equations and Boundary Conditions
The external flow was assumed to be three-dimensional, steady, isothermal, and incompressible. Because the primary objective was to compare mean aerodynamic forces over a relatively large number of parametric cases rather than to resolve transient flow structures, a steady-RANS approach was adopted. The realizable - turbulence model was employed to close the Reynolds-averaged Navier–Stokes equations. The continuity and momentum equations are presented in Equations (1) and (2), respectively. The turbulence model was selected because of its robustness in separated automotive flows and its lower computational cost compared with scale-resolving methods [24]. The SIMPLE algorithm was used for pressure–velocity coupling, and a second-order upwind scheme was applied to the convective terms to improve spatial accuracy while maintaining numerical stability. The computational geometry was cleaned and surface-preprocessed using ANSA (Version 23.1.0) [25]. Surface preprocessing included preparation of the vehicle body, wheels, wheelhouses, underbody, and air-deflector surfaces for volume meshing. The trimmed-hexahedral volume mesh was subsequently generated in Simcenter STAR-CCM+ (Version 2021.1) [26], which was also used for the numerical simulations.
Here, denotes the time-averaged velocity component, is the turbulent velocity fluctuation, is the time-averaged pressure, is the air density, is the dynamic viscosity, represents the Reynolds stress, and denotes the body force per unit mass.
The drag coefficient and pressure coefficient were calculated using Equations (3) and (4), respectively.
Here, is the air density, is the inflow speed as the reference velocity, is the frontal projected area, is the local static pressure, and is the reference pressure. denotes the aerodynamic force component in the vehicle longitudinal direction. For each wheel, the longitudinal drag force was obtained by integrating the pressure and viscous contributions over the combined tire and rim surfaces. The pressure contribution was determined from the surface pressure acting normal to the wheel surface, whereas the viscous contribution was obtained from the wall shear stress acting tangentially to the surface. The sum of these contributions in the vehicle longitudinal direction was used as the wheel drag force. The same reference velocity and total-vehicle frontal projected area were used to calculate the drag coefficients of both the entire vehicle and the individual wheels. Thus, the wheel-resolved drag coefficients represent the contribution of each wheel to the aerodynamic force normalized by the same reference quantities used for the total vehicle. The total-vehicle drag included the aerodynamic forces acting on the vehicle body, all four wheels, and any installed air deflectors.
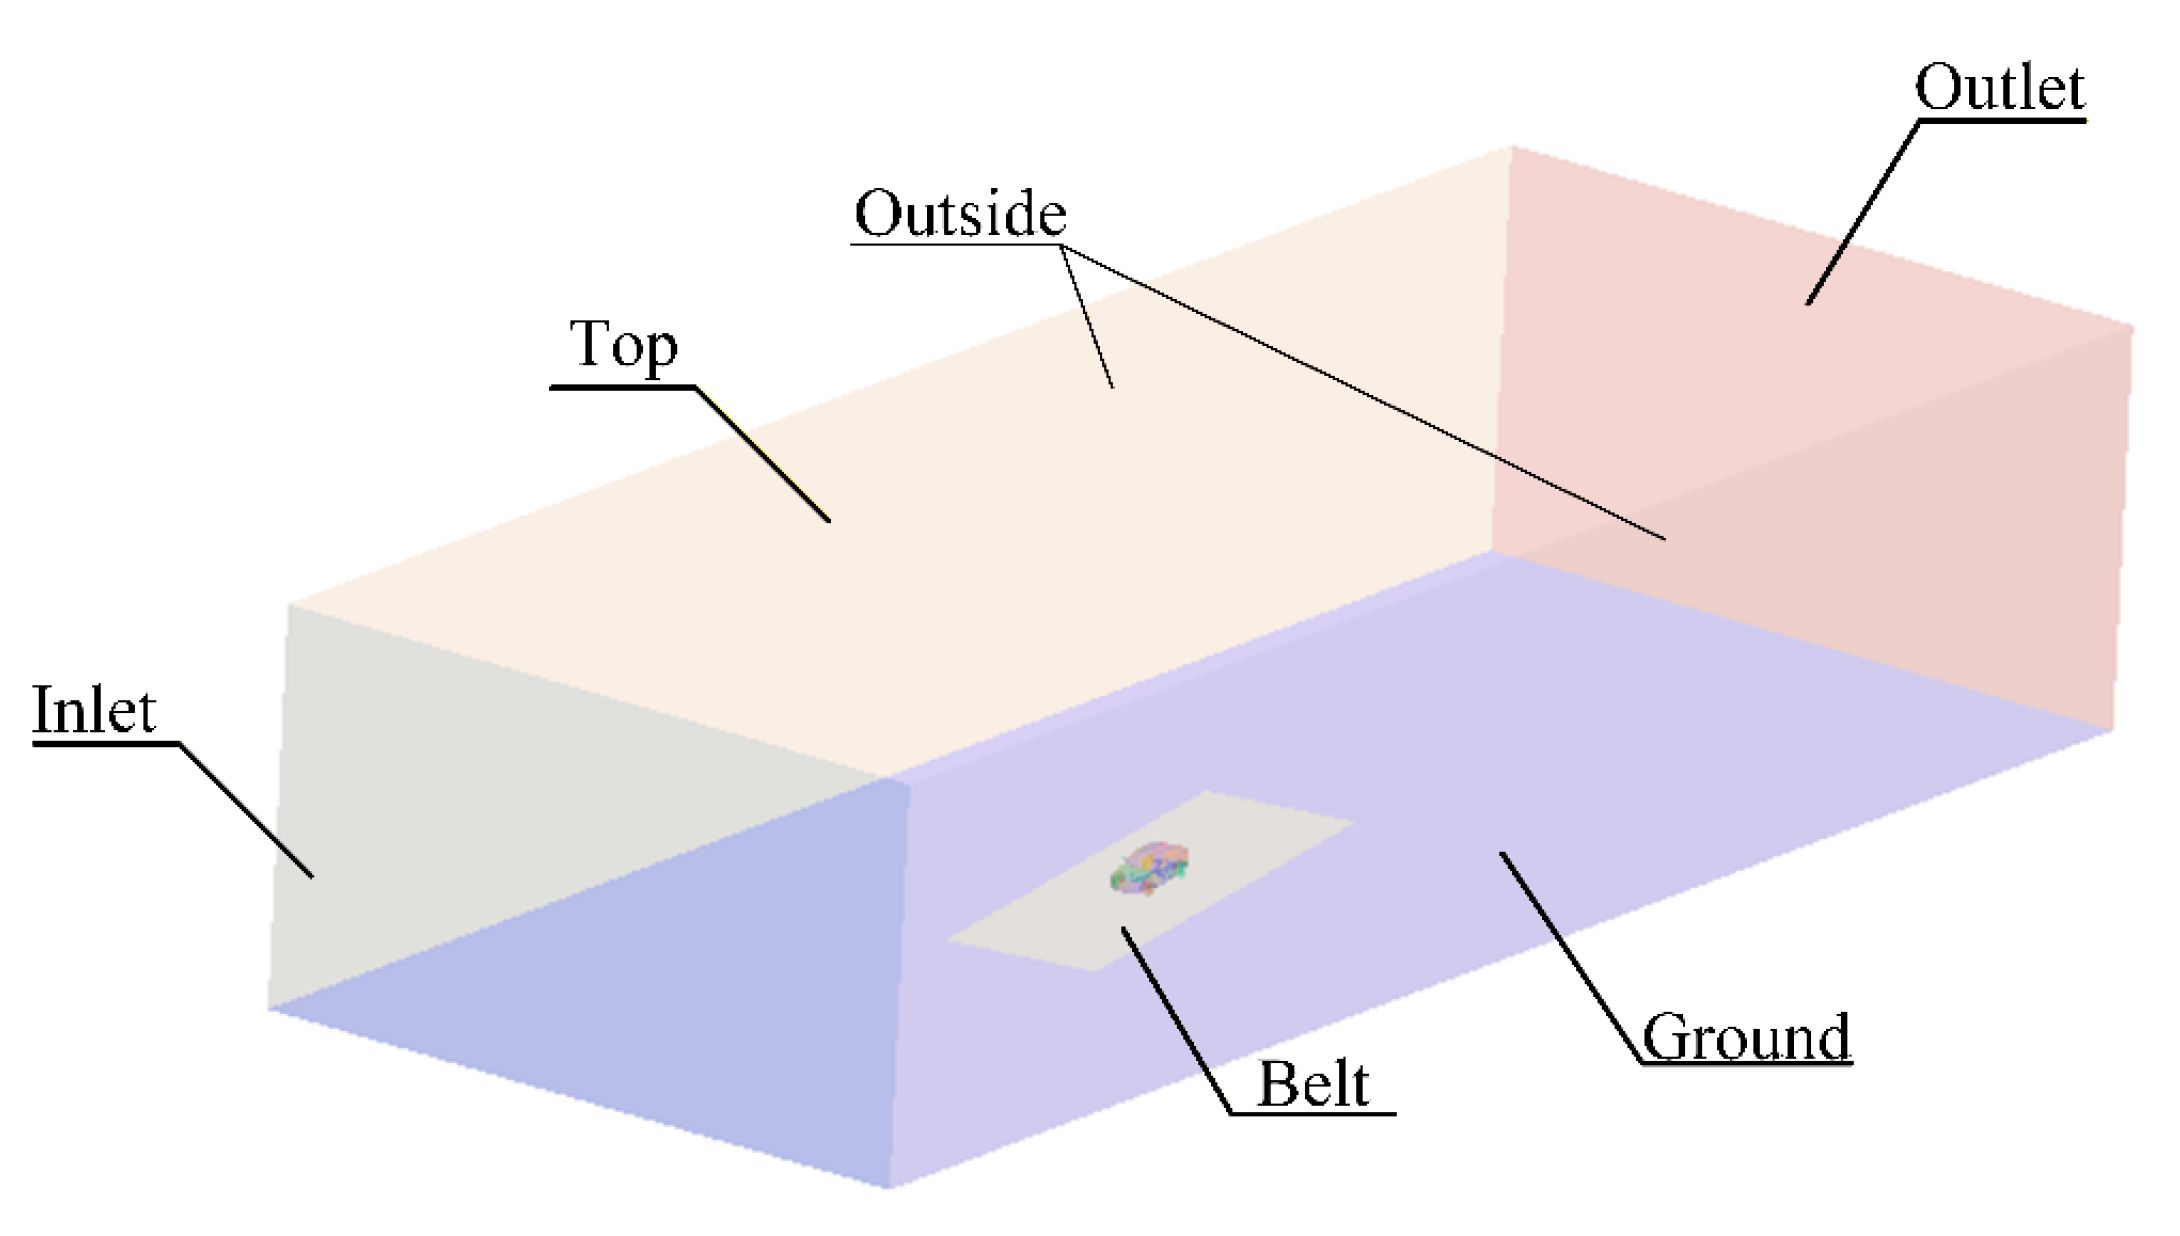
To confirm numerical convergence, the residuals were required to decrease below , and the simulations were terminated after the monitored aerodynamic coefficients had reached stable values. The principal boundary conditions and fluid properties are summarized in Table 1. The boundary conditions employed in the present study are illustrated in Figure 3.
Table 1.
Principal numerical settings and boundary conditions.
Figure 3.
Boundary conditions.
Because a 1:2.5-scale vehicle model was employed, exact Reynolds number similarity with the corresponding full-scale vehicle was not maintained at the same inflow velocity. Based on the model length of 1.845 m and the air properties used in the simulations, the Reynolds number ranged from approximately at 10 m/s to at 40 m/s. The corresponding full-scale Reynolds number range at the same velocities would be approximately –. Therefore, although all cases were evaluated consistently using the same scaled geometry and numerical methodology, the effects of Reynolds number scaling should be considered when extrapolating the present quantitative results to a full-scale vehicle.
2.3. Grid Independence and Validation
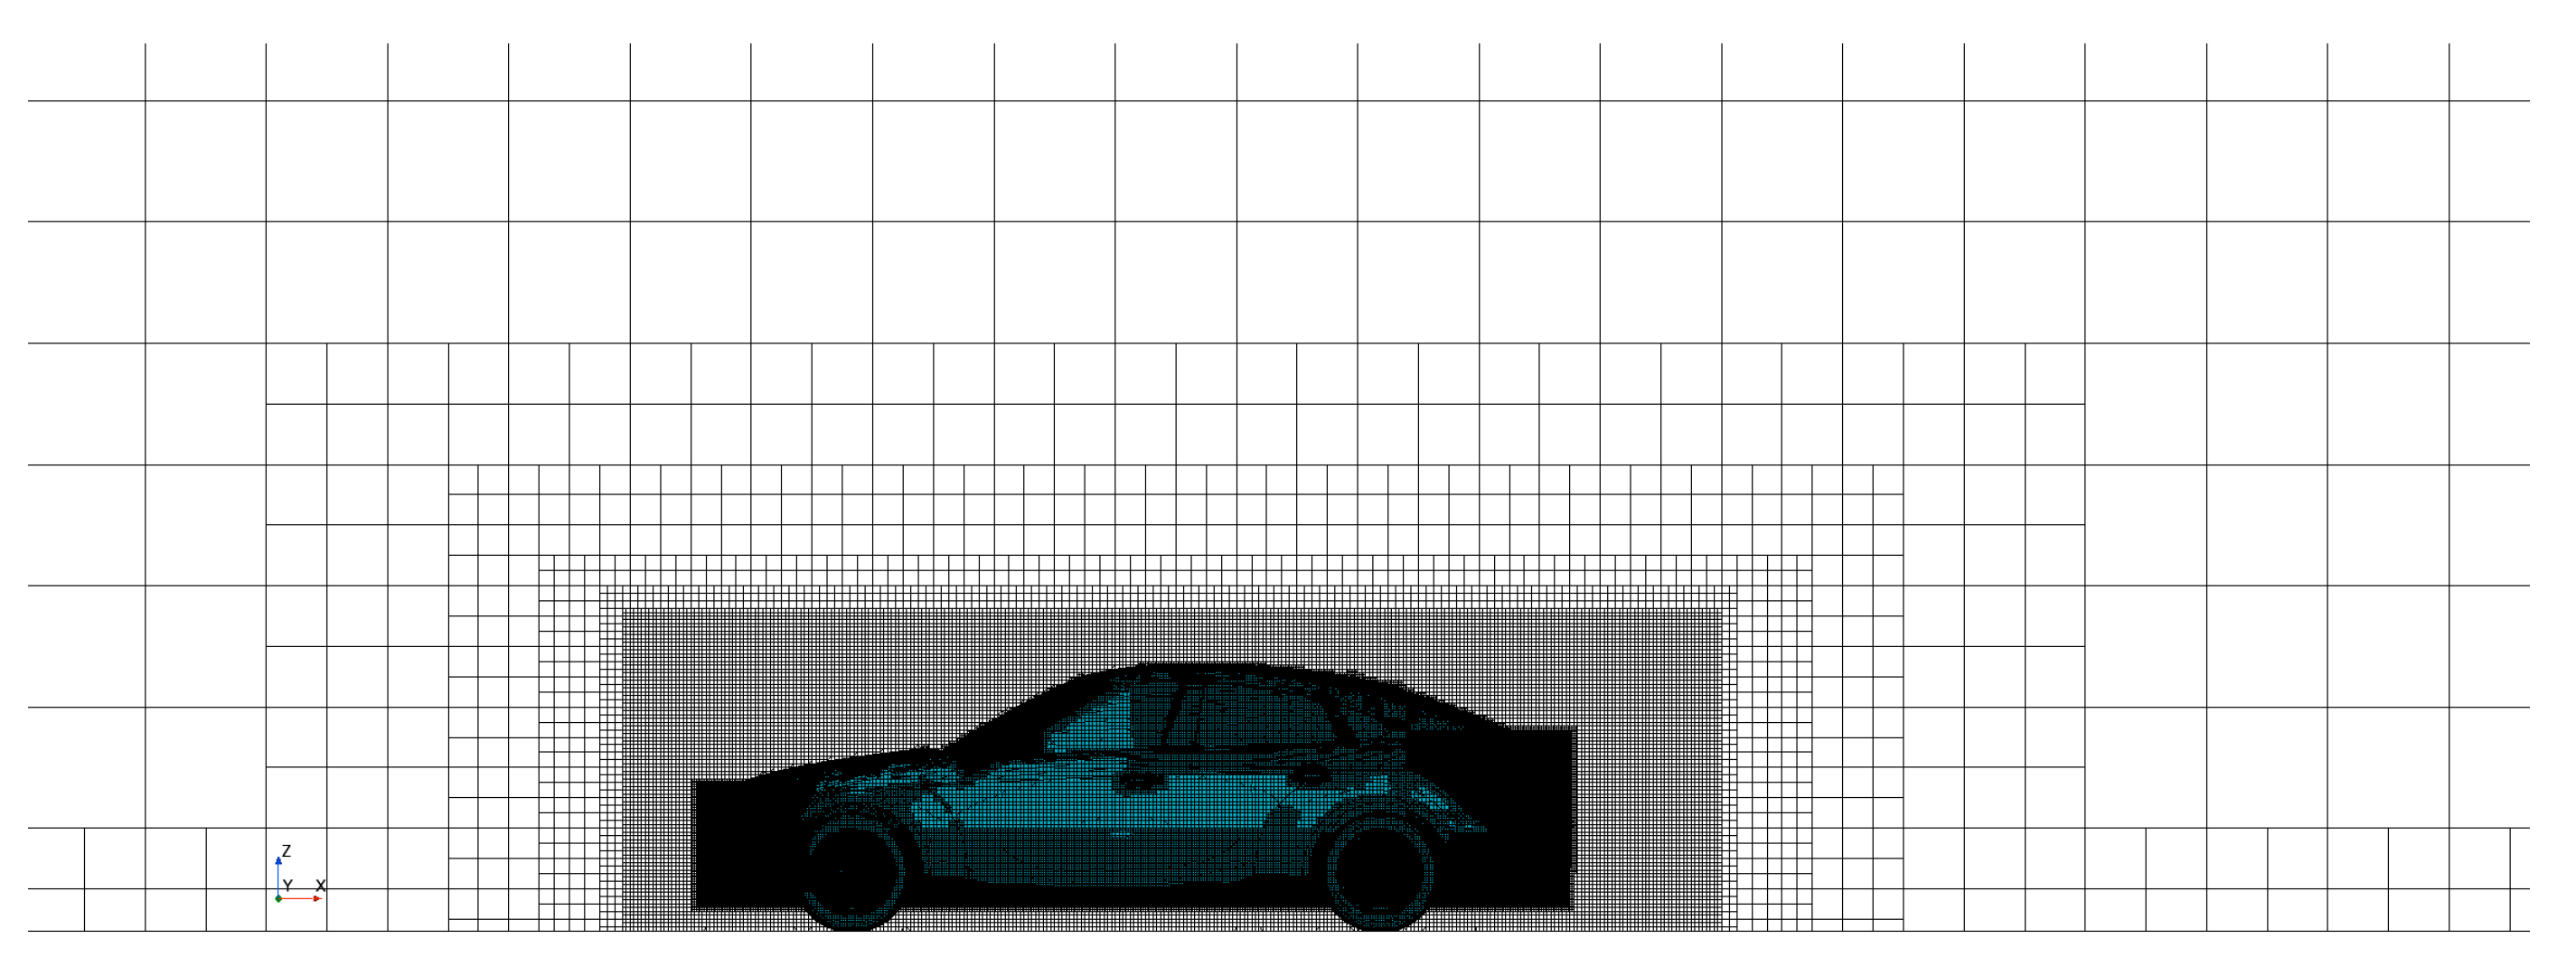
To reduce computational cost while maintaining numerical reliability, refined trimmed-hexahedral cells were applied around the vehicle body, wheels, wheelhouses, underbody, air deflector, near wake, and inter-vehicle wake region for the platooning cases, as shown in Figure 4. Near-wall flow was treated using wall functions with the realizable k-ε model. A target wall of approximately 30 was adopted, with used to avoid locating the first cell within the viscous sublayer. Five prism layers with a growth ratio of 1.3 and a first-layer thickness of 0.05 mm were applied to the vehicle-body and wheel surfaces. The calculated wall- distribution was confirmed to remain within the intended wall-function range. The mesh configuration and grid-independence assessment were performed in the authors’ previous study [22]. Three meshes comprising approximately 7.7, 14.9, and 18.9 million cells were compared. The corresponding grid-independence results are summarized in Table 2. The drag coefficient predicted using the fine mesh was 0.245, showing a difference of 0.8% from the published DrivAer wind-tunnel value of 0.243 [22,23]. Accordingly, the previously validated fine mesh comprising approximately 18.9 million cells was also employed in the present study. This validation confirms the consistency of the global aerodynamic prediction; however, it does not independently validate the wheel-resolved drag coefficients. Because directly comparable benchmark data for individual wheel forces under the same detailed geometry and boundary conditions are not available, the wheel-level results are interpreted primarily in terms of relative changes among consistently simulated cases. Further validation of individual wheel forces, local pressure distributions, and wheel-region flow structures is required. In addition, the grid-independence assessment in Ref. [22] was conducted for the baseline DrivAer configuration and therefore does not constitute a configuration-specific mesh-sensitivity study for the air-deflector and platooning cases considered here.
Figure 4.
Grid system of DrivAer model, adapted from Ref. [22].
Table 2.
Grid-independence results reproduced from Ref. [22].
2.4. Parametric Analysis Conditions
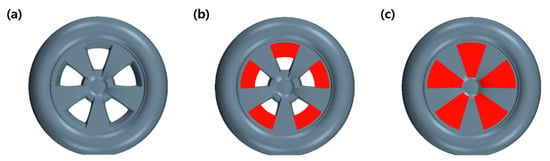
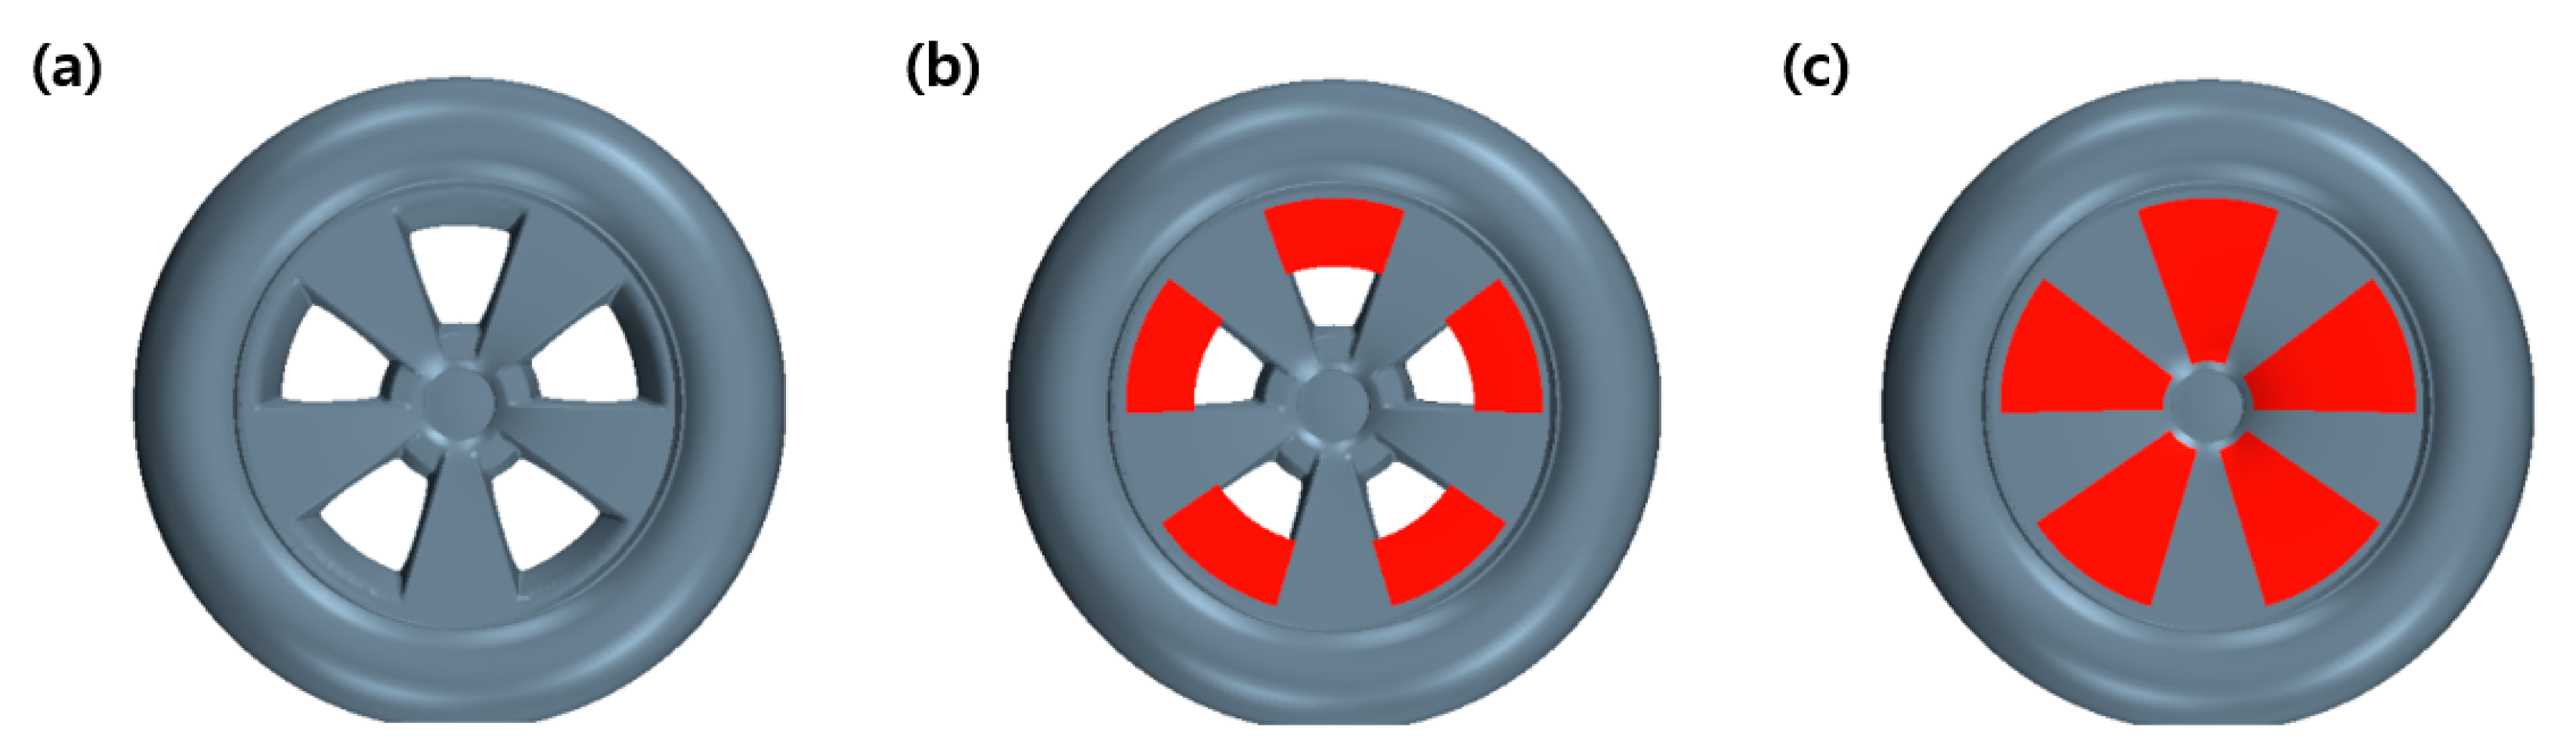
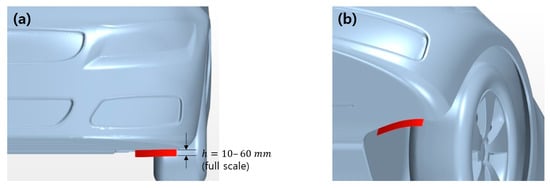
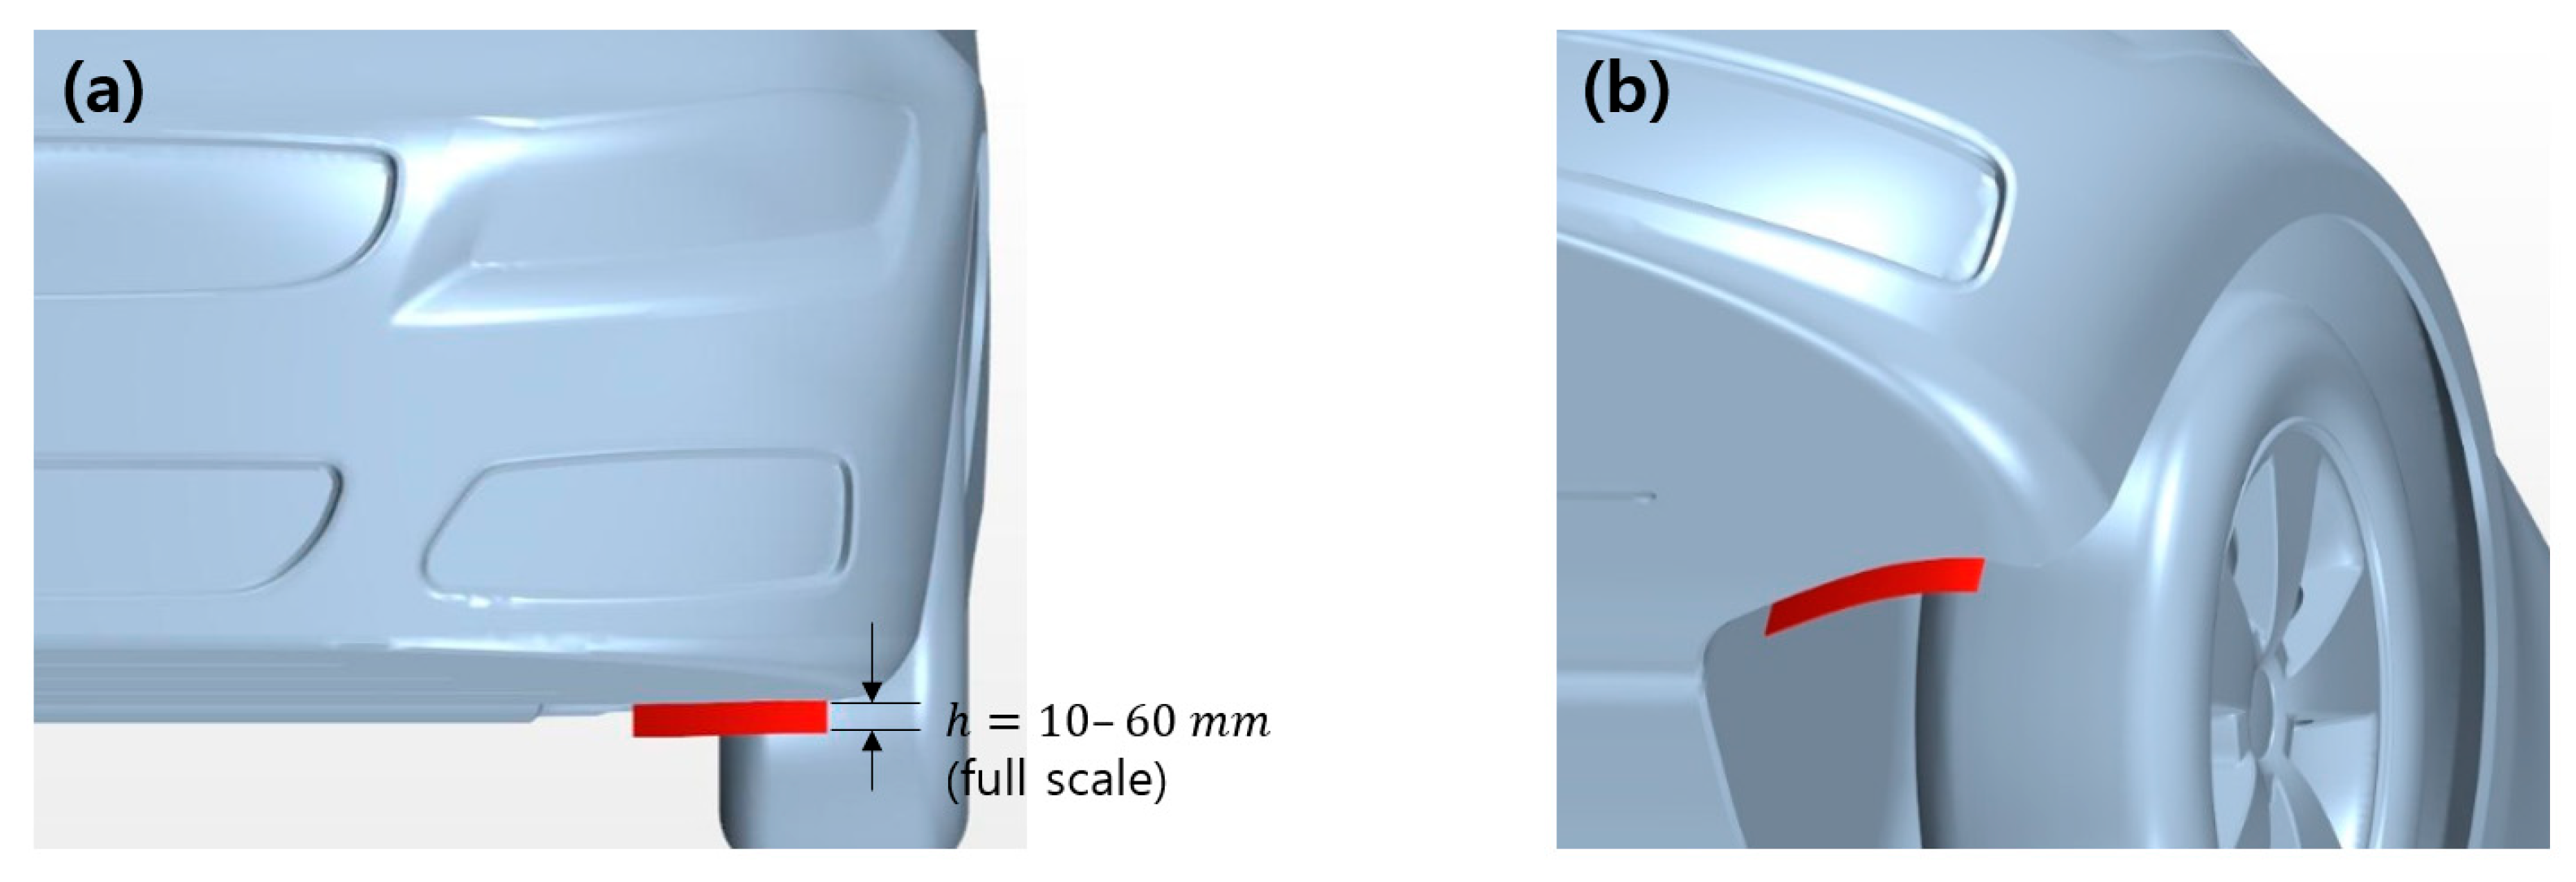
This CFD study investigated wheel-region aerodynamics and drag-reduction strategies under varying inflow, crosswind, and steady-state platooning conditions. The simulations were conducted as follows. (i) To examine the internal wheel-flow characteristics at different vehicle speeds, the inflow velocity was varied from 10 to 40 m/s in increments of 10 m/s. The wheel rotational speed was adjusted to match the corresponding vehicle speed. Wheel rotation was modeled using a rotating-wall boundary condition; the resolved tire and spoke geometry remained fixed in space, while the circumferential wall velocity was prescribed according to the corresponding vehicle speed. Because the non-axisymmetric spoke geometry remained fixed in space, the rotating-wall treatment does not fully reproduce the actual rotational kinematics of the spokes. This modeling choice constitutes a major technical limitation of the present study and may significantly affect the predicted local wheel forces and flow structures around the spoke openings and within the wheelhouse. Therefore, the wheel-resolved forces and local wheel-region flow structures should be interpreted primarily as qualitative, high-level comparative trends rather than quantitatively definitive predictions. (ii) To investigate the effects of spoke-opening geometry on wheel-region aerodynamics, the openings of the five-spoke rim were progressively covered from the outer radius toward the wheel center. The spoke-closure ratio was defined as the ratio of the covered radial length and was set to 0, 1/4, 1/2, 3/4, and 1. A closure ratio of 1 represents a fully closed-rim configuration. The wheel geometries with different spoke-opening configurations are summarized in Figure 5. Figure 5a shows the baseline model, whereas Figure 5c shows the fully closed-rim configuration. (iii) To evaluate the effects of crosswind, yaw angles of , , , , and were imposed while applying rotating-wheel and moving-ground conditions. The magnitude of the inflow velocity, , was fixed at 30 m/s. (iv) Bilateral front-wheel air deflectors conforming to the wheel-arch entrance geometry were evaluated over full-scale heights of 10–60 mm, with a full-scale thickness of 3 mm. Only the deflector height was varied; the deflector angle, longitudinal position, width, thickness, ground clearance, and wheelhouse geometry were maintained unchanged for all cases. Therefore, the effects of deflector height reported in this study are specific to the tested geometry and operating conditions. Both thickness and height were scaled by a factor of 1/2.5 for the 1:2.5-scale computational model. Hereafter, all reported air-deflector heights, , refer to the corresponding full-scale values.
Figure 5.
Representative wheel geometries at different spoke-closure ratios. (a) Base; (b) 1/2 closed wheel spoke; (c) fully closed-rim configuration.
Figure 6 shows the front-left-wheel-arch geometry with a 30 mm-high air deflector. The 60 mm air deflector, which produced the lowest drag among the tested configurations, was subsequently evaluated at a yaw angle of .
Figure 6.
Schematic of the representative 30 mm front-left-wheel air deflector. The deflector height, , was varied from 10 to 60 mm in full-scale units. (a) Front view; (b) oblique view.
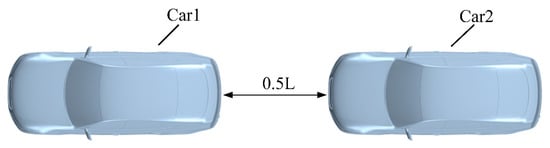
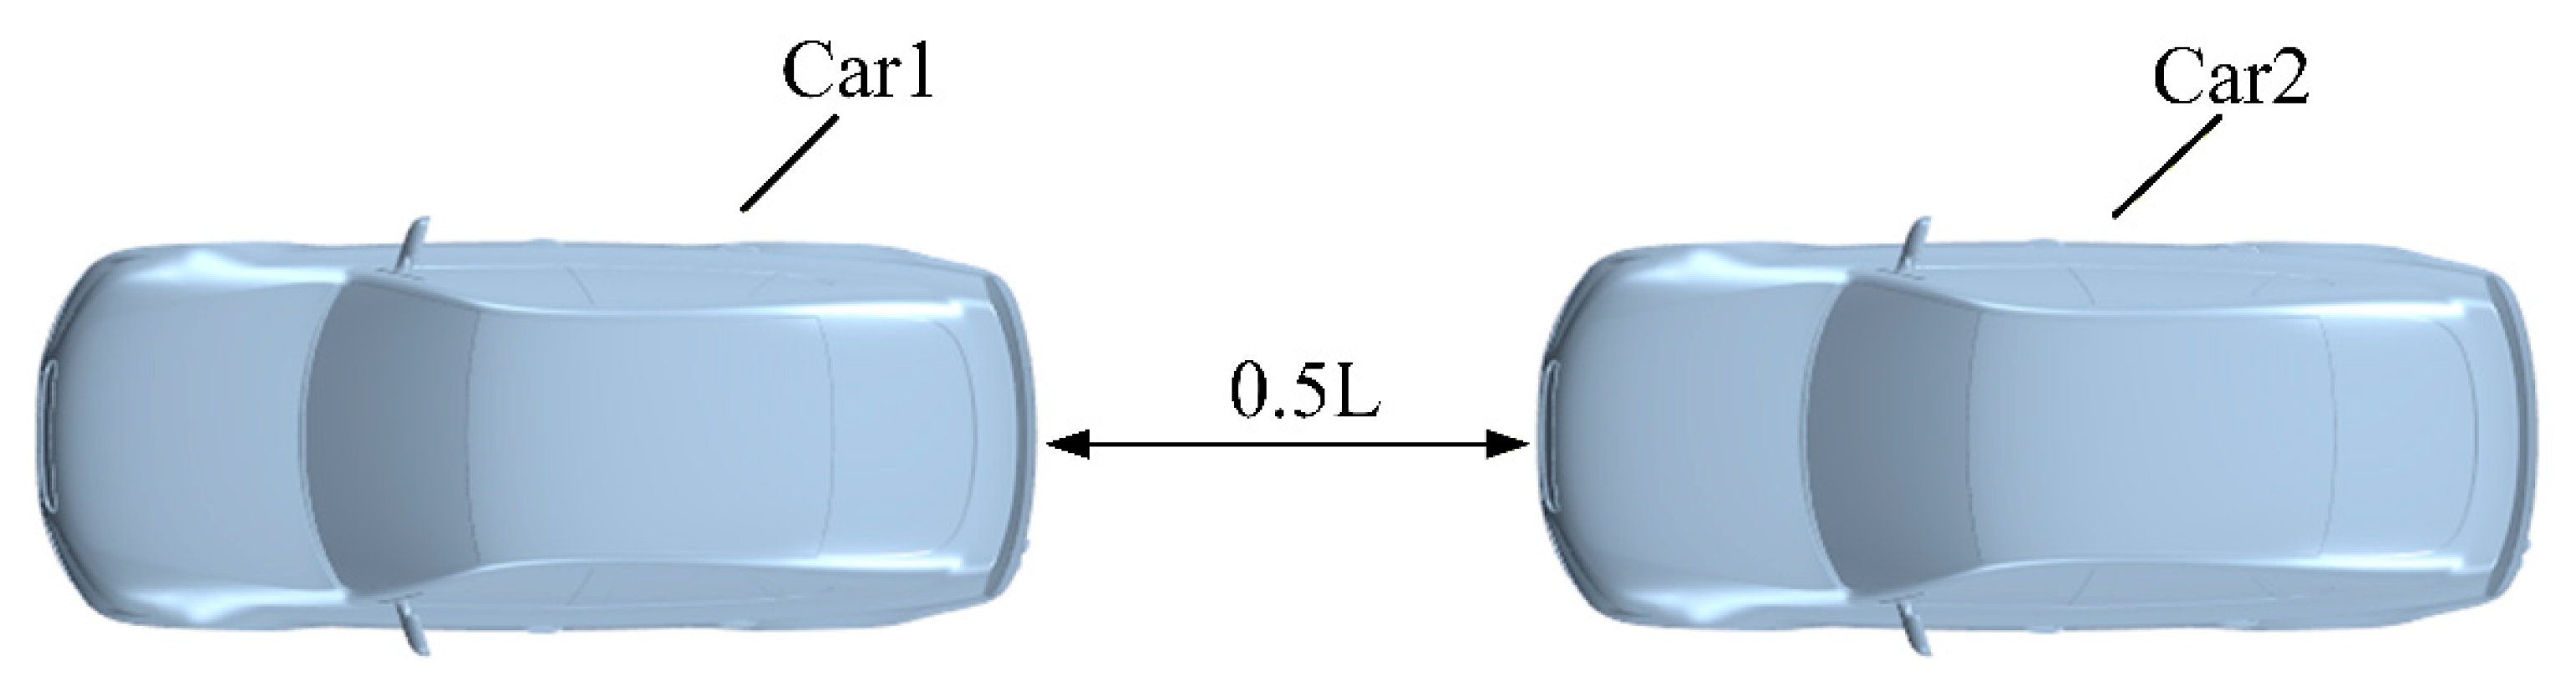
Finally, two identical vehicles were arranged with a spacing of , and the best-performing 60 mm air deflector was installed on the leading vehicle to evaluate both its local effects and downstream influence. The two-vehicle platooning configuration is shown in Figure 7. The spacing represents a close-spacing cooperative platooning condition selected to emphasize inter-vehicle aerodynamic interaction; therefore, the present results should not be directly generalized to conventional manual-driving spacings.
Figure 7.
Spacing between cars in the platoon.
3. Results
3.1. Effects of Inflow Speed and Wheel-Spoke Closure on Vehicle Drag
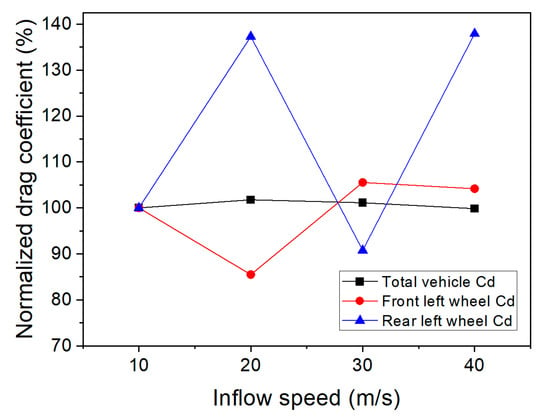
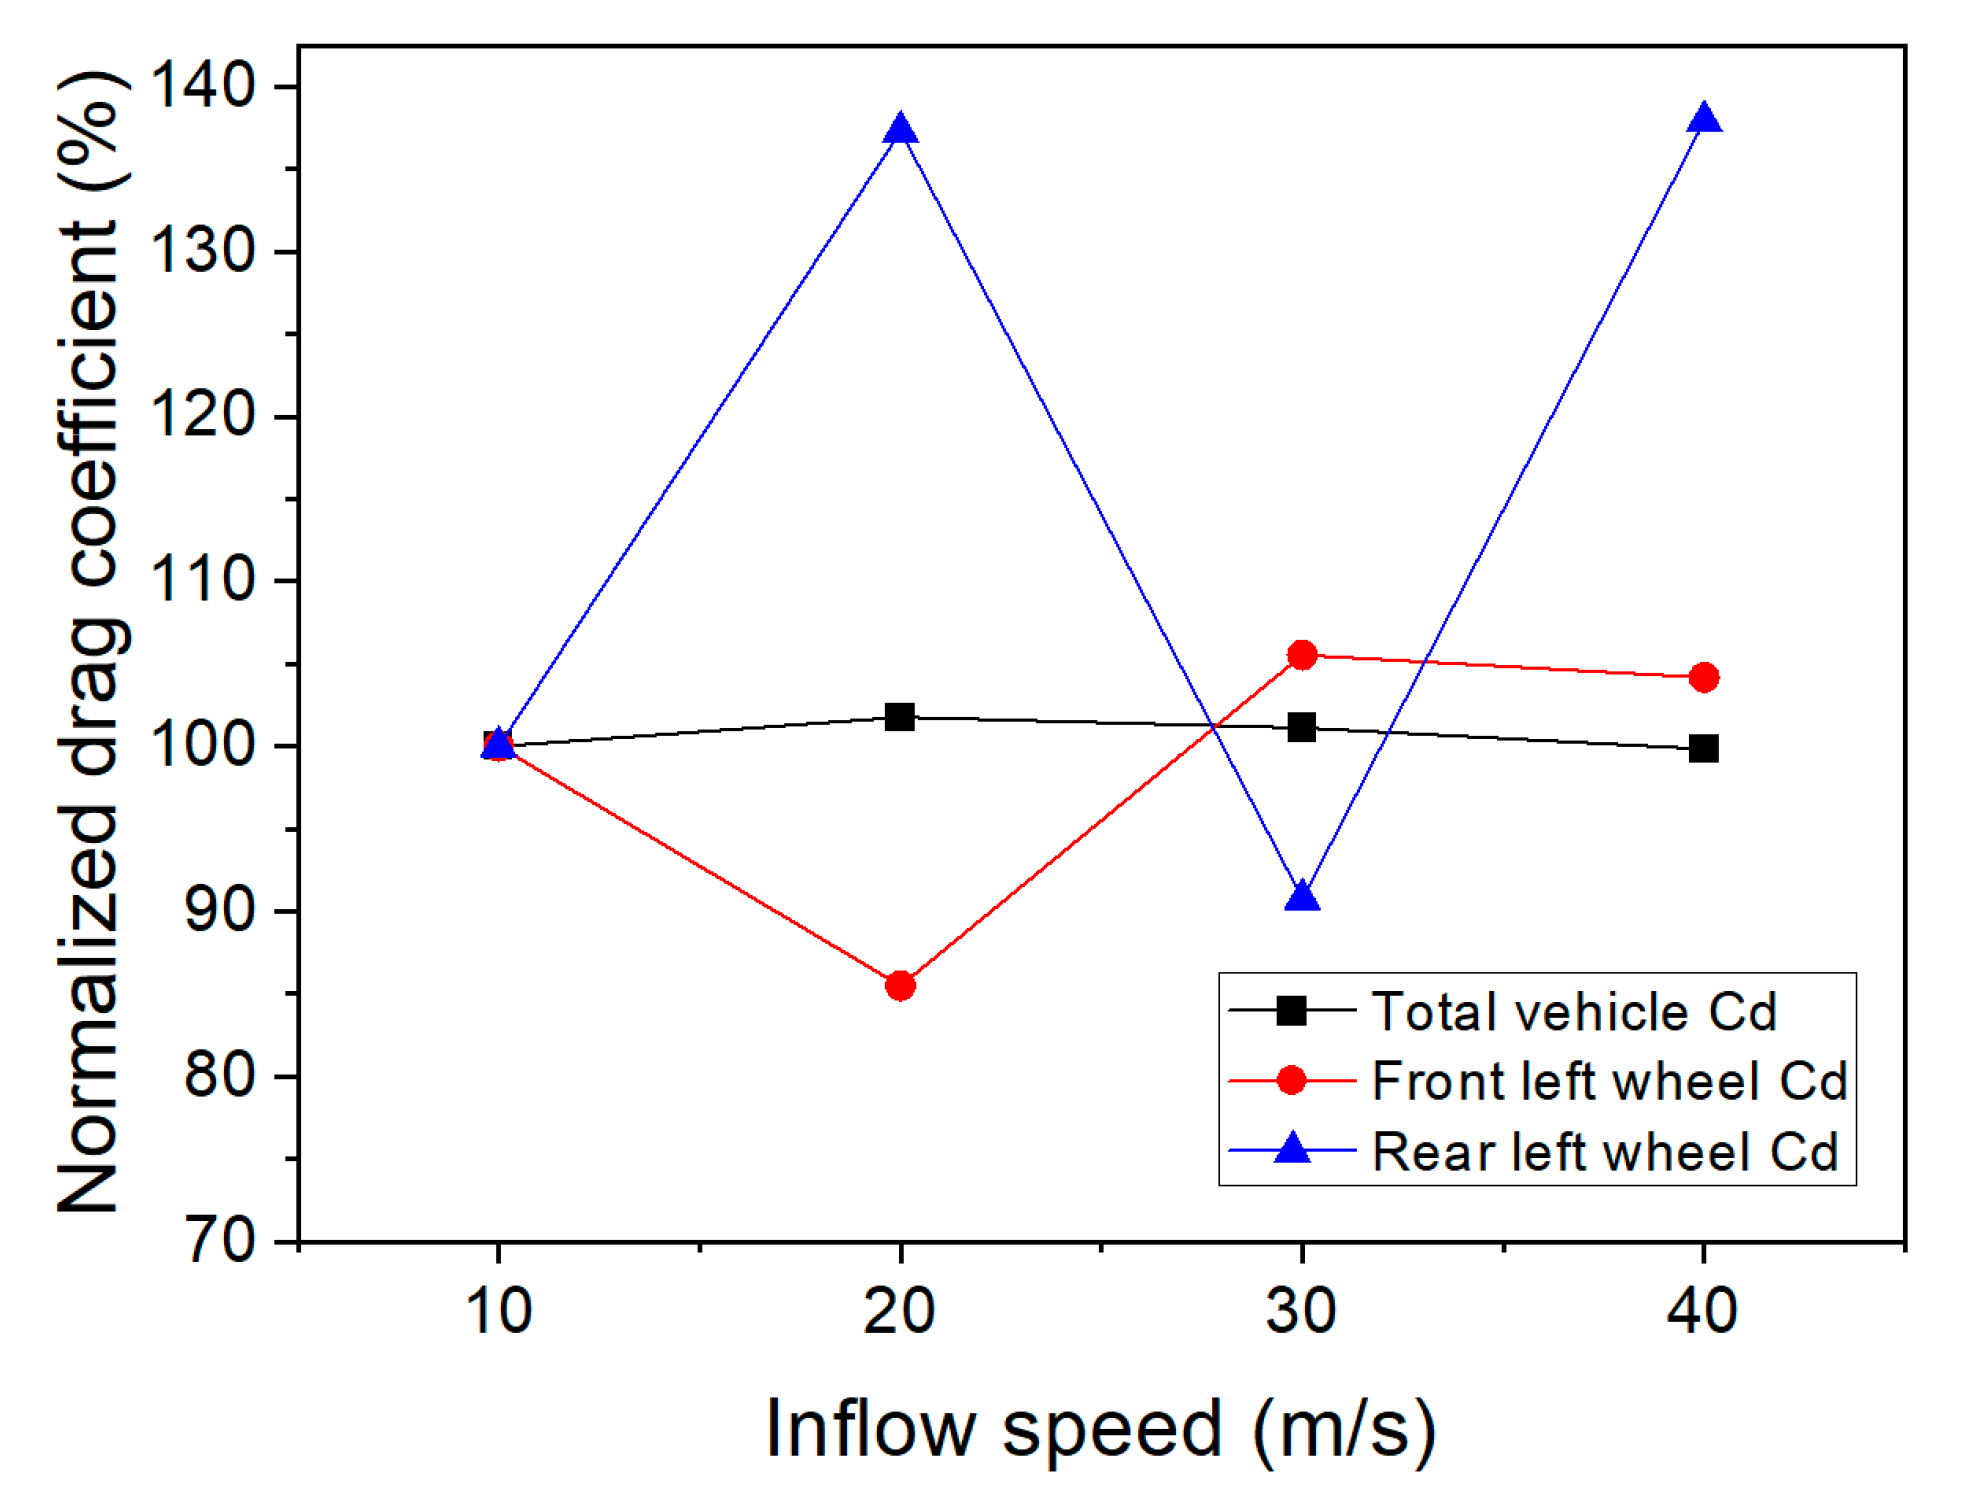
The drag coefficients of the front-left wheel, rear-left wheel, and total vehicle at inflow speeds ranging from 10 to 40 m/s are summarized in Table 3, while Figure 8 presents the drag coefficients normalized by their corresponding values at an inflow speed of 10 m/s. The total-vehicle drag coefficient exhibited only minor variations, remaining within the range of 0.2416–0.2463 as the inflow speed changed. In contrast, the wheel-level responses showed pronounced non-monotonic behavior. The front-left-wheel drag decreased at 20 m/s and subsequently increased at 30–40 m/s, whereas the rear-left-wheel drag exhibited local maxima at 20 and 40 m/s. In the present study, the one-side wheel contribution, , was defined as the percentage contribution of the combined front-left- and rear-left-wheel drag coefficients to the total-vehicle drag coefficient, as follows.
Table 3.
Aerodynamic drag coefficients under four different inflow speeds.
Figure 8.
Drag coefficients normalized by the corresponding values at an inflow speed of 10 m/s.
Here, denotes the drag coefficient of the front-left wheel, denotes the drag coefficient of the rear-left wheel, and denotes the total-vehicle drag coefficient. All drag coefficients were calculated using the same reference velocity and total-vehicle frontal projected area. The parameter is used only to indicate the relative contribution of the two wheels on one side of the vehicle under zero-yaw conditions and is not intended as a left–right comparison metric. As shown in Table 3, under the zero-yaw condition, the one-side wheel contribution remained within the range of 7.49–8.73% of the total-vehicle drag. This indicates that wheel drag remains non-negligible even when variations in the total-vehicle drag coefficient are relatively small.
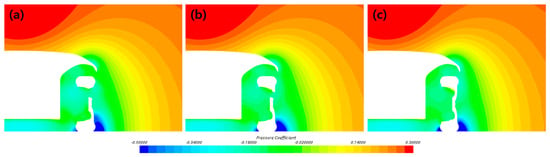
As shown by the pressure contours in Figure 9, when the inflow speed increased from 10 to 20 m/s, the low-pressure region inside the front-left-wheel cavity expanded and flow separation near the tire–ground contact region intensified. Consequently, the front-left-wheel drag coefficient decreased, whereas the rear-left-wheel drag coefficient increased. At 30–40 m/s, the separated-flow region became more confined, and the cavity flow exhibited a more organized structure. Therefore, although variations in inflow speed had only a limited effect on the total-vehicle drag coefficient, they altered the separation location, pressure distribution within the wheel cavity, and recirculating-flow structure, thereby exerting complex effects on the aerodynamic drag characteristics of the individual wheels.
Figure 9.
Pressure-coefficient distribution at the central cross-section (Section A in Figure 1) of the front-left wheel. (a) 10 m/s; (b) 20 m/s; (c) 40 m/s.
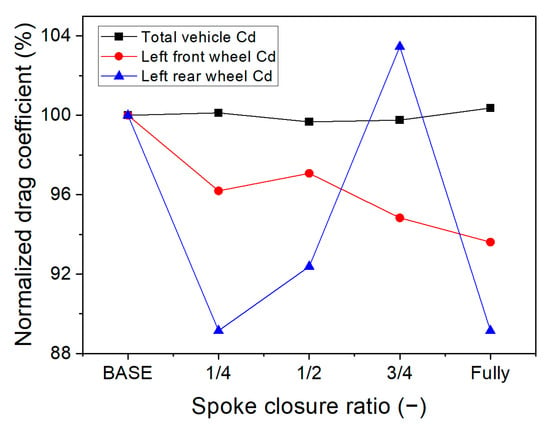
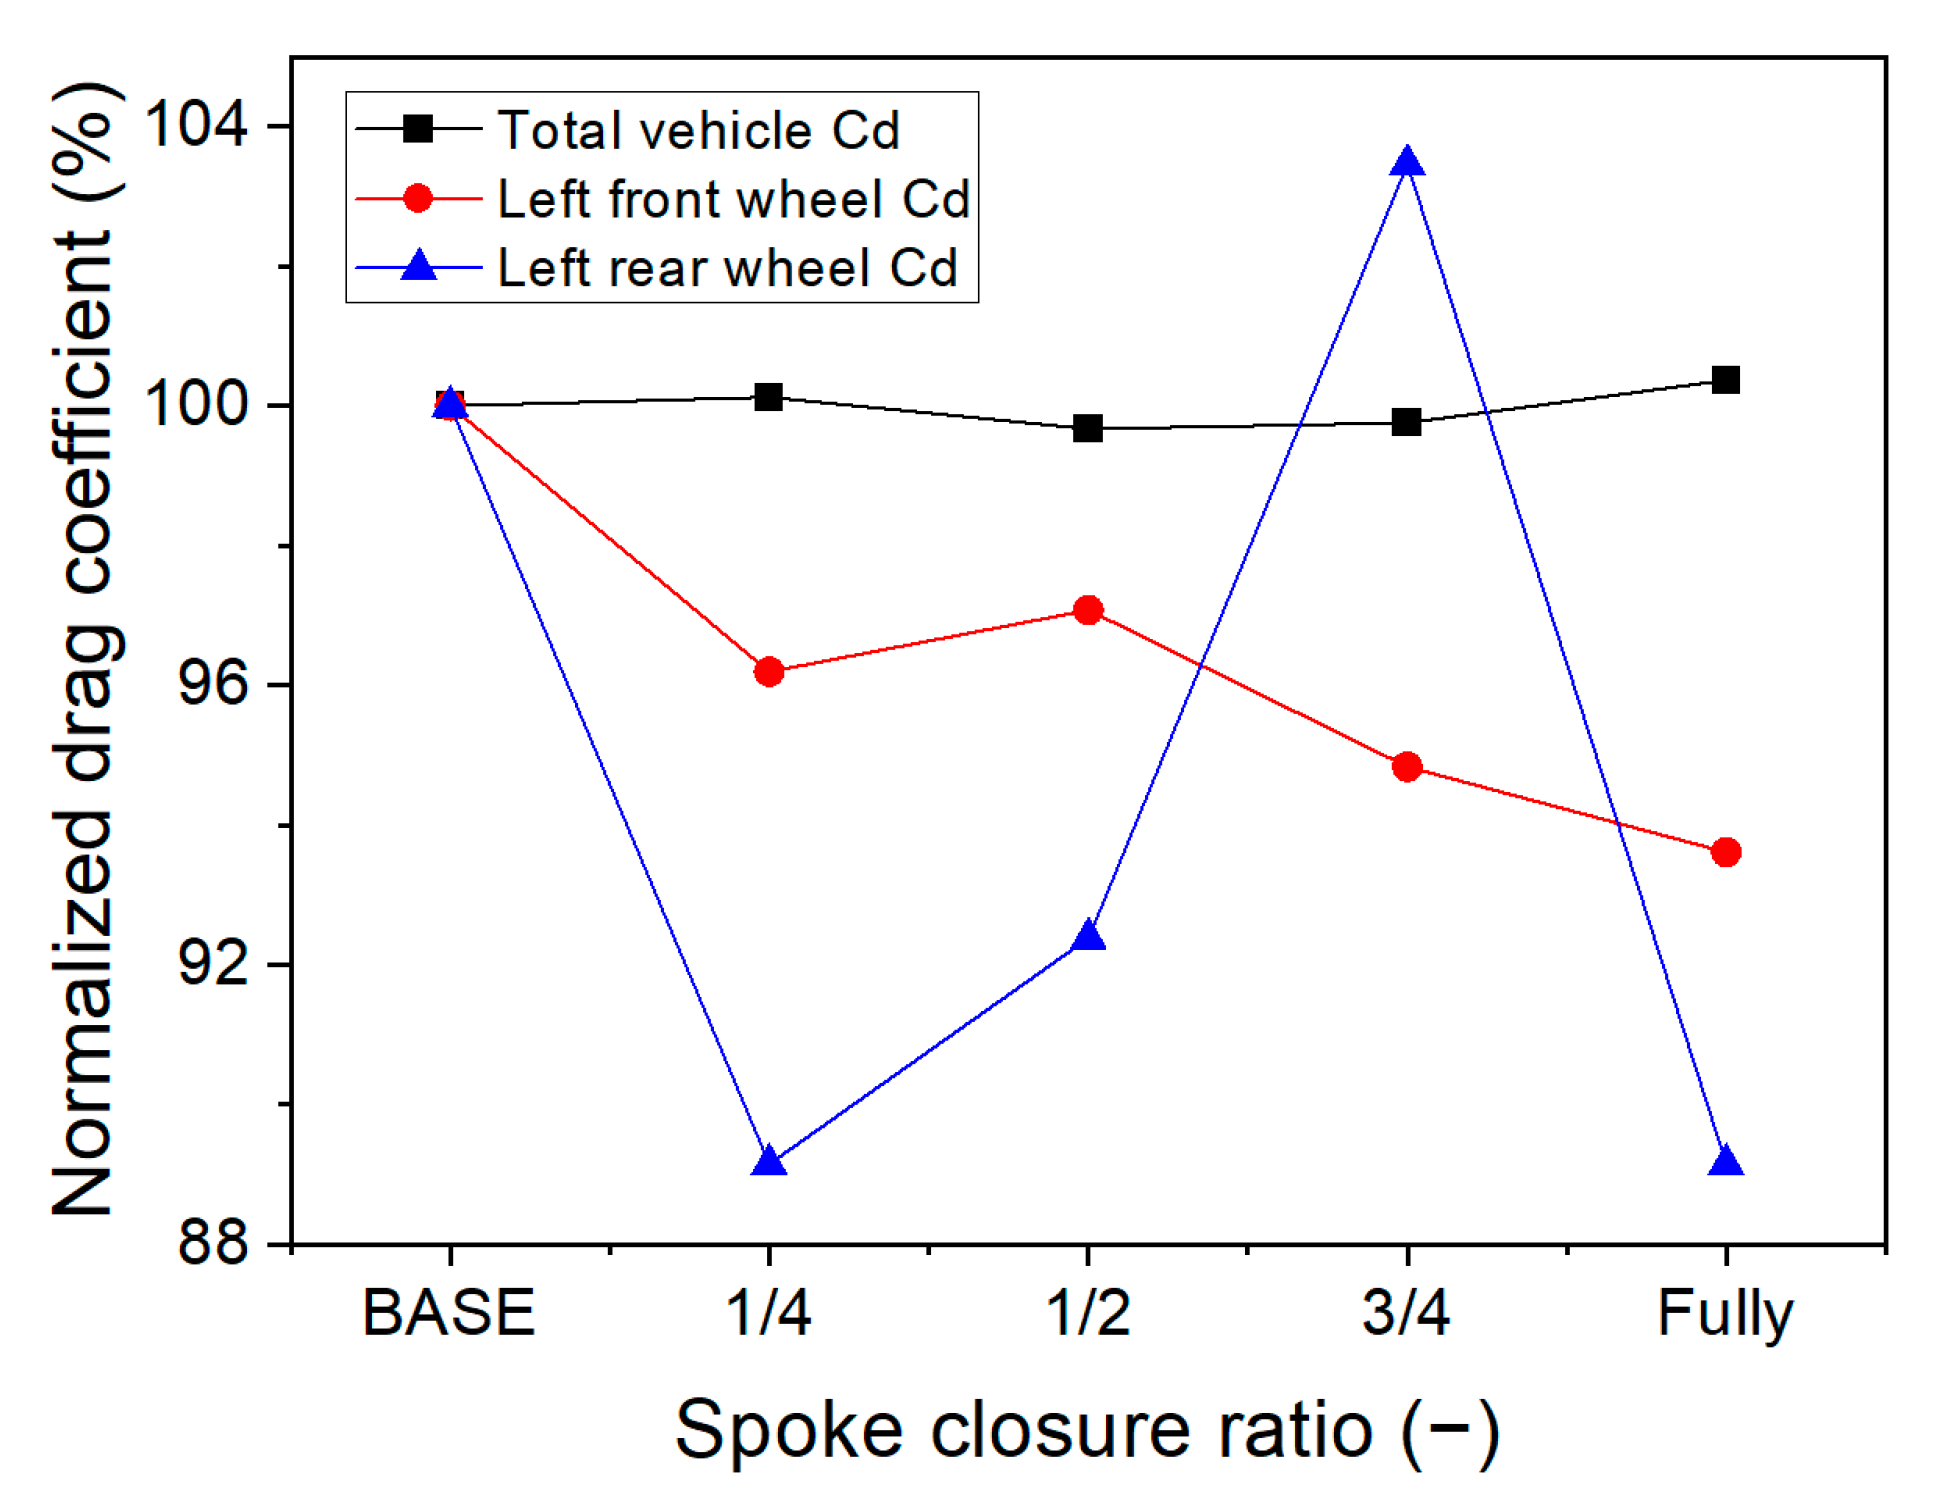
The effects of progressive spoke closure on total-vehicle drag are summarized in Table 4 and Figure 10. The total-vehicle drag coefficient, , changed from 0.2447 for the baseline rim to 0.2450 at 1/4 closure, 0.2439 at 1/2 closure, 0.2441 at 3/4 closure, and 0.2456 under the fully closed-rim configuration. Thus, no consistent decreasing trend was observed with increasing closure ratio, and the overall variation remained within approximately 0.7% of the baseline value. Because a formal numerical uncertainty analysis was not performed, this sub-1% variation should be interpreted as a limited change rather than as a quantitatively significant aerodynamic improvement. In particular, although the front-left- and rear-left-wheel drag coefficients both decreased in the fully closed configuration, the corresponding 0.37% increase in total-vehicle is too small to be interpreted as a meaningful aerodynamic penalty within the present numerical framework. In contrast, the front-left-wheel drag coefficient generally decreased from 0.01470 under the baseline condition to 0.01376 under the fully closed condition, whereas the rear-left-wheel drag coefficient varied irregularly with the closure ratio. This behavior can be attributed to spoke closure suppressing the flow through the rim and altering the pressure inside the wheel cavity, thereby partially reducing the local drag of the front wheel. However, the blocked flow was redistributed through the wheelhouse gaps and around the outer side of the wheel, producing complex changes in the surrounding flow separation and pressure distribution. Therefore, although spoke closure can affect the drag characteristics of individual wheels, its effectiveness as a total-vehicle drag-reduction measure is limited, and the optimum closure ratio cannot be determined from a simple monotonic relationship.
Table 4.
Aerodynamic drag coefficients at different spoke-closure ratios.
Figure 10.
Drag coefficients normalized by the open-rim baseline at different spoke-closure ratios.
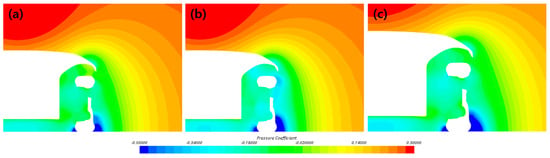
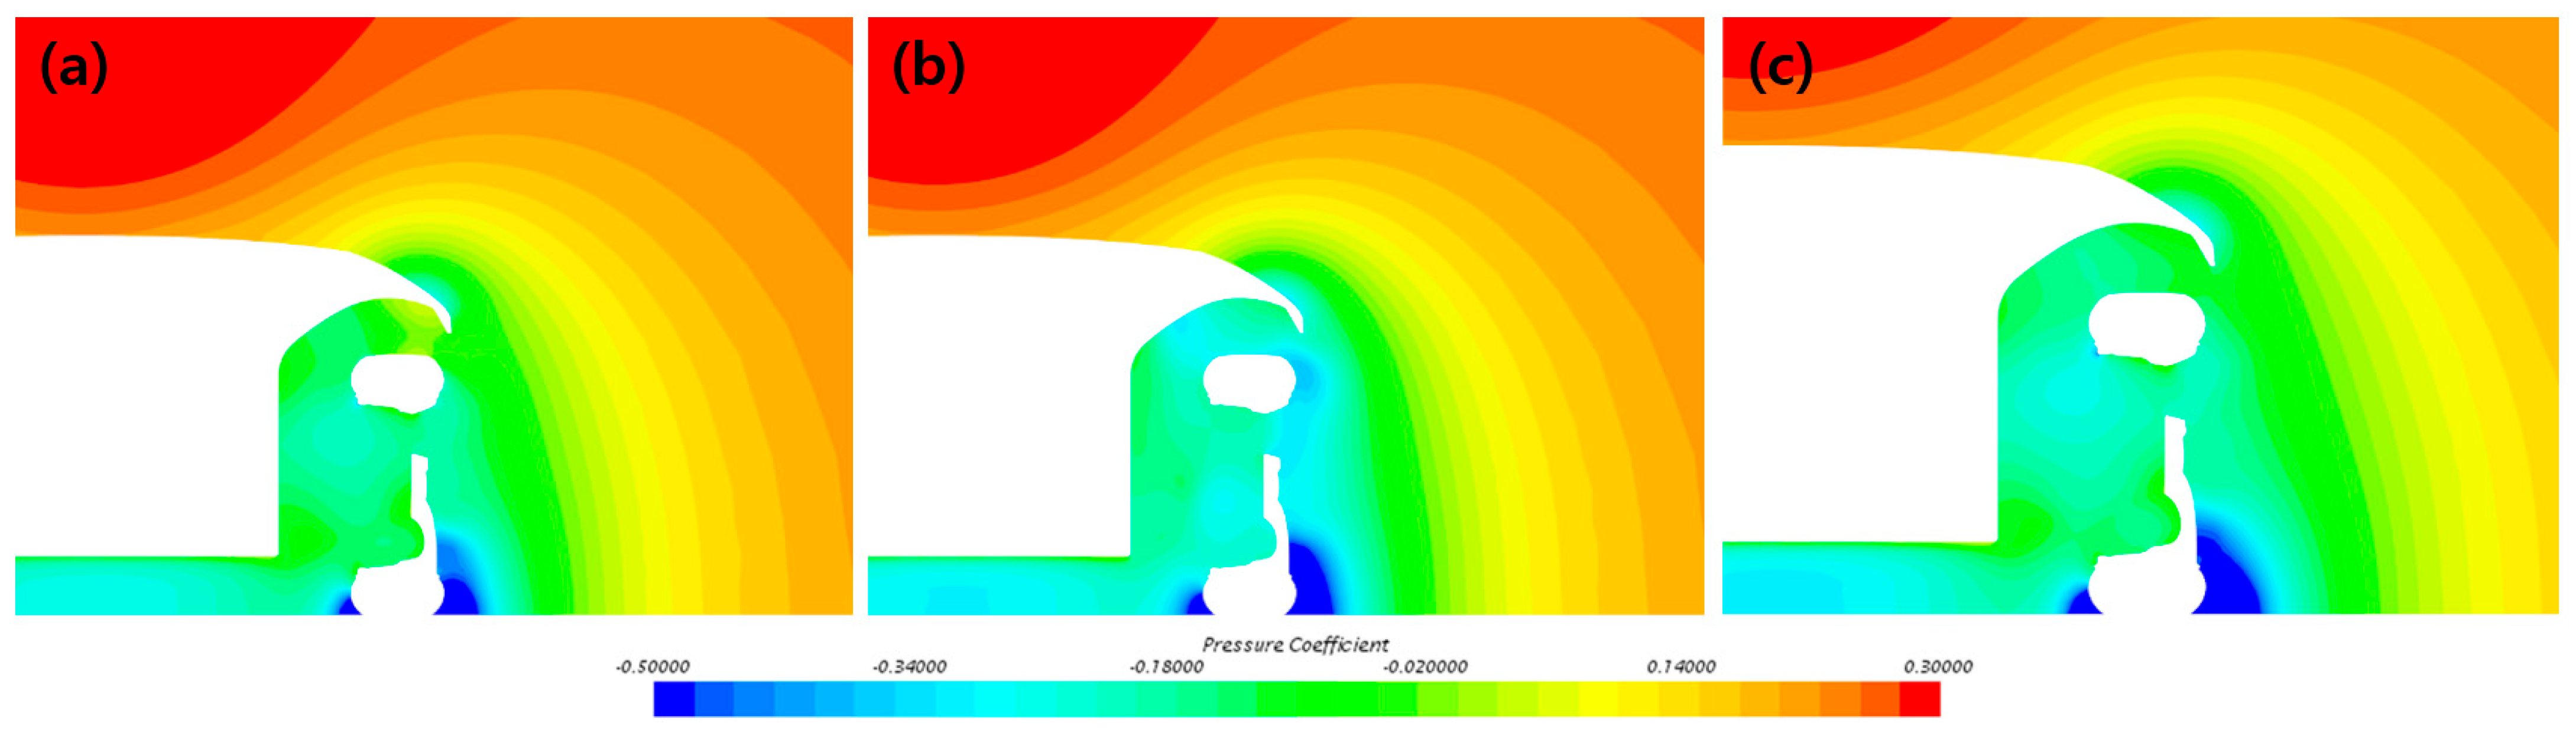
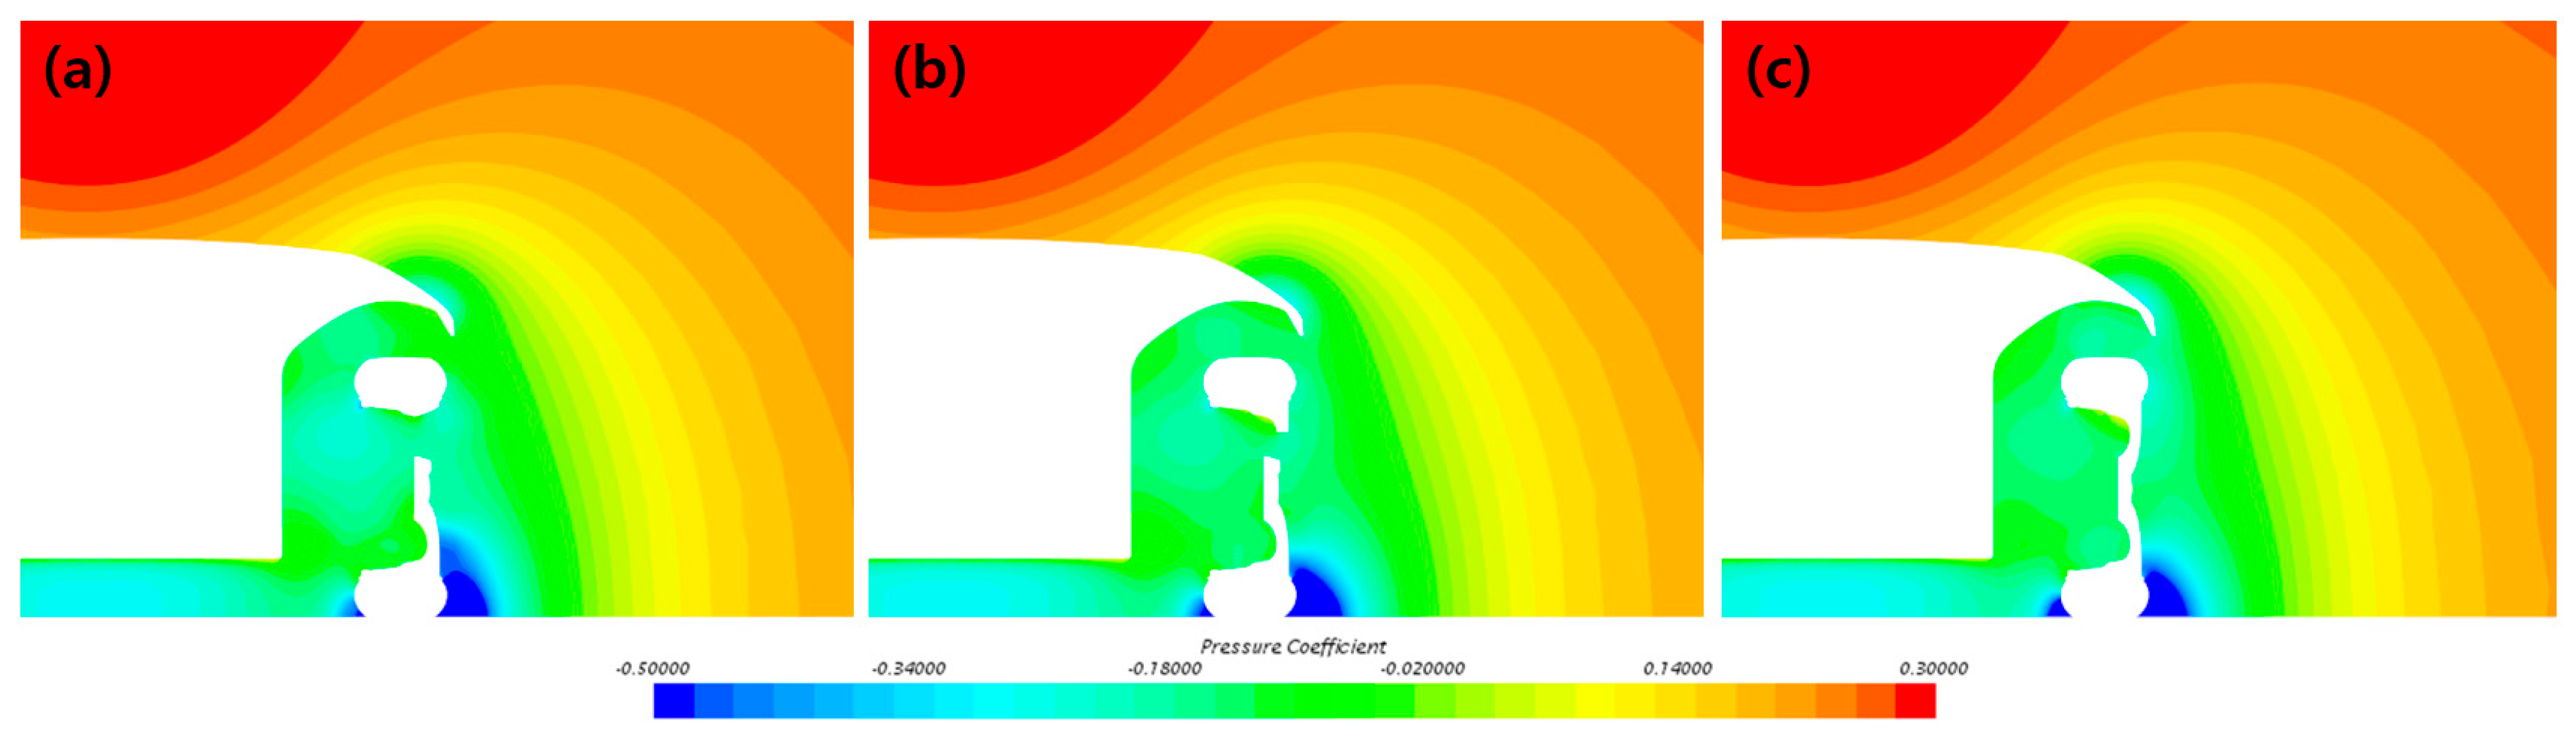
As shown in Figure 11, progressive spoke closure does not substantially alter the overall pattern of the pressure-coefficient distribution, although the local pressure variations inside the wheel become progressively less pronounced. Under the baseline open-spoke condition, active flow exchange through the rim openings produces an extensive region of relatively low pressure coefficient, shown in cyan, inside the wheel and near the wheelhouse entrance. On the 1/2-closure condition, the flow rate through the rim decreases, resulting in a moderate reduction in the low-pressure region inside the wheel and a more uniform pressure distribution. Under the fully closed condition, direct flow exchange between the external flow and the wheel interior is most strongly restricted. Consequently, the pressure coefficient inside the wheel generally recovers, and the low-pressure region becomes more localized. However, the strong low-pressure regions formed near the tire–ground contact area and the lower portion of the wheelhouse remain under all three conditions. Therefore, spoke closure affects the pressure distribution inside the rim but does not fundamentally alter the flow-separation and suction characteristics near the tire–ground contact region.
Figure 11.
Pressure coefficient distribution at the central cross-section (Section A in Figure 1) of the front-left wheel. (a) Base; (b) 1/2 spoke closure; (c) fully closed-rim configuration.
3.2. Effects of Yaw Angle on Vehicle Drag Under Crosswind Conditions
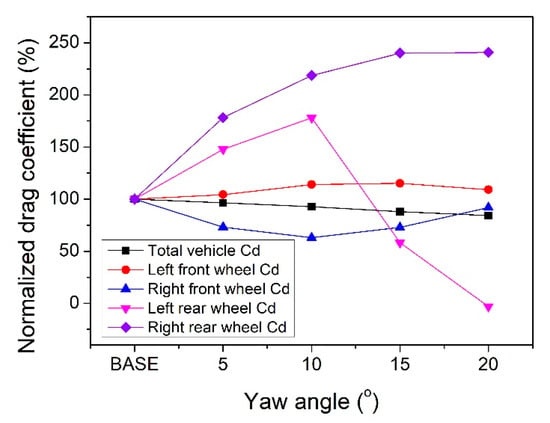
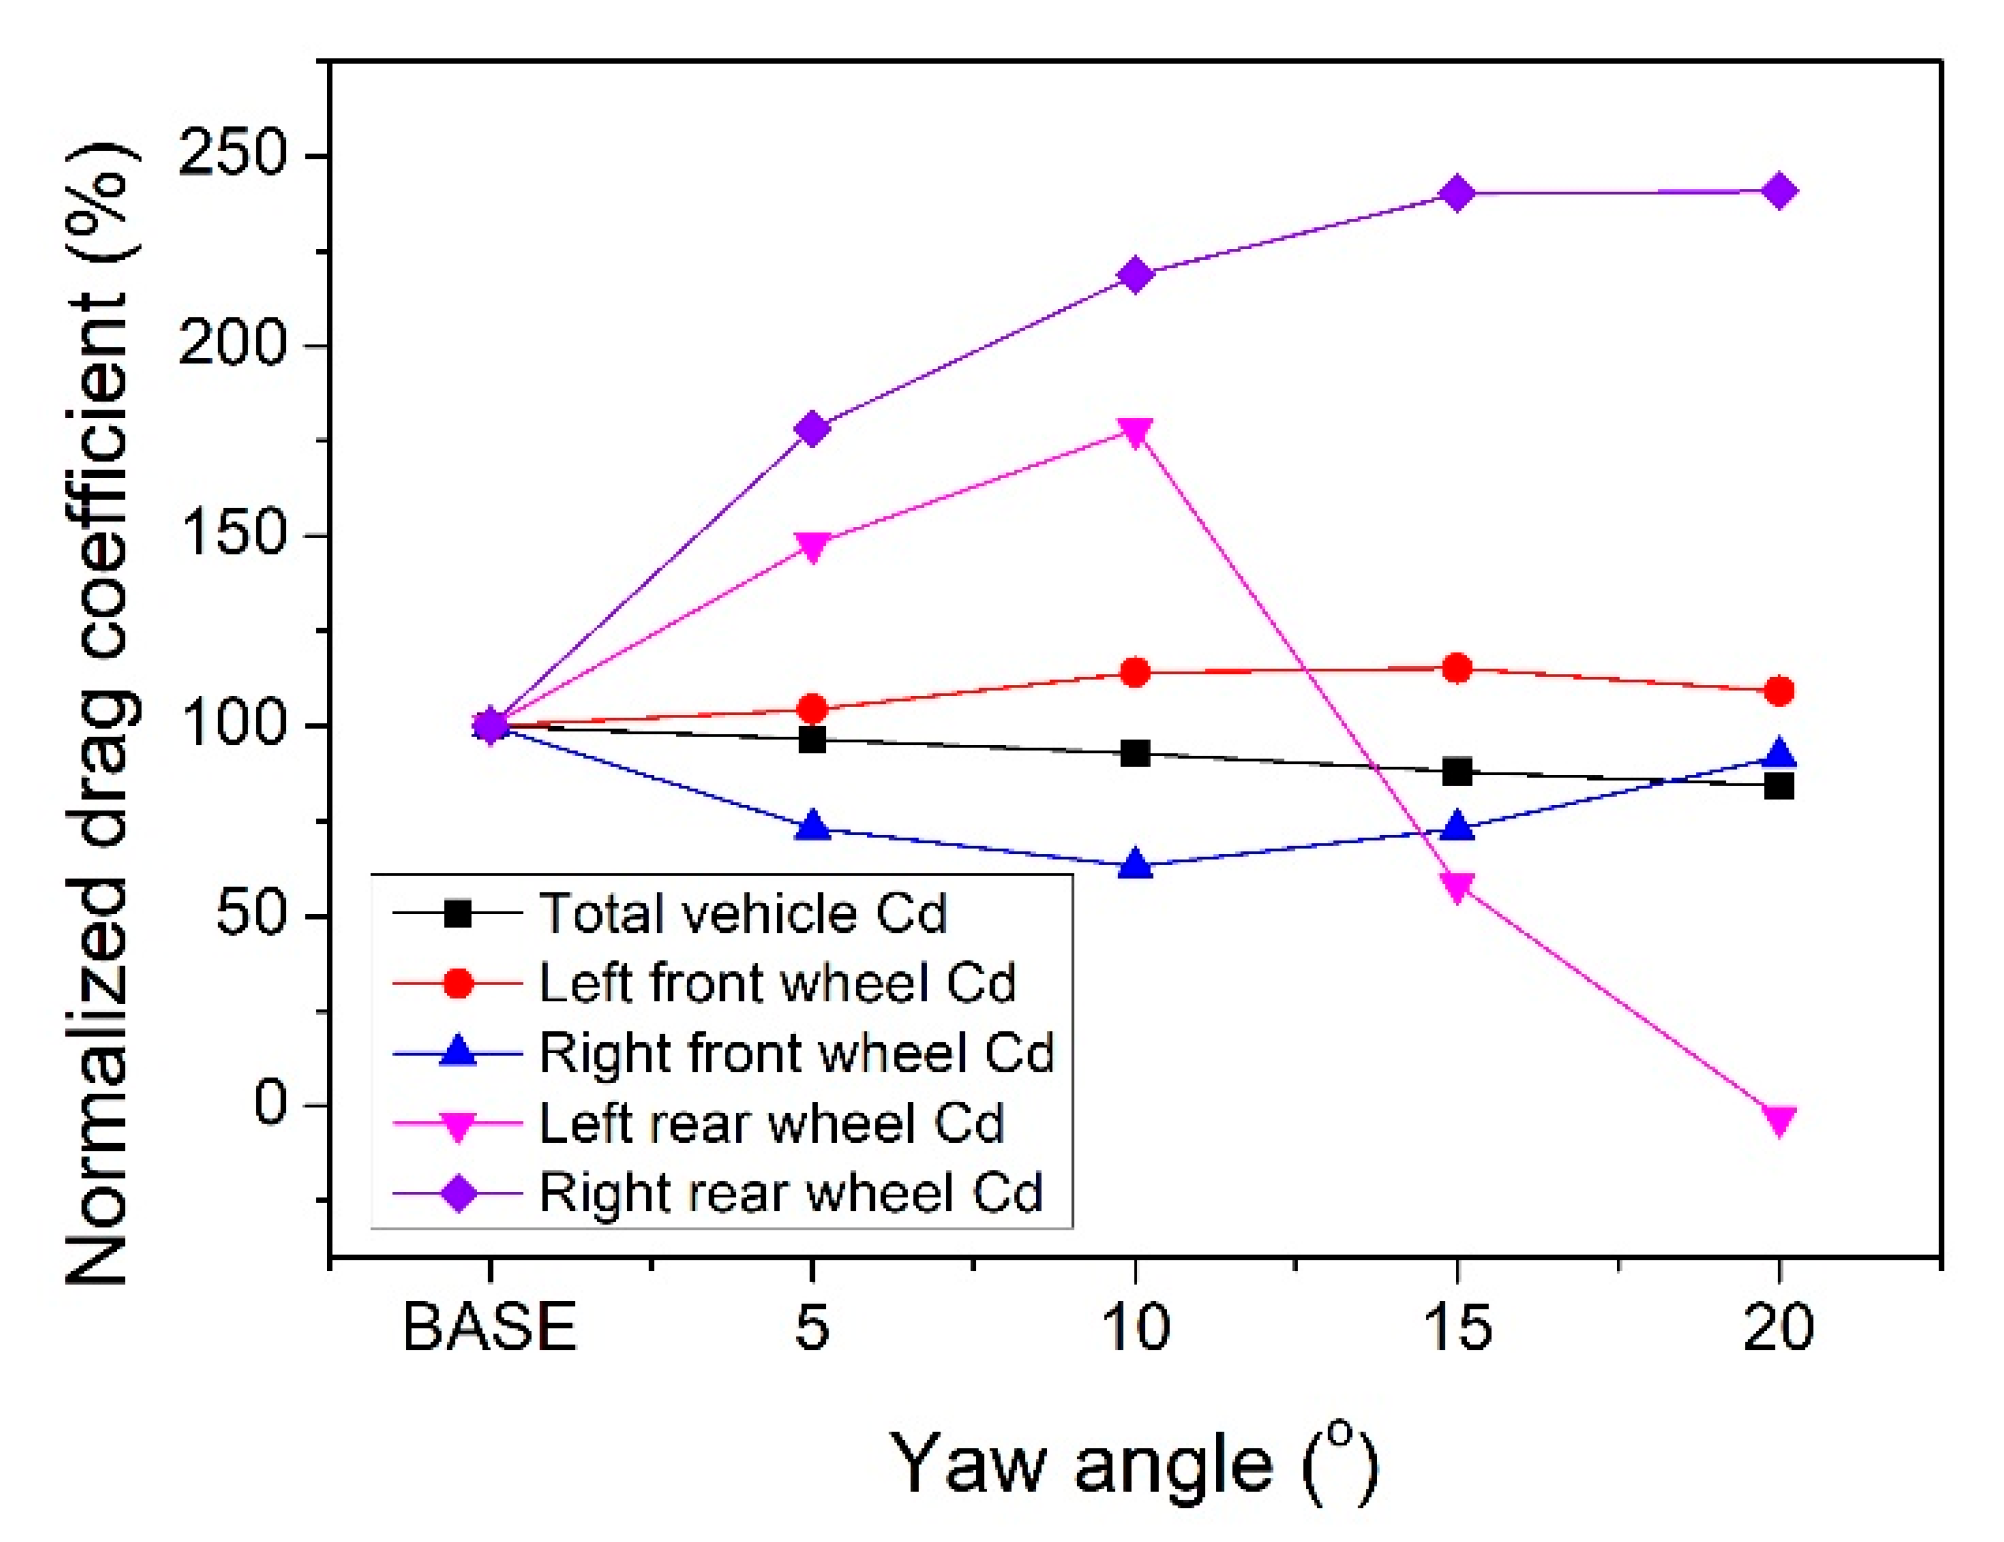
The effects of increasing yaw angle on vehicle drag are summarized in Table 5 and Figure 12. For all crosswind conditions, the magnitude of the inflow velocity, , was fixed at 30 m/s. As shown in Figure 2, the vehicle and moving ground were rotated by the yaw angle relative to the inflow direction. As indicated in Table 5, differences between the left- and right-side wheel drag coefficients occurred even under the zero-yaw condition because of the left–right asymmetry of the detailed underbody components. Increasing the yaw angle had a much greater influence on the left–right asymmetry of the individual wheel drag coefficients than on the total-vehicle drag coefficient.
Table 5.
Aerodynamic drag coefficients at different yaw angles under crosswind conditions.
Figure 12.
Drag coefficients normalized by the corresponding zero-yaw values under crosswind conditions.
The longitudinal total-vehicle drag coefficient, , decreased from 0.2447 under the zero-yaw condition to 0.2363, 0.2268, 0.2151, and 0.2064 at yaw angles of , , , and , respectively, corresponding to a reduction of approximately 15.7% at . However, this result represents only the longitudinal drag component and does not account for side force, lift, roll moment, or yawing moment. These quantities govern lateral loading, tire normal loads, lateral load transfer, and directional stability, respectively. Therefore, the decrease in longitudinal with increasing yaw angle should not be interpreted as an improvement in overall aerodynamic performance or crosswind stability.
The drag coefficient of the front-left wheel increased to a maximum of 0.01693 at , as the lateral underbody flow acted directly on the spoke openings and wheel surface, intensifying flow separation and the front-to-rear pressure imbalance. At , it decreased slightly because of pressure recovery on the downstream side of the wheel. The drag coefficient of the front-right wheel decreased to 0.00916 at , but increased again at larger yaw angles as the inflow into the wheel cavity and flow disturbances intensified. The drag coefficient of the rear-left wheel increased to 0.00771 at because of increased wheelhouse inflow and local flow stagnation. At higher yaw angles, however, the rear-left-wheel drag coefficient decreased sharply. This trend is consistent with the streamline patterns indicating shielding by the upstream front-right wheel and reduced flow momentum toward the rear-left-wheel region. Because the local momentum deficit was not quantitatively evaluated, this mechanism is interpreted qualitatively rather than established conclusively. In contrast, the drag coefficient of the rear-right wheel increased by approximately 2.4 times, from 0.00554 to 0.01334, because the effective impingement area of the incoming flow increased.
These results indicate that crosswind reduces the longitudinal of the vehicle while simultaneously inducing nonlinear and asymmetric changes in the drag of the individual wheels through the lateral redistribution of underbody flow and shielding effects produced by the upstream wheels.
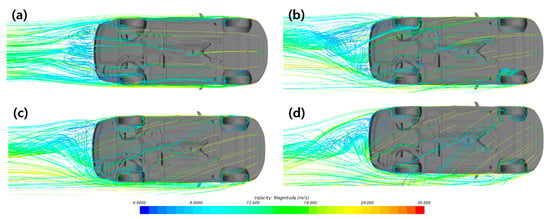
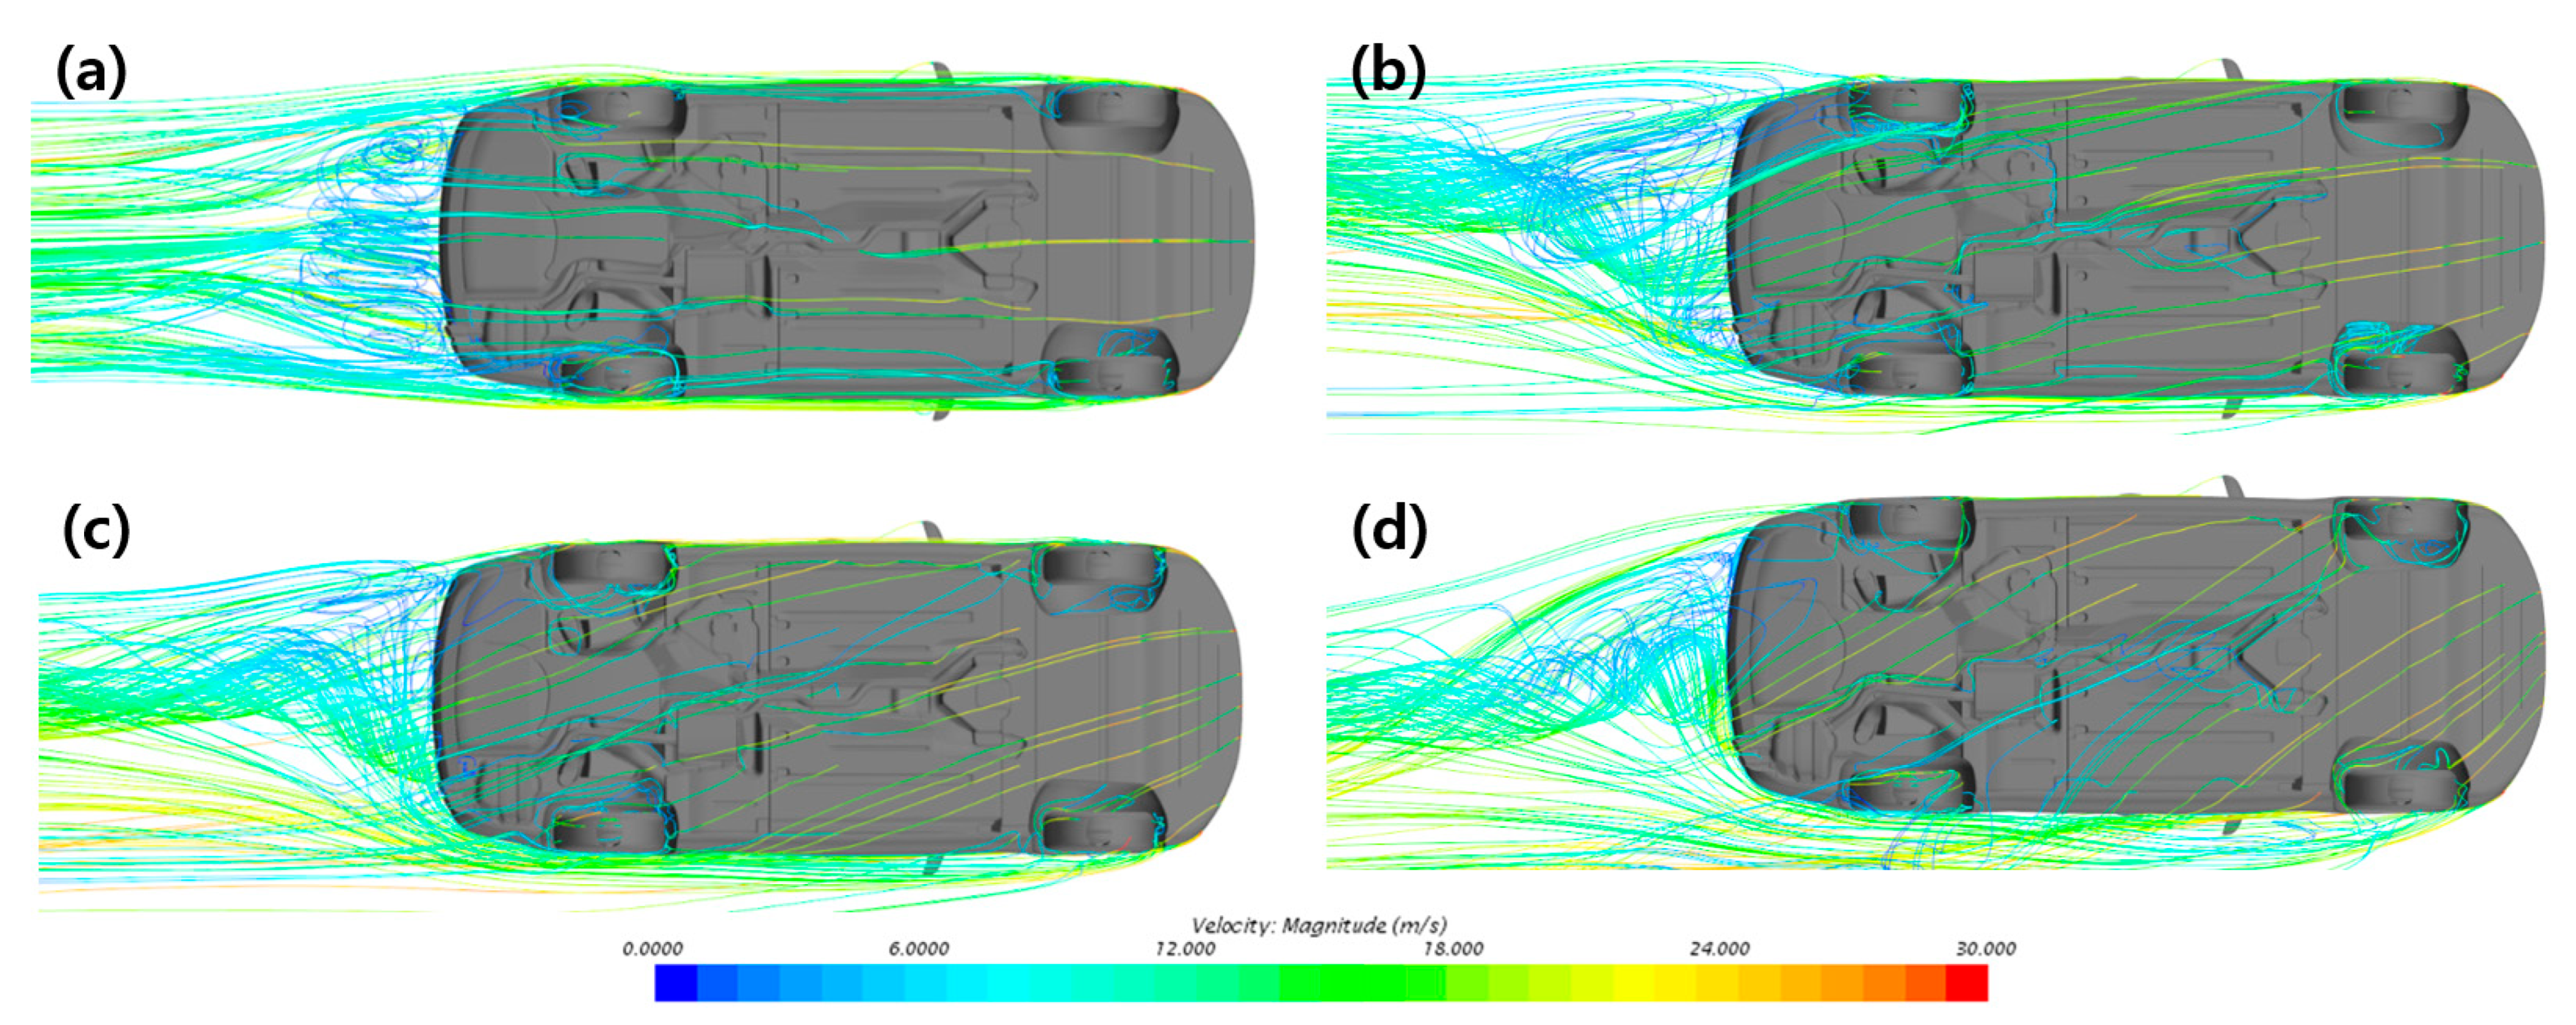
As shown by the top-view streamline distributions in Figure 13, under the zero-yaw condition, the flow remains relatively symmetric along the longitudinal direction of the vehicle, with only localized separation and wake formation around each wheel. When the yaw angle increases to , the incoming flow impinges obliquely on the vehicle, causing the underbody streamlines to deviate laterally. Disturbed flow generated by the front wheels is then transmitted toward the opposite-side rear-wheel region, producing left–right asymmetry between the wheels. At , this lateral momentum transfer becomes more pronounced: the streamlines around the windward-side front wheel are strongly deflected, and the front-wheel wake traverses the underbody diagonally, substantially altering both the magnitude and direction of the flow entering the rear-wheel regions. At , the underbody flow is dominated by the crosswind component, and both streamline deflection and inter-wheel interference become most pronounced. The upstream front-right wheel diverts the flow, producing a shielding effect that reduces the momentum transmitted toward the opposite-side rear-left wheel. Consequently, the flow becomes concentrated around the rear-right wheel, increasing its drag coefficient, whereas the rear-left wheel experiences a substantial momentum deficit and localized pressure recovery, causing its drag coefficient to decrease sharply and become slightly negative at . The resulting value of at is extremely small and should be regarded as approximately zero within the numerical uncertainty of the present calculation rather than as a physically significant negative drag. These results indicate that crosswind does not merely incline the overall flow field; rather, it redistributes the front-wheel wakes beneath the vehicle, thereby inducing nonlinear and asymmetric changes in the front-to-rear pressure difference and drag coefficient of each wheel.
Figure 13.
Top view of streamline distributions around the vehicle underbody. (a) Base; (b) = 5°; (c) = 15°; (d) = 20°.
3.3. Effects of Front-Wheel Air-Deflector Height and a 5° Yaw Angle
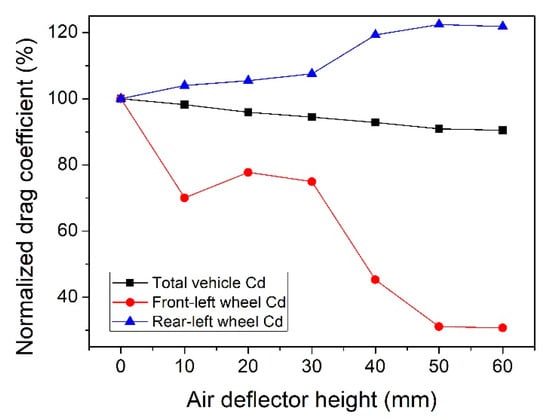
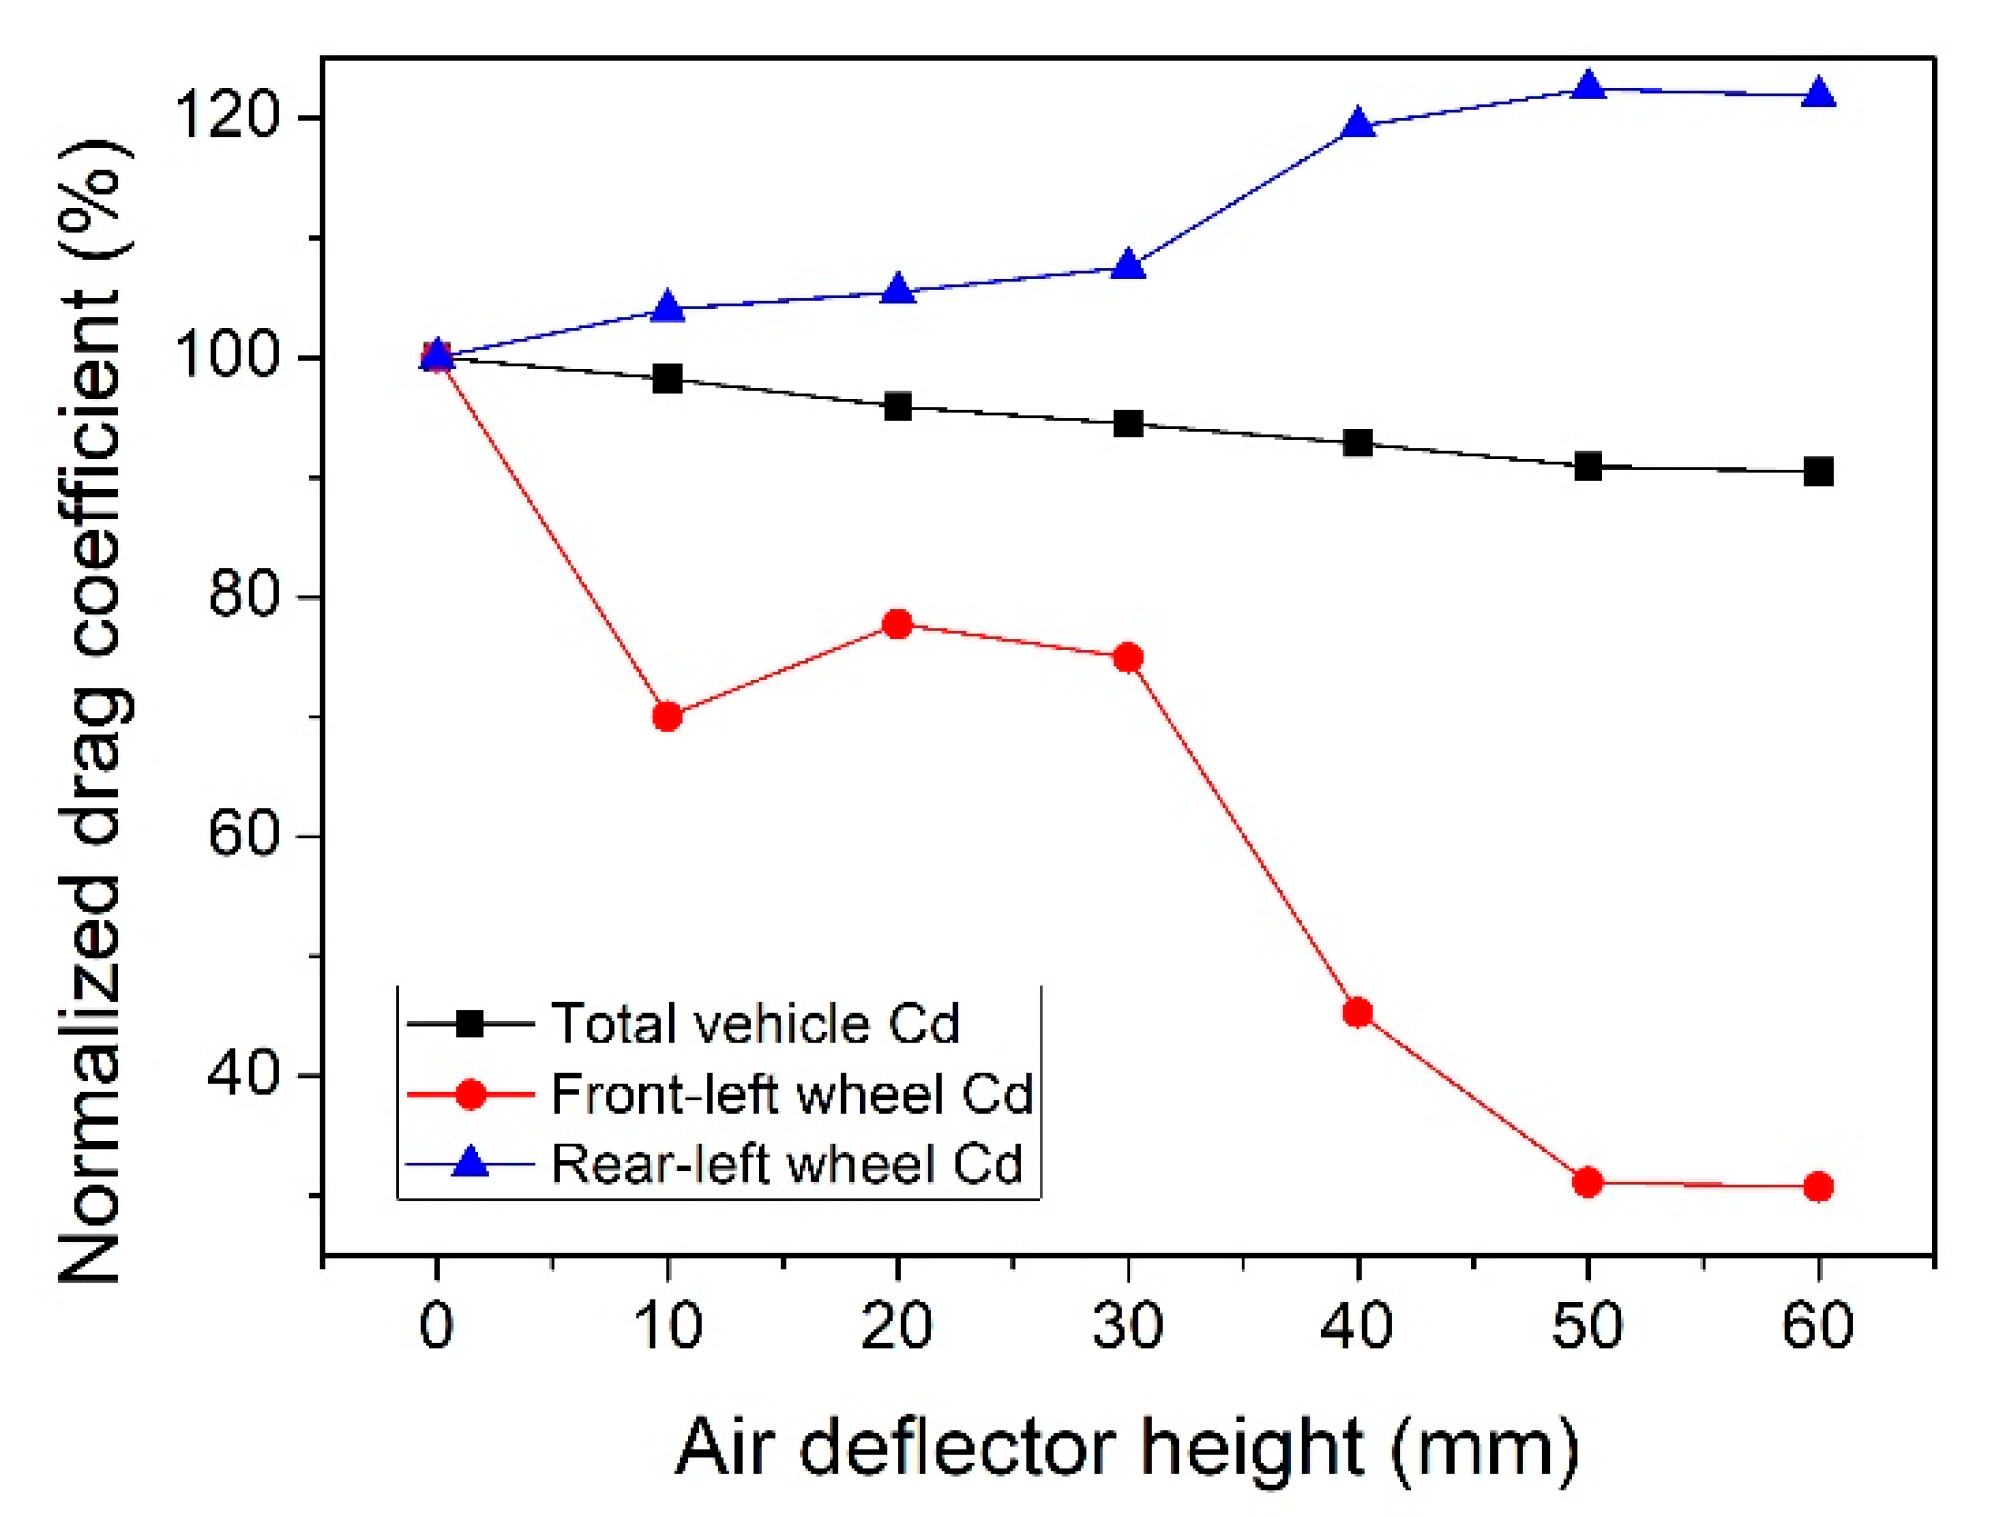
The effects of front-wheel air-deflector height on vehicle drag are presented in Table 6 and Figure 14. The inflow velocity was fixed at = 30 m/s. As the air-deflector height increased, the total-vehicle drag coefficient decreased almost monotonically from 0.2447 for the baseline condition to 0.2213 for the 60 mm configuration, corresponding to a maximum drag reduction of 9.6%. In particular, the front-left-wheel drag coefficient decreased by 70.8%, from 0.01470 to 0.00429, indicating that the primary aerodynamic benefit of the air deflector occurred in the front-wheel region. At a fixed vehicle speed and with the same reference quantities, this 9.6% reduction in corresponds to the same relative reduction in aerodynamic drag force and aerodynamic power demand. However, it should not be interpreted as a 9.6% reduction in total vehicle energy consumption, because rolling resistance, drivetrain losses, and other power demands are not considered in the present aerodynamic analysis.
Table 6.
Aerodynamic drag coefficients for different air deflector heights at = 30 m/s.
Figure 14.
Drag coefficients normalized by the baseline values at different front-wheel air-deflector heights at = 30 m/s.
A non-monotonic variation was observed at the lower deflector heights: the front-left-wheel drag coefficient decreased to 0.00976 at 10 mm and then temporarily increased to 0.01083 at 20 mm. This behavior is attributed to localized changes in the pressure balance between the upper wheelhouse outflow and the front-wheel wake as the deflector height varied. At heights of 30 mm and above, the air deflector effectively restricted the underbody flow entering the front wheelhouse, substantially reducing the high-pressure stagnation region on the front-wheel surface and the front-to-rear pressure difference. Consequently, the drag-reduction effect increased markedly by 40 to 50 mm.
In contrast, the rear-left-wheel drag coefficient increased by approximately 34.2%, from 0.00433 to 0.00581. This increase is considered to result from the downstream redistribution of the underbody flow diverted around the front wheel, which altered the incoming flow and pressure distribution around the rear wheel. Nevertheless, the reductions in front-left-wheel and total-vehicle drag were considerably greater than the increase in rear-left-wheel drag. Because the additional improvement became nearly saturated between 50 and 60 mm, an air-deflector height of approximately 50–60 mm was considered effective under the present conditions.
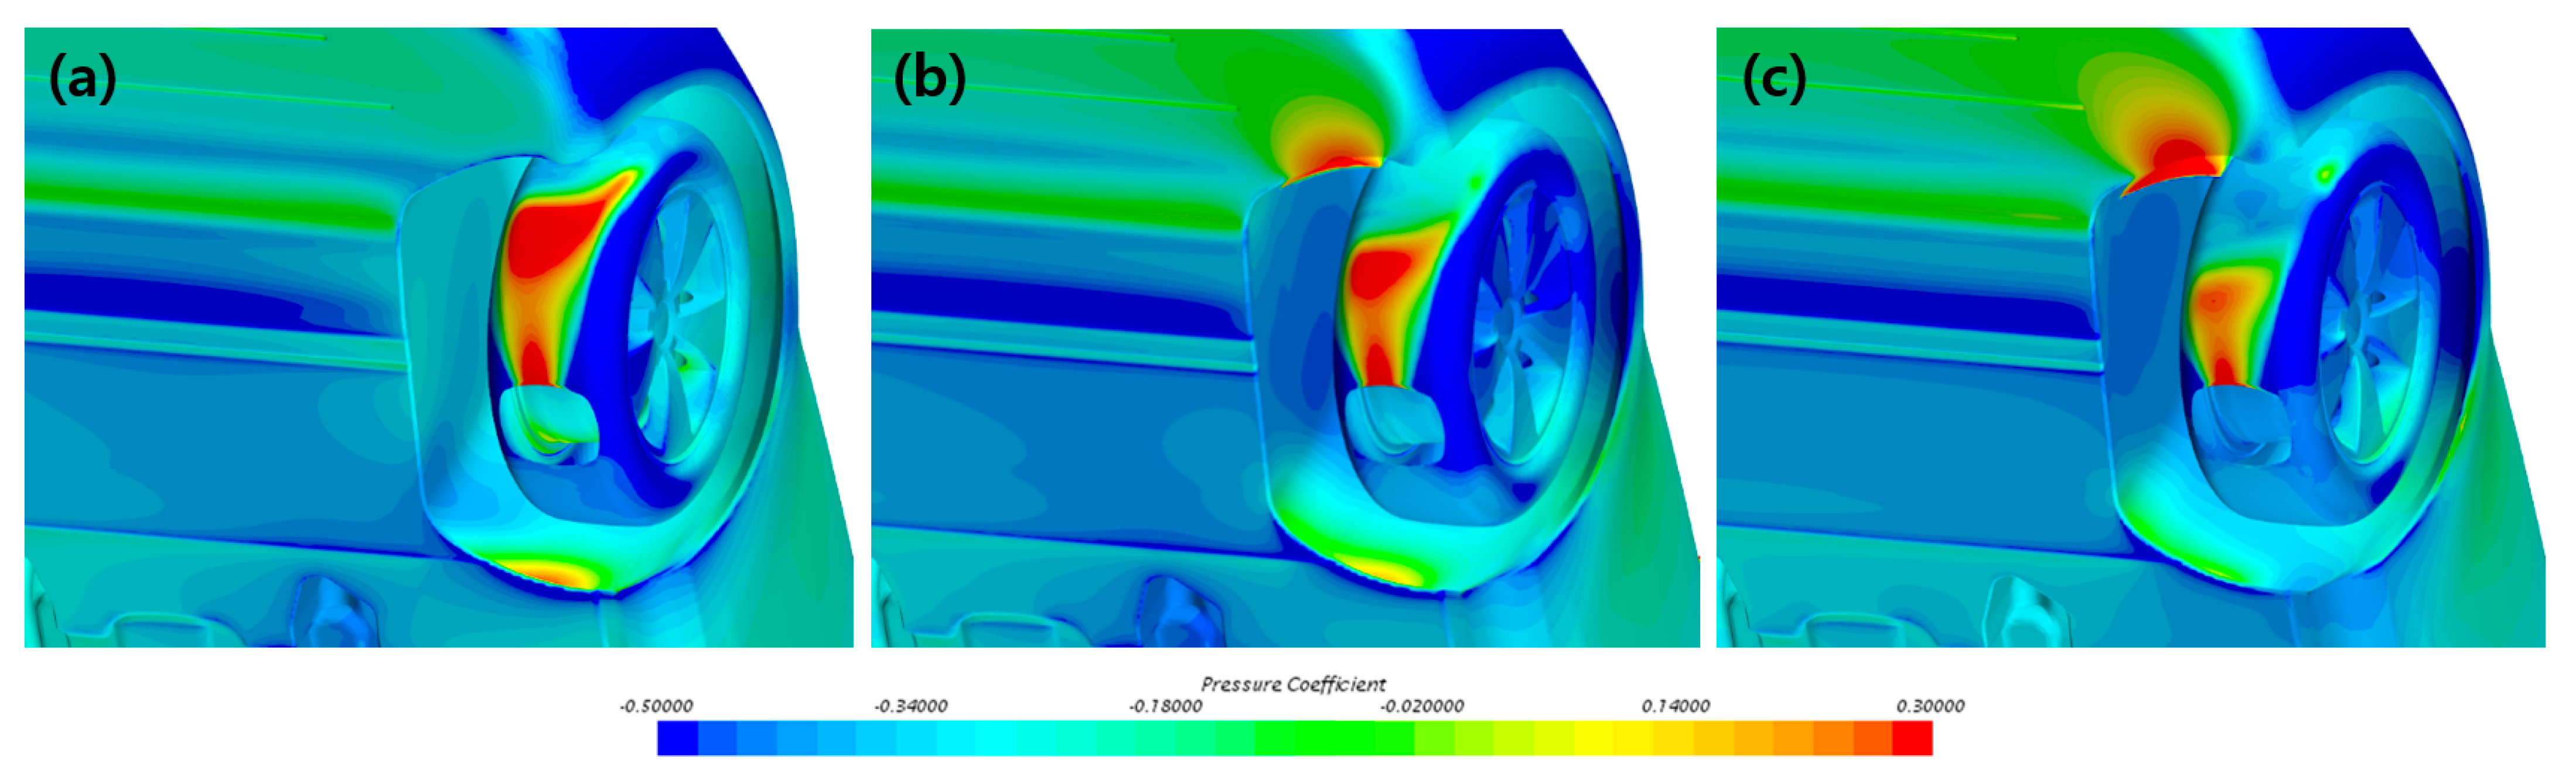
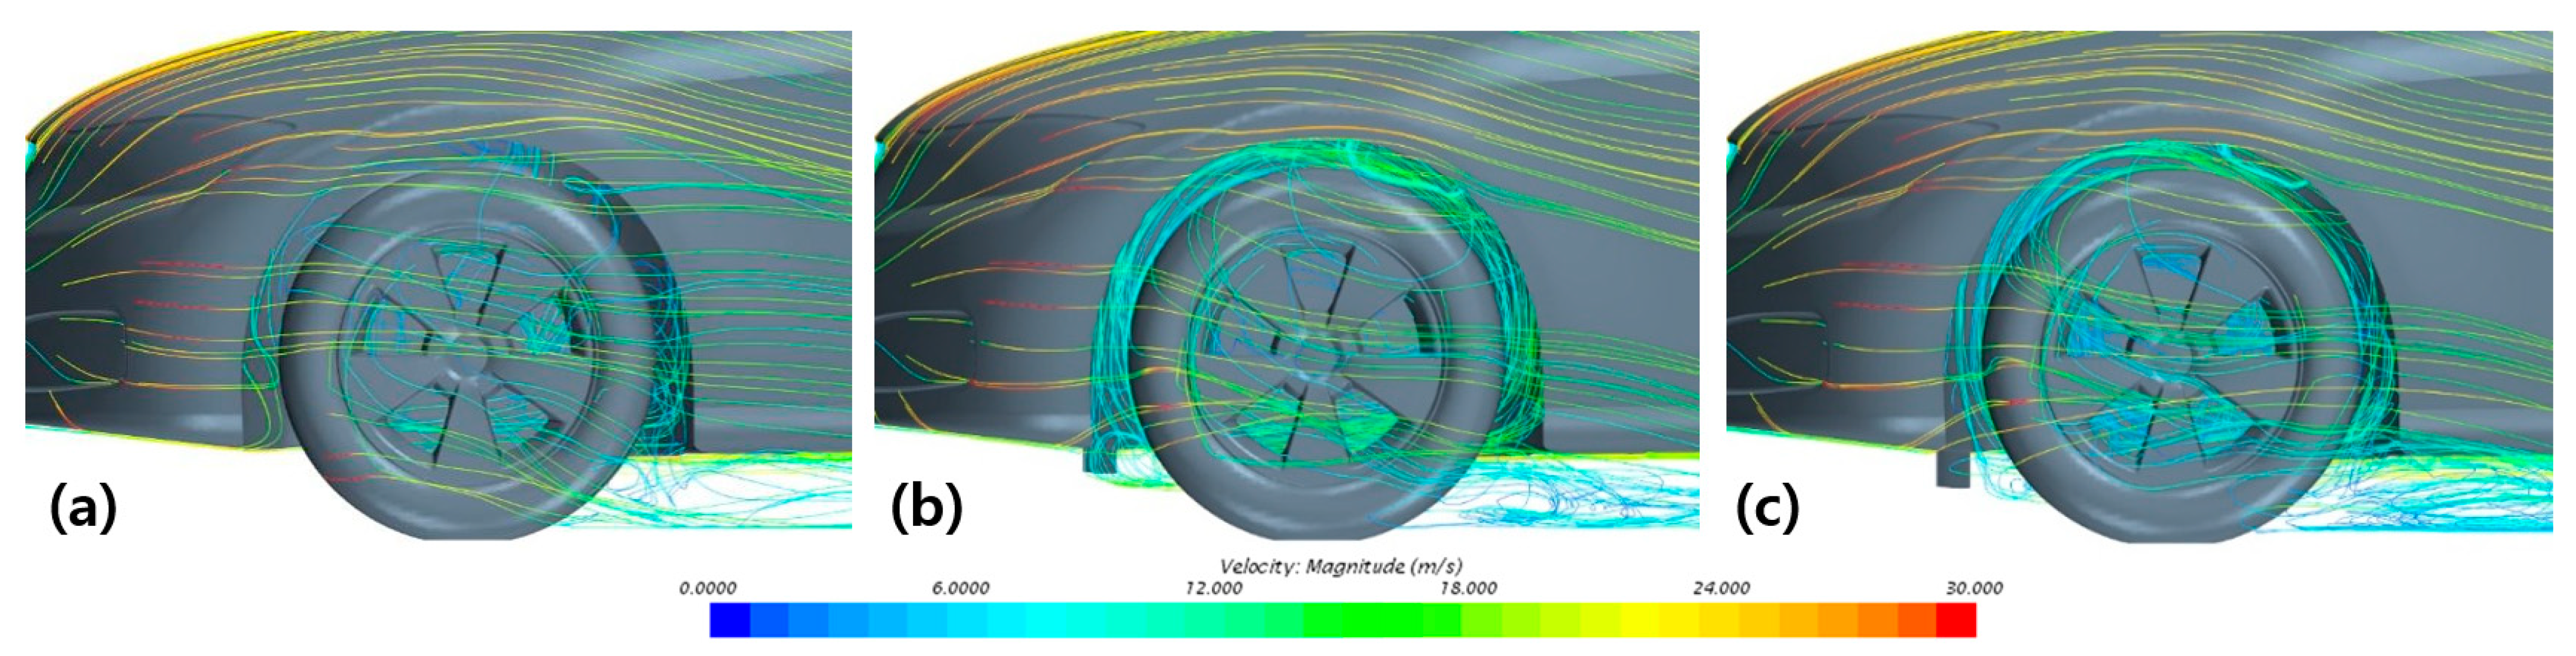
The pressure and streamline distributions associated with different front-wheel air-deflector heights are presented in Figure 15 and Figure 16, respectively. As shown in Figure 15, under the baseline condition, a strong high-pressure region is formed in front of the front wheel and inside the wheelhouse, resulting in a large pressure difference between the front and rear sides of the wheel. When a 30 mm air deflector is installed, part of the high-pressure region that had acted directly on the front wheel is shifted toward the air deflector. Under the 60 mm condition, this effect becomes more pronounced, leading to a reduction in both the high-pressure region on the wheel surface and the associated pressure imbalance. As a result, the pressure drag of the front wheel is reduced. As shown in Figure 16, under the baseline condition, the underbody flow enters the front-wheel wheelhouse directly, generating complex flow separation and recirculation around the wheel. The 30 mm air deflector diverts part of the incoming flow, whereas the 60 mm air deflector more effectively suppresses the inflow entering the wheelhouse inlet, thereby reducing flow disturbance and recirculation around the wheel. Consequently, as the air-deflector height increases, the disturbance of the streamlines and the extent of the recirculation region around the front wheel tend to decrease.
Figure 15.
Pressure-coefficient distributions around the front-left wheel. (a) Base; (b) = 30 mm; (c) = 60 mm.
Figure 16.
Streamline distributions around the front-left wheel. (a) Base; (b) = 30 mm; (c) = 60 mm.
As shown in Table 7, when the yaw angle increased from 0° to 5° for the 60 mm air-deflector configuration, the total-vehicle drag coefficient decreased by approximately 1.2%, from 0.2213 to 0.2186, while the front-left-wheel drag coefficient decreased by approximately 52.3%, from 0.00429 to 0.002045. This reduction is attributed to the change in the inflow direction under crosswind, which enabled the air deflector to more effectively restrict the flow entering the front-wheel region and contributed to a reduction in the pressure difference between the front and rear sides of the wheel. In contrast, the rear-left-wheel drag coefficient increased, suggesting that the combined redistribution of the flow diverted around the front wheel and the crosswind-induced underbody flow increased the pressure imbalance in the rear-wheel region.
Table 7.
Aerodynamic drag coefficients of the 60 mm front-wheel air-deflector configuration at yaw angles of 0° and 5°.
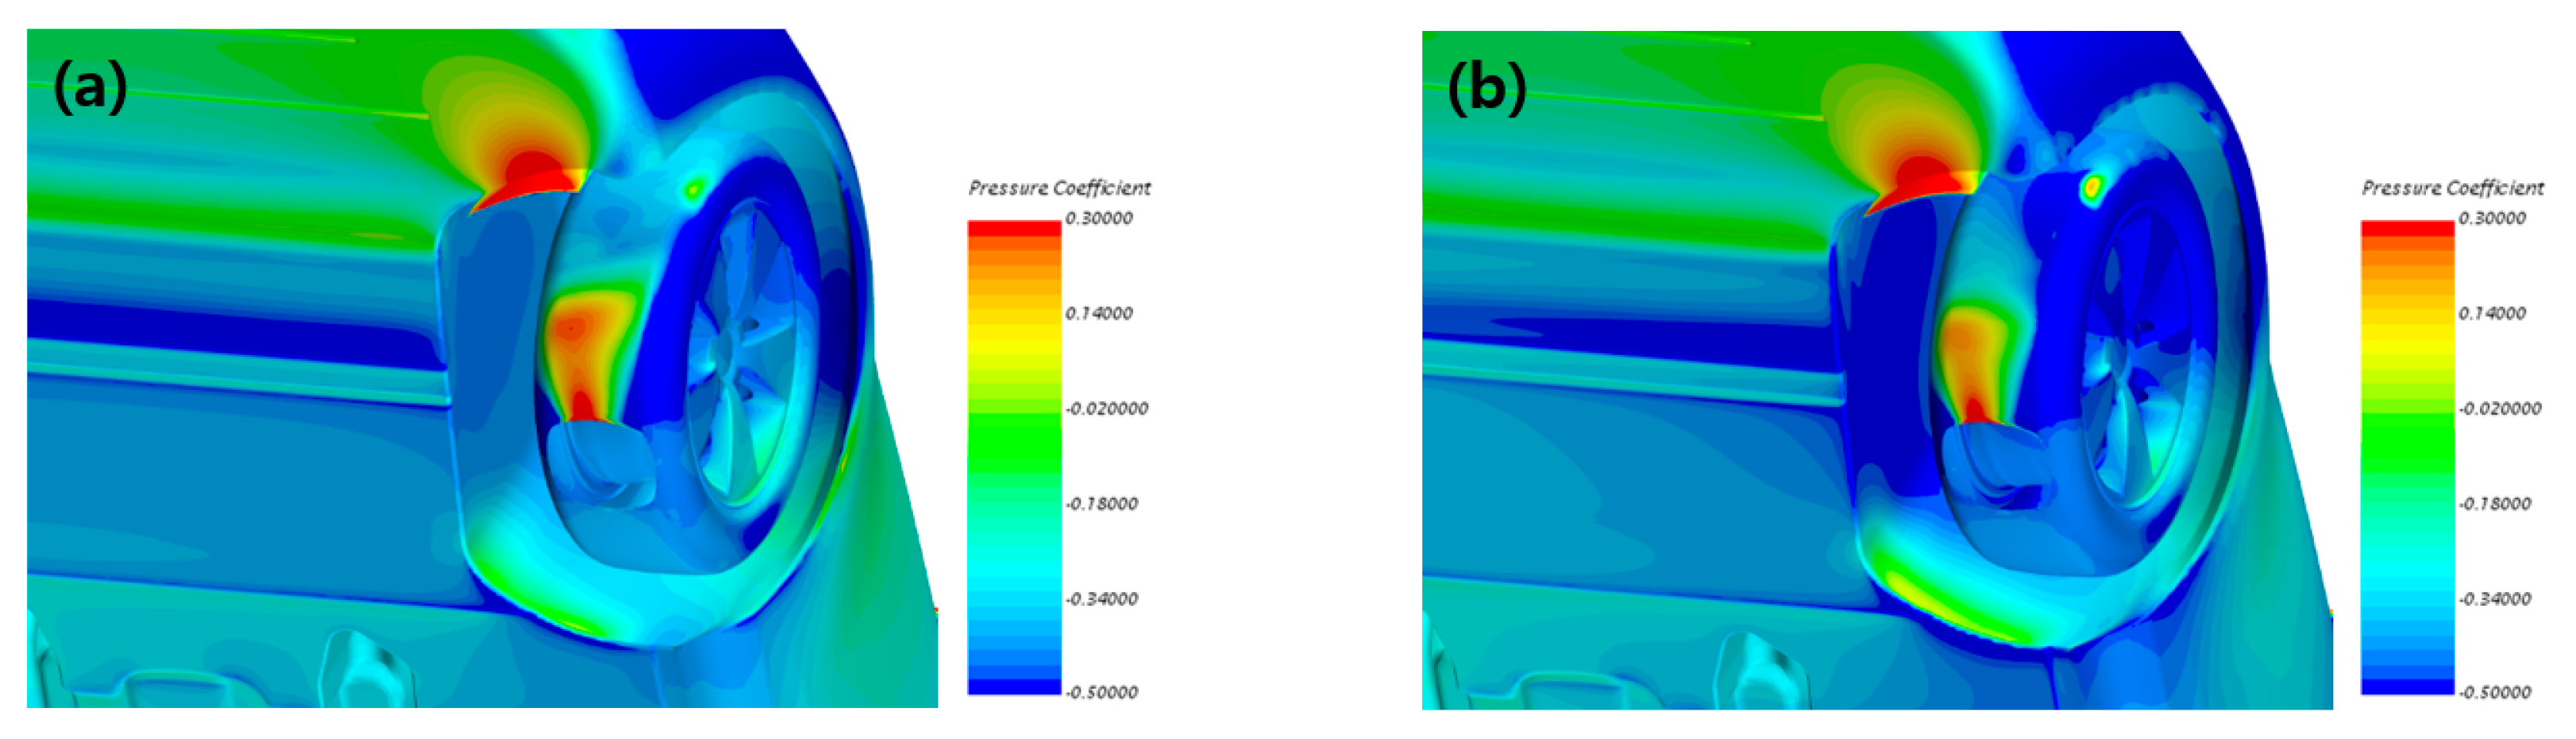
Figure 17 presents the pressure-coefficient distribution over the front-left wheel. Under the 0° condition, high-pressure regions are formed on the front face of the air deflector and in the upper part of the wheelhouse, while a relatively broad region of pressure variation appears over the front-wheel surface. At a yaw angle of 5° under crosswind conditions, the high-pressure stagnation region on the front face of the air deflector becomes more pronounced, whereas the high-pressure region on the front-wheel surface decreases and the low-pressure region expands. Consequently, the pressure difference between the front and rear sides of the wheel is reduced, which is consistent with the substantial decrease in the front-left-wheel drag coefficient reported in Table 7.
Figure 17.
Pressure-coefficient distributions around the front-left wheel. (a) = 60 mm and = 0°; (b) = 60 mm and = 5°.
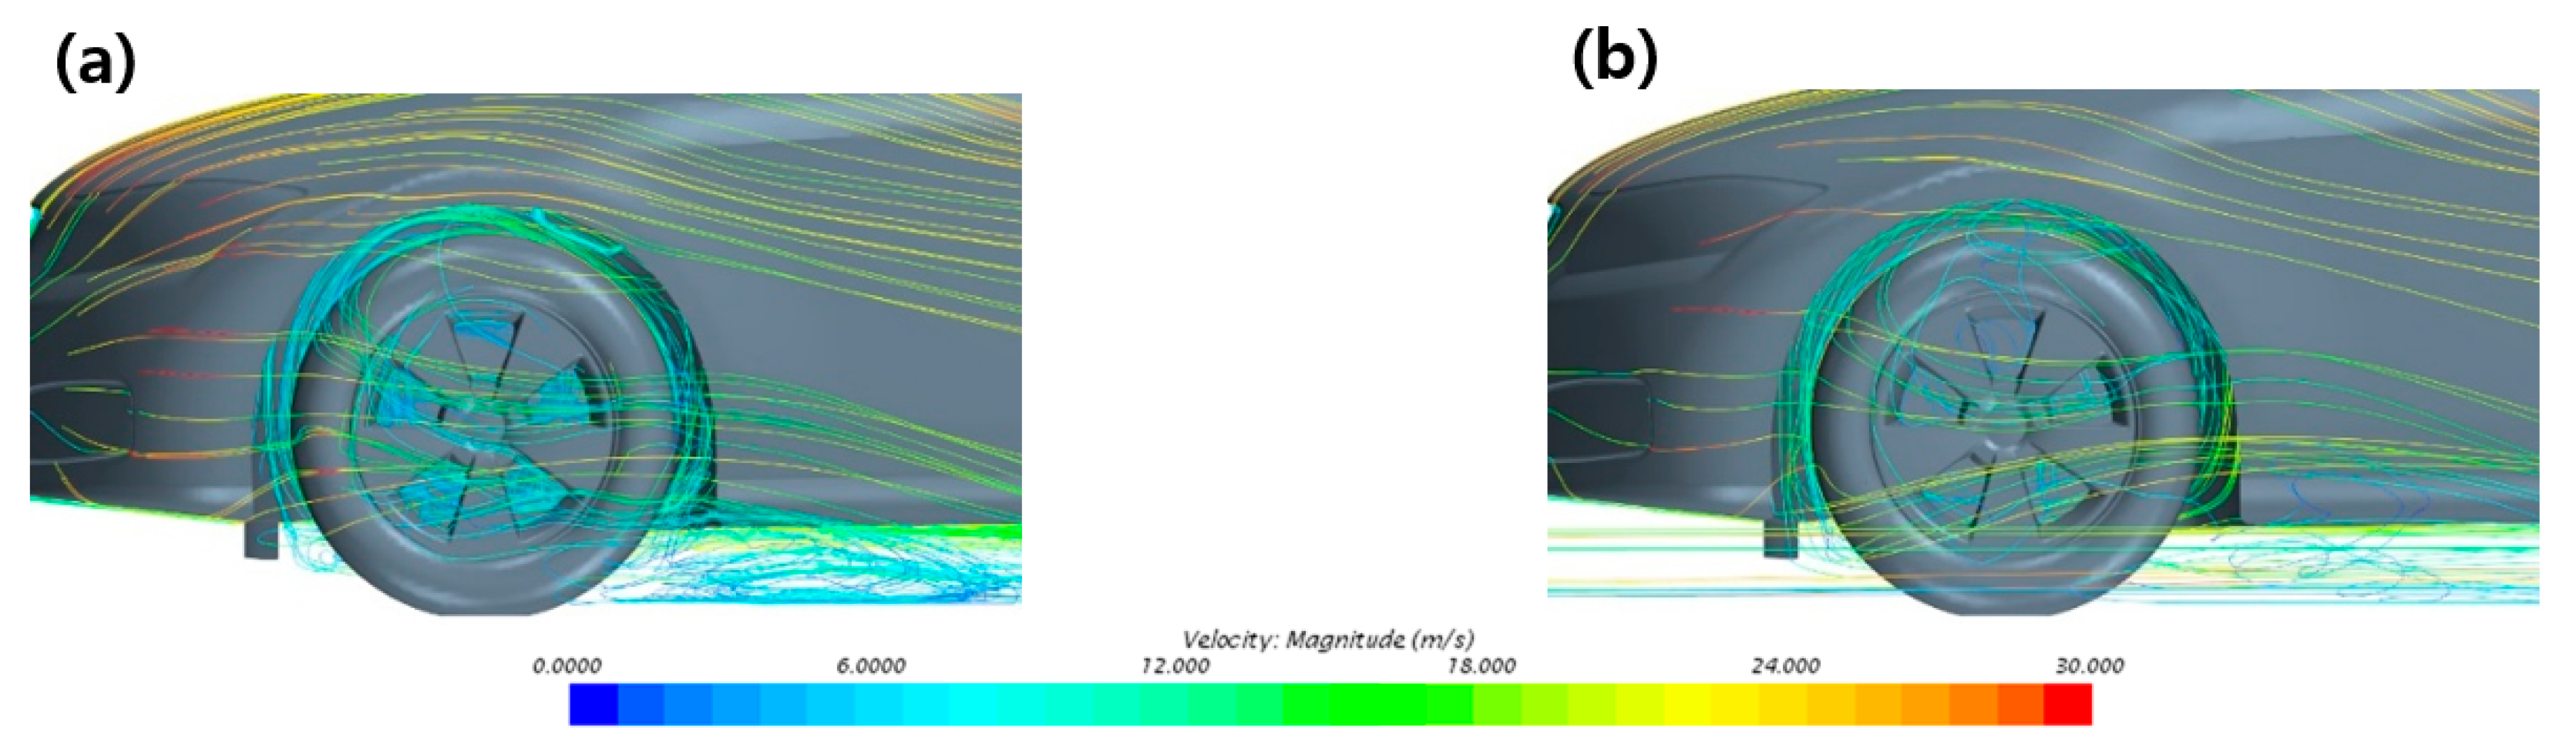
Figure 18 shows the streamline distribution around the front-left wheel. Under the condition of the 60 mm air deflector and a yaw angle of , the underbody flow is diverted by the air deflector toward the outer side and lower part of the front wheel, resulting in relatively complex recirculating flow inside the wheelhouse and behind the tire. When the yaw angle increases to , the streamlines are deflected laterally, and the flow around the front wheel is redistributed, leading to a moderate reduction in both the flow directly impinging on the wheel surface and the recirculating flow inside the wheelhouse. Therefore, the combined effect of crosswind and the air deflector is considered to reduce the front-to-rear pressure difference and flow losses around the front-left wheel, thereby lowering its drag coefficient.
Figure 18.
Streamline distributions around the front-left wheel. (a) = 60 mm and = 0°; (b) = 60 mm and = 5°.
3.4. Effects of Steady-State Two-Vehicle Platooning
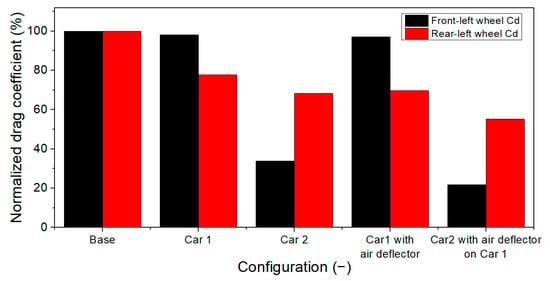
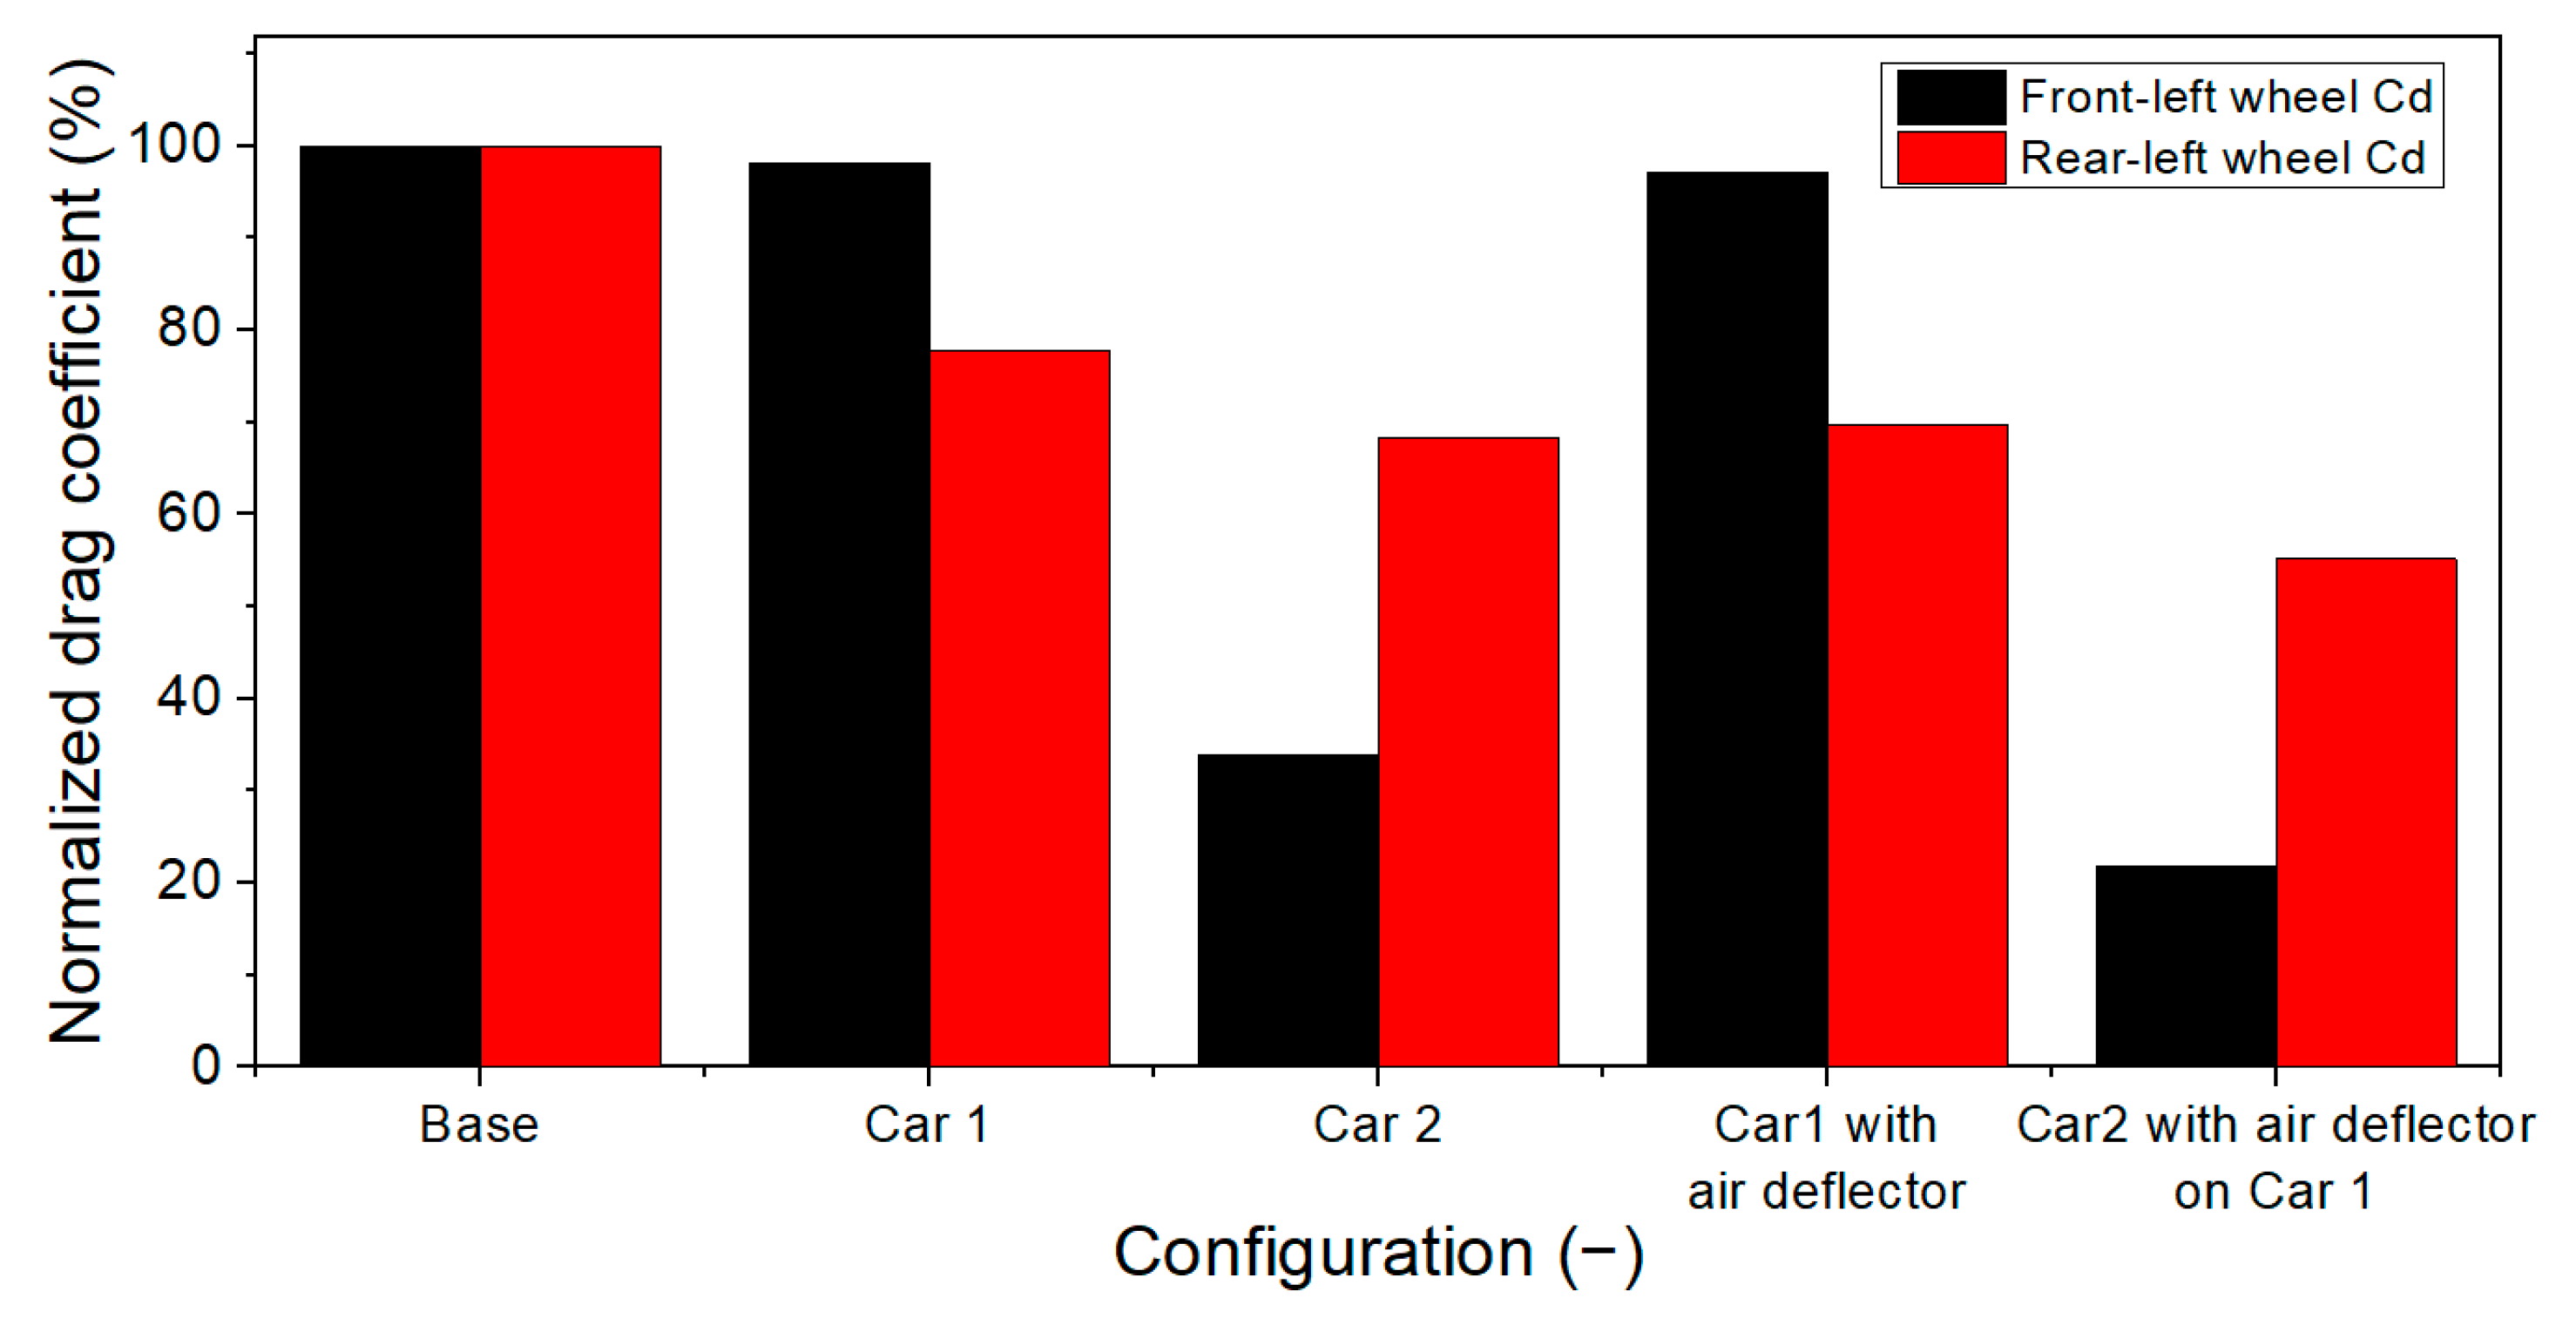
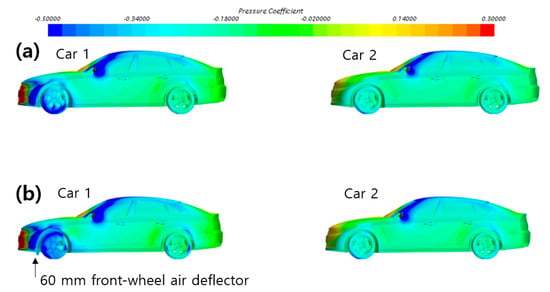
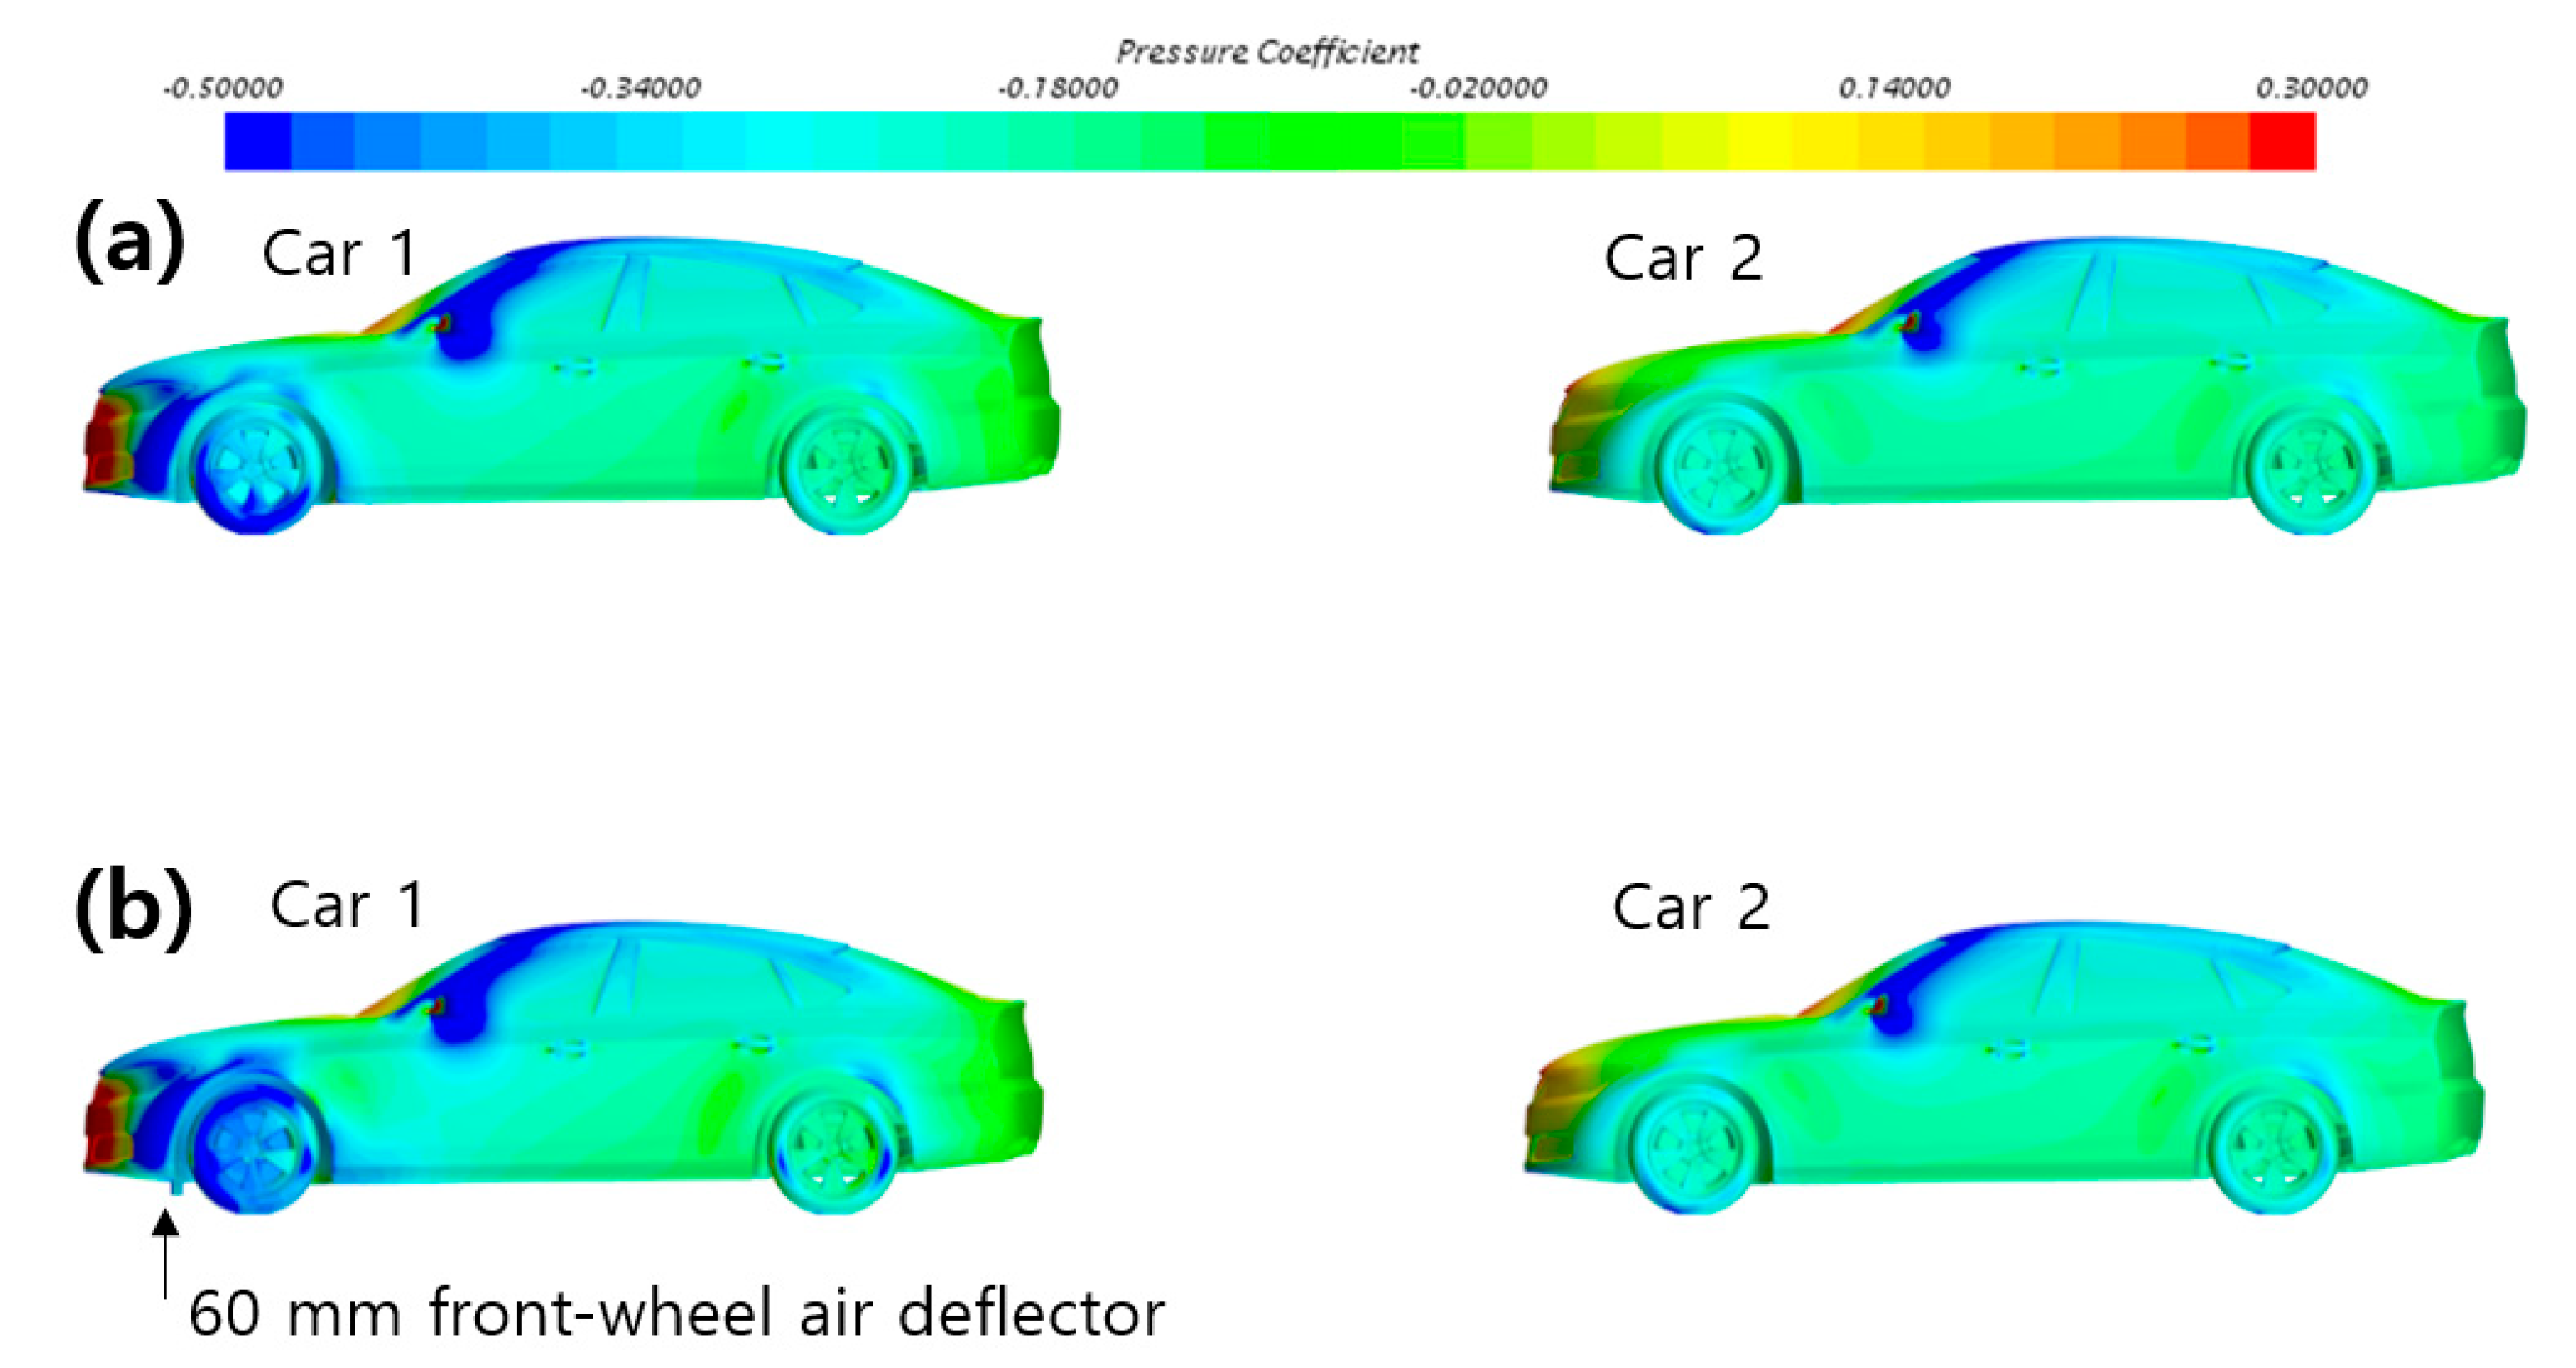
This section analyzes wheel-region aerodynamics under steady-state two-vehicle platooning. Table 8 and Figure 19 compare the drag characteristics of the leading and following vehicles in a platoon with a spacing of , using the isolated vehicle (Base) as the reference, as well as the additional effects of installing a 60 mm air deflector on the leading vehicle. In the authors’ previous study [22], the total-vehicle drag coefficients of the leading and following vehicles under steady-state platooning with an inter-vehicle spacing of were reported as 0.1936 and 0.2283, respectively. The corresponding drag coefficients obtained from the wheel-resolved analysis in the present study were 0.1930 and 0.2285, showing good agreement with the previous results.
Table 8.
Aerodynamic drag coefficients of the platooning vehicles with and without the 60 mm front-wheel air deflector on Car 1.
Figure 19.
Front-left- and rear-left-wheel drag coefficients normalized by the isolated-vehicle values under two-vehicle platooning conditions.
As shown in Figure 19, the drag coefficients of the front-left and rear-left wheels of the following vehicle decreased by 66.0% and 31.6%, respectively, relative to the isolated-vehicle condition. When the 60 mm front-wheel air deflector was installed on the leading vehicle, the drag coefficients of the front-left and rear-left wheels of the following vehicle were further reduced by 35.5% and 19.3%, respectively, compared with the platooning condition without the air deflector. In contrast, the additional reduction in the total drag of the leading vehicle was limited. This result is attributed to the air deflector on the leading vehicle modifying not only the local flow around its front wheels but also the velocity and pressure distributions in the vehicle wake, thereby reducing the momentum of the flow entering the wheels of the following vehicle and the corresponding front-to-rear pressure difference. Therefore, under platooning conditions, the air deflector on the leading vehicle produced only a limited additional benefit in terms of the leading vehicle’s total drag, while yielding relatively large additional reductions in the drag of the left-side wheels of the following vehicle.
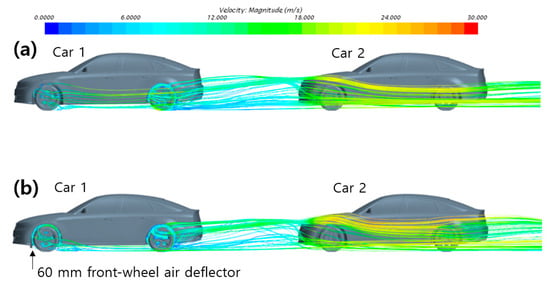
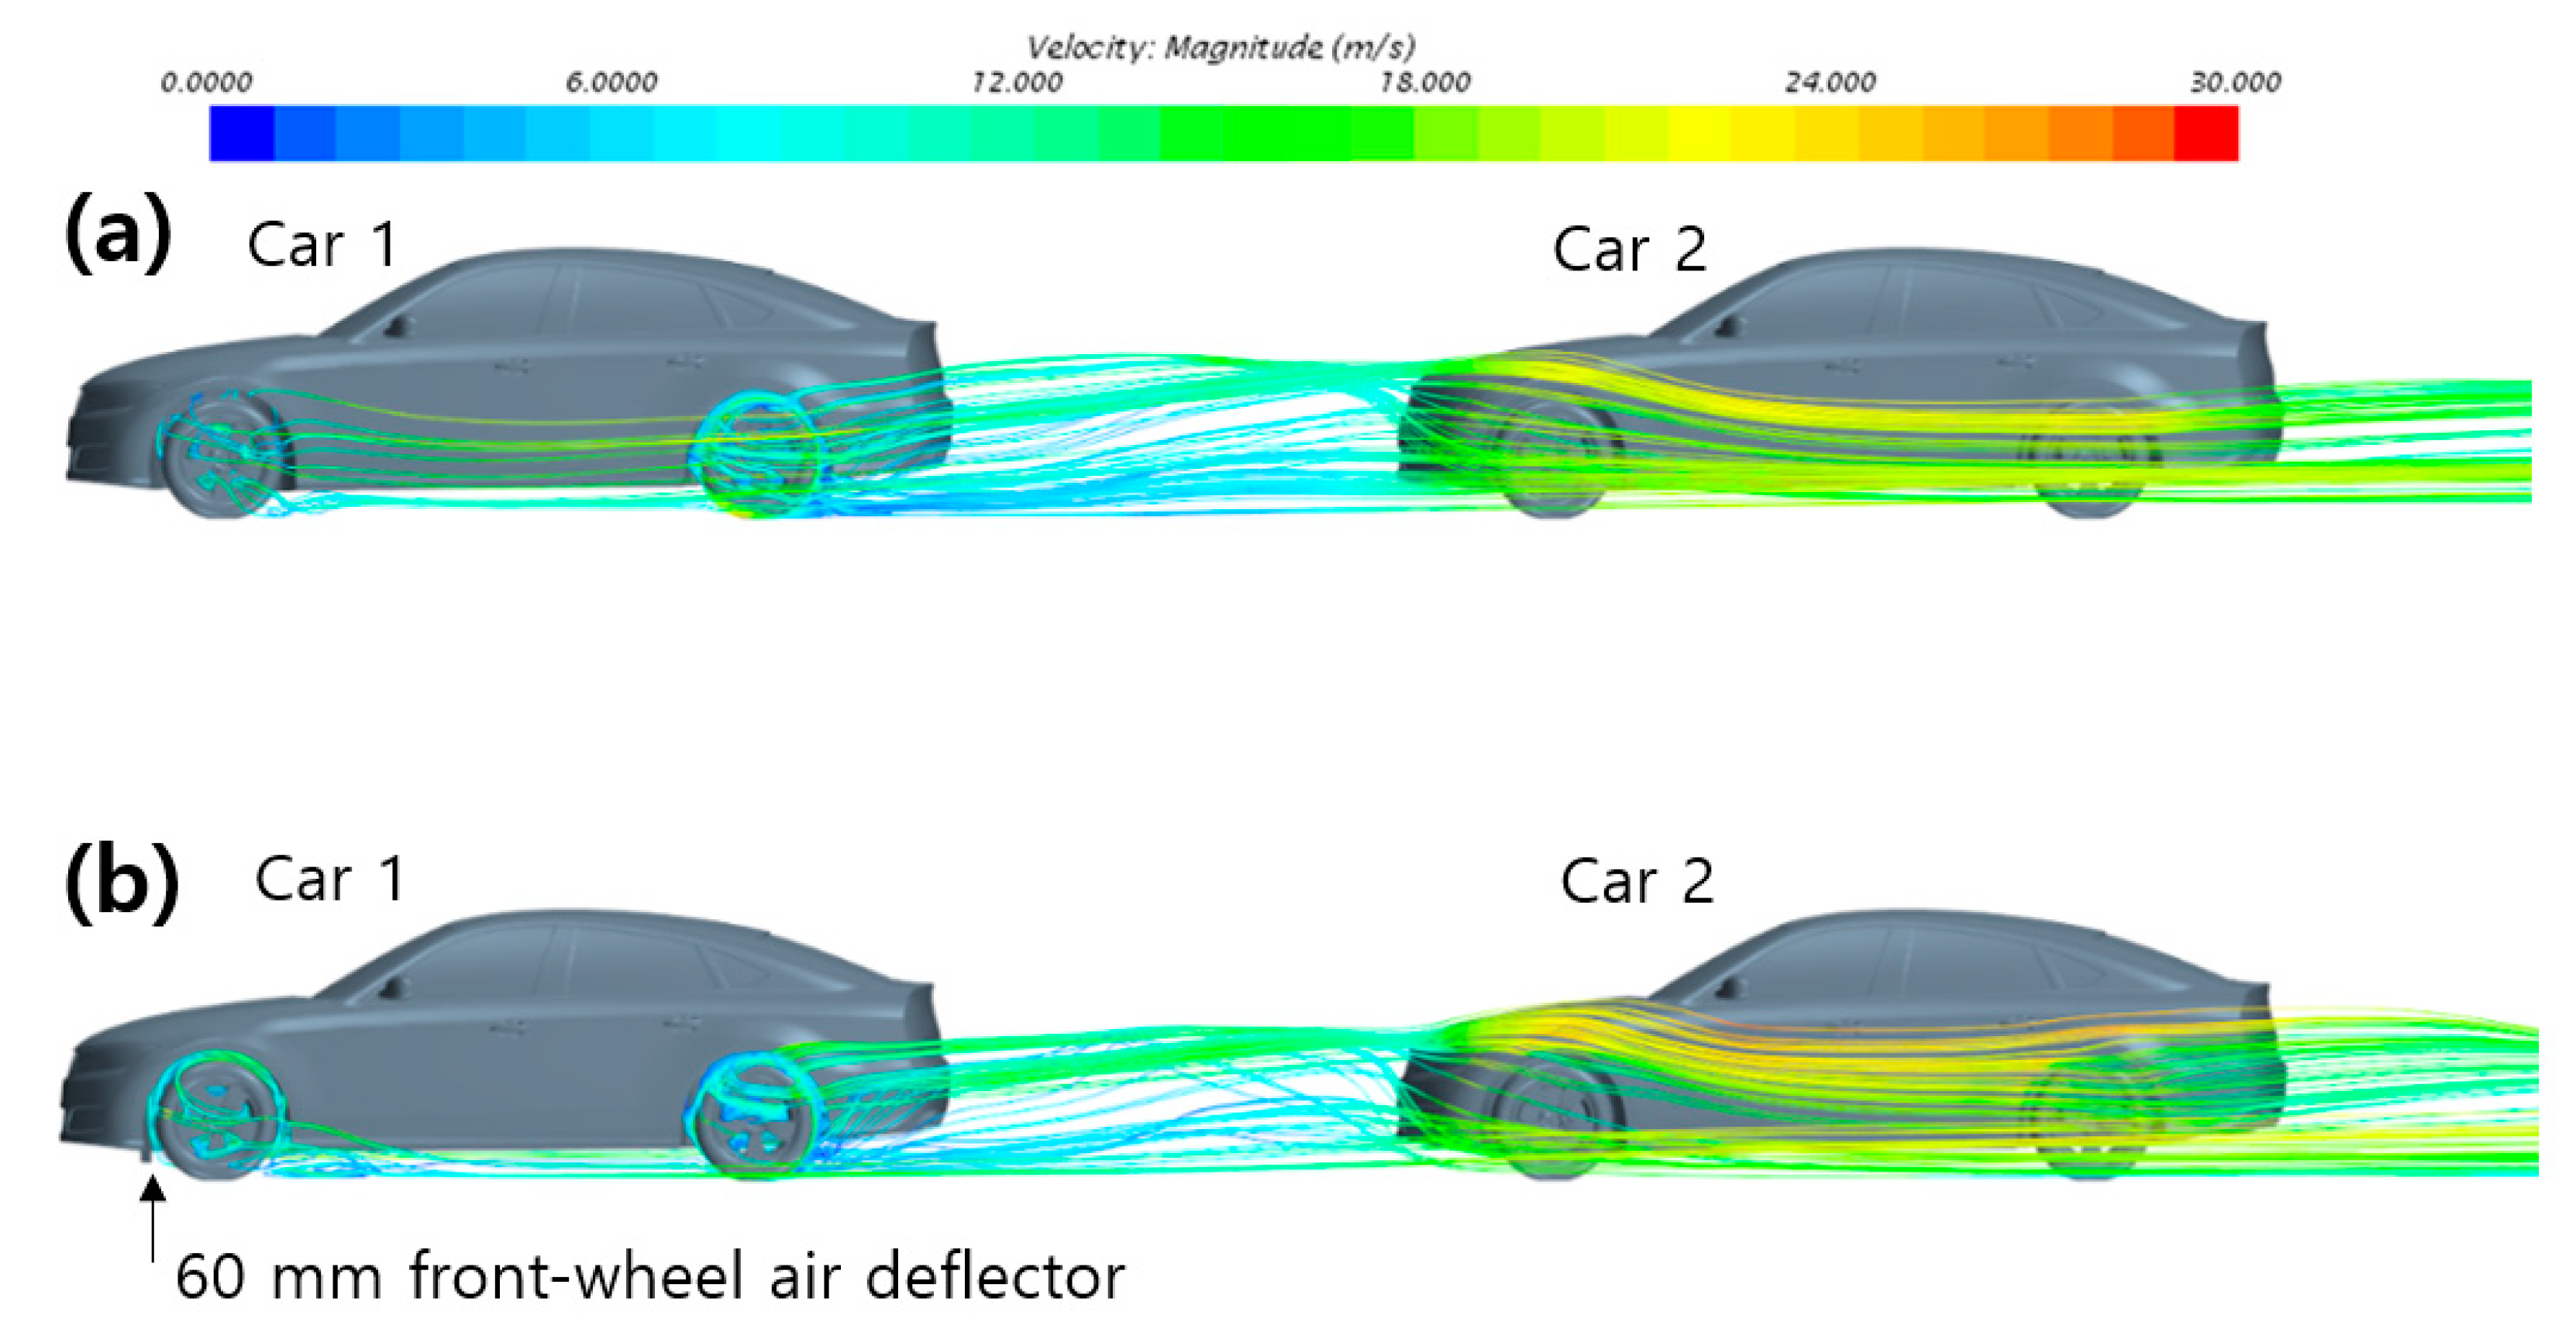
Figure 20 and Figure 21 present the streamline distributions around the platooning vehicles and the surface pressure-coefficient distributions, respectively. In Figure 20a, which represents the case without an air deflector, the disturbed flow generated around the front wheels and underbody of Car 1 spreads broadly downstream, and this wake flows directly into the front and wheel regions of Car 2. In contrast, in Figure 20b, where a 60 mm front-wheel air deflector is installed on Car 1, the underbody flow entering the front-wheel wheelhouse is diverted, thereby altering the streamline structure and momentum distribution in the wake of Car 1. These qualitative flow-field differences are consistent with the additional reductions in the front-left- and rear-left-wheel drag coefficients of Car 2 by 35.5% and 19.3%, respectively. However, because velocity deficit, turbulent kinetic energy, and wake-plane pressure recovery were not quantitatively evaluated, the detailed wake-transfer mechanism cannot be conclusively determined from the present results. In other words, the air deflector on Car 1 provides a drag-reduction benefit not only for the leading vehicle itself but also for the wheel regions of the following vehicle through modification of the wake.
Figure 20.
Streamline distributions around the two vehicles in the platoon. (a) without the 60 mm front-wheel air deflector on Car 1; (b) with the 60 mm front-wheel air deflector on Car 1.
Figure 21.
Surface pressure-coefficient distributions on the two vehicles in the platoon. (a) without the 60 mm front-wheel air deflector on Car 1; (b) with the 60 mm front-wheel air deflector on Car 1.
Compared with Figure 21a, where no air deflector is installed, Figure 21b, in which a 60 mm front-wheel air deflector is applied to Car 1, shows that the redistribution of the front-wheel and underbody flow changes the pressure distribution in the wake of Car 1 and in the region between the two vehicles, while the pressure distribution around the front of Car 2 also appears to be redistributed. These changes in the pressure field are consistent with reductions in the total drag of the following vehicle as well as the drag of its front and rear wheels. A quantitative wake-plane analysis will be required to establish the relationship between the modified wake of Car 1 and the aerodynamic loads on Car 2.
4. Conclusions
In this study, the wheel-region aerodynamics of a detailed DrivAer fastback model were investigated using a steady-state RANS framework under varying inflow speeds, progressive spoke closure, crosswind, front-wheel air deflector, and steady-state platooning conditions. The major findings are summarized as follows.
- (1)
- Variations in inflow speed affected the flow-separation and recirculation structures inside the front-wheel cavity; however, the total-vehicle drag coefficient, , remained relatively stable within the range of 0.2416–0.2463. Progressive wheel-spoke closure also altered the local pressure distribution inside the wheel cavity, but the resulting variation in total-vehicle drag remained within 0.7% of the baseline condition.
- (2)
- Under crosswind conditions, the lateral deflection of the underbody flow and shielding effects between the wheels produced pronounced left–right asymmetry in the drag of the individual wheels. Although the total-vehicle decreased with increasing yaw angle, the drag coefficients of the individual wheels exhibited nonlinear and non-monotonic variations owing to the redistribution of underbody momentum and the shielding effects of the upstream wheels.
- (3)
- When 60 mm air deflectors were installed ahead of both front wheels, the total-vehicle decreased by 9.6% to 0.2213, while the front-left-wheel drag coefficient decreased by 70.8%. The drag-reduction effect generally increased with air-deflector height; however, the incremental improvement diminished between 50 and 60 mm, indicating that the drag-reduction benefit approached saturation. This behavior was attributed to the suppression of the principal underbody flow entering the front-wheel and wheelhouse regions.
- (4)
- When the 60 mm air deflectors were evaluated at a yaw angle of , the total-vehicle decreased further from 0.2213 under the zero-yaw condition to 0.2186, while the front-left-wheel drag coefficient decreased to 0.002045. In contrast, the rear-left-wheel drag coefficient increased, confirming that the aerodynamic influence of the air deflector differed between the front and rear wheels under crosswind conditions.
- (5)
- Under steady-state platooning with an inter-vehicle spacing of , the front-left- and rear-left-wheel drag coefficients of the following vehicle decreased by 66.0% and 31.6%, respectively, relative to the isolated-vehicle condition. Furthermore, installing a 60 mm air deflector on the leading vehicle produced additional reductions of 35.5% and 19.3% in the front-left- and rear-left-wheel drag coefficients of the following vehicle, respectively, compared with the platooning condition without the air deflector. These results demonstrate that front-wheel flow control on the leading vehicle can also exert a pronounced influence on the aerodynamic characteristics of the wheels of the following vehicle.
Overall, for the 1:2.5-scale DrivAer fastback geometry and the numerical conditions examined in this study, direct control of the wheel-arch inflow produced a larger reduction in total-vehicle drag than the tested spoke-closure variations. The reported trends are specific to the investigated inflow-speed range, yaw angles of 0–20°, air-deflector geometry, and two-vehicle platooning configuration with a spacing of , and should not be generalized to other vehicle geometries or operating conditions without further validation.
The present study has several limitations. First, steady-state RANS provides only the time-averaged flow field and therefore cannot resolve unsteady vortex shedding or transient responses to gusts. Second, the crosswind analysis focused on the longitudinal drag component, whereas a complete stability assessment would require the evaluation of side force, lift, roll moment, and yawing moment. Therefore, the present crosswind results should be interpreted only in terms of longitudinal drag characteristics and not as a complete assessment of crosswind stability. Third, only one vehicle geometry, one steady-state platooning spacing, and fixed air-deflector angle, longitudinal position, width, thickness, ground clearance, and wheelhouse geometry were considered. Fourth, although the numerical framework was validated using the total-vehicle drag coefficient, the wheel-resolved forces and local wheel-region pressure and flow fields were not independently validated against experimental data. Future work should further assess the reliability of the relatively small wheel drag coefficients through independent repeat simulations and quantitative uncertainty analysis. In addition, exact Reynolds number similarity between the 1:2.5-scale computational model and a full-scale vehicle was not maintained, which should be considered when extrapolating the present quantitative results to full-scale conditions. Accordingly, the conclusions of the present study should be interpreted primarily in terms of relative aerodynamic trends within the scaled configuration. Although the qualitative flow-control mechanisms may remain relevant at full scale, this has not yet been verified. The absolute drag coefficients and optimum air-deflector dimensions may differ because exact Reynolds number similarity is not maintained. Full-scale or Reynolds-matched validation is therefore required for quantitative extrapolation. Finally, the rotating-wall treatment applied to the fixed non-axisymmetric spoke geometry constitutes a major technical limitation because it does not fully represent physical wheel rotation. Consequently, the predicted wheel-resolved forces and local wheelhouse-flow structures should be regarded primarily as qualitative, high-level trends rather than quantitatively definitive results.
Author Contributions
Conceptualization, T.Z.; writing—original draft preparation, T.Z.; methodology—software, Q.-Y.C.; writing—review and editing, T.Z. and G.-S.L.; supervision, G.-S.L. All authors have read and agreed to the published version of the manuscript.
Funding
This research was supported by the Anchor Program for Regional Talent Development (ANCHOR) through the Institute for Regional Innovation System & Education in Busan Metropolitan City, funded by the Ministry of Education (MOE) and the Busan Metropolitan City, Republic of Korea. (2026-ANCHOR-02-007-004).
Data Availability Statement
The raw data supporting the conclusions of this article will be made available by the authors on request.
Conflicts of Interest
The authors declare no conflicts of interest.
References
- Hucho, W.H.; Sovran, G. Aerodynamics of Road Vehicles. Annu. Rev. Fluid Mech. 1993, 25, 485–537. [Google Scholar] [CrossRef]
- Mercker, E.; Breuer, N.; Berneburg, H.; Emmelmann, H.J. On the Aerodynamic Interference Due to the Rolling Wheels of Passenger Cars. In Proceedings of the International Congress & Exposition, Detroit, MI, USA, 25 February 1991. SAE Technical Paper 910311. [Google Scholar] [CrossRef] [Scilit] [PubMed]
- Wickern, G.; Zwicker, K.; Pfadenhauer, M. Rotating Wheels—Their Impact on Wind Tunnel Test Techniques and on Vehicle Drag Results. In Proceedings of the SAE International Congress and Exposition, Detroit, MI, USA, 24 February 1997. SAE Technical Paper 970133. [Google Scholar] [CrossRef] [Scilit]
- Wang, Y.; Sicot, C.; Borée, J.; Grandemange, M. Experimental Study of Wheel–Vehicle Aerodynamic Interactions. J. Wind Eng. Ind. Aerodyn. 2020, 198, 104062. [Google Scholar] [CrossRef] [Scilit]
- Wäschle, A. The Influence of Rotating Wheels on Vehicle Aerodynamics—Numerical and Experimental Investigations. In Proceedings of the SAE World Congress & Exhibition, Detroit, MI, USA, 16 April 2007. SAE Technical Paper 2007-01-0107. [Google Scholar] [CrossRef] [Scilit]
- Regert, T.; Lajos, T. Description of Flow Field in the Wheelhouses of Cars. Int. J. Heat Fluid Flow 2007, 28, 616–629. [Google Scholar] [CrossRef] [Scilit]
- Nabutola, K.L.; Boetcher, S.K.S. On the Validation of Turbulence Models for Wheel and Wheelhouse Aerodynamics. J. Verif. Valid. Uncertain. Quantif. 2021, 6, 021006. [Google Scholar] [CrossRef] [Scilit]
- Brandt, A.; Berg, H.; Bolzon, M.; Josefsson, L. The Effects of Wheel Design on the Aerodynamic Drag of Passenger Vehicles. SAE Int. J. Adv. Curr. Pract. Mobil. 2019, 1, 1279–1299. [Google Scholar] [CrossRef] [Scilit]
- Vdovin, A.; Löfdahl, L.; Sebben, S. Investigation of Wheel Aerodynamic Resistance of Passenger Cars. SAE Int. J. Passeng. Cars—Mech. Syst. 2014, 7, 639–645. [Google Scholar] [CrossRef] [Scilit]
- Landström, C.; Walker, T.; Christoffersen, L.; Löfdahl, L. Influences of Different Front and Rear Wheel Designs on Aerodynamic Drag of a Sedan Type Passenger Car. In Proceedings of the SAE 2011 World Congress & Exhibition, Detroit, MI, USA, 12 April 2011. SAE Technical Paper 2011-01-0165. [Google Scholar] [CrossRef] [Scilit]
- Bolzon, M.D.P.; Sebben, S.; Broniewicz, A. Effects of Wheel Configuration on the Flow Field and the Drag Coefficient of a Passenger Vehicle. Int. J. Automot. Technol. 2019, 20, 763–777. [Google Scholar] [CrossRef] [Scilit]
- Gleason, M.E.; Duncan, B.; Walter, J.; Guzman, A.; Cho, Y.-C. Comparison of Computational Simulation of Automotive Spinning Wheel Flow Field with Full Width Moving Belt Wind Tunnel Results. SAE Int. J. Passeng. Cars—Mech. Syst. 2015, 8, 275–293. [Google Scholar] [CrossRef] [Scilit]
- Guilmineau, E.; Chikhaoui, O.; Deng, G.B.; Visonneau, M. Cross Wind Effects on a Simplified Car Model by a DES Approach. Comput. Fluids 2013, 78, 29–40. [Google Scholar] [CrossRef] [Scilit]
- Meile, W.; Ladinek, T.; Brenn, G.; Reppenhagen, A.; Fuchs, A. Non-Symmetric Bi-Stable Flow around the Ahmed Body. Int. J. Heat Fluid Flow 2016, 57, 34–47. [Google Scholar] [CrossRef] [Scilit]
- Iinuma, Y.; Taniguchi, K.; Oshima, M. Aerodynamics Development for a New EV Hatchback Considering Crosswind Sensitivity. Presented at the WCX World Congress Experience, Detroit, MI, USA, 10 April 2018. SAE Technical Paper 2018-01-0715. [Google Scholar] [CrossRef] [Scilit]
- Sebben, S. Numerical Simulations of a Car Underbody: Effect of Front-Wheel Deflectors. In Proceedings of the SAE 2004 World Congress & Exhibition, Detroit, MI, USA, 8 March 2004. SAE Technical Paper 2004-01-1307. [Google Scholar] [CrossRef] [Scilit]
- Nabutola, K.L.; Boetcher, S.K.S. Assessment of Conventional and Air-Jet Wheel Deflectors for Drag Reduction of the DrivAer Model. Adv. Aerodyn. 2021, 3, 29. [Google Scholar] [CrossRef] [Scilit]
- Zabat, M.; Frascaroli, S.; Browand, F.K. Drag Measurements on 2, 3 and 4 Car Platoons. In Proceedings of the International Congress & Exposition, Detroit, MI, USA, 28 February 1994. SAE Technical Paper 940421. [Google Scholar] [CrossRef] [Scilit]
- Ebrahim, H.; Dominy, R.; Martin, N. Aerodynamics of Electric Cars in Platoon. Proc. Inst. Mech. Eng. Part D J. Automob. Eng. 2021, 235, 1396–1408. [Google Scholar] [CrossRef] [Scilit]
- Ebrahim, H.; Dominy, R. The Effect of Afterbody Geometry on Passenger Vehicles in Platoon. Energies 2021, 14, 7553. [Google Scholar] [CrossRef] [Scilit]
- Kim, W.; Noh, J.; Lee, J. Effects of Vehicle Type and Inter-Vehicle Distance on Aerodynamic Characteristics during Vehicle Platooning. Appl. Sci. 2021, 11, 4096. [Google Scholar] [CrossRef] [Scilit]
- Zhang, T.; Chen, Q.-Y.; Kwon, S.-J.; Lee, G.-S. Analysis of Aerodynamic Behavior in Overtaking Maneuvers Within Vehicle Platooning. Modelling 2026, 7, 56. [Google Scholar] [CrossRef] [Scilit]
- Heft, A.I.; Indinger, T.; Adams, N.A. Experimental and Numerical Investigation of the DrivAer Model. In Proceedings of the ASME 2012 Fluids Engineering Division Summer Meeting, Rio Grande, PR, USA, 8–12 July 2012; Volume 1, Parts A and B. pp. 41–51. [Google Scholar] [CrossRef] [Scilit]
- Shih, T.-H.; Liou, W.W.; Shabbir, A.; Yang, Z.; Zhu, J. A New - Eddy Viscosity Model for High Reynolds Number Turbulent Flows. Comput. Fluids 1995, 24, 227–238. [Google Scholar] [CrossRef] [Scilit]
- BETA CAE Systems. ANSA, Version 23.1.0; BETA CAE Systems: Root, Switzerland, 2022.
- Siemens Digital Industries Software. Simcenter STAR-CCM+, Version 2021.1; Siemens Digital Industries Software: Plano, TX, USA, 2021.

Disclaimer/Publisher’s Note: The statements, opinions and data contained in all publications are solely those of the individual author(s) and contributor(s) and not of MDPI and/or the editor(s). MDPI and/or the editor(s) disclaim responsibility for any injury to people or property resulting from any ideas, methods, instructions or products referred to in the content. |
© 2026 by the authors. Licensee MDPI, Basel, Switzerland. This article is an open access article distributed under the terms and conditions of the Creative Commons Attribution (CC BY) license.