


Abstract
To address the challenges in remote monitoring of power system secondary equipment, including dispersed multi-source heterogeneous corpora, inconsistent terminology, non-standardized expressions, unstable knowledge granularity, and fragmented evidence retrieval, a knowledge-organized and retrieval-augmented intelligent decision-making model is proposed in this paper. First, heterogeneous textual resources, including defect records, standards and operating procedures, maintenance logs, typical cases, and abnormal operation reports, are transformed into retrievable, reusable, and traceable knowledge units through text cleaning, terminology normalization, semantic chunking, and metadata annotation. Monitoring issues are then uniformly represented and modeled as structured retrieval requests. A hybrid retrieval scheme is further developed by integrating keyword retrieval, vector retrieval, hierarchical index backtracking, and unified re-ranking. On this basis, an evidence-constrained retrieval-augmented output mechanism is introduced to generate structured results containing anomaly assessment, evidence-based interpretation, handling recommendations, and source traceability, thereby forming an intelligent auxiliary analysis workflow with expert-system-oriented support for duty-operation scenarios. Results show that the proposed model improves evidence retrieval over baseline retrieval settings and achieves better assisted-analysis performance than direct LLM output and conventional RAG. It effectively improves evidence matching accuracy, completeness of evidence organization, and stability of source traceability, indicating its scenario-level feasibility for intelligent auxiliary analysis and decision-support tasks in remote monitoring of power system secondary equipment.
1. Introduction
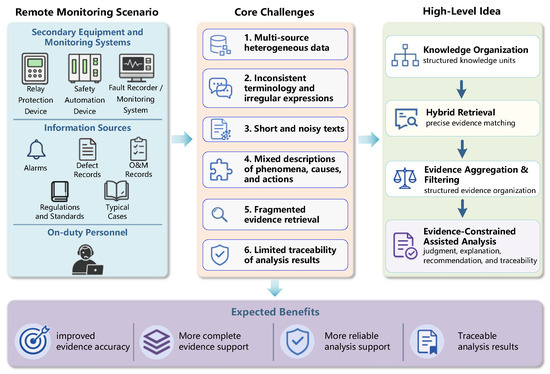
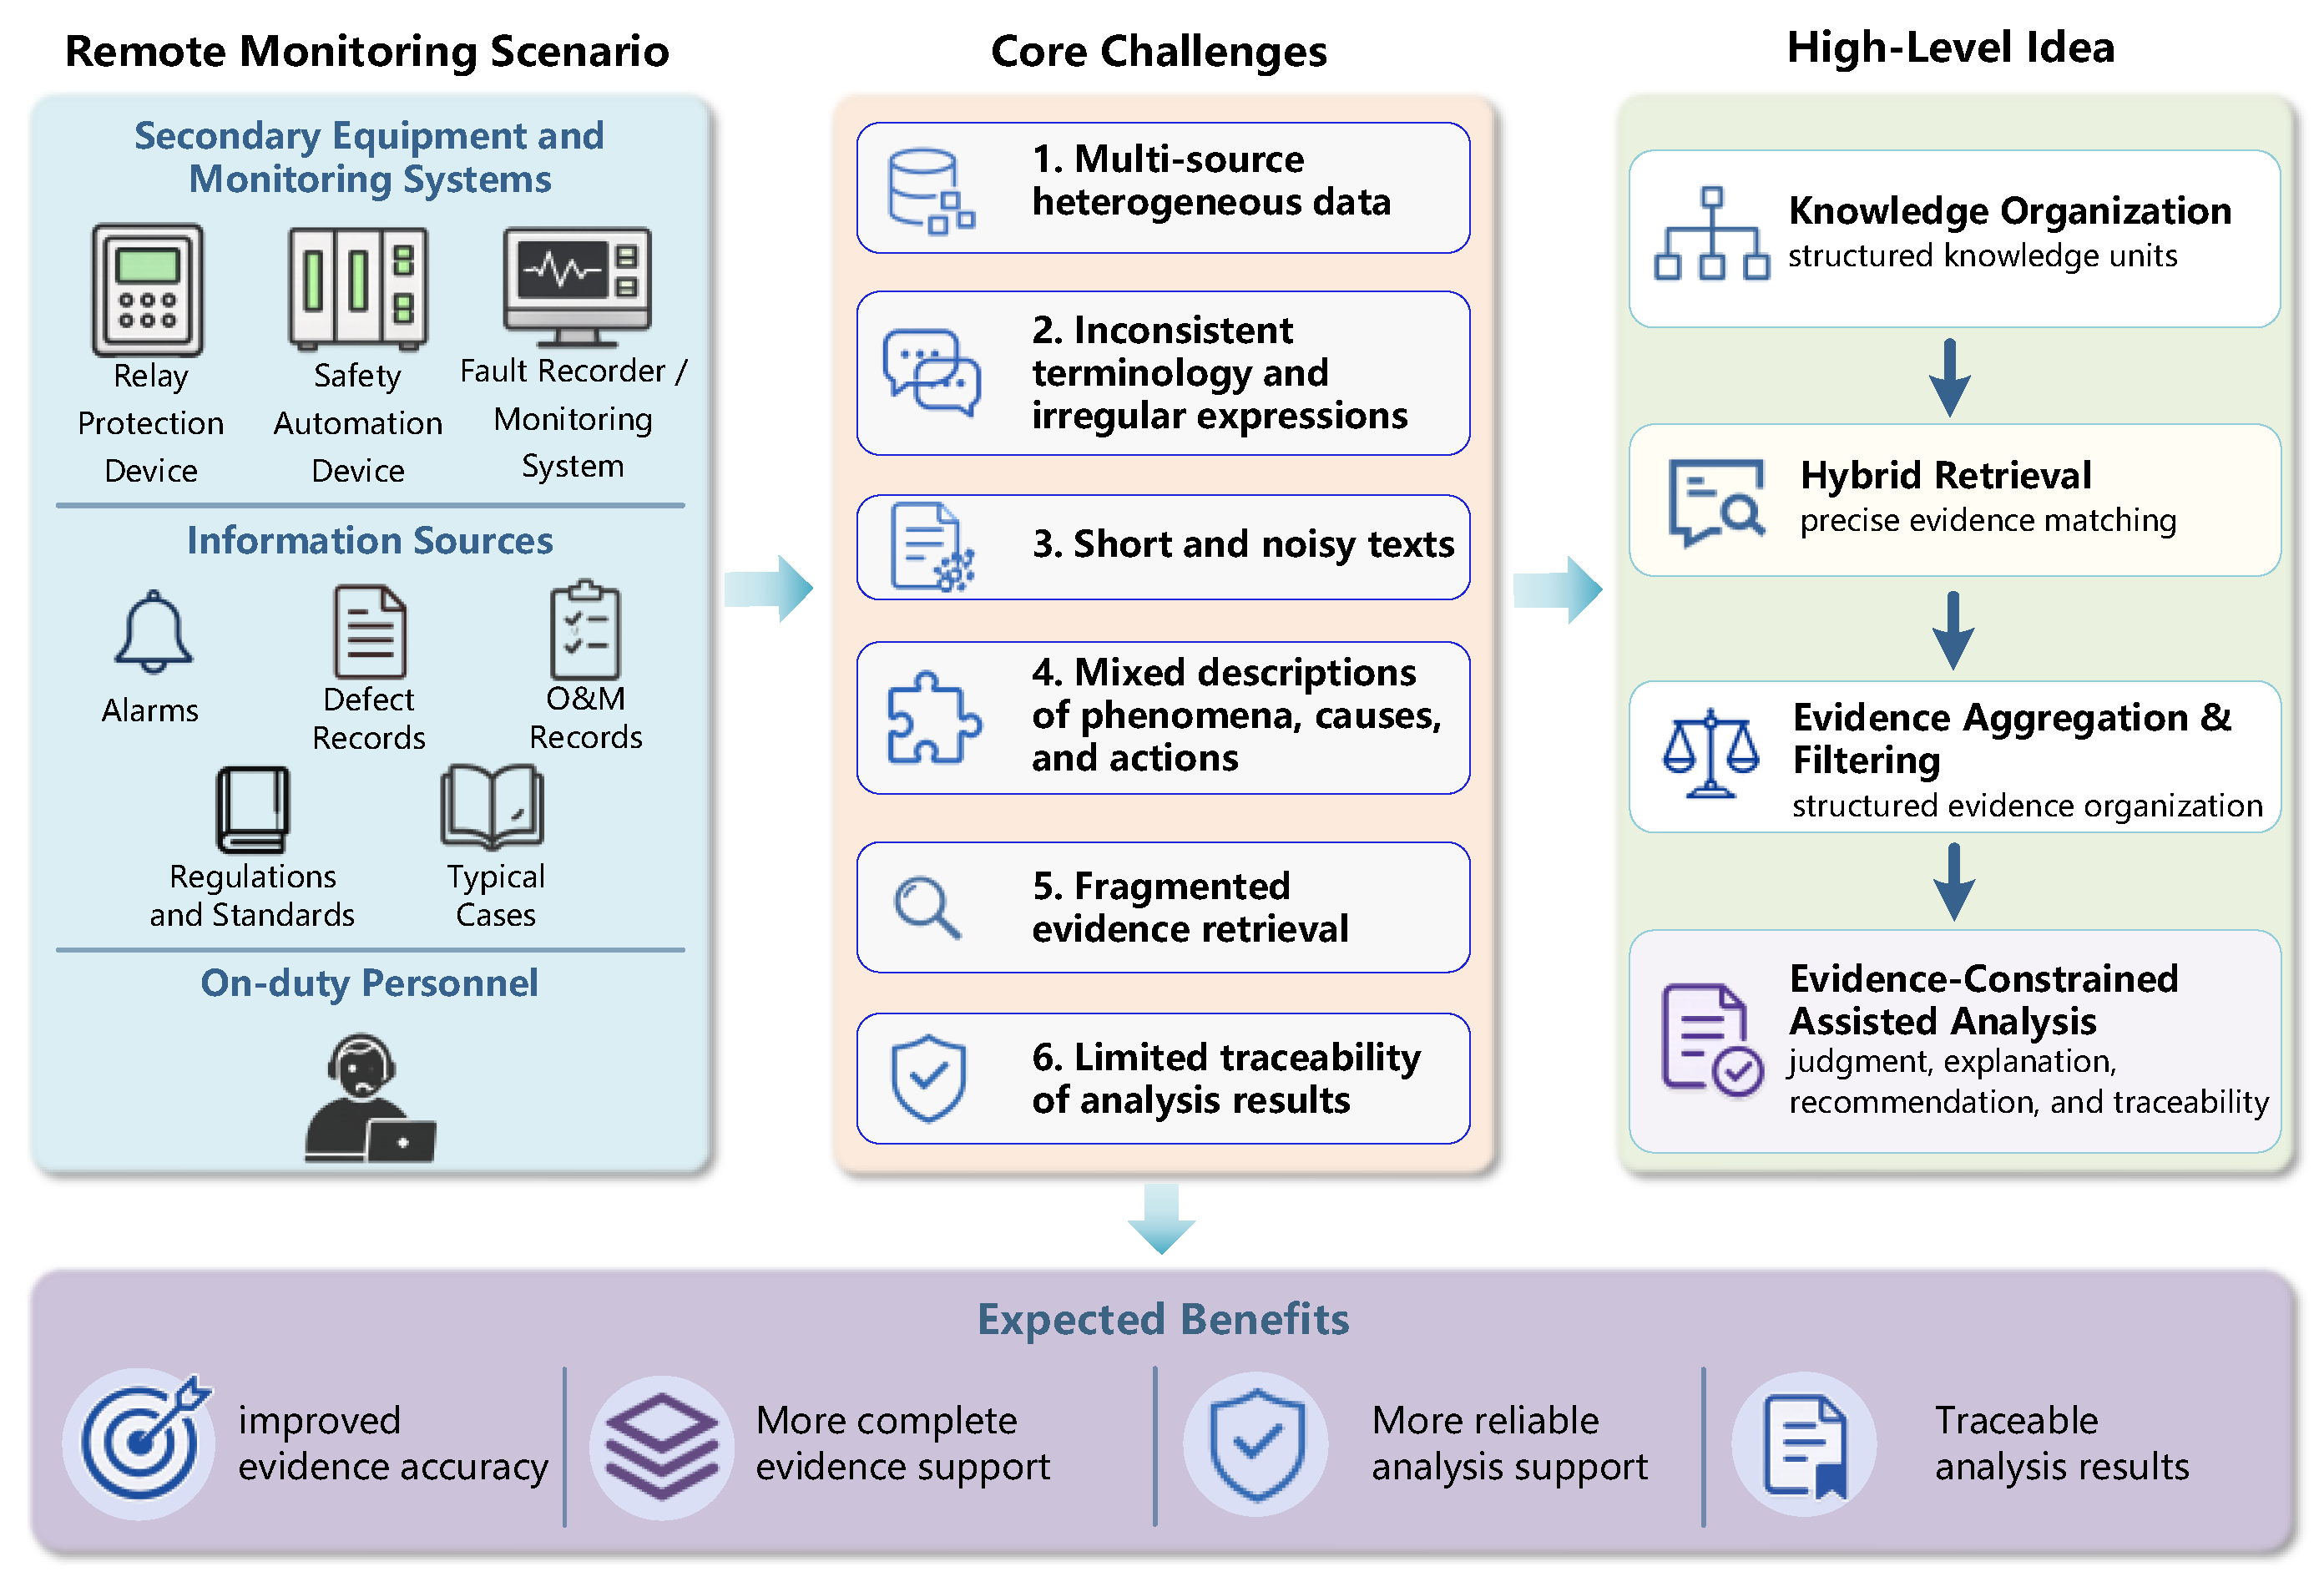
In secondary equipment remote monitoring, personnel must handle multi-source heterogeneous data, including defect handling records, regulations and standards, operation and maintenance records, typical cases, and action anomaly reports. These data contain key information on equipment status, abnormal phenomena, handling actions, and rule-based evidence, but are often short, noisy, terminology-dense, and inconsistently expressed. Unstructured defect records of relay protection devices often suffer from incompleteness, inaccuracy, and redundancy [1]. Fault texts of secondary equipment are also typically short Chinese texts mixed with numbers, symbols, and domain-specific terms [2]. The same abnormal phenomenon may be described differently by different personnel, making the raw corpus difficult to directly support stable and trustworthy remote monitoring and assisted analysis [3]. Figure 1 presents the corresponding scenario schematic.
Figure 1.
Multi-source heterogeneous data and core challenges of assisted analysis in secondary equipment remote monitoring scenarios.
Existing studies can be grouped into three categories. The first focuses on defect text mining and identification, including defect grading [4], short-text classification [5,6], and pattern discovery through clustering and association-rule analysis [7]. The second addresses state assessment, fault location, and risk identification using health indices and evaluation models [8,9], graph-based methods [10,11,12], and Bayesian- or knowledge-graph-based approaches [13,14]. Although these studies provide an important foundation, they mainly target downstream tasks such as classification, evaluation, localization, and risk scoring, with limited attention to terminology normalization, knowledge reuse, evidence organization, and result traceability. Knowledge graphs, retrieval-augmented generation (RAG), expert systems [15], and agent-based methods have recently been introduced into power-system applications. Knowledge graphs combined with Bayesian networks have been used for defect cause identification [16]. RAG has been applied to fault knowledge question answering and regulation understanding [17,18]. Large language model agents and multi-agent frameworks have further shown potential for memory, planning, task routing, and interpretable operation and maintenance analysis [19,20]. Meanwhile, recent RAG studies have improved retrieval quality, generation reliability, and corpus-level knowledge organization through advanced indexing, re-ranking, and graph-enhanced retrieval strategies [21,22,23]. Power-system knowledge graphs have also been investigated for fault diagnosis, fault disposal, and defect-record retrieval [24]. These studies show the value of external knowledge and structured knowledge representation, but most of them still focus on either retrieving relevant information or identifying fault causes. In secondary equipment remote monitoring, however, on-duty analysis usually requires a further step: heterogeneous records, rules, cases, and handling experience must be reorganized into consistent evidence that can directly support abnormality judgment, explanation, handling recommendation, and source checking. Therefore, existing RAG- or knowledge-graph-based studies still provide limited support for an evidence-oriented assisted analysis workflow that integrates corpus governance, knowledge organization, hybrid retrieval, evidence constraints, and result traceability.
To address these limitations, this study develops a knowledge-organization and retrieval-augmented assisted analysis method for secondary equipment remote monitoring, with validation focused on anomaly analysis of relay protection and related secondary equipment. The proposed method first constructs a unified knowledge base through corpus normalization and knowledge unit organization, and then performs hybrid retrieval by combining keyword retrieval, vector retrieval, and re-ranking. On this basis, structured analytical outputs are generated under evidence constraints to support coordinated abnormality judgment, evidence explanation, recommended handling actions, and source traceability. The main contributions are threefold:
- (1)
- a corpus normalization and knowledge unit organization method for secondary equipment remote monitoring;
- (2)
- an evidence-oriented assisted analysis workflow integrating terminology alignment, hybrid retrieval, evidence organization, and source-traceable output;
- (3)
- an evaluation framework for secondary equipment scenarios from the perspectives of retrieval performance, analysis correctness, evidence sufficiency, output usability, and source traceability.
2. Framework and Knowledge Organization Method
2.1. Scenario Analysis and Overall Workflow
Secondary equipment remote monitoring is aimed at continuous operational monitoring and assisted abnormality analysis. On-duty personnel need to integrate multi-source information, including alarm messages, defect records, action anomaly reports, regulations and standards, operation and maintenance records, and typical cases, to identify abnormal phenomena, analyze possible causes, and determine appropriate handling actions. Unlike single-source analysis, remote monitoring typically requires the joint use of historical records, rule-based evidence, and handling experience centered on equipment objects, abnormal phenomena, and action events. To formalize the monitoring scenario, a monitoring question or abnormality description is represented as:
where denotes the monitored equipment object, denotes the abnormal phenomenon, denotes the related action event, denotes the monitoring time, and denotes contextual information. This representation provides a structured basis for subsequent knowledge retrieval and evidence-constrained analysis.
Accordingly, the overall workflow can be summarized into two consecutive stages. First, multi-source corpora are normalized and organized into knowledge units to form a unified knowledge base. The candidate corpus space is defined as
where , , , , and denote defect records, action anomaly reports, regulations and standards, operation and maintenance records, and typical cases, respectively.
Then, retrieval requests are constructed from monitoring questions or abnormality descriptions, and assisted outputs are generated through hybrid retrieval, evidence screening, and constrained analysis. The overall process therefore includes multi-source corpus aggregation, corpus normalization, knowledge unit construction, retrieval and evidence screening, and assisted analysis output. This process can be further abstracted as:
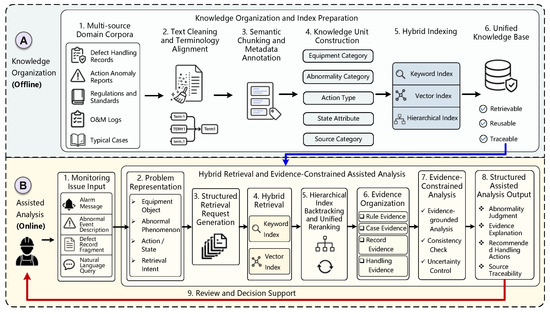
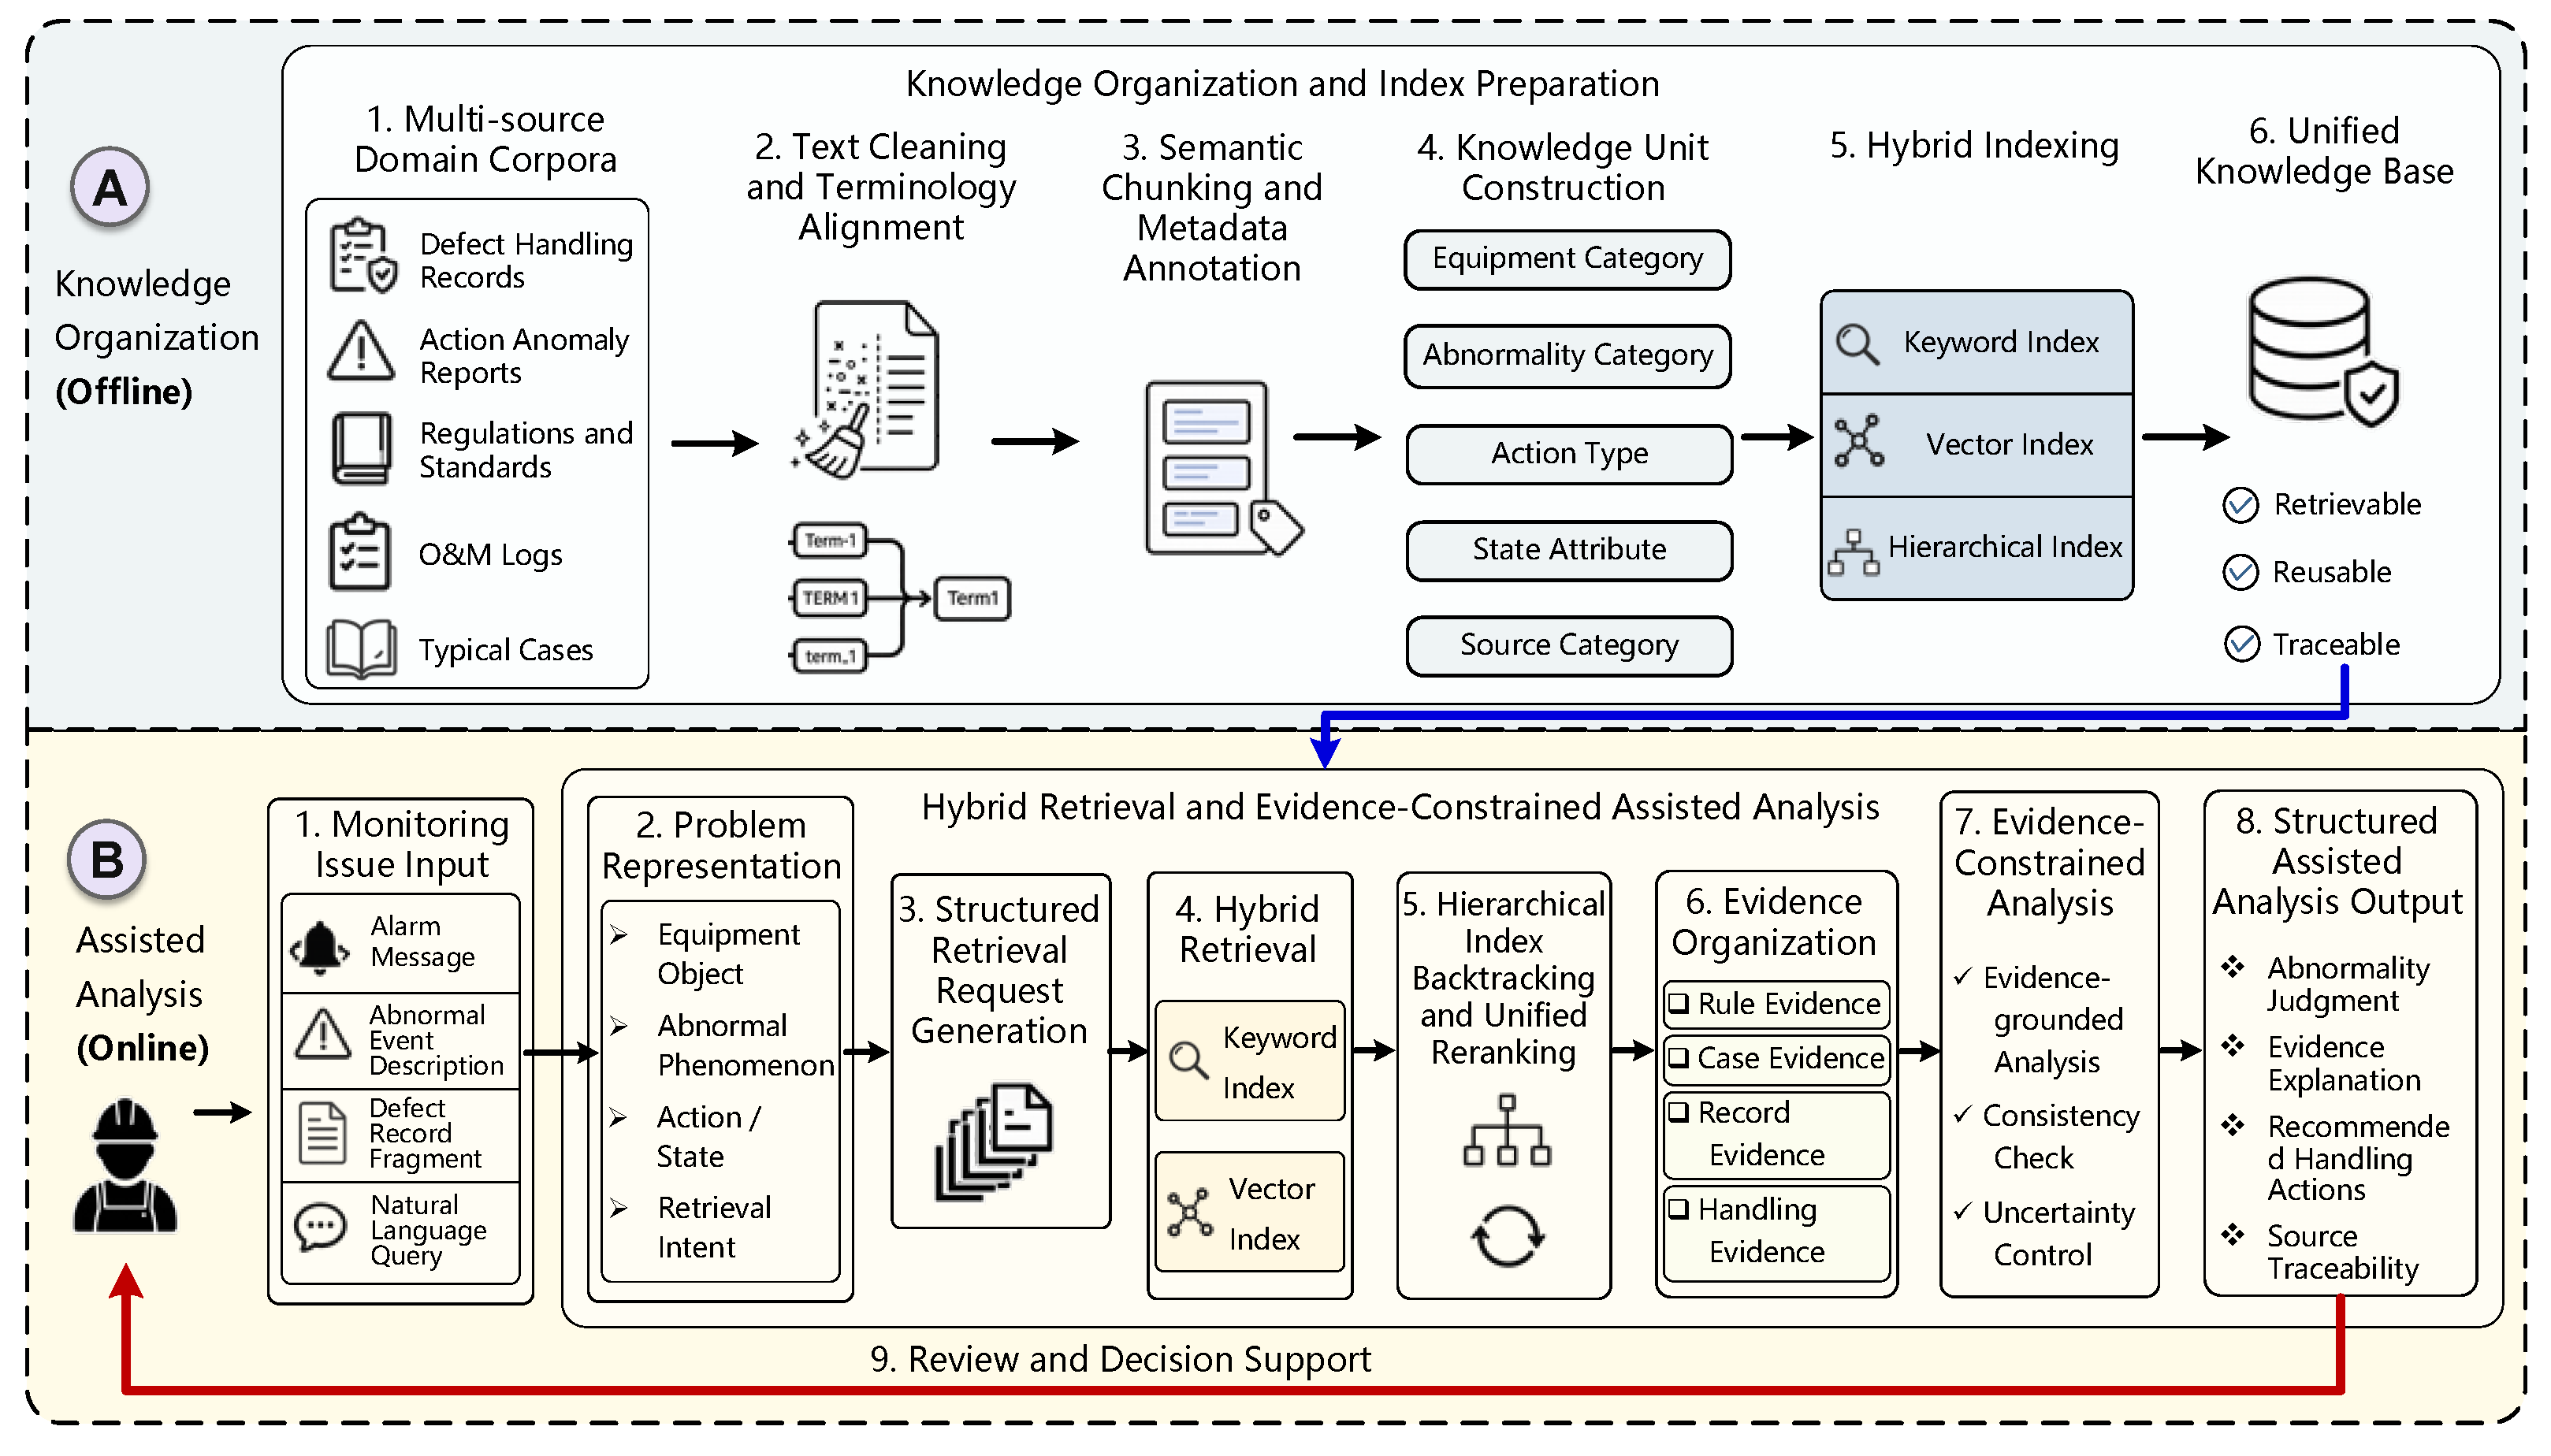
where denotes the organized knowledge unit set, denotes the retrieved evidence set for the monitoring question , denotes the screened effective evidence set, denotes the aggregated structured evidence set and denotes the final assisted-analysis output. The former stage determines the usability of the knowledge base, whereas the latter determines the accuracy and trustworthiness of assisted analysis, as shown in Figure 2.
Figure 2.
Framework for knowledge organization and retrieval-augmented assisted analysis in secondary equipment remote monitoring.
2.2. Composition and Characteristics of Multi-Source Domain Corpora
The knowledge sources used in secondary equipment remote monitoring are markedly heterogeneous. In addition to defect handling records, regulations and standards, operation and maintenance records, typical cases, and action anomaly reports also contribute to abnormality analysis. These corpora play different roles: defect records and anomaly reports mainly describe abnormal phenomena and handling processes; regulations and standards provide judgment criteria and handling requirements; and operation and maintenance records together with typical cases supplement object background, historical experience, and process information. Table A1 in Appendix A summarizes the main corpus types, data forms, and functional roles.
These corpora include structured, semi-structured, and unstructured information, with substantial differences in expression. Regulations and standards are usually hierarchically organized and formally expressed, whereas defect records, operation and maintenance records, and case texts are often short or semi-free texts containing numbers, symbols, abbreviations, and colloquial descriptions, with inconsistent semantic granularity. Such heterogeneity can adversely affect retrieval recall, evidence matching, and the stability of analysis results. Therefore, before retrieval-augmented analysis, the dispersed raw texts must be normalized and organized into knowledge units with clear structure and stable semantics.
2.3. Domain Corpus Normalization Method for Remote Monitoring
Multi-source domain corpora differ substantially in source, format, and expression habits. If directly used for retrieval and analysis, they may lead to unstable recall, fragmented evidence, and insufficient support. Therefore, unified normalization is first performed to reduce terminology discrepancies and noise while preserving domain semantics and operational context, thereby providing consistent input for subsequent knowledge unit construction. In this study, normalization is regarded as the process of transforming each raw corpus item into a reusable knowledge unit :
where denotes the normalization process. The normalization process consists of four steps.
- (1)
- Text cleaning. Invalid characters, repeated symbols, and obvious redundancies are removed, while the expressions of time, numbering, and common fields are unified to reduce noise in the original records.
- (2)
- Terminology normalization. A “controlled vocabulary + rule-based merging” strategy is adopted. The controlled vocabulary currently contains approximately 400 standardized terms covering equipment objects, protection functions, abnormal phenomena, action/state descriptions, and handling actions, with original expressions and aliases retained through mapping rules. Mapping rules are then established for abbreviations, aliases, shorthand expressions, and colloquial descriptions to merge different expressions into standardized terms. For example, “bus differential protection,” “busbar differential protection,” and “No. I bus differential protection device” are unified as “busbar differential protection device,” while “no return signal” and “action information not returned” are merged into “return-signal abnormality/information upload abnormality”. For terms not covered by the vocabulary, candidate terms are first identified through high-frequency term statistics and similar-expression discovery, and then checked against their source context before being added to the vocabulary. To reduce arbitrary merging, both the original expression and the standardized term are retained with the corresponding source identifier. Term merging is performed only when the expressions refer to the same equipment object, abnormal phenomenon, action state, or handling meaning in the source context, while ambiguous expressions are preserved in their original form for later evidence checking and source tracing. New unmatched expressions can be incrementally collected from updated corpora or retrieval queries, and lexical and semantic similarity can be used to generate candidate groups with existing standardized terms for subsequent source-context verification.
- (3)
- Semantic chunking. Instead of fixed-length truncation, semantic integrity is used as the primary principle. Periods, semicolons, bullet markers, and field tags are treated as candidate boundaries, while elements such as equipment object, abnormal phenomenon, action status, handling result, and rule requirement are used to determine whether a segment forms an independent knowledge unit. For causal or procedural chains such as “caused by …,” “restored after inspection,” and “no return signal after action,” the cause, phenomenon, and result are kept within the same unit. For long regulation-related texts, priority is given to preserving the correspondence between applicable conditions and handling requirements, with necessary context retained through source identifiers. The logical boundary determination process for semantic chunking is summarized in Algorithm 1.
| Algorithm 1 Semantic chunking with condition–requirement preservation |
| Input: normalized corpus item source identifier |
| Output: knowledge-unit set |
|
- (4)
- Metadata annotation. Metadata such as equipment category, abnormality category, action type, temporal attribute, and source category are annotated for each unit. After normalization, a knowledge unit is represented as:where denotes the normalized text, denotes the metadata, and denotes the source identifier.
Through the above process, raw corpora are transformed from loosely expressed and unevenly granular texts into intermediate results with more unified expression and clearer semantic boundaries. This improves the consistency of subsequent knowledge organization and provides a basis for conditional filtering, evidence aggregation, and source traceability in the retrieval stage.
2.4. Knowledge Unit Construction and Representation of Organized Results
After corpus normalization, the organization target shifts from raw record texts to semantic segments obtained through cleaning, terminology unification, and semantic chunking. In remote monitoring scenarios, a knowledge unit is defined as the minimum retrievable semantic carrier centered on a single equipment object, abnormal phenomenon, rule-based basis, or handling point. The organized knowledge base can be represented as a set of knowledge units :
where denotes the total number of constructed knowledge units.
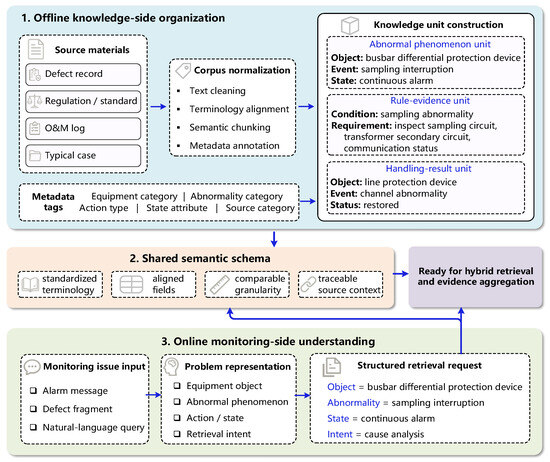
As shown in Figure 3, the organized knowledge units and monitoring problem representations are aligned through a shared semantic schema to support subsequent retrieval preparation. Knowledge unit construction involves three steps. First, normalized representations are generated by extracting core elements such as equipment object, abnormal event, state change, handling result, rule condition, and handling requirement from different corpora. Second, the extracted semantic content is mapped to unified knowledge unit fields, including equipment category, abnormality category, action type, state attribute, and source category, so that texts from different sources can be incorporated into a consistent framework. Third, source and context information, including the original corpus source, location identifier, and necessary context, are retained to support retrieval filtering, evidence verification, and result traceability. Table A2 in Appendix A presents typical examples of the mapping from raw text to knowledge units. Through this process, multi-source heterogeneous corpora are organized into a retrievable, filterable, and traceable knowledge base for subsequent hybrid retrieval, evidence aggregation, and assisted analysis. Compared with raw corpus records, provides a unified representation of domain knowledge and serves as the direct retrieval basis for subsequent evidence construction.
Figure 3.
Offline knowledge organization, online problem understanding, and semantic alignment for retrieval preparation.
3. Hybrid Retrieval and Evidence-Constrained Assisted Analysis Method
3.1. Monitoring Problem Representation and Query Understanding
Assisted analysis in secondary equipment remote monitoring usually starts from alarm messages, defect descriptions, action anomaly records, or manually entered questions rather than standardized queries. These inputs vary substantially in form and may appear as short alarm phrases, record fragments, or natural-language questions. If directly used for retrieval, terminology variation, omitted expressions, and mixed semantics may lead to scattered results and poor matching with knowledge units.
To improve consistency between retrieval requests and the knowledge base, monitoring problems are first represented in a unified form. Following the definition of the monitoring problem in Section 2.1, the query understanding process converts a raw monitoring input into the structured problem representation:
where denotes the query understanding function, and denotes the original input such as an alarm message, defect description, action anomaly record, or manually entered question. This process identifies the equipment object, abnormal phenomenon, and action or state information from the raw input, and then determines the retrieval intent according to the current task. The equipment object constrains the retrieval scope, abnormal phenomena and action states characterize the core event semantics, and retrieval intent distinguishes whether the task is oriented toward evidence lookup, cause investigation, or handling recommendation. On this basis, the retrieval request is represented as:
where denotes the retrieval request generated from the monitoring problem, denotes the retrieval intent, and denotes auxiliary constraints such as equipment category, time range, source type, or abnormality category. The raw input is thereby converted into a retrieval request consisting of core retrieval items and auxiliary constraints, providing stable input for subsequent hybrid retrieval. Table A3 in Appendix A presents typical examples of this representation.
3.2. Hybrid Retrieval Method Integrating Keywords, Vectors, and Hierarchical Indexing
After monitoring problems are represented, evidence retrieval is performed over knowledge units. Since secondary-equipment queries contain both explicit domain terms and semantically varied expressions, a hybrid retrieval method is adopted to combine terminology matching with semantic generalization.
The core retrieval items and auxiliary constraints in are used as unified inputs. Keyword retrieval and vector retrieval are performed in parallel: the former captures terminology and constraint matches, while the latter supplements semantically similar candidates expressed in different forms. For vector retrieval, the represented monitoring problem and the text of each knowledge unit are encoded into the same semantic vector space:
where denotes the semantic encoder, implemented by BAAI/bge-large-zh-v1.5 in this study, and denotes the normalized text of knowledge unit . The semantic similarity between and is calculated as:
Keyword retrieval and vector retrieval generate two candidate subsets, which are merged to form the initial candidate pool:
where denotes the keyword-based candidate set, denotes the vector-based candidate set, and denotes the merged candidate pool.
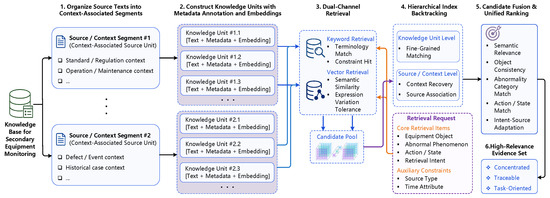
Hierarchical index backtracking is then used to recover necessary source context after fine-grained knowledge-unit matching, including rule conditions, scope of applicability, and event process information. Candidate results are finally ranked by semantic relevance, equipment-object consistency, abnormality-category matching, action/state matching, and intent–source adaptation:
where denotes the unified ranking score between candidate knowledge unit and retrieval request . This score determines the final evidence order by jointly considering semantic similarity, object consistency, abnormality-category matching, action/state matching, and intent–source adaptation. The workflow is illustrated in Figure 4.
Figure 4.
Schematic illustration of the hybrid retrieval process.
3.3. Re-Ranking of Retrieval Results and Evidence Aggregation
After hybrid retrieval, the candidate set may still contain partially relevant or only semantically similar results. To convert retrievable candidates into usable evidence, the results are further re-ranked and aggregated before being used for assisted analysis.
For a candidate knowledge unit , evidence screening in remote monitoring depends not only on semantic relevance but also on equipment-object consistency, abnormality-category matching, action/state matching, and source adaptability. Therefore, the ranking score is defined as:
where , , , , and denote semantic relevance, equipment-object consistency, abnormality-category matching, action/state matching, and the adaptation between source type and task intent, respectively. The corresponding weights , , , , and satisfy:
The score is calculated using a domain-rule-based weighted ranking strategy. Semantic relevance is characterized by keyword retrieval results and vector similarity; equipment-object, abnormality-category, and action/state consistency are scored from the corresponding knowledge-unit fields; and source adaptability is determined by the match between task intent and source type. In the ranking design, semantic relevance, equipment-object consistency, and abnormality-category matching determine the main evidence priority, while action/state matching and source adaptability refine the ordering of candidate evidence. This factor-level scoring keeps the ranking process inspectable and reduces the promotion of candidates that are semantically similar but lack key domain consistency.
Based on the unified ranking, the retained evidence set for the current monitoring problem can be expressed as follows:
where is the evidence retention threshold, and denotes the top candidate knowledge units retained from the candidate pool according to the ranking score. The threshold and top- cutoff jointly control the quality and quantity of evidence entering the subsequent analysis stage.
On this basis, evidence aggregation is further performed. In remote monitoring, effective support is usually provided not by a single knowledge unit but by information from multiple sources and levels. To avoid reliance on isolated fragments, the filtered evidence is organized into four categories: phenomenon description, rule-based evidence, case experience, and handling points. The aggregated evidence set is represented as:
where , , , and denote evidence related to phenomenon description, rule-based basis, case experience, and handling points, respectively. During aggregation, candidates with inconsistent equipment objects or mismatched abnormality categories are down-weighted; repetitive results are merged by retaining clearer and more complete sources, and semantically similar results lacking key constraints are excluded from core evidence. The retained evidence is thereby transformed into a structured evidence set for evidence-constrained assisted analysis.
3.4. Retrieval-Augmented Assisted Analysis Output Mechanism Under Evidence Constraints
After a structured evidence set for the current monitoring problem is obtained, the task shifts from evidence retrieval to evidence-supported analytical output. Following the evidence aggregation result in Section 3.3, the evidence-constrained assisted analysis process is defined on the aggregated evidence set :
where denotes the input construction function, denotes the constructed evidence-aware input, and denotes the output instructions and evidence-use constraints. The evidence-constrained assisted analysis process can then be abstracted as:
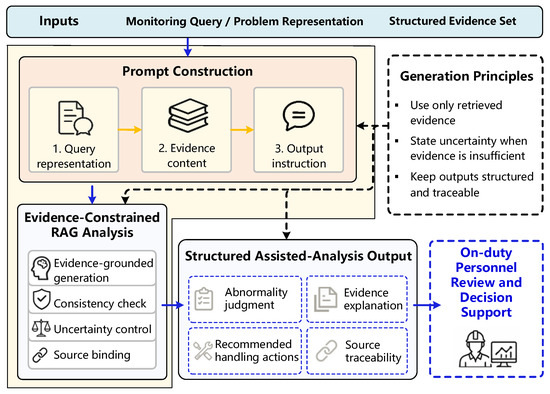
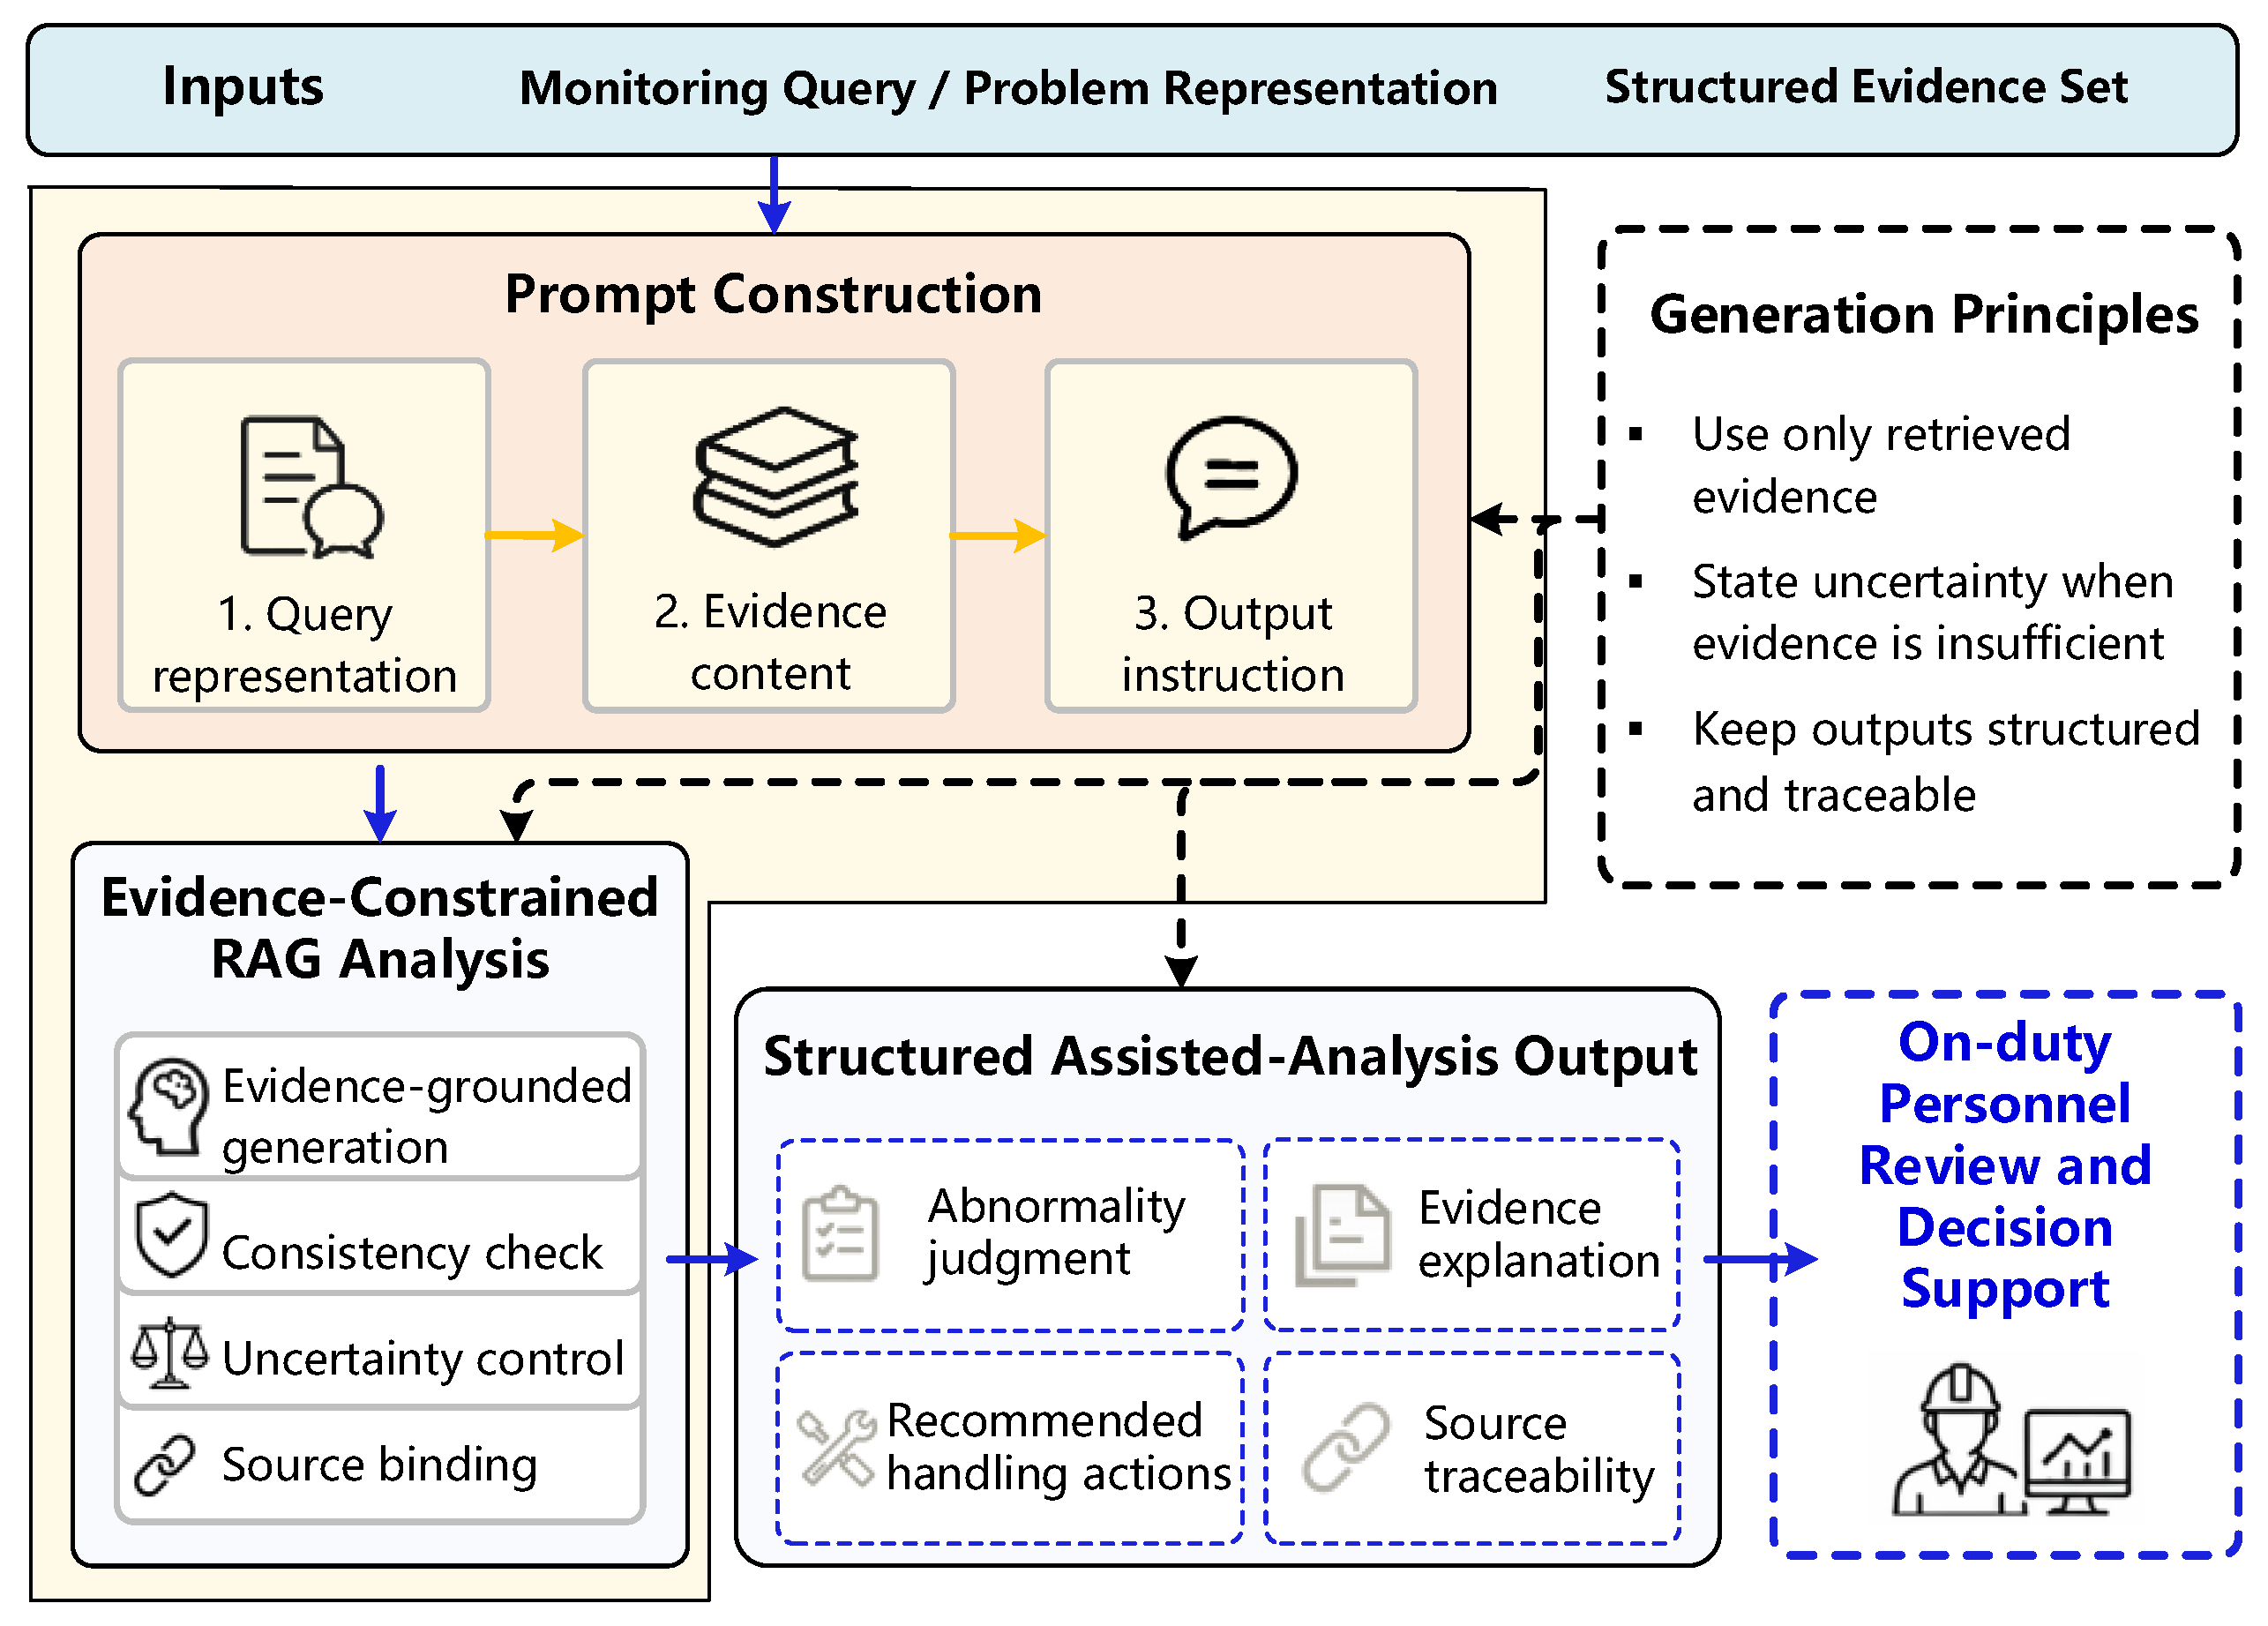
where denotes the overall evidence-constrained generation function, denotes the retrieval-augmented analysis module, and denotes the structured assisted-analysis output. In the experiments, was implemented using Qwen2.5-7B-Instruct, a 7.61-billion-parameter instruction-tuned causal language model based on a decoder-only Transformer architecture. The model was used in its instruction-tuned form for evidence-constrained assisted-analysis generation, without updating model parameters during the evaluation. Inference was performed on a single NVIDIA RTX 4090 24GB GPU using FP16 precision, and no additional INT4/INT8 quantization was applied. At this stage, the problem representation and aggregated evidence are jointly fed into a retrieval-augmented generation module to produce structured results, including abnormality judgment, evidence explanation, recommended handling actions, and source traceability, under evidence constraints, as shown in Figure 5.
Figure 5.
Evidence-constrained retrieval-augmented assisted analysis workflow.
3.4.1. Unified Input and Structured Output
The unified input consists of three parts: problem representation, structured evidence set, and output instructions. The problem representation specifies the analysis object and task intent, the evidence set provides the analytical basis, and the output instructions require the model to organize the result in the fixed structure of “abnormality judgment–evidence explanation–recommended handling actions–source traceability,” while restricting the analysis to the provided evidence. Accordingly, the structured output is represented as:
where , , , and denote abnormality judgment, evidence explanation, recommended handling actions, and source traceability, respectively. The output is designed to balance natural-language readability with the structural requirements of engineering applications.
3.4.2. Principles of Evidence-Constrained Generation
The RAG module does not generate open-ended answers directly, but produces analytical results under the constraints of the retrieved evidence. To reduce arbitrary inference, three principles are followed. First, abnormality judgment, evidence explanation, and recommended handling actions must all be supported by the input evidence. This evidence-support requirement can be expressed as:
where denotes a key output component, denotes a supporting evidence item in , denotes the evidence-support relation, and denotes the minimum support threshold. Second, when the available evidence is insufficient for a definite conclusion, uncertainty should be explicitly retained. Third, when evidence from different sources conflicts, priority is given to evidence with clear provenance, consistent object alignment, and better matching with the task intent. Through this mechanism, retrieved evidence is transformed into assisted analysis outputs that are reviewable and traceable.
4. Result Analysis
4.1. Data and Evaluation Task Design
To validate the proposed knowledge-organization and retrieval-augmented assisted analysis method for secondary equipment remote monitoring, a knowledge base was constructed from five categories of multi-source domain corpora: defect handling records, regulations and standards, typical cases, operation and maintenance records, and action anomaly reports. The raw corpus comprised 470 entries, including 120 defect records, 180 regulations and standards, 40 typical cases, 80 operation and maintenance records, and 50 action anomaly reports. After cleaning, terminology normalization, semantic chunking, and metadata annotation, these data were organized into approximately 800 knowledge units.
The verification case included two tasks: evidence retrieval and assisted analysis output. Retrieval performance was evaluated using Recall@5 and nDCG@5, while assisted-analysis output was evaluated through manual and automatic metrics for abnormality judgment, evidence explanation, recommended handling actions, and source traceability. The test set consisted of 80 retrieval questions derived from actual monitoring problems, historical abnormality descriptions, and evaluation-oriented analytical questions. Specifically, 20 questions (25.0%) were derived from actual monitoring problems, mainly in the form of alarm-style descriptions, abnormal states, or duty-assistance inputs; 24 questions (30.0%) were derived from historical abnormality descriptions, including protection actions, secondary-circuit abnormalities, setting-related trips, signal acquisition faults, and communication-link abnormalities; and 36 questions (45.0%) were evaluation-oriented analytical questions designed to examine terminology alignment, rule/evidence retrieval, and source tracing. The task intents covered cause investigation (16 questions, 20.0%), rule/evidence query (15 questions, 18.8%), handling recommendation (14 questions, 17.5%), similar case retrieval (6 questions, 7.5%), abnormality judgment (8 questions, 10.0%), source tracing/evidence verification (15 questions, 18.8%), and terminology normalization/object alignment (6 questions, 7.5%). Twenty representative samples were selected from the 80 retrieval questions for assisted-analysis output evaluation, covering major task intents and typical scenarios such as secondary-voltage distortion, communication-link abnormalities, protection-setting verification, anti-accident measures, inspection management, and online monitoring. For each test question, relevant knowledge units or evidence fragments and reference analytical results were annotated. Manual evaluation was conducted independently by three reviewers from four dimensions, namely abnormality judgment correctness, evidence sufficiency, recommendation usefulness, and source traceability, and the average scores were reported. Automatic evaluation further included abnormality judgment accuracy, evidence coverage rate, recommendation coverage rate, and source hit rate. The retrieval comparison, output comparison, and ablation experiments shared the same base corpora and core test samples to ensure comparability.
4.2. Comparative Verification on Hybrid Retrieval Performance
Based on the experimental data and test set described in Section 4.1, comparative retrieval experiments were conducted to evaluate the evidence recall and ranking performance of different knowledge-organization and retrieval strategies in secondary equipment remote monitoring. The retrieval settings were organized to compare raw-text retrieval, semantic-chunking retrieval, knowledge-unit-based hybrid retrieval, and the proposed full retrieval strategy. The comparison was conducted under a unified evaluation setting, in which the corpus scope, retrieval questions, annotated evidence references, and metric calculation were kept consistent across methods. In the raw-text retrieval settings, corpus items were segmented according to original paragraph or field boundaries. In the semantic-chunking retrieval settings, the boundary-determination rules in Algorithm 1 were used to preserve semantic boundaries, while metadata constraints, retrieval fusion, and unified re-ranking were not introduced. For the vector-based settings, the same semantic encoder and similarity calculation were used; for the two knowledge-unit-based settings, the same knowledge-unit set was used, with the difference lying in whether unified re-ranking was applied after hybrid retrieval. For the proposed re-ranking strategy, the weights in (13) were empirically calibrated on a 20-question subset selected from the evaluation-question pool. The subset included five actual monitoring problems, six historical abnormality descriptions, and nine evaluation-oriented analytical questions, and covered major retrieval intents including cause investigation, rule/evidence query, handling recommendation, abnormality judgment, and source tracing/evidence verification. The final weight setting used in the comparative retrieval experiment was α = 0.35, β = 0.20, γ = 0.20, δ = 0.10, and λ = 0.15. Recall@5 and nDCG@5 were adopted as evaluation metrics. Recall@5 measures whether the manually annotated relevant evidence can be retrieved within the top five results, while nDCG@5 evaluates the ranking quality of the returned evidence by assigning higher scores when relevant evidence appears earlier in the list. The top-5 cutoff was selected to provide a limited and reviewable evidence set for subsequent evidence aggregation and structured output generation. The results are shown in Table 1.
Table 1.
Comparison and verification results of the retrieval settings.
As shown in Table 1, semantic chunking improves both BM25 and vector retrieval compared with raw text chunking, indicating that preserving semantic boundaries contributes to evidence matching. The 95% confidence intervals were estimated by bootstrap resampling over the 80 retrieval questions, and ΔRecall@5 and ΔnDCG@5 denote the mean improvement of the proposed method over each comparison setting. The knowledge-unit-based hybrid baseline further improves Recall@5 and nDCG@5, suggesting that semantic chunking alone does not account for the full retrieval gain. The additional gain over the knowledge-unit hybrid baseline further confirms the contribution of unified re-ranking.
To examine whether the retrieval results were sensitive to the empirical re-ranking weights, several nearby normalized weight settings were tested around the final setting. As shown in Table 2, Recall@5 remained between 0.93 and 0.94, and nDCG@5 remained between 0.88 and 0.89 across the tested settings, indicating that the retrieval performance was stable under small weight perturbations.
Table 2.
Sensitivity analysis of re-ranking weights.
4.3. Verification on Evidence-Constrained Assisted Analysis Output
To evaluate evidence-constrained assisted analysis output, each of the 20 assisted-analysis samples was generated under three modes: direct LLM output, conventional RAG output, and the proposed method. The same generation model was used in all modes; thus, the comparison focused on whether external evidence was retrieved, organized, and constrained. Direct LLM output uses no external evidence, conventional RAG output generates answers from retrieved texts, whereas the proposed method produces structured outputs in the form of “abnormality judgment–evidence explanation–recommended handling actions–source traceability” under evidence constraints.
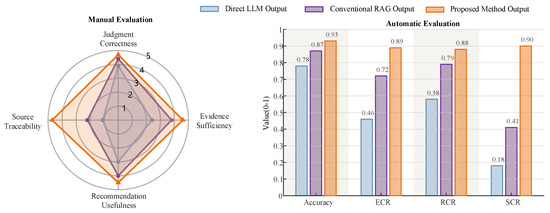
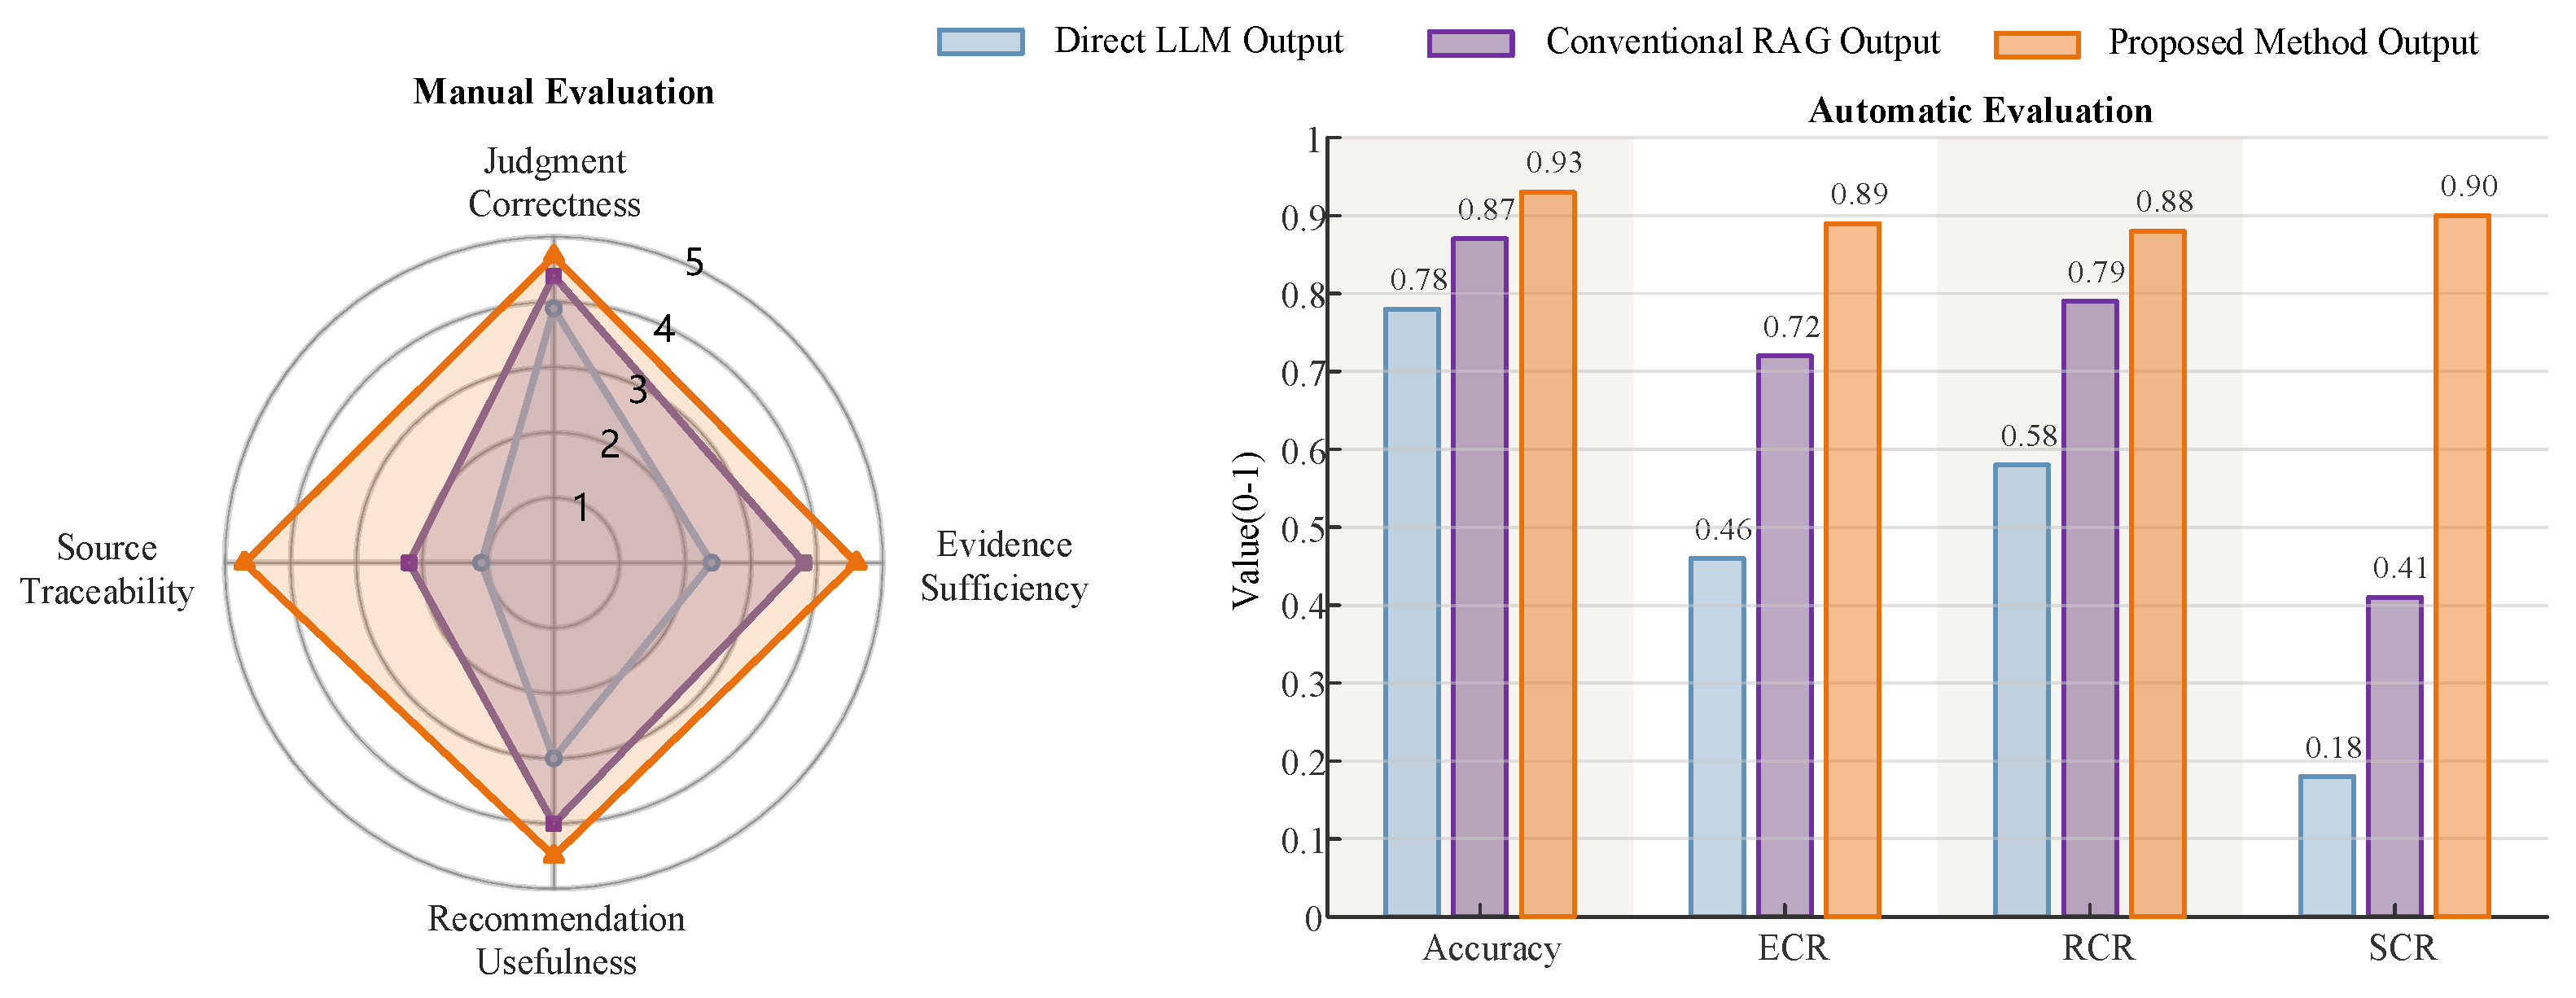
Manual evaluation was conducted independently by three reviewers with backgrounds in relay protection, secondary-equipment monitoring, and power-system operation and maintenance. They used a five-point scale for abnormality judgment correctness, evidence sufficiency, recommendation usefulness, and source traceability. The reported scores were averaged across reviewers, with score differences retained, and ICC was used to assess inter-rater consistency. Automatic metrics included abnormality judgment accuracy, ECR, RCR, and SCR. Table 3 reports the evaluation results and ICC values, and Figure 6 compares the three output methods.
Table 3.
Results of evidence-constrained assisted analysis output.
Figure 6.
Comparison of assisted analysis results under different output methods.
Five error categories were counted on the 20 assisted-analysis samples: incorrect abnormality judgment, insufficient evidence, inadequate handling recommendations, missing source traceability, and incomplete structure. Figure 7 shows that direct LLM output mainly suffers from evidence deficiency, traceability deficiency, and structural incompleteness. Conventional RAG reduces these errors but still has traceability and structural weaknesses, whereas the proposed method further lowers all five error types. Remaining errors were mainly associated with rare abnormality expressions or implicit secondary-circuit causes, semantically relevant fragments without explicit source linkage, and compound queries requiring judgment, cause analysis, recommendation, and source tracing.
Figure 7.
Heatmap of major generation error rates under different output methods.
4.4. Representative Case Analysis
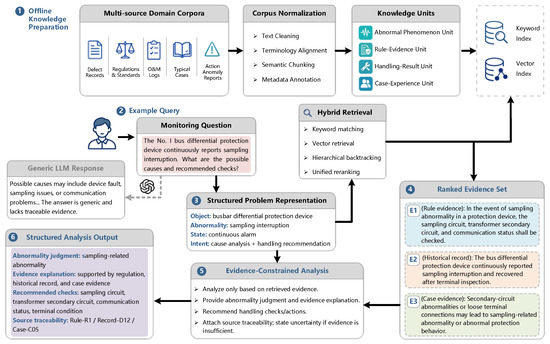
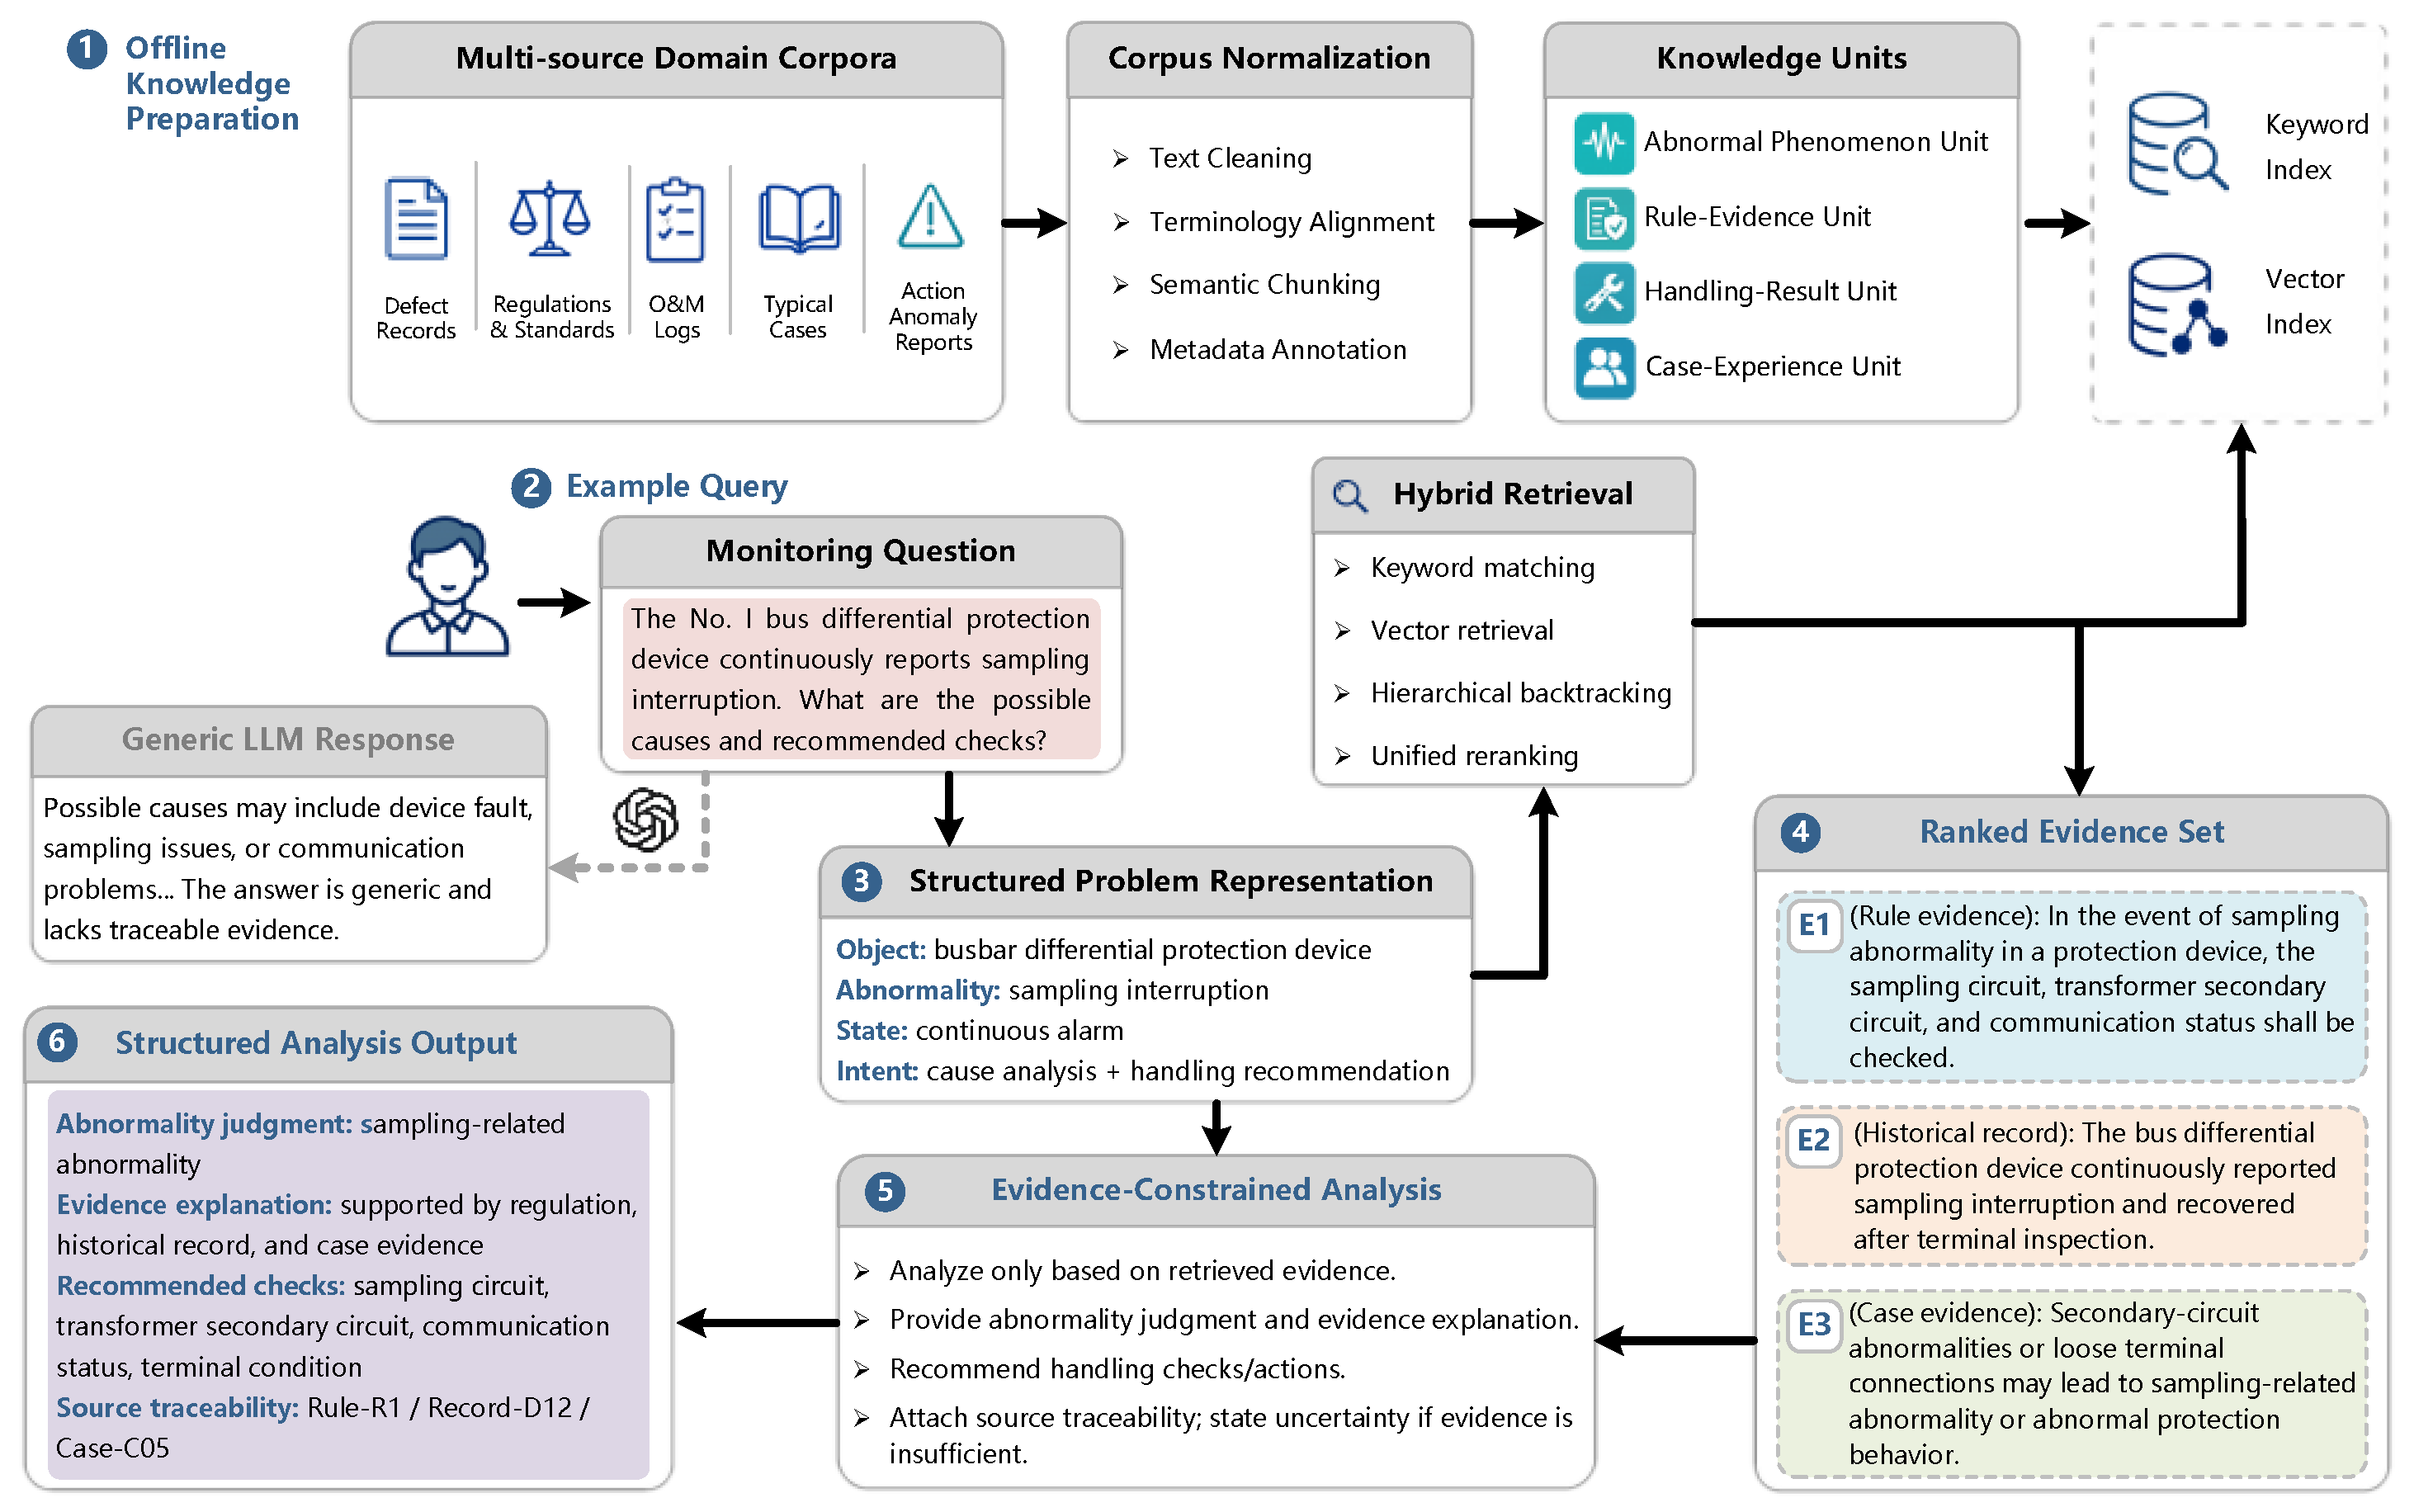
Two secondary-equipment monitoring problems were selected for case analysis: abnormal zero-sequence voltage accompanied by directional-element misjudgment, and abnormal remote signals after protection action. These two cases correspond to protection misjudgment caused by voltage secondary-circuit abnormalities and abnormal uploading of action information, respectively. As shown in Table A4 in Appendix A, the proposed method can generate structured outputs in the form of “abnormality judgment–evidence explanation–recommended handling actions–source traceability” for different monitoring problems, while improving evidence sufficiency and result traceability under multi-source evidence support. Figure 8 further presents a running example to illustrate how a monitoring question is represented, retrieved, supported by evidence, and transformed into a structured assisted-analysis output.
Figure 8.
Running example of evidence-constrained analysis for remote monitoring of secondary equipment.
4.5. Lightweight Ablation Experiments on Key Modules
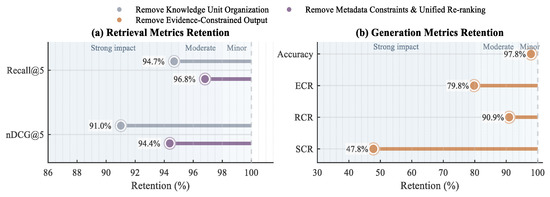
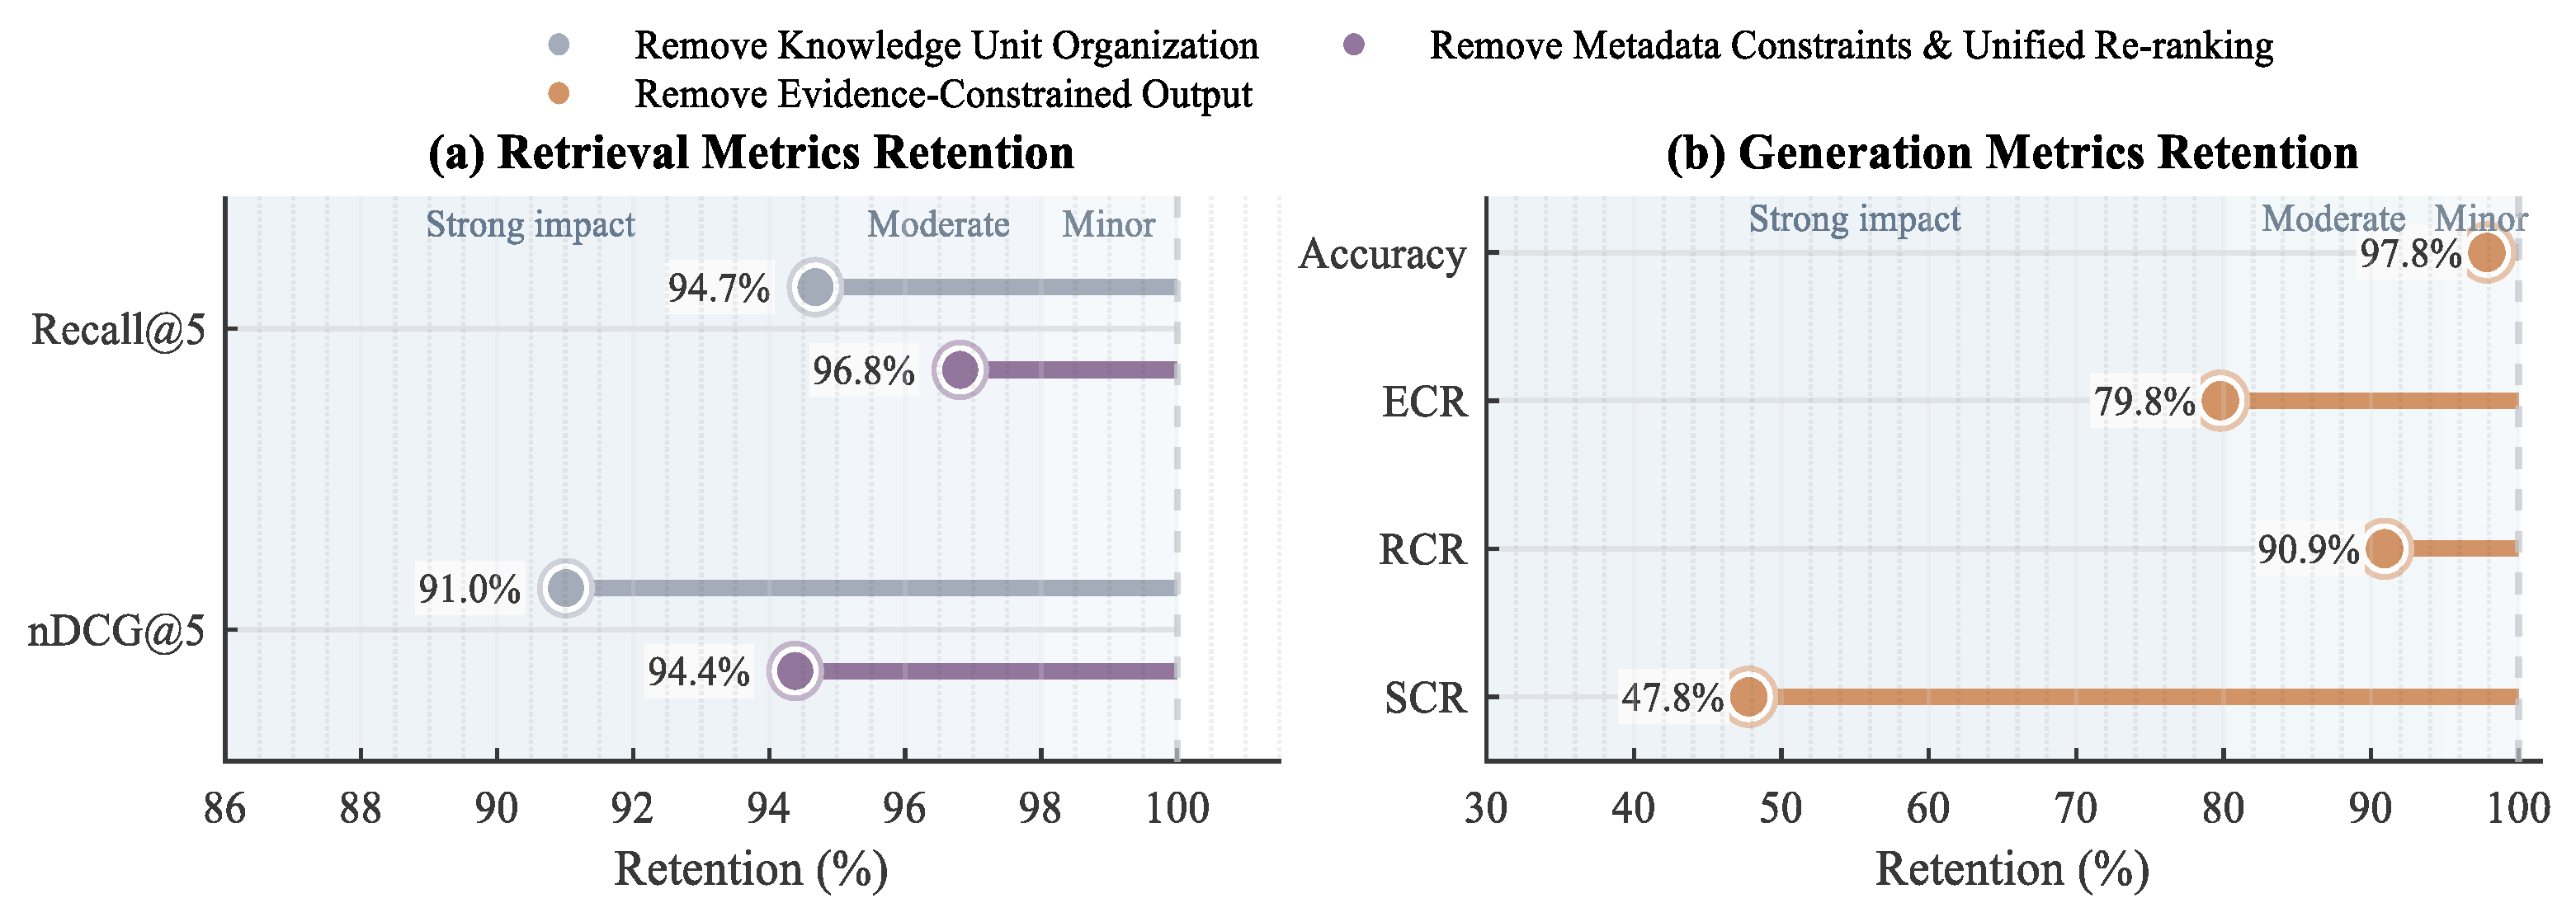
To examine the contributions of the key modules in the proposed method, lightweight ablation experiments were conducted on three components: knowledge unit organization, metadata constraints with unified re-ranking, and evidence-constrained output. Removing knowledge unit organization means that retrieval is performed directly on raw text chunks; removing metadata constraints and unified re-ranking means that knowledge units and hybrid retrieval are retained but unified ranking is disabled; and removing evidence-constrained output means that evidence retrieval is retained while structured evidence-constrained generation is removed. The first two ablation settings are evaluated using Recall@5 and nDCG@5, whereas the third is evaluated using abnormality judgment accuracy, ECR, RCR, and SCR. The results are shown in Table 4, and Figure 9 illustrates the corresponding performance retention. For each ablation setting and evaluation metric , performance retention is calculated as
where denotes the metric value under ablation setting , and denotes the metric value of the complete proposed method. A lower retention value indicates a larger contribution of the removed module to the corresponding metric.
Table 4.
Results of lightweight ablation experiments on key modules.
Figure 9.
Comparison of metric retention rates after removing different key modules.
As shown in Table 4 and Figure 9, removing knowledge unit organization causes the largest decline in retrieval performance, while removing metadata constraints and unified re-ranking mainly affects evidence prioritization. Removing evidence-constrained output has the greatest impact on generation-level metrics, especially ECR and SCR, indicating its role in evidence organization and source traceability.
5. Conclusions
This study develops a knowledge-organization and retrieval-augmented modeling framework for intelligent decision support in secondary equipment remote monitoring to address the problems of dispersed multi-source corpora, inconsistent terminology, fragmented retrieval results, and insufficient analytical support. The proposed framework integrates corpus normalization, knowledge unit construction, hybrid retrieval, evidence aggregation, and evidence-constrained structured output, thereby organizing heterogeneous texts into retrievable, reusable, and traceable knowledge units and improving evidence screening and analytical output for intelligent decision support in remote monitoring tasks.
Verification results demonstrate that the proposed method achieves effective performance in retrieval, assisted analysis output, and key-module ablation validation. Knowledge unit organization improves the accuracy and stability of evidence matching, unified re-ranking enhances the prioritization of highly relevant evidence, and evidence-constrained output strengthens evidence sufficiency and source traceability. Broader application will require validation on larger and more diverse engineering corpora, where terminology variants, long-tail abnormality types, and cross-source evidence inconsistencies may place higher demands on vocabulary updating, retrieval calibration, and evidence aggregation.
Author Contributions
Conceptualization, L.J. (Longxing Jin), J.Z. and K.L.; Funding acquisition, L.J. (Longxing Jin); Methodology, L.J. (Longxing Jin), L.J. (Luemou Ju), X.Z., Z.L., T.W., J.Z. and K.L.; Supervision, L.J. (Longxing Jin); Validation, J.Z.; Writing—original draft, J.Z.; Writing—review and editing, L.J. (Longxing Jin), and K.L. All authors have read and agreed to the published version of the manuscript.
Funding
This research received no external funding.
Data Availability Statement
The compiled corpus, annotations, and vocabulary resources are not publicly released because some source materials are subject to copyright, licensing, or redistribution restrictions. Relevant corpus statistics, representative examples, and methodological details are provided in the manuscript and Appendix A.
Conflicts of Interest
Authors Longxing Jin, Luemou Ju, Xu Zhang, Zhengfei Lu, and Tinghuang Wang were employed by the Shenzhen Power Supply Bureau Co., Ltd. The remaining authors declare that the research was conducted in the absence of any commercial or financial relationships that could be construed as a potential conflict of interest.
Appendix A
Table A1.
Types, data forms, and functional characteristics of multi-source domain corpora.
Table A2.
Examples of mapping from raw text to knowledge units.
Table A3.
Examples of mapping monitoring problems to retrieval requests.
Table A4.
Structured assisted analysis results for representative cases.
References
- Zheng, S.; Liu, Z.; Yu, Y.; Dong, P.; Yang, X.; Wang, S.; Tao, C.; Xue, A. A Quality Evaluation Method for the Unstructured Defect Record of Relay Protection Devices Based on Ontology and Knowledge Graph. Energy Rep. 2023, 9, 771–781. [Google Scholar] [CrossRef] [Scilit]
- Wei, W.; Zhou, J.; Nan, D.; Wang, L.; Zhang, L.; Tang, X. Short Text Data Model of Secondary Equipment Faults in Power Grids Based on LDA Topic Model and Convolutional Neural Network. In Proceedings of the 2020 35th Youth Academic Annual Conference of Chinese Association of Automation (YAC), Zhanjiang, China, 16–18 October 2020; pp. 156–160. [Google Scholar]
- Chen, K.; Mahfoud, R.J.; Sun, Y.; Nan, D.; Wang, K.; Haes Alhelou, H.; Siano, P. Defect Texts Mining of Secondary Device in Smart Substation with GloVe and Attention-Based Bidirectional LSTM. Energies 2020, 13, 4522. [Google Scholar] [CrossRef] [Scilit]
- Nan, D.; Wang, K.; Wang, W.; Wei, W.; Chen, K.; Sun, Y. Defect Classification of Power Secondary Equipment Based on XGBoost Algorithm. In Proceedings of the 2019 Chinese Automation Congress (CAC), Hangzhou, China, 22–24 November 2019. [Google Scholar]
- Liu, J.; Ma, H.; Xie, X.; Cheng, J. Short Text Classification for Faults Information of Secondary Equipment Based on Convolutional Neural Networks. Energies 2022, 15, 2400. [Google Scholar] [CrossRef] [Scilit]
- Chen, K.; Nan, D.; Sun, Y.; Wang, K. Text Mining of Power Secondary Equipment Based on BiLSTM-Attention. In Proceedings of the 2020 Chinese Control and Decision Conference (CCDC), Hefei, China, 22–24 August 2020; pp. 709–714. [Google Scholar]
- Zheng, M.; Gao, Z.; Yu, J.; Mu, J.; Chen, Z.; Li, Z. Defect Analysis of Power System Secondary Equipment Based on Cluster Analysis and Association Rule. In Proceedings of the 2021 8th International Forum on Electrical Engineering and Automation (IFEEA), Xi’an, China, 10–12 September 2021; pp. 500–504. [Google Scholar]
- Shi, B.; Lu, S.; Yi, K. State Evaluation Method of Smart Substation Secondary Equipment Based on Big Data Mining. In Proceedings of the 2022 IEEE/IAS Industrial and Commercial Power System Asia (I&CPS Asia), Shanghai, China, 9–12 July 2022; pp. 929–933. [Google Scholar]
- Wang, W.; Zhang, J.; Wang, S.; Chen, X. A Comprehensive Performance Evaluation Algorithm for Substation Secondary Equipment: An Improved Analytic Hierarchy Process Entropy Weight and Learning Vector Quantization Neural Network Approach. J. Eng. 2024, 2024, e12347. [Google Scholar] [CrossRef] [Scilit]
- Xiang, X.-M.; Dong, X.-C.; He, J.-Q.; Zheng, Y.-K.; Li, X.-Y. A Study on the Fault Location of Secondary Equipment in Smart Substation Based on the Graph Attention Network. Sensors 2023, 23, 9384. [Google Scholar] [CrossRef] [Scilit] [PubMed]
- Guo, Z.; Luo, W.; Wei, J.; Wang, J. Intelligent Diagnosis of Power System Secondary Equipment Based on Selective Bayesian Networks and XGBoost. Eng. Res. Express 2025, 7, 035343. [Google Scholar] [CrossRef] [Scilit]
- Pan, J.; Gao, X.; Chen, Q.; Wang, Y. Predictive Modeling of Power Equipment Operation and Maintenance Based on Event Knowledge Graph. In Proceedings of the 2023 International Conference on Power, Electrical Engineering, Electronics and Control (PEEEC), Shenyang, China, 15–17 September 2023. [Google Scholar]
- Huang, X.; Li, P.; Wang, Y.; Ren, X.; Zhao, Z.; Li, G. Knowledge Graph-Augmented ERNIE-CNN Method for Risk Assessment in Secondary Power System Operations. Energies 2025, 18, 2104. [Google Scholar] [CrossRef] [Scilit]
- Zhu, P.; Li, Y.; Xu, P.; Li, P.; Zhao, Z.; Li, G. Secondary Operation Risk Assessment Method Integrating Graph Convolutional Networks and Semantic Embeddings. Sensors 2025, 25, 1934. [Google Scholar] [CrossRef] [Scilit] [PubMed]
- Tan, J.C.; Crossley, P.A.; Kirschen, D.; Goody, J.; Downes, J.A. An expert system for the back-up protection of a transmission network. IEEE Trans. Power Deliv. 2000, 15, 508–514. [Google Scholar] [CrossRef] [Scilit]
- Xiong, J.; Yang, P.; Chen, B.; Chen, Z. Defect Identification Method of Power Grid Secondary Equipment Based on Coordination of Knowledge Graph and Bayesian Network Fusion. Energy Eng. 2026, 123, 1–18. [Google Scholar] [CrossRef] [Scilit]
- Wu, D.; Zhao, R.; Tan, Y.; Yao, T.; Yang, X. A Method for Power Equipment Faults Knowledge Reasoning Based on Retrieval-Augmented Generation. In Proceedings of the 2025 2nd International Conference on the Frontiers of Electronic, Electrical and Information Engineering (ICFEEIE), Wuhan, China, 8–10 August 2025; pp. 448–455. [Google Scholar]
- Cheng, Y.; Zhao, H.; Xiang, D.; Zhang, Z.; Liu, G.; Liu, Y.; Zhao, J.; Cai, X. Power System Operational Reliability Evaluation with Retrieval-Augmented Generation Enhanced Large Language Model. Energy AI 2026, 24, 100688. [Google Scholar] [CrossRef] [Scilit]
- Zhao, H.; Cheng, Y.; Xiang, D.; Zhou, X.; Zhao, J.; Cai, X.; Dong, Z. Large Language Model-Based Power Dispatch Agent: Framework, Application and Challenges. Int. J. Electr. Power Energy Syst. 2026, 175, 111653. [Google Scholar] [CrossRef] [Scilit]
- Xiao, Z.; Liu, H.; Zhou, X.; Cong, S.; Ju, Y. Power Ops Agent: A Knowledge and Data Dual-Driven Multi-Agent Framework for Substation Operation and Maintenance. Expert Syst. Appl. 2026, 318, 131965. [Google Scholar] [CrossRef] [Scilit]
- Gao, Y.; Xiong, Y.; Gao, X.; Jia, K.; Pan, J.; Bi, Y.; Dai, Y.; Sun, J.; Wang, M.; Wang, H. Retrieval-Augmented Generation for Large Language Models: A Survey. arXiv 2023, arXiv:2312.10997. [Google Scholar]
- Edge, D.; Trinh, H.; Cheng, N.; Bradley, J.; Chao, A.; Mody, A.; Truitt, S.; Larson, J. From Local to Global: A Graph RAG Approach to Query-Focused Summarization. arXiv 2024, arXiv:2404.16130. [Google Scholar]
- Guo, Z.; Xia, L.; Yu, Y.; Ao, T.; Huang, C. LightRAG: Simple and Fast Retrieval-Augmented Generation. arXiv 2024, arXiv:2410.05779. [Google Scholar]
- Chen, Q.; Li, Q.; Wu, J.; Mao, C.; Peng, G.; Wang, D. Application of Knowledge Graph in Power System Fault Diagnosis and Disposal: A Critical Review and Perspectives. Front. Energy Res. 2022, 10, 988280. [Google Scholar] [CrossRef] [Scilit]



Disclaimer/Publisher’s Note: The statements, opinions and data contained in all publications are solely those of the individual author(s) and contributor(s) and not of MDPI and/or the editor(s). MDPI and/or the editor(s) disclaim responsibility for any injury to people or property resulting from any ideas, methods, instructions or products referred to in the content. |
© 2026 by the authors. Licensee MDPI, Basel, Switzerland. This article is an open access article distributed under the terms and conditions of the Creative Commons Attribution (CC BY) license.