


Abstract
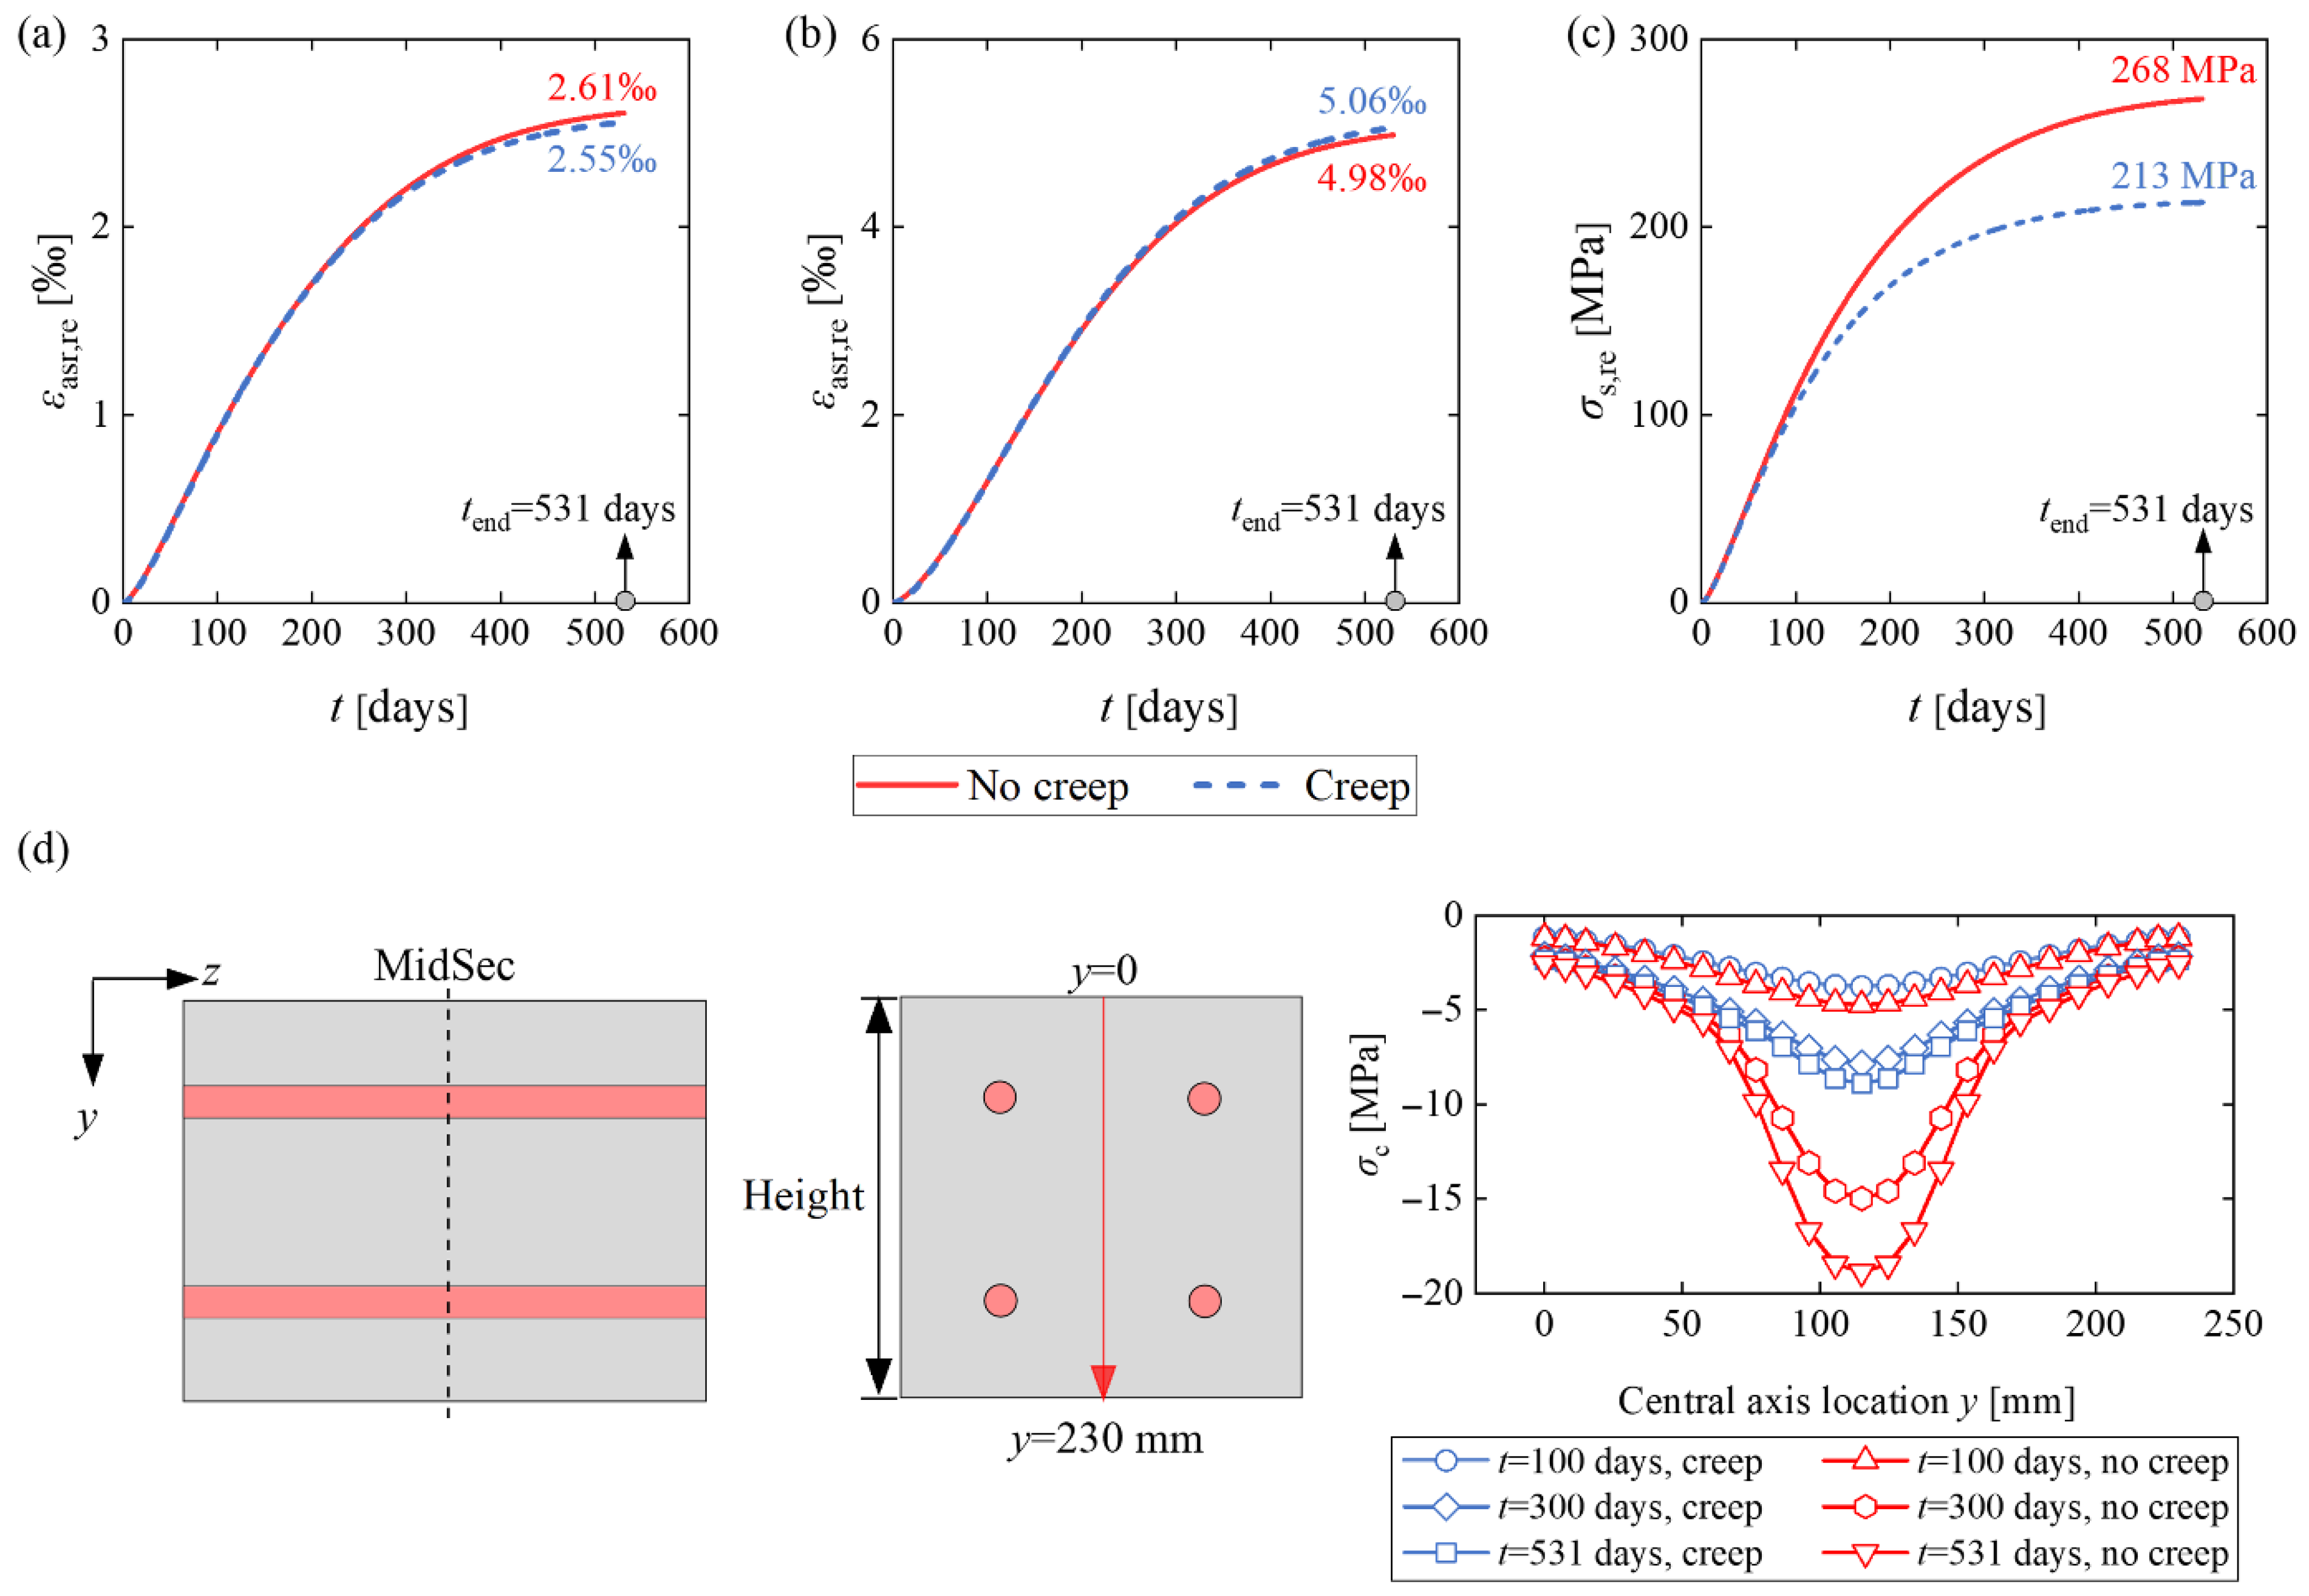
The condition assessment of alkali-silica reaction (ASR)-damaged concrete structures necessitates accurate reproduction of ASR expansion progression and its induced load effects across time and spatial dimensions. To address this challenge, a time-dependent free ASR expansion model was developed based on experimental measurements. A user subroutine incorporating stress-dependent behavior for restrained ASR expansion evolution was implemented on the ABAQUS platform and validated through simulation of ASR expansion in specimens under external loading and internal reinforcement restraint. Finite element analyses of the reinforced concrete specimens revealed distinct variations in ASR expansion between the surface and interior zones of concrete members. The assumption that surface ASR expansion strain equals steel rebar strain leads to significant overestimation of actual rebar stress and strain conditions. Additionally, based on the validated finite element model, the influence of elastic modulus, creep, stress-dependent function, steel plate thickness, and reinforcement ratio on the ASR expansion was investigated. For the reinforced concrete specimens, the stress variation over the cross-section is considerably reduced when creep is considered, while the concrete strain at the surface is only slightly influenced by creep.
1. Introduction
1.1. Background and Motivation
Alkali-silica reaction (ASR) is a durability concern in existing concrete structures, caused by the chemical reaction between reactive silica in aggregates and alkalis in cement clinker. In the presence of water, ASR-induced gel expansion creates increasing internal pressure within localized regions of the cementitious matrix, leading to deformation and potentially initiating micro- to macro-cracking and excessive expansion [1]. Recently, the solidification pressure exerted by precipitating negatively charged ASR products has been demonstrated to be the mechanism leading to aggregate cracking and expansion of ASR-affected concrete [2]. ASR expansion results in concrete property deterioration, surface map cracking, and structural misalignment [3]. Evidence of ASR deterioration has been documented in dams, bridges, and building structures worldwide, particularly in the UK [3], France [4], Canada [5], Japan [6], Denmark [7], and Norway [8,9]. The ASR-induced permanent deterioration at both material and structural levels has attracted significant attention from researchers, engineers, and infrastructure administrators. Consequently, accurate estimation of ASR expansion progression and quantitative assessment of damaged concrete structures across time and space are crucial for ensuring structural safety throughout the service life.
1.2. State-of-the-Art
1.2.1. Restrained ASR Expansion
In concrete structures, ASR expansion is inherently restrained by surrounding non-active concrete elements, externally applied stresses, and internal reinforcement. This restraint leads to reduced or inhibited expansion in the direction of constraint, with dominant cracks forming parallel to this direction [3]. In ASR-affected reinforced concrete (RC) structures, the restrained ASR expansion generates a prestressing effect, resulting in concrete under compression and steel reinforcement under tension, potentially leading to yielding and rupture [6]. Experimental studies investigating the influence of applied stresses and reinforcement on ASR expansion have been conducted over recent decades [10,11,12,13,14,15,16,17,18,19,20,21,22,23,24]. These studies have established several consistent conclusions: specimens under applied compressive stresses exhibit decreased expansion compared to unloaded specimens, external tensile stress shows negligible impact on ASR expansion, and expansion remains largely unaffected by restraint perpendicular to its direction. Although laboratory testing provides quantitative data on ASR expansion response under restraints, it has limitations. For instance, due to technical constraints of testing equipment, measurements are often restricted to specimen surface expansion.
1.2.2. Numerical Modeling
In contrast to laboratory testing, numerical simulation offers a comprehensive approach for monitoring ASR expansion without constraints on measurement points or spatial limitations. Numerical models for ASR expansion have evolved alongside laboratory experiments, spanning micro-, meso-, and macro-scales [25]. Micro-scale models can be categorized into two types. The first type [26,27] focuses on micro-physical mechanisms contributing to ASR expansion, including alkali diffusion, ASR gel formation, and water supply. The second type [28,29] emphasizes the simulation of deterioration effects caused by gel expansion-induced pressure, based on linear elastic fracture mechanics. This approach models a representative elementary volume (REV) of concrete with ASR-induced damage through a synthesis of distributed micro-cracks and mean-field homogenization. However, these models are heavily dependent on reaction and swelling phenomena and mathematical assumptions, making their application challenging in the condition assessment of ASR-affected infrastructure.
Meso-scale models, which separately simulate aggregates, cement paste, and interfacial transition zones, effectively reproduce ASR expansion-induced cracking and stiffness degradation through finite-element [30] or discrete-element analysis [31,32,33]. Although recent models [32,33] have successfully incorporated steel reinforcement and concrete-rebar interface simulations, the extensive computational time and storage requirements limit meso-scale models to local analysis of concrete members. Additionally, these models have not yet successfully captured the decreased expansion phenomenon under compressive stress.
The micro-macro models, also known as thermo-chemo-mechanical models, were initially proposed by Ulm et al. [1] based on reaction-swelling kinetics. Subsequent developments have produced more sophisticated models incorporating chemo-plasticity of ASR swelling, stress dependence, and concrete damage [4,34,35,36,37,38]. These advanced models have been successfully applied to service performance assessments of dams, bridges, and shear walls. Additionally, the macro-scale models to simulate the orthotropic ASR expansion have been developed based on global kinetics, including temperature and humidity effects [39,40]. However, determining ASR expansion evolution through these models requires numerous variables related to the physicochemical reaction process, limiting their widespread application.
Additionally, Morenon et al. [41] have developed a constitutive law for concrete suffering from ASR within the poromechanical framework. In this law, cracking is represented by two components: structural cracking, modeled using the smeared crack approach, and ASR-induced diffuse cracking. This model has been successfully applied to assess the residual flexural capacity of laboratory beam specimens subjected to ASR [41,42]. Gorga et al. conducted a 3D numerical assessment of the damage condition for an ASR-affected concrete overpass in service for 50 years [5]. However, the reference did not clearly describe the free expansion data, including the final expansion strain and the evolution function. It can be inferred that the final expansion was determined from microscopic testing of drill core samples, while the expansion evolution function was based on the thermo-chemo-mechanical model developed by Ulm et al. [1]. Kongshaug et al. [43] developed a constitutive model for ASR-affected concrete that accounts for stress-dependent anisotropic expansion, deterioration of mechanical properties, creep, cracking, and crushing. This model was extended from 1D to 3D and applied to simulate the damage condition of a continuous concrete beam bridge in Norway [44]. A linear expansion evolution function over time was assumed due to the lack of sufficient expansion monitoring data.
1.3. Existing Research Gaps
Despite the above efforts, several significant research gaps remain to be solved, and the following are addressed in the present research work:
- (1)
- A simplified time-dependent free ASR expansion model is needed as input data for the restrained ASR expansion simulation. This model should minimize the number of variables to facilitate practical engineering applications.
- (2)
- There is a critical need to develop a comprehensive numerical model at the macro-scale that can accurately simulate ASR expansion evolution under both external and internal restraints while incorporating stress-dependent behavior.
- (3)
- It should be possible to identify the model parameters from experimental testing.
- (4)
- The general validity of the model should be proven by showing that the same model parameters can be used to describe the structural behavior of several types of structural members with sufficient accuracy.
- (5)
- The influence of ASR-induced deteriorated concrete elastic modulus, creep, stress-dependent function, external loading, and reinforcement ratio on ASR expansion should be numerically quantified.
1.4. Aim and Scope of This Study
This study aims to develop a numerical model to simulate the restrained ASR expansion advancement and to establish a framework for load effect prediction. A normalized time-dependent free ASR expansion model was developed based on measurements of free ASR expansion history from a comprehensive laboratory program, which were part of the PhD study by Kathrine Mürer Stemland [20]. Using the ABAQUS platform, finite element models incorporating a user subroutine for restrained ASR expansion simulation were established and validated against experimental data. Additionally, based on the validated finite element models, the influence of ASR-induced deteriorated concrete elastic modulus, creep, stress-dependent function, external loading, and reinforcement ratio on ASR expansion has been studied. The novelty of this study is the establishment of the time-dependent free ASR expansion model and the development of a user subroutine for restrained ASR expansion simulation for laboratory samples. This programming can also be extended to applications in real structures.
This research constitutes a part of the MESLA (Management and Extension of Service Life of infrastructures affected by Alkali-silica reactions) project funded by the Norwegian Research Council. The project period is 2021–2026, and the project owner is the Norwegian University of Science and Technology (NTNU). The overall aim of MESLA is to build up new knowledge regarding the management and maintenance of existing ASR-affected structures in technically, economically, and environmentally beneficial ways, and verify how this knowledge can be applied to ensure structural safety and extend the service life of existing bridges in Norway.
2. Experimental Program
2.1. Materials and Methods
2.1.1. Test Design and Measurement
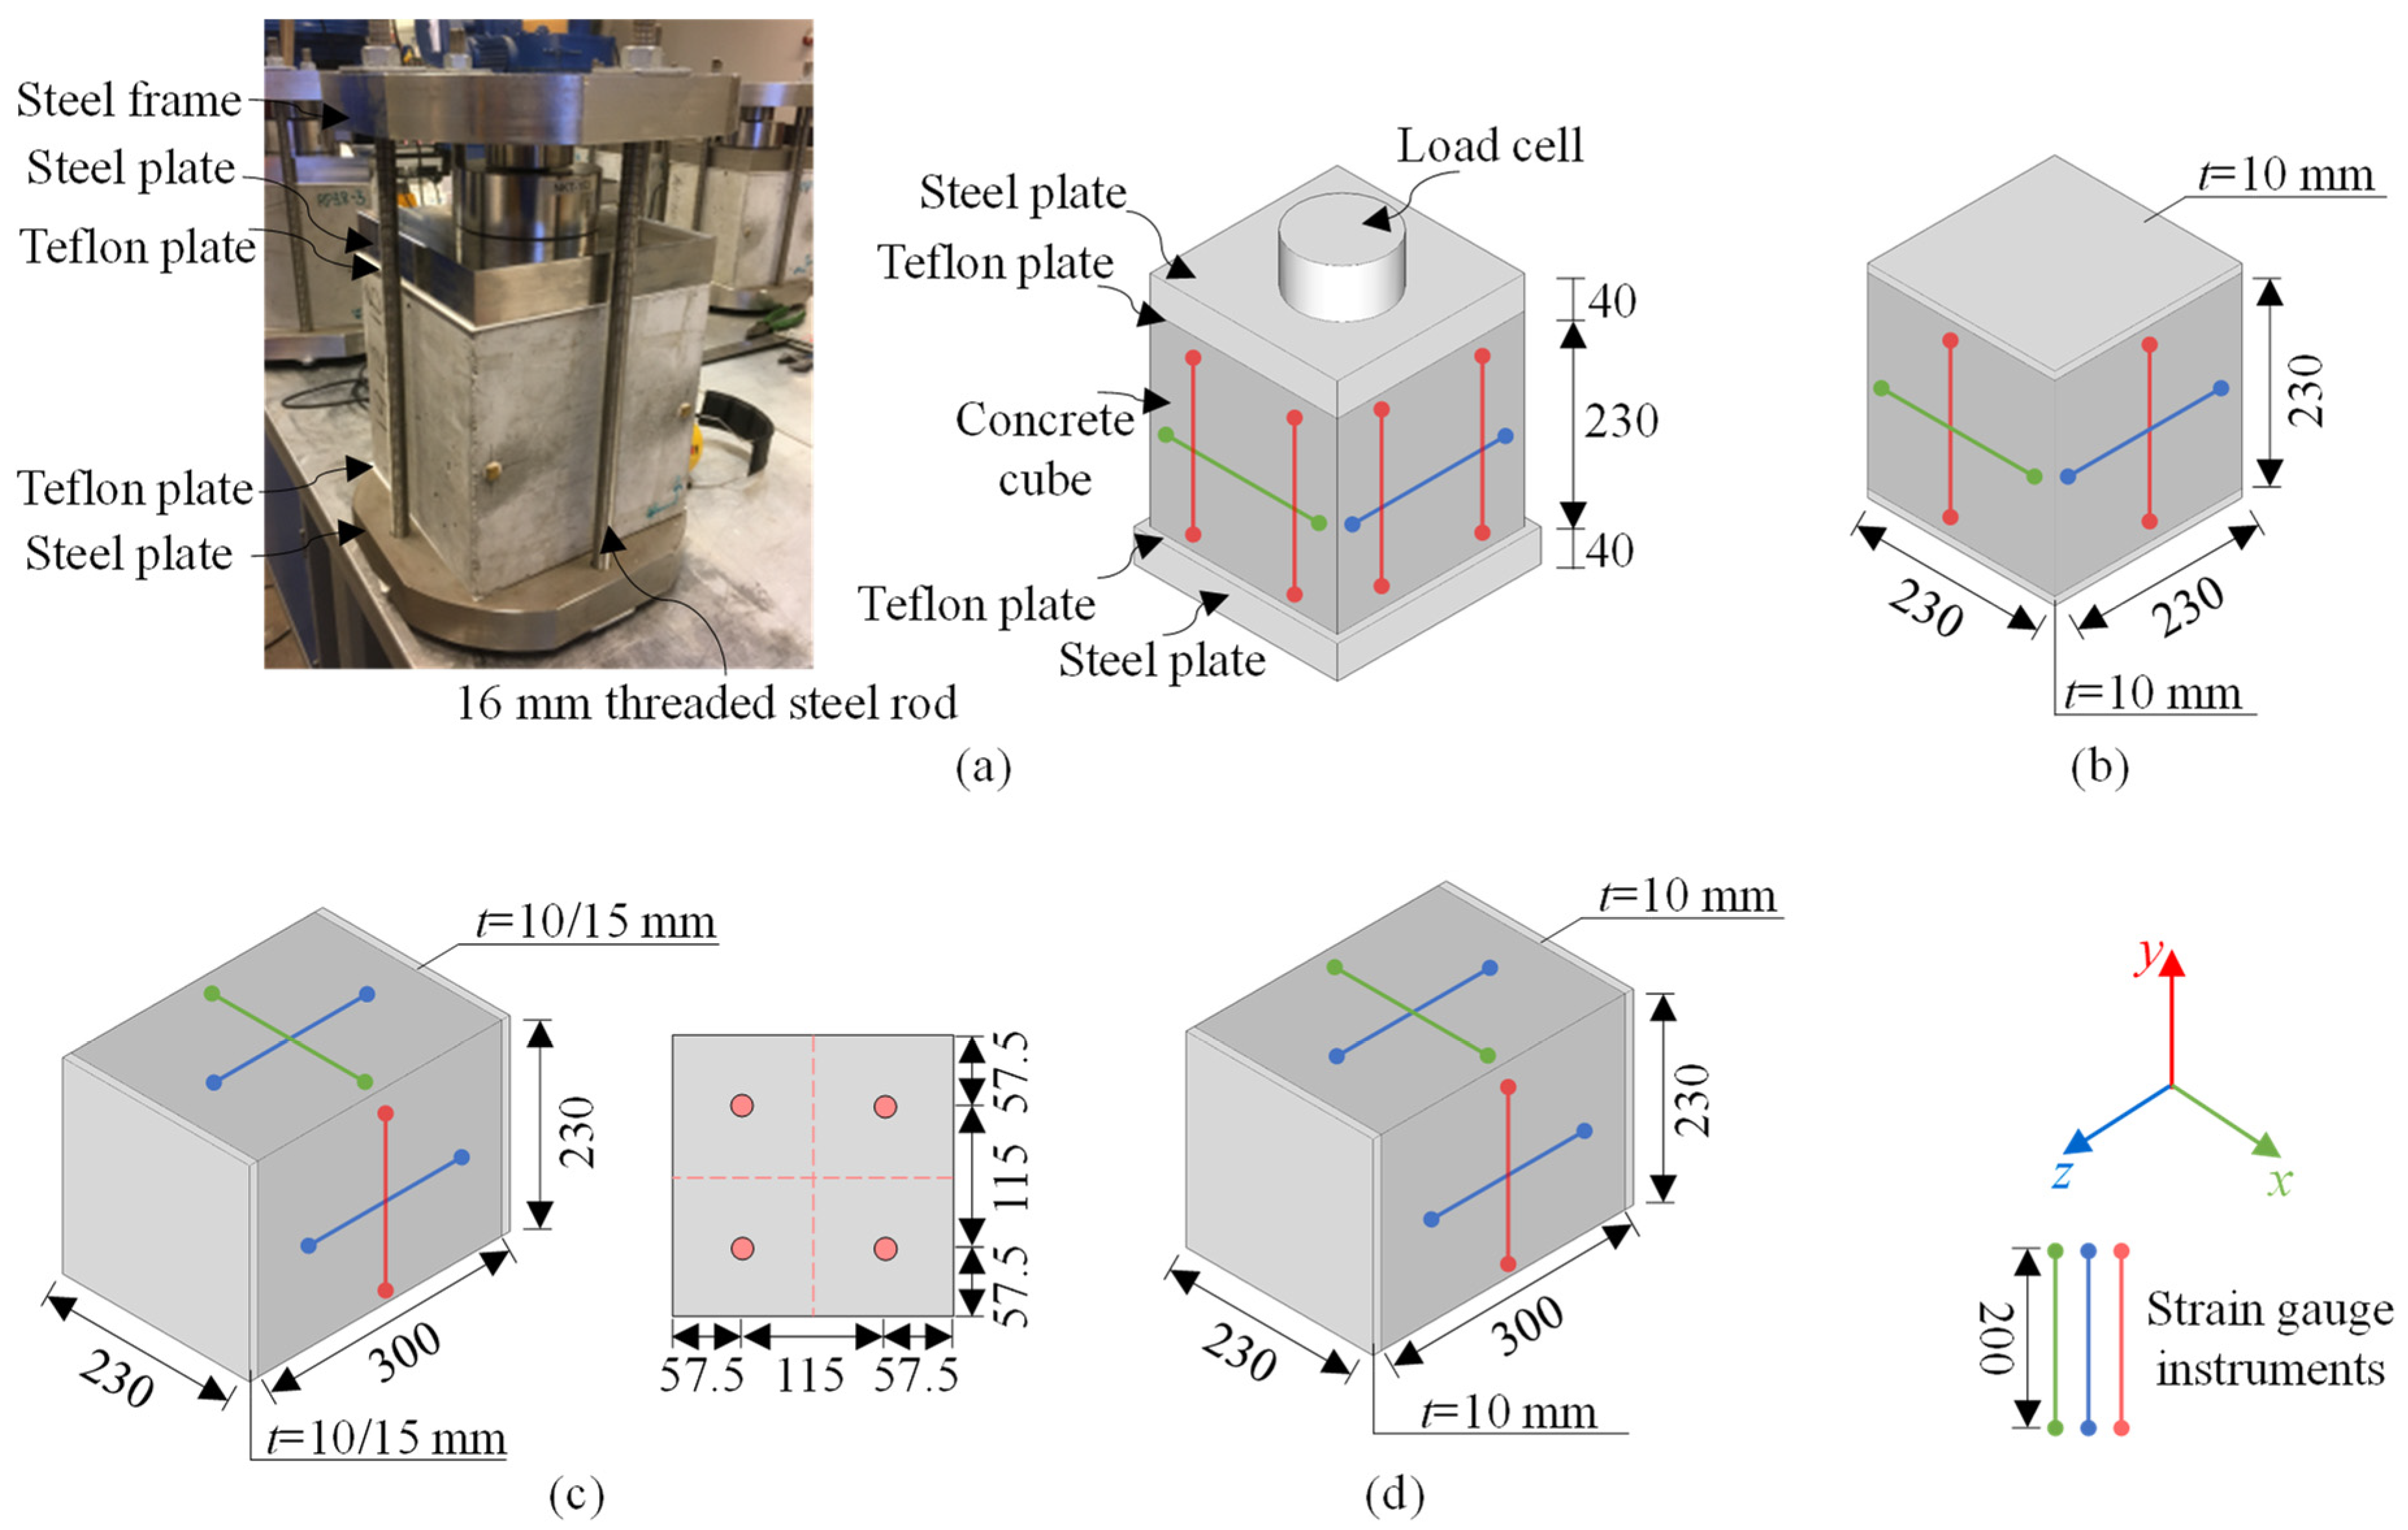
Table 1 lists the ASR expansion test overview; each test had one sample. The tests consisted of two campaigns, which were conducted in 2019 and 2020, respectively [20]. To quantify the influence of external and internal restraints on ASR expansion, the restrained samples were divided into two types: plain concrete cubes (230 mm × 230 mm × 230 mm) under external compressive stress, and reinforced concrete prisms (230 mm × 230 mm × 300 mm) with four internal ribbed steel rebars (diameters varying from 10 mm, 16 mm to 20 mm). These samples are labeled as 2019/2020-LoadCube and 2019/2020-RcPrism. Additionally, free ASR expansion cube and prism samples, marked as 2019/2020-Cube and 2019/2020-Prism, were designed as references for the restrained expansion samples.
Table 1.
Test sample overview [20].
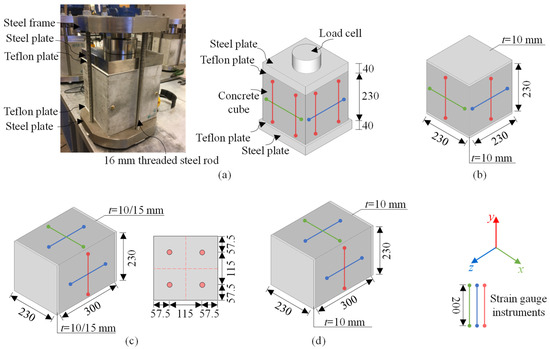
Figure 1 illustrates the test samples and expansion measuring methods. For the LoadCube samples, a steel frame was designed to apply a constant 3 MPa compressive stress to the cube surface by tightening the rods. A load cell was placed between the steel frame and a 40 mm thick steel plate attached to the LoadCube top surface to measure the applied load. Two Teflon layers were placed between the LoadCube and the steel plates to prevent side-way restraint. To ensure a similar moisture storage condition, two steel plates with a thickness of 10 mm were attached to the top and bottom surfaces of the free cube samples. For the RcPrism samples, two 10/15 mm-thick (10 mm for 2019-RcPrism-4ds10, 2019-RcPrism-4ds16, and 2020-RcPrism-4ds16, and 15 mm for 2020-RcPrism-4ds20) steel plates were placed at the two end surfaces. The rebars were welded to the steel plates. Accordingly, the free prism samples were equipped with two 10 mm thick steel plates at similar end surfaces. The expansion was measured between glued metal studs with a distance of 200 mm in each direction on all available surfaces using a Digital DEMEC Mechanical Strain Gauge instrument.
Figure 1.
Specimen design (unit: mm): (a) LoadCube samples; (b) free expansion cube samples; (c) RcPrism samples and cross-section; and (d) free expansion prism samples [20].
2.1.2. Materials and Properties Characterization
The concrete mix was designed to be representative of concrete used in Norwegian bridges built in the 1960s–1970s. The mix [20] contains alkali-reactive coarse aggregate from crushed cataclasite (Ottersbo 4/16 mm), non-reactive sand mainly consisting of granite and gneiss (Årdal 0/4 mm), 457 kg/m3 ordinary Portland cement (Norcem Industry, CEM I 42.5R with 1.24% Na2Oeq), which gives an alkali content of 5.6 kg Na2Oeq/m3. The 2019 series and 2020 series adopted similar concrete mixes, but different water-cement ratios (0.47 for the 2019 series and 0.54 for the 2020 series).
All the ASR expansion samples were stored in containers with a constant temperature of 38 °C and 100% RH to accelerate the reaction. The reference samples were cured at 20 °C under wet burlaps and plastic sheets. The 28-day mechanical properties of the concrete are listed in Table 2. The ribbed steel rebars are of quality B500NC. Direct tension tests were carried out, and the elastic modulus Es, yield strength fsy, and yield strain εsy of the rebars are summarized in Table 3.
Table 2.
Basic mechanical properties of the applied concrete [20].
Table 3.
Basic mechanical properties of the rebars [20].
2.2. Test Results and Analysis
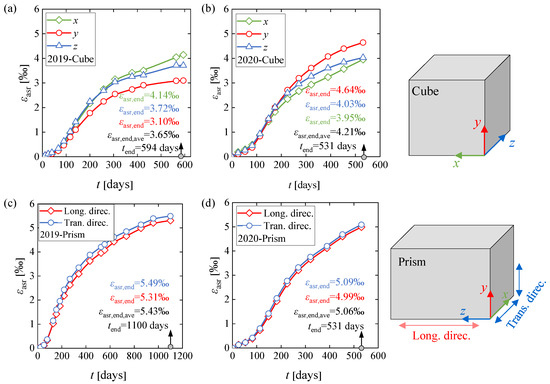
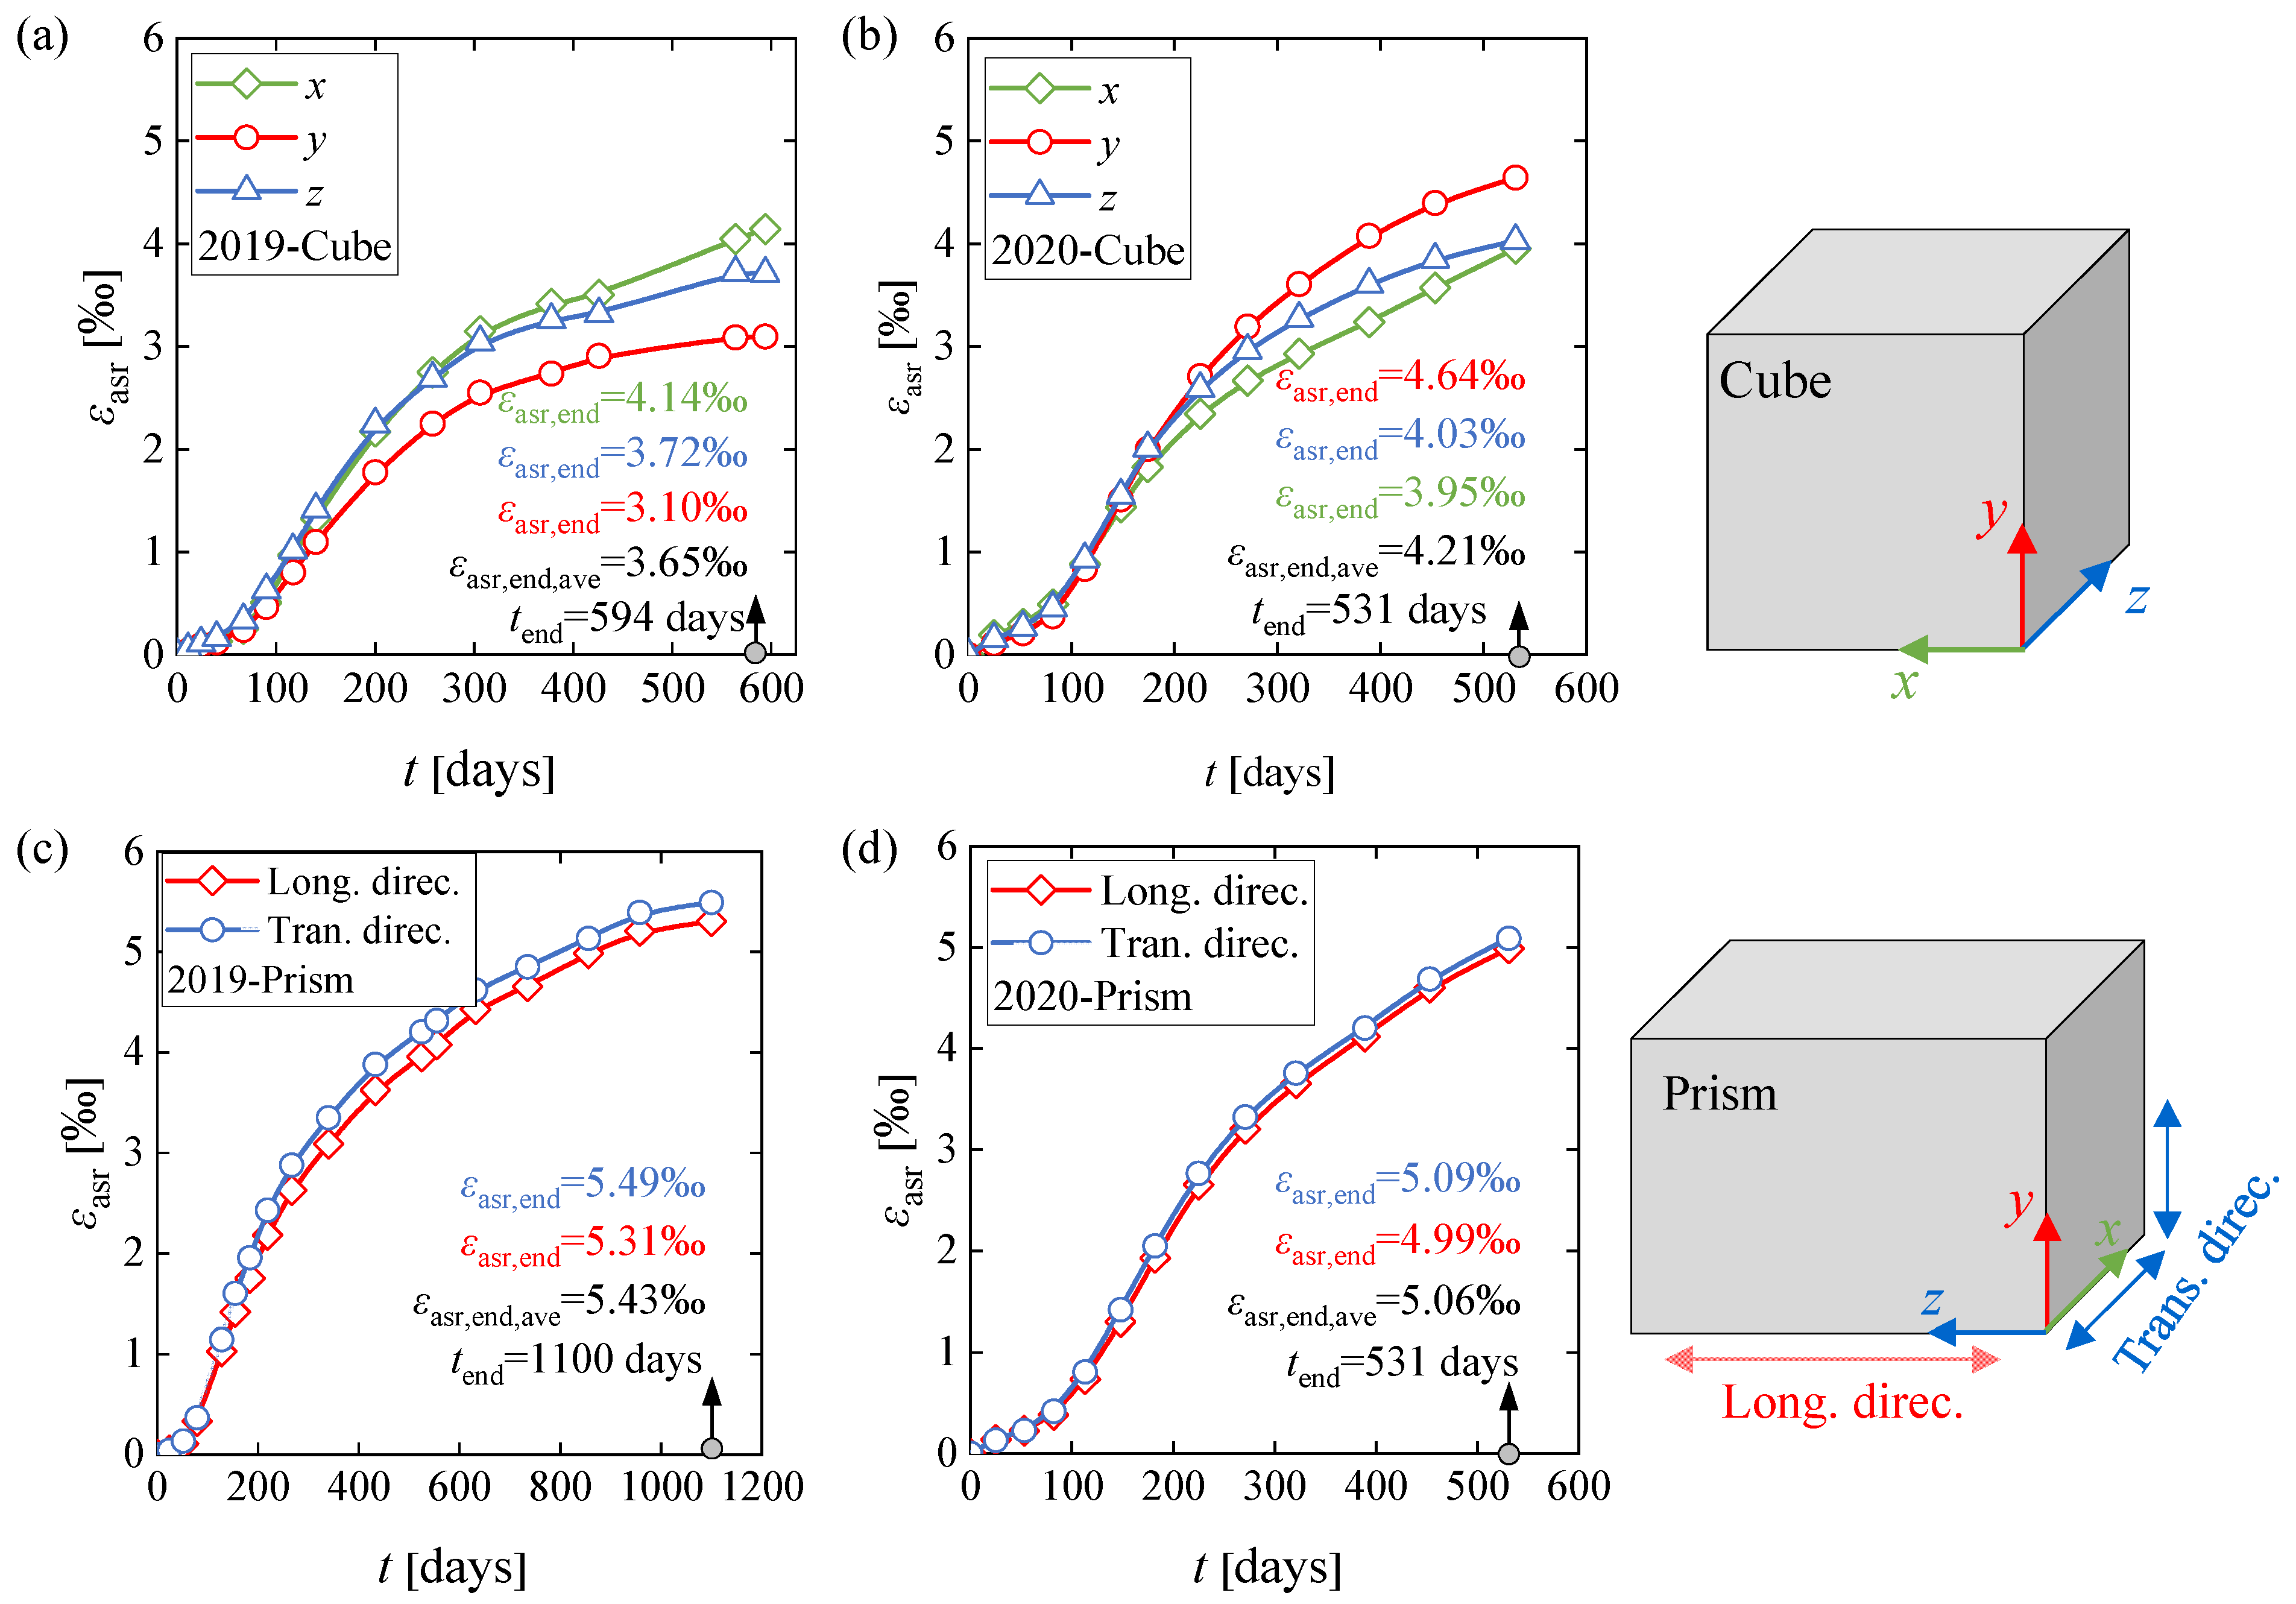
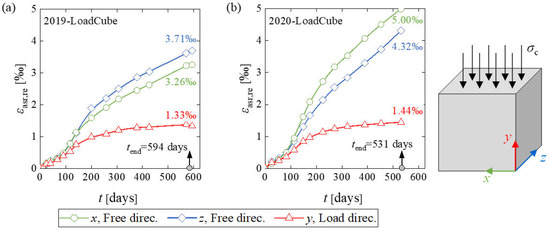
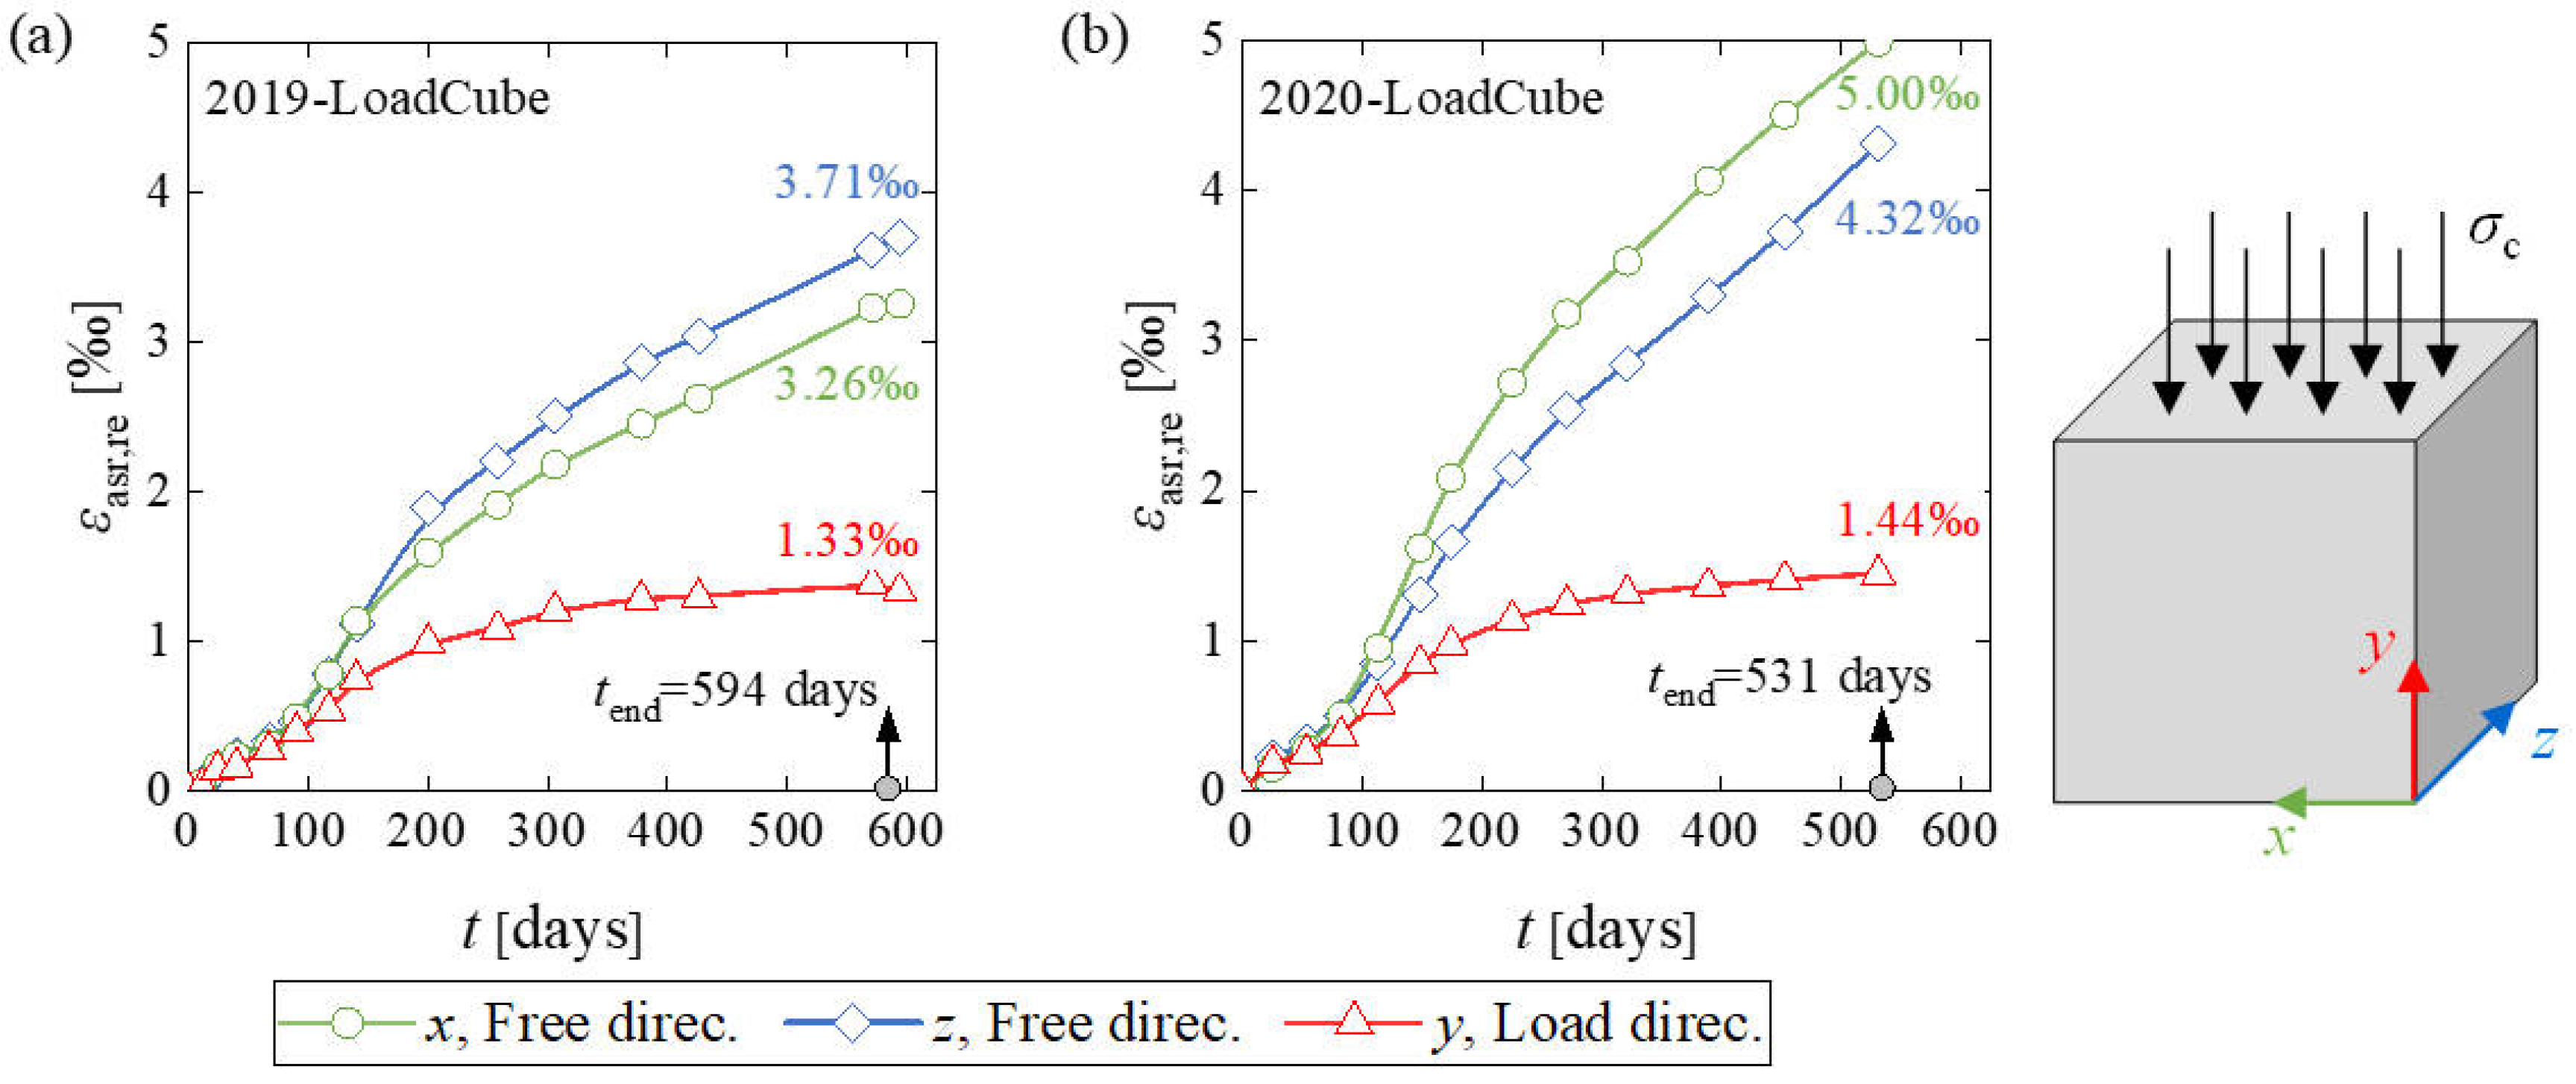
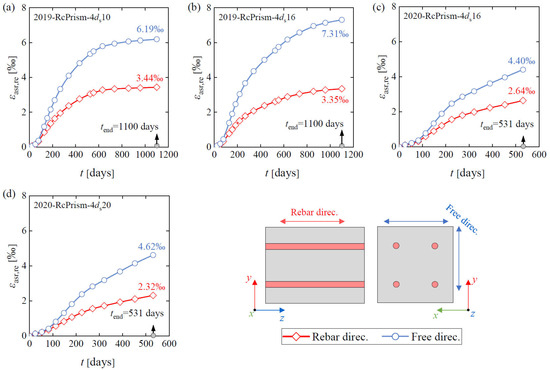
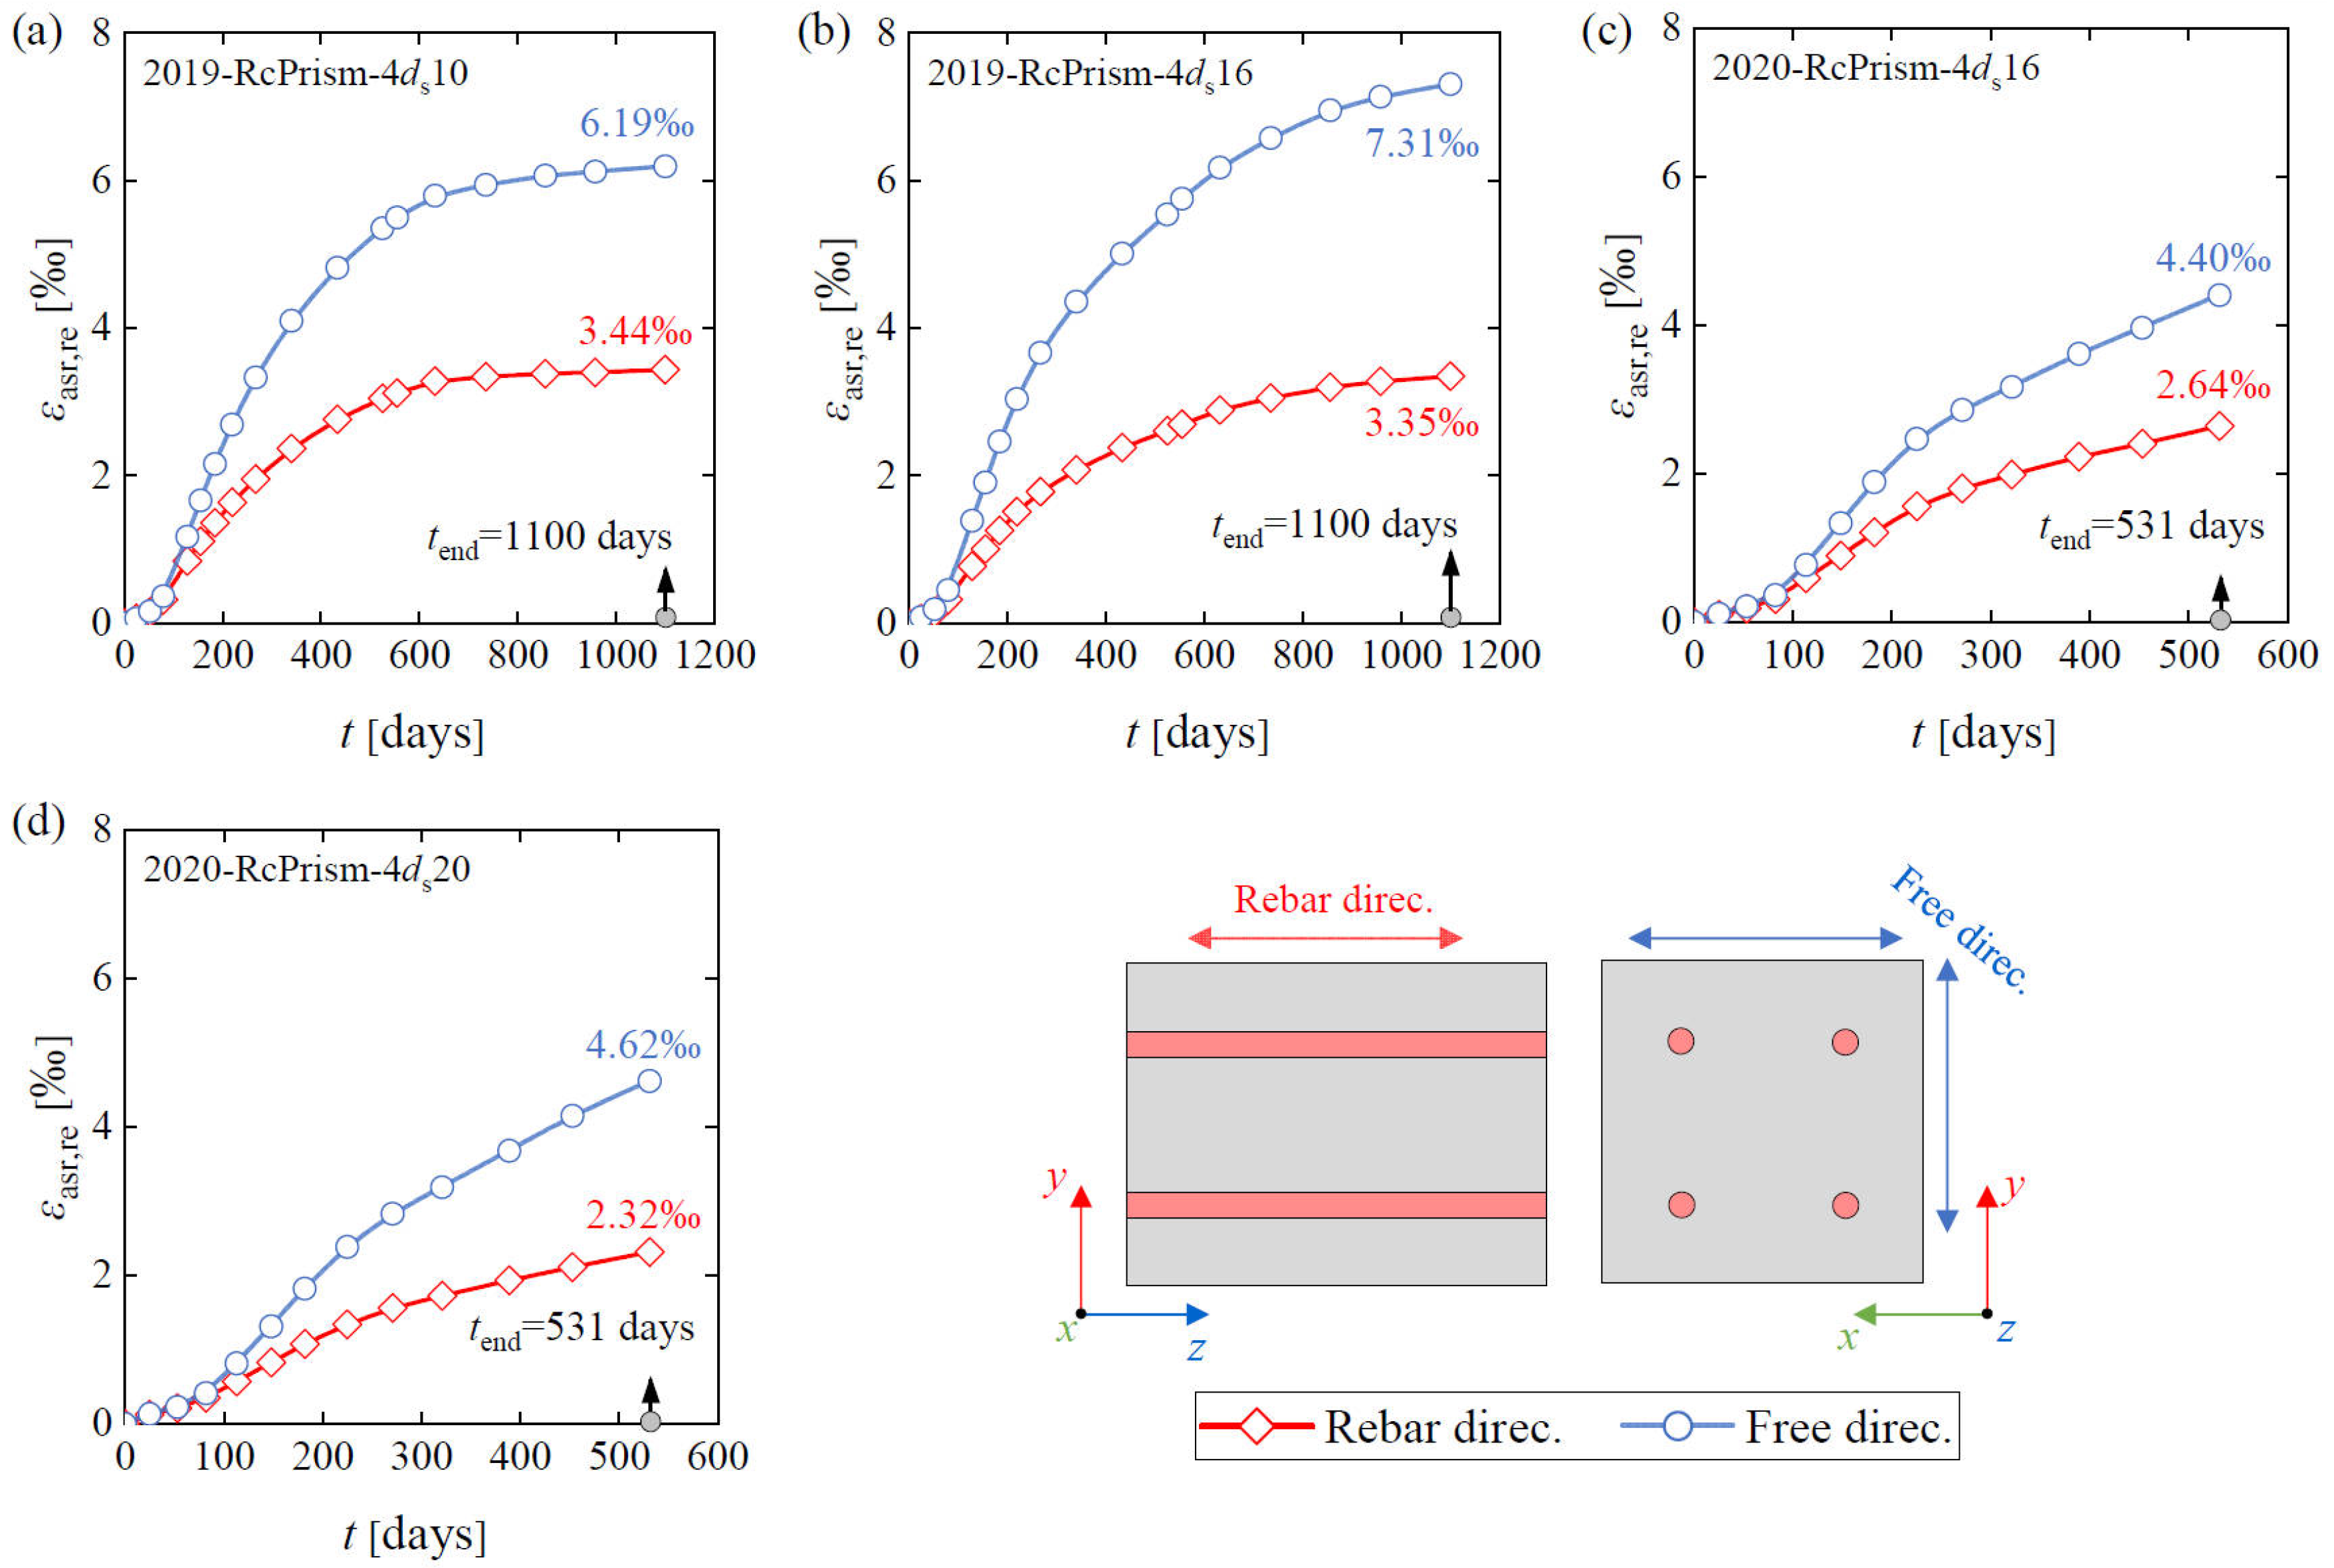
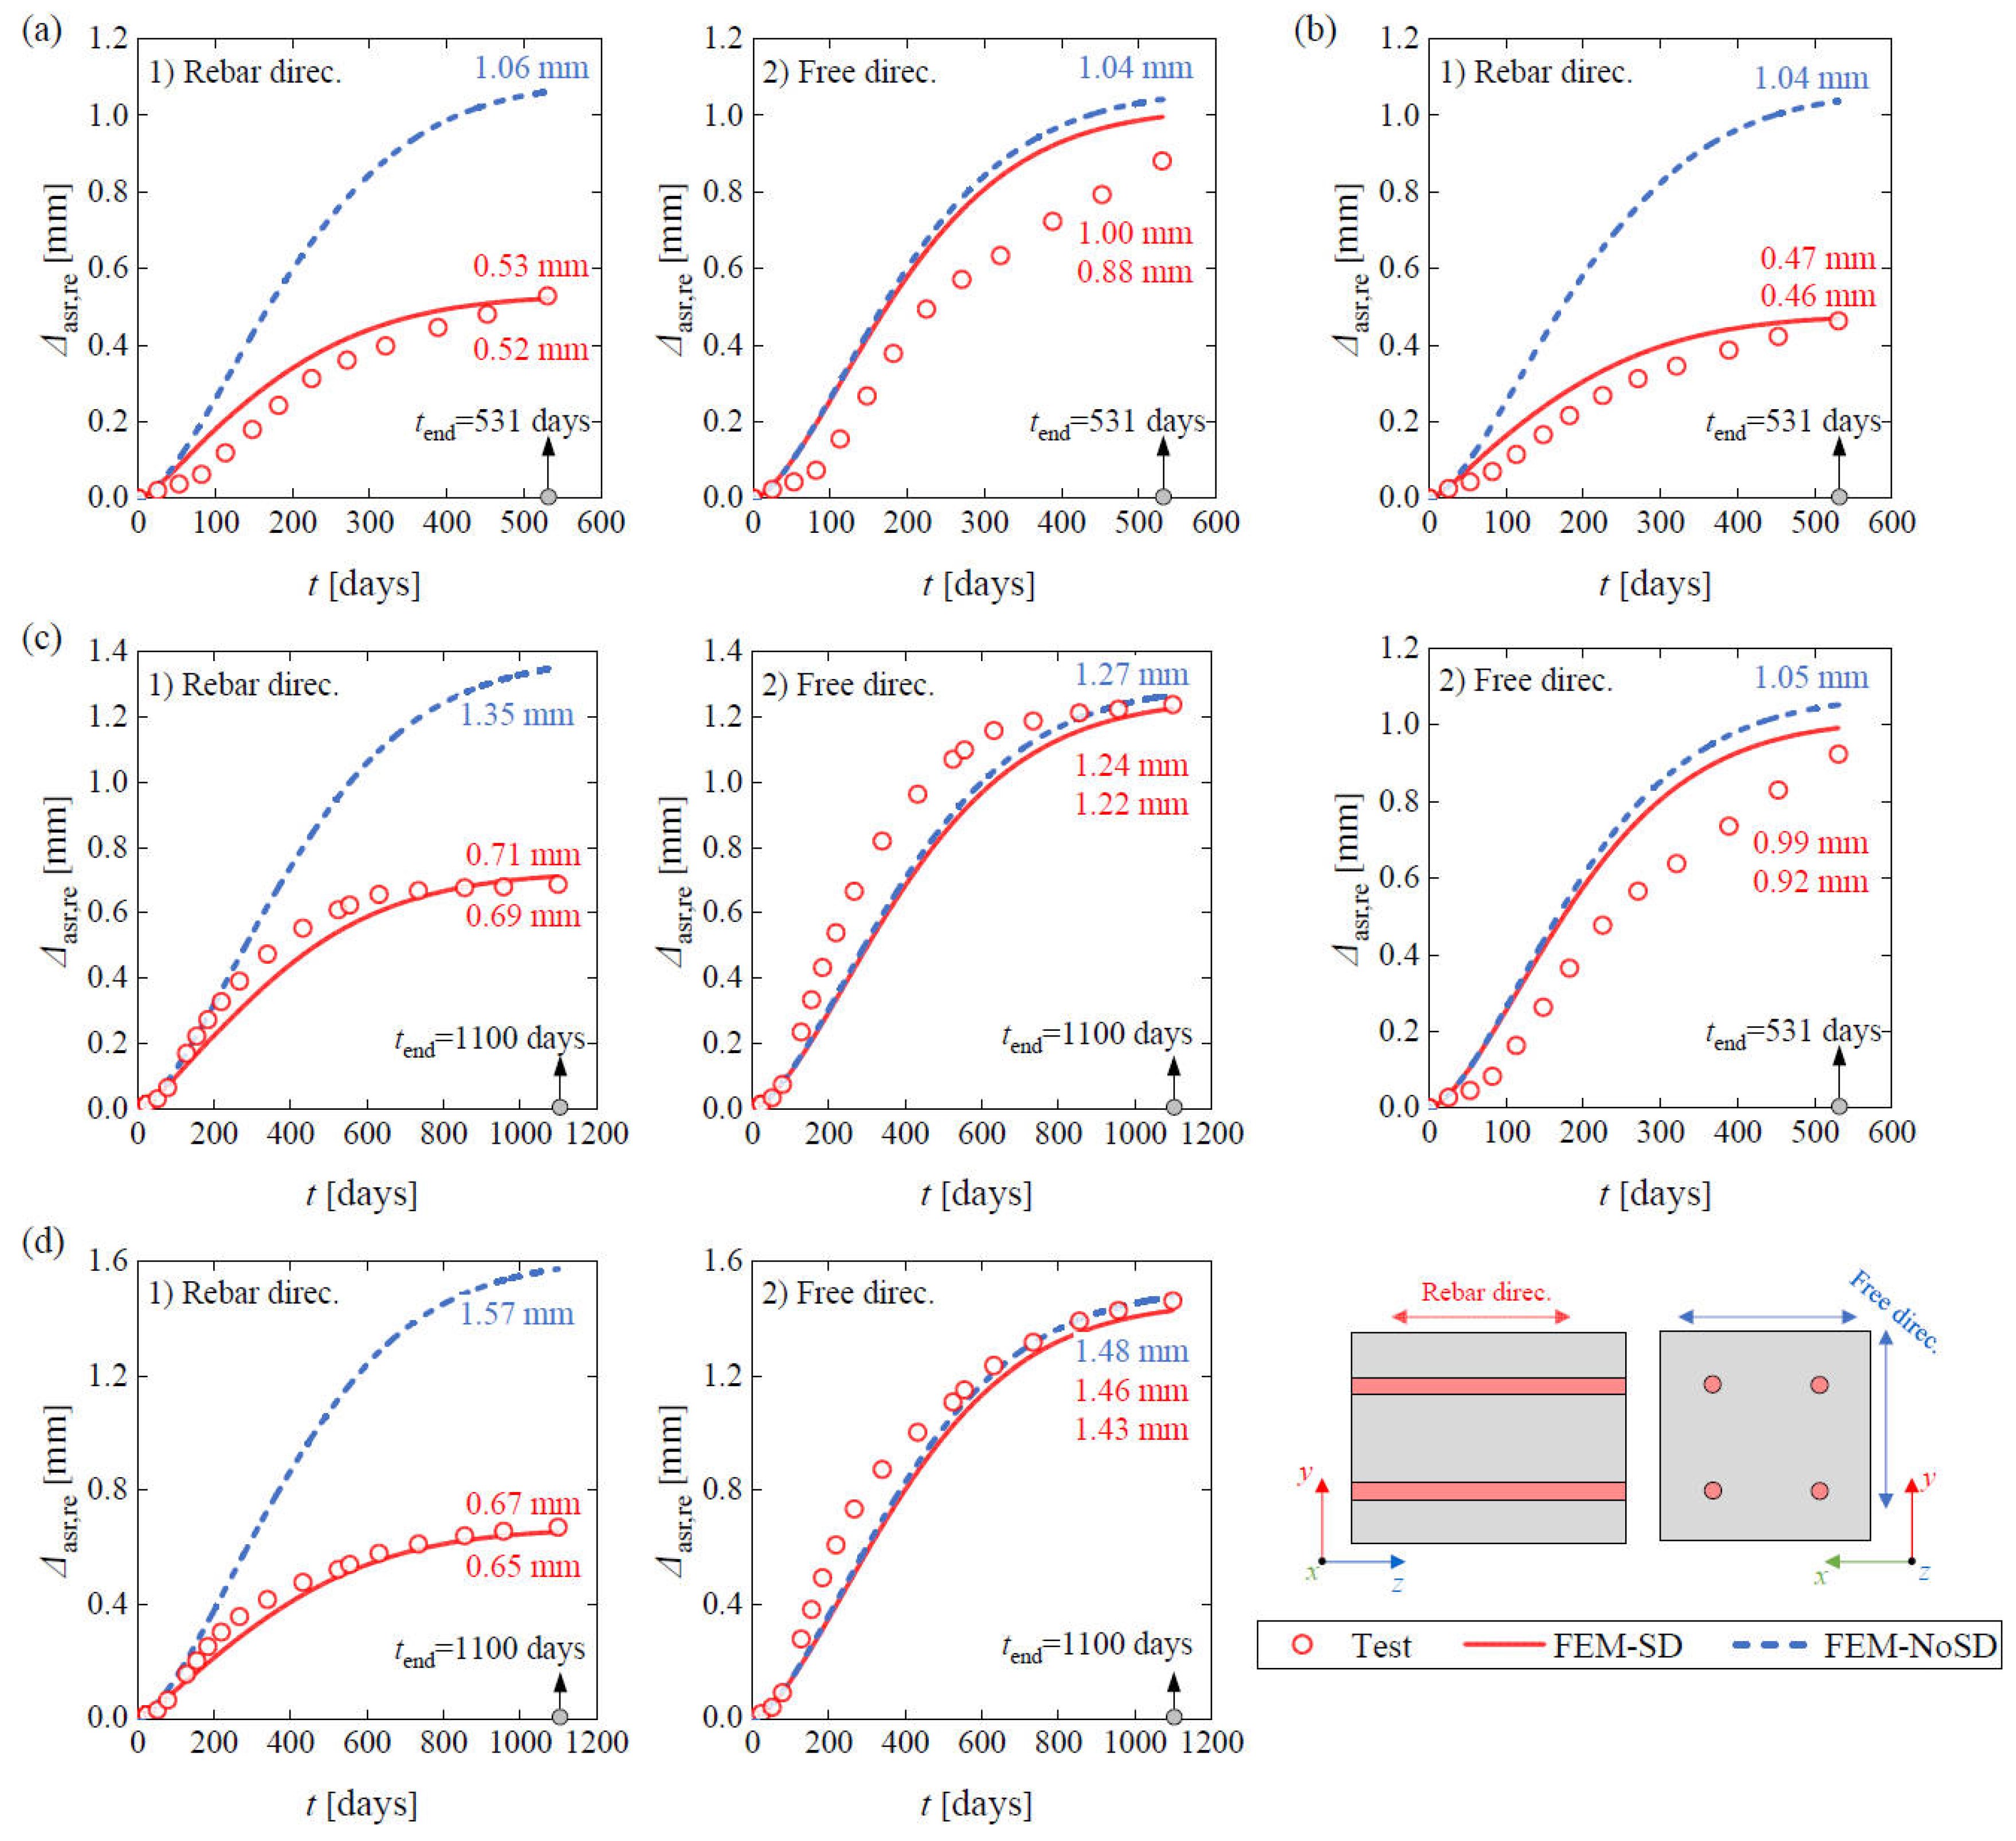
The measured expansions divided by the gauge length (200 mm) defined the expansion strains in ‰ (mm/m). The average results of the corresponding Digital DEMEC Mechanical Strain Gauge instruments in Figure 1 were used to identify the expansion response. Figure 2 shows the average free expansion development of the corresponding Cube and Prism samples. For the Prism samples, the expansion strain in the transversal direction is the average of the values at the x and y directions, while for the cubes, the free expansions in all three directions are presented. The single measurements are reported in [20]. Figure 3 presents the average restrained expansion development in the load direction and the average expansion in the free direction (without external load) of the LoadCube samples. Figure 4 illustrates the restrained expansion history in the rebar direction and the free direction (orthogonal to the rebar direction) of the RcPrism samples. In these figures, tend is the final expansion measuring date, εasr denotes the free ASR expansion strain (εasr,end corresponds to tend), while εasr,re denotes the restrained ASR expansion strain.
Figure 2.
Free ASR expansion history of: (a) 2019-Cube sample; (b) 2020-Cube sample; (c) 2019-Prism sample; and (d) 2020-Prism sample [20].
Figure 3.
Restrained ASR expansion history of: (a) 2019-LoadCube sample; and (b) 2020-LoadCube sample [20].
Figure 4.
Restrained ASR expansion history of: (a) 2019-RcPrism-4ds10 sample; (b) 2019-RcPrism-4ds16 sample; (c) 2020-RcPrism-4ds16 sample; and (d) 2020-RcPrism-4ds20 sample.
As demonstrated in Figure 3 and Figure 4, the ASR expansion strain in the load direction or in the rebar direction is significantly lower than in the corresponding free directions, indicating that restraints from external loading or internal reinforcement lead to significantly reduced expansion. The mechanism of the restrained ASR expansion will be interpreted in Section 3.1. The final expansion strains for all the samples are presented in Table 4. As illustrated, the free ASR expansion strains (free ASR expansion strain for free samples, and the restrained ASR expansion strain in the free direction for restrained samples) exhibited some scatter even if adopting the same concrete batch with the same expansion measuring duration. For the 2020-Cube sample, the average final free ASR expansion strain is 4.209‰ at 531 days, which is significantly lower than that of the 2020-Prism sample (5.056‰). The final free ASR expansion strains of the 2019-RcPrism-4ds10 and 2019-RcPrism-4ds16 samples are 6.195‰ and 7.306‰, respectively, which are larger than the 2019-Prism sample (5.432‰). While the final free ASR expansion strains of the 2020-RcPrism-4ds16 and 2020-RcPrism-4ds20 samples are 4.404‰ and 4.618‰, respectively, which are smaller than the 2020-Prism sample (5.056‰). This scatter can partly be due to the random surface cracks that occurred late in the expansion process, and which notably influence the measured expansion.
Table 4.
Final ASR expansion strain [20].
2.3. Free ASR Expansion Model
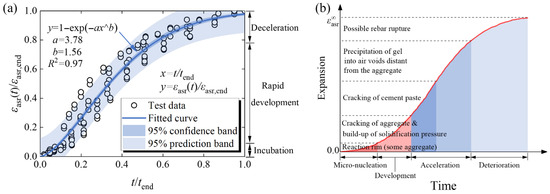
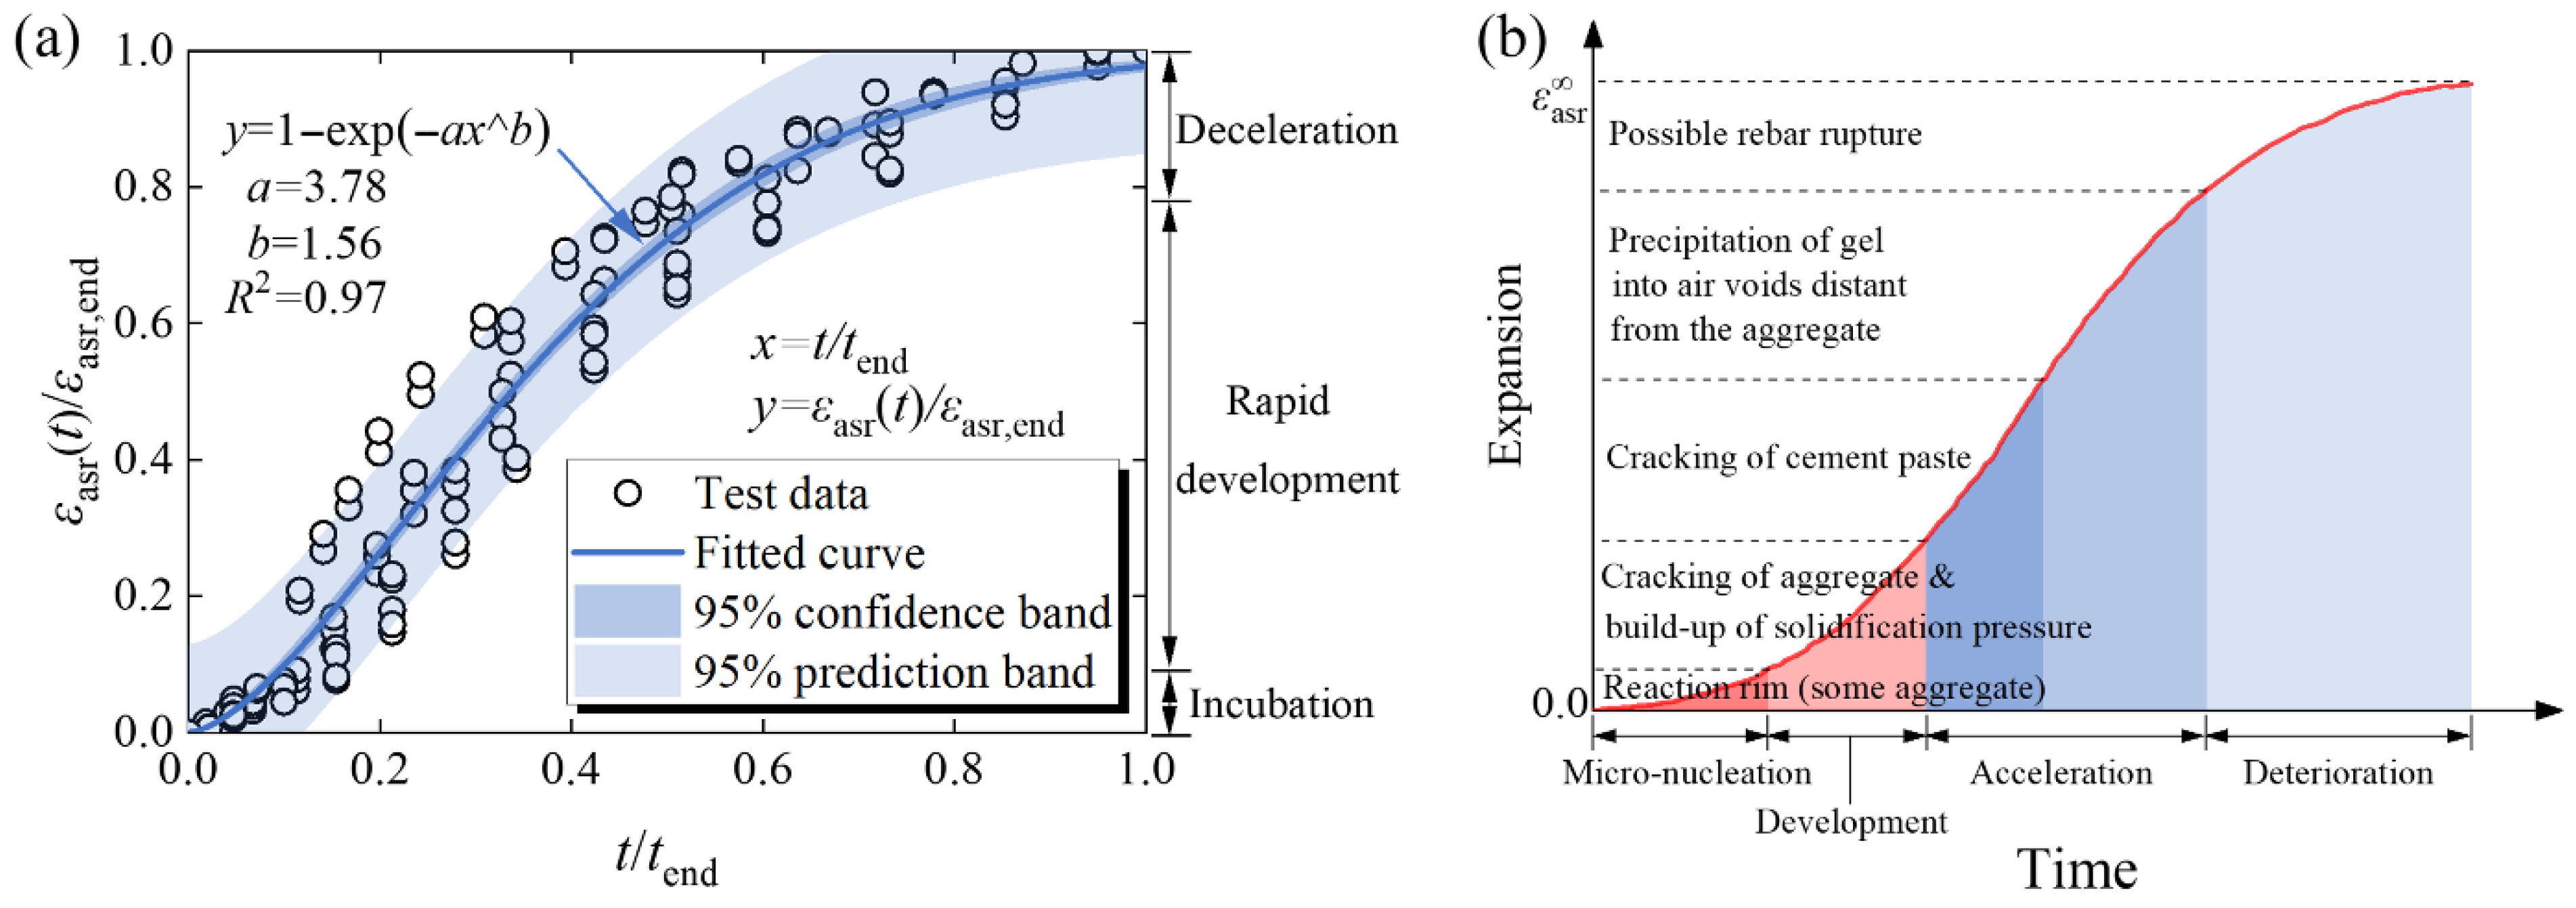
A time-dependent free ASR expansion function, which could identify the whole reaction process, is the basis for an accurate simulation of restrained ASR expansion development. Based on all the free ASR expansion test data in Figure 2, a normalized free ASR expansion model was proposed and fitted, given in Figure 5a and Equation (1):
where tend is the final measurement time, while εasr,end is the measured free ASR expansion strain at this time. Once εasr,end and tend are given, the whole ASR process can be achieved according to Equation (1). The parameters in Equation (1) were determined using nonlinear least-squares regression implemented in Python 3.13. The fitting was performed using the Levenberg–Marquardt algorithm with default convergence criteria.
Figure 5.
ASR expansion curve: (a) free ASR expansion model proposed in this study; (b) physical interpretation related to the ASR [2,46].
The proposed free ASR expansion model was compared with the physical interpretation curve of ASR [46] presented in Figure 5b. It can be observed that the two curves exhibit similar time-dependent trends, which could be divided into three stages: incubation, rapid development (with a constant expansion rate), and deceleration (approaching the limit).
3. Numerical Simulation
3.1. Mechanism, Methodology and Numerical Implementation
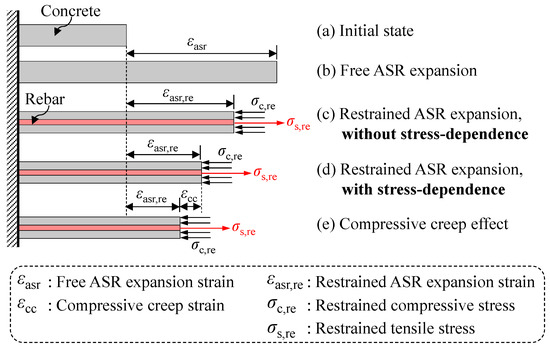
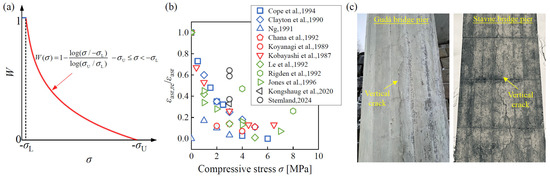
Figure 6 illustrates the schematic diagram of the restrained ASR effect in RC members. In the absence of both external and internal restraints, the free ASR expansion or expansion strain εasr in plain concrete members develops. The free ASR expansion in the rebar direction is restrained by the presence of rebars in the concrete, leading to concrete under compression and rebar in tension, as shown in Figure 6c. The developed expansion strain in concrete is termed the restrained ASR expansion strain εasr,re. The induced restrained compressive stress σc,re in the concrete and the tensile stress σs,re in the rebar can be derived from internal force equilibrium, as given by Equation (2):
where Ac and As are cross-section areas of concrete and steel rebar, respectively.
Figure 6.
Restrained ASR expansion effect for RC members.
Furthermore, it has been known for decades [7,8] that the concrete compressive stress leads to further reduced ASR expansion, i.e., the ASR expansion is stress-dependent, as illustrated in Figure 6d compared with Figure 6c. Additionally, the restrained ASR-induced concrete compressive stress results in compressive creep strain εcc in concrete, further reducing the ASR expansion.
The stress-dependence of ASR expansion can be expressed by the stress-expansion relationship:
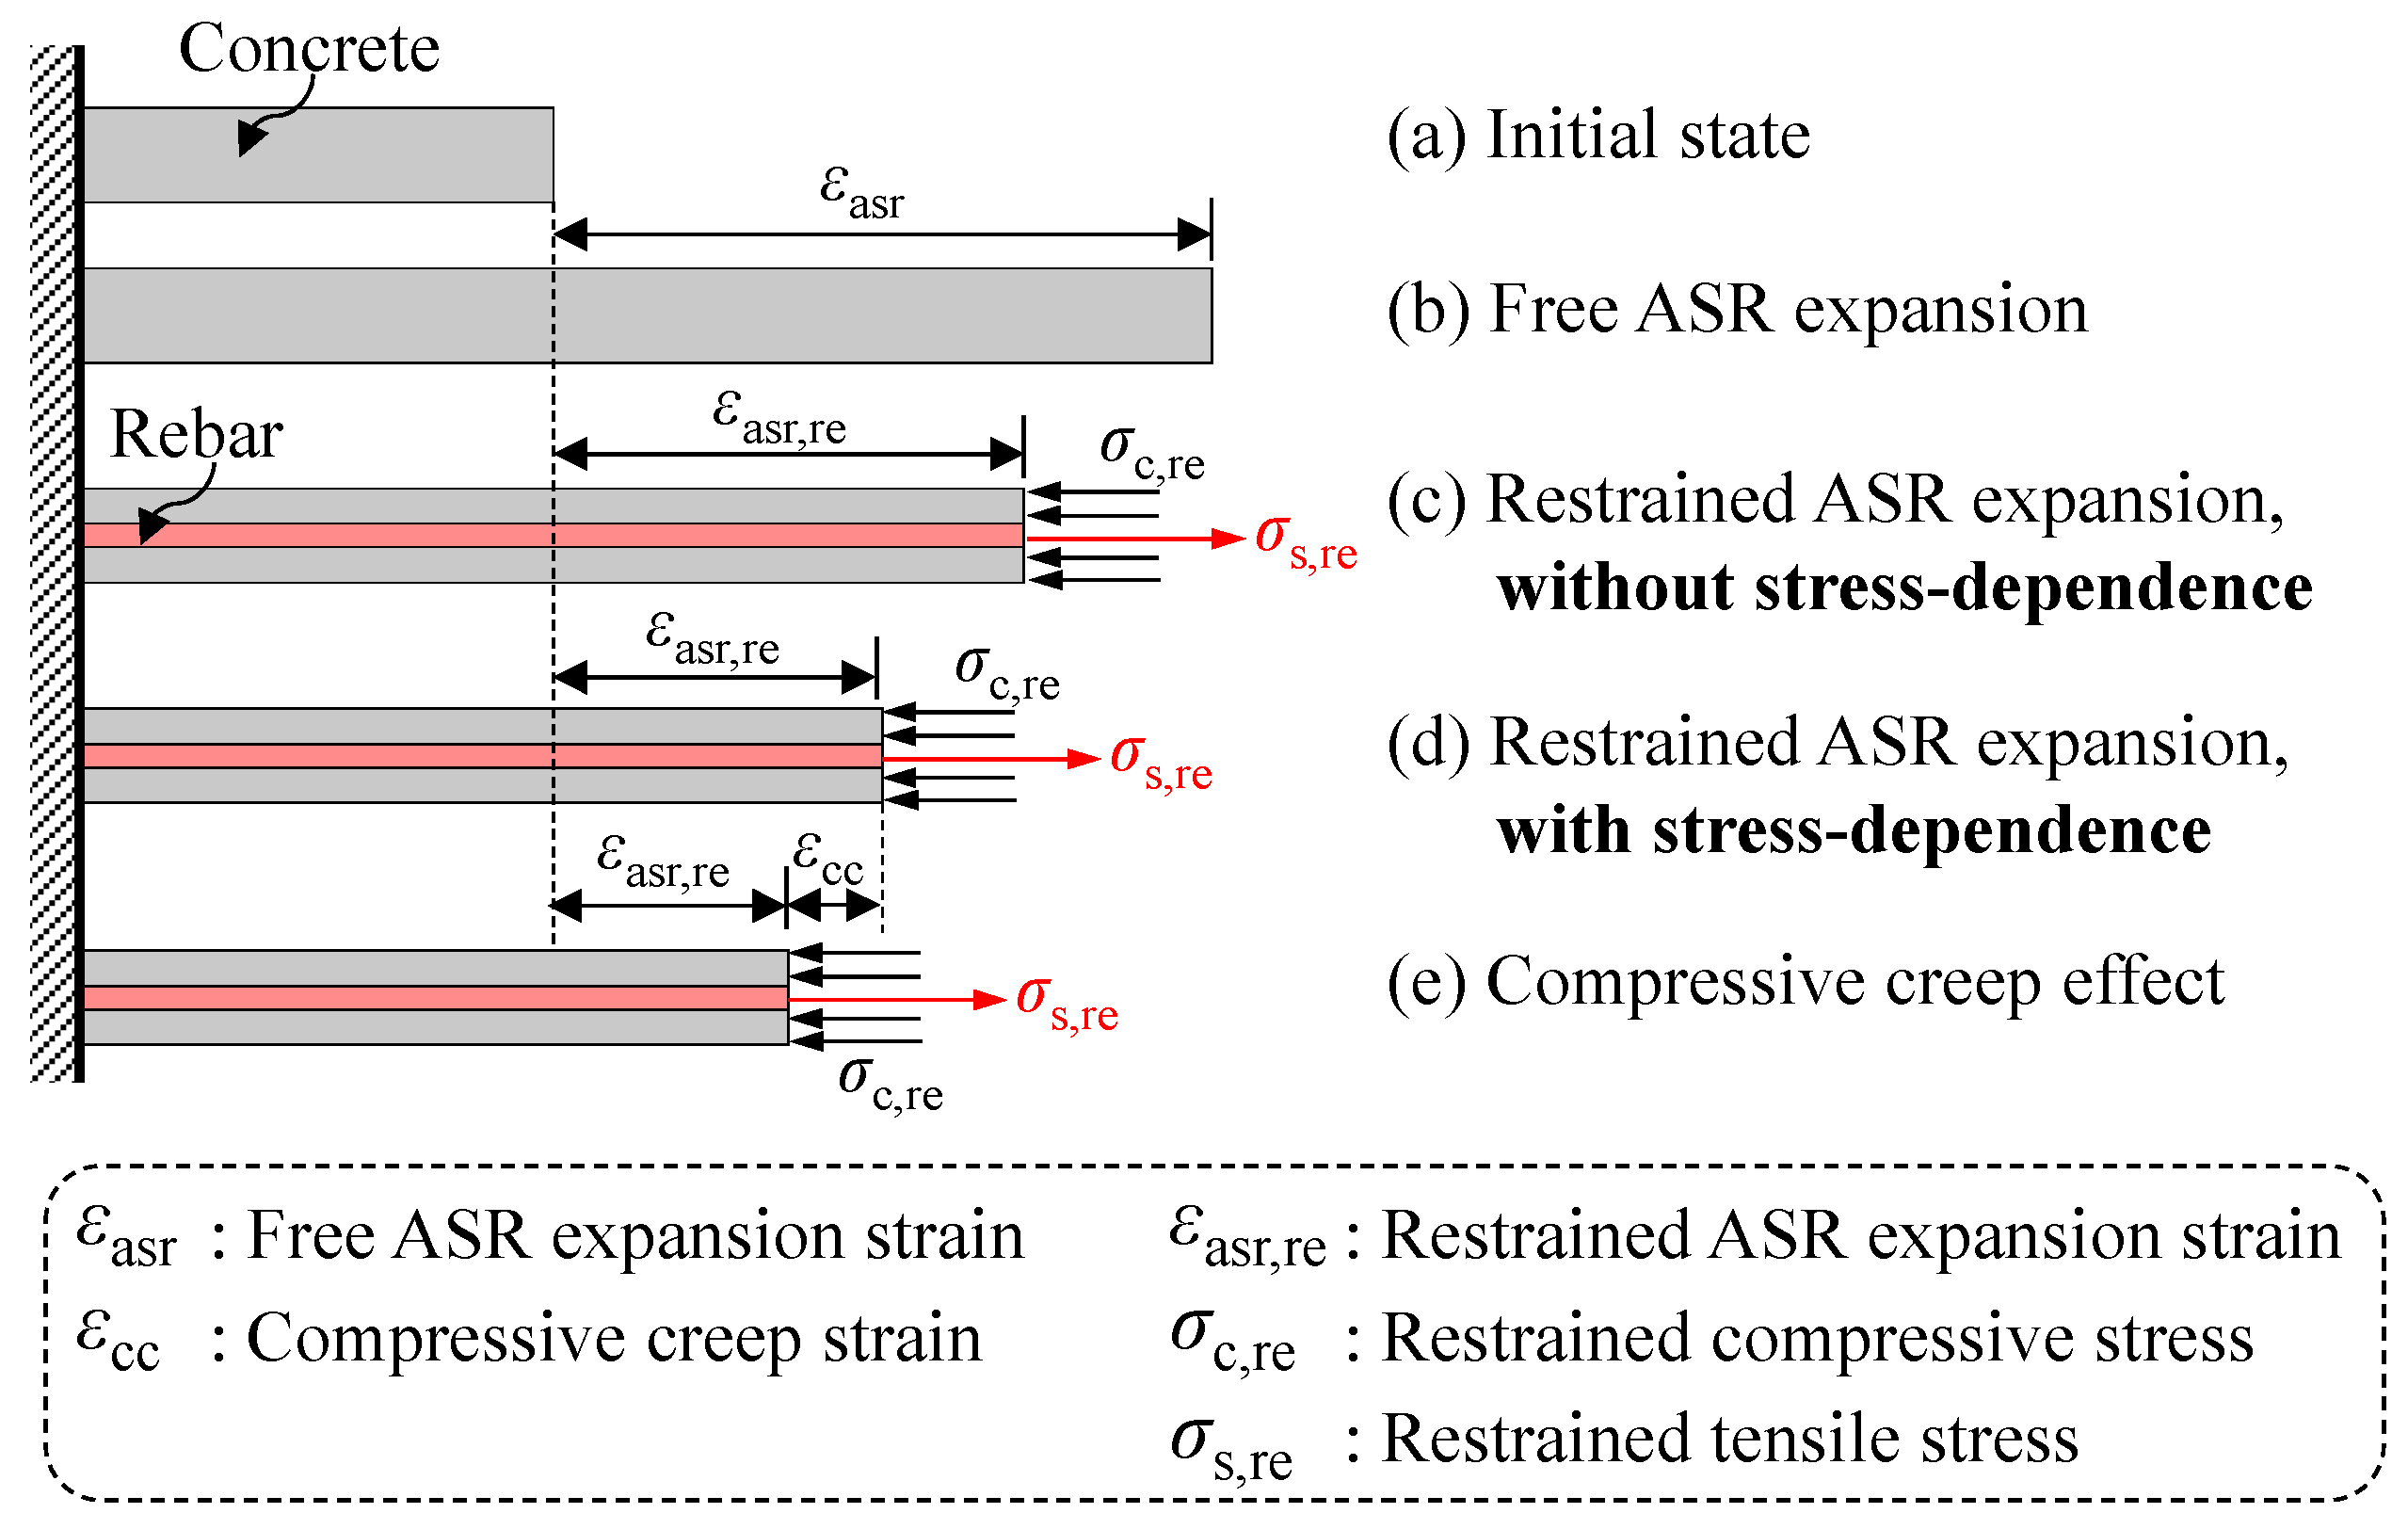
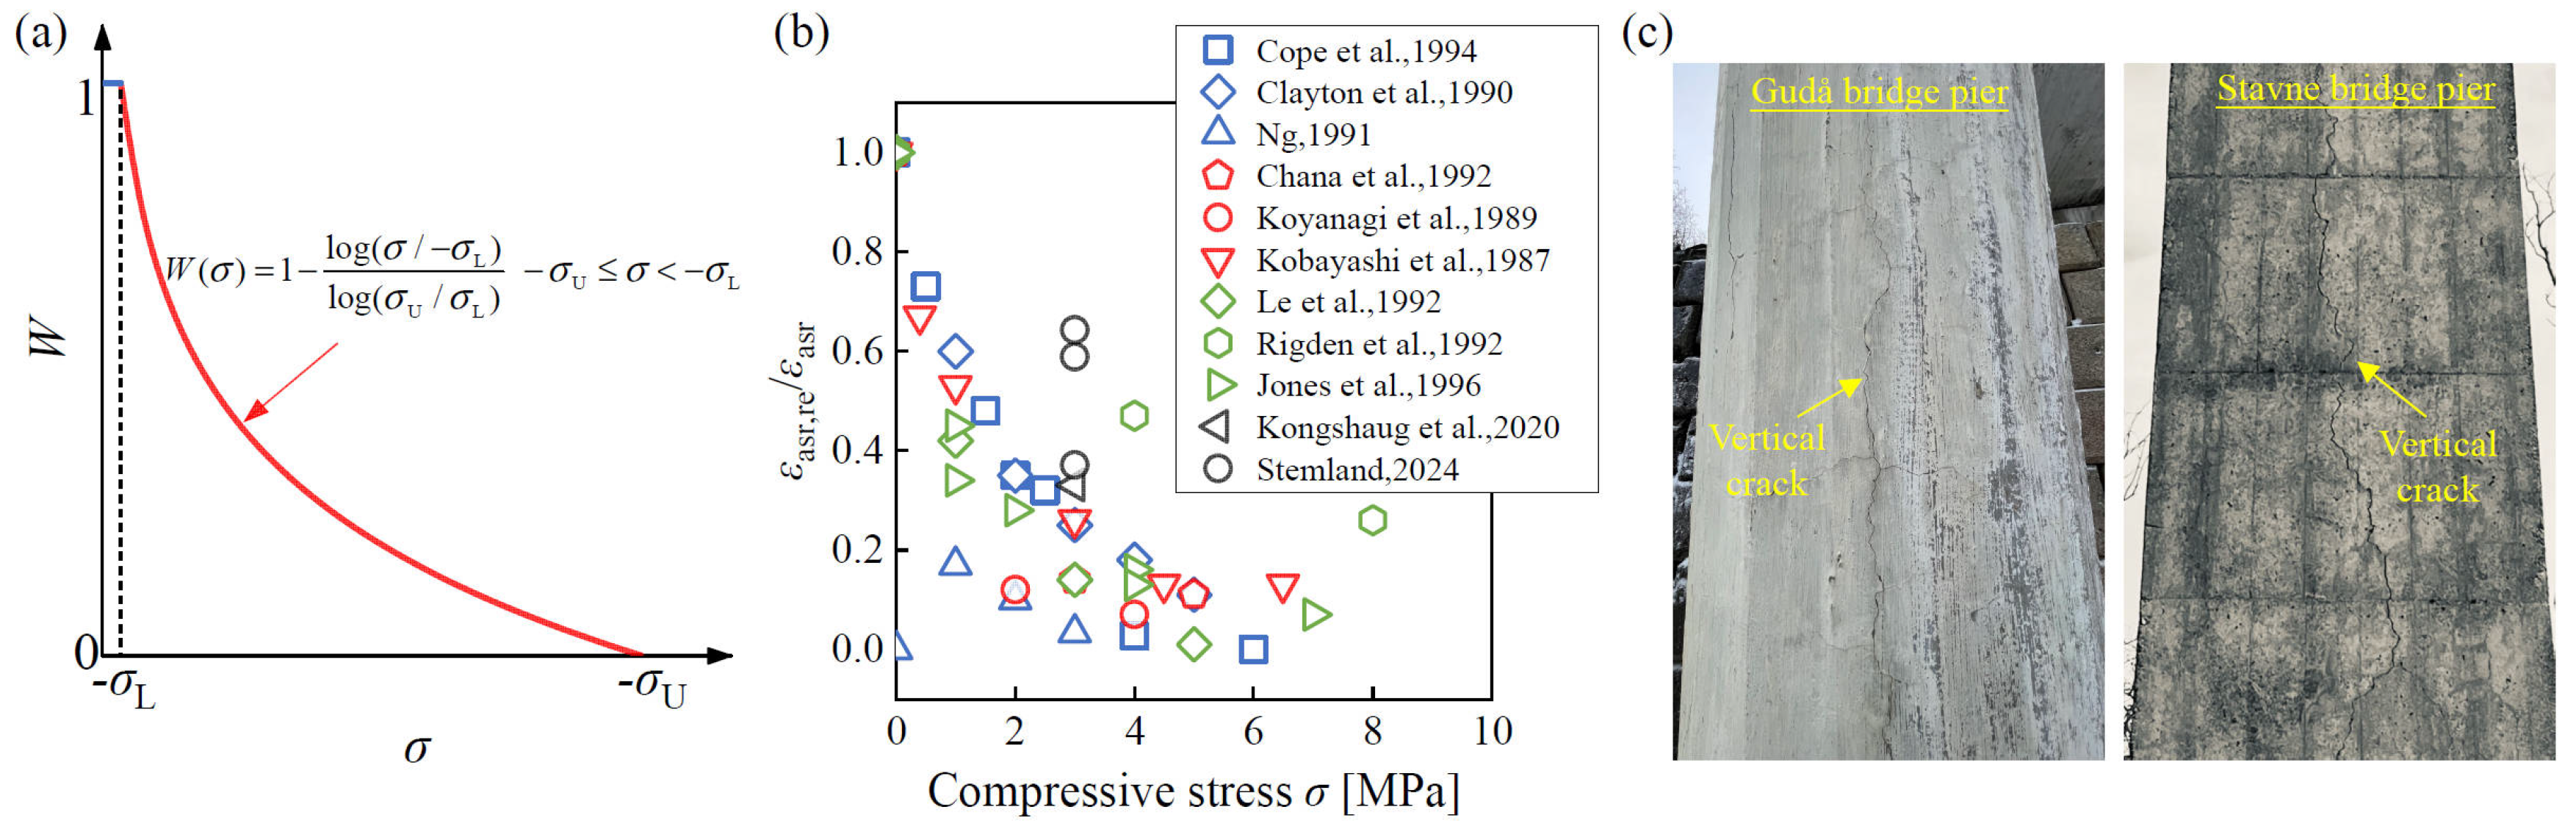
where W(σ) is the stress-dependent coefficient or weight coefficient, which can be expressed as a function of concrete stress σ according to Charlwood et al. [47], shown in Figure 7a and given by:
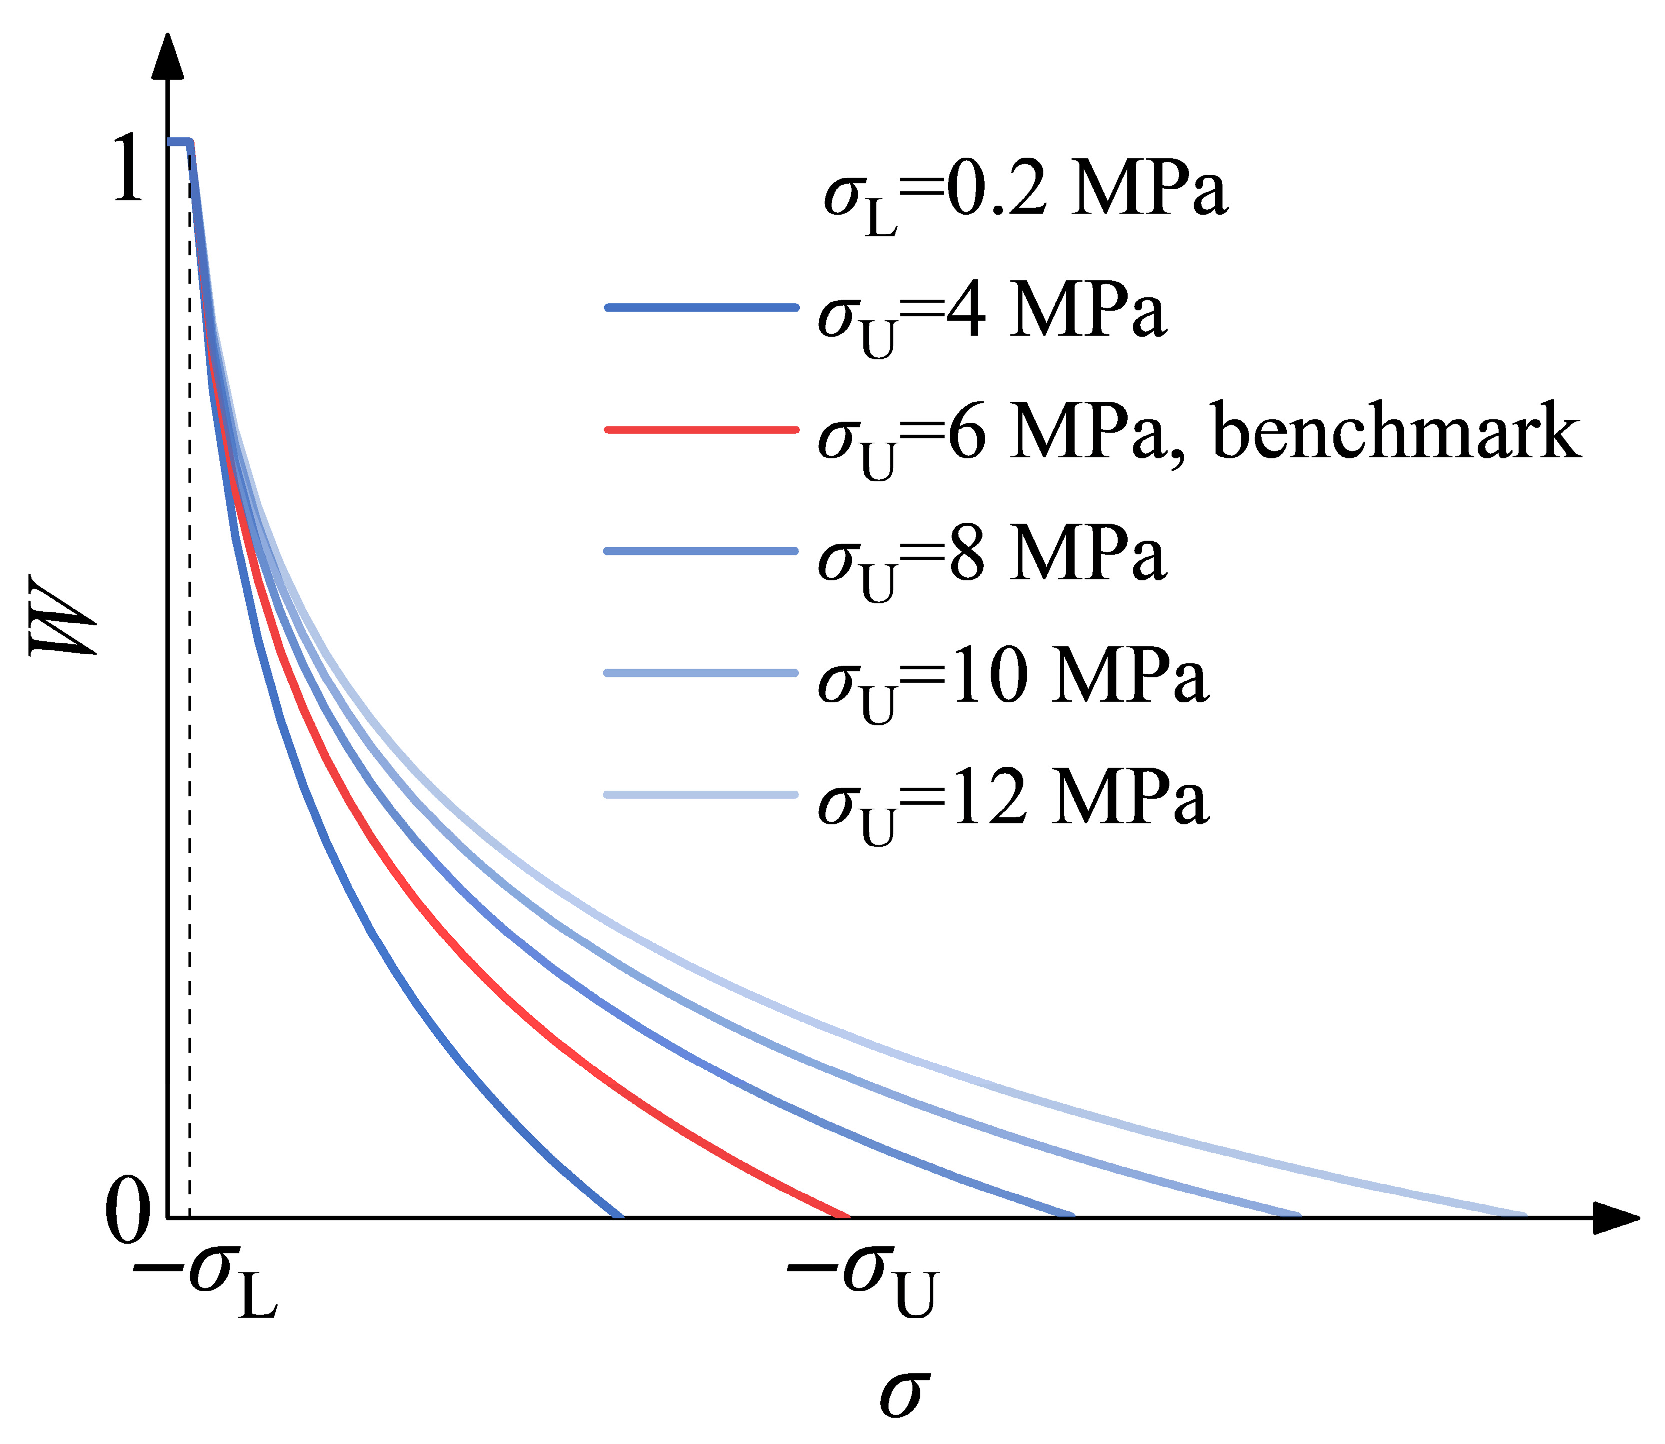
where the material parameter σU is the upper compressive stress bound, i.e., the stress that stops the ASR expansion completely; the material parameter σL is the lower compressive stress bound, below which the stress effect is negligible. The two material parameters, which may depend on the concrete mix composition, must be determined through restrained ASR expansion tests [43]. Berra et al. [22] revealed that the restrained ASR expansion under a compressive stress of 0.17 MPa is similar to the corresponding free expansion, regardless of the concrete mix. Hence, σL can be chosen as 0.2 MPa. Relevant test data [10,11,12,13,14,15,16,17,18] on the relation of compressive stress and restrained expansion expressed as a percentage of free expansion is plotted in Figure 7b; the σU value ranges from 4 MPa to 10 MPa, even exceeding 10 MPa. As compressive stress of 6 MPa covers most of the data points, σU was set to 6 MPa in the present work.
Figure 7.
Stress-dependent nature of ASR expansion: (a) stress-dependent function; (b) relationship of compressive stress and restrained expansion expressed as a percentage of free expansion (Data adapted from [10,11,12,13,14,15,16,17,18,19,20]); and (c) ASR-affected bridge cases in Norway (photos by Zhanchong Shi).
The stress-dependent nature of the ASR expansion can be observed by vertical cracks in RC bridge piers exposed to ASR, as illustrated in Figure 7c. As bridge piers mainly sustain vertical compressive stress from the superstructures, this leads to lower expansion in the vertical direction compared to the lateral directions, making them prone to inducing vertical cracks.
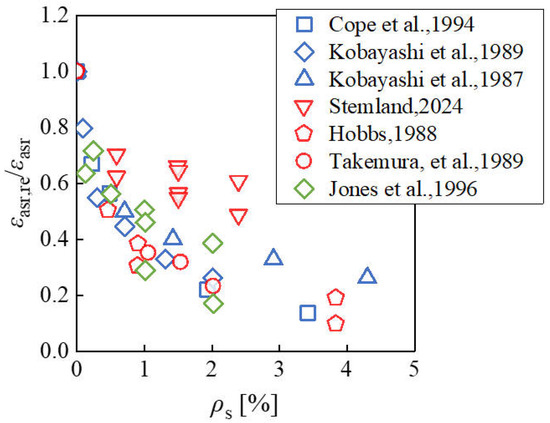
Relevant studies [10,11,16,20,48,49,50] on the ASR expansion of rebar-reinforced concrete components have been conducted, and Figure 8 presents the relationship of reinforcement ratio and restrained expansion expressed as a percentage of free expansion. Though exhibiting some scatter, the developed ASR expansion decreases with the increased reinforcement ratio.
Figure 8.
Relationship of reinforcement ratio and restrained expansion expressed as a percentage of free expansion (Data adapted from [10,11,16,20,48,49,50]).
This study developed an incremental stress-dependent and anisotropic ASR expansion algorithm into the ABAQUS platform, which offers interfaces through user subroutines [51]. The ASR expansion strain and the following creep strain were treated as thermal strain imposed on the concrete element and were input to the ABAQUS implicit solver. Therefore, the concrete total strain was composed of the imposed thermal strain and the mechanical strain. It is noted that, although the ASR expansion is characterized by anisotropy, the isotropic concrete mechanical properties according to the largest developed ASR expansion strain were adopted in this study. This will be introduced in the following section. The user subroutines USDFLD and UEXPAN, combined with the utility routine GETVRM, were used to calculate and apply the restrained ASR expansion strain increment in the form of:
where Δεasr(t) is the free ASR expansion strain increment; Δεasr,re (t) is the restrained ASR expansion strain increment; W(σ) is a stress-dependent coefficient given by Equation (4), and the concrete normal stresses in the three coordinate axes of the global coordinate system, σc,x, σc,y, and σc,z, are adopted separately in W(σ).
As for concrete creep deformation, a similar simulation method to the ASR expansion was adopted. According to Eurocode 2 [45], the creep coefficient was defined in Equation (6).
where φ0 is the notional creep coefficient; βc(t,t0) is a factor to allow for the effect of concrete age at loading on the notional creep coefficient. For the convenience of achieving creep simulation in codes, this study adopted the Dirichlet series [52], as given in Equation (7), where m is taken as 1 to 4, ai and βi are fitted parameters.
The creep strain at time tn and tn−1 can be expressed in Equation (8) and Equation (9), respectively, then the creep strain increment from tn−1 to tn can be obtained, given in Equation (10). The creep strain increment can be further expressed in Equation (11), where Ai,n is achieved in the form of recursion formula as given by Equations (12) and (13). As shown, this formulation requires only the stress increments from the previous time step, thereby eliminating the need to store the entire stress history. This significantly reduces the memory requirements.
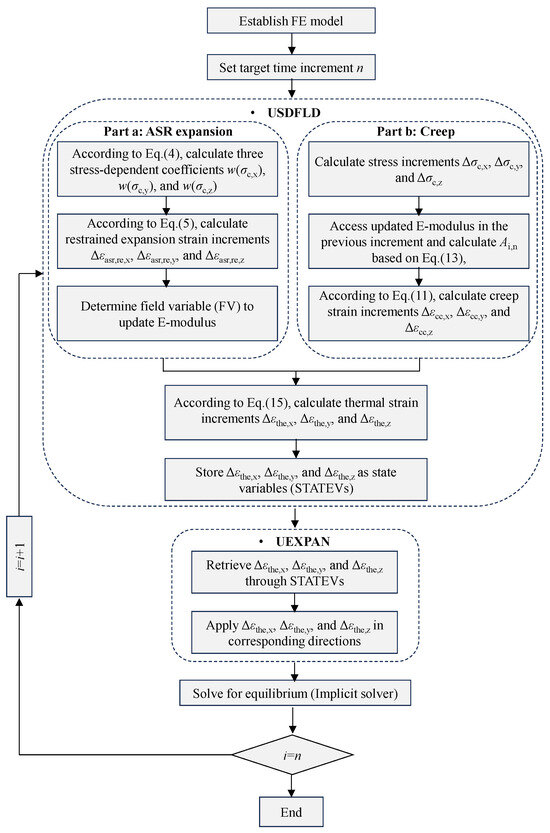
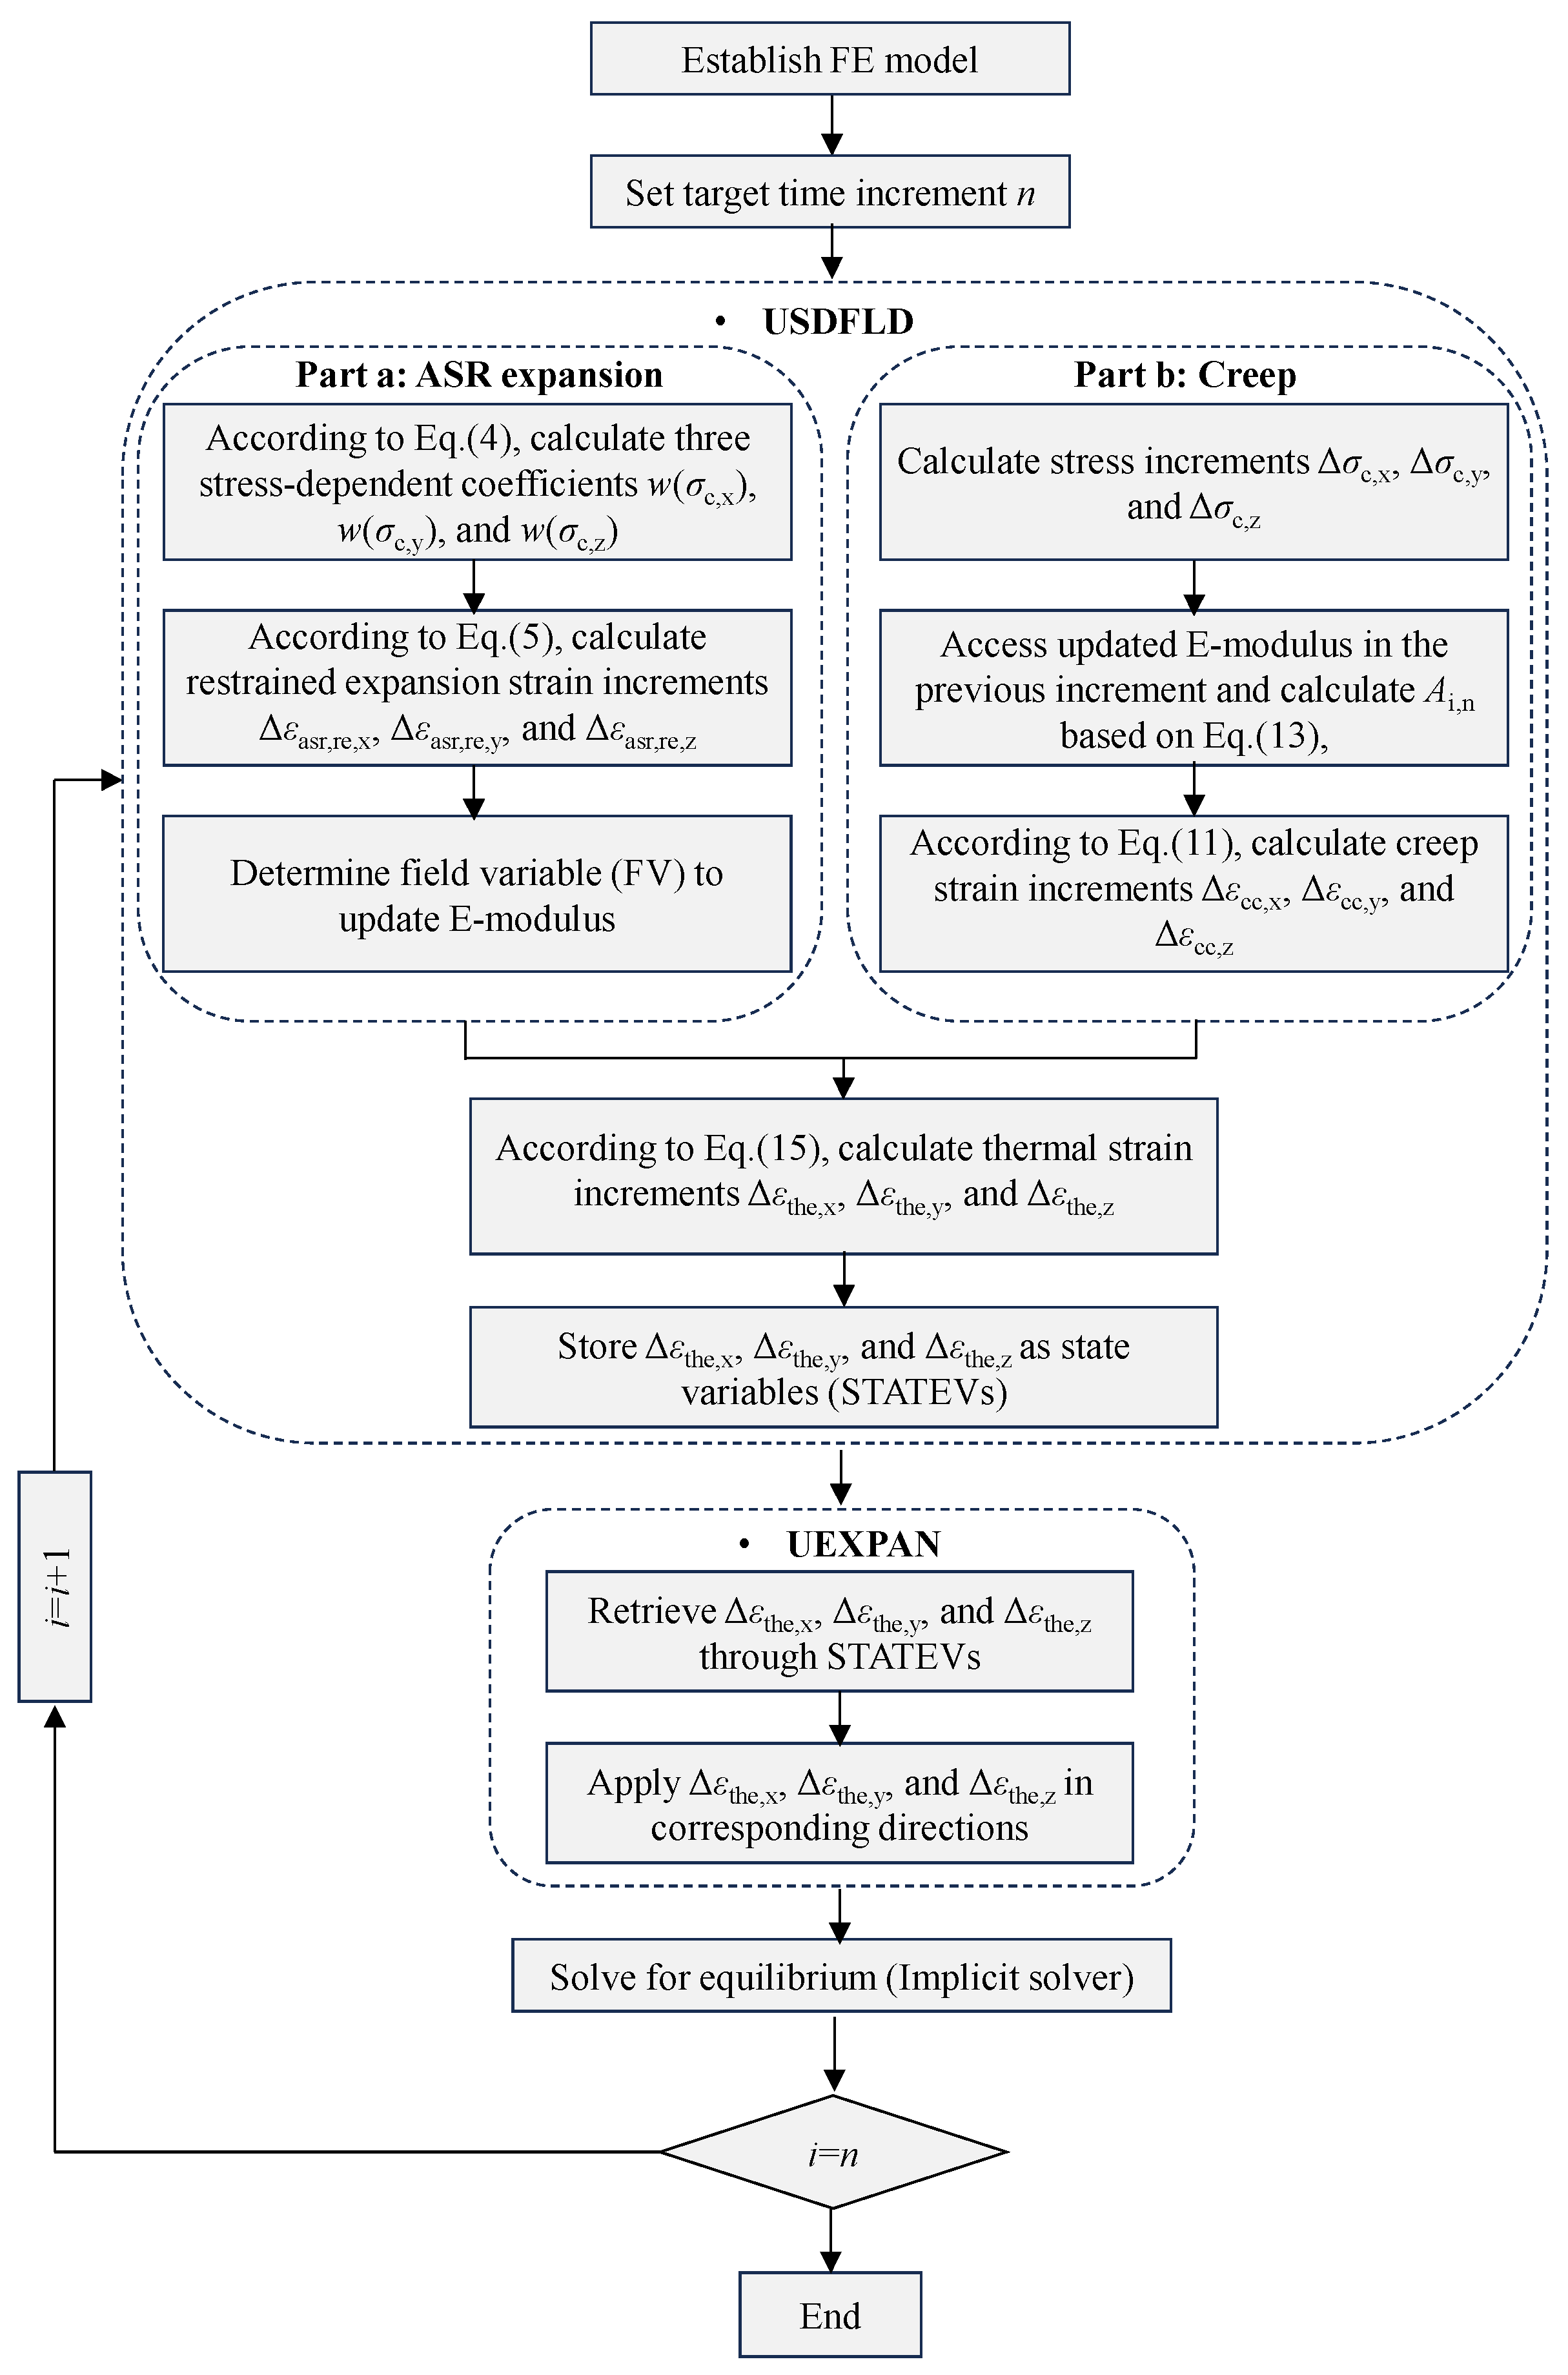
Figure 9 shows the flowchart for the ASR expansion and creep modeling user subroutine. The main steps for the ASR expansion simulation in USDFLD can be described as:
Figure 9.
Flowchart for ASR expansion and creep modeling user subroutine.
- Step 1: Get the stress tensor σij of the previous time increment through GETVRM, giving the concrete normal stress components σc,x, σc,y, and σc,z.
- Step 2: Calculate the three restrained ASR expansion strain increments Δεasr,res,x, Δεasr,res,y, Δεasr,res,z according to Equation (5).
- Step 3: Obtain the maximum accumulated restrained ASR expansion strain εasr,res = max{εasr,res,x, εasr,res,y, εasr,res,z}, and define it as a field variable to update the concrete E-modulus according to Equation (14). In this equation, an isotropic ASR-affected concrete E-modulus was derived.
Equation (14) was fitted by Kongshaug et al. [19]. This relationship defines the correlation between deteriorated concrete E-modulus due to ASR, denoted as Ecm,asr, and the corresponding ASR expansion strain εasr,res, where the Ecm represents the mean elastic modulus of undamaged concrete at 28 days.
The main steps for the concrete creep simulation in USDFLD are described as:
- Step 1: Get the stress tensor σij of the previous time increment through GETVRM, and calculate the increments of normal stress components Δσc,x, Δσc,y, and Δσc,z.
- Step 2: Access updated E-modulus and calculate Ai,n based on Equation (13).
- Step 3: Determine the three creep strain increments Δεcc,x, Δεcc,y, Δεcc,z following Equation (11).
Furthermore, the thermal strain increments Δεthe,x, Δεthe,y, Δεthe,z can be obtained by summing the ASR expansion and creep strain increments, as follows:
where i represents the three directions of the coordinate system, x, y, and z, respectively.
The thermal strain increments are stored as state variables (STATEVs) in USDFLD and later retrieved in UEXPAN, where they are applied along the three coordinate axes.
It should be noted that the adopted ASR expansion simulation approach is an average strain method. In this method, the local ASR-induced expansion and cracking and the consequent anisotropic degradation of concrete properties cannot be achieved.
3.2. Finite Element Model
The numerical simulation of the restrained ASR expansion for the tested LoadCube and RcPrism samples was conducted using the established method. In this method, the input value of the final free ASR expansion strain εasr,end has a significant influence on the simulation results. As illustrated in Table 4, the tested free ASR expansion strains from the free expansion samples and from the restrained expansion samples exhibited a certain scatter. Therefore, a unified method for obtaining the value of εasr,end to be used in the user subroutine was defined as the larger one of the final free ASR expansion strains from the restrained samples and the corresponding free samples. It is noted that the creep simulation and ASR-induced damaged concrete E-modulus were not incorporated in the following finite element models, considering that the ASR expansion is significantly larger than the elastic and creep deformations. The influence of deteriorated concrete E-modulus and creep behavior on the numerical results will be further elaborated in a parametric study in Section 4.
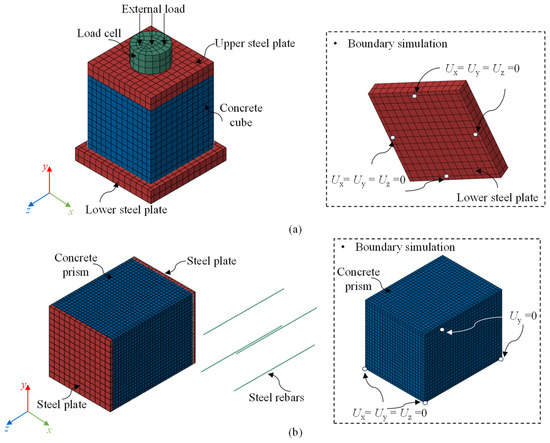
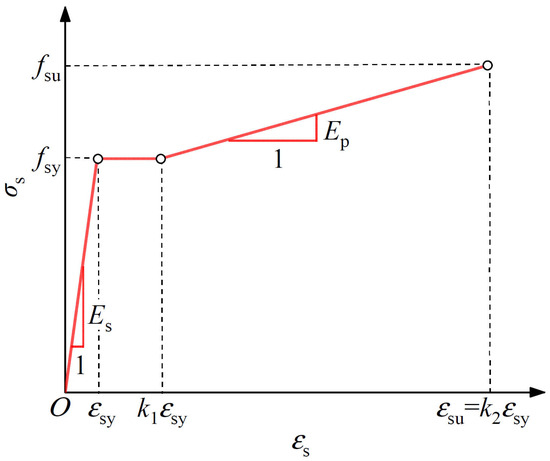
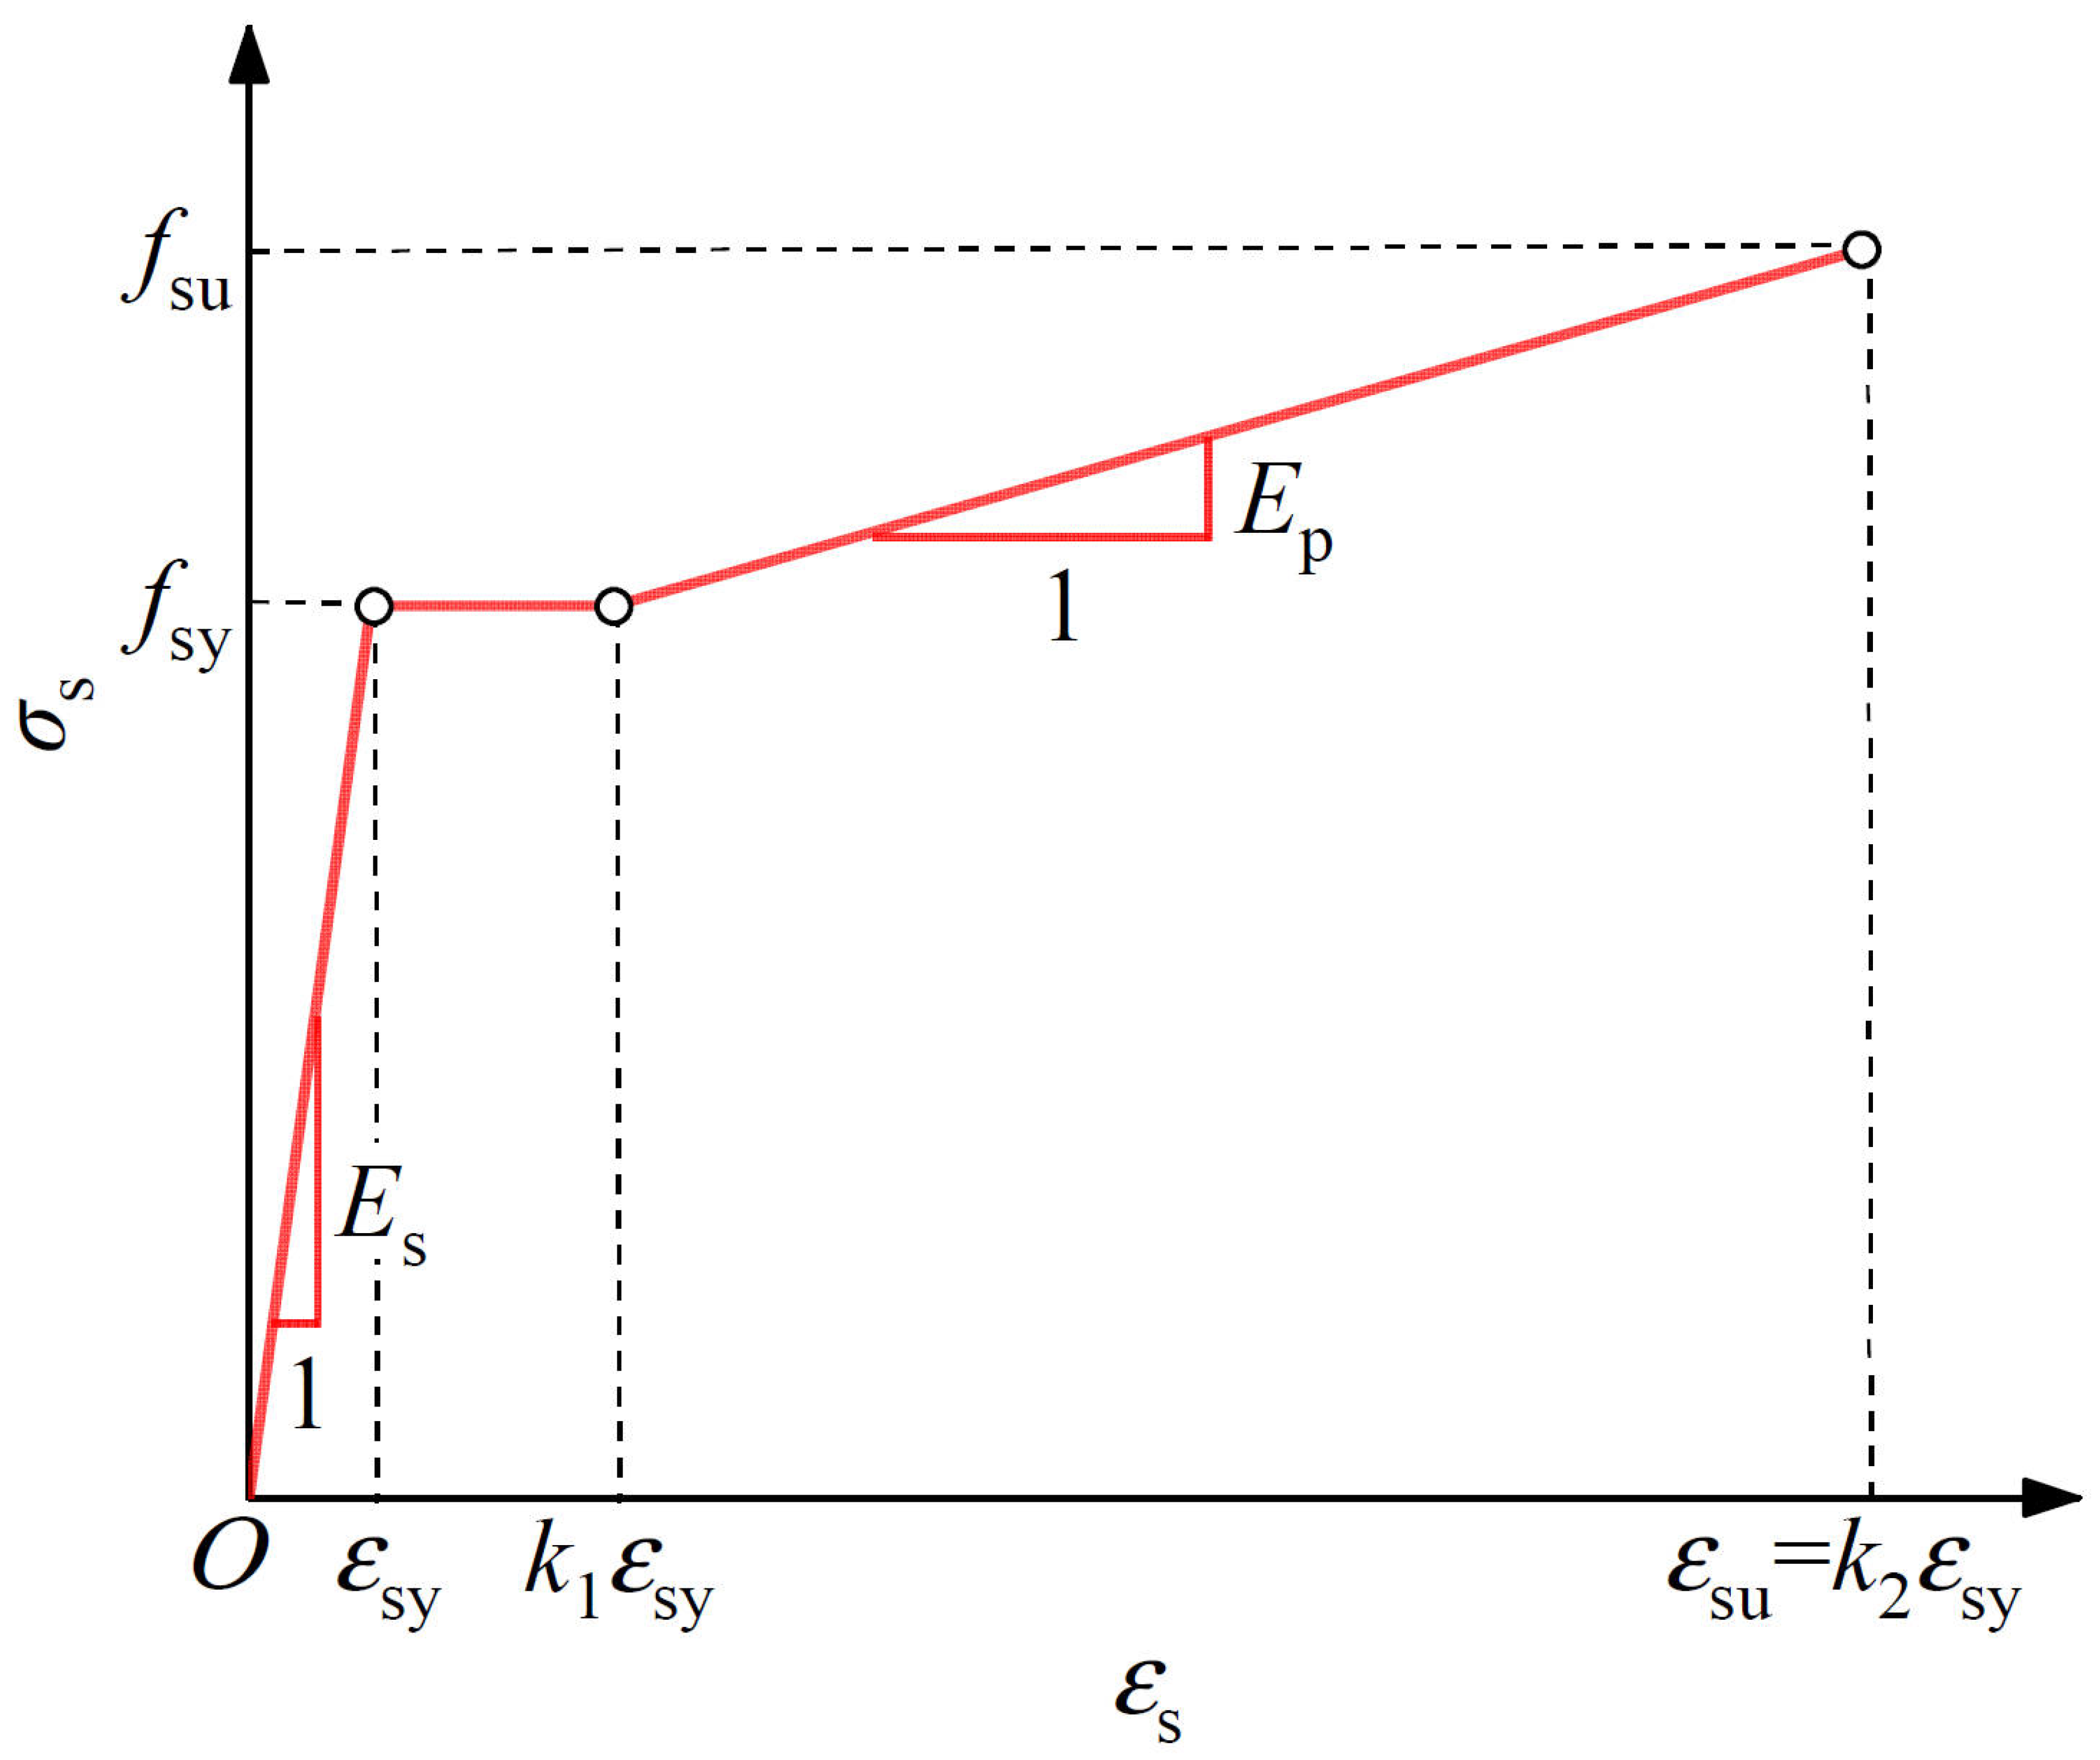
Figure 10 shows the FE models for the tested LoadCube and RcPrism samples. The concrete cube, concrete prism, steel plates, and load cell were modeled by the linearly interpolated 3D solid element C3D8R, while the steel rebars were simulated using the two-node truss element T3D2. An elastic modulus Es of 210,000 MPa was adopted for the steel plate and the load cell. A tri-linear constitutive model was adopted for the steel rebars, as given in Equation (16) and plotted in Figure 11:
where the yielding strength fsy and elastic modulus Es were according to Table 3; the yielding strain εsy was calculated as fsy/Es. Because the complete tensile stress–strain curve of steel rebar was not obtained in the material test, the tensile strength fsu was taken as 1.2 fsy, k1 and k2 were taken as 10 [53] and 40 [54], respectively; while the plastic modulus can be obtained as Ep = (fsu − fsy)/[(k2 − k1) εsy].
Figure 10.
FE models for: (a) LoadCube samples; and (b) RcPrism samples.
Figure 11.
Tensile constitutive model of steel rebar.
For the LoadCube FE models, the three translational degrees of freedom Ux, Uy, and Uz of four supporting points (corresponding to the four threaded steel rods) at the bottom surface of the bottom steel plate were restrained. Two approaches, tie and contact, were adopted to model the steel-Teflon-concrete interfaces. The modeling details and their influence on the simulation results will be described in Section 3.4.1. The connection between the load cell and the top steel plate was simulated using a tie. The load steps consisted of an external load step (step 1) and subsequent ASR expansion steps. At the external loading step, a load was applied to the top surface of the load cell, which will induce an average compressive stress of 3 MPa on the concrete cube top surface. Each ASR expansion step corresponds to one day; the total step numbers correspond to the expansion measuring duration.
For the RcPrism FE models, the steel rebars were embedded in the concrete. The two steel plates were tied to the concrete surfaces. As for the boundary condition simulations, the vertical translational freedom Uy of the two corner points at the concrete bottom surface was restrained, while the three translational degrees of freedom Ux, Uy, and Uz of the other two corner points were restrained. The simulation of the ASR expansion history for the RcPrism samples was similar to that of the LoadCube samples.
3.3. Mesh Size Dependence
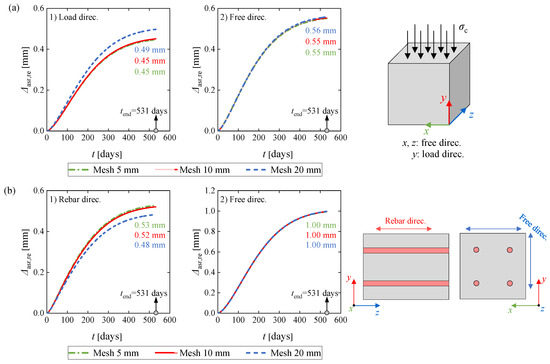
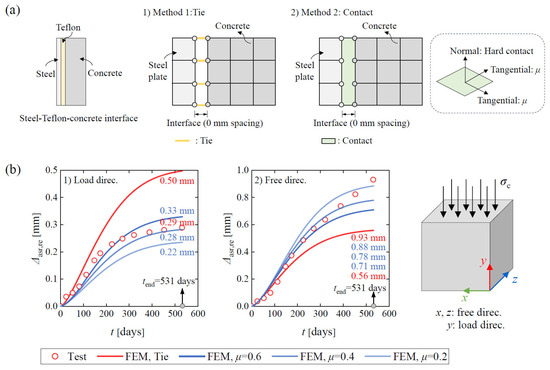
The 2020-LoadCube and 2020-RcPrism-4ds16 samples were chosen to conduct mesh size dependence analysis for the LoadCube and RcPrism samples, respectively. The obtained FE expansion was determined as the displacement difference between the two measuring points (gauge length of 200 mm) of the Digital DEMEC Mechanical Strain Gauge.
For the 2020-LoadCube sample, a 20 mm mesh size was used for the steel plates and load cell. Alternative mesh sizes of 5 mm, 10 mm, and 20 mm for the concrete cube were used to investigate their influence on the simulation results. It should be noted that a tie connection was used to model the steel-Teflon-concrete interface connection in the FE model. Figure 12a compares the restrained ASR expansion obtained by different mesh sizes. As shown, the three investigated mesh sizes had a relatively small influence on the expansions in the load direction as well as the free direction. To improve the computation efficiency, a mesh size of 20 mm was chosen for the following FE models representing the LoadCube samples.
Figure 12.
FE restrained expansions from different mesh sizes for: (a) 2020-LoadCube sample; and (b) 2020-RcPrism-4ds16 sample.
For the 2020-RcPrism-4ds16 sample, the mesh size for the steel plate was 20 mm, while mesh sizes of 5 mm, 10 mm, and 20 mm for the concrete were used to quantify the effect on the simulation results. As illustrated in Figure 12b, the three mesh sizes had a limited influence on the expansions in the rebar and in the free directions. The mesh size of 10 mm was selected for the subsequent simulation for RcPrism samples, considering computation efficiency as well as more data to conduct the restrained expansion effect analysis.
3.4. Validation and Discussion
3.4.1. LoadCube Samples
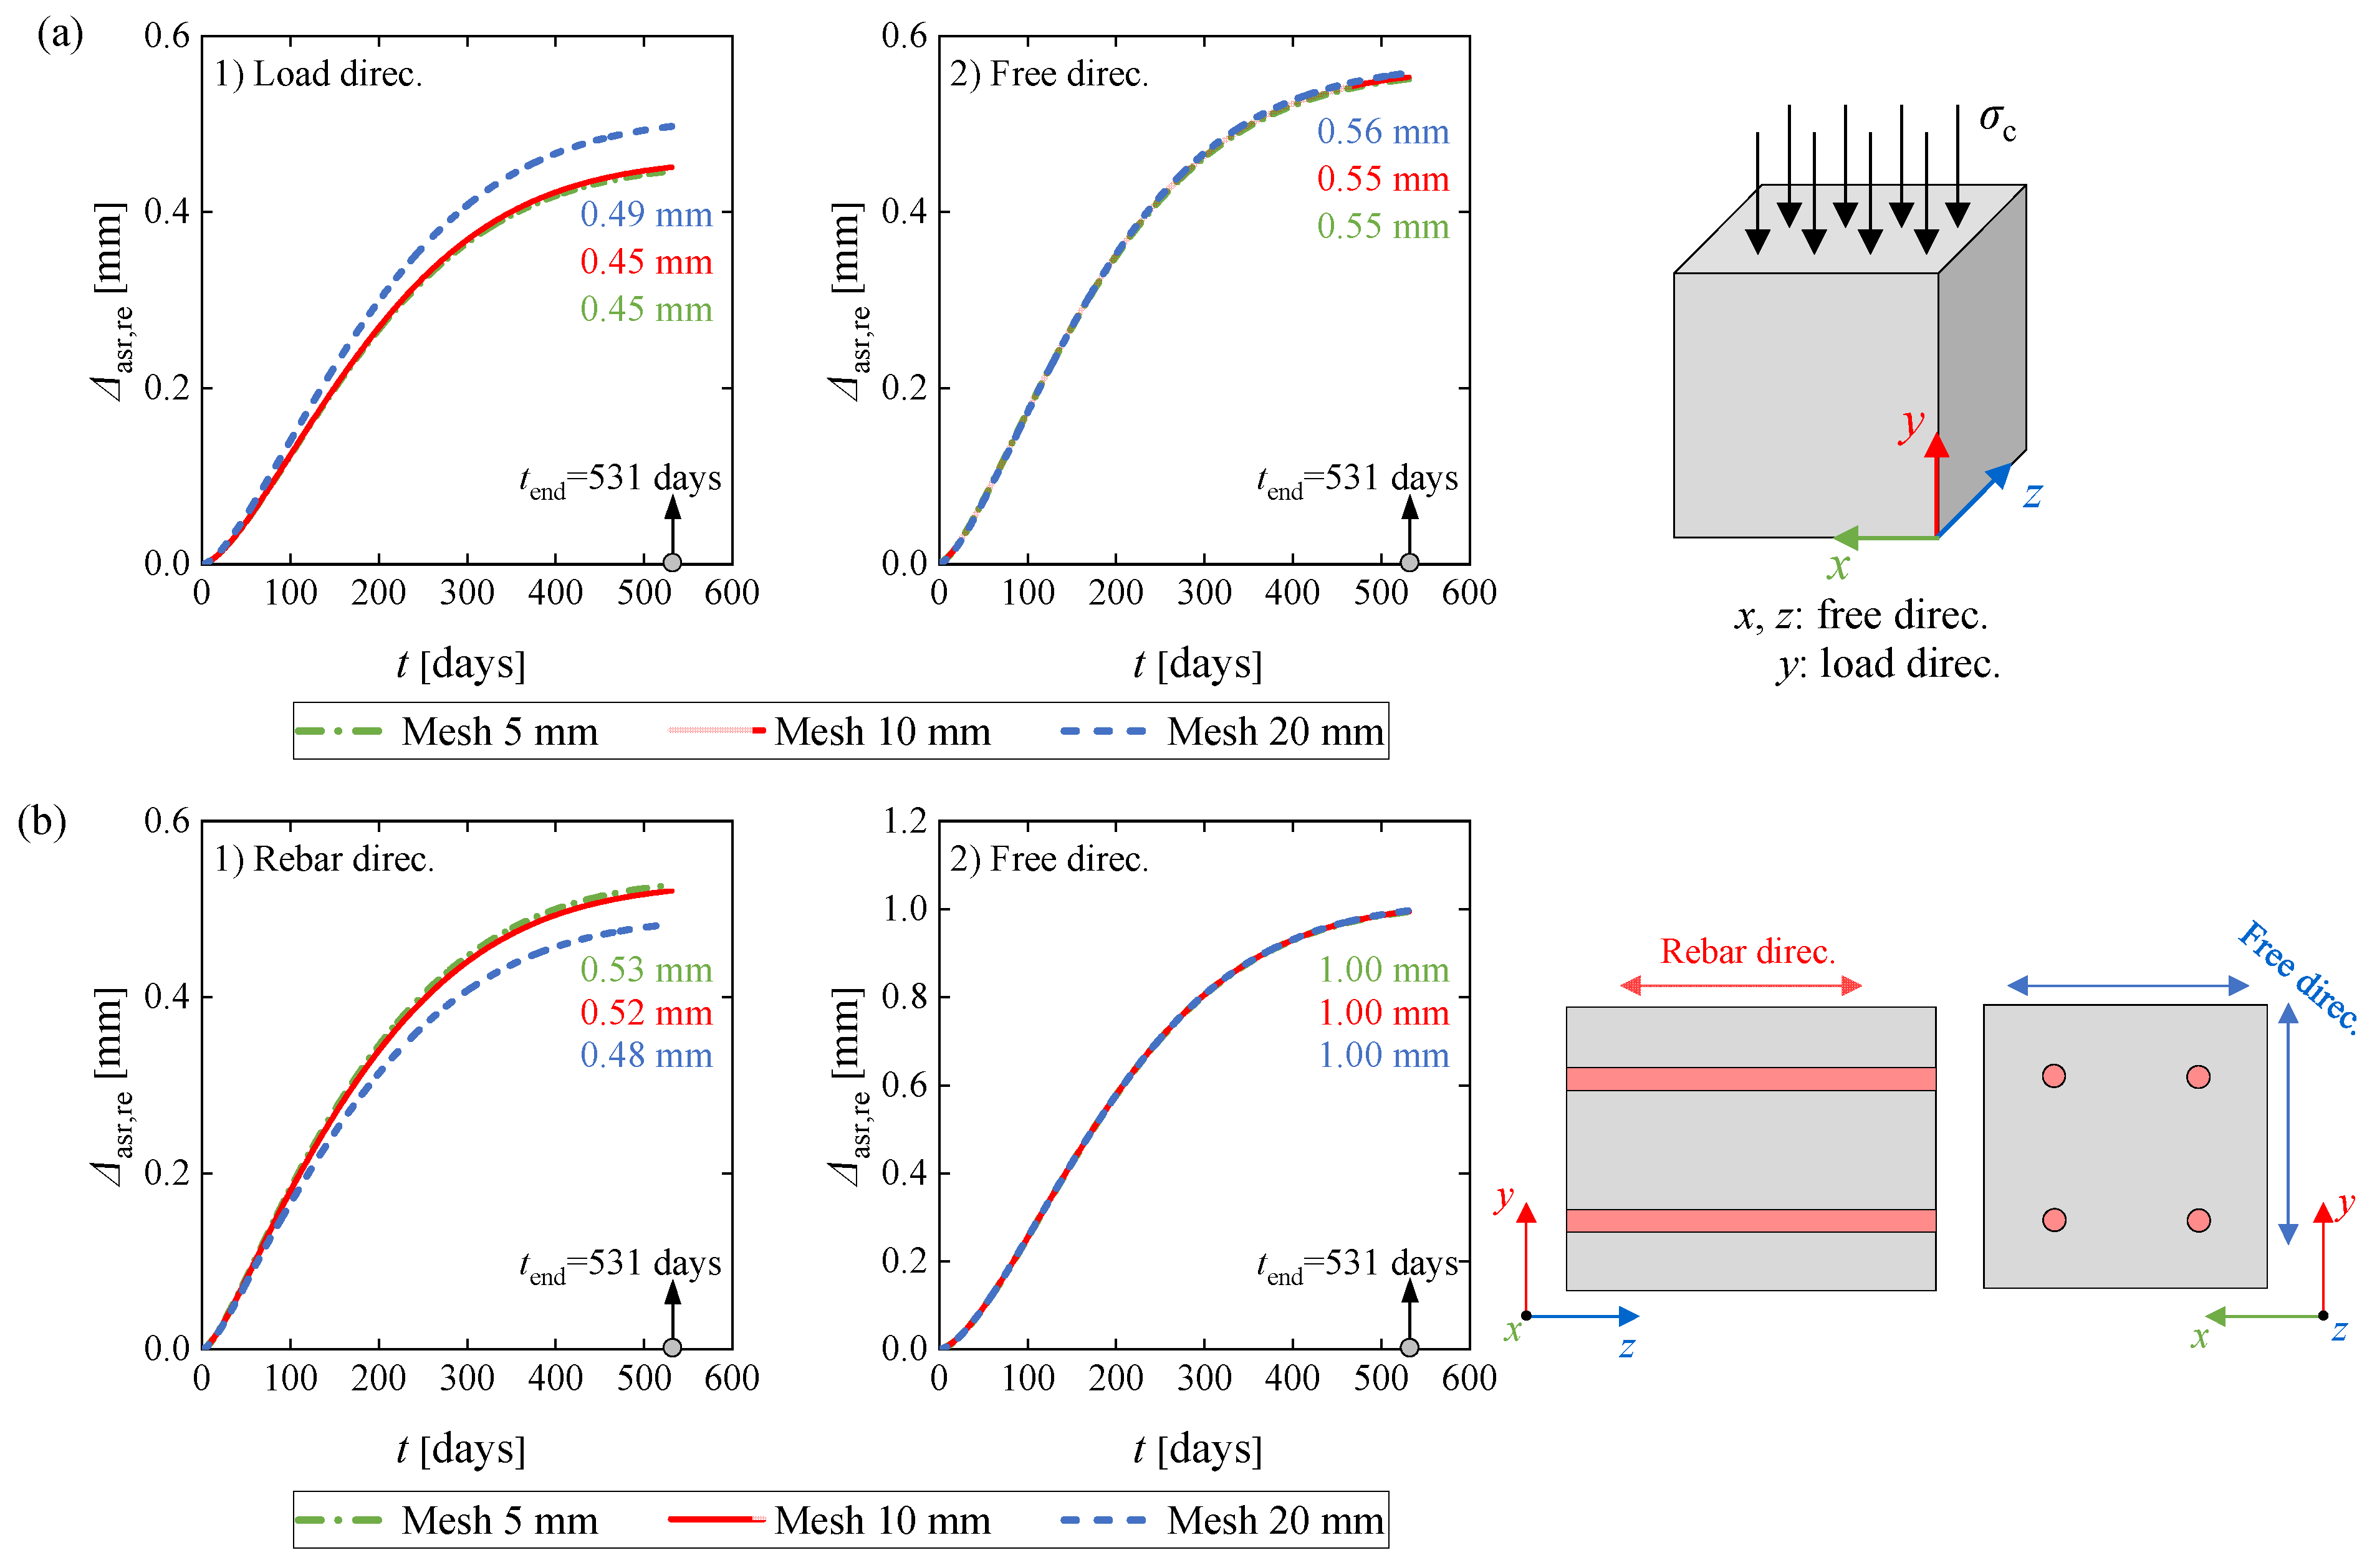
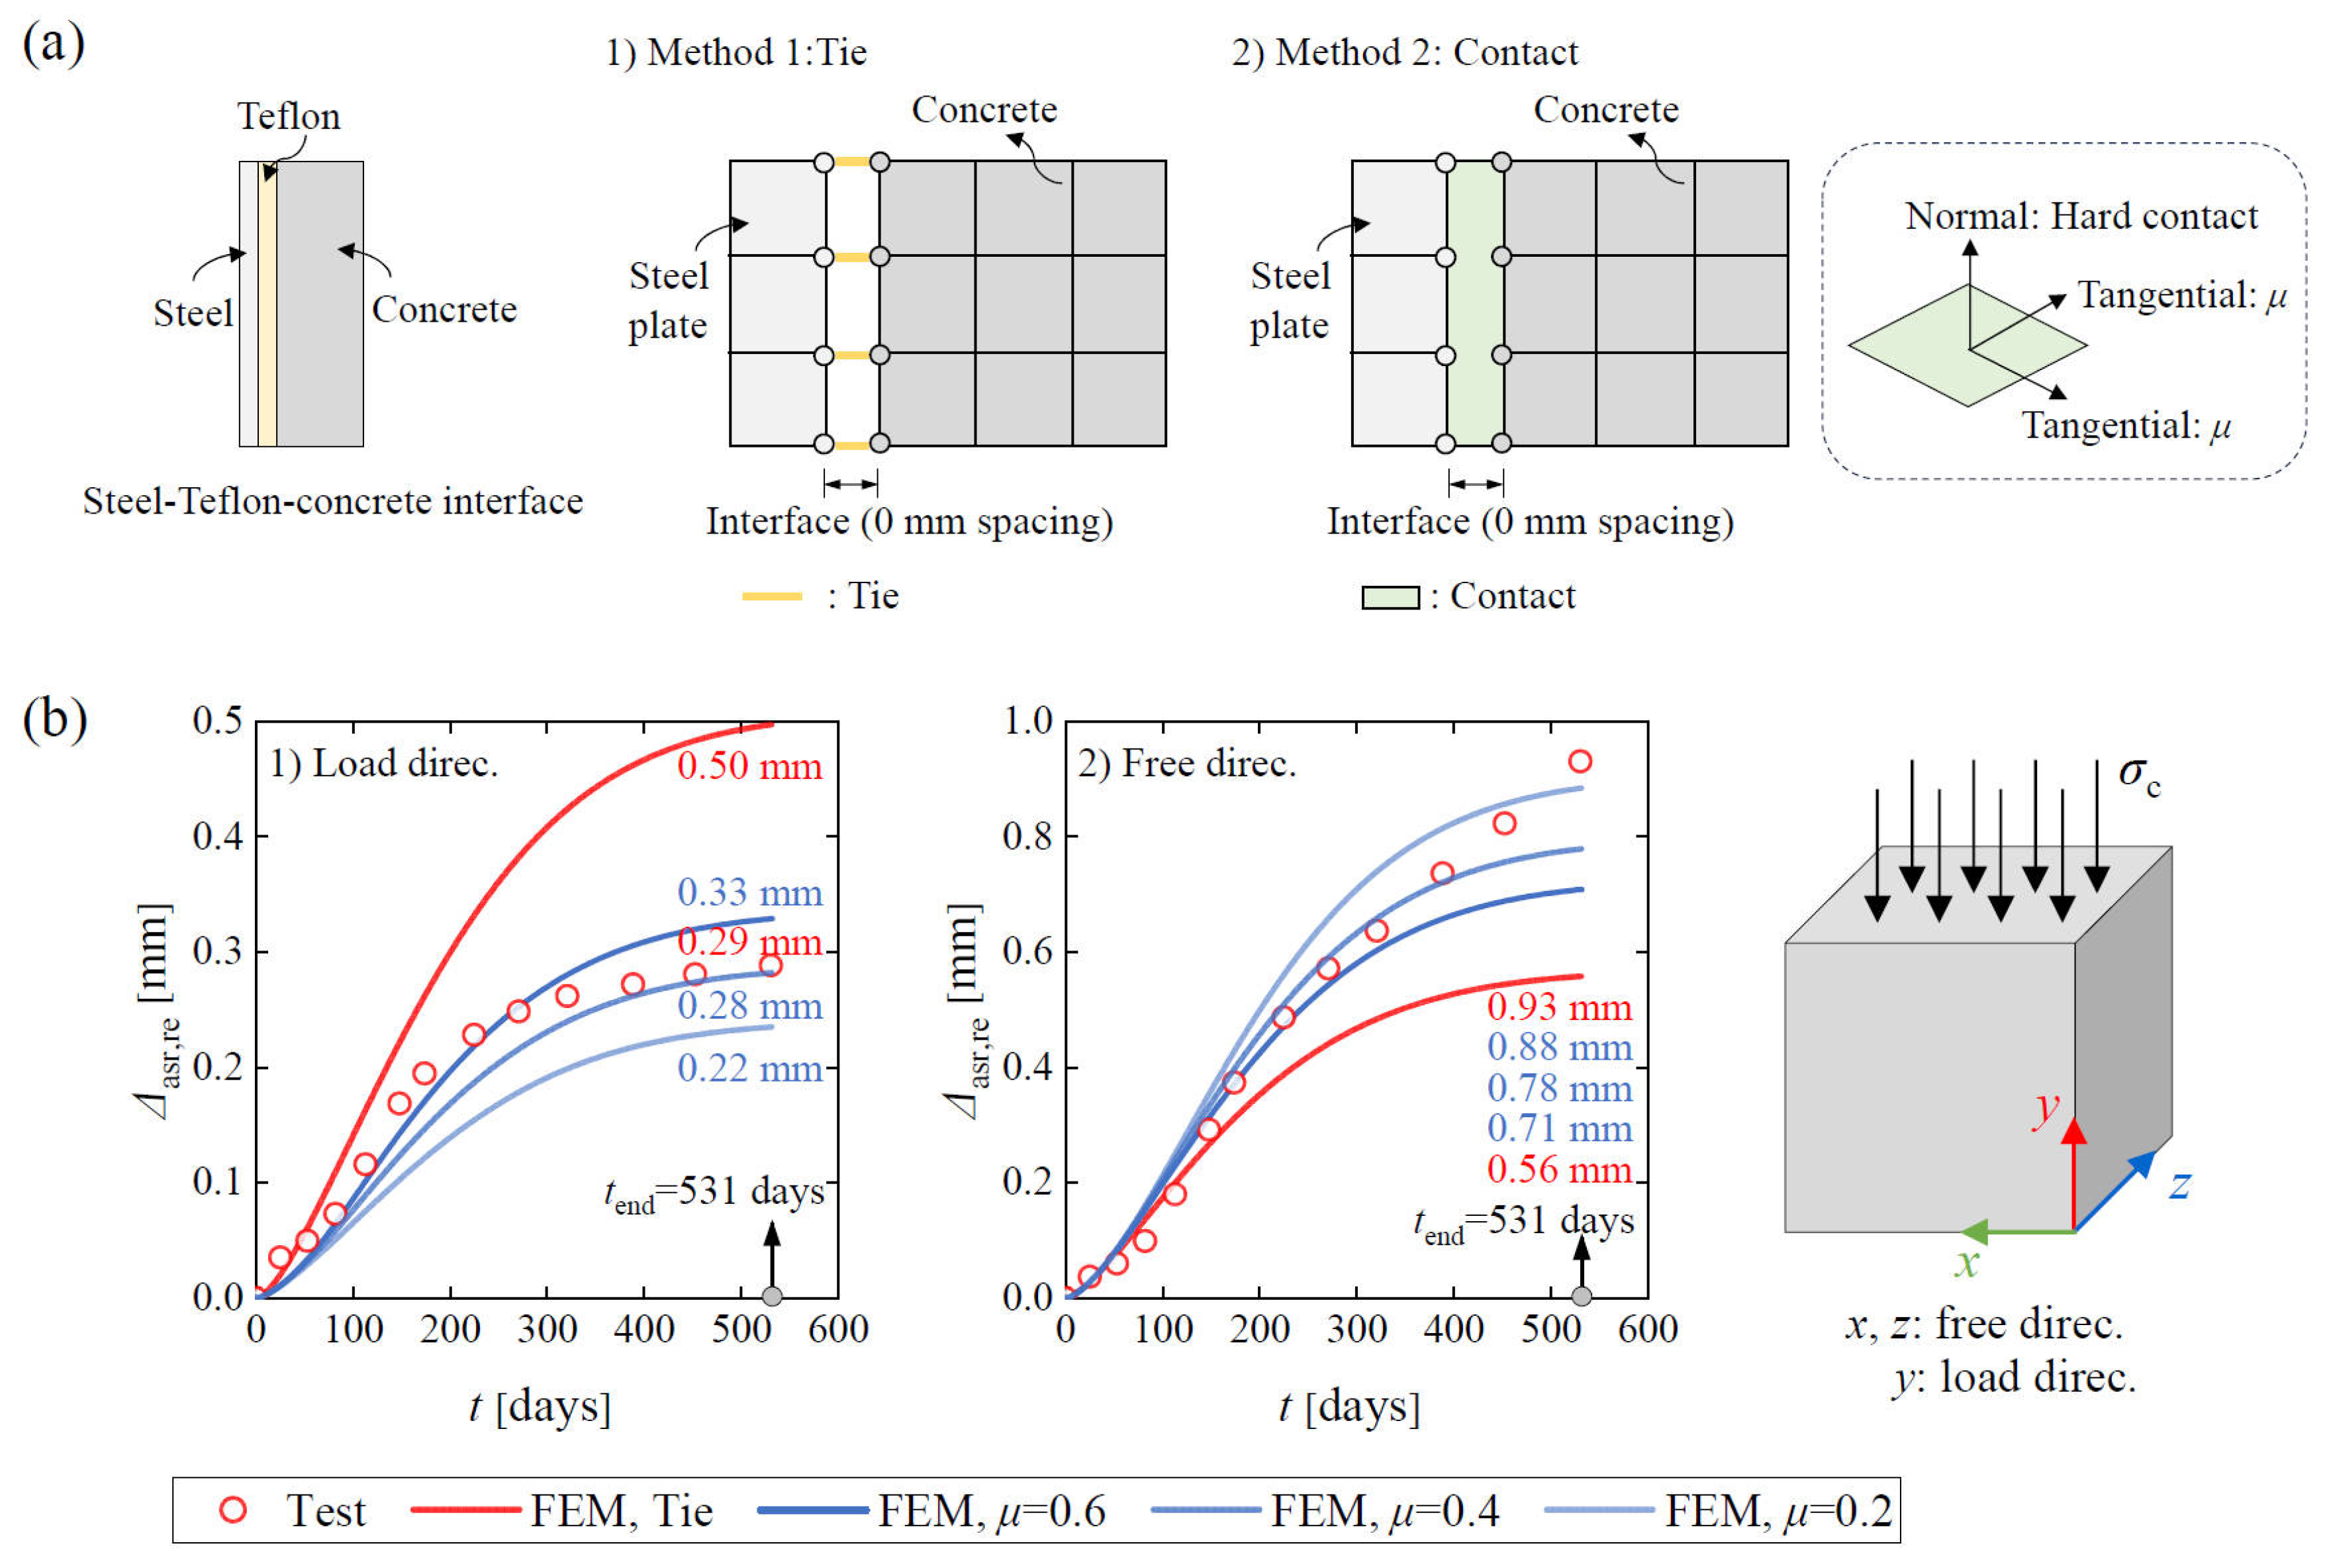
As the steel-Teflon-concrete interface property was an unknown parameter, two interface modeling methods, tie and surface-to-surface contact, were compared to identify the influence on the FE expansion responses. The mechanism of the modeling methods is shown in Figure 13a. For the contact connection, the normal direction was modeled using a hard contact to prevent the mutual penetration of the steel plate and concrete prism, and the tangential direction was simulated by a penalty function with three alternative coefficients of friction values of 0.6, 0.4, and 0.2. The tie is the most rigid connection (infinite stiffness in both directions), while for the contact connection, descending coefficients of friction from 0.6 to 0.2 indicate reduced tangential constraints.
Figure 13.
Influence of steel-Teflon-concrete interface modeling on FE restrained ASR expansions of 2020-LoadCube sample: (a) interface simulation methods; and (b) comparison between experimental and FE results.
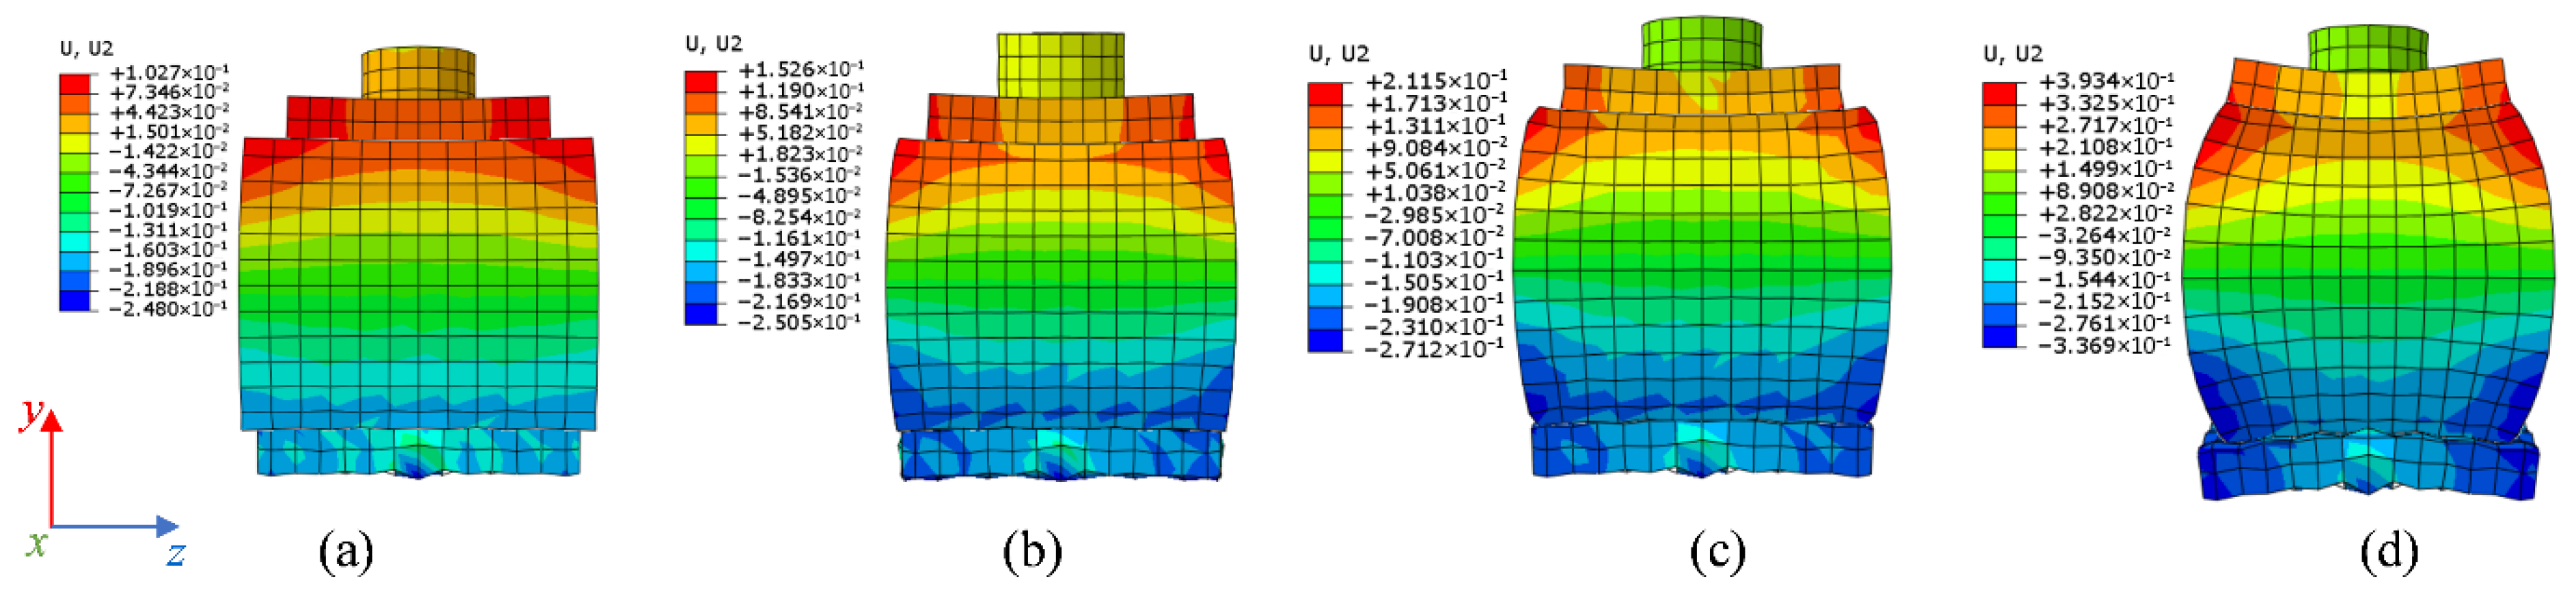
Figure 13b compares the experimental and numerical ASR expansions at the concrete surface for the 2020-LoadCube sample. As shown, as the lateral constraint reduces from tie to a friction coefficient of 0.2, the restrained expansion in the free direction exhibited an increasing trend, while the restrained expansion in the load direction presented an opposite response. This is because the stiffer the lateral constraint, the lower the lateral expansion (free direction), leading to an increased vertical expansion (load direction) at the outer edge of the concrete cube. This is illustrated in Figure 14, where the FE expansion deformations are compared. Furthermore, the FE expansion response at the load direction from a friction coefficient of 0.4 provided the best agreement with the test data. Therefore, surface-to-surface contact with a friction coefficient of 0.4 was chosen to model the steel-Teflon-concrete interface in all the following FE models for the LoadCube samples.
Figure 14.
Comparison of interface simulation methods on the FE deformations at the surface of the 2020-LoadCube sample (the deformations are zero in the horizontal middle plane): (a) contact, μ = 0.2; (b) contact, μ = 0.4; (c) contact, μ = 0.6; and (d) tie.
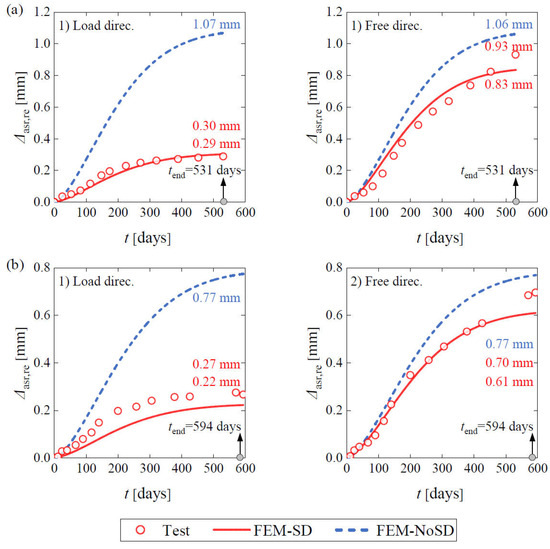
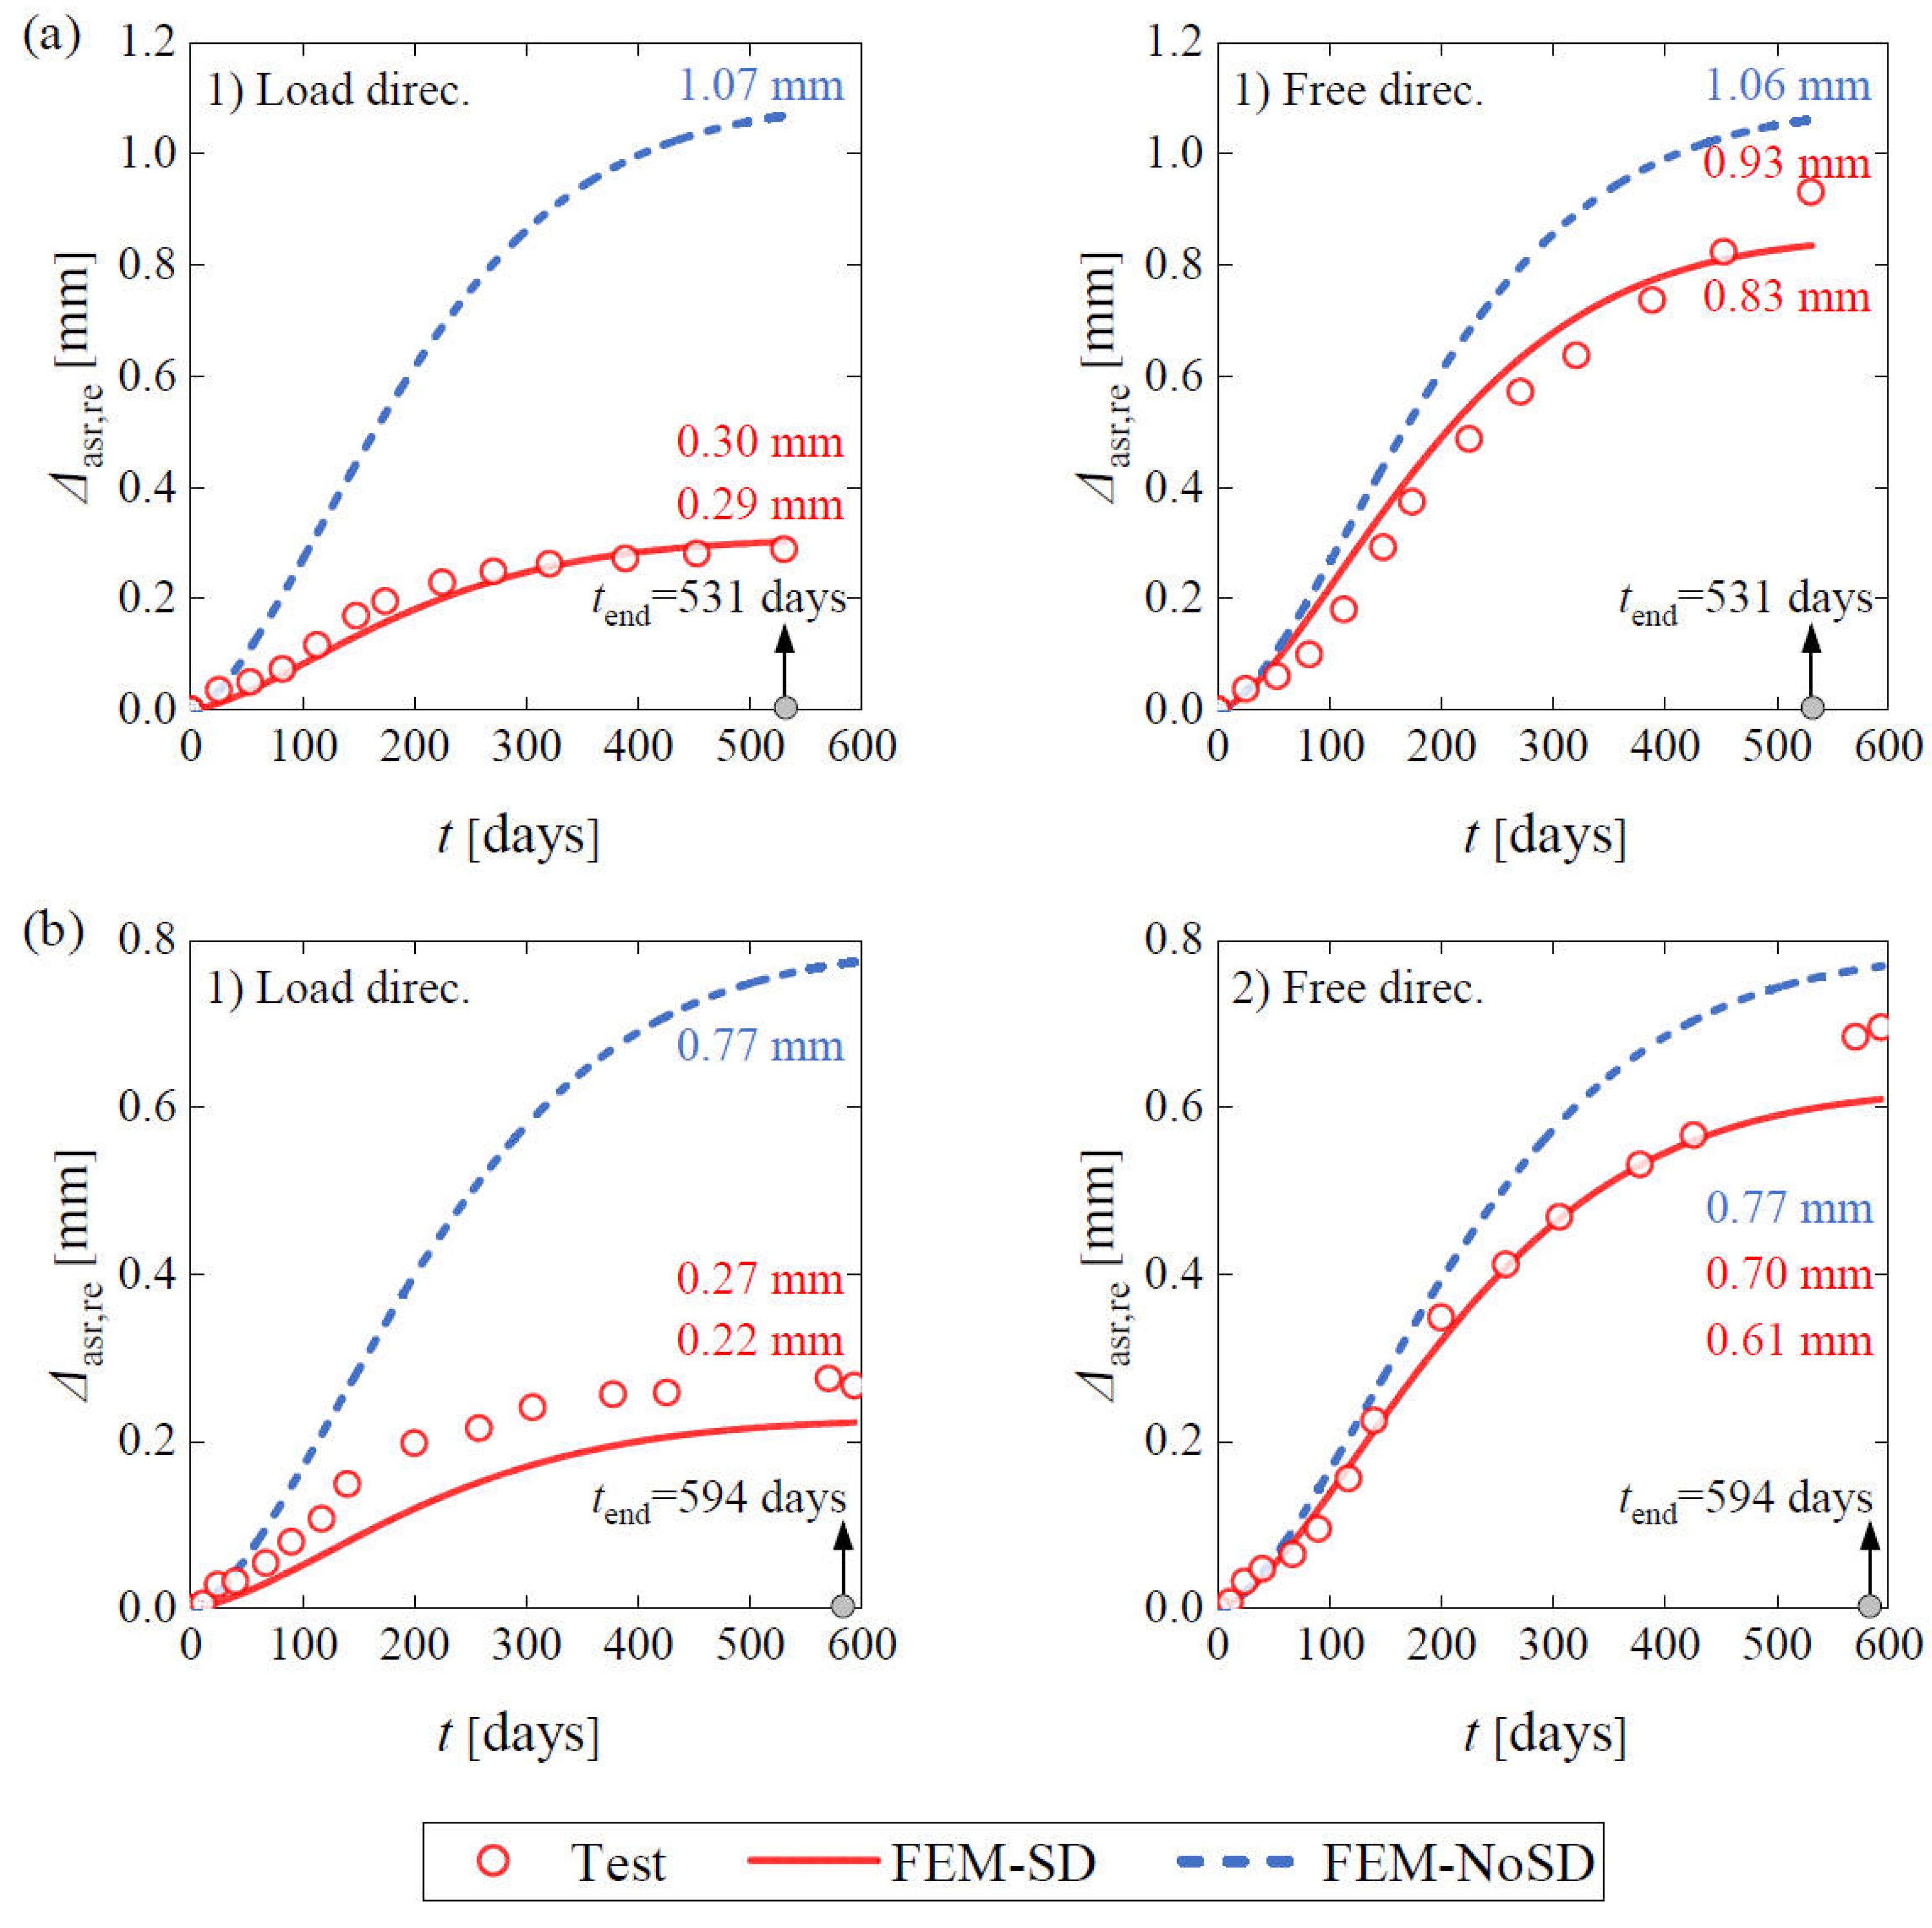
The FE modeling results of all the LoadCube samples, with and without considering stress-dependent expansion (noted as FEM-SD and FEM-No SD, respectively) were selected to be compared with the test measurements, as shown in Figure 15. It is clear that the FE model, neglecting the stress-dependent nature of ASR expansion, leads to significantly overestimated expansion in the load direction. When stress-dependence is incorporated in the FE model, the FE expansions correlate well with the experimental results. Taking the 2020-LoadCube specimen as an example, FEM-No SD significantly overestimates the expansion in the loading direction, predicting a value of 1.07 mm, approximately three times that of both FEM-SD and the experimental result. In the free direction, however, the effect of stress dependence is minor, and the FEM predictions remain in good agreement with the experimental observations. These results therefore demonstrate the validity and feasibility of the developed ASR expansion user subroutine and FE model.
Figure 15.
Restrained expansion history comparison between FE model and experiment: (a) 2020-LoadCube sample; and (b) 2019-LoadCube sample.
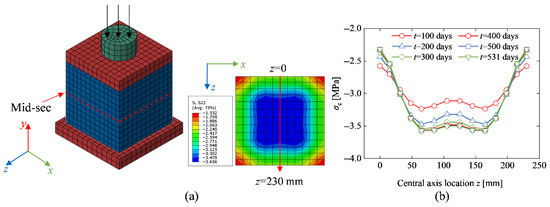
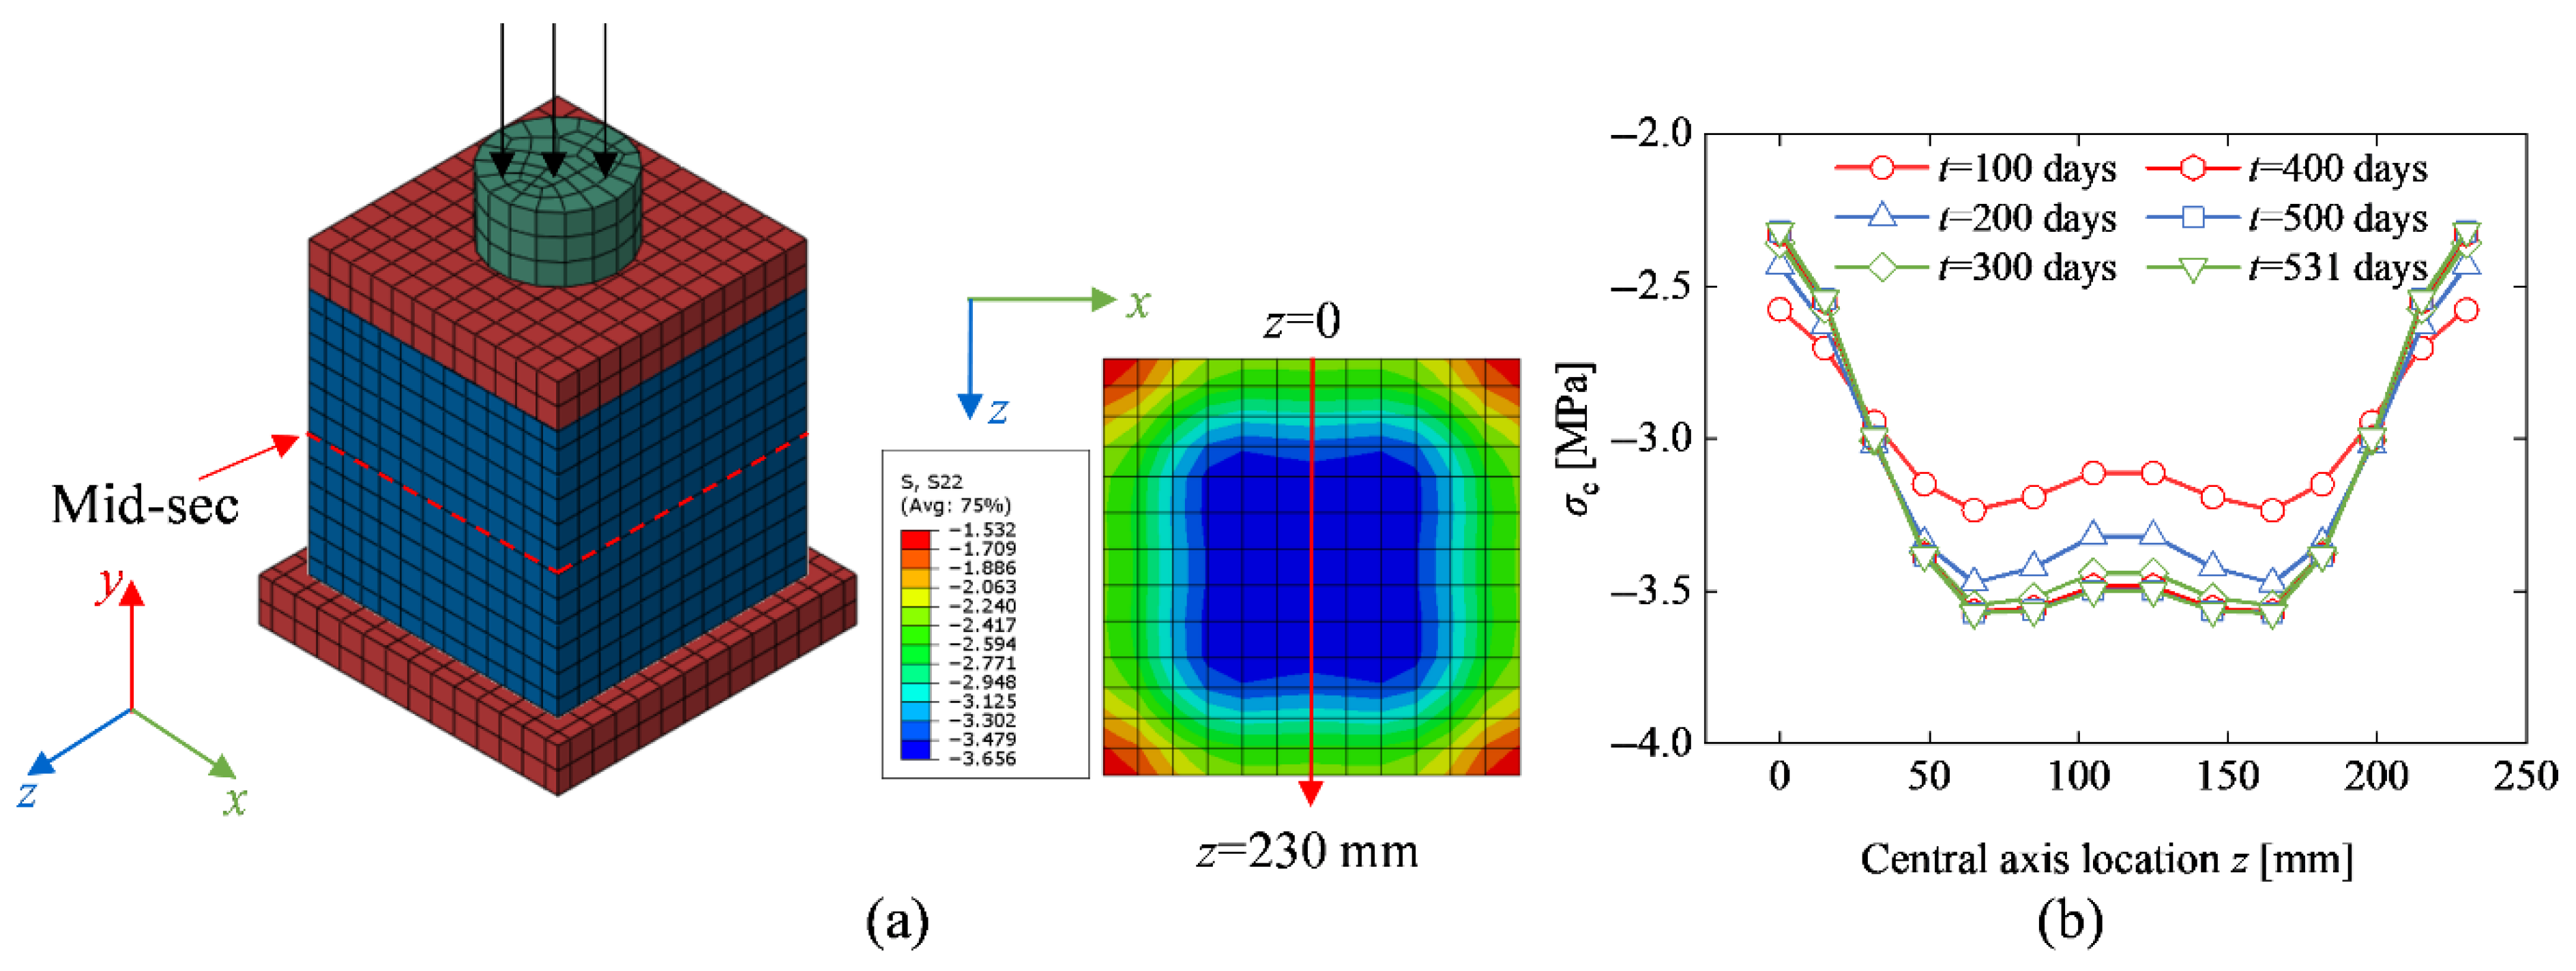
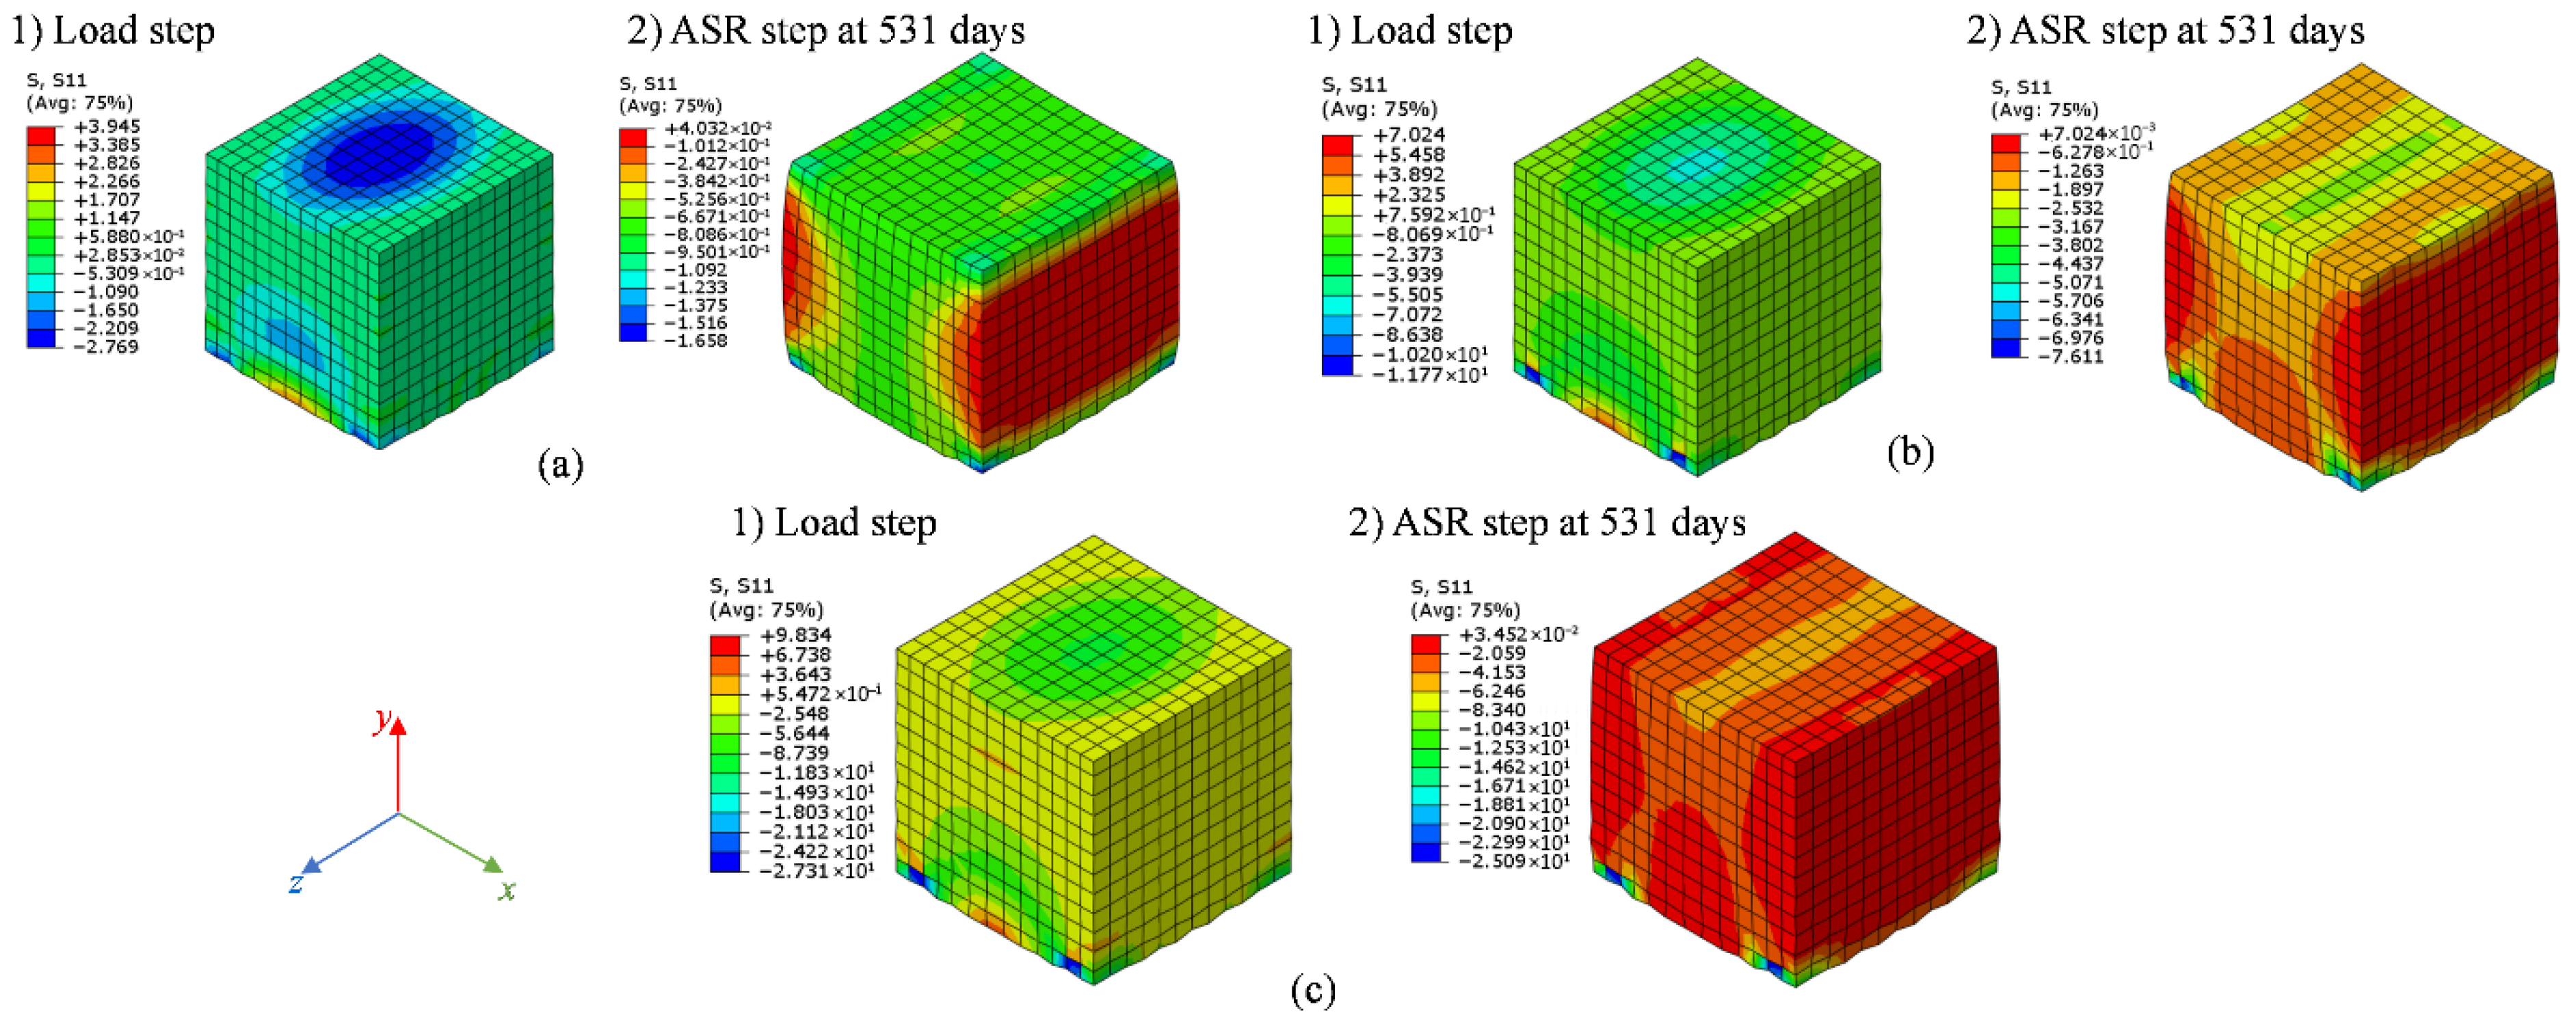
Figure 16 shows the vertical normal stress distribution at the mid-section of the 2020-LoadCube sample. The stress in the central zone of the cross-section is uniform. The concrete stress increases with time, induced by the restrained effect from the steel plate and boundary conditions.
Figure 16.
Vertical normal stress distribution at mid-section of the 2020-LoadCube sample: (a) stress cloud map at 531 days; and (b) stress distribution along the central axis.
3.4.2. RcPrism Samples
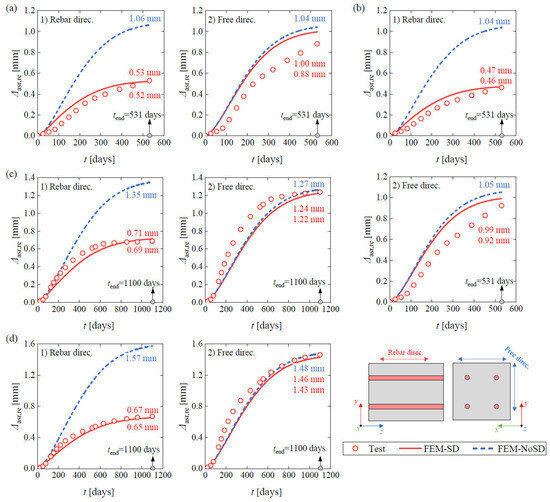
Figure 17 compares the restrained expansion history of the FE model and experiments for all the RcPrism samples, in which the FE models with and without considering stress-dependent expansion were described as FEM-SD and FEM-No SD, respectively. As shown, stress dependence has a negligible influence on the FE restrained expansion in the free direction. The FE restrained expansion considering stress dependence yields good agreement with the experimental measurements. Specifically, take the 2020-RcPrism-4ds16 sample as an example, the final measured expansion in the rebar direction was 0.53 mm, the FE result considering stress-dependence was 0.52 mm, while the FE value without stress-dependence was 1.06 mm. As for the free direction, the expansion values of FEM-SD and FEM-No SD were 1.04 mm and 1.00 mm, respectively, which were quite close to the experimental expansion of 0.88 mm.
Figure 17.
Restrained expansion history comparison between FE model and experiment: (a) 2020-RcPrism-4ds16 sample; (b) 2020-RcPrism-4ds20 sample; (c) 2019-RcPrism-4ds10 sample; and (d) 2019-RcPrism-4ds16 sample.
The comparisons between FE and experimental results for both LoadCube and RcPrism samples demonstrate that the proposed ASR expansion user subroutine can accurately simulate the time-dependent ASR expansion of concrete members under external as well as internal restraint. Additionally, this also validates the good applicability of the proposed free ASR expansion model in predicting the whole development process of the restrained ASR expansion. This ASR simulation approach can be extended to the ASR damage assessment of real structures, e.g., bridges and dams. The corresponding challenge is the capture of the free ASR expansion strain at the current stage. This input data can be obtained by the empirical relationship between free ASR expansion strain and E-modules of drilled cores extracted from the structures.
3.5. Stress and Strain Distributions of RC Samples
Considering that structural concrete members are typically reinforced with steel rebars under actual service conditions, this section presents an ASR-induced restrained expansion effect analysis for the RcPrism samples on the basis of the above numerical validation. As no strain gauges were attached to the rebars to monitor the rebar strain history in the laboratory test, the rebar stress and strain responses of the FE models were adopted due to the good simulation results from the above FE models.
3.5.1. Restrained ASR Expansion Strain Distribution
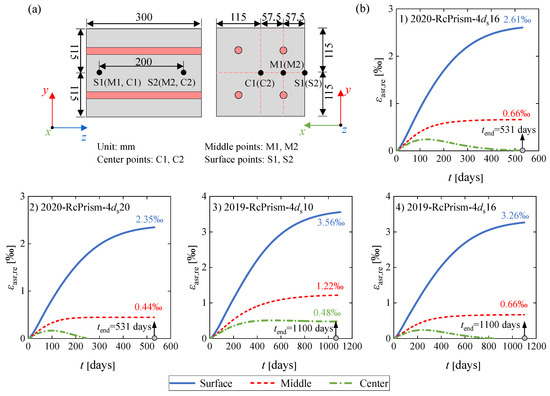
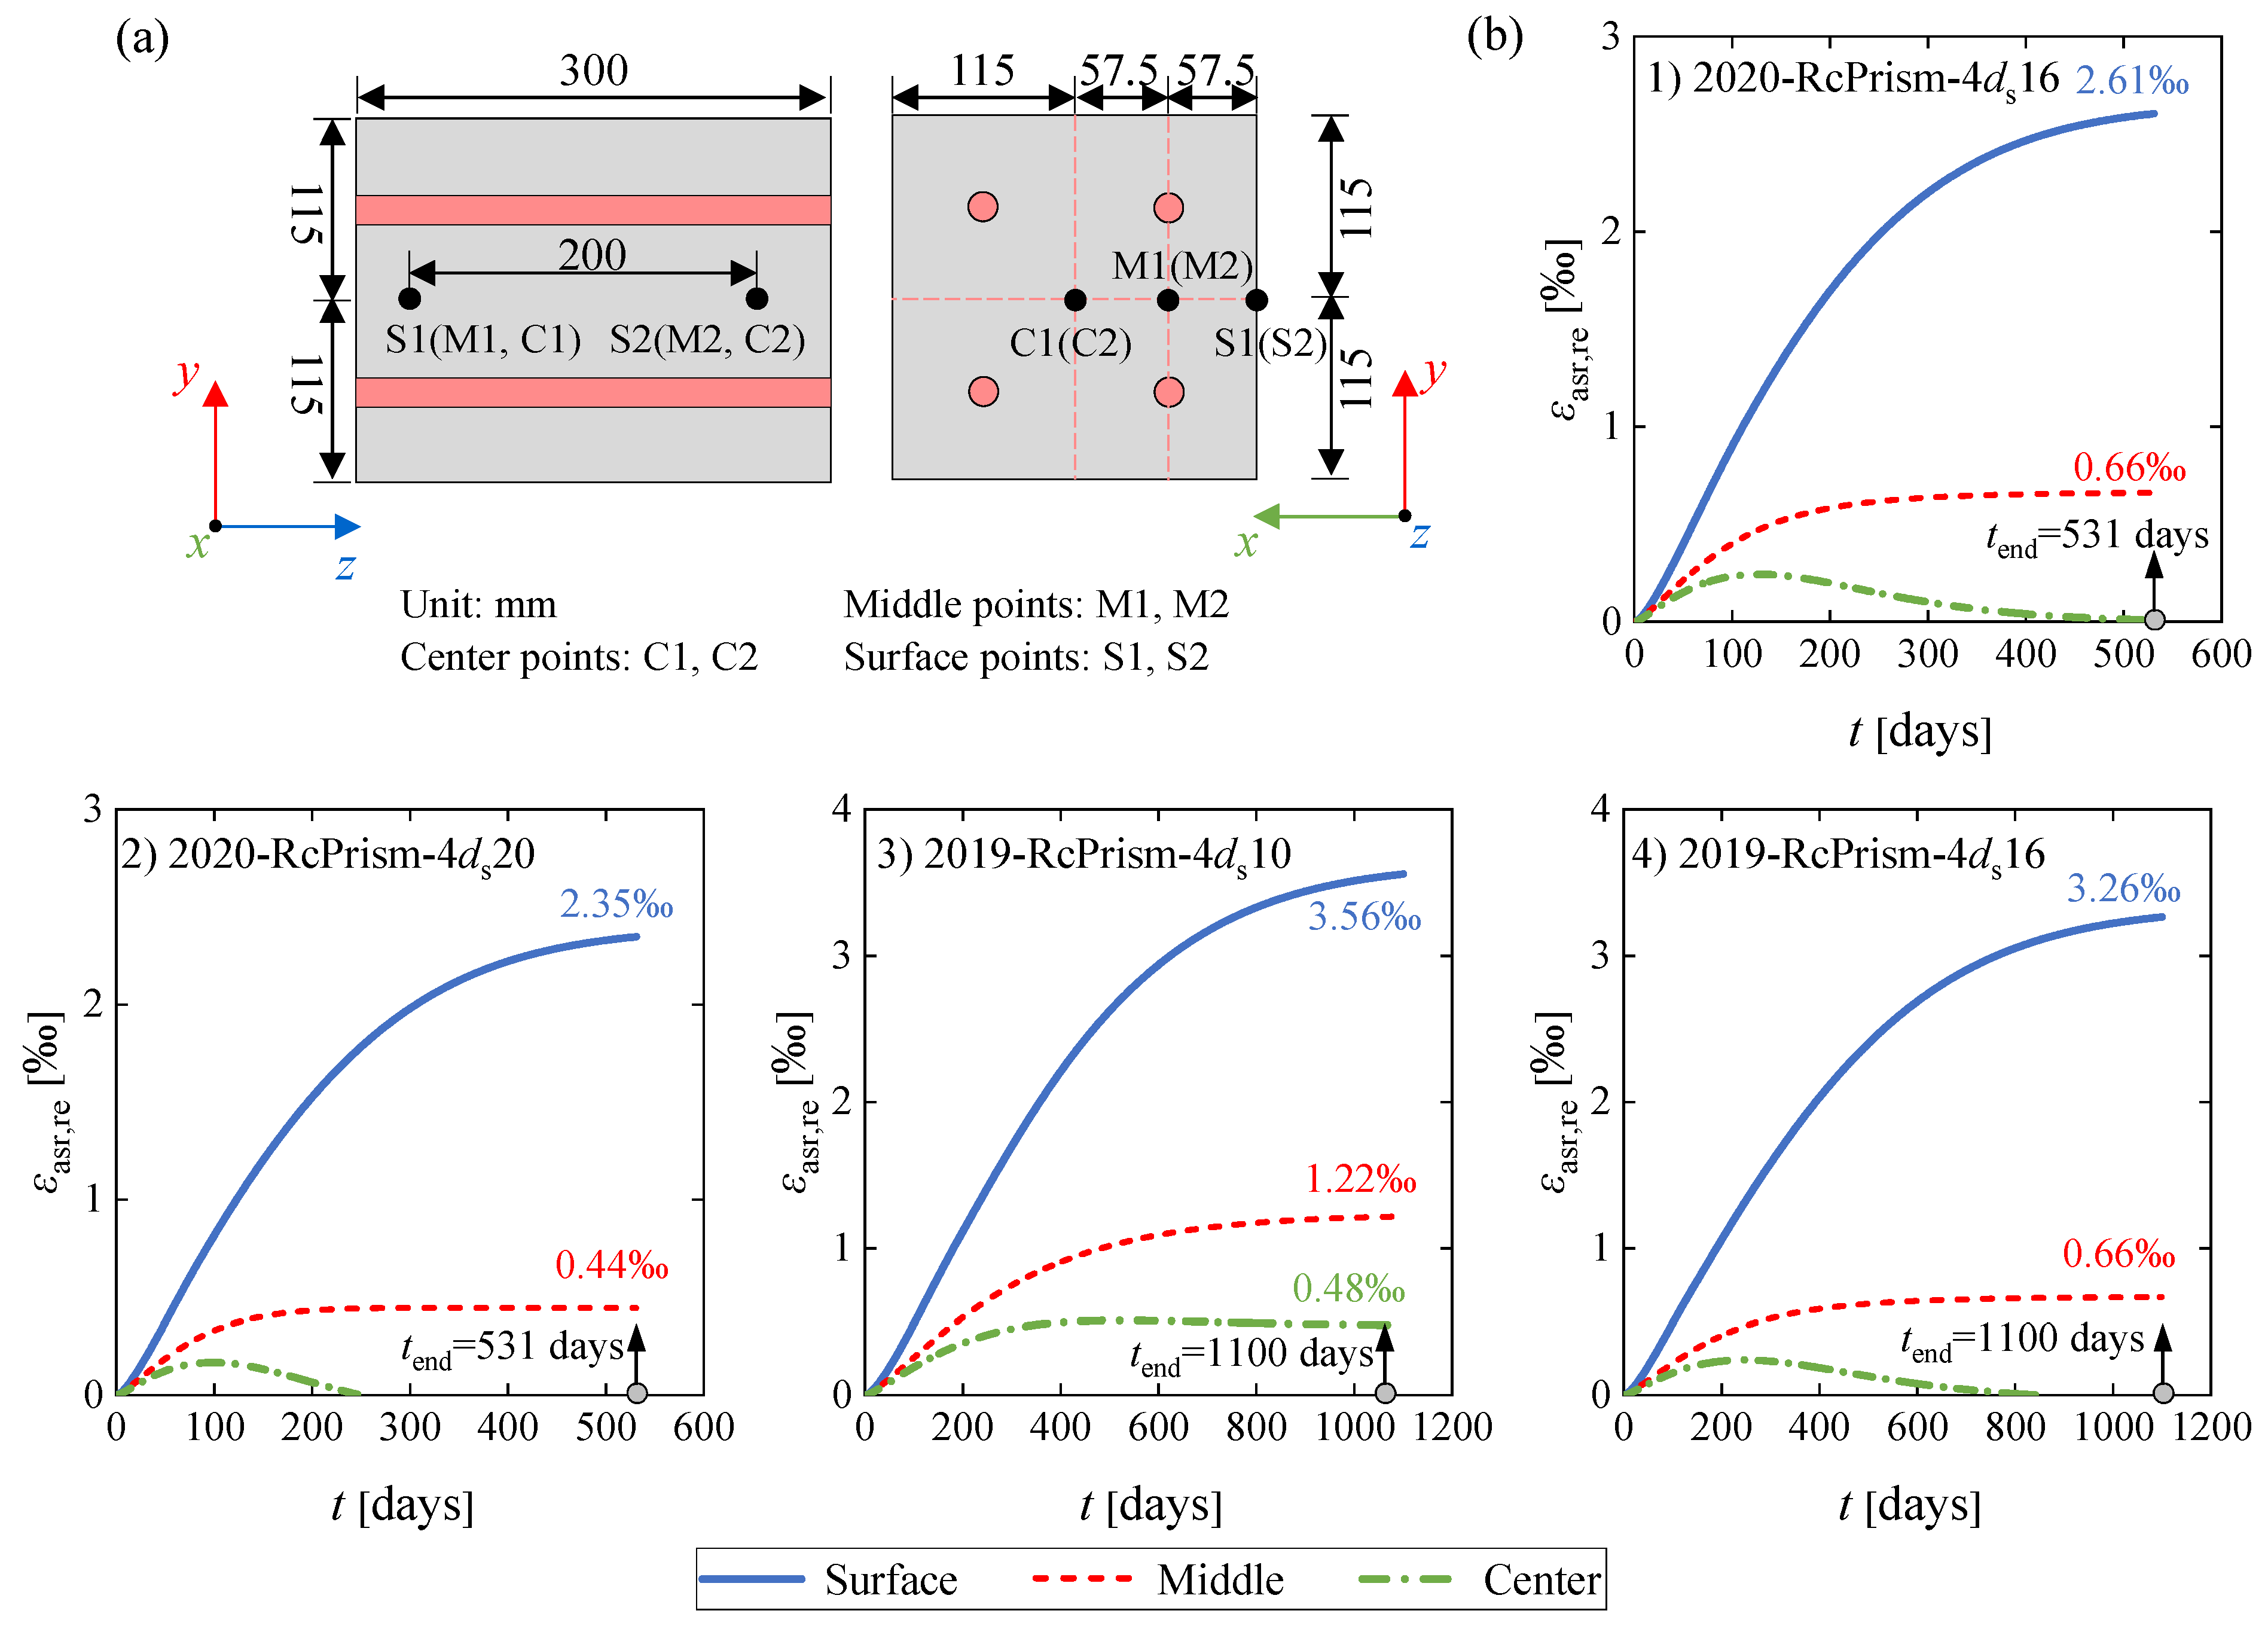
The laboratory test could only capture the ASR expansion on the sample surfaces due to technical limitations. Based on the validated FE model, the ASR expansion of the three locations at one cross-section, the surface point, the middle point, and the center point, shown in Figure 18a, can be obtained. Each location corresponds to two measuring points with a gauge length of 200 mm. The restrained ASR expansion strain in the rebar directions for the three locations can be calculated as the relative expansion of the two measuring points divided by the gauge length.
Figure 18.
Restrained ASR expansion strain history: (a) measuring point locations; and (b) comparison curves.
Figure 18b compares the restrained ASR expansion strains at the surface, in the middle and the center points. As shown, the restrained ASR expansion strain presents a descending trend from surface to middle and to center, demonstrating the inhomogeneity of ASR expansion over the same cross-section. The closer the concrete element is to the center, the stronger the constraints from the surrounding adjacent elements, thus resulting in less expansion even to compression.
3.5.2. Stress and Strain Analysis
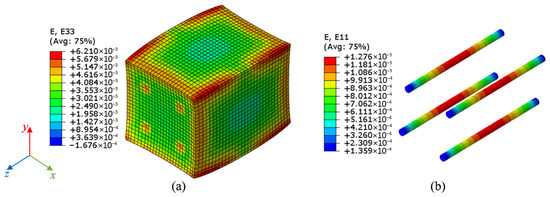
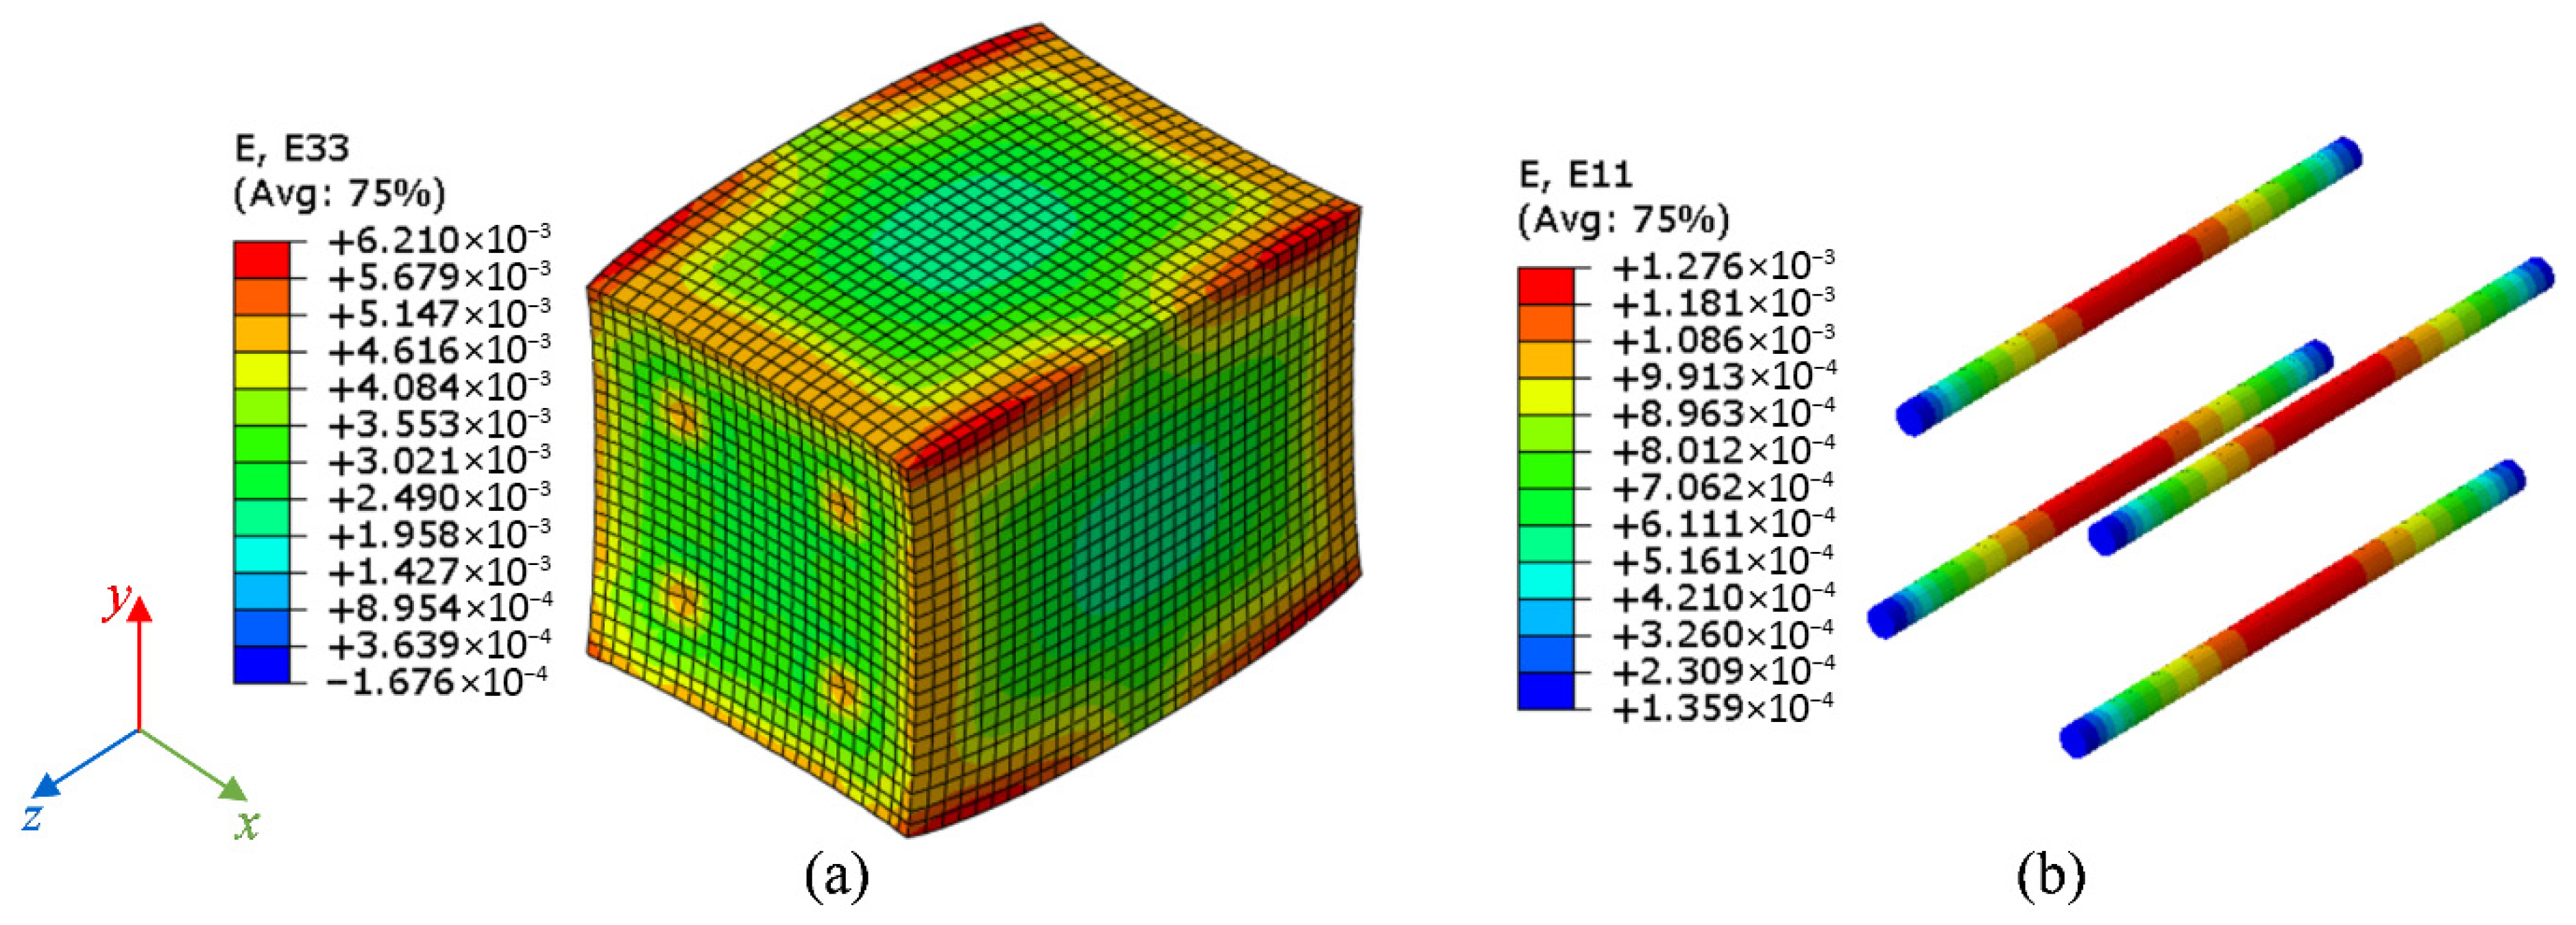
The 2020-RcPrism-4ds16 sample is chosen as a case for stress and strain analysis. Figure 19 shows the restrained ASR expansion strain distribution and the rebar strain distribution at 531 days. The ASR expansion strains exhibit a descending trend from the longitudinal end-section to the mid-section. For the cross-section, the edge parts present larger ASR expansion strains than the inner part. The rebar strains are increasing from the end-section to the mid-section.
Figure 19.
Strain distribution and deformation geometry at 531 days for the 2020-RcPrism-4ds16 sample: (a) restrained ASR expansion strain in the rebar direction; and (b) rebar strain.
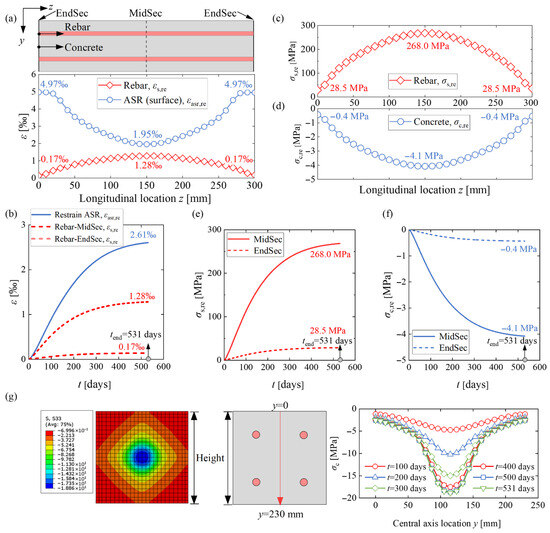
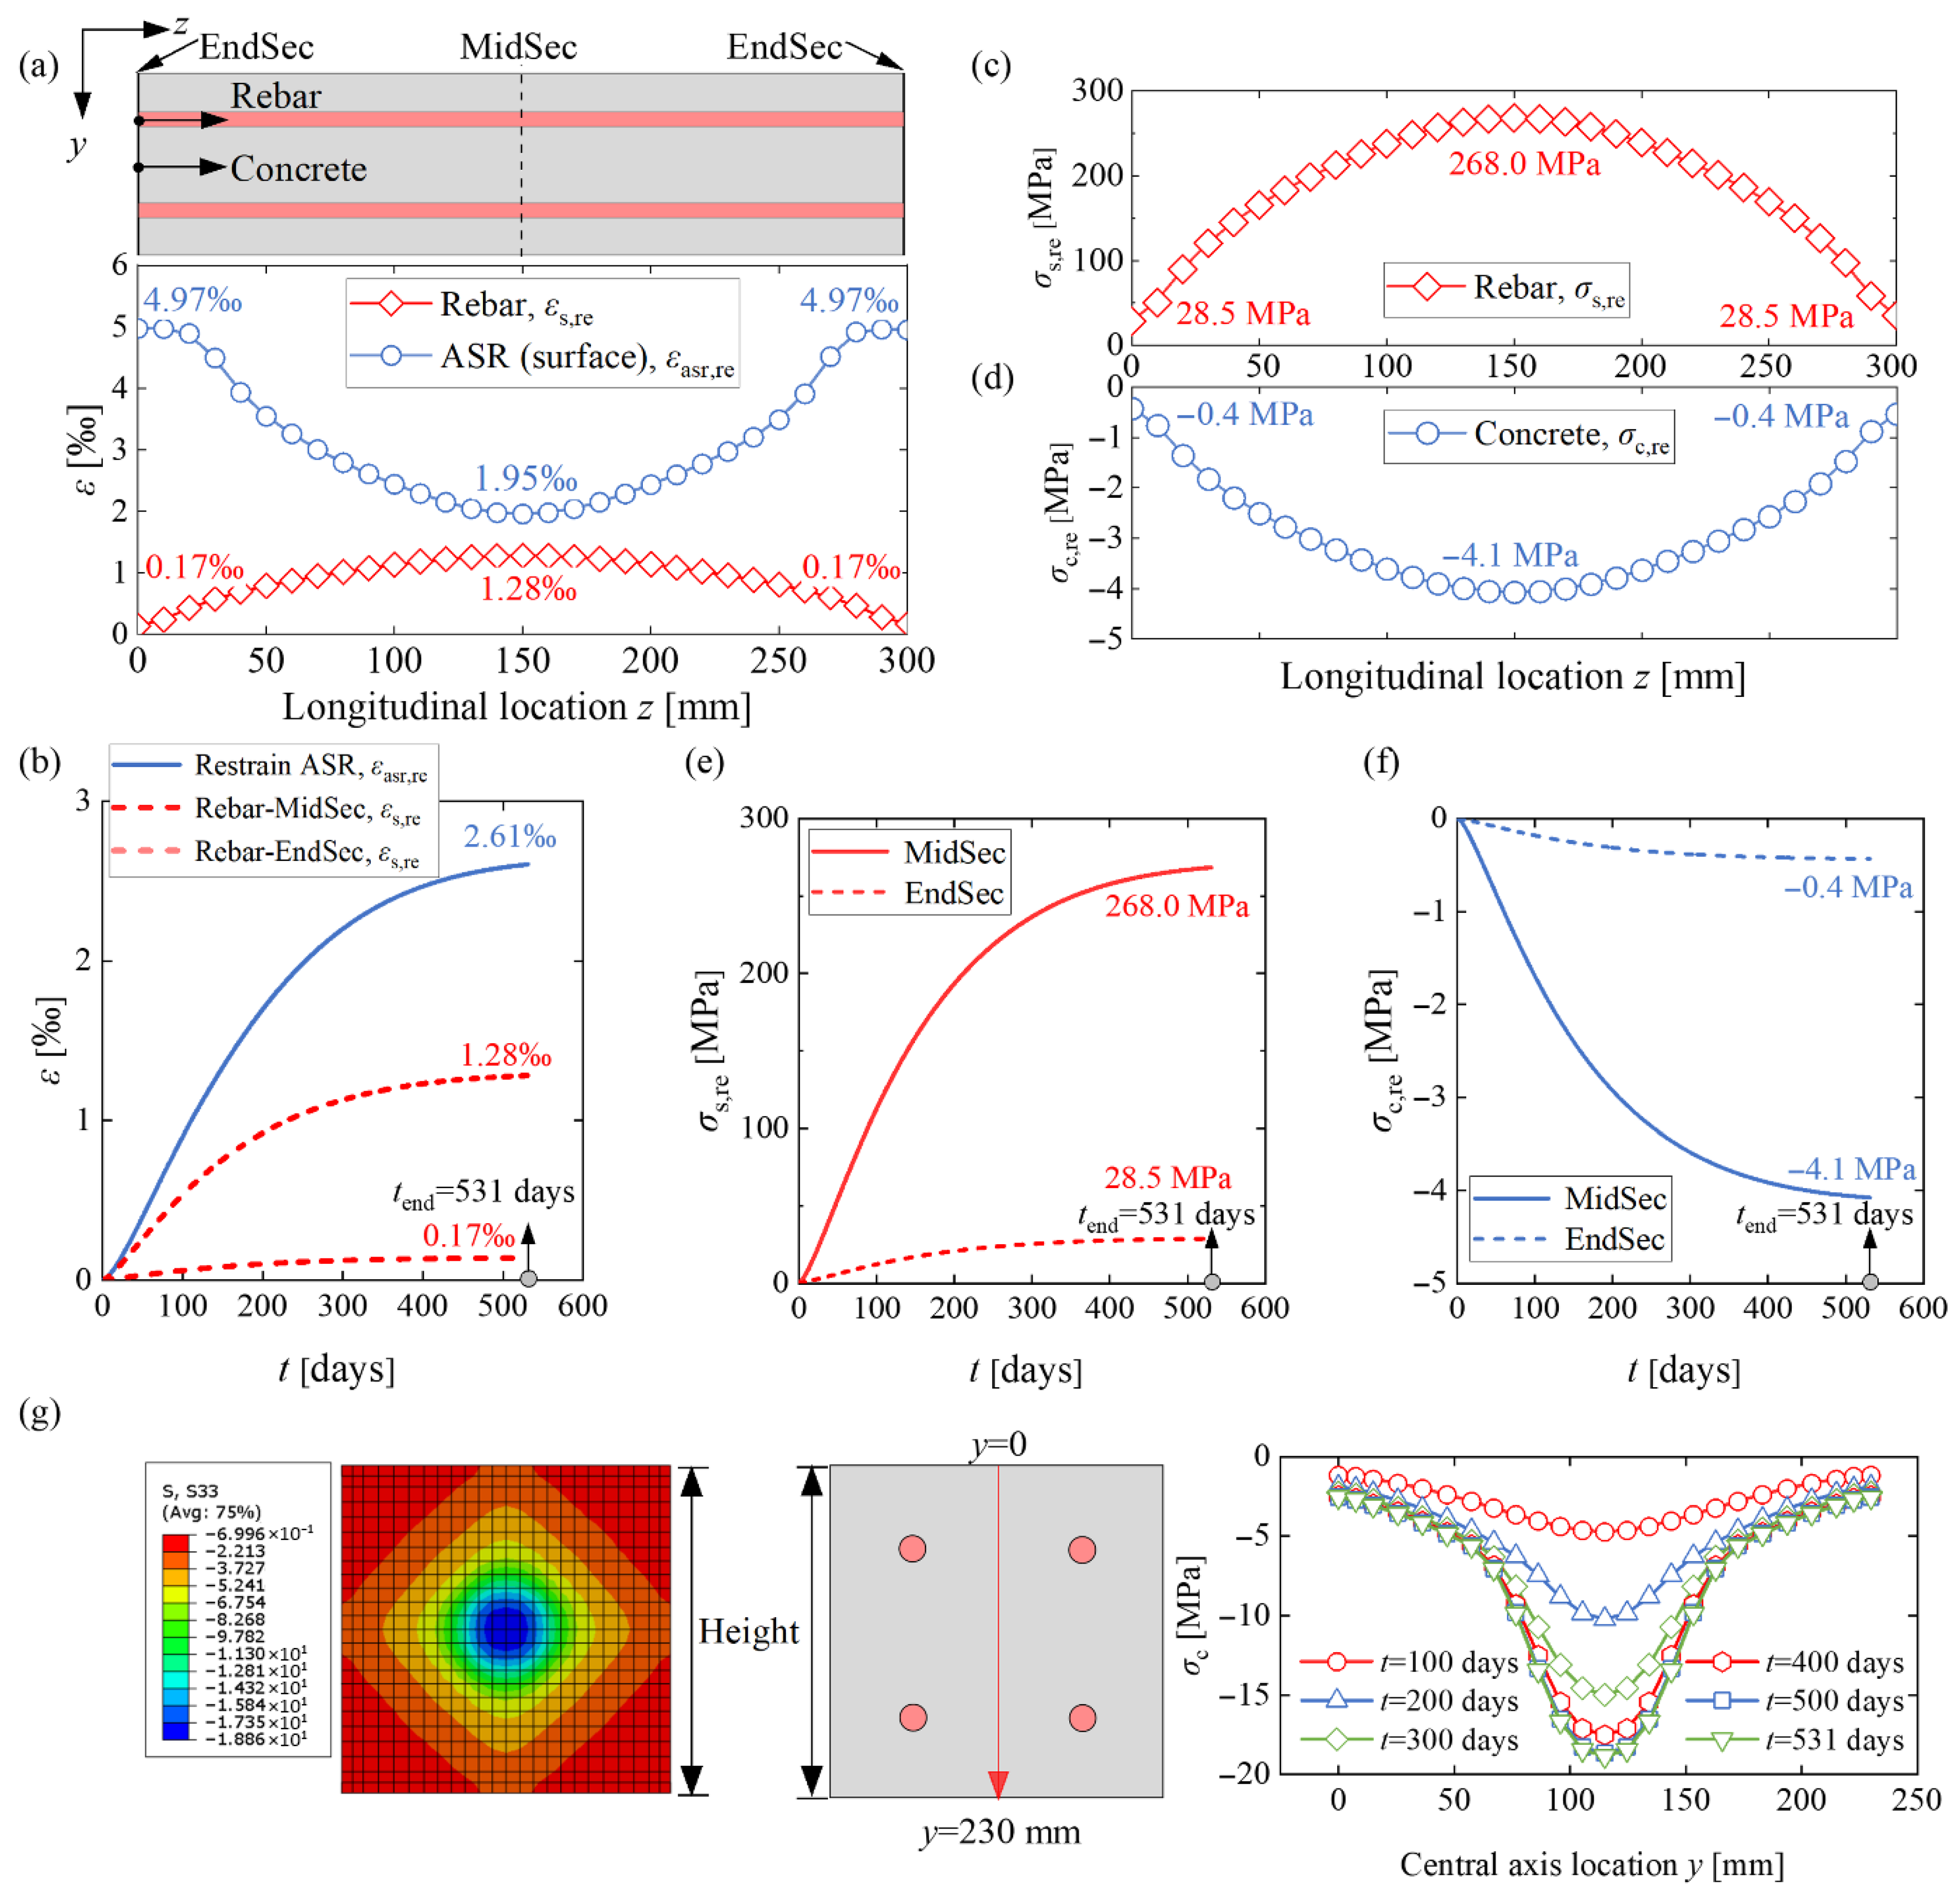
The more detailed restrained ASR strain distribution at the concrete surface and rebar strain distribution along the longitudinal axis are illustrated in Figure 20a. The restrained ASR strain decreases from 4970 με in the end-section to 1950 με in the mid-section, while the rebar strain increases from 170 με to 1280 με. Figure 20b compares the restrained ASR strain and the rebar strain history, where the restrained ASR strain was calculated as the surface expansion over the 200 mm gauge length. The mid-section rebar stain is 1280 με at 531 days, which is approximately half of the restrained ASR strain at the concrete surface. Therefore, if no rebar strain was captured in the laboratory ASR expansion test, taking the measured ASR expansion strain at the concrete surface as the rebar strain will lead to a significant overestimation of rebar yielding.
Figure 20.
Stresses and strains for the 2020-RcPrism-4ds16 sample: (a) restrained ASR strain distribution and rebar strain distribution in the longitudinal direction at 531 days; (b) restrained ASR strain history and rebar strain history; (c) rebar stress distribution at 531 days; (d) concrete normal stress distribution in the longitudinal direction at 531 days; (e) rebar stress history; (f) concrete compressive stress history; (g) concrete stress distribution at the mid-section.
Figure 20c and Figure 20d plot the rebar stress and the restrained concrete compressive stress distribution along the longitudinal axis, respectively. The concrete stress presented is the average stress of the concrete section, which is achieved through the rebar stress and internal force equilibrium. The restrained ASR expansion effect leads to rebar stress up to 268.0 MPa and concrete stress reaching −4.1 MPa. The rebar stress history and the concrete compressive stress history are illustrated in Figure 20e and Figure 20f, respectively. The FE stress and strain distribution and development for the other RcPrism samples are presented in the Appendix A.
Figure 20g presents the concrete stress distribution at the mid-section of the 2020-RcPrism-4ds16 sample. The stress distribution is not uniform, with a decreasing trend from the center to the edge. Additionally, the concrete stress increases with time due to the internal force equilibrium from increased rebar strains and stresses.
4. Parametric Study and Effect Prediction Framework
Based on the validated numerical models, a supplementary parametric study of the expansion behavior of the LoadCube and RcPrism samples was conducted. The 2020-LoadCube sample and the 2020-RcPrism-4ds16 sample were taken as benchmark examples. Table 5 lists the investigated parameters, including the concrete elastic modulus, the upper compressive stress bound used by the stress-dependent function, the applied external stress (for the LoadCube), the creep effect (for the RcPrism), the steel plate thickness (for the RcPrism), and the reinforcement ratio (for the RcPrism).
Table 5.
Parameters of the supplementary models.
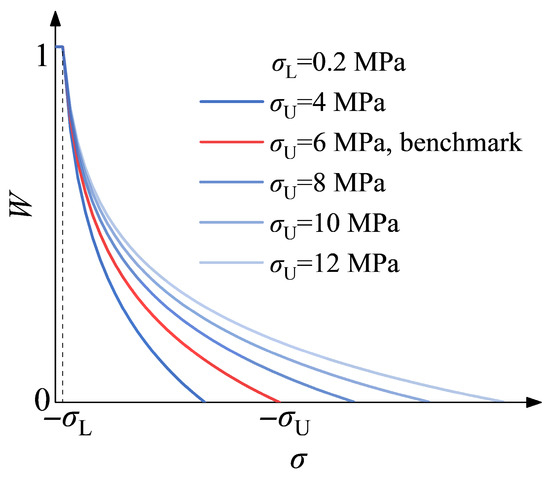
The simulations for deteriorated concrete E-modulus and creep were described in Sub-Section 3.1. The selected applied external compressive stresses cover the range from 3 to 11 MPa, which are within the linear-elastic limit 0.4 fc (taking the cylinder compressive strength fc as 30 MPa, approximately the minimum grade for concrete utilized in existing RC bridge structures). The varied upper compressive stress bounds were determined according to Figure 7b, and the corresponding stress-dependent functions are illustrated in Figure 21. The investigated reinforcement ratios range from 0.6% to 3.7%, covering the range from low to dense reinforcement.
Figure 21.
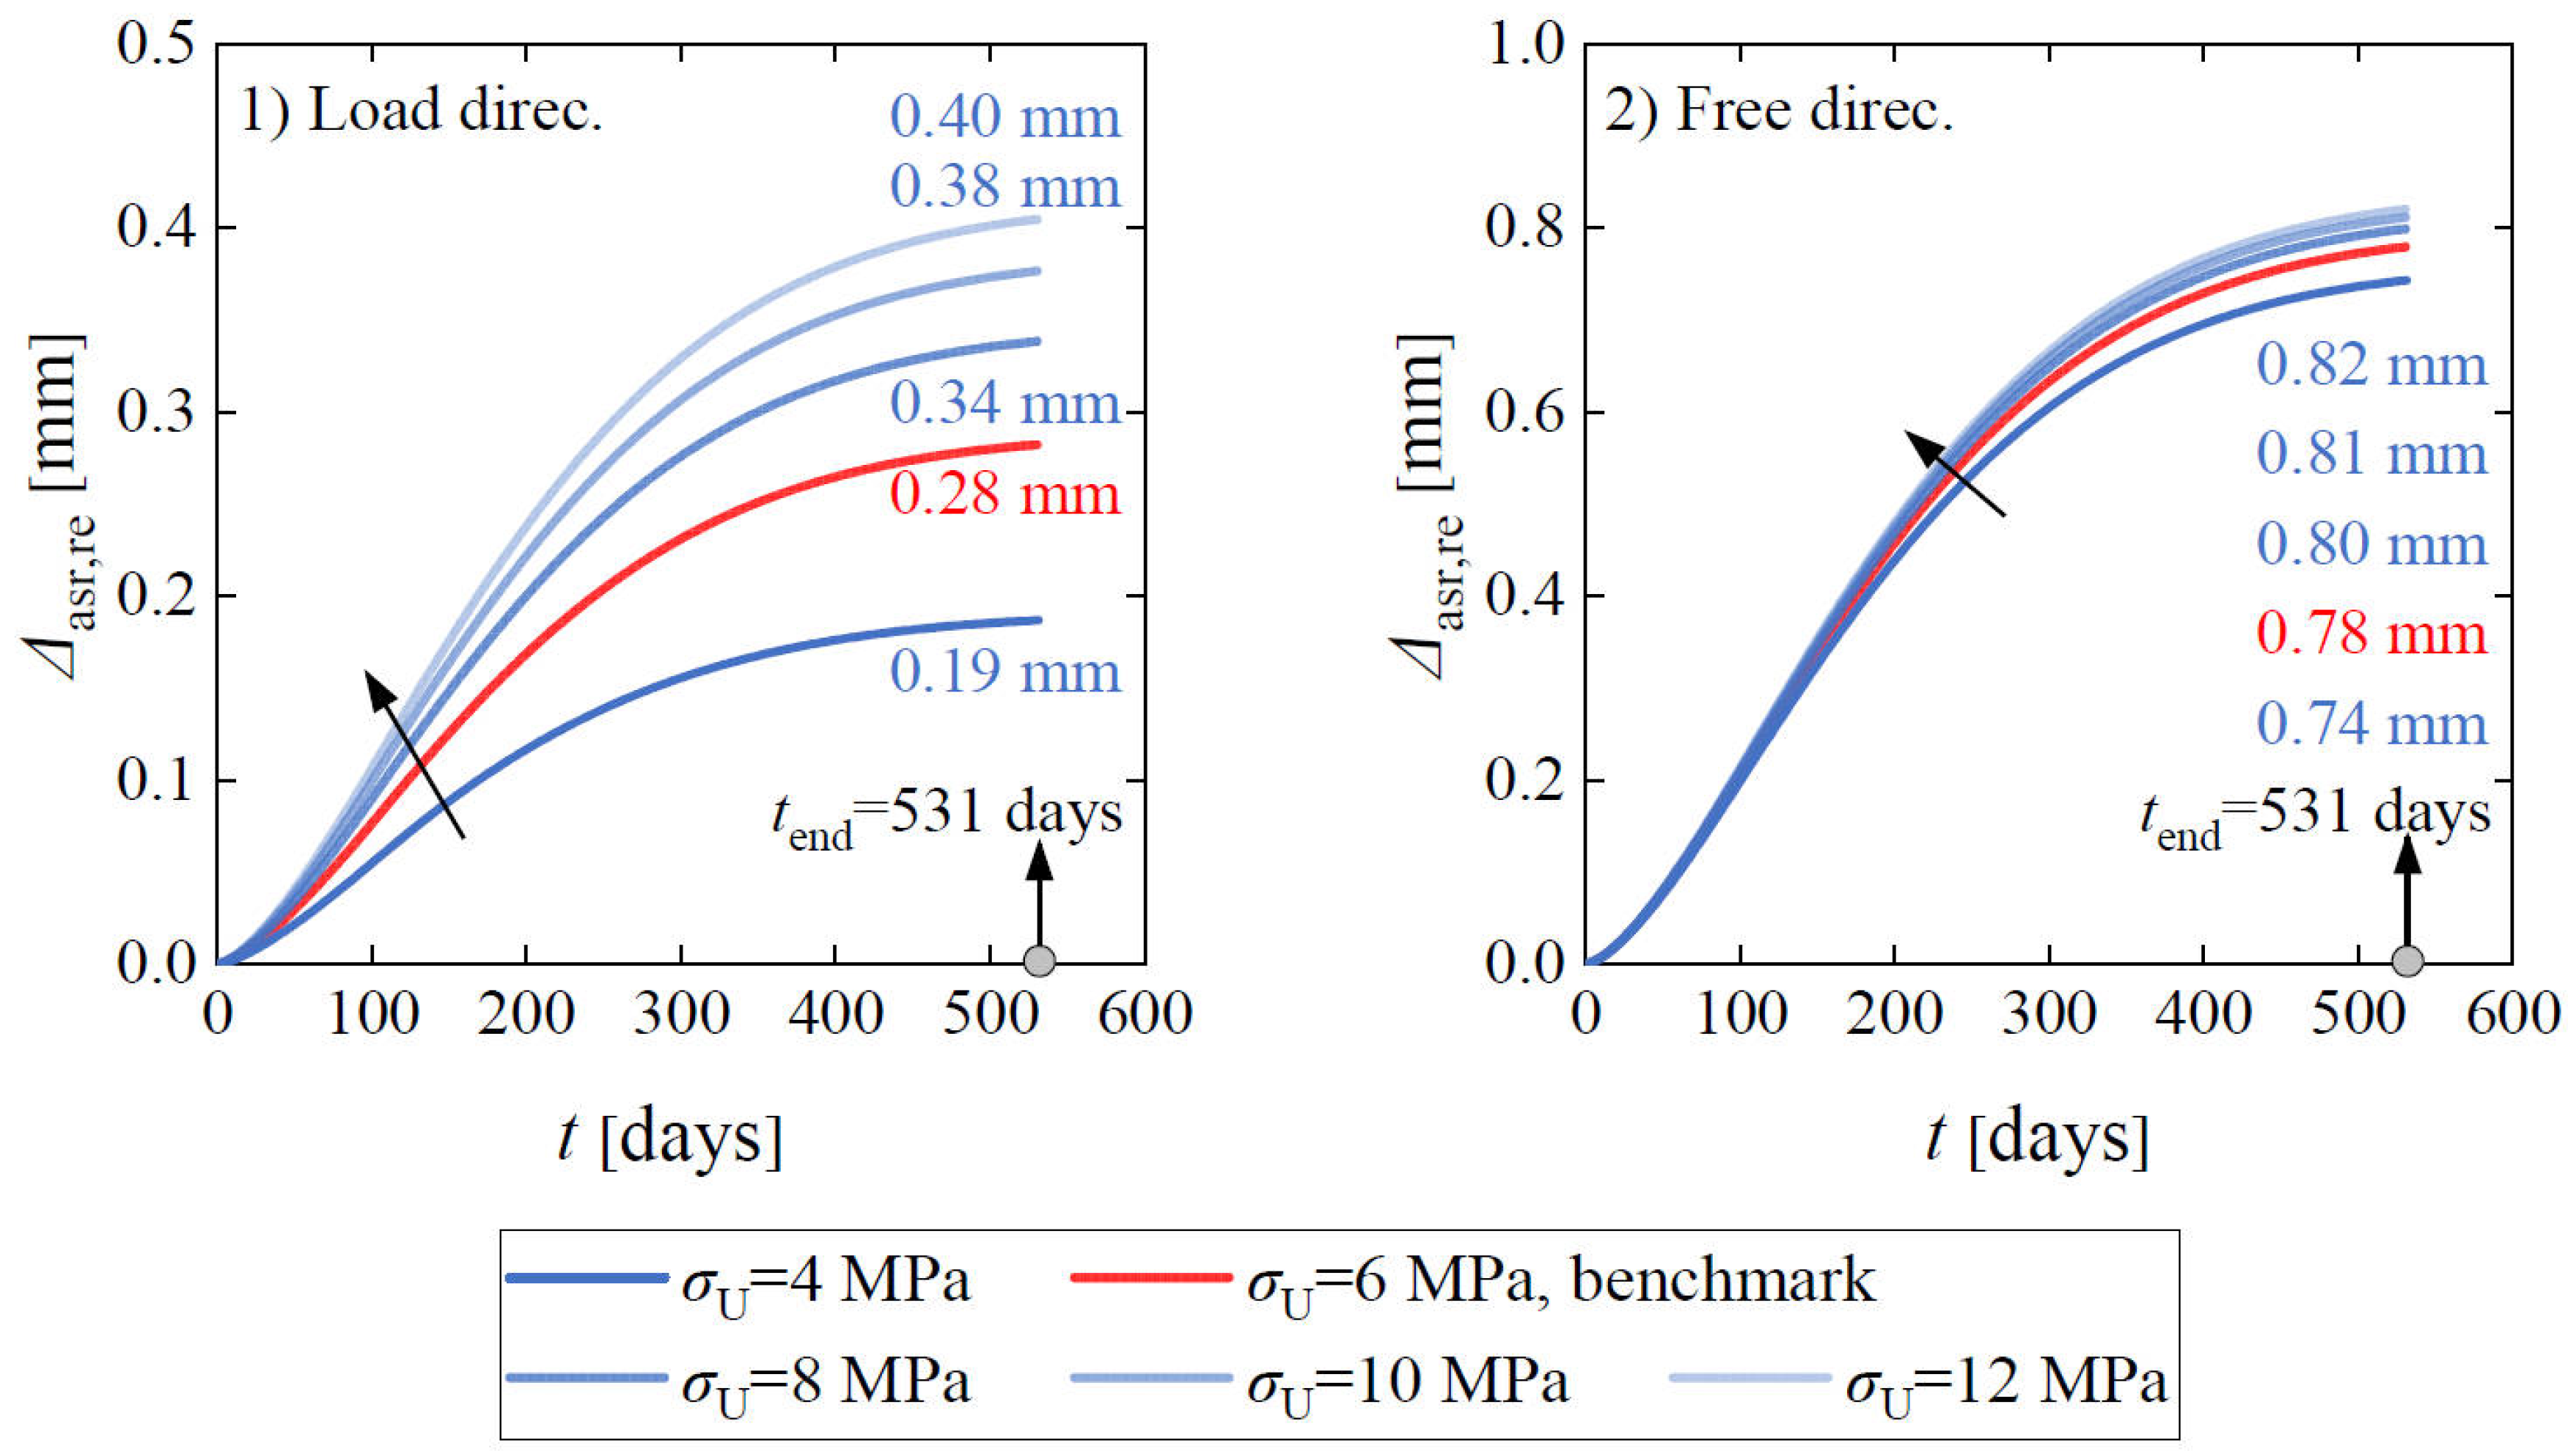
Stress-dependent functions assuming different upper compressive stress bounds (σU).
4.1. LoadCube Samples
4.1.1. Elastic Modulus
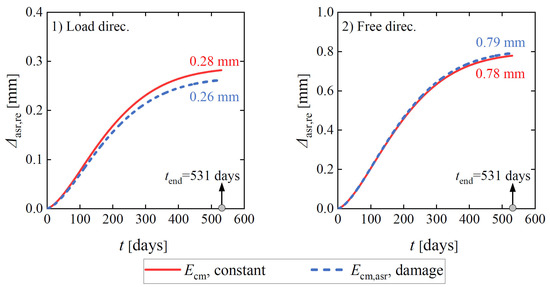
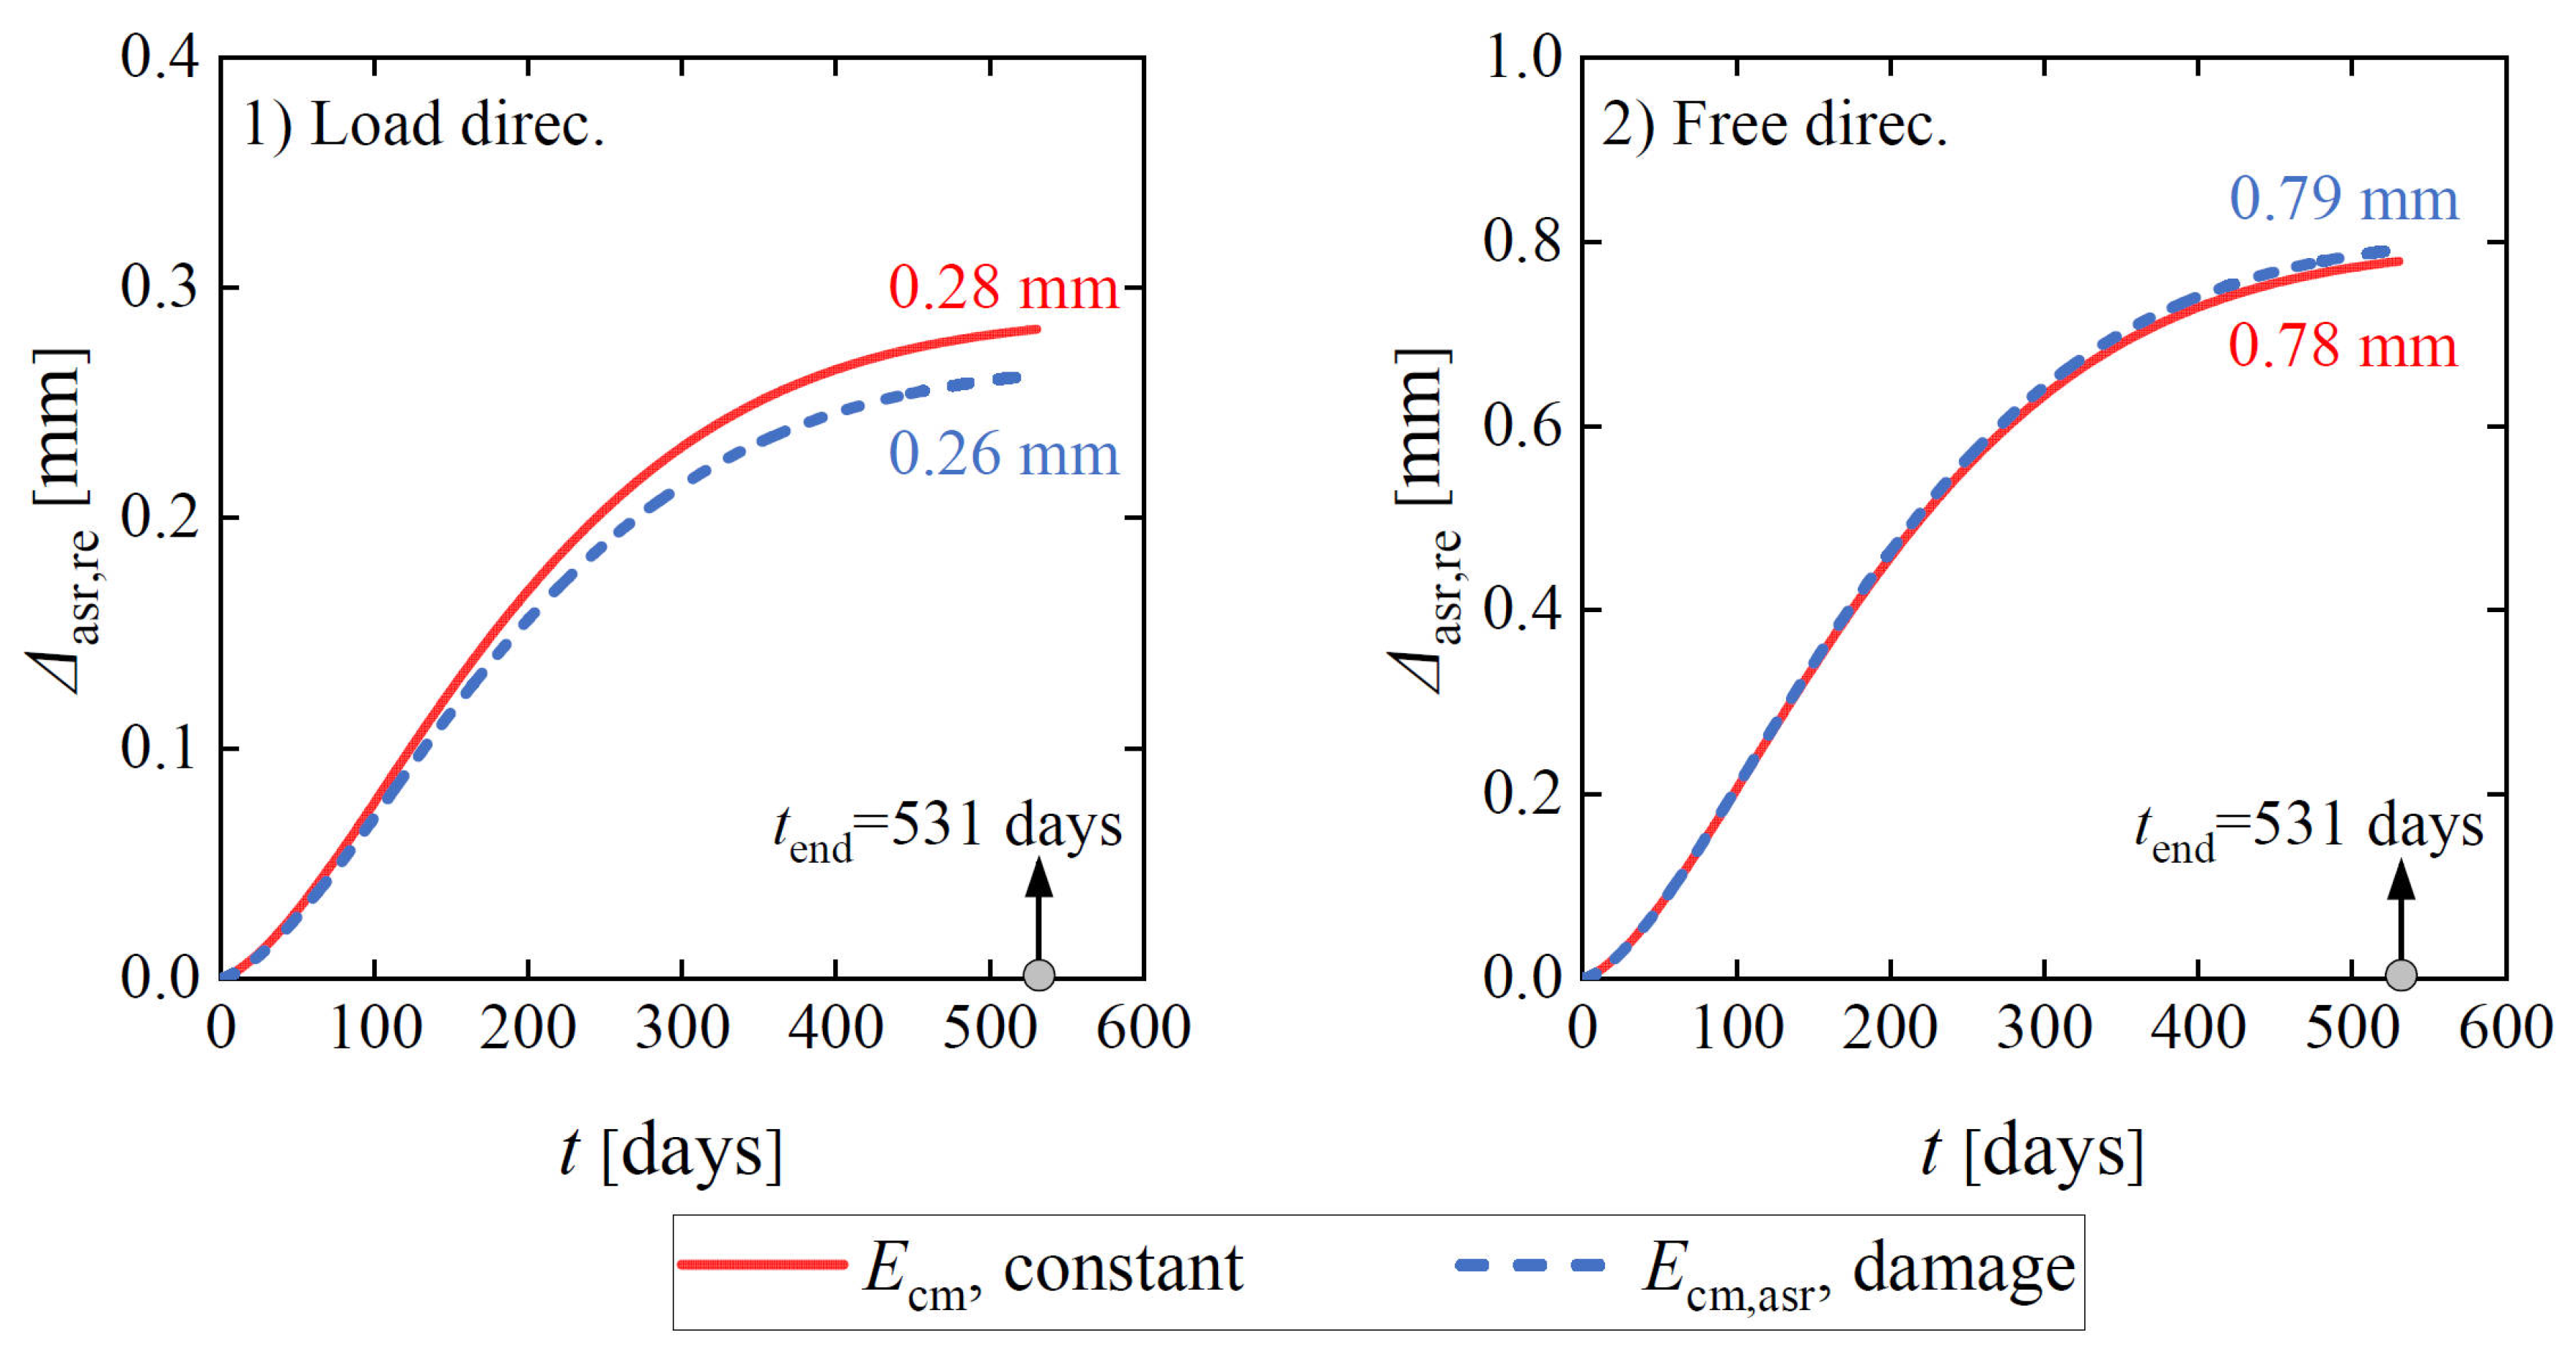
Figure 22 presents the influence of assuming a damaged elastic modulus on the restrained ASR expansion for the 2020-LoadCube sample. At 531 days, the elastic modulus is reduced to 37% of the initial elastic modulus in the region with the largest ASR expansion according to Equation (7). As illustrated, a damaged elastic modulus yields reduced expansion in the two directions, which is caused by the increased compressive strain or deformation. However, the effect can be neglected since it is relatively small.
Figure 22.
Influence of elastic modulus on restrained ASR expansion at the concrete surface for the 2020-LoadCube sample.
4.1.2. Stress-Dependent Function
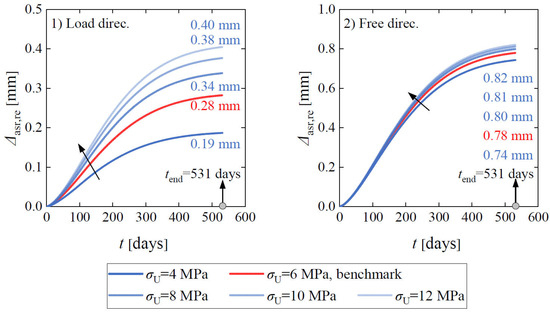
Figure 23 presents the influence of the upper compressive stress bound in the stress-dependent function on restrained expansion for the 2020-LoadCube sample. In the FE models, the applied external compressive stress was kept at 3 MPa. As the stress bound increases from 4 MPa to 12 MPa, the constrained effect on expansion continuously declines, resulting in increased expansion, as can be observed in the two directions. Furthermore, the influence on expansion in the load direction is more pronounced than in the free direction.
Figure 23.
Influence of the upper compressive stress bound of stress-dependent function on restrained ASR expansion at the concrete surface for the 2020-LoadCube sample.
4.1.3. Applied External Stress
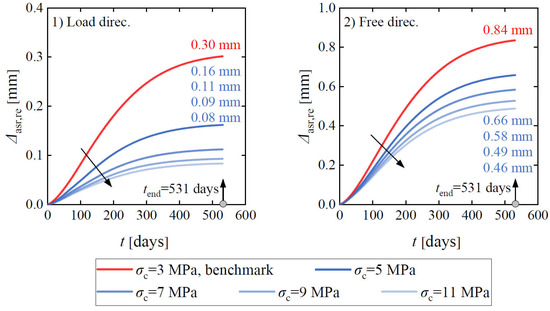
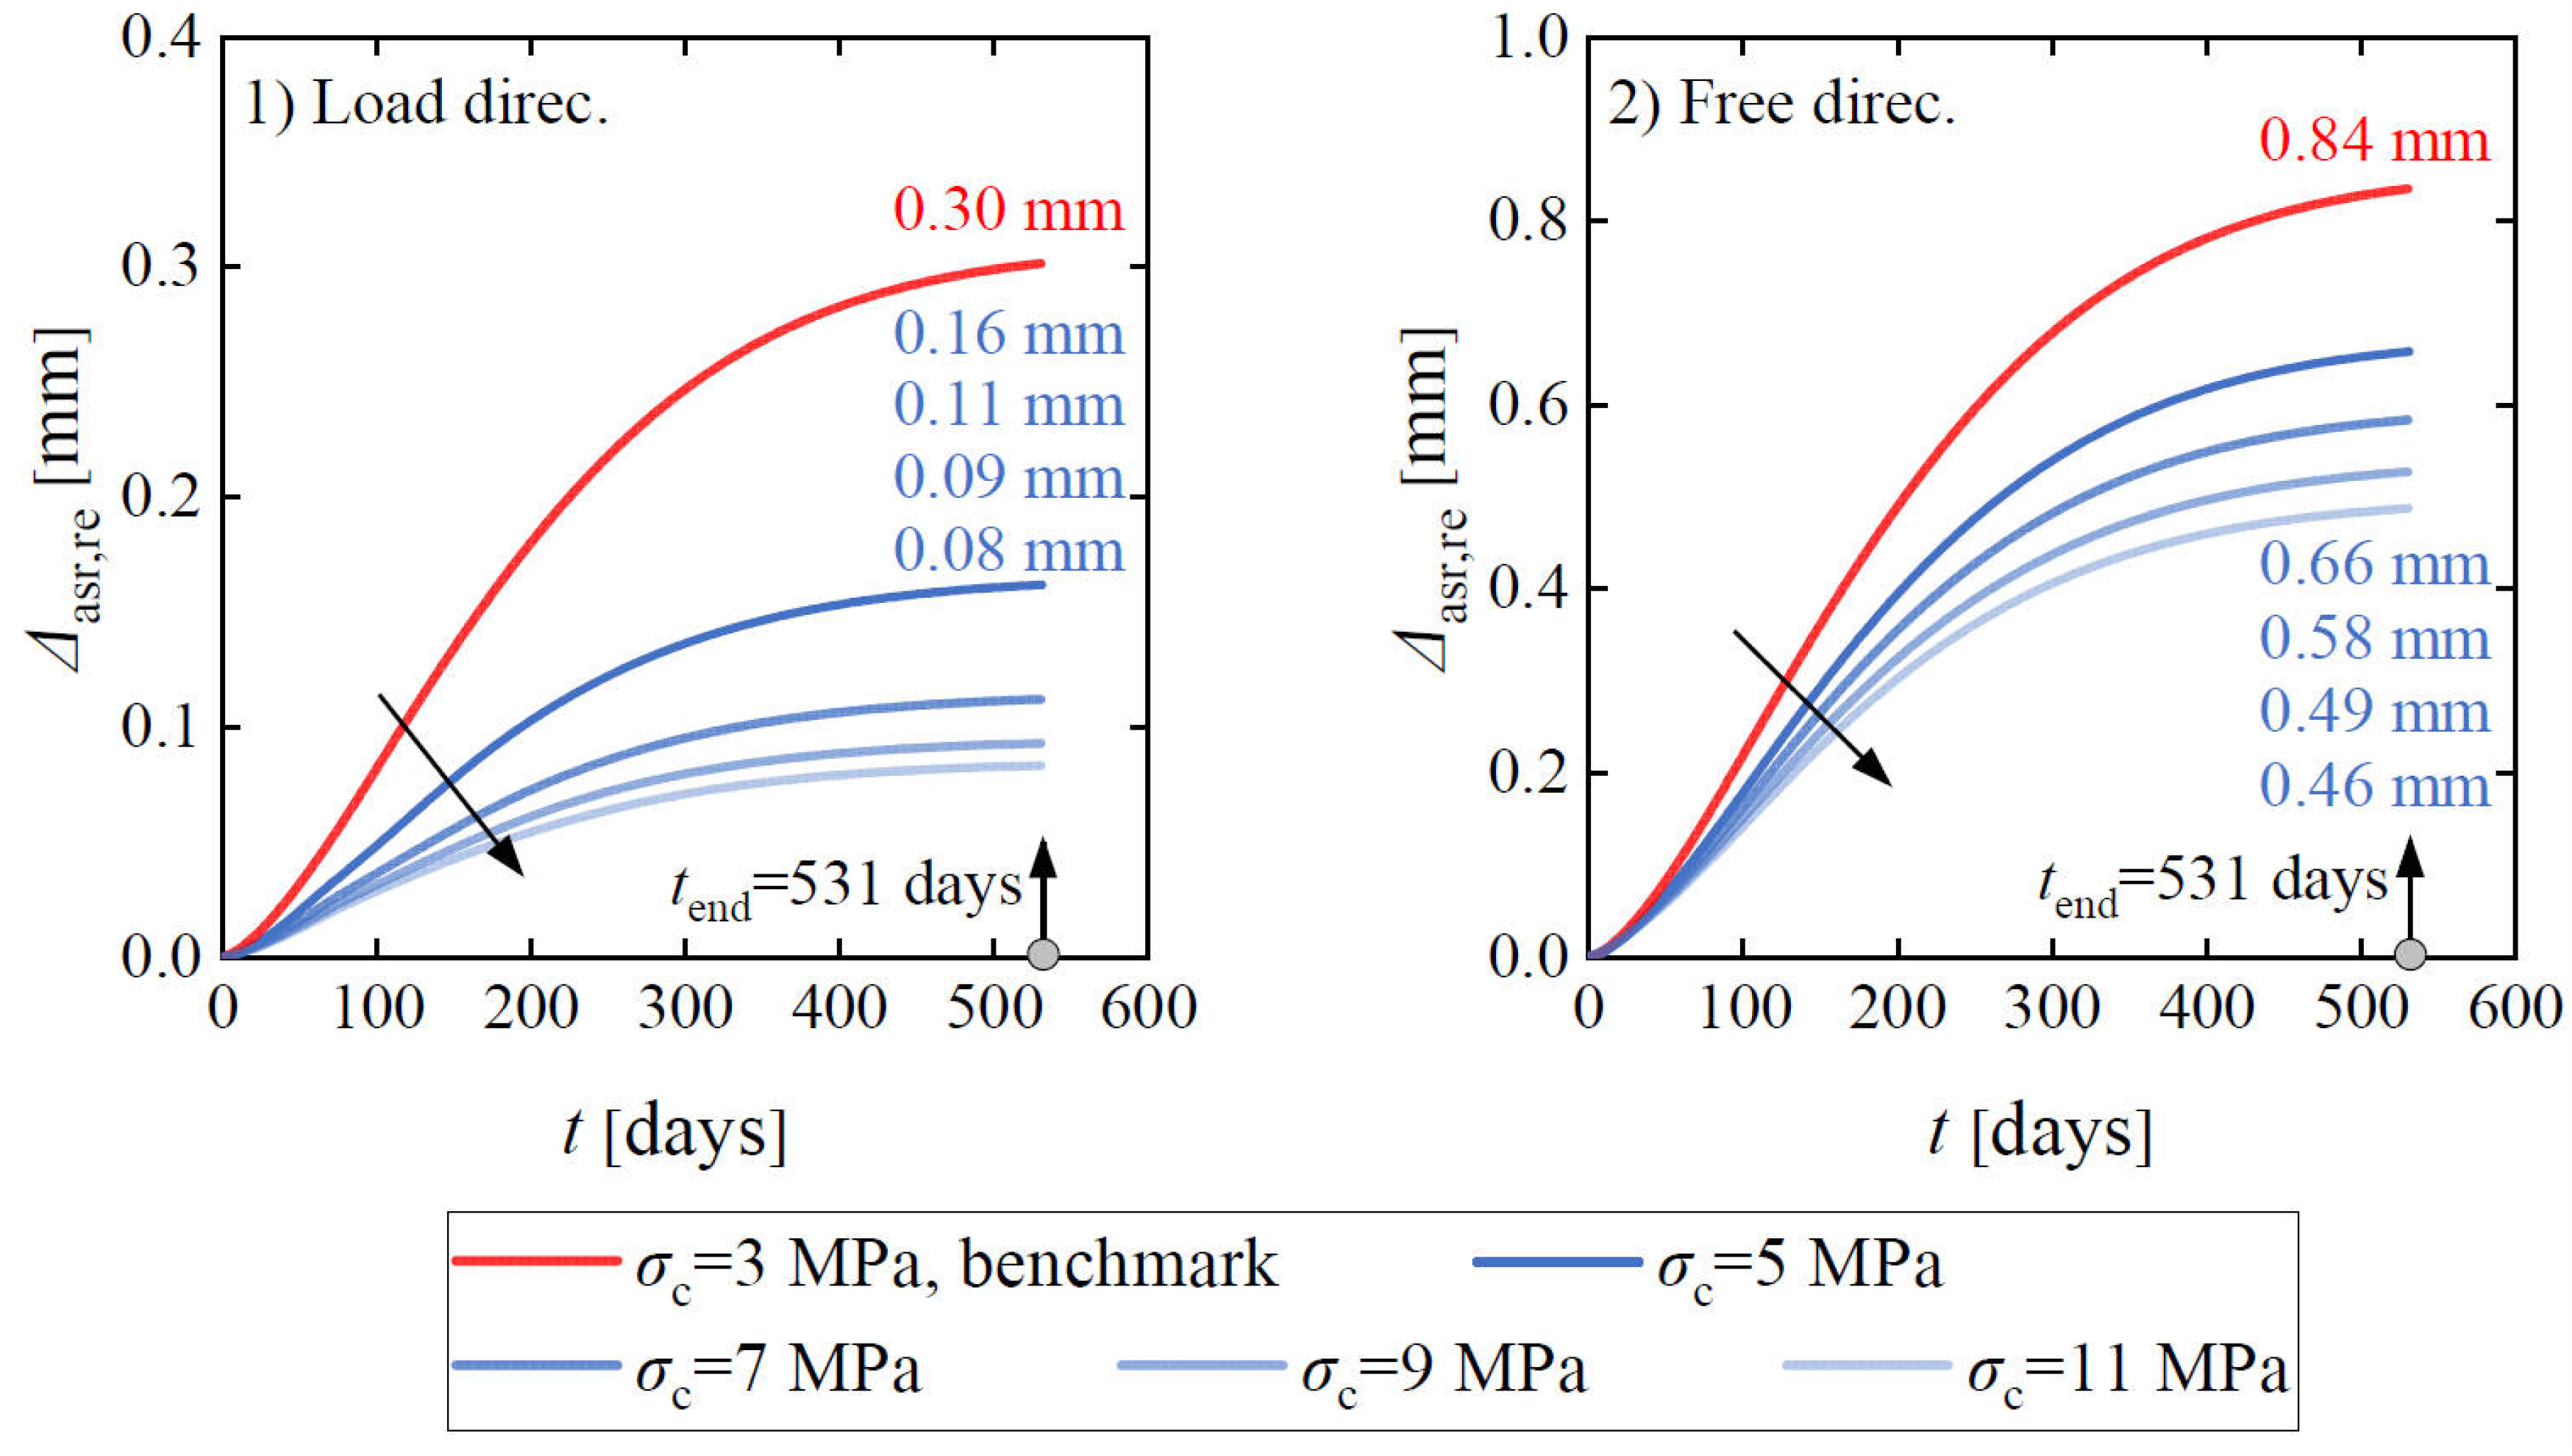
Figure 24 compares the influence of the applied external stress on the restrained expansion for the 2020-LoadCube sample. The expansion in the load direction shows a significant decrease as the compressive stress increases from 3 MPa to 7 MPa, followed by a minimal reduction when the compressive stress increases from 7 MPa to 11 MPa. This behavior is attributed to the upper compressive stress bound of the stress-dependent function being set at 6 MPa, beyond which the ASR expansion becomes negligible.
Figure 24.
Influence of the applied external stress on restrained ASR expansion at the concrete surface for the 2020-LoadCube sample.
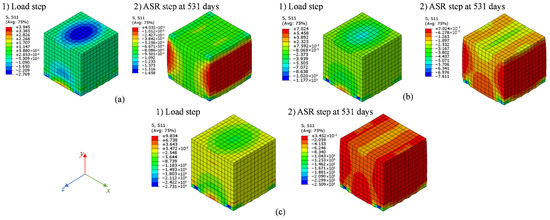
Additionally, the expansion on the concrete surface in the middle of the cube height in the free direction also exhibits a pronounced decline as the compressive stress increases from 3 MPa to 11 MPa, as shown in Figure 24. Figure 25 illustrates the normal stress distribution of the concrete cube in the free direction (x-axis) under the varying compressive stress, in which each stress condition consists of two cases: during the load step (without ASR expansion) and including ASR expansion at 531 days. Even at the load step, the normal compressive stress in the free direction presents an increasing trend as the compressive stress increases from 3 MPa to 11 MPa. Furthermore, the normal compressive stress in the free direction grows at the expansion step, which can be interpreted by the restrained expansion effect from the two steel plates. This phenomenon can explain the decreased ASR expansion in the free direction.
Figure 25.
Normal stress distribution in free direction (x-axis) for 2020-LoadCube sample: (a) σc = 3 MPa, benchmark; (b) σc = 7 MPa; and (c) σc = 11 MPa.
4.2. RcPrism Samples
4.2.1. Elastic Modulus
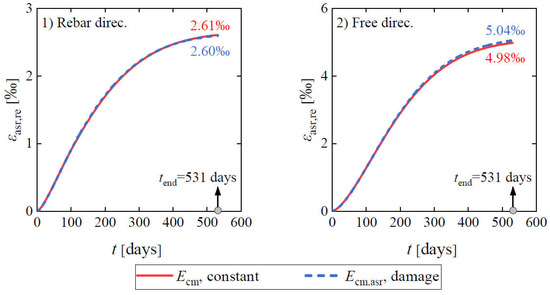
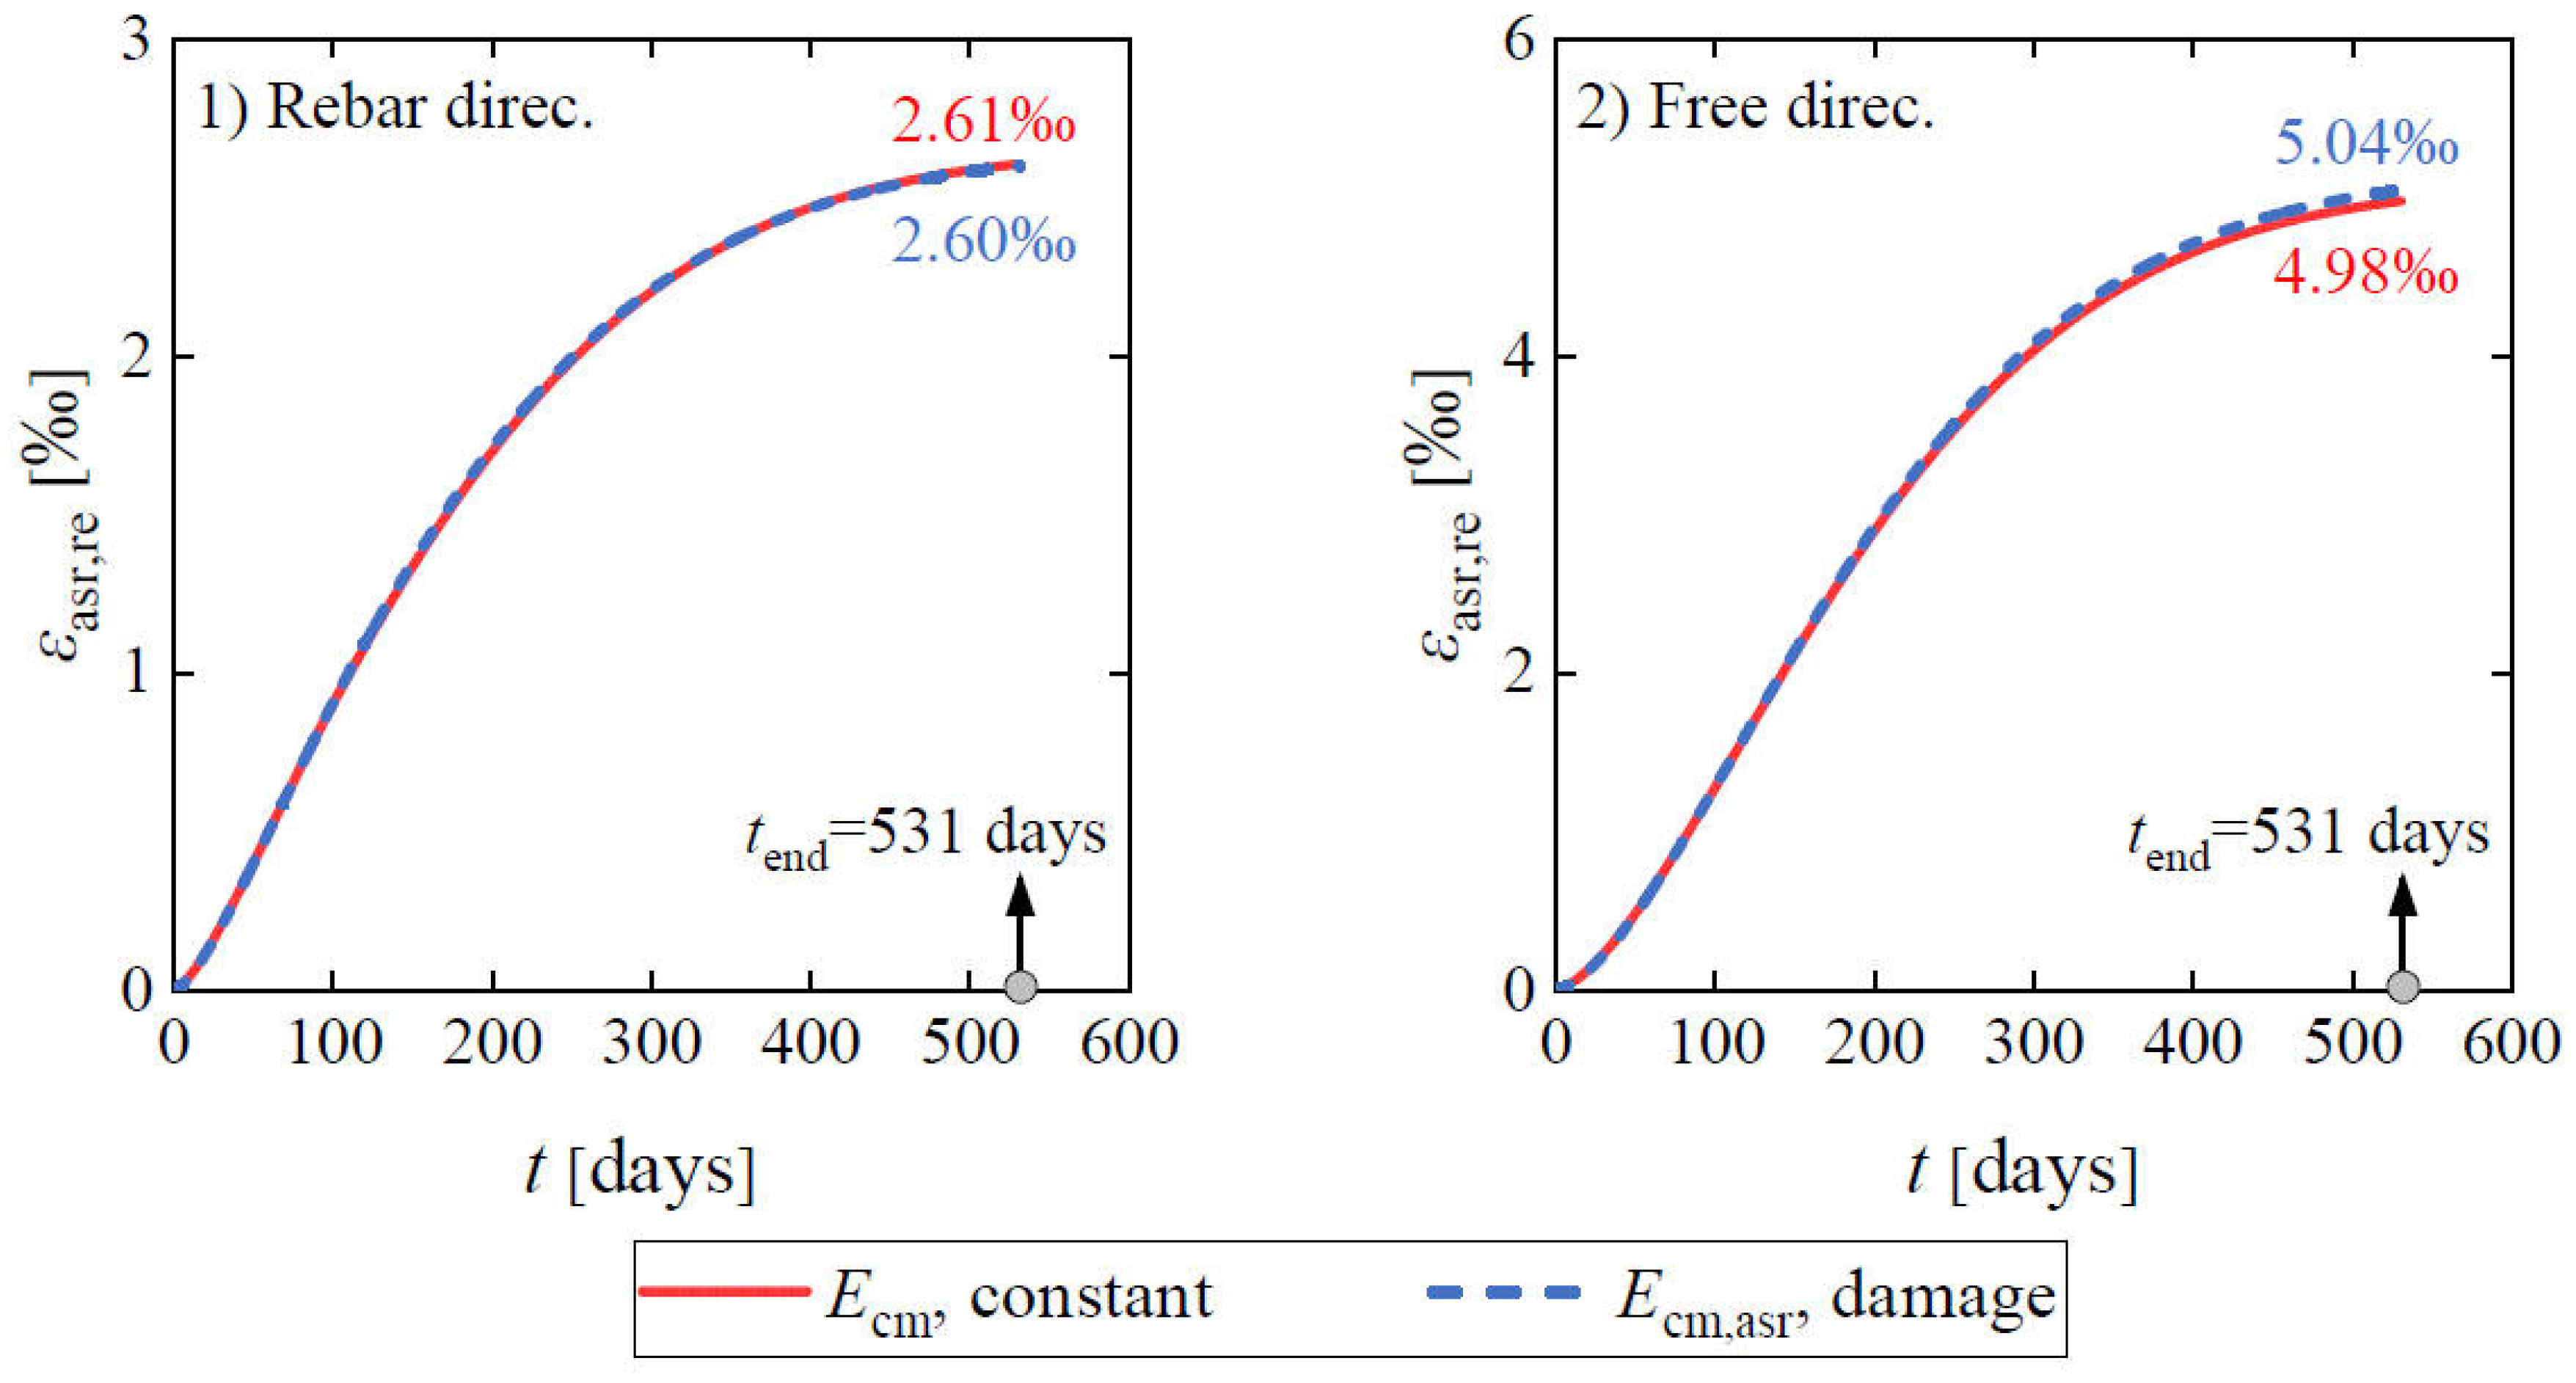
Figure 26 compares the influence of constant and damaged elastic modulus on the restrained expansion strain at the concrete surface for the 2020-RcPrism-4ds16 sample. At 531 days, the elastic modulus is reduced to 37% of the initial elastic modulus in the region with the largest ASR expansion according to Equation (7). As shown, the two curves approximately overlap, indicating the influence of the damaged elastic modulus is negligible. The explanation is the same as the corresponding comparison for the 2020-LoadCube sample.
Figure 26.
Influence of elastic modulus on restrained ASR expansion strain at the concrete surface for the 2020-RcPrism-4ds16 sample.
4.2.2. Creep
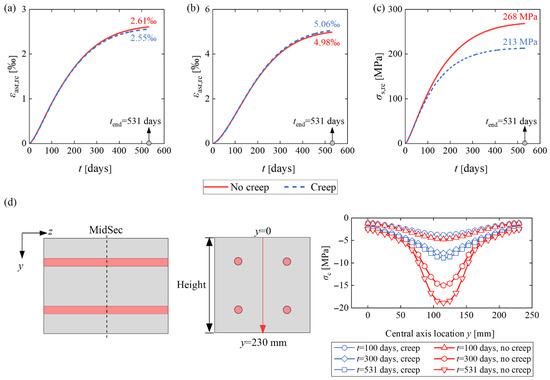
Figure 27 compares the influence of concrete creep on the expansion strains and stresses for the 2020-RcPrism-4ds16 sample. It is shown that the creep has a limited impact on the ASR expansion strain at the concrete surface in the two directions. Considering creep results in decreased expansion strain in the inner part of the member, it subsequently reduces the rebar strain and stress, which in turn lowers the stress in the surrounding concrete. It is noted that the adopted creep model in the FE analysis is for concrete without ASR damage; the creep behavior of ASR-affected concrete needs further experimental investigation and the corresponding model is to be developed [55].
Figure 27.
Influence of creep on stresses and strains of the 2020-RcPrism-4ds16 sample: (a) restrained ASR expansion strain at the concrete surface in the rebar direction; (b) restrained ASR expansion strain at the concrete surface in the free direction; (c) rebar stress at mid-section; and (d) concrete stress distribution along the central axis at mid-section.
4.2.3. Stress-Dependent Function
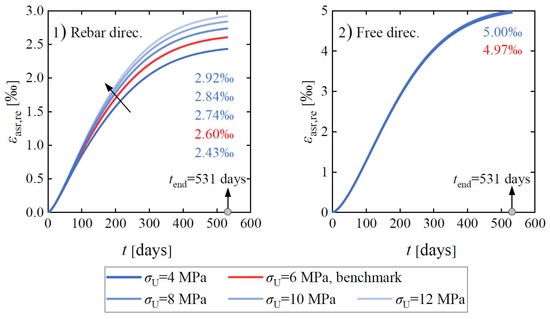
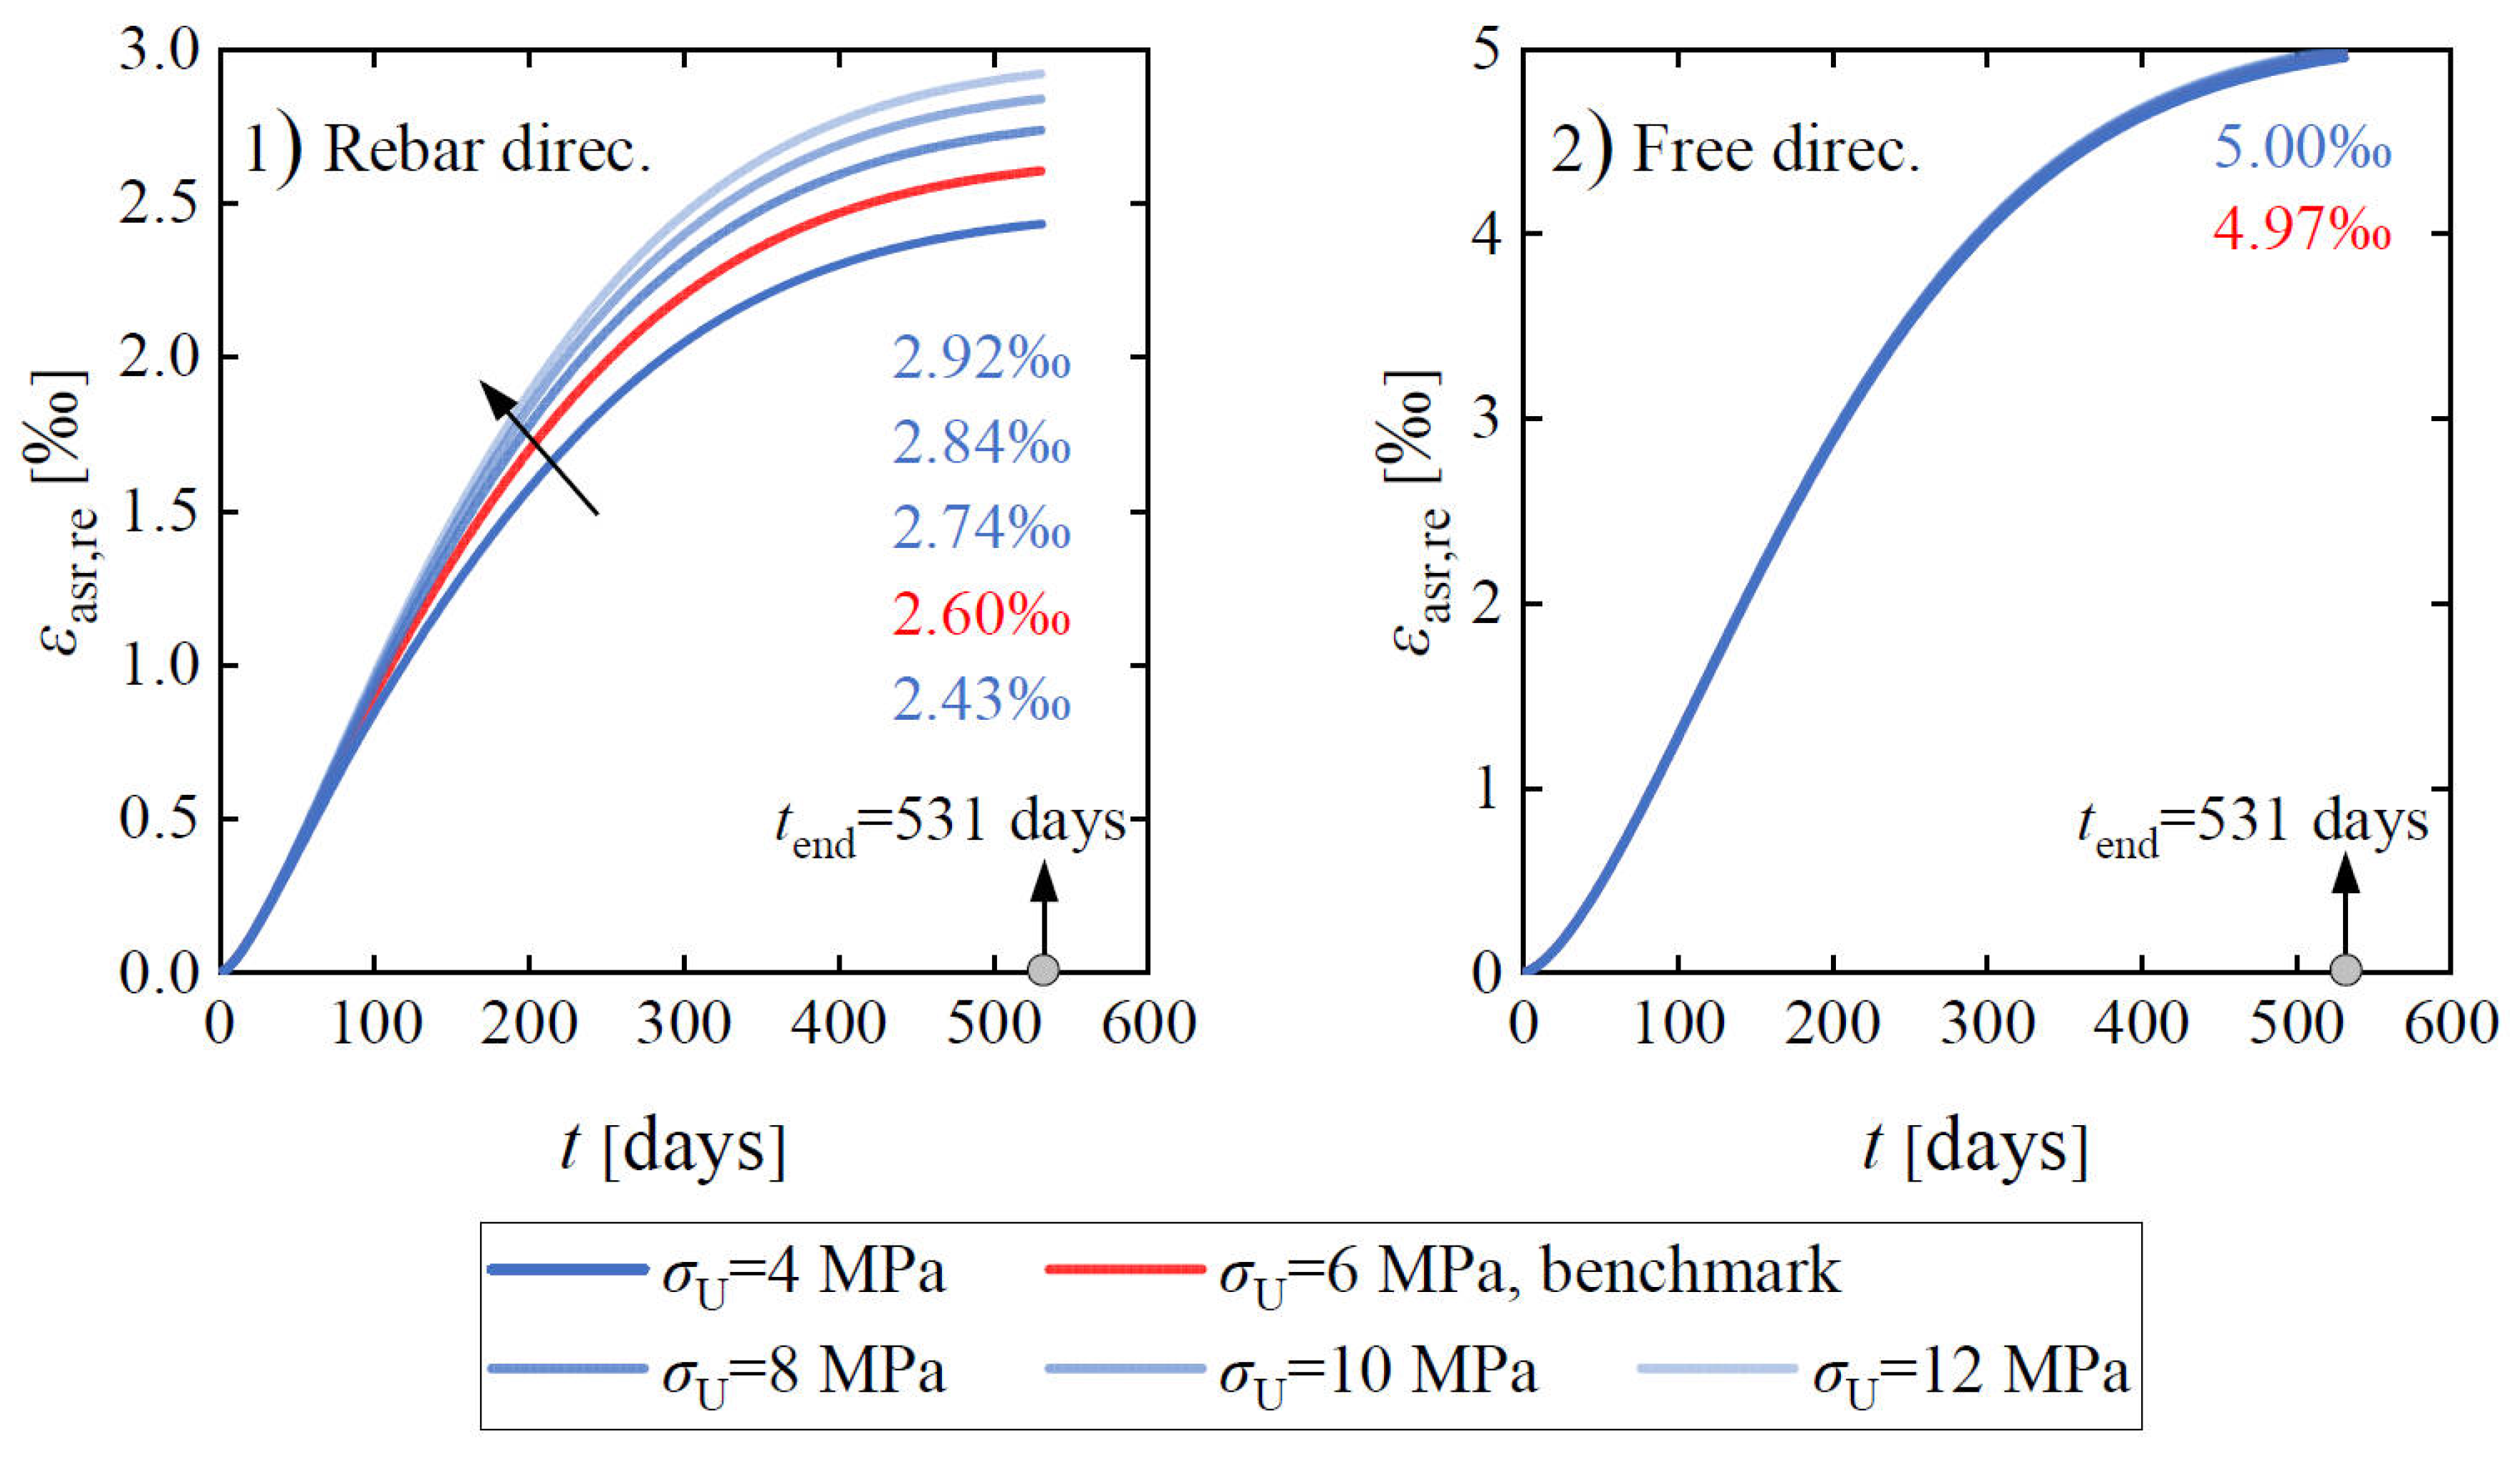
Figure 28 compares the influence of the upper compressive stress bound of the stress-dependent function on the restrained expansion strain at the concrete surface for the 2020-RcPrism-4ds16 sample. The increase in the upper compressive stress bound from 4 MPa to 12 MPa yields a declining restrained effect on expansion, leading to the expansion strain in the rebar direction growing from 2430 με to 2920 με. Because the expansion-induced compressive stress in the free direction is limited, the influence on the corresponding expansion strain is negligible.
Figure 28.
Influence of the upper compressive stress bound for stress-dependent function on restrained ASR expansion strain at the concrete surface for the 2020-RcPrism-4ds16 sample.
4.2.4. Steel Plate Thickness
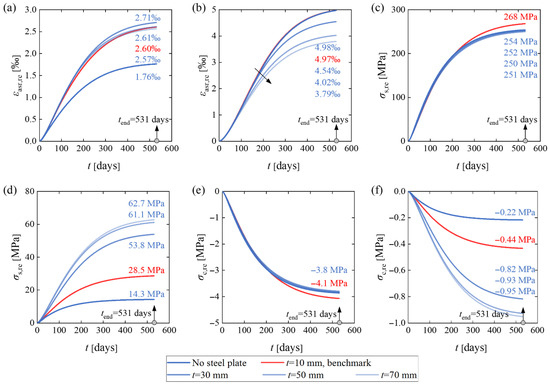
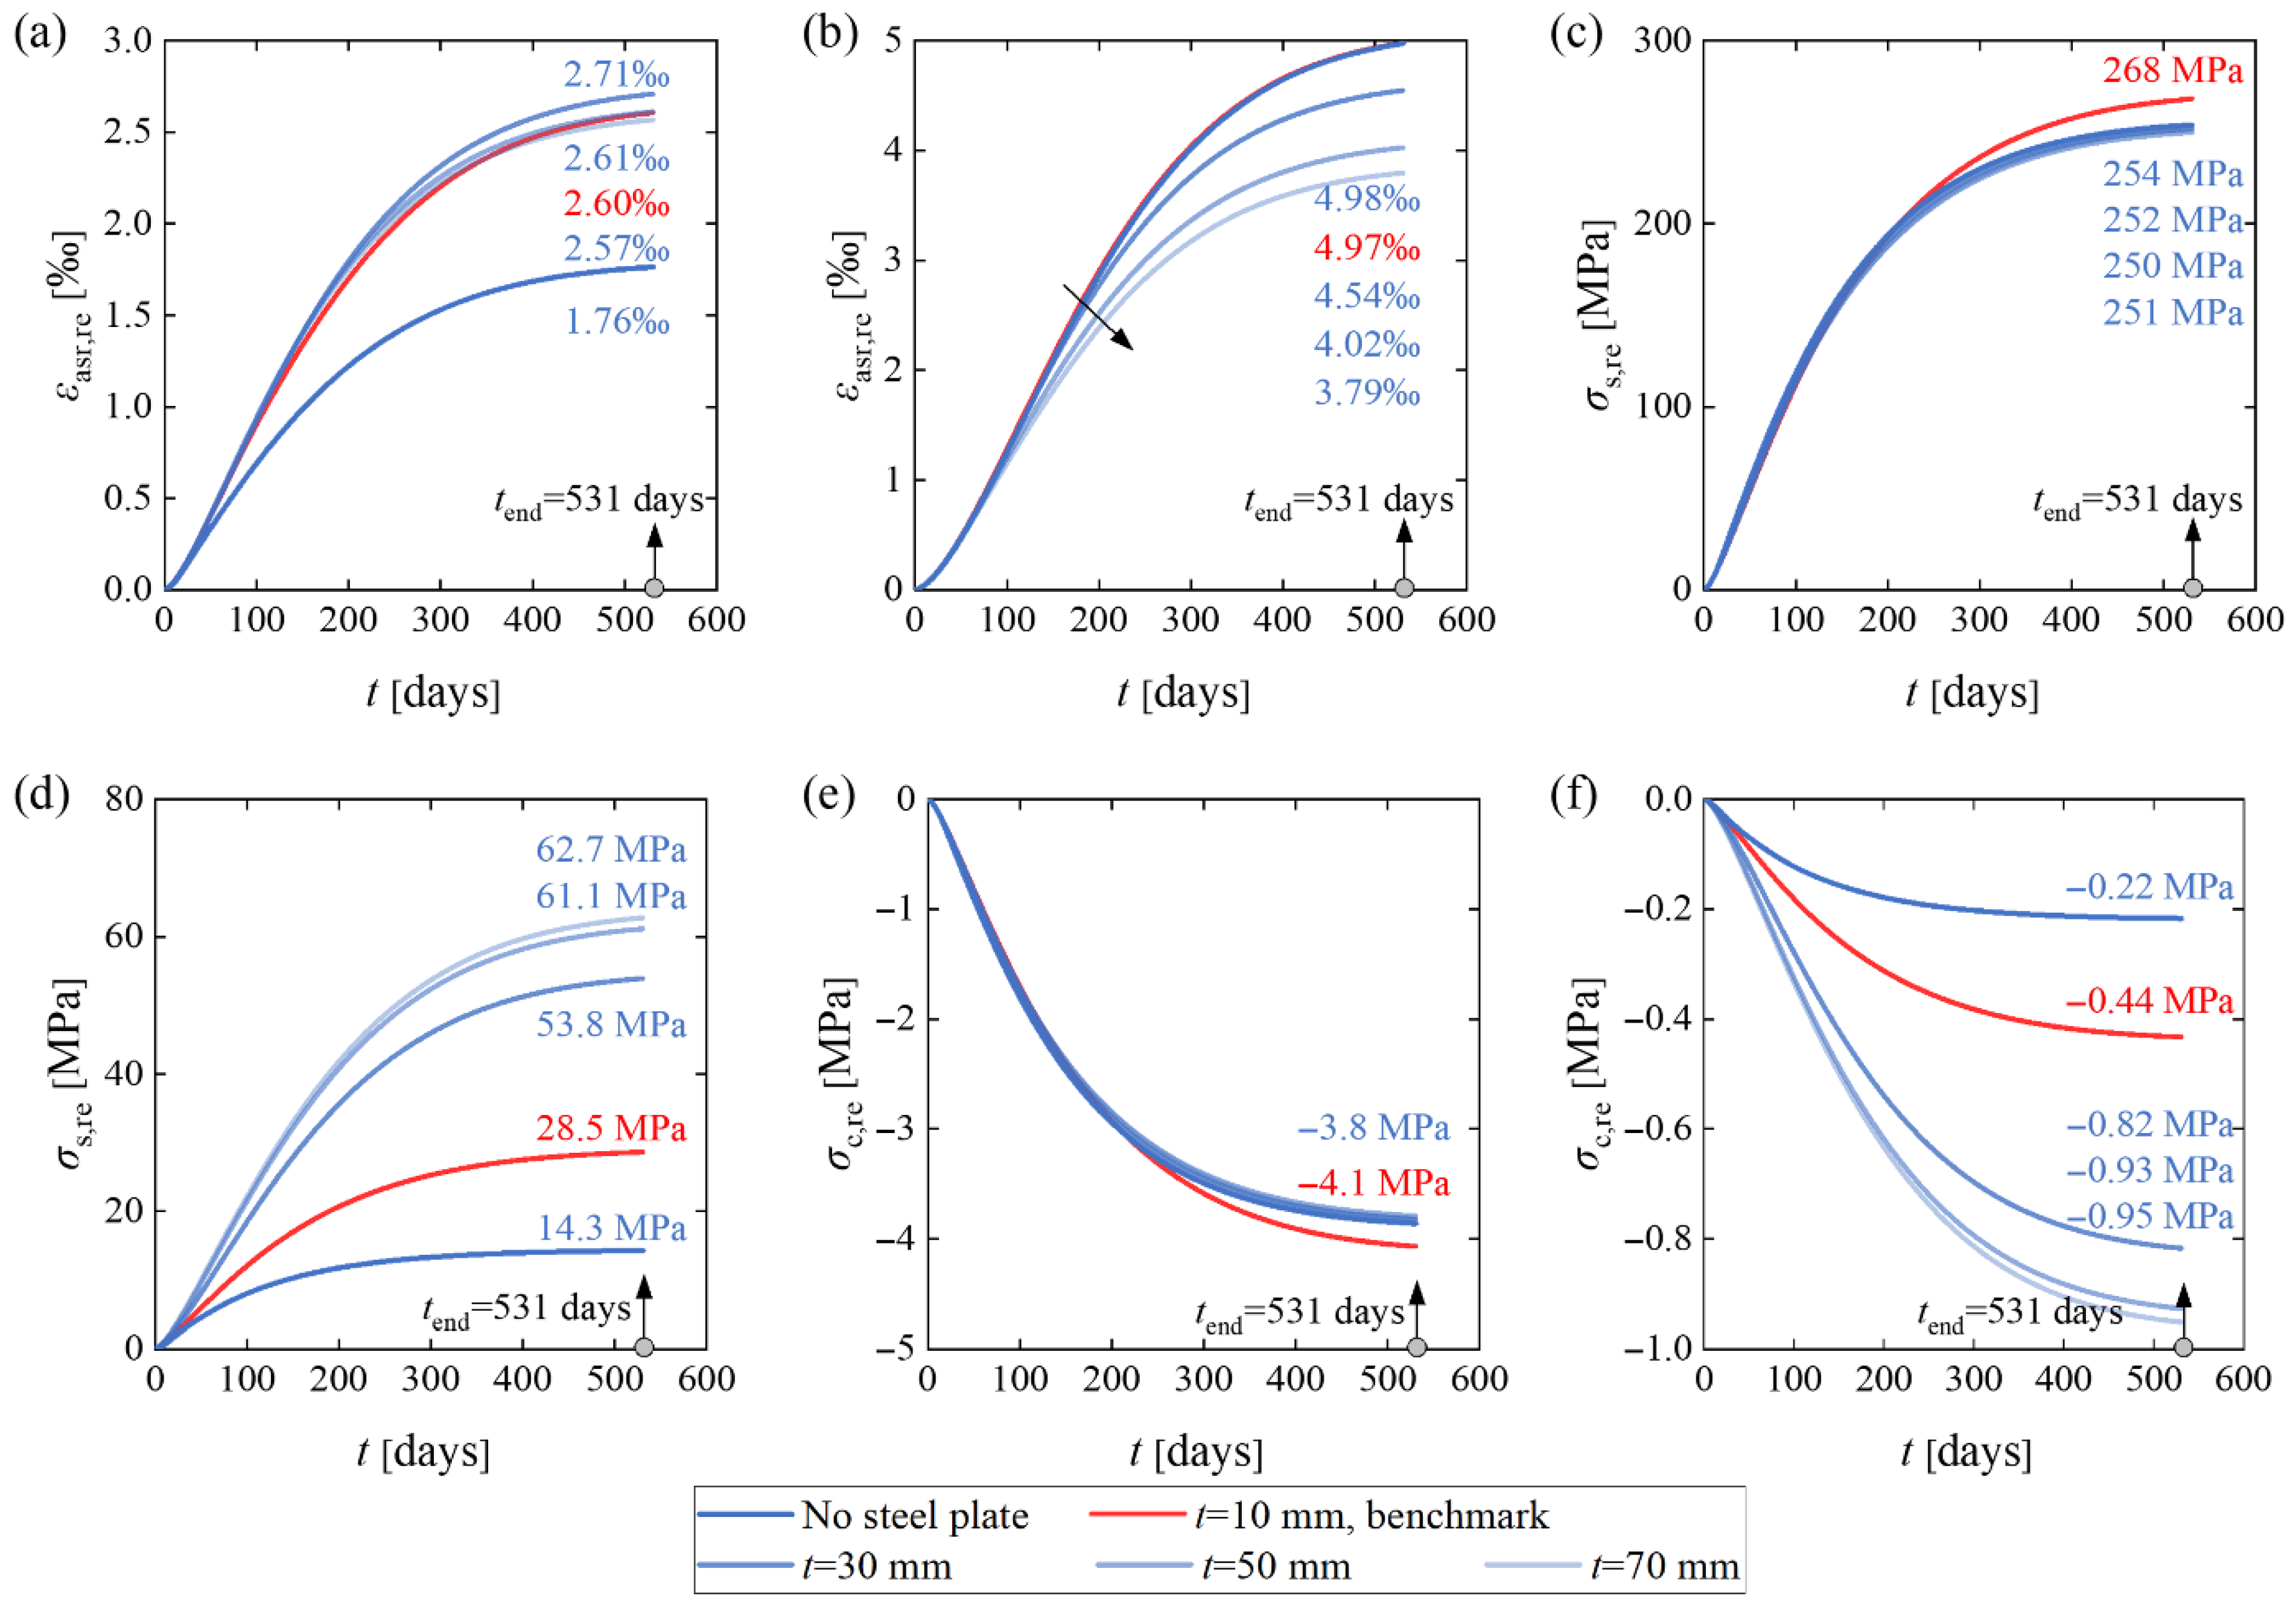
Figure 29 compares the influence of the steel plate thickness on the stresses and strains for the 2020-RcPrism-4ds16 sample. As shown in Figure 29a, increasing the steel plate thickness from 10 mm to 70 mm has a slight impact on the restrained ASR strain in the rebar direction, while the FE model without steel plates yields the smallest restrained ASR expansion strain. As for the restrained ASR expansion strain in the free direction, increasing steel plate thickness results in a considerable decline in response, as illustrated in Figure 29b. Two reasons can explain this phenomenon. The presence of steel plates tied to the concrete prism restrains the lateral expansion (free direction, x-axis, and y-axis), leading to the extension effect for the deformation in the rebar direction and increased restrained ASR expansion strain. Because the steel plates have a more significant restraining effect on the lateral deformation compared to the longitudinal deformation, the increasing steel plate thickness only yields a limited effect on the restrained ASR expansion strain in the rebar direction.
Figure 29.
Influence of steel plate thickness on stresses and strains of the 2020-RcPrism-4ds16 sample: (a) restrained ASR expansion strain at the concrete surface in the rebar direction; (b) restrained ASR expansion strain at the concrete surface in free direction; (c) rebar stress at mid-section; (d) rebar stress at end-section; (e) average concrete compressive stress at mid-section; and (f) average concrete compressive stress at end-section.
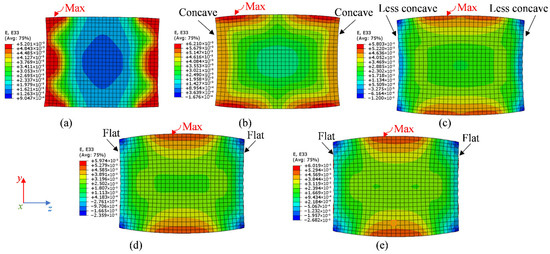
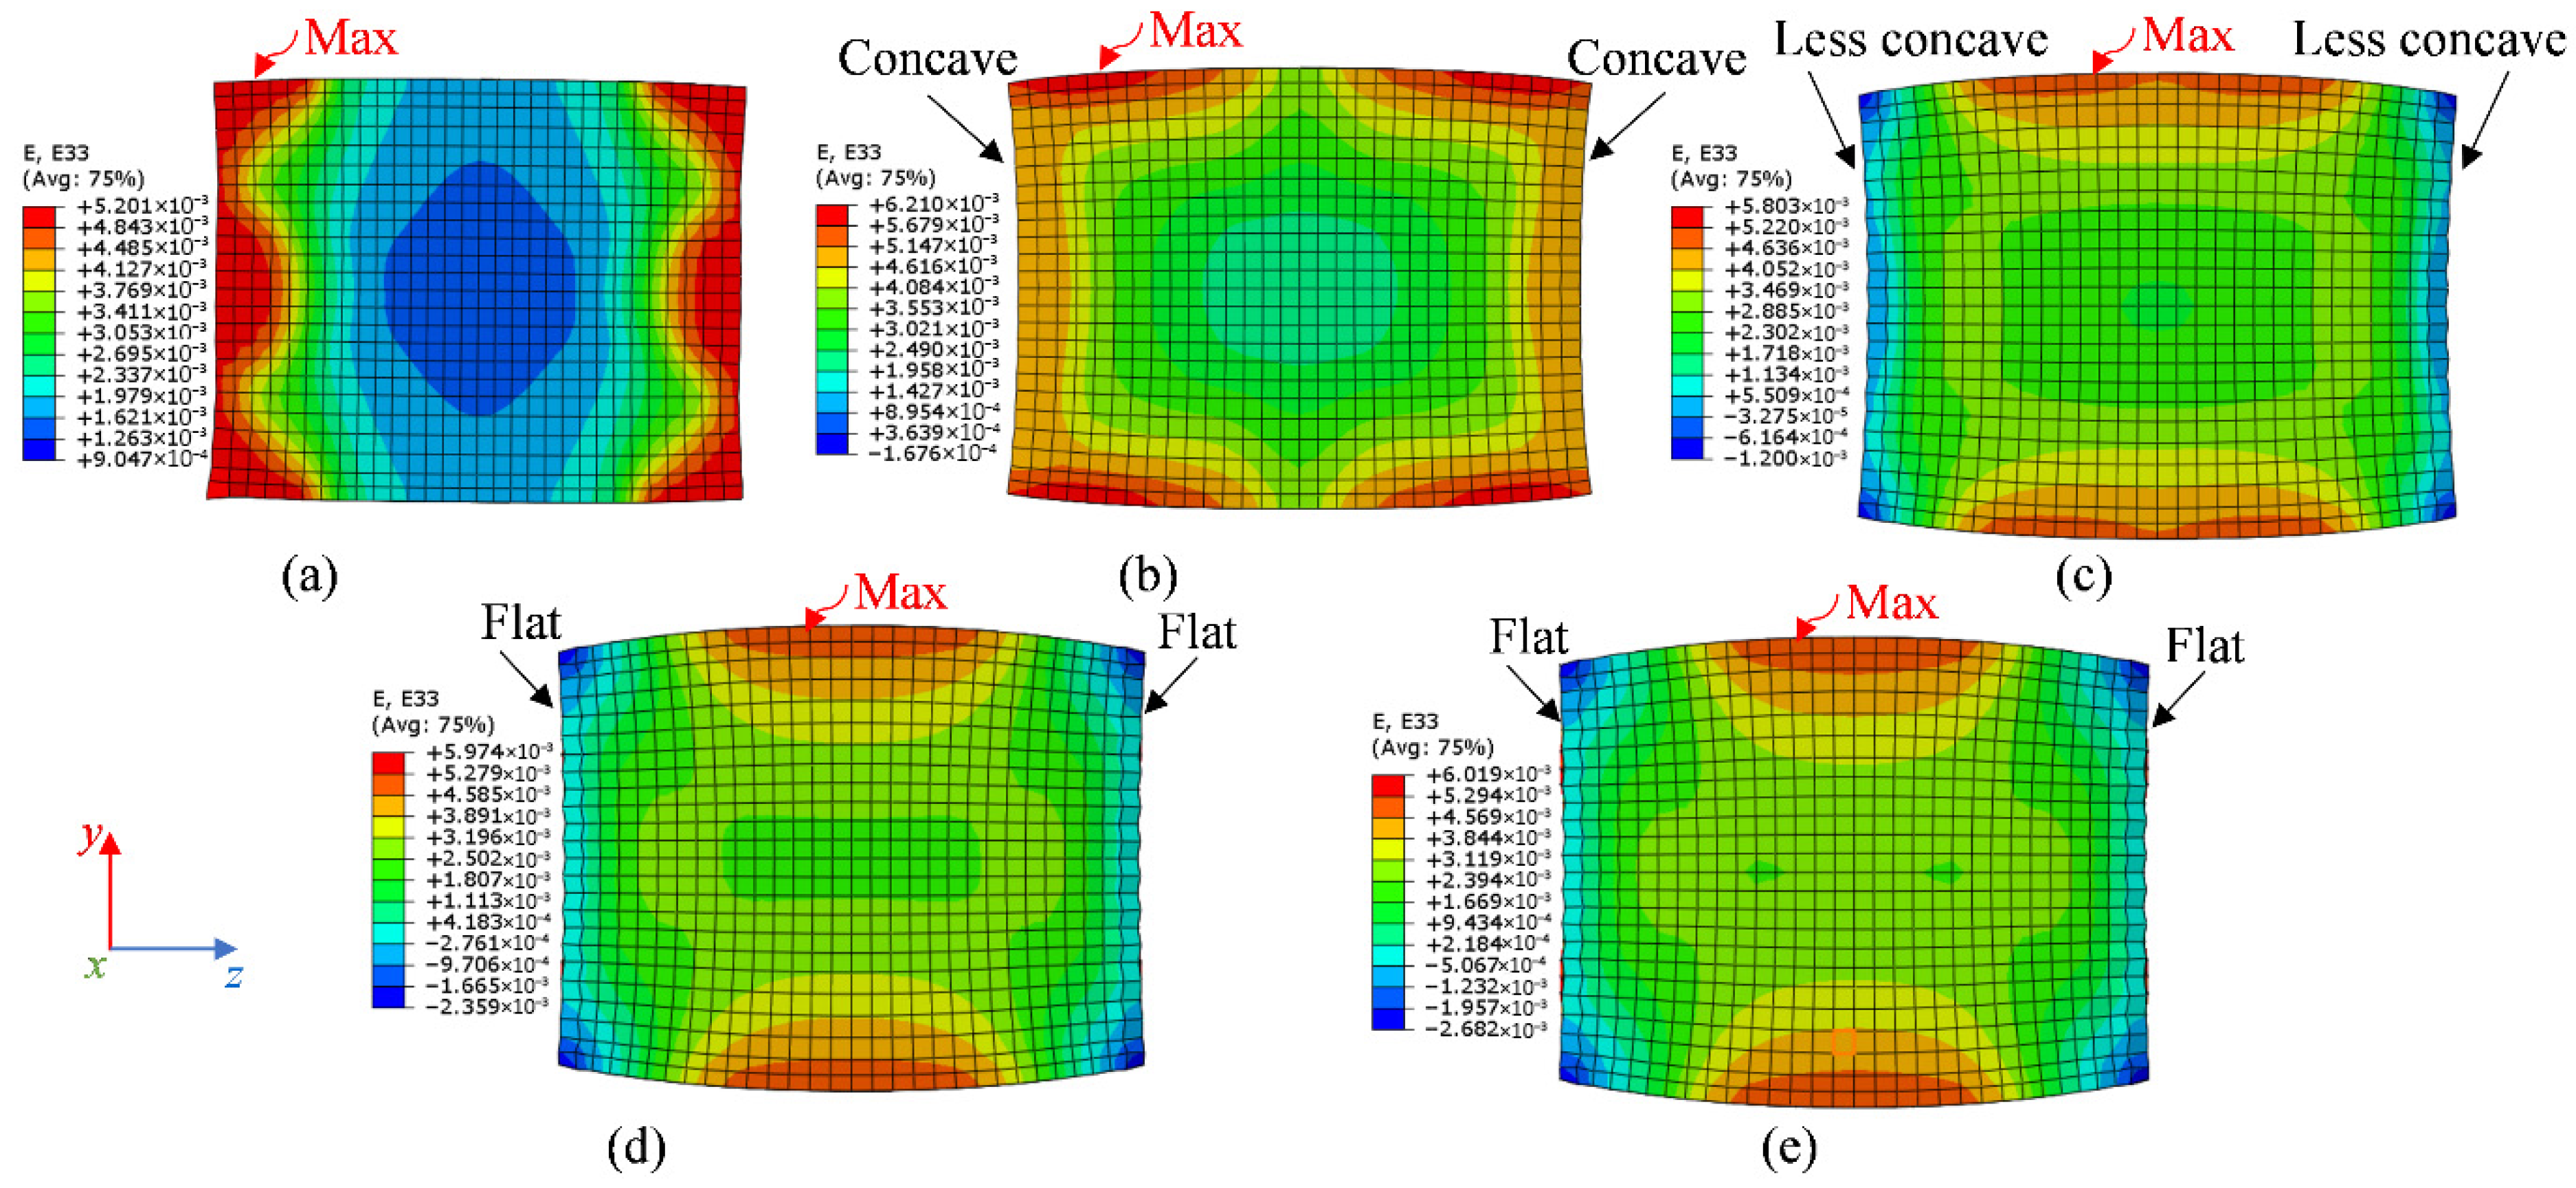
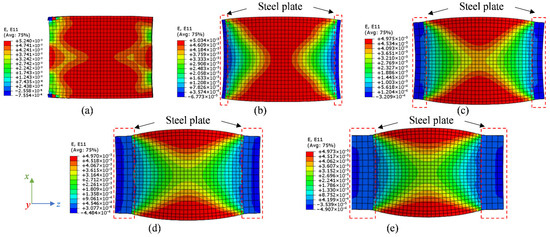
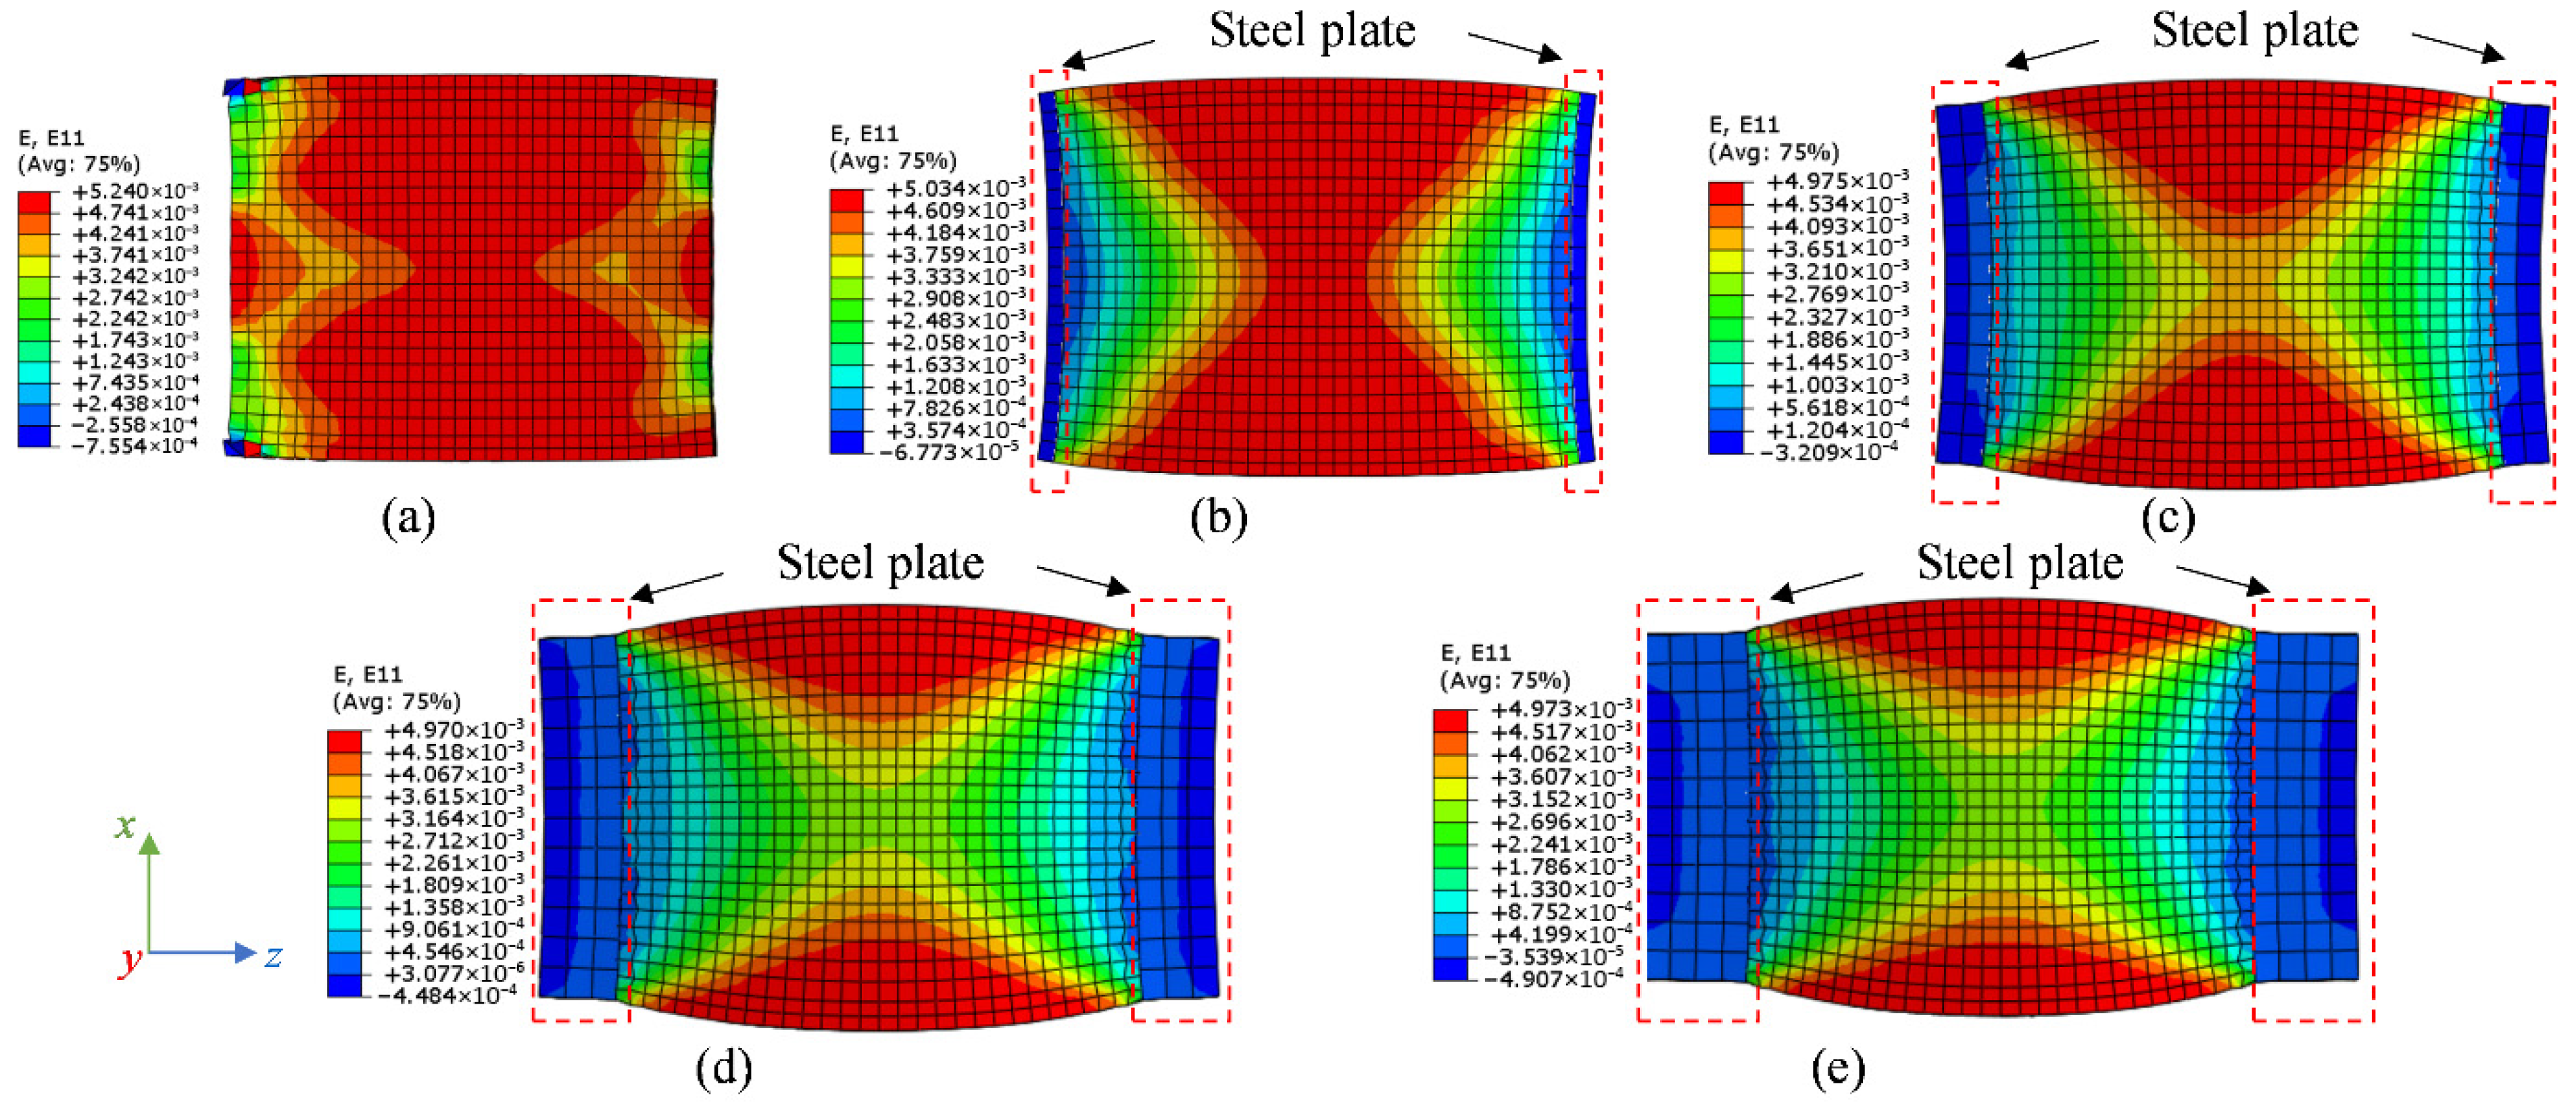
As shown in Figure 30, increasing the steel plate stiffness transfers the end-section deformation of the concrete prism from concave to flat, and the location of maximum expansion strain changes from end-section to mid-section. Figure 31 presents the influence of the steel plate thickness on deformation and restrained ASR expansion strain in the free direction (x-axis), in which the red zone denotes the maximum strain. The FE model without steel plates provides a uniform ASR expansion strain distribution. As the steel plate thickness increases from 10 mm to 70 mm, the maximum strain zone becomes smaller and smaller.
Figure 30.
Influence of steel plate thickness t on the deformation and restrained ASR expansion strain in the rebar direction: (a) no steel plate; (b) t = 10 mm (benchmark); (c) t = 30 mm; (d) t = 50 mm; and (e) t = 70 mm.
Figure 31.
Influence of steel plate thickness t on the deformation and restrained ASR expansion strain in free direction: (a) no steel plate; (b) t = 10 mm (benchmark); (c) t = 30 mm; (d) t = 50 mm; and (e) t = 70 mm.
Furthermore, the steel plate thickness has a significant effect on the strain and stress at the end-section, but only a slight influence in the mid-section, as demonstrated in Figure 29c–f. From without steel plates to the presence of steel plates and to increasing the thickness to 50 mm, the rebar stress and concrete compressive stress at the end-section are enhanced by approximately 3.3 times. This is due to the steel plate contributing to the improved stiffness of the rebars at the end-section compared with those at the mid-section. In addition, the enhancing effect from steel plate thickness starts to decline as the thickness increases from 50 mm to 70 mm.
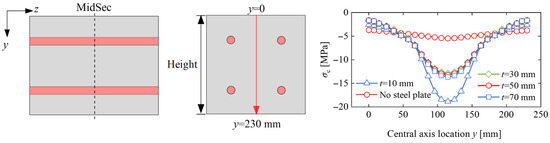
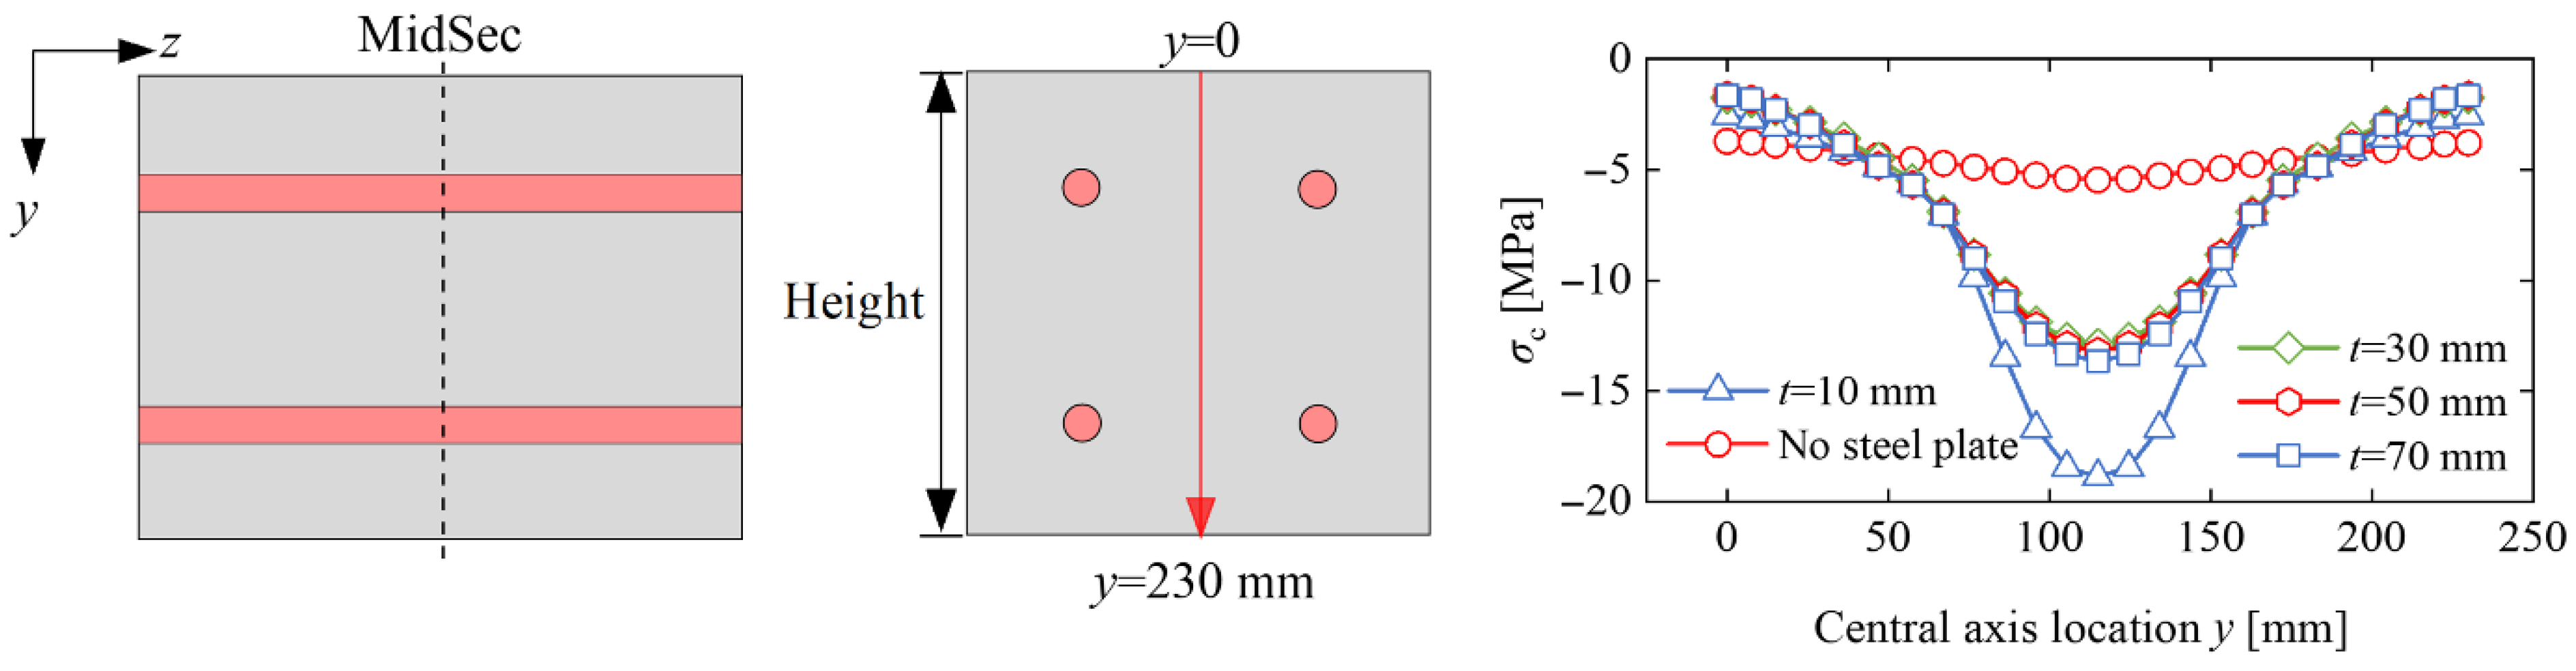
Figure 32 compares the influence of steel plate thickness on the 531-day concrete stress distribution along the central axis at mid-section. The stress distributions of all the cases present a similar trend, increasing from the end to the center. The FE model without steel plates has the minimum concrete stress (at the center) of −5.5 MPa, while that with a 10 mm thick steel plate yields the maximum concrete stress (at the center) of −18.9 MPa. As the steel plate changes from 30 mm to 70 mm, its impact on the concrete stress is not significant. Even though the steel plate thickness leads to a pronounced response on the concrete stress distribution along the central axis at mid-section, the average concrete stress of this whole cross-section for all cases is kept approximately at −4 MPa, as presented in Figure 29e.
Figure 32.
Influence of steel plate thickness t on the concrete stress distribution at 531 days along the central axis at mid-section.
4.2.5. Reinforcement Ratio
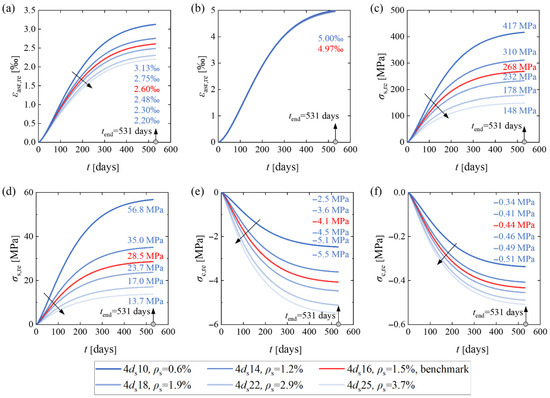
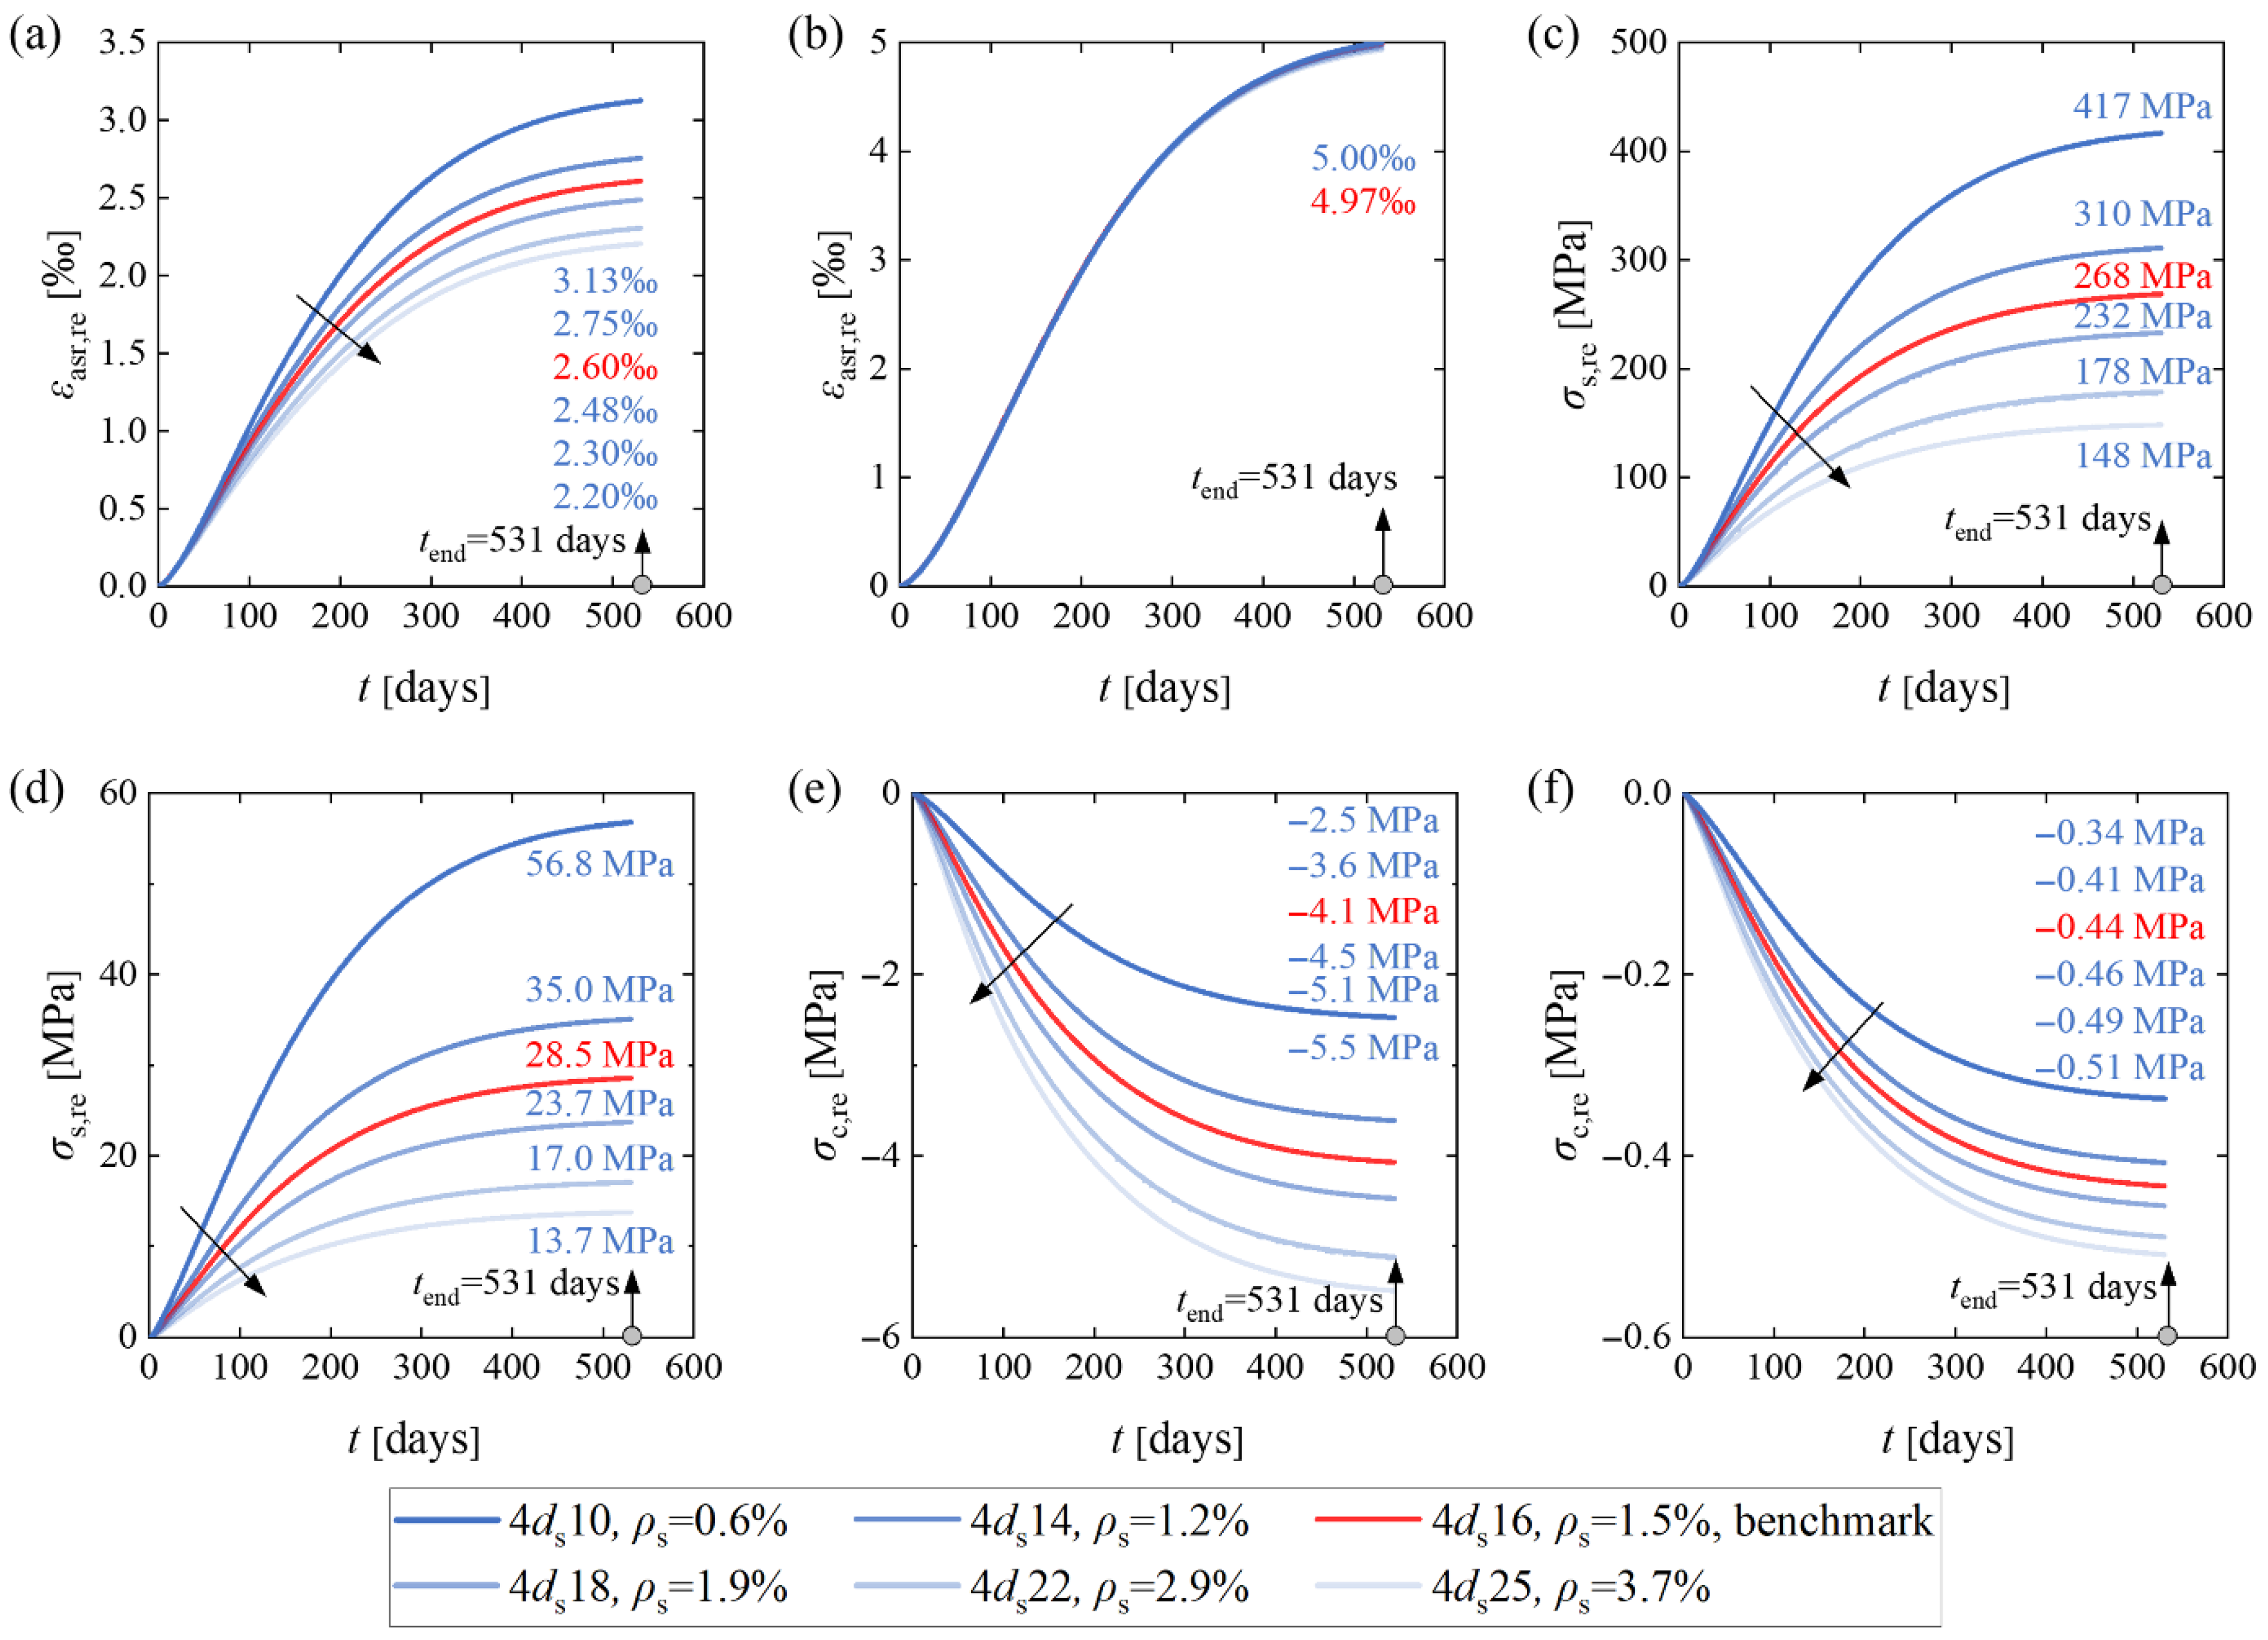
Figure 33 compares the influence of reinforcement ratio on the RcPrism stresses and strains. Increasing reinforcement ratio leads to an enhanced relative stiffness of steel rebars to the concrete prism, thus increasing the restrained effect of the ASR expansion. As shown in Figure 33a,b, as the reinforcement ratio increases from 0.6% to 3.7%, the restrained ASR expansion in the rebar direction declines from 3130 με to 2200 με, while in the free direction, the change is negligible. The decreased ASR expansion in the rebar direction results in lower rebar strains and stresses, while the concrete compressive stresses are larger, as illustrated in Figure 33c–f. It can also be concluded that ASR-affected structural members with a lower reinforcement ratio are more susceptible to rebar yielding than members with a higher reinforcement ratio.
Figure 33.
Influence of reinforcement ratio on stresses and strains of the RcPrism sample: (a) restrained ASR expansion strain at the concrete surface in rebar direction; (b) restrained ASR expansion strain at the concrete surface in free direction; (c) rebar stress at mid-section; (d) rebar stress at end-section; (e) average concrete restrained compressive stress at mid-section; and (f) average concrete restrained compressive stress at end-section.
5. Conclusions
In this work, experimental results on free and restrained ASR expansion have been validated by numerical simulations conducted by ABAQUS. On the basis of the validated FE models, the influence of elastic modulus, creep, stress-dependent function, steel plate thickness, and reinforcement ratio on the ASR expansion was numerically analyzed. Based on the investigations, the main conclusions are:
- (1)
- A time-dependent model for free ASR expansion was developed based on experimental data, which effectively characterizes the three distinct stages of ASR evolution: incubation, rapid development, and deceleration.
- (2)
- A user subroutine for restrained ASR expansion incorporating stress-dependent characteristics was implemented on the ABAQUS platform. Finite element models utilizing this subroutine successfully simulated the expansion history of concrete specimens under external loading or internal reinforcement restraint, with results validated against experimental measurements.
- (3)
- The finite element analyses demonstrate that the ASR expansion varies between surface and interior zones of the investigated concrete specimens. The ASR expansion strain diminishes toward the interior due to the restraint from rebars. Consequently, assuming that the surface ASR expansion strain equals the rebar strain results in significant overestimation of the actual strain values for the rebar.
- (4)
- For the tested RcPrism samples with two 10/15 mm thick end steel plates, the rebar strain over a 200 mm measurement length varies from 40% to 60% of the concrete surface strain.
- (5)
- The large variations in stress and ASR expansion strain over the test specimens may explain the large variation in the ratio between restrained and free expansion reported in the literature.
- (6)
- The stress variation over the cross-section is considerably reduced when creep is considered, while the concrete strain at the surface is slightly influenced by creep.
- (7)
- The stress-dependent function proposed by Charlwood et al. and an upper stress bound of 6 MPa work well for all the investigated test specimens.
Author Contributions
Conceptualization, Z.S.; methodology, Z.S. and J.X.; software, Z.S.; validation, Z.S. and G.J.; formal analysis, Z.S.; investigation, Z.S. and K.S.; resources, T.K.; data curation, Z.S. and K.S.; writing—original draft preparation, Z.S.; writing—review and editing, M.A.N.H. and T.K.; visualization, Z.S.; supervision, M.A.N.H. and T.K.; project administration, T.K.; funding acquisition, T.K. All authors have read and agreed to the published version of the manuscript.
Funding
This research was funded by the Research Council of Norway grant number [326764].
Data Availability Statement
Data will be made available on request.
Acknowledgments
The authors acknowledge the funded MESLA (Management and Extension of Service Life of infrastructures affected by Alkali-silica reactions) project. The authors also acknowledge the project partners: the Norwegian Public Roads Administration (NPRA), BaneNOR (railway bridge owner), Trøndelag County, Norconsult (consultant), SINTEF Community and SINTEF Narvik, and international partners, the Universities Laval and Ottawa in Canada and Gustave Eiffel in France.
Conflicts of Interest
The authors declare no conflict of interest.
Appendix A
Figure A1.
Stresses and strains of the 2020-RcPrism-4ds20 sample: (a) restrained ASR strain distribution and rebar strain distribution in the longitudinal direction at 531 days; (b) restrained ASR strain history and rebar strain history; (c) rebar stress distribution at 531 days; (d) concrete normal stress distribution in the longitudinal direction at 531 days; (e) rebar stress history; and (f) concrete stress history.
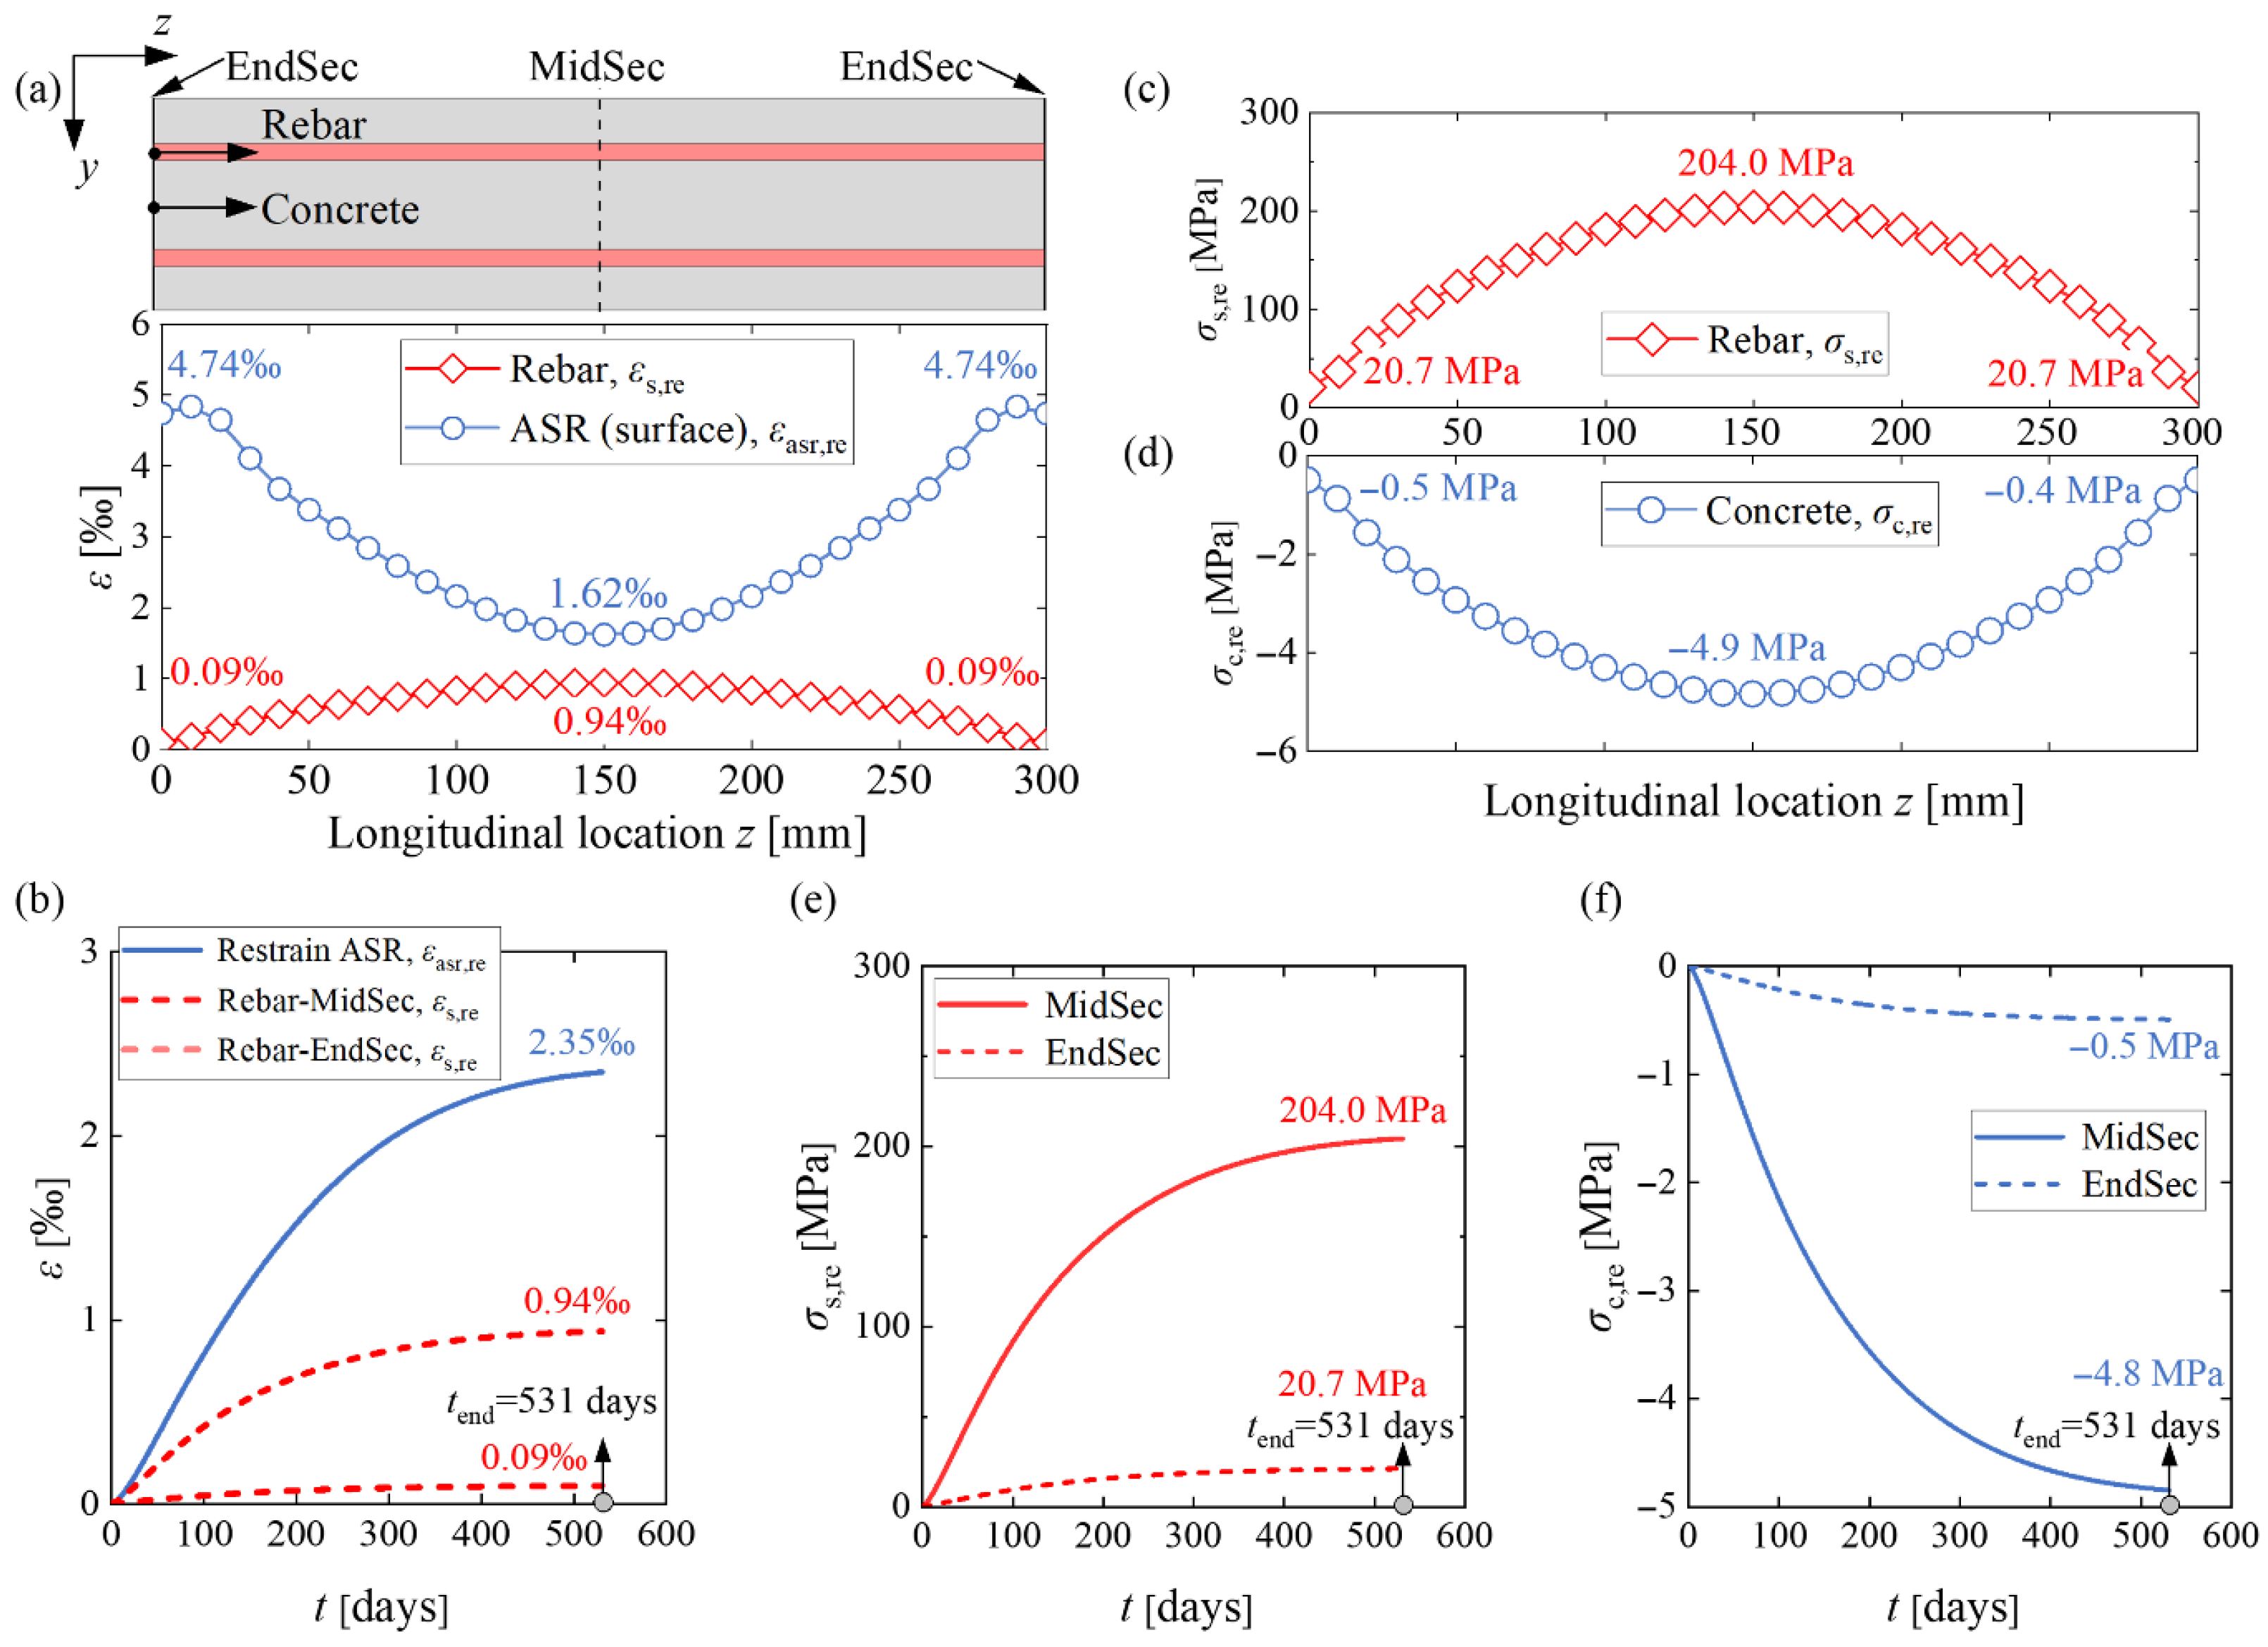
Figure A2.
Stresses and strains of the 2019-RcPrism-4ds10 sample: (a) restrained ASR strain distribution and rebar strain distribution in the longitudinal direction at 1100 days; (b) restrained ASR strain history and rebar strain history; (c) rebar stress distribution at 1100 days; (d) concrete normal stress distribution in the longitudinal direction at 1100 days; (e) rebar stress history; and (f) concrete stress history.
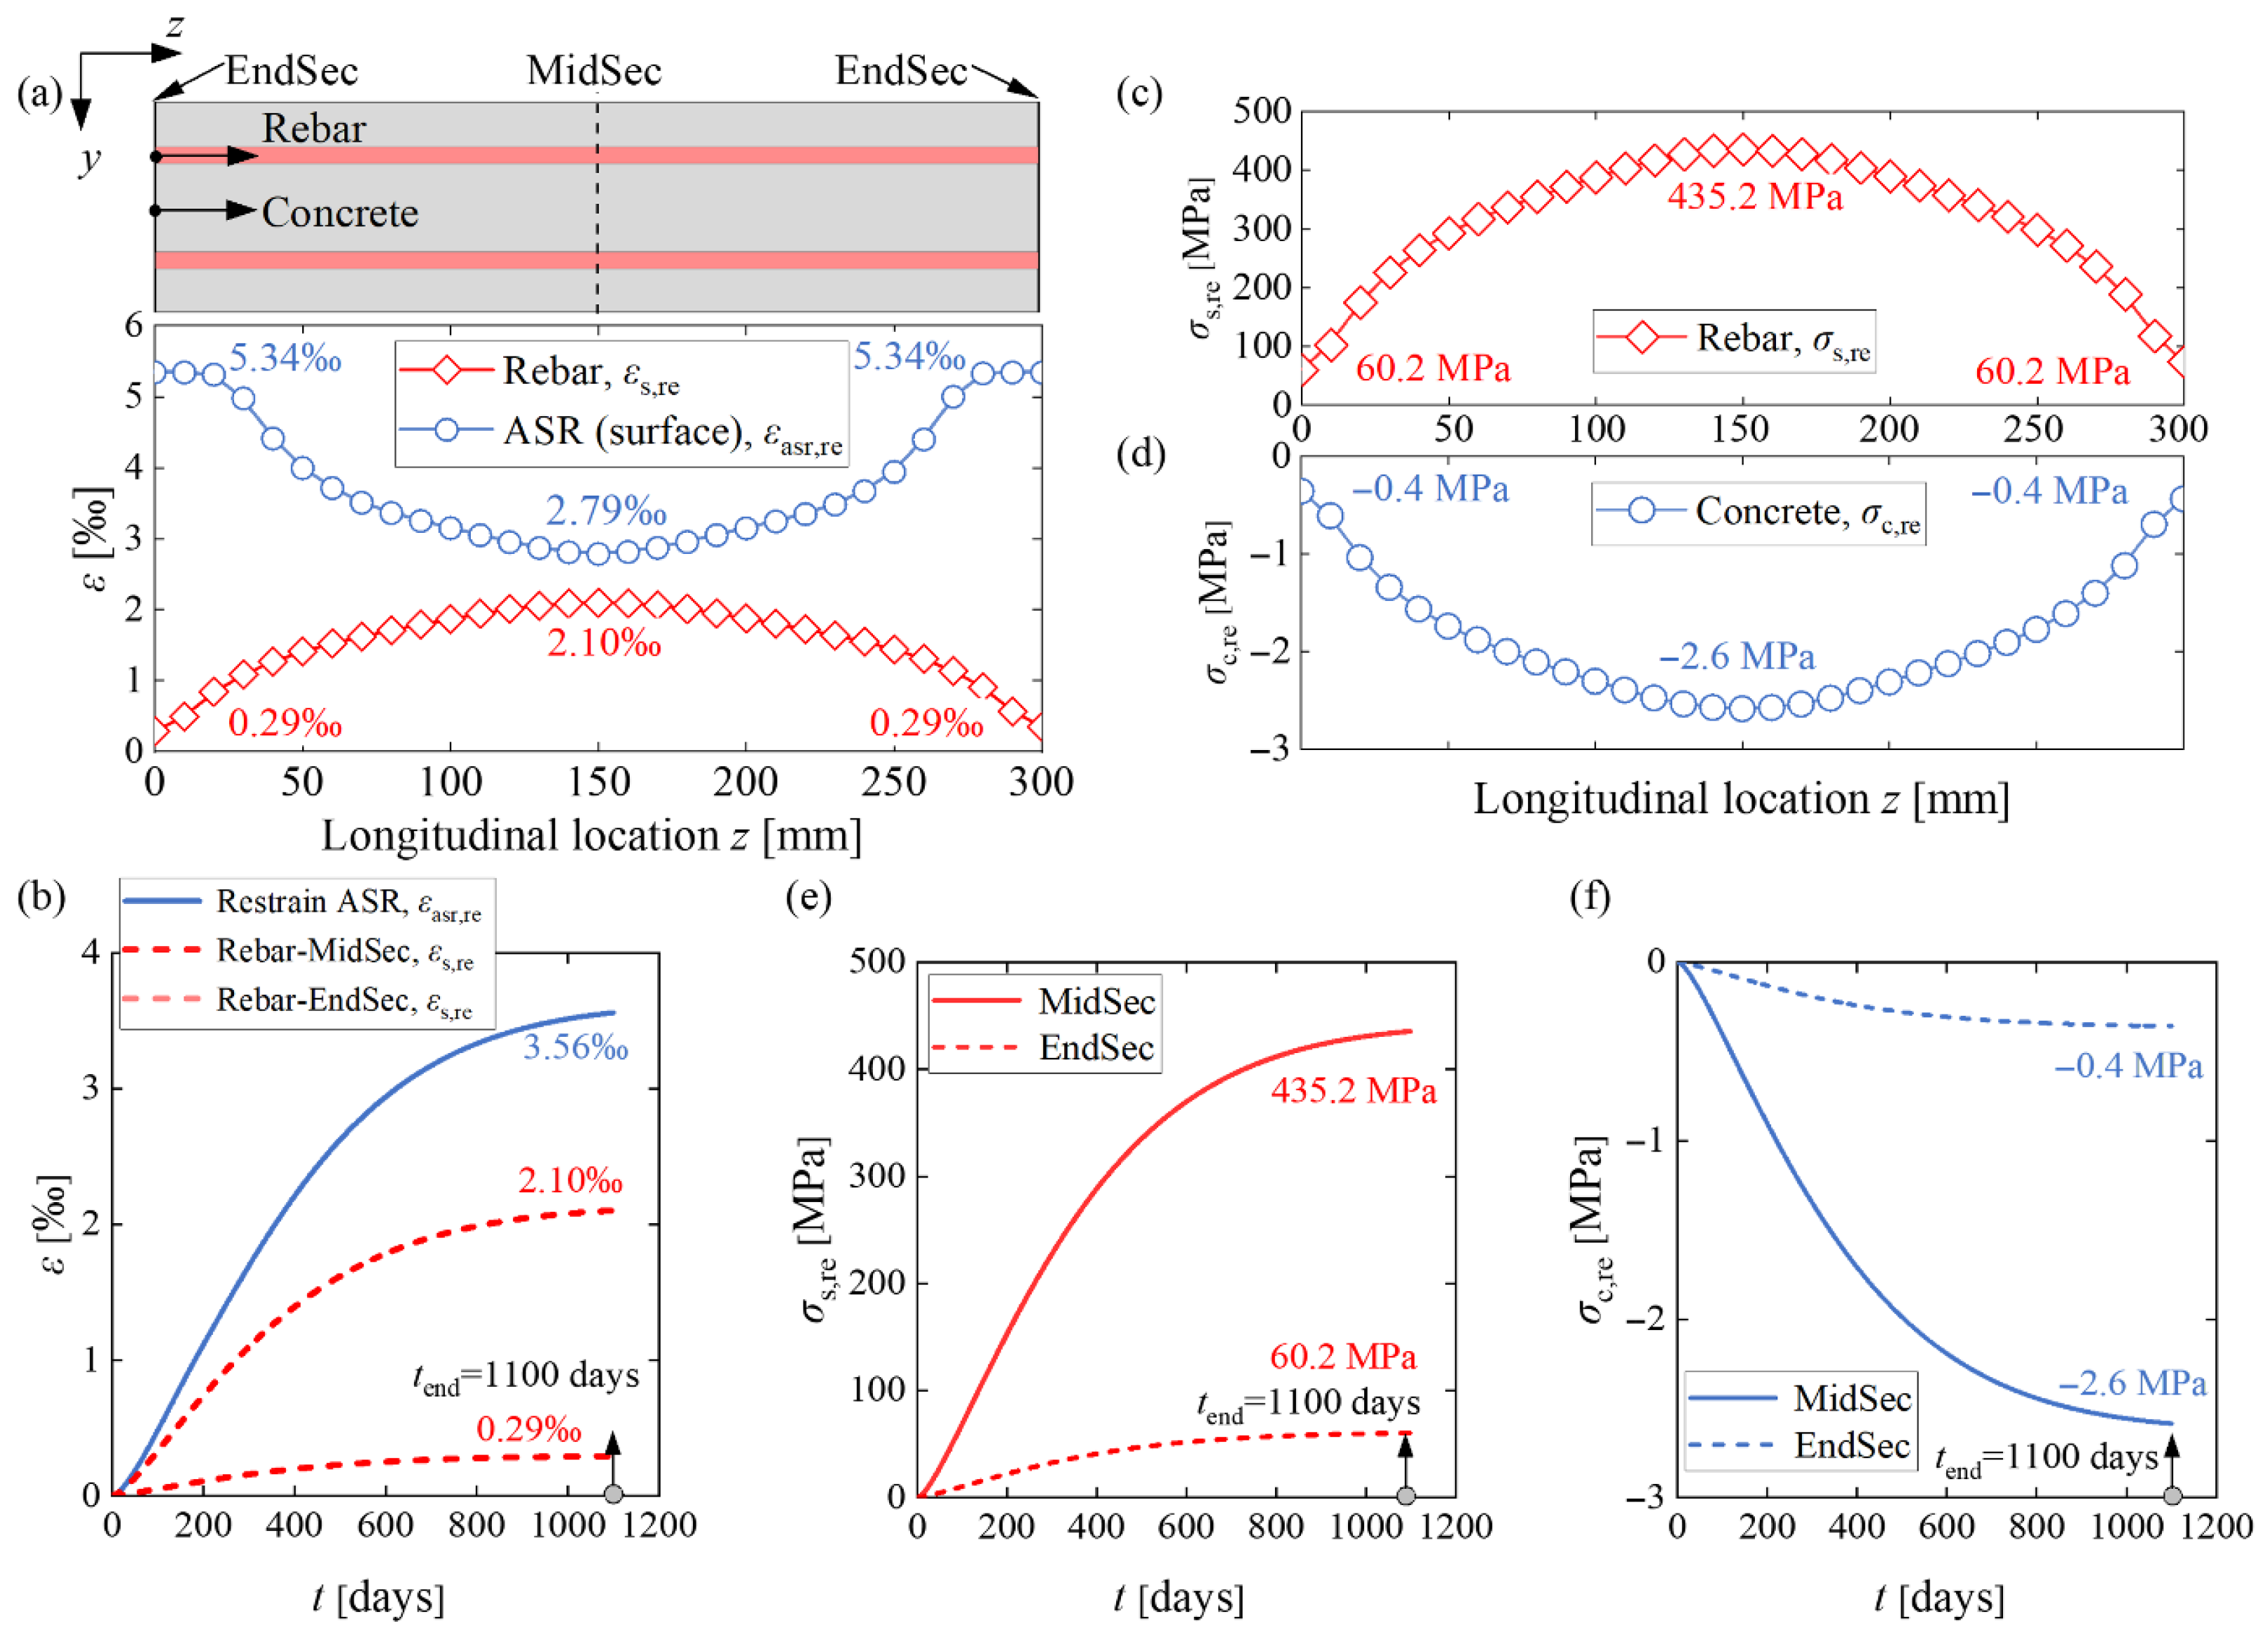
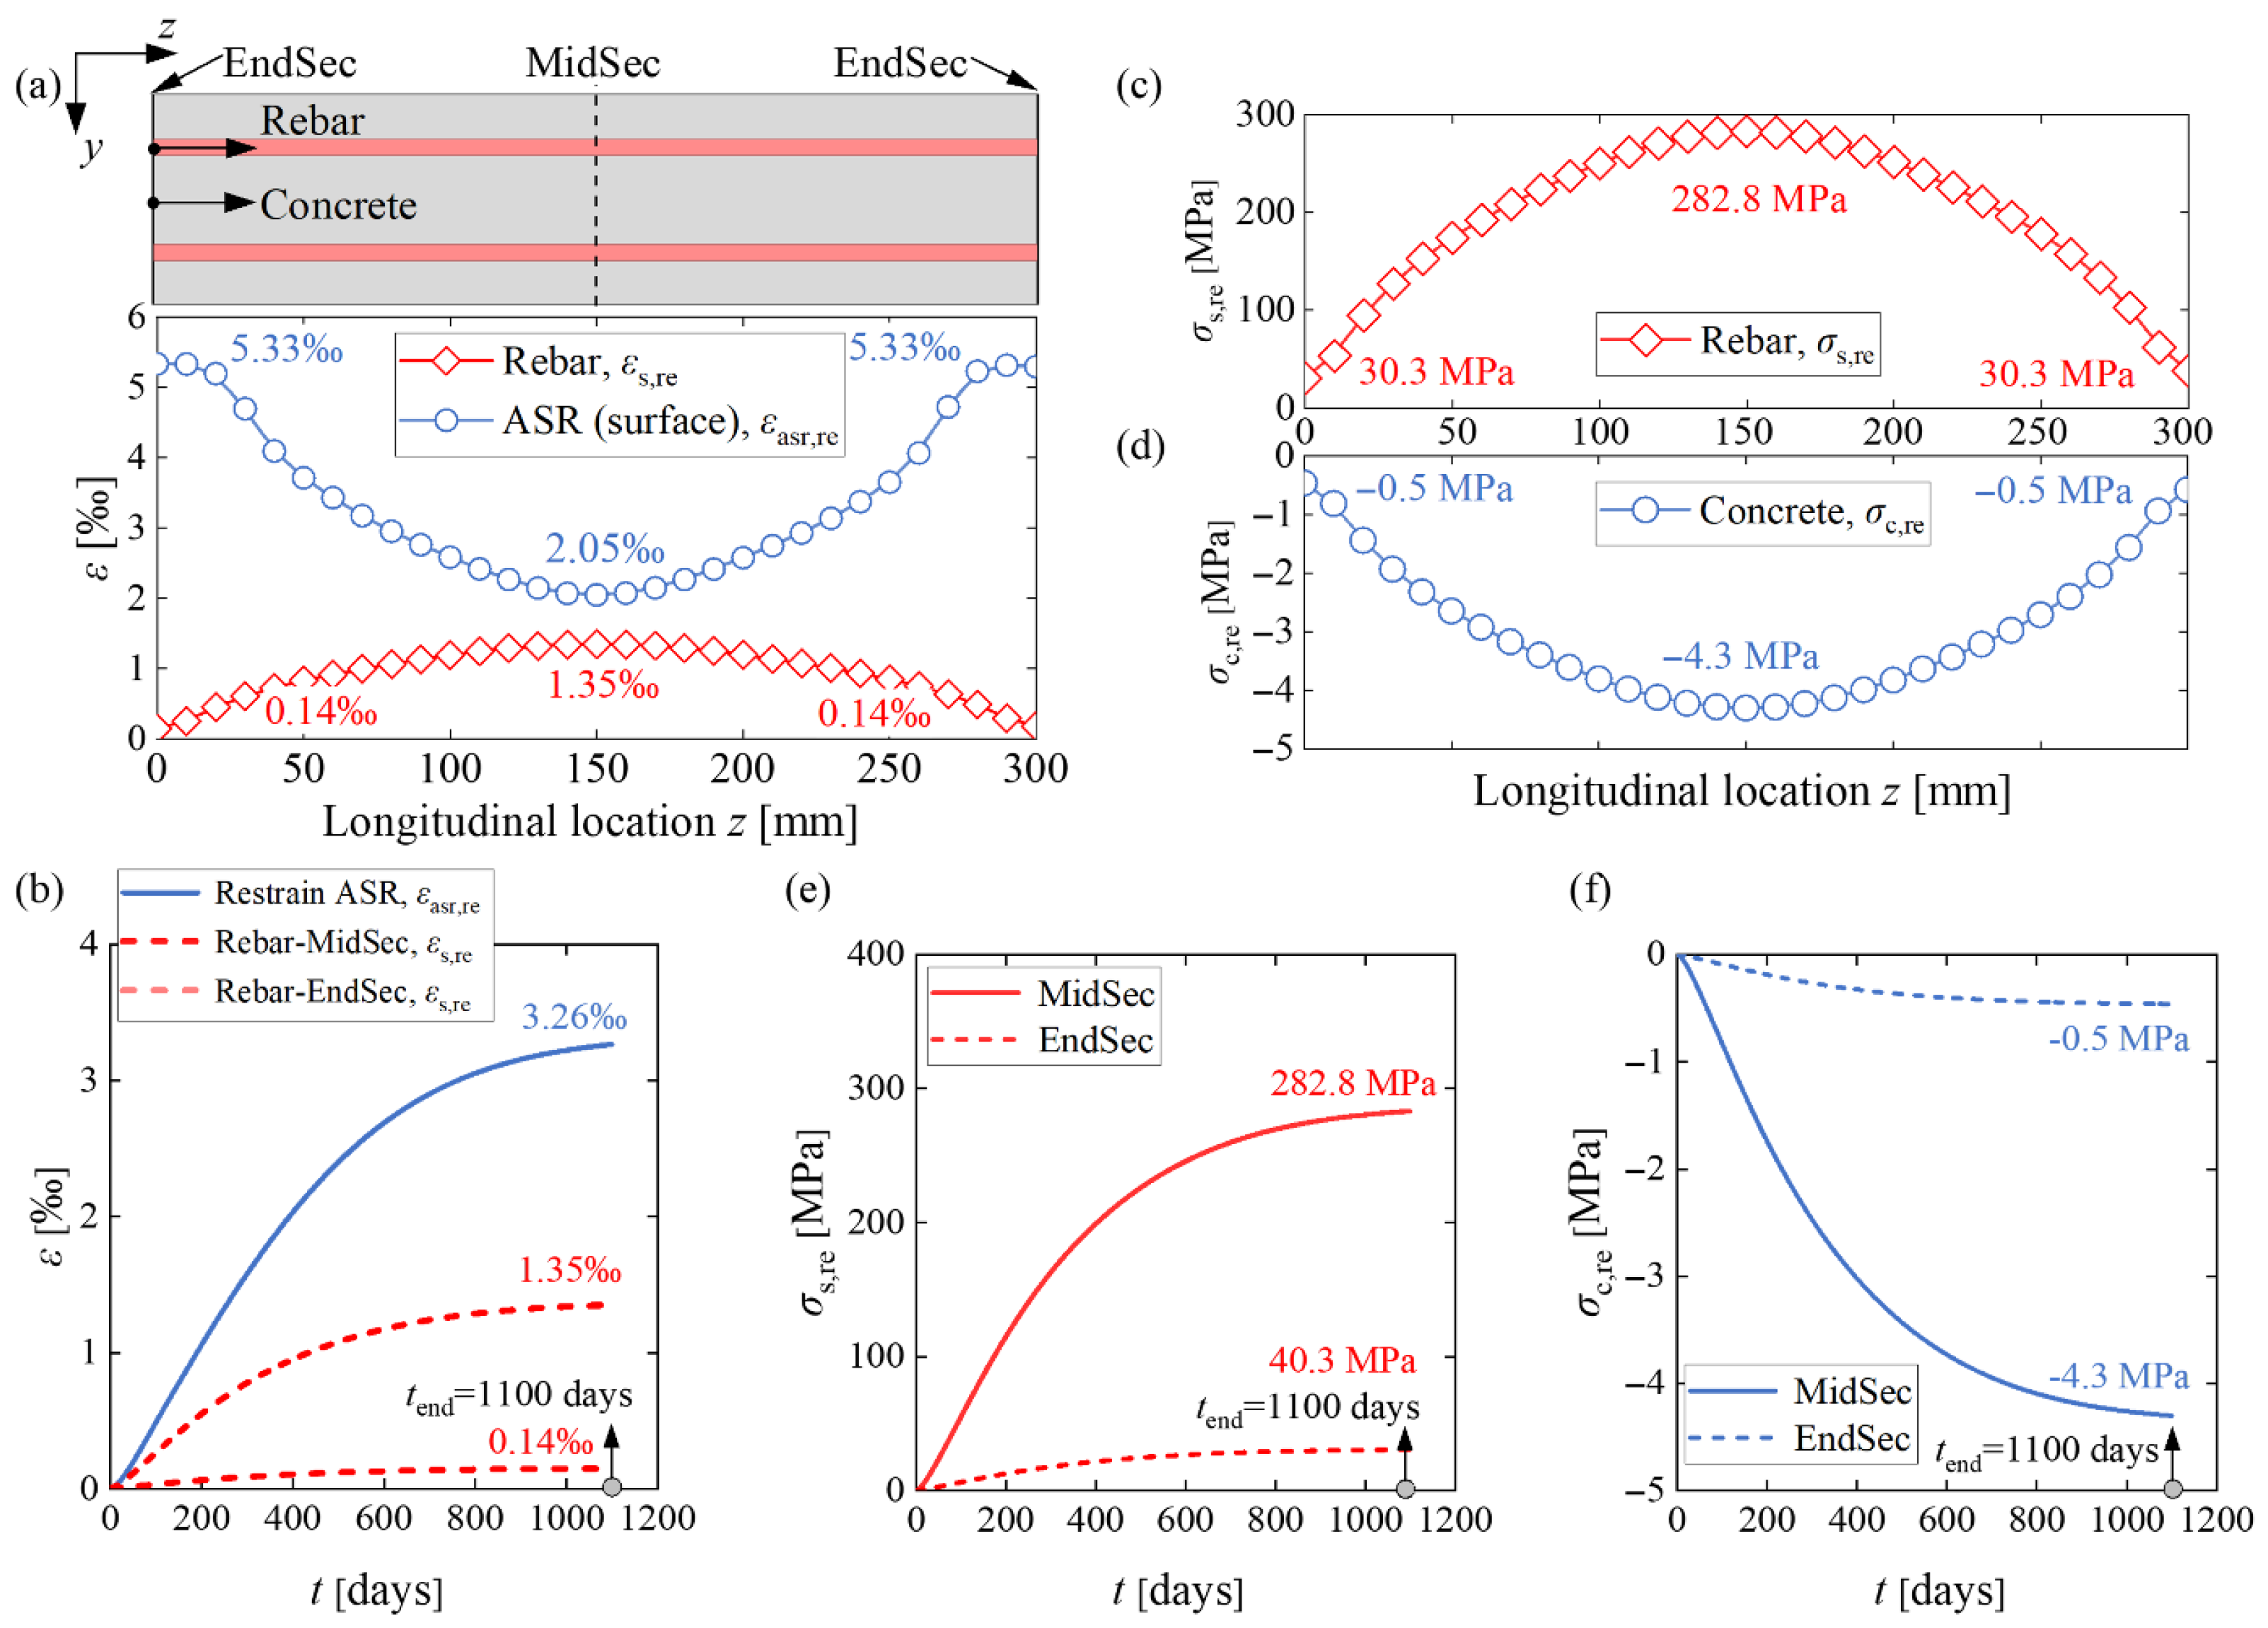
Figure A3.
Stresses and strains of the 2019-RcPrism-4ds16 sample: (a) restrained ASR strain distribution and rebar strain distribution in the longitudinal direction at 1100 days; (b) restrained ASR strain history and rebar strain history; (c) rebar stress distribution at 1100 days; (d) concrete normal stress distribution in the longitudinal direction at 1100 days; (e) rebar stress history; and (f) concrete stress history.
References
- Ulm, F.-J.; Coussy, O.; Kefei, L.; Larive, C. Thermo-chemo-mechanics of ASR expansion in concrete structures. J. Eng. Mech. 2000, 126, 233–242. [Google Scholar] [CrossRef] [Scilit]
- Leemann, A.; Góra, M.; Lothenbach, B.; Heuberger, M. Alkali silica reaction in concrete-Revealing the expansion mechanism by surface force measurements. Cem. Concr. Res. 2024, 176, 107392. [Google Scholar] [CrossRef] [Scilit]
- Institution of Structural Engineers. Structural Effects of Alkali-Silica Reaction: Technical Guidance on the Appraisal of Existing Structures; Institution of Structural Engineers: London, UK, 1992. [Google Scholar]
- Li, K.; Coussy, O. Concrete ASR degradation: From material modelling to structure assessment. Concr. Sci. Eng. 2002, 4, 35–46. [Google Scholar]
- Gorga, R.; Sanchez, L.; Martín-Pérez, B. FE approach to perform the condition assessment of a concrete overpass damaged by ASR after 50 years in service. Eng. Struct. 2018, 177, 133–146. [Google Scholar] [CrossRef] [Scilit]
- Torii, K.; Wasada, S.; Sasatani, T.; Minato, T. A survey on ASR-affected bridge piers with fracture of steel bars on Noto expressway. In Proceedings of the 13th Inter. Conf. on Alkali-aggregate Reaction in Concrete, Trondheim, Norway, 16–20 June 2008; pp. 1304–1311. [Google Scholar]
- Barbosa, R.A.; Hansen, S.G.; Hansen, K.K.; Hoang, L.C.; Grelk, B. Influence of alkali-silica reaction and crack orientation on the uniaxial compressive strength of concrete cores from slab bridges. Constr. Build. Mater. 2018, 176, 440–451. [Google Scholar] [CrossRef] [Scilit]
- Stemland, K.; Rodum, E.; Kanstad, T. Stiffness damage testing of laboratory-cast alkali-silica reactive concrete and cores drilled from an existing concrete structure. In Proceedings of the 16th ICAAR Conference, Lisbon, Portugal, 31 May–2 June 2022. [Google Scholar]
- Kanstad, T.; Rodum, E.; Lindgård, J. Assessment of Norwegian Bridges Affected by ASR. In Proceedings of the International Conference on Alkali-Aggregate Reaction in Concrete; Springer: Cham, Switzerland, 2024; pp. 411–418. [Google Scholar]
- Jones, A.; Clark, L. The effects of restraint on ASR expansion of reinforced concrete. Mag. Concr. Res. 1996, 48, 1–13. [Google Scholar] [CrossRef] [Scilit]
- Cope, R.; Wen, H.; May, I. Prediction of Stress Distributions in Reinforced Concrete Members Affected by Alkali Aggregate Reaction; Transport Research Laboratory: Wokingham, UK, 1994. [Google Scholar]
- Clayton, N.; Currie, R.; Moss, R. Effects of alkali-silica reaction on the strength of prestressed concrete beams. Struct. Eng. 1990, 68, 287–292. [Google Scholar]
- Ng, K.E. Effect of Alkali Silica Reaction on the Punching Shear Capacity of Reinforced Concrete Slabs. Ph.D. Thesis, University of Birmingham, Birmingham, UK, 1991. [Google Scholar]
- Chana, P.; Korobokis, G. The Structural Performance of Reinforced Concrete Affected by Alkali Silica Reaction: Phase II; Transport Research Laboratory: Wokingham, UK, 1992. [Google Scholar]
- Koyanagi, W.; Rokugo, K.; Morimoto, H. Characteristics and simulation of concrete cracks caused by AAR. In Proceedings of the 8th International Conference on Alkali Aggregate Reaction, Kyoto, Japan, 17–20 July 1989; pp. 845–850. [Google Scholar]
- Kobayashi, K.; Inoue, S.; Yamazaki, T.; Nakano, K. Structural Behaviors of Prestressed Concrete Beams Affected by Alkali-Aggregate Reaction. Trans. Jpn. Concr. Inst. 1987, 9, 615–620. [Google Scholar]
- Le Roux, A.; Massieu, E.; Godart, B. Evolution under stress of a concrete affected by aar-application to the feasilbility of strengthening a bridge by prestressing. In Proceedings of the 9th International Conference on Alkali-Aggregate Reaction in Concrete, London, UK, 27–31 July 1992; Volume 2. [Google Scholar]
- Rigden, S.; Salam, J.; Burley, E. The influence of stress intensity and orientation upon the mechanical properties of ASR affected concrete. In Proceedings of the 9th International Conference on Alkali-Aggregate Reaction in Concrete, London, UK, 27–31 July 1992; Volume 2, pp. 865–876. [Google Scholar]
- Kongshaug, S.S.; Oseland, O.; Kanstad, T.; Hendriks, M.A.; Rodum, E.; Markeset, G. Experimental investigation of ASR-affected concrete–The influence of uniaxial loading on the evolution of mechanical properties, expansion and damage indices. Constr. Build. Mater. 2020, 245, 118384. [Google Scholar] [CrossRef] [Scilit]
- Stemland, K. Experimental and Structural Basis for Analysis and Assessment of Concrete Structures Exposed to Alkali-Silica Reactions. Ph.D. Dissertation, Norwegian University of Science and Technology, Trondheim, Norway, 2024. [Google Scholar]
- Multon, S.; Toutlemonde, F. Effect of applied stresses on alkali–silica reaction-induced expansions. Cem. Concr. Res. 2006, 36, 912–920. [Google Scholar] [CrossRef] [Scilit]
- Berra, M.; Faggiani, G.; Mangialardi, T.; Paolini, A.E. Influence of stress restraint on the expansive behaviour of concrete affected by alkali-silica reaction. Cem. Concr. Res. 2010, 40, 1403–1409. [Google Scholar] [CrossRef] [Scilit]
- Morenon, P.; Multon, S.; Sellier, A.; Grimal, E.; Hamon, F.; Bourdarot, E. Impact of stresses and restraints on ASR expansion. Constr. Build. Mater. 2017, 140, 58–74. [Google Scholar] [CrossRef] [Scilit]
- Farooq, S.; Aoki, G.; Miura, T.; Kawabata, Y.; Nakamura, H. Anisotropic expansion behavior and crack orientation of reinforced concrete due to the alkali–silica reaction. Cem. Concr. Compos. 2024, 151, 105568. [Google Scholar] [CrossRef] [Scilit]
- Esposito, R.; Hendriks, M. Literature review of modelling approaches for ASR in concrete: A new perspective. Eur. J. Environ. Civ. Eng. 2019, 23, 1311–1331. [Google Scholar] [CrossRef] [Scilit]
- Bazant, Z.P.; Steffens, A. Mathematical model for kinetics of alkali–silica reaction in concrete. Cem. Concr. Res. 2000, 30, 419–428. [Google Scholar] [CrossRef] [Scilit]
- Puatatsananon, W.; Saouma, V. Chemo-mechanical micromodel for alkali-silica reaction. ACI Mater. J. 2013, 110, 67. [Google Scholar]
- Esposito, R.; Hendriks, M.A. A multiscale micromechanical approach to model the deteriorating impact of alkali-silica reaction on concrete. Cem. Concr. Compos. 2016, 70, 139–152. [Google Scholar] [CrossRef] [Scilit]
- Iskhakov, T.; Timothy, J.J.; Meschke, G. Expansion and deterioration of concrete due to ASR: Micromechanical modeling and analysis. Cem. Concr. Res. 2019, 115, 507–518. [Google Scholar] [CrossRef] [Scilit]
- Comby-Peyrot, I.; Bernard, F.; Bouchard, P.-O.; Bay, F.; Garcia-Diaz, E. Development and validation of a 3D computational tool to describe concrete behaviour at mesoscale. Application to the alkali-silica reaction. Comput. Mater. Sci. 2009, 46, 1163–1177. [Google Scholar] [CrossRef] [Scilit]
- Wang, Y.; Meng, Y.; Jiradilok, P.; Matsumoto, K.; Nagai, K.; Asamoto, S. Expansive cracking and compressive failure simulations of ASR and DEF damaged concrete using a mesoscale discrete model. Cem. Concr. Compos. 2019, 104, 103404. [Google Scholar] [CrossRef] [Scilit]
- Luo, J.; Wang, Y.; Asamoto, S.; Nagai, K. Mesoscopic simulation of crack propagation and bond behavior in ASR damaged concrete with internal/external restraint by 3D RBSM. Cem. Concr. Compos. 2022, 129, 104488. [Google Scholar] [CrossRef] [Scilit]
- Luo, J.; Asamoto, S.; Nagai, K. Mesoscale simulation of compression-induced cracking and failure of ASR-damaged concrete with stirrup confinement. Eng. Fract. Mech. 2023, 277, 108977. [Google Scholar] [CrossRef] [Scilit]
- Saouma, V.; Perotti, L. Constitutive model for alkali-aggregate reactions. ACI Mater. J. 2006, 103, 194. [Google Scholar] [CrossRef] [Scilit]
- Fairbairn, E.M.; Ribeiro, F.L.; Lopes, L.E.; Toledo-Filho, R.D.; Silvoso, M.M. Modelling the structural behaviour of a dam affected by alkali–silica reaction. Commun. Numer. Methods Eng. 2006, 22, 1–12. [Google Scholar] [CrossRef] [Scilit]
- Comi, C.; Fedele, R.; Perego, U. A chemo-thermo-damage model for the analysis of concrete dams affected by alkali-silica reaction. Mech. Mater. 2009, 41, 210–230. [Google Scholar] [CrossRef] [Scilit]
- Hariri-Ardebili, M.A.; Saouma, V.E. Sensitivity and uncertainty analysis of AAR affected reinforced concrete shear walls. Eng. Struct. 2018, 172, 334–345. [Google Scholar] [CrossRef] [Scilit]
- Hariri-Ardebili, M.A.; Saouma, V.E.; Merz, C. Risk-Informed Condition Assessment of a Bridge with Alkali-Aggregate Reaction. ACI Struct. J. 2018, 115, 475–487. [Google Scholar]
- Capra, B.; Bournazel, J.-P. Modeling of induced mechanical effects of alkali-aggregate reactions. Cem. Concr. Res. 1998, 28, 251–260. [Google Scholar] [CrossRef] [Scilit]
- Capra, B.; Sellier, A. Orthotropic modelling of alkali-aggregate reaction in concrete structures: Numerical simulations. Mech. Mater. 2003, 35, 817–830. [Google Scholar] [CrossRef] [Scilit]
- Morenon, P.; Multon, S.; Sellier, A.; Grimal, E.; Hamon, F.; Kolmayer, P. Flexural performance of reinforced concrete beams damaged by Alkali-Silica Reaction. Cem. Concr. Compos. 2019, 104, 103412. [Google Scholar] [CrossRef] [Scilit]
- Vo, D.; Multon, S.; Morenon, P.; Sellier, A.; Grimal, E.; Masson, B.; Kolmayer, P. Evaluation of structures affected by Alkali-Silica reaction (ASR) using homogenized modelling of reinforced concrete. Eng. Struct. 2021, 246, 112845. [Google Scholar] [CrossRef] [Scilit]
- Kongshaug, S.S.; Larssen, R.M.; Hendriks, M.A.; Kanstad, T.; Markeset, G. Load effects in reinforced concrete beam bridges affected by alkali–silica reaction—Constitutive modelling including expansion, cracking, creep and crushing. Eng. Struct. 2021, 245, 112945. [Google Scholar] [CrossRef] [Scilit]
- Kongshaug, S.S.; Hendriks, M.A.; Kanstad, T.; Markeset, G. Toward identifying the ASR-induced stresses from displacement measurements and crack observations—Demonstration on a beam bridge in Norway. Eng. Struct. 2022, 263, 114337. [Google Scholar] [CrossRef] [Scilit]
- European Committee for Standardization. EN 1992-1-1: Eurocode 2: Design of Concrete Structures - Part 1-1: General Rules and Rules for Buildings; European Committee for Standardization: Brussels, Belgium, 2004. [Google Scholar]
- Saouma, V.E.; Martin, R.A.; Hariri-Ardebili, M.A.; Katayama, T. A mathematical model for the kinetics of the alkali–silica chemical reaction. Cem. Concr. Res. 2015, 68, 184–195. [Google Scholar] [CrossRef] [Scilit]
- Charlwood, R.; Solymar, S.; Curtis, D. A review of alkali aggregate reactions in hydroelectric plants and dams. In Proceedings of the International Conference of Alkali-Aggregate Reactions in Hydroelectric Plants and Dams, Fredericton, NB, Canada, 28 September–2 October 1992; Volume 129. [Google Scholar]
- Kobayashi, K. Load Carrying Behaviour of Concrete Structures and Members Affected by Alkali-aggregate Reactions: Reinforced concrete beams. Concr. J. 1989, 24, 70–78. [Google Scholar]
- Hobbs, D.W. Alkali-Silica Reaction in Concrete; Thomas Telford Publishing: London, UK, 1988. [Google Scholar]
- Takemura, K.; Tazawa, E.; Yonekura, A.; Abe, Y. Mechanical characteristics of reinforced concrete column affected by alkali aggregate reaction. In Proceedings of the 8th International Conference on Alkali-Aggregate Reaction, Kyoto, Japan, 17–20 July 1989; pp. 665–670. [Google Scholar]
- Dassault Systèmes. Abaqus User Subroutines Reference Guide; Dassault Systèmes Simulia Corp.: Johnston, RI, USA, 2016. [Google Scholar]
- Bažant, Z.P.; Wu, S.T. Dirichlet series creep function for aging concrete. J. Eng. Mech. Div. 1973, 99, 367–387. [Google Scholar] [CrossRef] [Scilit]
- Zheng, S.; Liu, Y.; Yoda, T.; Lin, W. Parametric study on shear capacity of circular-hole and long-hole perfobond shear connector. J. Constr. Steel Res. 2016, 117, 64–80. [Google Scholar] [CrossRef] [Scilit]
- Zhang, Q.; Liu, Y.; Bao, Y.; Jia, D.; Bu, Y.; Li, Q. Fatigue performance of orthotropic steel-concrete composite deck with large-size longitudinal U-shaped ribs. Eng. Struct. 2017, 150, 864–874. [Google Scholar] [CrossRef] [Scilit]
- Lacombe, C.; Vidal, T.; Sellier, A.; Noret, C.; Anthiniac, P. Compressive creep of a concrete affected by advanced alkali-aggregate reaction. Constr. Build. Mater. 2024, 421, 135627. [Google Scholar] [CrossRef] [Scilit]

Disclaimer/Publisher’s Note: The statements, opinions and data contained in all publications are solely those of the individual author(s) and contributor(s) and not of MDPI and/or the editor(s). MDPI and/or the editor(s) disclaim responsibility for any injury to people or property resulting from any ideas, methods, instructions or products referred to in the content. |
© 2026 by the authors. Licensee MDPI, Basel, Switzerland. This article is an open access article distributed under the terms and conditions of the Creative Commons Attribution (CC BY) license.