


Abstract
Wire-arc additive manufacturing (WAAM) offers several advantages in the production of nickel aluminium bronze (NAB) parts for maritime, aviation and petrochemicals industries. Anisotropic material properties, however, have been observed in WAAM and, to date, the variability in corrosion behaviour in NAB processed by WAAM has not been explored. This study addresses the gap by investigating the microstructure and corrosion behaviour of NAB processed by WAAM in the three orthogonal planes (XY, YZ and XZ) compared to a continuously cast sample using microspectroscopy and electrochemical techniques. YZ- and XZ-orientated WAAM samples exhibited layered microstructures with coarser and finer regions. Microstructures appear similar across orientations with elongated α grains, higher proportions of the intergranular region in heat-affected zones and considerably finer κ precipitates compared to the cast NAB. Corrosion resistance across WAAM orientations were comparable to those of casted samples. Increased variability in WAAM corrosion results suggests possible additional locational dependencies beyond orientation alone.
1. Introduction
Additive manufacturing is a booming technology receiving major industry and research interest. The sector is valued at around $14B AUD ($10B USD) and is projected to hit $70B AUD ($50B USD) by 2030 [1]. Additive manufacturing offers unique benefits over traditional manufacturing such as rapid prototyping, complex designs, shorter lead times through component production at point and time of need, topological optimisation, and more efficient material usage [2,3,4]. Amidst the various feedstock materials, metals are currently experiencing the highest market growth as they develop and expand into various industries like marine, aerospace, and defence which have more stringent material qualification and corrosion performance requirements [1,5]. Wire-arc additive manufacturing (WAAM) is an additive manufacturing method that uses common welding technology, such as gas metal arc welding, and computer-aided design to fabricate medium- to large-scale metal parts [6,7]. In marine applications, nickel aluminium bronzes (NABs), typically 9–12% aluminium and up to 6% nickel and iron, are chosen over other bronzes or steels, due to their high strength and corrosion resistance [8,9,10].
The superior corrosion resistance of NAB is attributed to a protective, passive self-repairing layer that forms in chloride-containing environments [8]. The passive layer comprises various unreactive copper and aluminium corrosion products that adhere tightly to the surface, preventing further corrosion of the bulk alloy [8,11]. The alloy’s microstructure also plays an important role in passivation and corrosion resistance. NAB is a multiphase alloy, exhibiting a copper-rich α phase and various intermetallic κ phases (κI, κII, κIII, κIV) that are rich in aluminium, iron and/or nickel [8,12]. A martensitic β’ phase with similar elemental composition to the α phase is often reported. After etching, dark regions observed in optical microscopy are often attributed to this β’ phase; however, it is more difficult to characterise [12]. Investigations into the corrosion behaviour of cast NAB often find that the β’ phase or the α phase within α + κlll eutectoid regions are most susceptible to corrosion [13,14,15]. Initially, films formed over the κ and β’ phases are found to be more resistive than the film formed over the α phase, attributed to differing composition of κ and unstable structure of β’ [16]. Extended immersion time, however, shows the protective film over β’ appears prone to microcracks [16]. Therefore, the attack of eutectic α and contrarian nature of β’ can be explained.
The use of WAAM in industry and its presence in the literature has grown significantly in recent times due to its ability to rapidly produce large components [17]. Early investigations into the WAAM of NAB focused on its mechanical properties and microstructure. The mechanical properties of WAAM appear comparable to cast NAB [18], although anisotropies have been observed due to the layered structure that is created during manufacture. Shen et al. and Chen et al. observed reduced ultimate tensile strengths in the vertical z-build direction [19,20] and increased ultimate tensile strength [18,20], but decreased ductility [18], in the lower region near attachment to the base metal. The microhardness of the material was also observed to increase in this region [18] and varied along the vertical build direction [19].
A complex, layered microstructure is commonly observed in studies of WAAM-produced NAB materials [18,19,20,21,22]. Upon etching, interlayer boundaries appear darker and print layer regions appear lighter. Microscopic characterisation of these regions has revealed that print layers contain more of the light-etched grains, whereas in contrast, interlayer regions exhibit a coarser microstructure with more of the dark-etched intergranular region [21]. Light grains are identified as α phase, high in copper concentration with a face-centred cubic structure [21]. The κII and κIII phases are observed in the intergranular regions and κIV is found within α grains, however no κI phase has been identified in NAB made via WAAM. This is thought to be due to faster cooling rates in WAAM [21]. The composition of the dark intergranular region is contested with some authors attributing it to be β’ phase [22] and others finding it consists only of α and κ phases [21]. Generally, the α grains appear finer in WAAM than in cast NAB [18,22], with some coarsening in the interlayer boundaries [21]. Dharmendra et al. looked at some properties along the build direction of a manufactured NAB wall and found that grain size changed with proximity to the print surface, with larger grains at the bottom than those observed at the top of the wall (i.e., the print surface) [23]. Less, and smaller κ precipitate features are typically observed in WAAM than for cast NAB [20] and with a heterogeneous distribution throughout the material; more κ precipitation is observed in the middle region of the wall than in either the top or bottom [23]. Similar observations are made by Cai et al. with some microstructural variation along build height, but minimal between horizontal and vertical directions [24].
Recent research by Cai et al. has investigated the corrosion behaviour of a NAB cladding layer made via WAAM. Using the impedance behaviour in artificial seawater, they observed a passive film that thickened over time. The film on the WAAM NAB was also found to be thicker and denser than its cast equivalent [25]. After 30 days of immersion, corrosion resistance was deemed better for WAAM-produced NAB over its cast counterpart. Pitting was also observed for the case of cast but not for the WAAM-produced materials. Passivation films were layered with an aluminium oxide inner layer and an outer layer of various copper oxides. Greater film heterogeneity was observed in the cast NAB contributing to its reduced corrosion resistance compared to the WAAM [25]. This was thought by the authors to be due to the larger and greater amount of the precipitated κ phase. Xu et al. also investigated the corrosion behaviour of a wall of NAB made via WAAM. The authors observed that WAAM had a denser passive film than its cast counterpart, which increased with immersion time [26]. The suppression of κ phase precipitation in WAAM was thought to be responsible for its increased corrosion resistance due to a more homogeneous distribution of aluminium oxide in the passive film [26]. Recent research focuses on the impacts of heat treatments on the corrosion resistance of WAAM NAB, with mixed conclusions being drawn so far [27,28,29].
The recent interest in WAAM for the production of large metal parts has led to numerous publications studying the effects of this disruptive technology on the metal’s properties. The corrosion performance of WAAM NAB appears favourable so far, however, studies have been limited, assuming a homogeneous material. Hence, there currently exists a gap in the literature regarding potential anisotropy in its corrosion behaviour. Specifically, attention to the corrosion in different planes is lacking, which is of crucial interest, considering the heterogeneous microstructural and mechanical properties reported by other authors. The objective of this research is thus to characterise the microstructure and corrosion behaviour of inner orientations of a multi-beaded wall of NAB produced with WAAM. Comparison with a traditional, as-cast counterpart will provide insight into the variability associated with the WAAM process.
2. Materials and Methods
A wall of NAB was printed at AML3D facilities in Edinburgh, South Australia with the parameters displayed in Table 1. The wall was printed with an alternating pattern switching direction along the wall’s length each layer (every three weld lines). Compressed air-cooling was used in between depositions, and the interpass temperature was measured using an overhead pyrometer aimed at the start of each weld line. A wire diameter of 1.2 mm was used. A continuously cast counterpart NAB alloy C95800 (AB2) was sourced from AW Fraser, Christchurch, New Zealand complying with ASTM B505 [30]. Molten NAB was poured into a crucible, water cooled and passed through graphite dies to produce the final 25.4 mm (1 inch) diameter solid rod. The nominal chemical compositions of the materials are shown in Table 2.
Table 1.
Printing parameters for the WAAM wall.
Table 2.
Actual and nominal compositions (wt%) for welding wire (AWS A5.7) and as-cast C95800 (AS 1565).
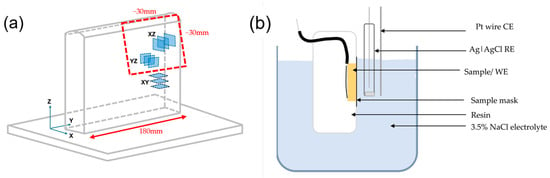
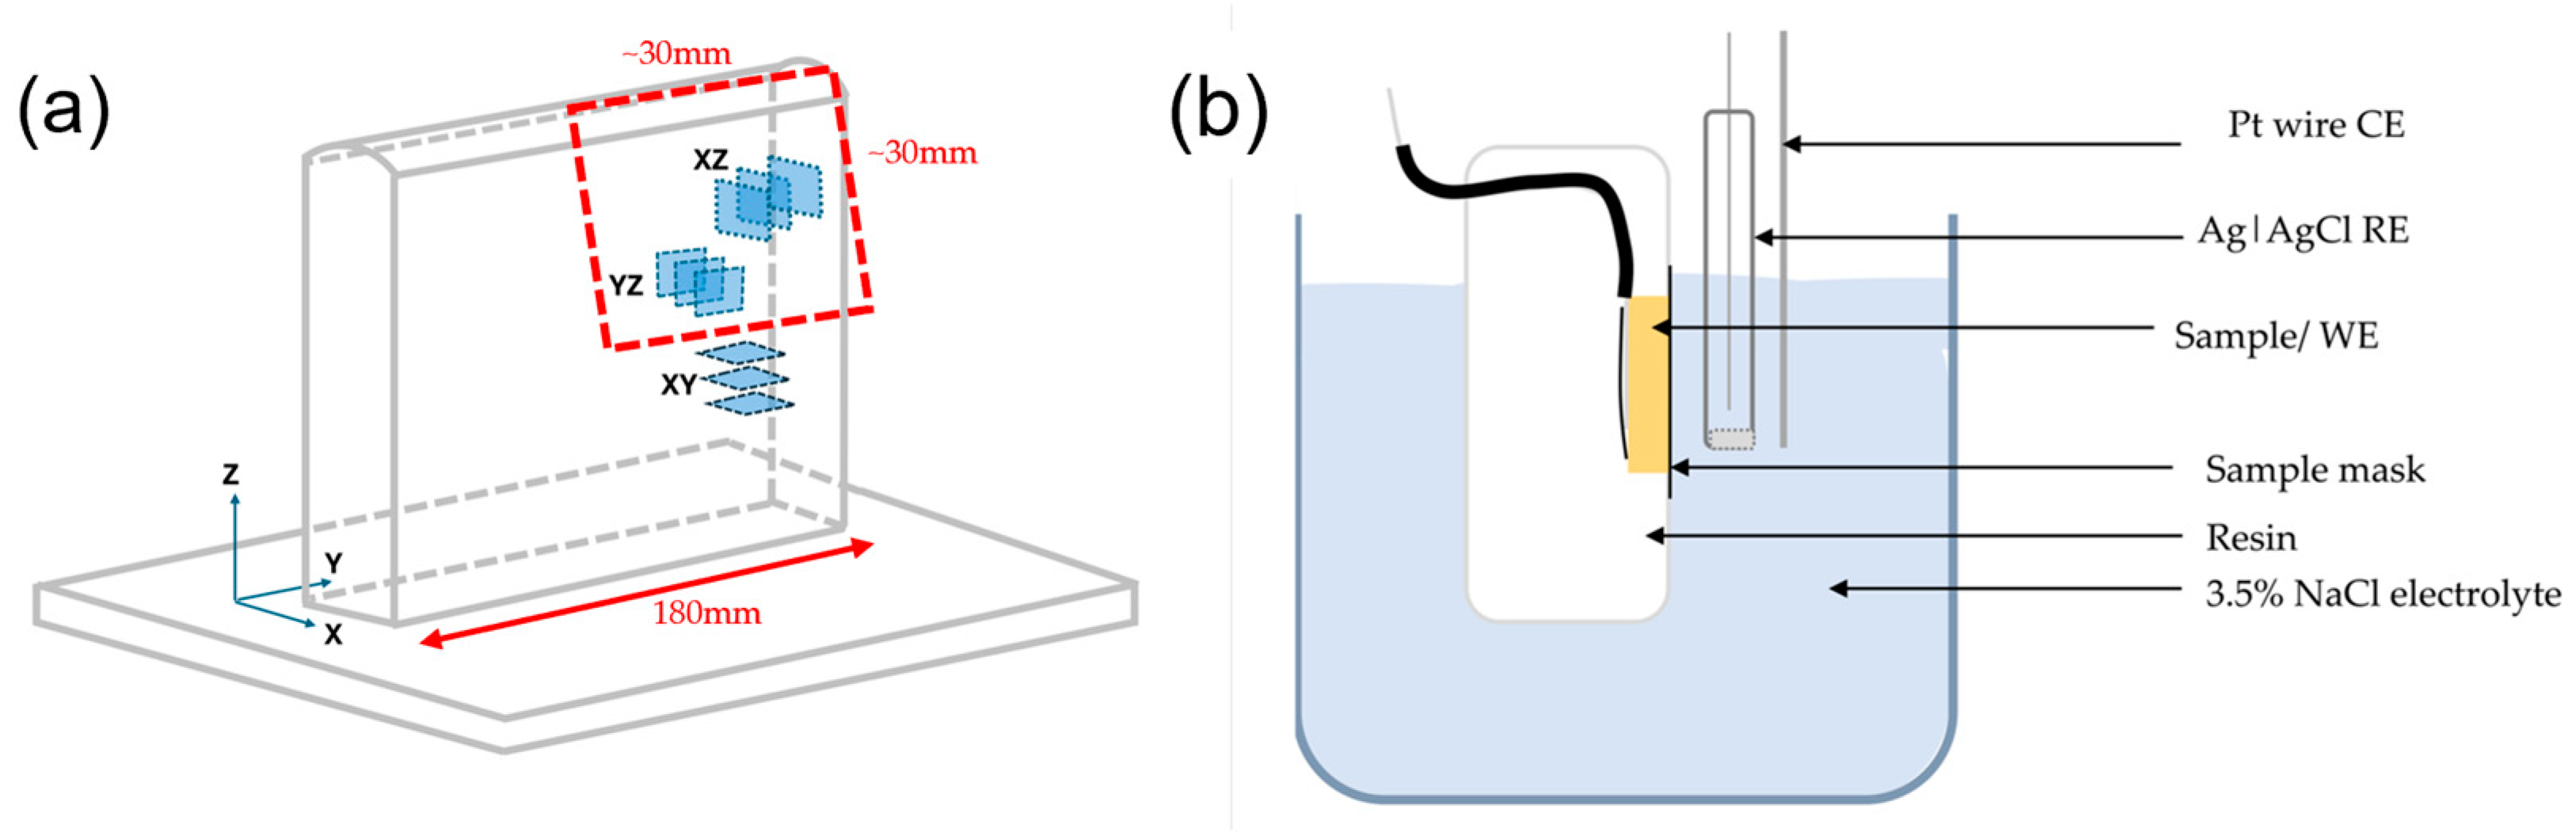
Samples were cut into approximately 10 × 10 mm squares 5 mm thick with a Buehler IsoMet 1000 precision cutter (Lake Bluff, IL, USA) to ensure minimal heating. WAAM Samples were cut along three orientations according to Figure 1a with XZ and YZ orientations from the upper end portion of the wall and the XY orientation from the middle end portion of the wall. Samples were mounted in an insulative acrylic resin purchased from Struers (Copenhagen, Denmark). Power cables were adhered with electrical tape to the samples to create an electrical connection to the potentiostat as seen in Figure 1b. Samples were polished using a Tegramin polisher following the method in Table 3 to achieve a mirror finish for evaluation with scanning electron microscopy (SEM) and Auger electron microspectroscopy (AES). A FEI Inspect F50 field emission scanning electron microscope from Flinders Microscopy and Microanalysis (FMMA, South Australia, Australia, https://doi.org/10.25957/flinders.sem, accessed on 20 September 2026) was used to observe the microstructure. A PHI-710 nanoprobe with a field emission electron source and cylindrical mirror electron energy analyser from FMMA was used for Auger electron microspectroscopy to gain insight into the elemental distribution on the surface. Imaging was done in secondary electron mode with an accelerating voltage of 20–30 kV.
Figure 1.
(a) A diagram of the WAAM wall and the samples cut from it. (b) A schematic of the 3-electrode setup for electrochemical measurements. Potential was applied to the working electrode using the potential of the Ag|AgCl electrode as a reference. An inert platinum electrode was used as the counter electrode to complete the cell. Electrodes were fixed in a holder to control interelectrode distances.
Table 3.
Tegramin polishing method.
Electrochemical data was measured using an IVIUM CompactStat potentiostat (Eindhoven, The Netherlands) using a standard three-electrode configuration with the NAB samples acting as the working electrode, a platinum wire as the counter electrode and a Ag|AgCl (1 M KCl) reference electrode. A cell stand was created to ensure controlled interelectrode distances between samples as well as masking samples with insulative tape for a controlled 0.28 cm2 exposed surface area. IviumSoft software (Version 4.1117, IVIUM, Eindhoven, The Netherlands) was used to apply the electrochemical perturbations in order of least to most destructive and used to fit data to equivalent circuit models using the Chi-Squared (χ2) test and individual element uncertainties to determine the fit quality. A 1 h open circuit potential (OCP) observation was done followed by electrochemical impedance spectroscopy (EIS) ranging from 10 kHz to 10 mHz, at a 10 mV peak amplitude, taking 10 measurements per frequency decade at the OCP taken from the previous analysis. This EIS measurement was then repeated but in reverse from 10 mHz to 10 kHz to ensure data was stable, causal and valid. A linear potential sweep (LPS) was then taken at ±10 mV and then ±30 mV around the OCP (re-measured after a 2 min stabilisation) followed by a potentiodynamic polarisation with a potential range of ±250 mV to extract the Tafel constants. All potentiodynamic scans were measured from negative to positive potentials at a scan rate of 600 mV/h. All measurements were in a naturally aerated 3.5% NaCl solution. A review of the standards relevant to corrosion testing by electrochemical means was conducted and these methods were formed from ISO16208 [31] and ASTMG106 [32] along with methods observed in the literature.
3. Results
3.1. Microstructure Results
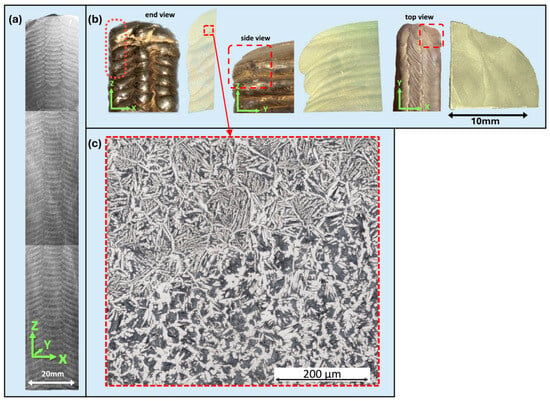
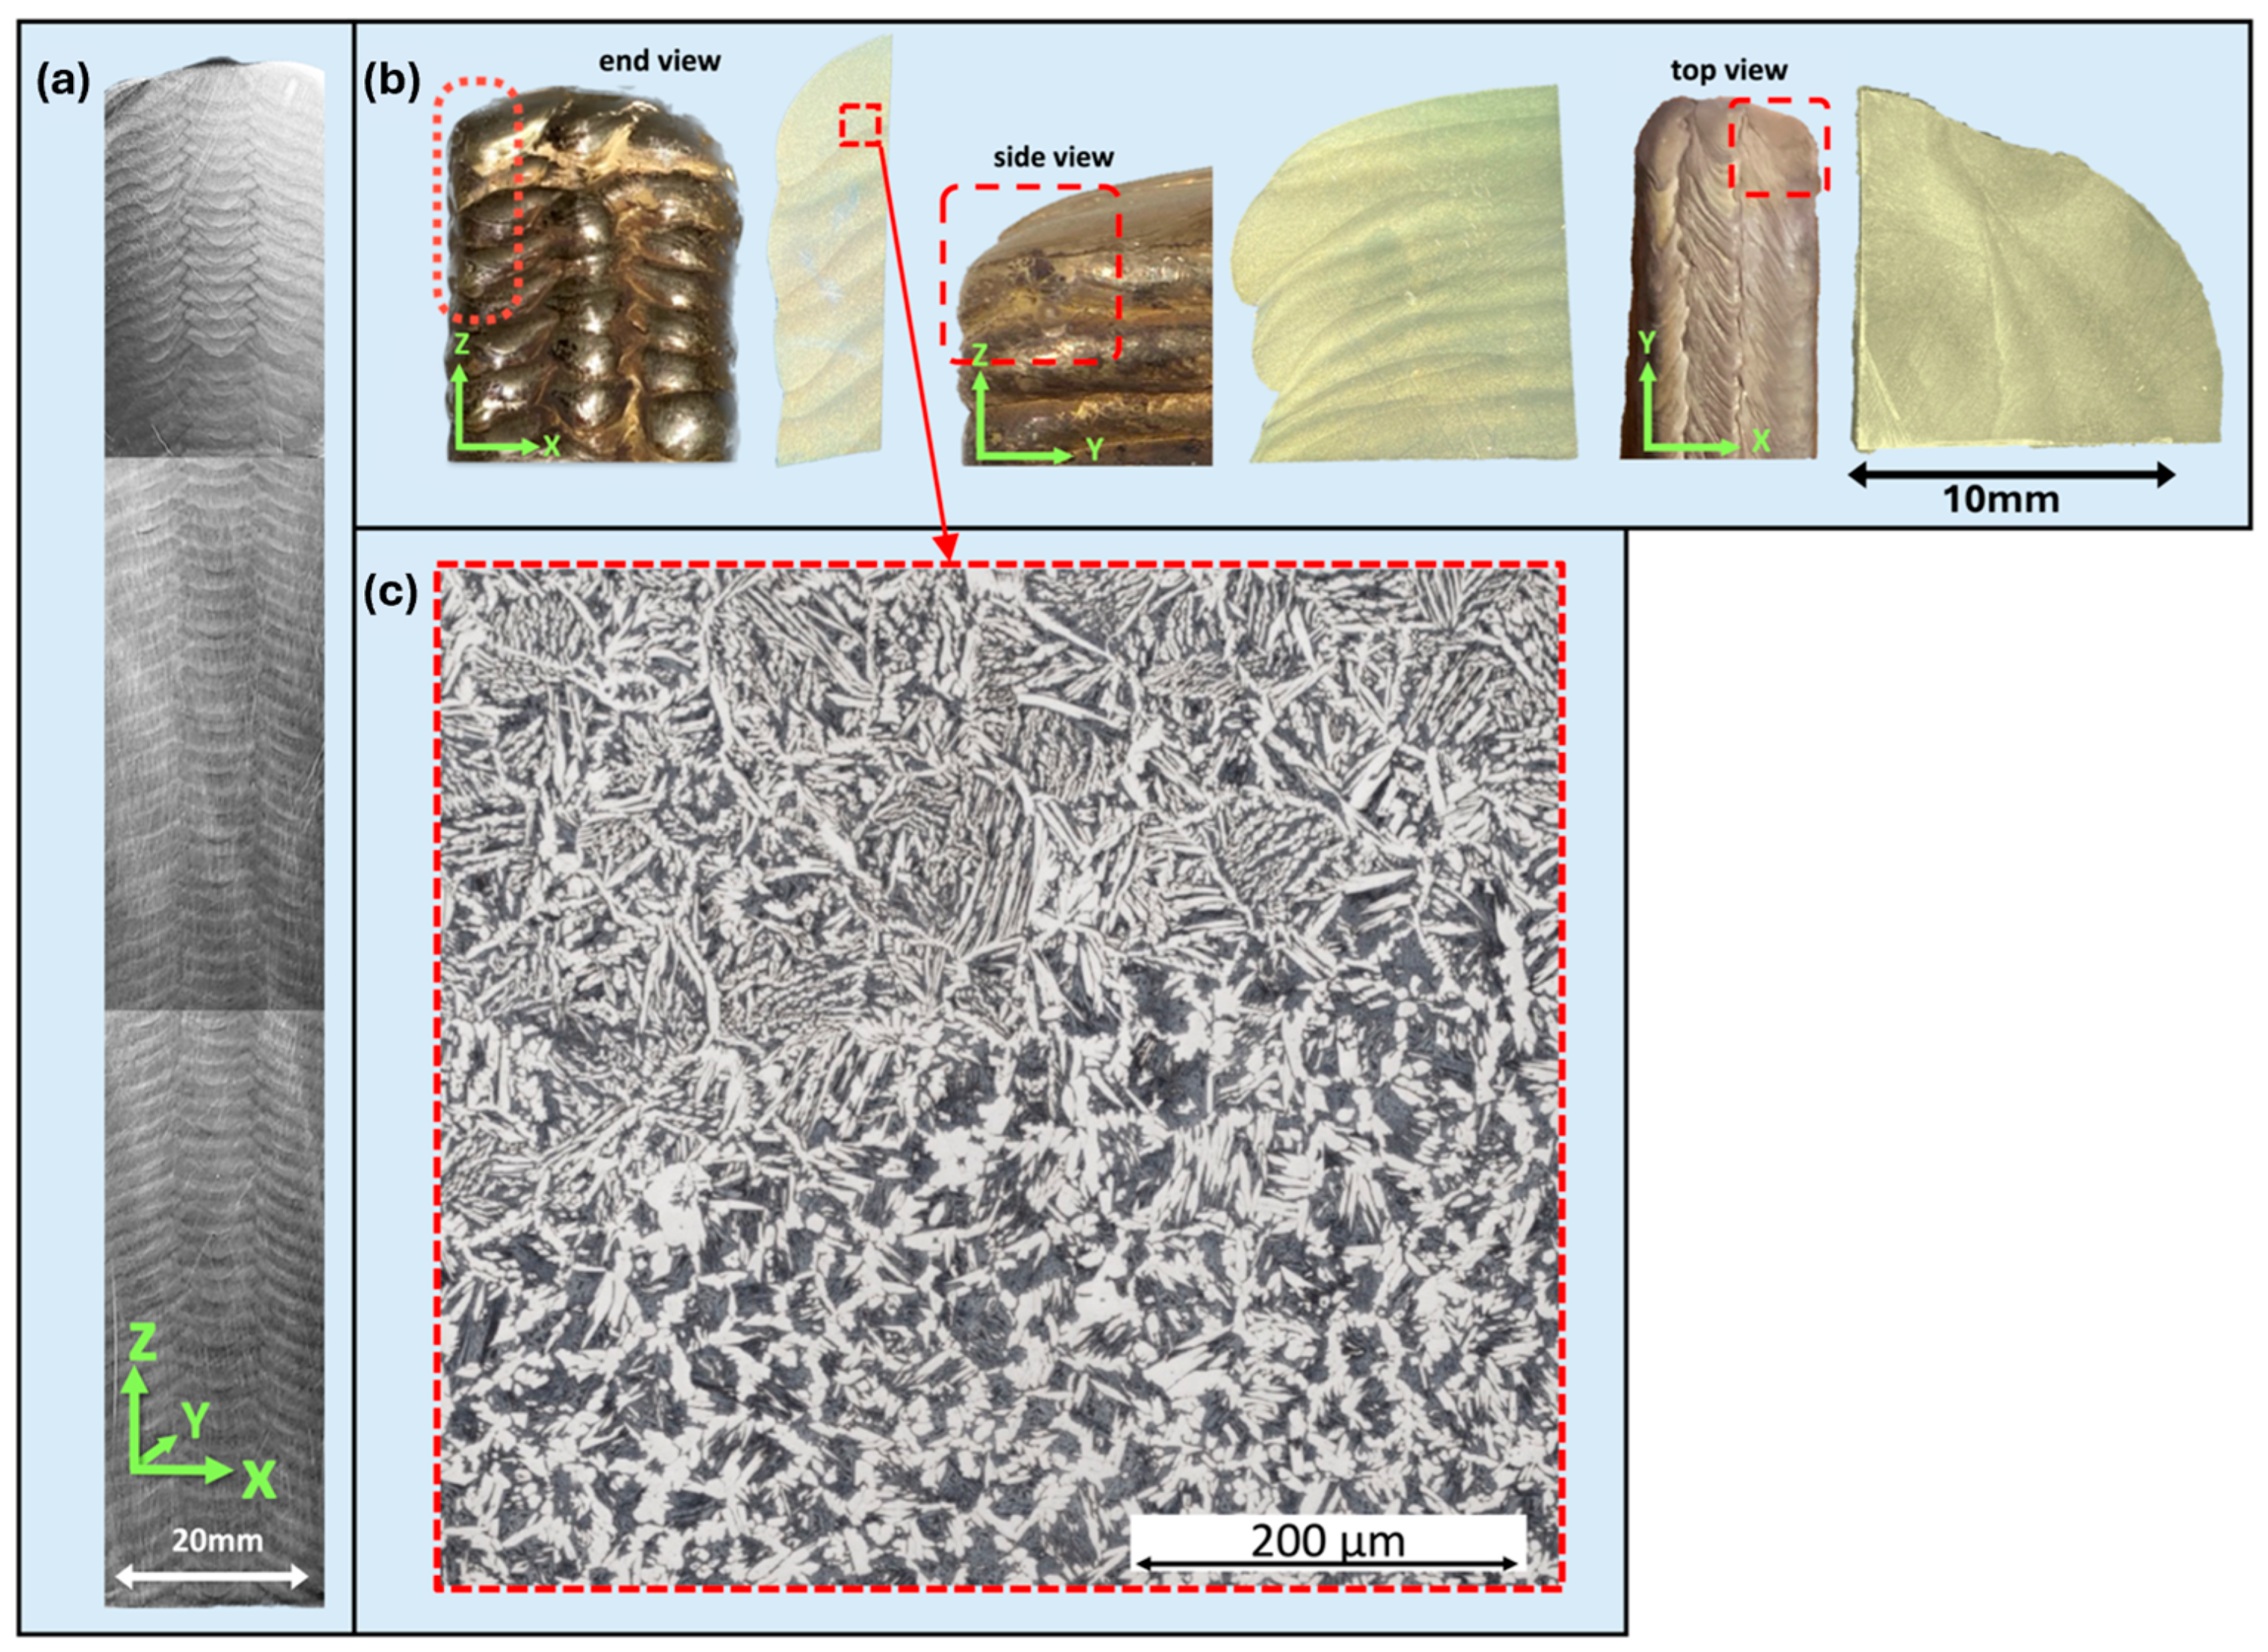
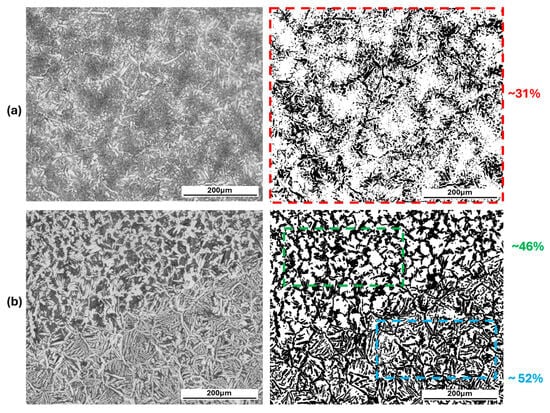
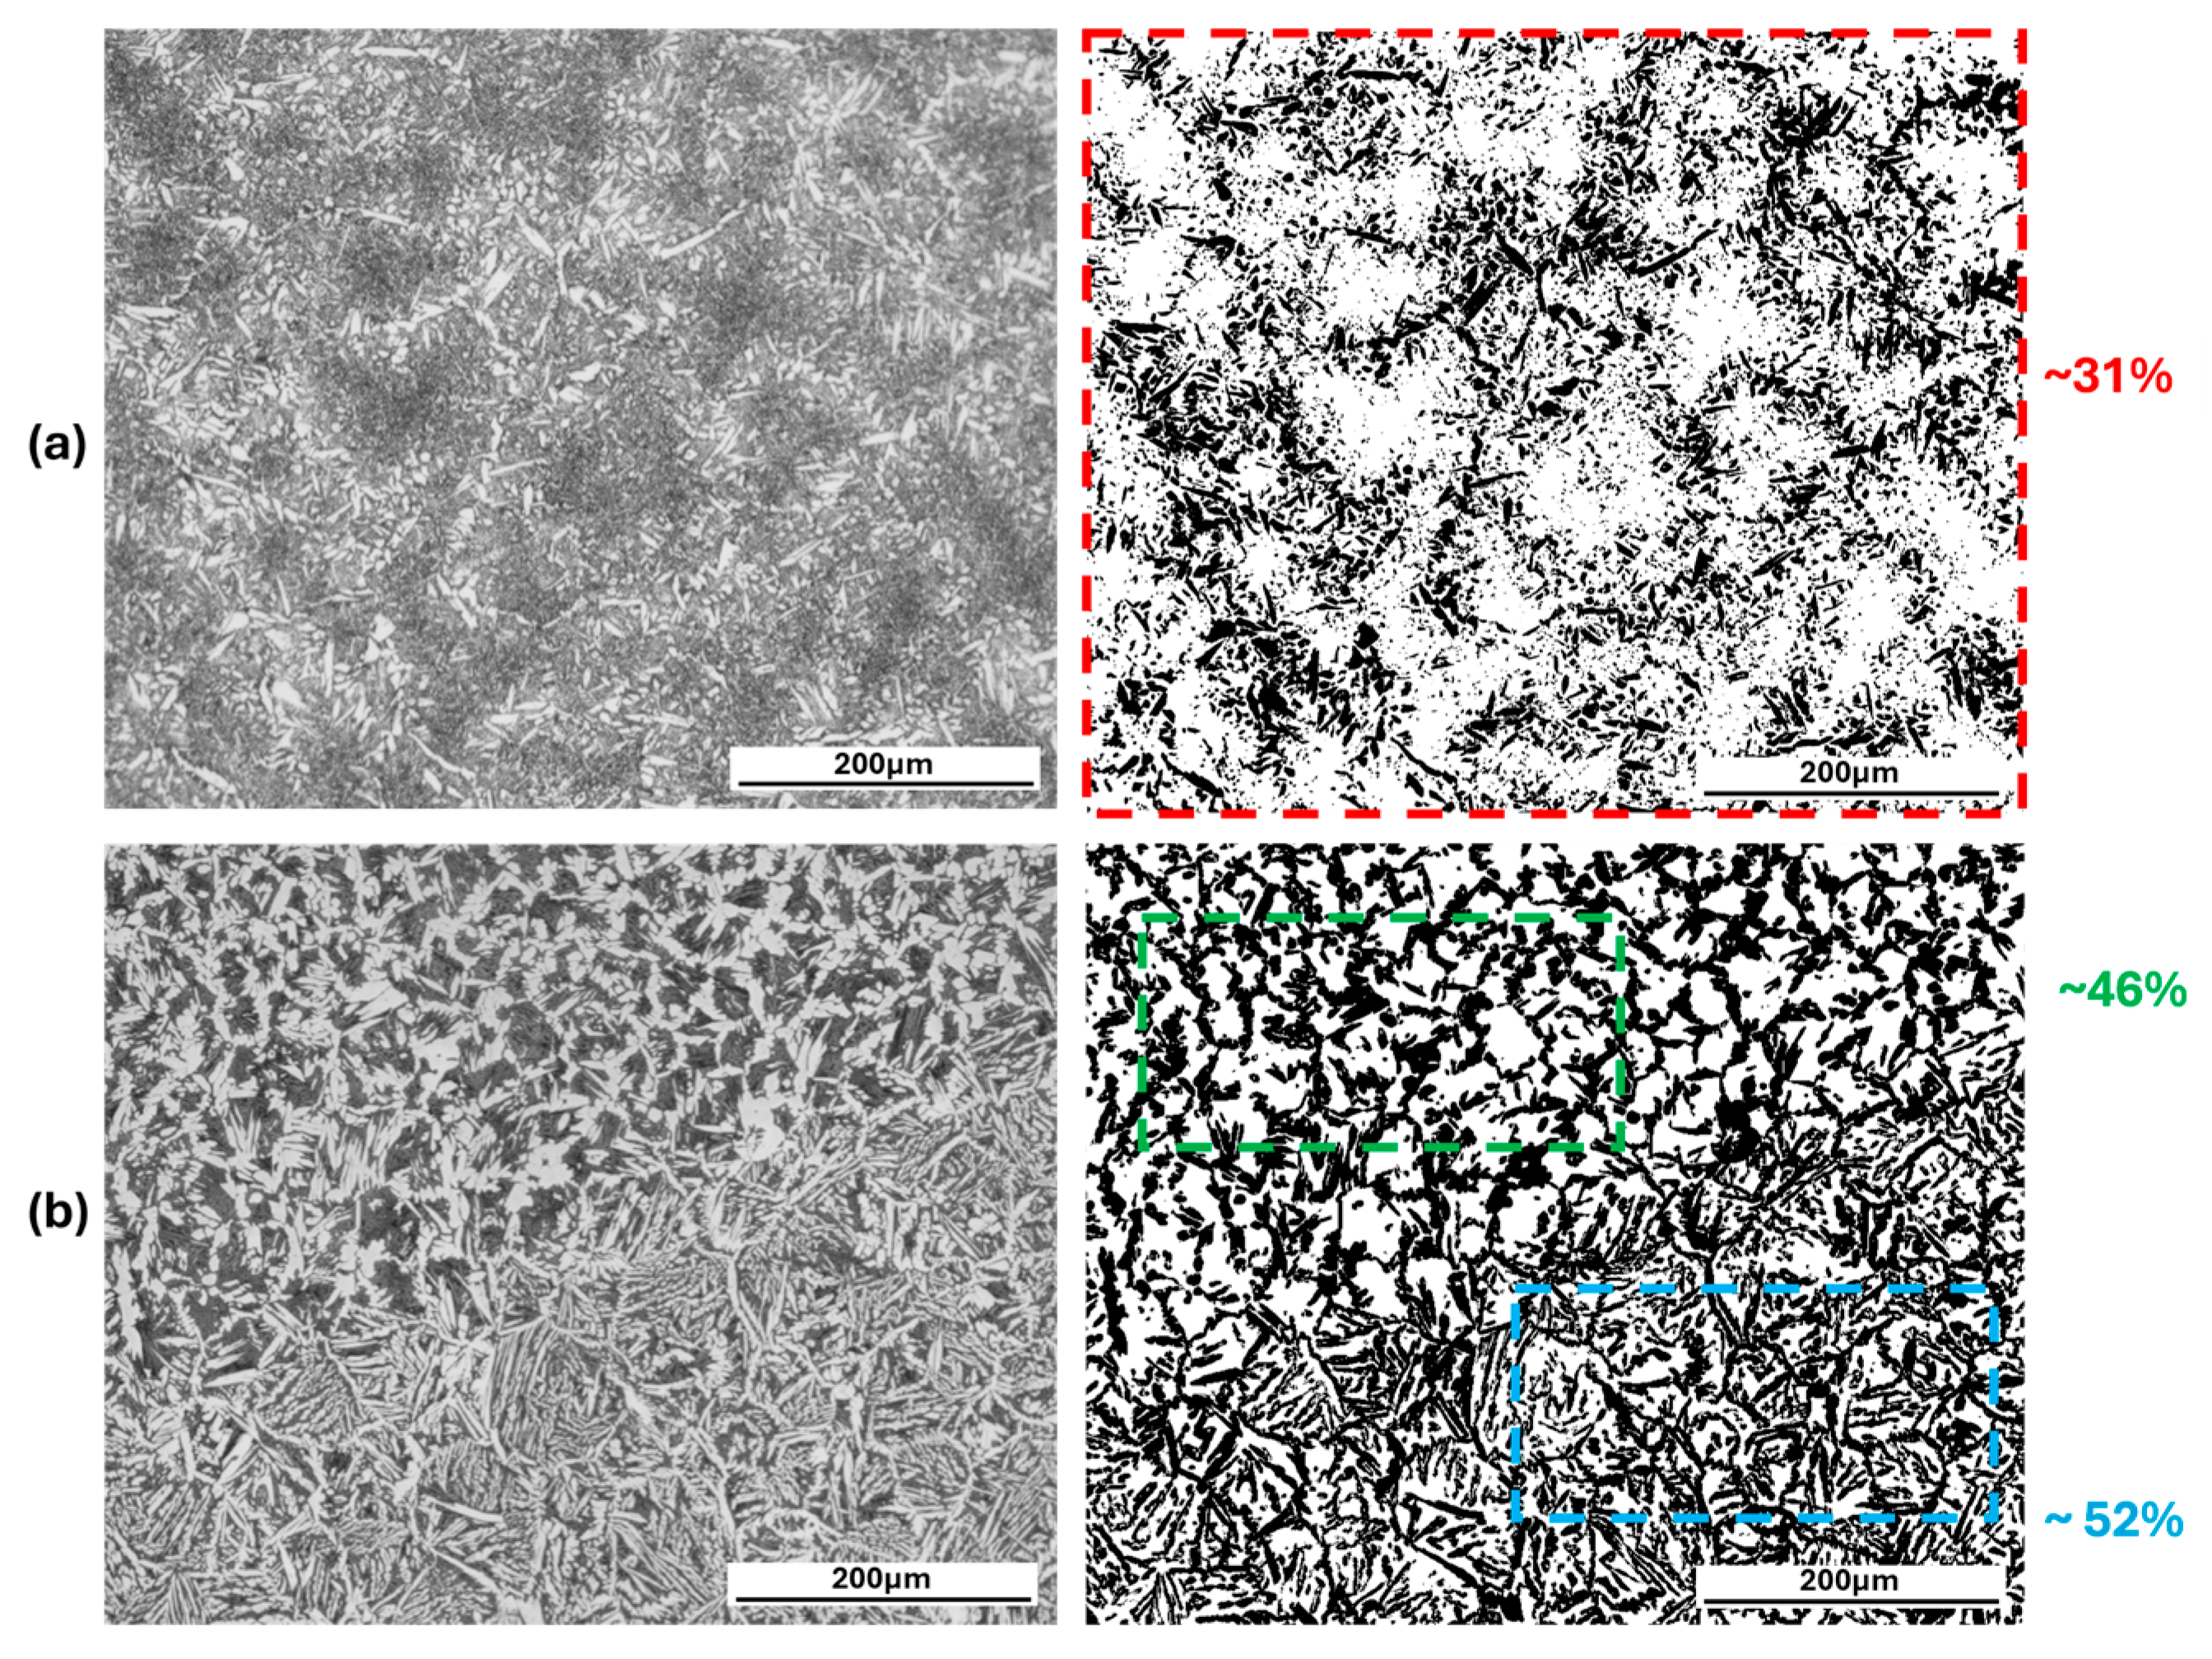
A WAAM-produced NAB wall with dimensions of approximately 25 mm wide × 180 mm long and 130 mm high was characterised in this work. A set of XYZ axes were assigned to the wall to investigate the different planes of analysis. The X direction was associated with the wall’s width, the Y direction with the wall’s length and the Z direction with the wall’s height and print direction. A photograph of a cross-section of the wall in the XZ plane is shown in Figure 2a. Looking at this image, the weld beads appeared to have been deposited uniformly along the Z direction over the entire height of the wall. Figure 2b. shows optical micrographs of the three planes of analysis, revealing a complex microstructure of generally thicker, lighter layers and thinner darker layers as a result of the fusing between layers from the WAAM process, as have been previously observed [18,19,20,21,22]. The horizontal print layers were also seen in the YZ orientation, but some deviation from uniformity is seen near the end of the wall’s length. In the XY orientation, the boundaries between two horizontal layers can be seen. Increased irregularity in the microstructure is also seen in the XY orientation as a result of where the sample was cut from, i.e., within a layer or between layers. Further magnification of these layers with optical microscopy (Figure 2c) revealed the darker layers had a coarser microstructure with larger grains and more intergranular regions due to reheating from the above weld bead. The lighter layers had less of the intergranular region and thinner, elongated light-coloured grains. A comparison of the fraction of these regions in the cast and WAAM microstructures is shown in Figure 3.
Figure 2.
(a) Definition of X, Y and Z directions, and an XZ plane cross-section of the printed wall (combining 3 images); (b) optical micrographs of the layered microstructures for the different planar orientations XZ, YZ and XY; and (c) a magnified optical micrograph of the uppermost print layer. All images were obtained after etching.
Figure 3.
Optical micrographs of (a) cast and (b) WAAM microstructures with phase fractions of the grain/intergranular region determined via ImageJ (Version 1.48, [33]) analysis of the dashed regions.
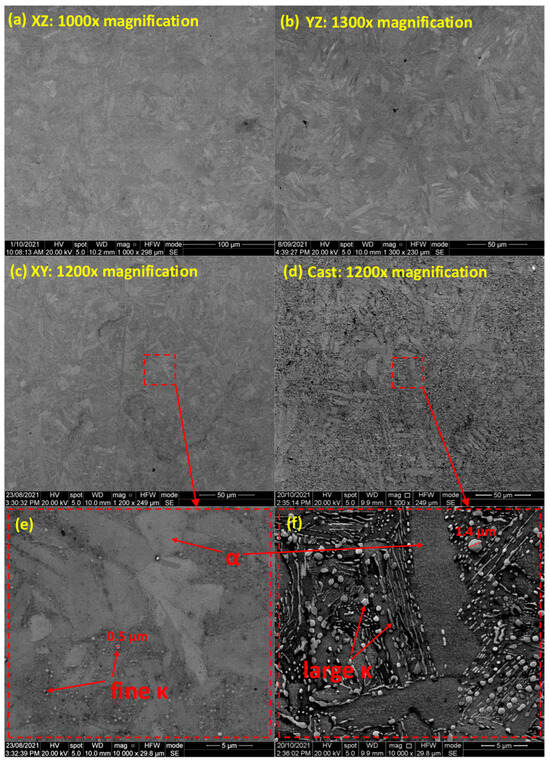
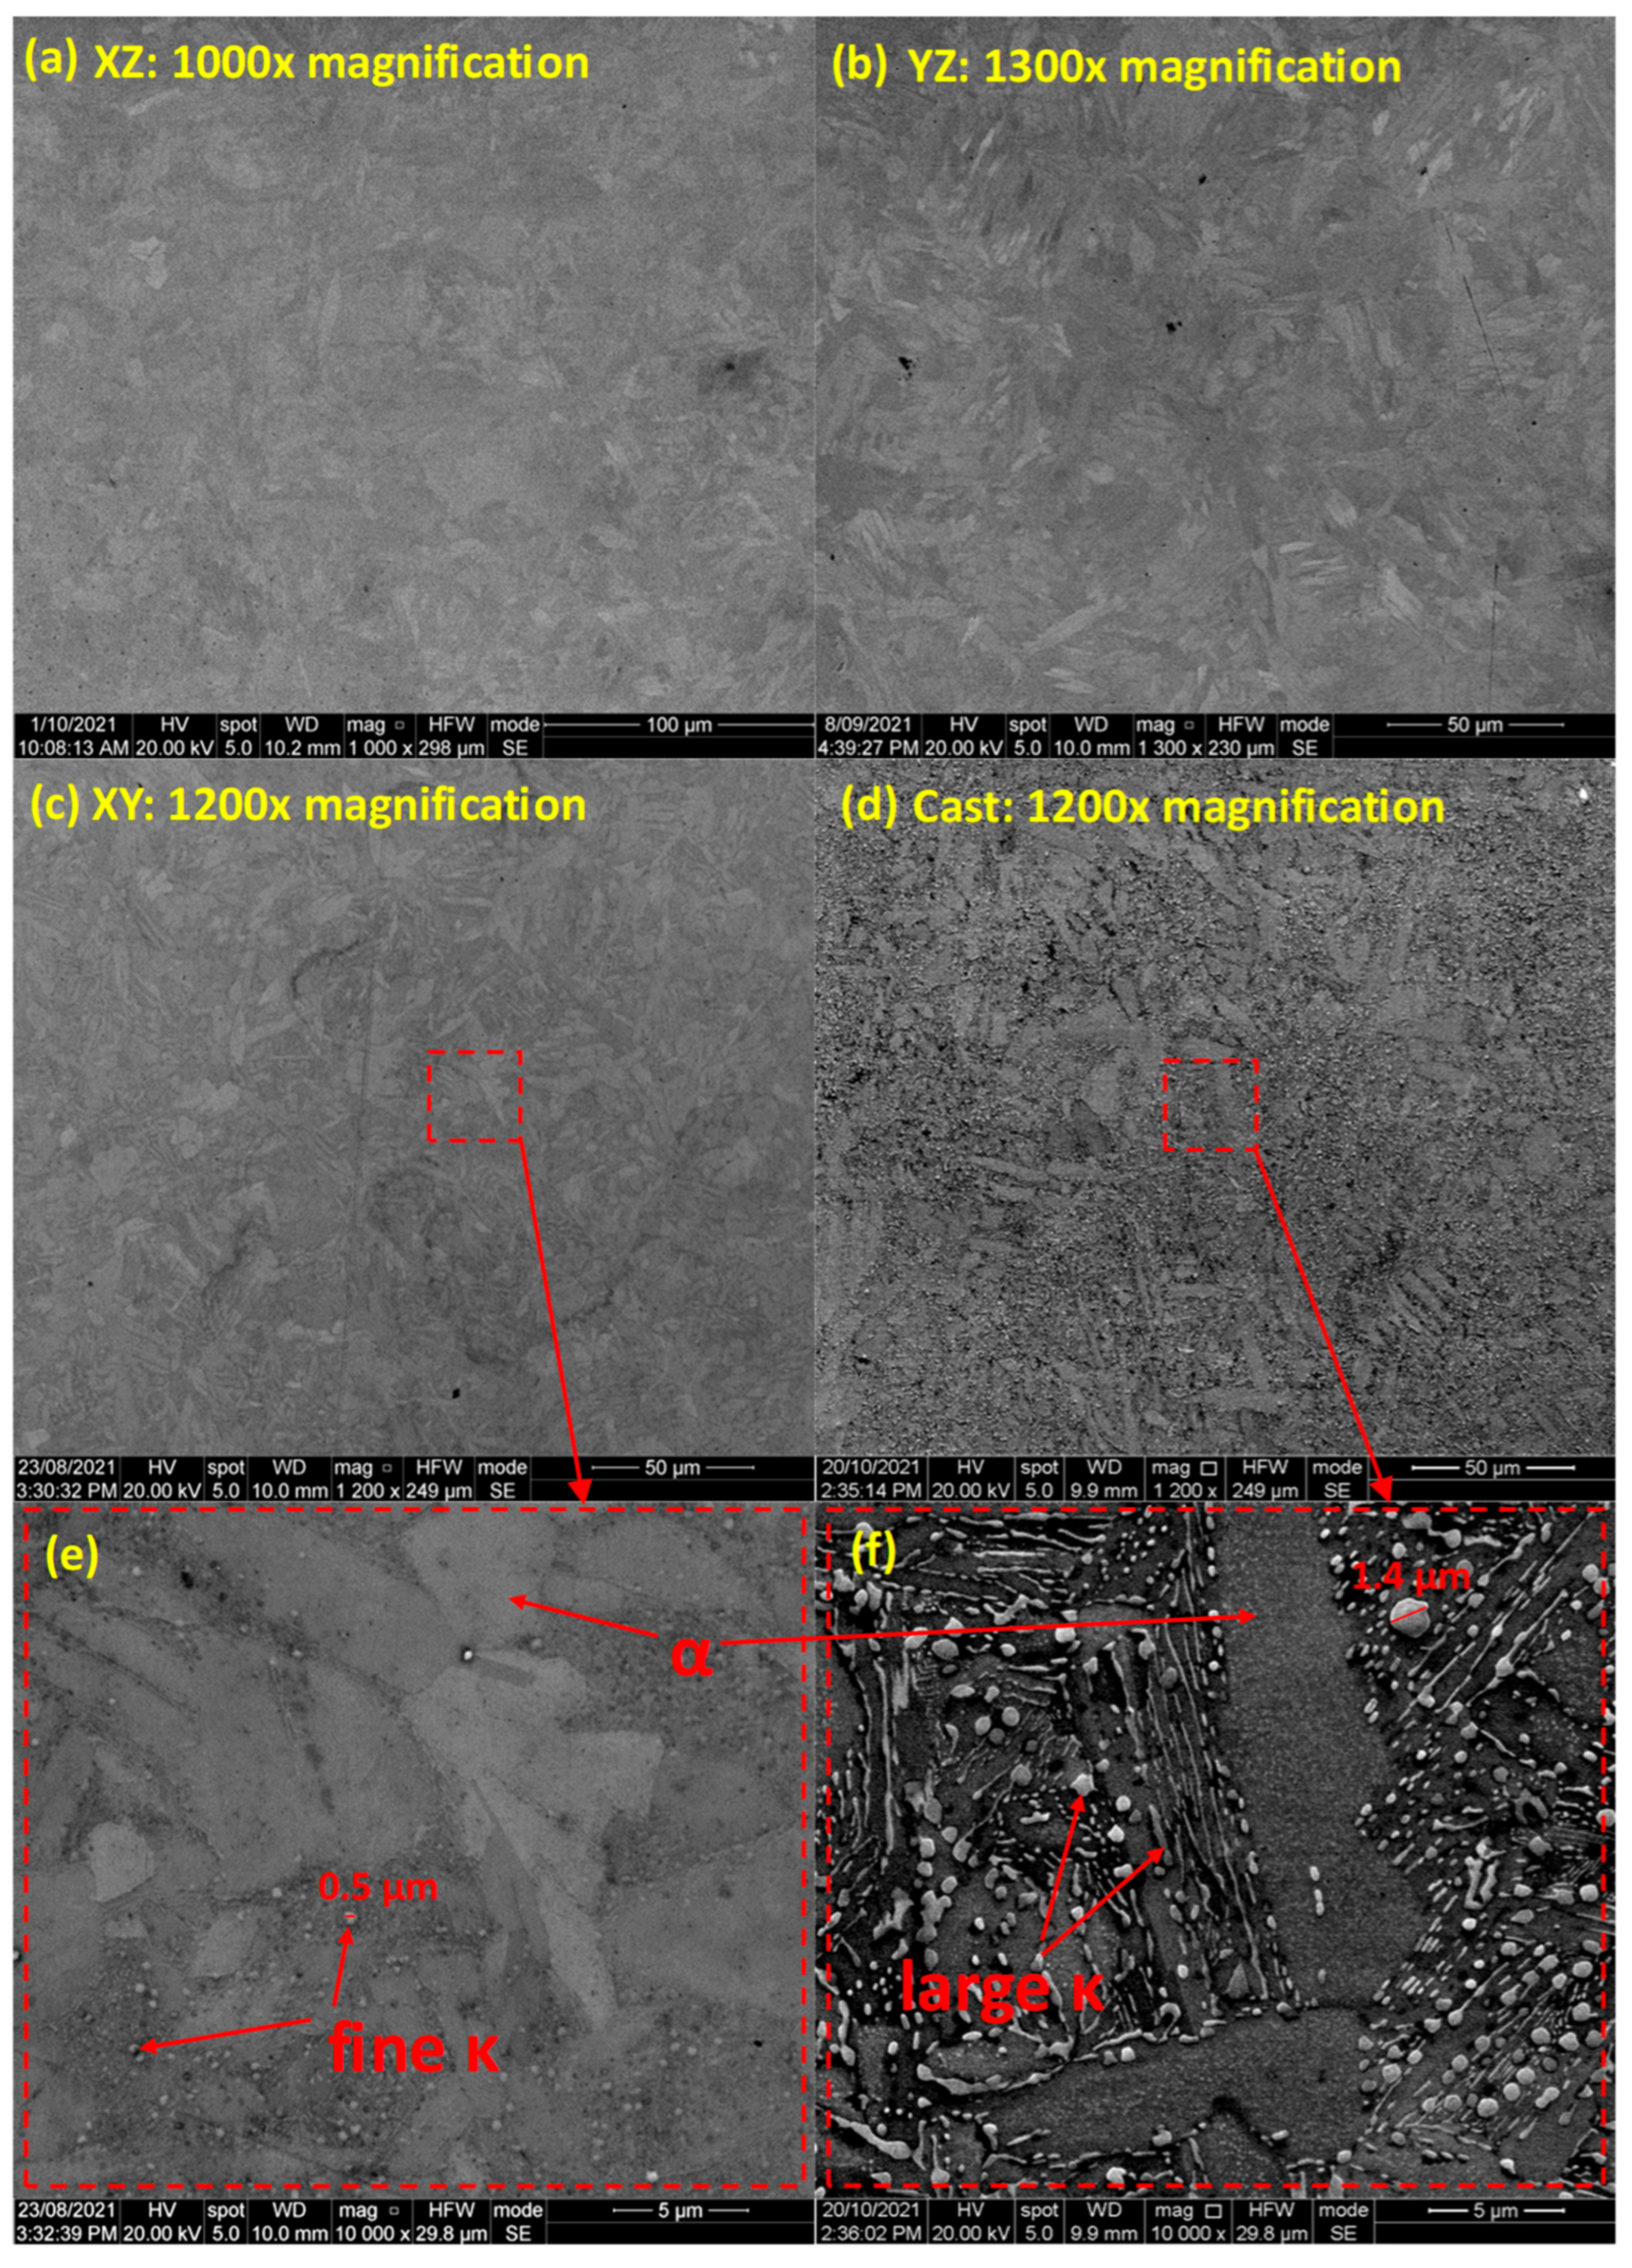
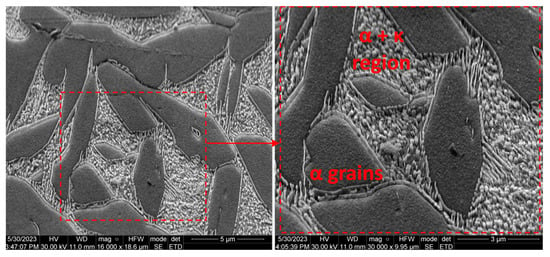
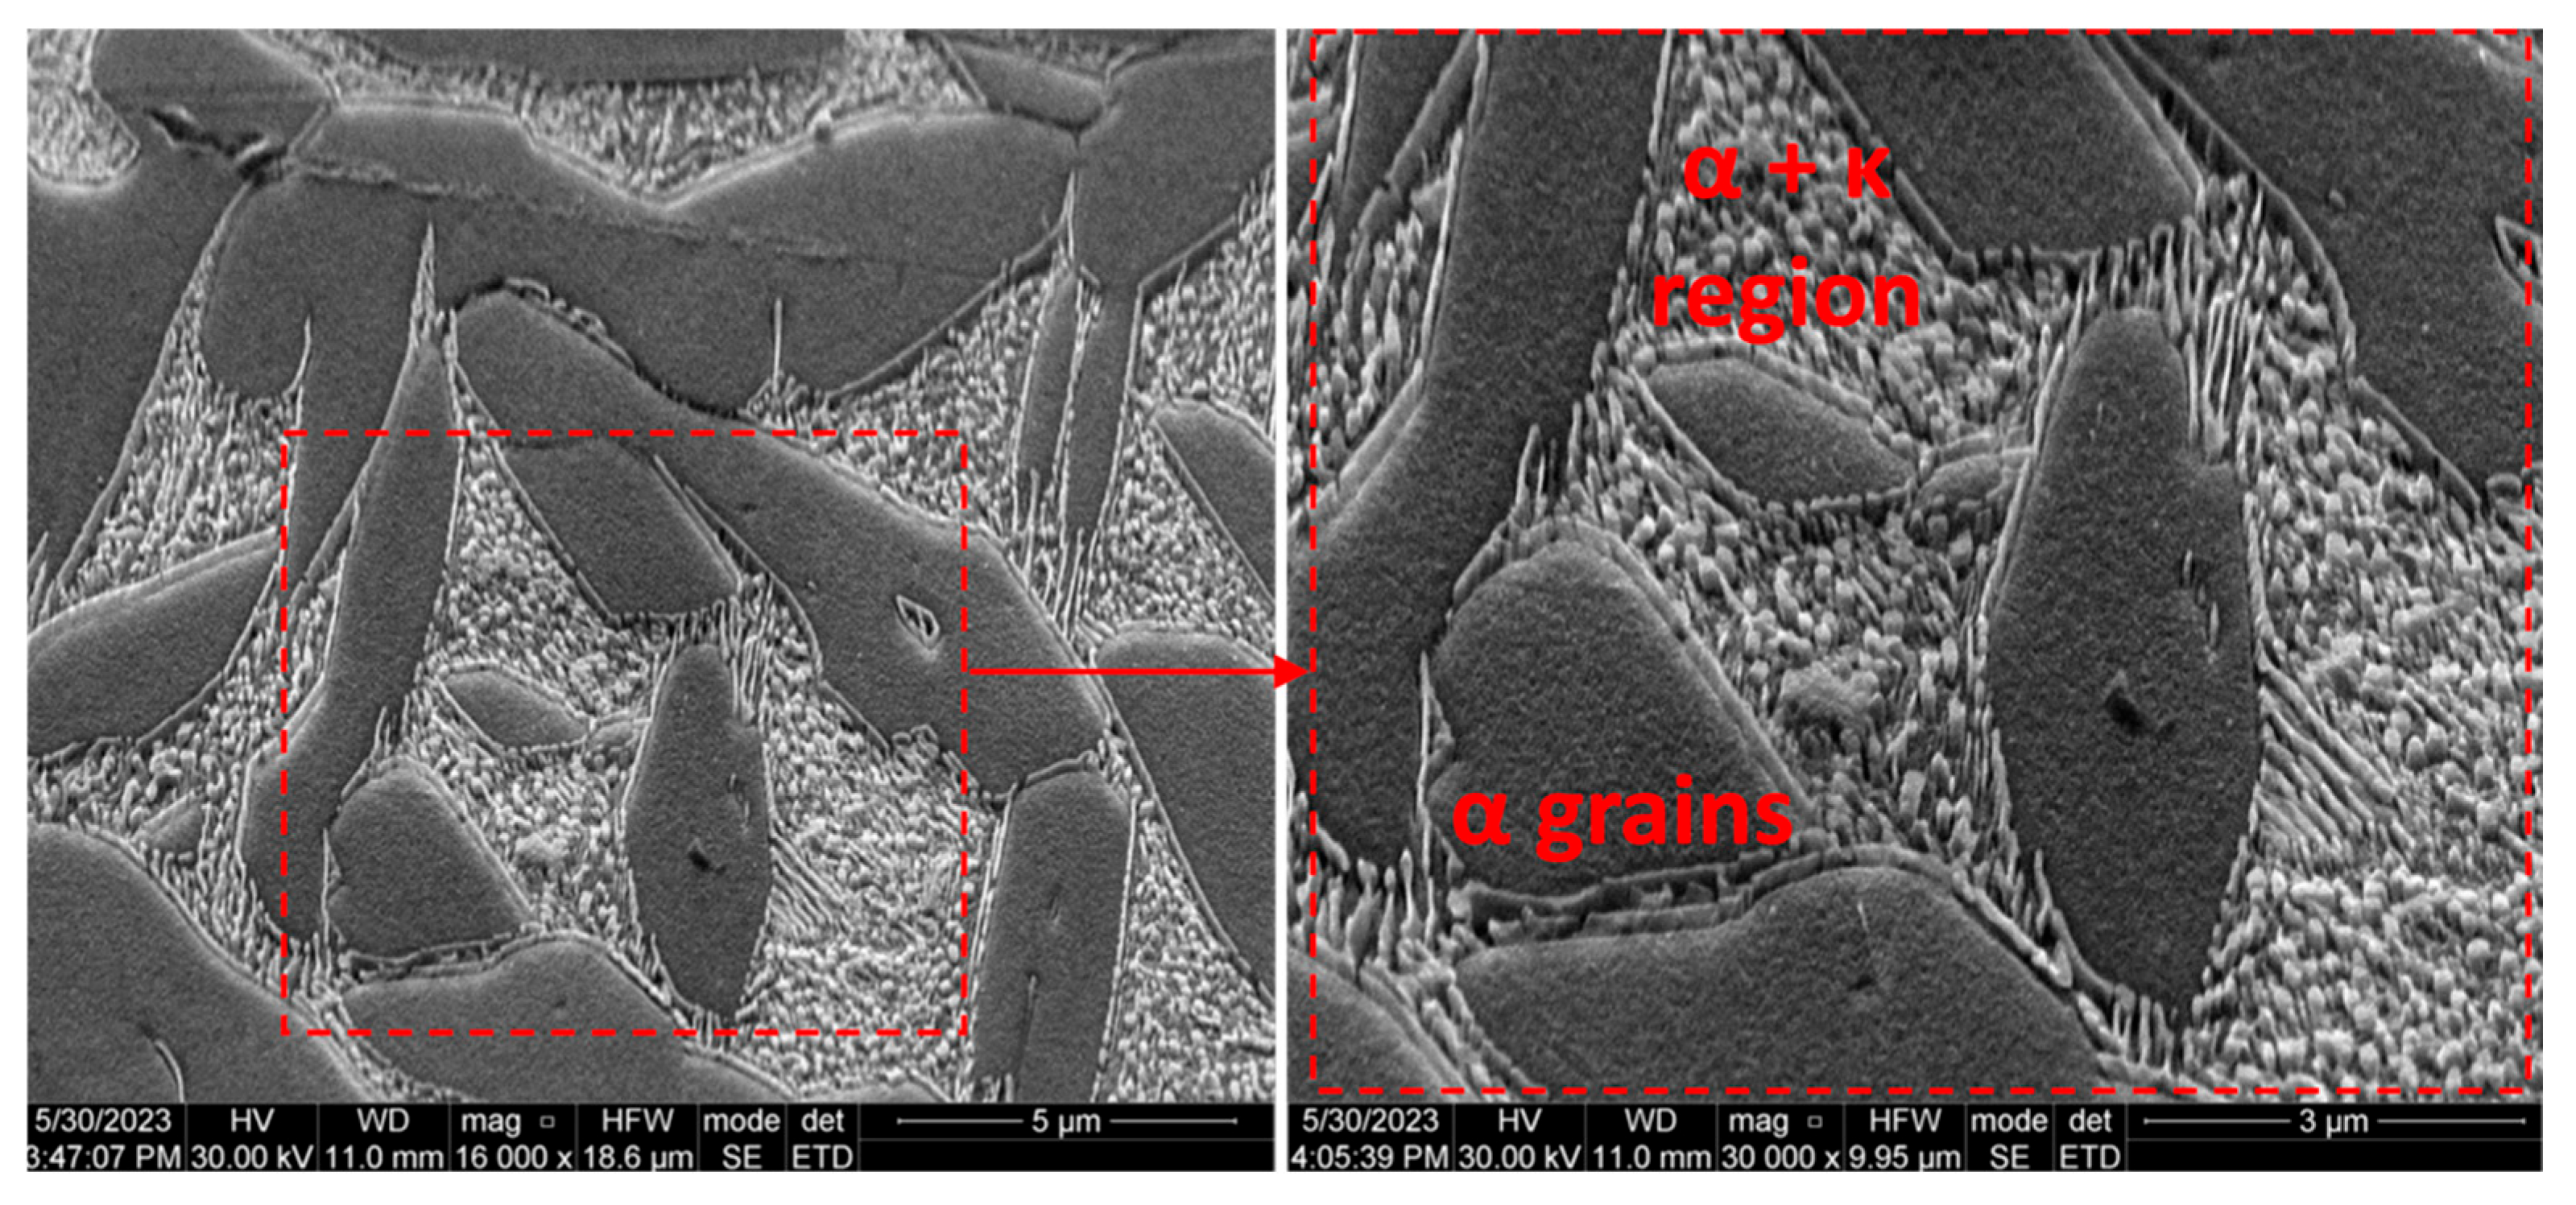
Closer examination with SEM revealed small, rounded features in the intergranular regions (Figure 4a–c,e). Comparison with the cast NAB (Figure 4d,f) shows similar features, although larger, more distinct, with some globular and some rounded. Additional etching and a greater beam voltage helped characterise the dark intergranular region further (Figure 5) and revealed that lamellar and globular features comprised the regions surrounding the larger grains.
Figure 4.
Micrographs of polished (a) XZ, (b) YZ and (c) XY orientations and (d) the cast reference. (e,f) show the magnified regions highlighted in (c,d) with the phases highlighted.
Figure 5.
SEM micrographs of an etched XZ sample, showing the interdendritic region consists of globular and lamellar features.
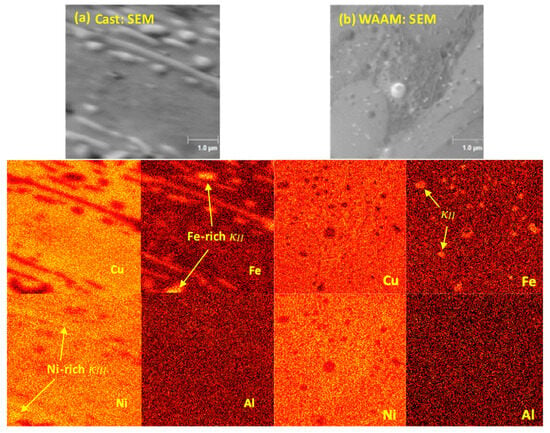
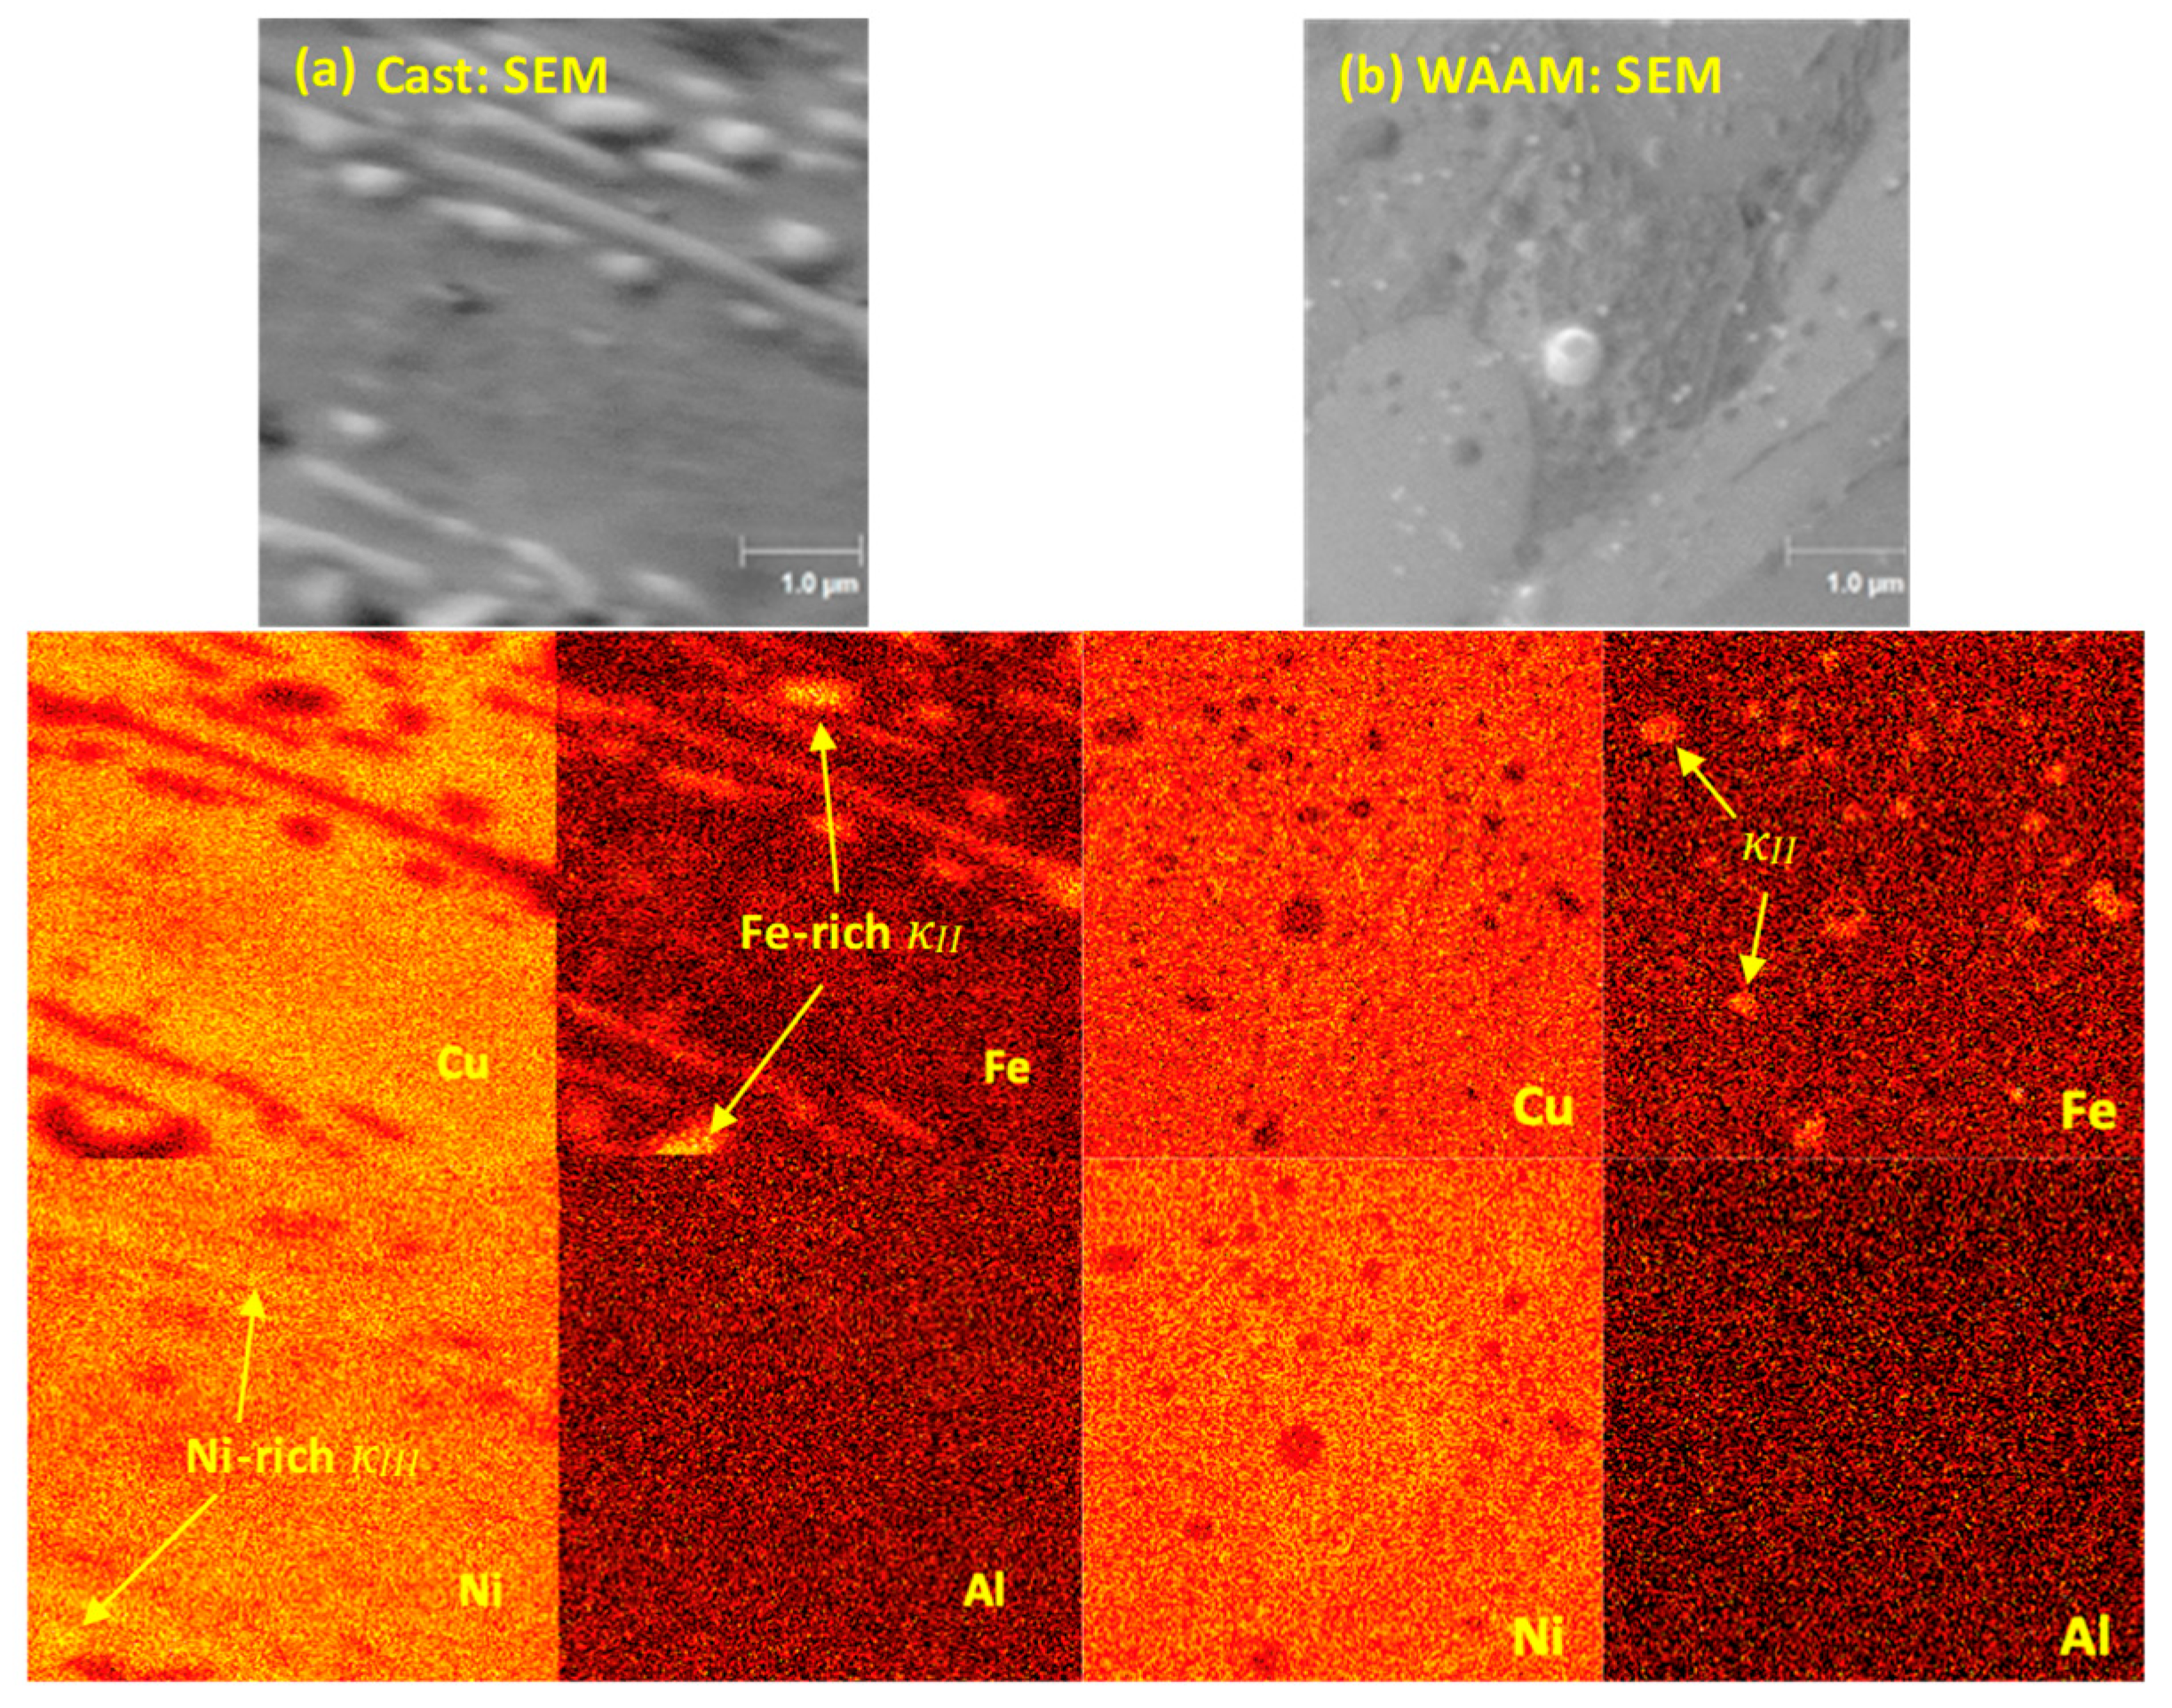
AES was also employed to characterise the elemental compositions of the surface features observed. AES elemental maps in Figure 6 show some segregation of the principal alloying elements, namely copper, aluminium, nickel, and iron. A relatively greater atomic concentration of copper was observed in the middle region of the corresponding cast SEM image where the light-coloured grain was identified. Furthermore, the regions with a lesser concentration of copper appeared to correlate with the rounded/lamellar features observed in the SEM image and are observed to be higher in nickel and iron instead. The lamellar features appeared greater in nickel and iron concentration and the rounded features appeared to have an increased concentration of iron and a decrease in nickel. The rounded features of the WAAM sample were also seen to exhibit greater iron and lesser nickel and copper concentrations and although the intergranular region appeared slightly greater in nickel, the sound-to-noise ratio was too insufficient to reveal these fine lamellar features. These characterisations indicate the light-coloured grains were likely the copper-rich, face-centred cubic α phase, and the lamellar features that congregate in the dark intergranular regions were likely the body-centred cubic nickel-rich κIII phase [8]. The iron-rich rounded particles were likely the reported κII or κIV phase, depending on their location within or outside the α phase, although further investigation with a technique such as electron backscatter diffraction would be needed to confirm their identities.
Figure 6.
AES mapping of (a) cast and (b) XY sample. Globular and lamellar features align with elemental map features, suggesting they may be different phases, specifically some iron and nickel (κIII) rich features and some just iron-rich features (κII).
3.2. Corrosion Results
3.2.1. Determining Corrosion Behaviour from Electrochemical Methods
The determination of a corrosion resistance from electrochemical means is based on finding the polarisation resistance (Rp), a value that describes the electrical resistance in the transfer of charges at the electrode–electrolyte interface [34]. The linear potential sweep (LPS) method is quick and commonly used, in which a small potential perturbation is applied around the OCP, causing a pseudo-linear current response that can be used to determine Rp [34]. Electrochemical impedance is another technique commonly seen in corrosion studies to estimate Rp and also provides mechanistic information on the corrosion process [35]. Further detail about EIS and extracting Rp is explained in Section 3.2.3.
3.2.2. Corrosion Behaviour of Cast and WAAM NAB
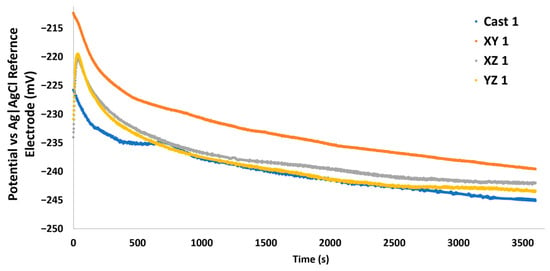
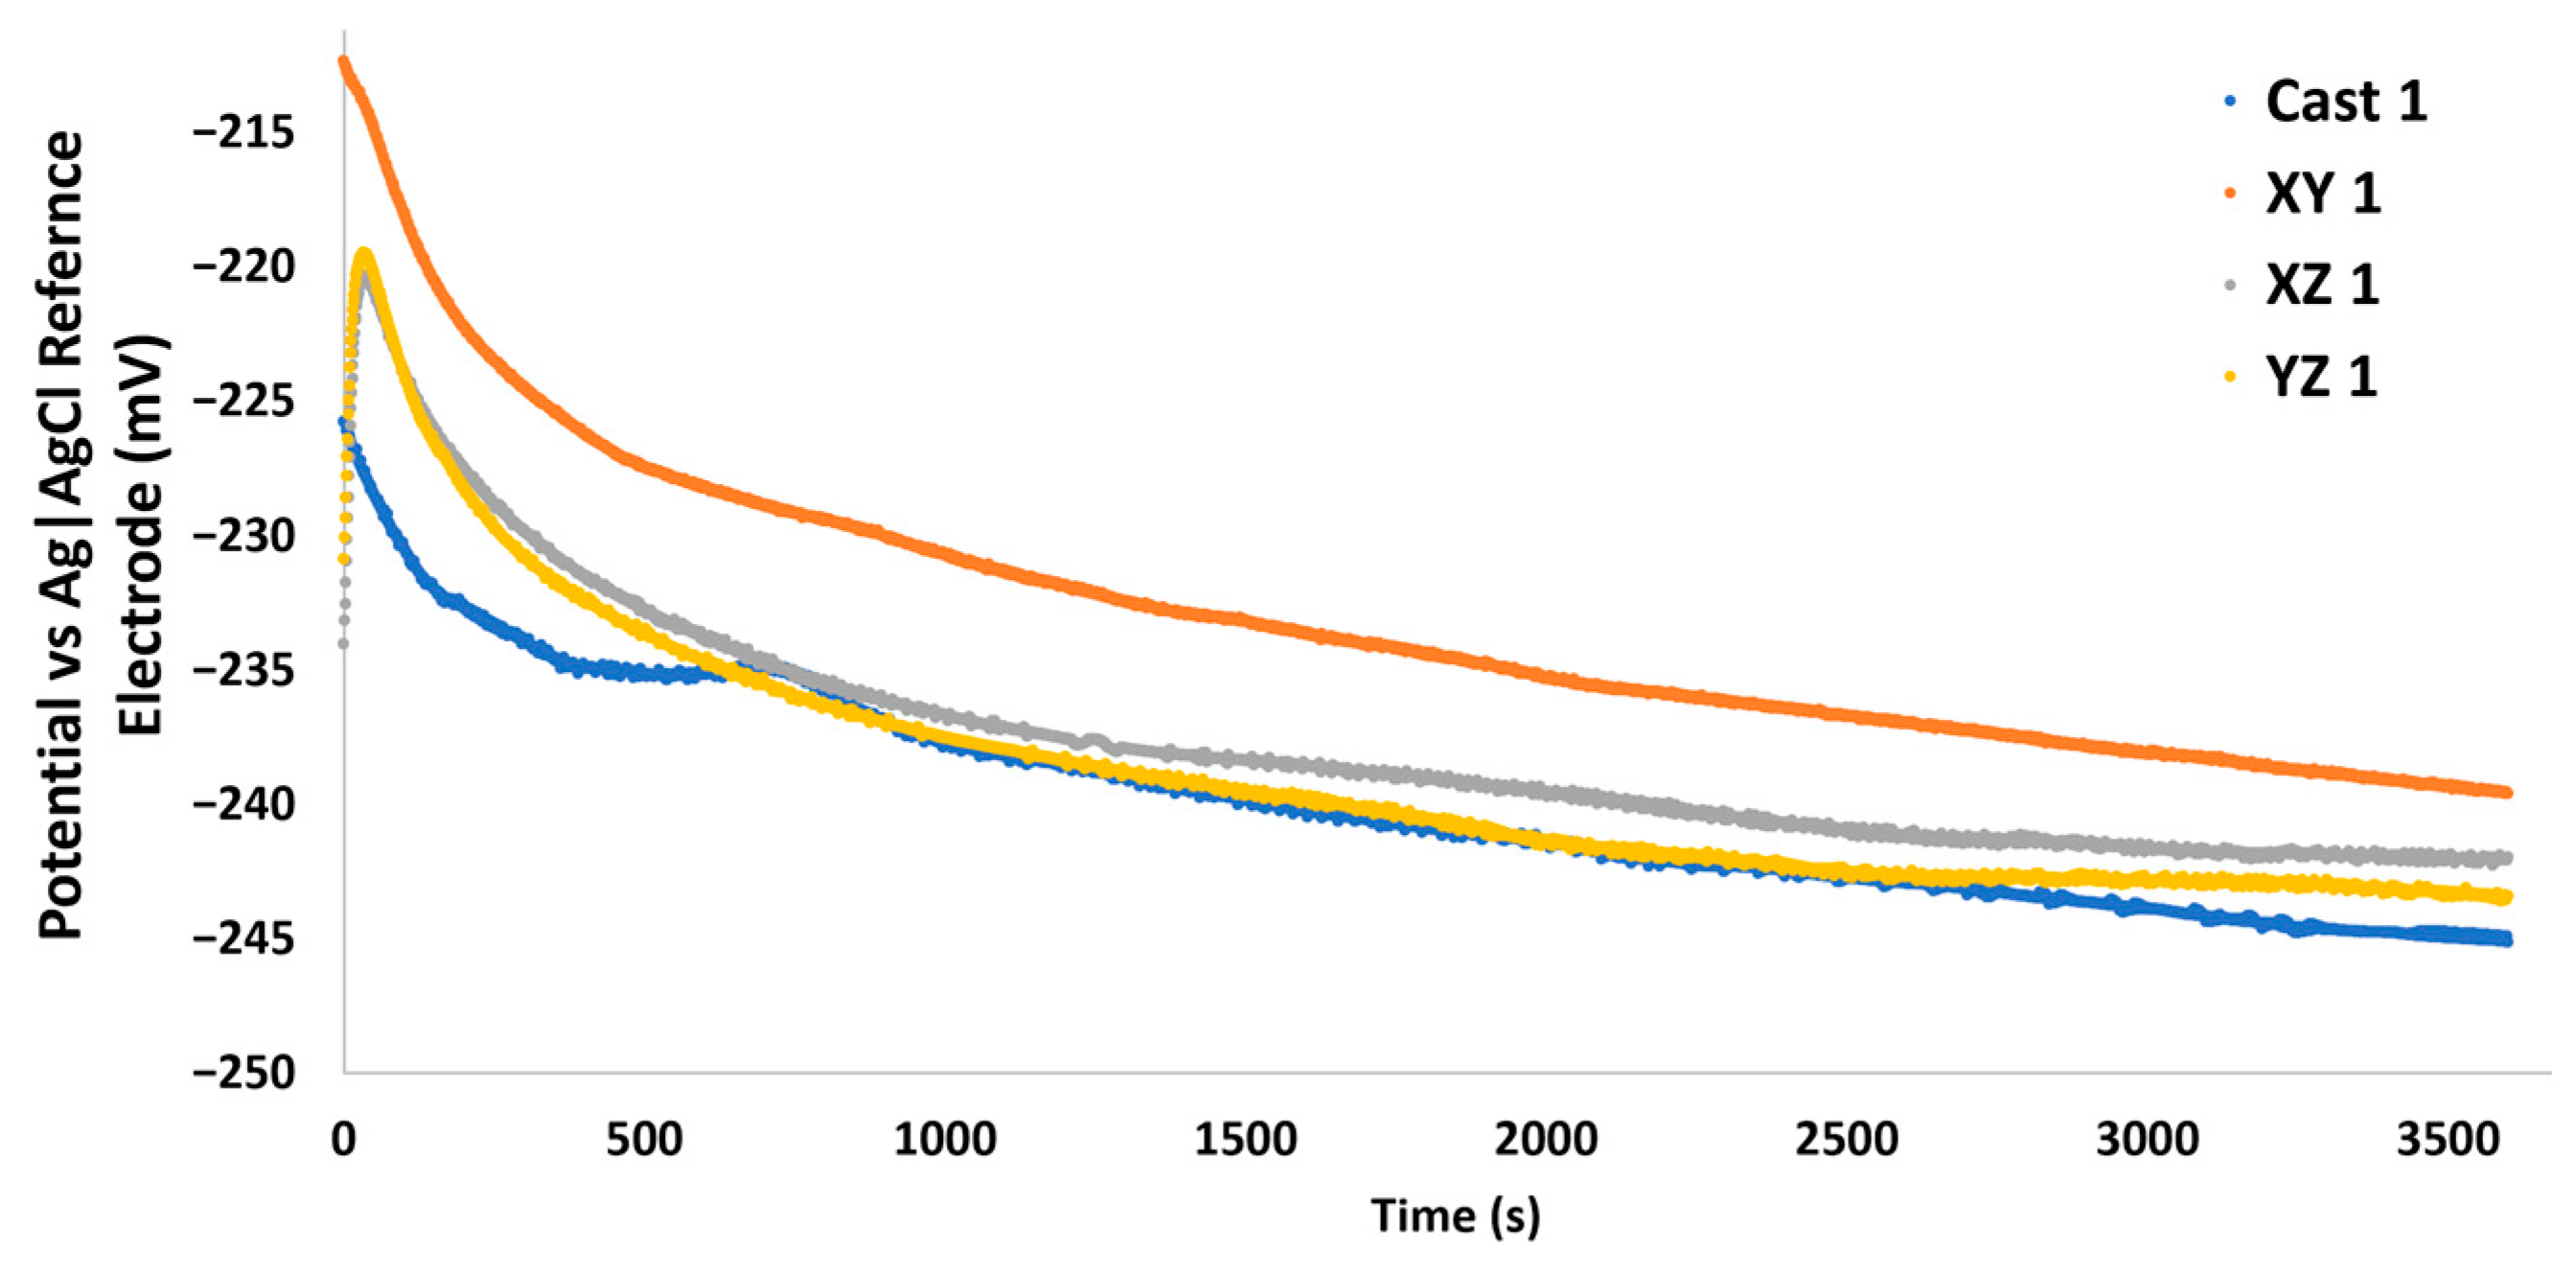
The corrosion behaviour was studied using 3.5% NaCl solution as an approximation for seawater and samples were mounted in epoxy and covered in a tape mask with a controlled approximately 0.28 cm2 exposed surface area. Samples went through a one-hour stabilisation period (Figure 7) during which the OCP was monitored by the potential difference between the working and reference electrode. All OCPs stabilised by the end of the observation period, and no significant difference was seen between cast and WAAM average OCPs.
Figure 7.
Open circuit potentials monitored over time for the first set of samples.
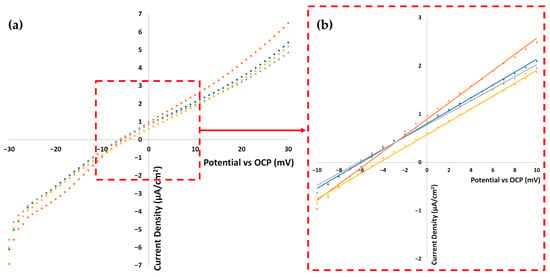
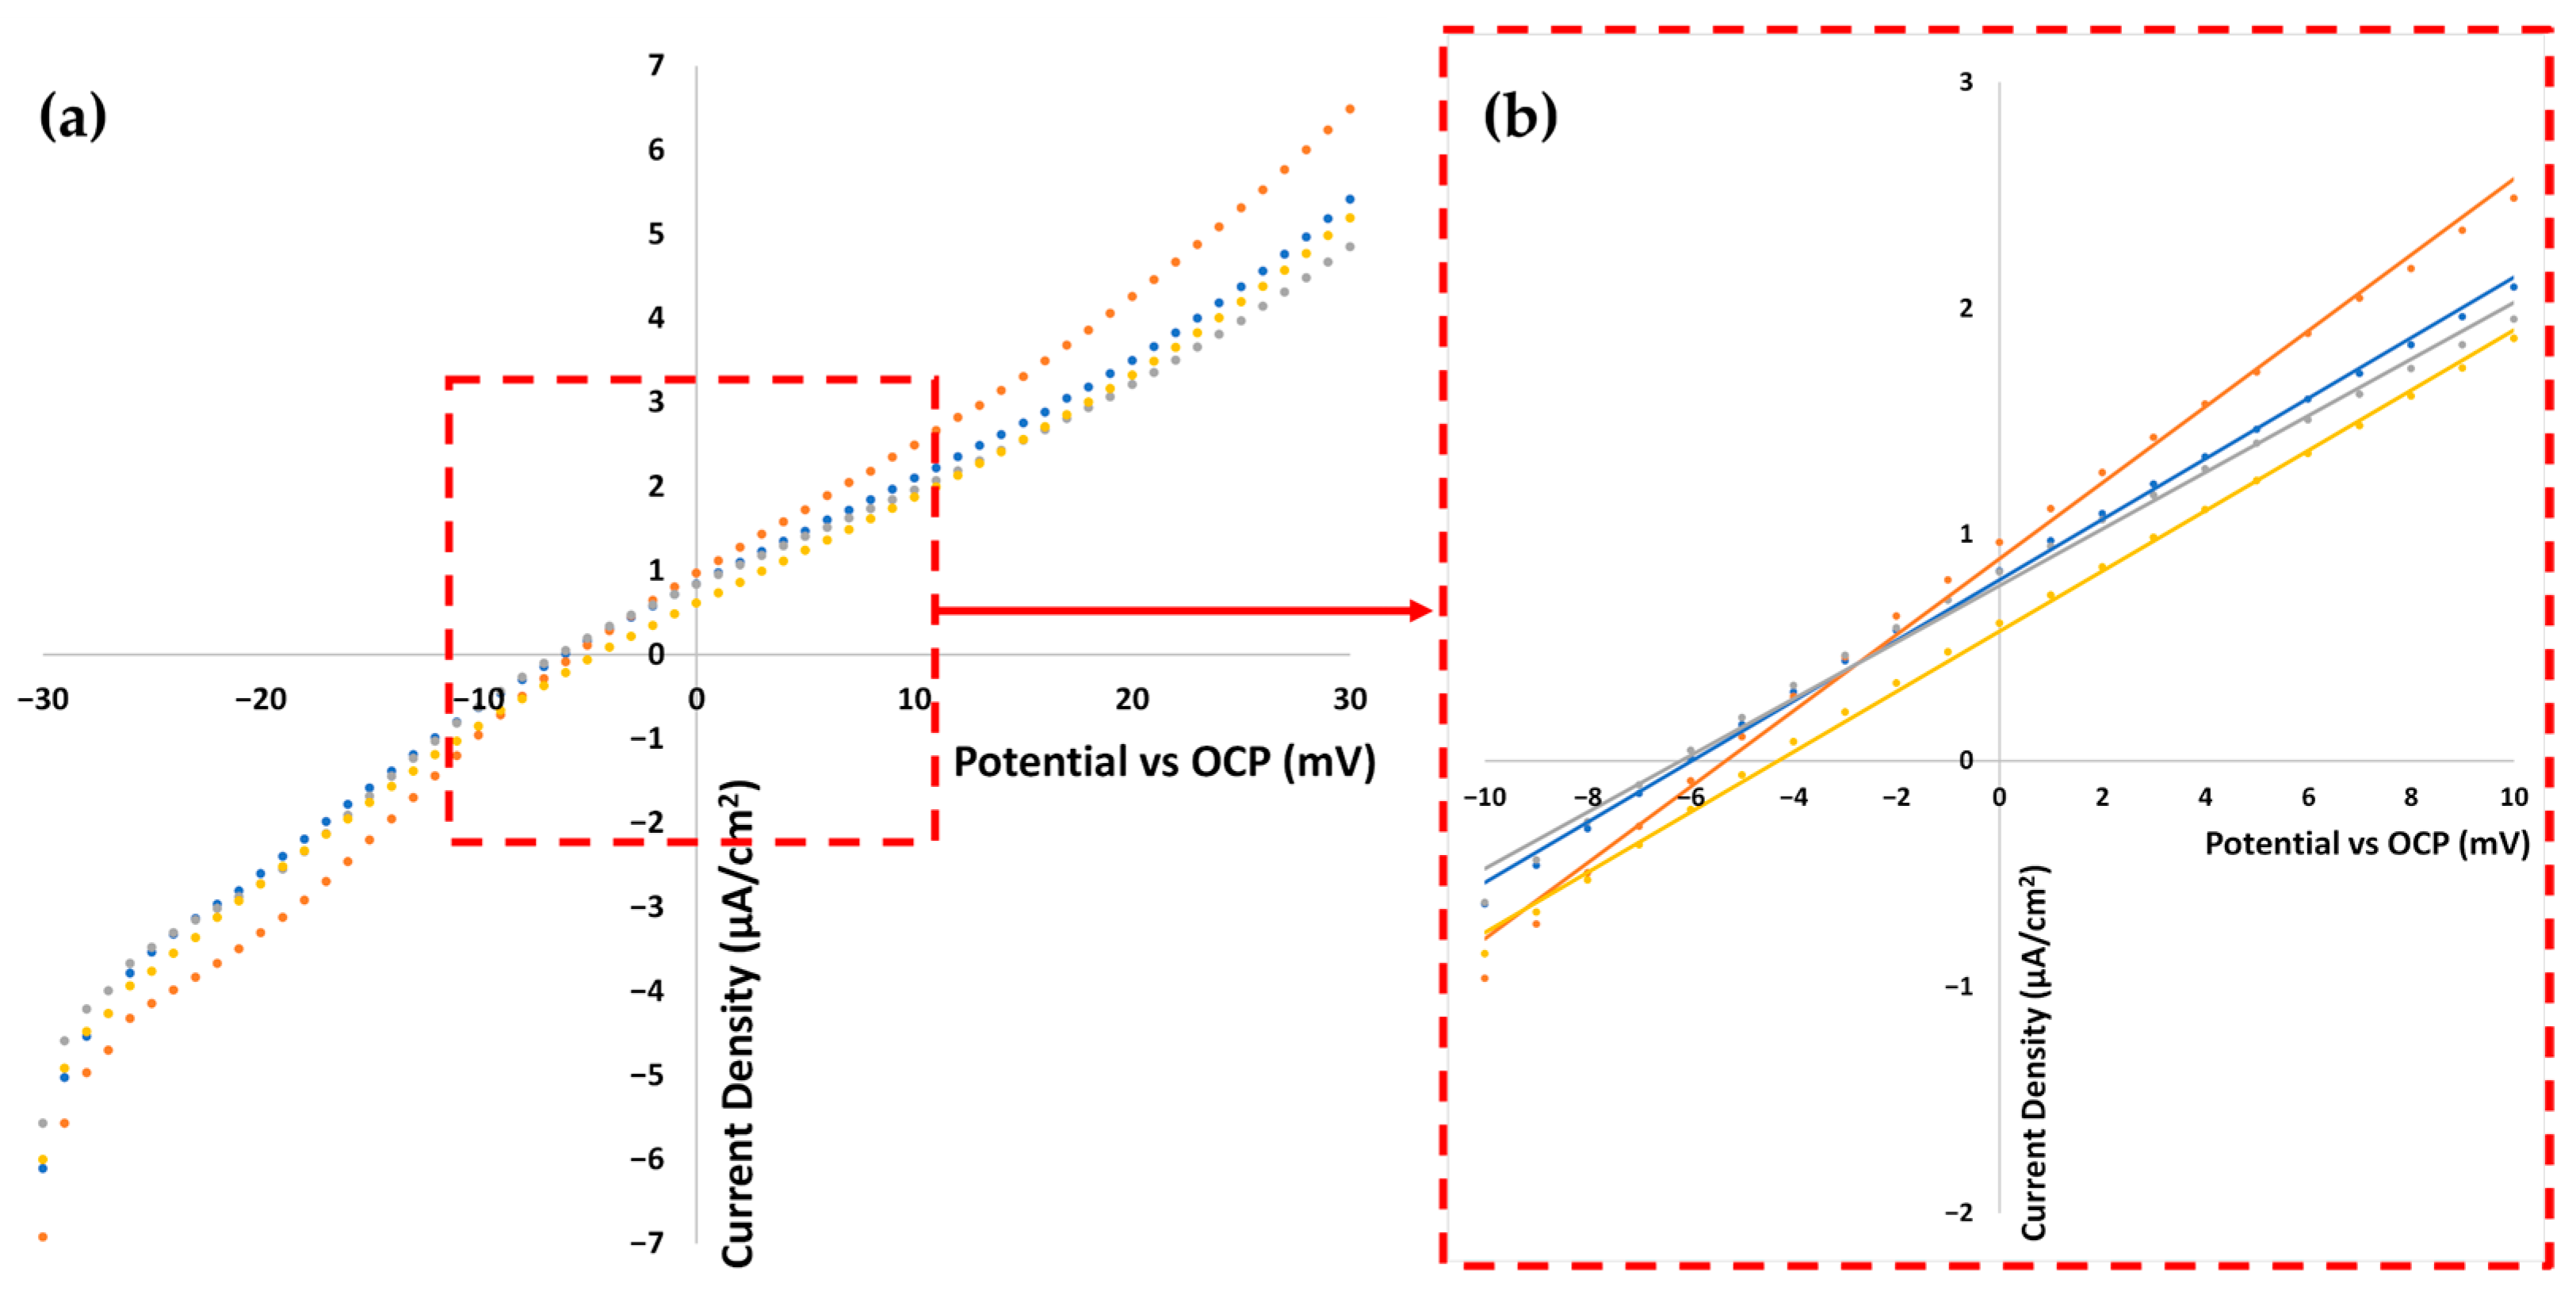
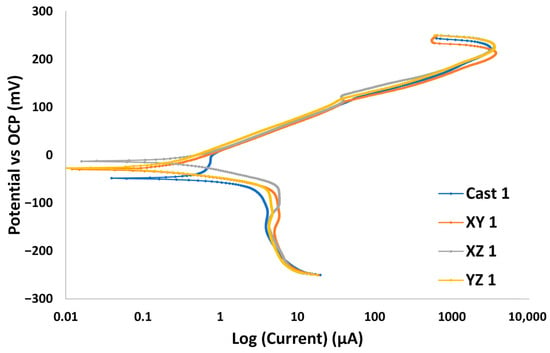
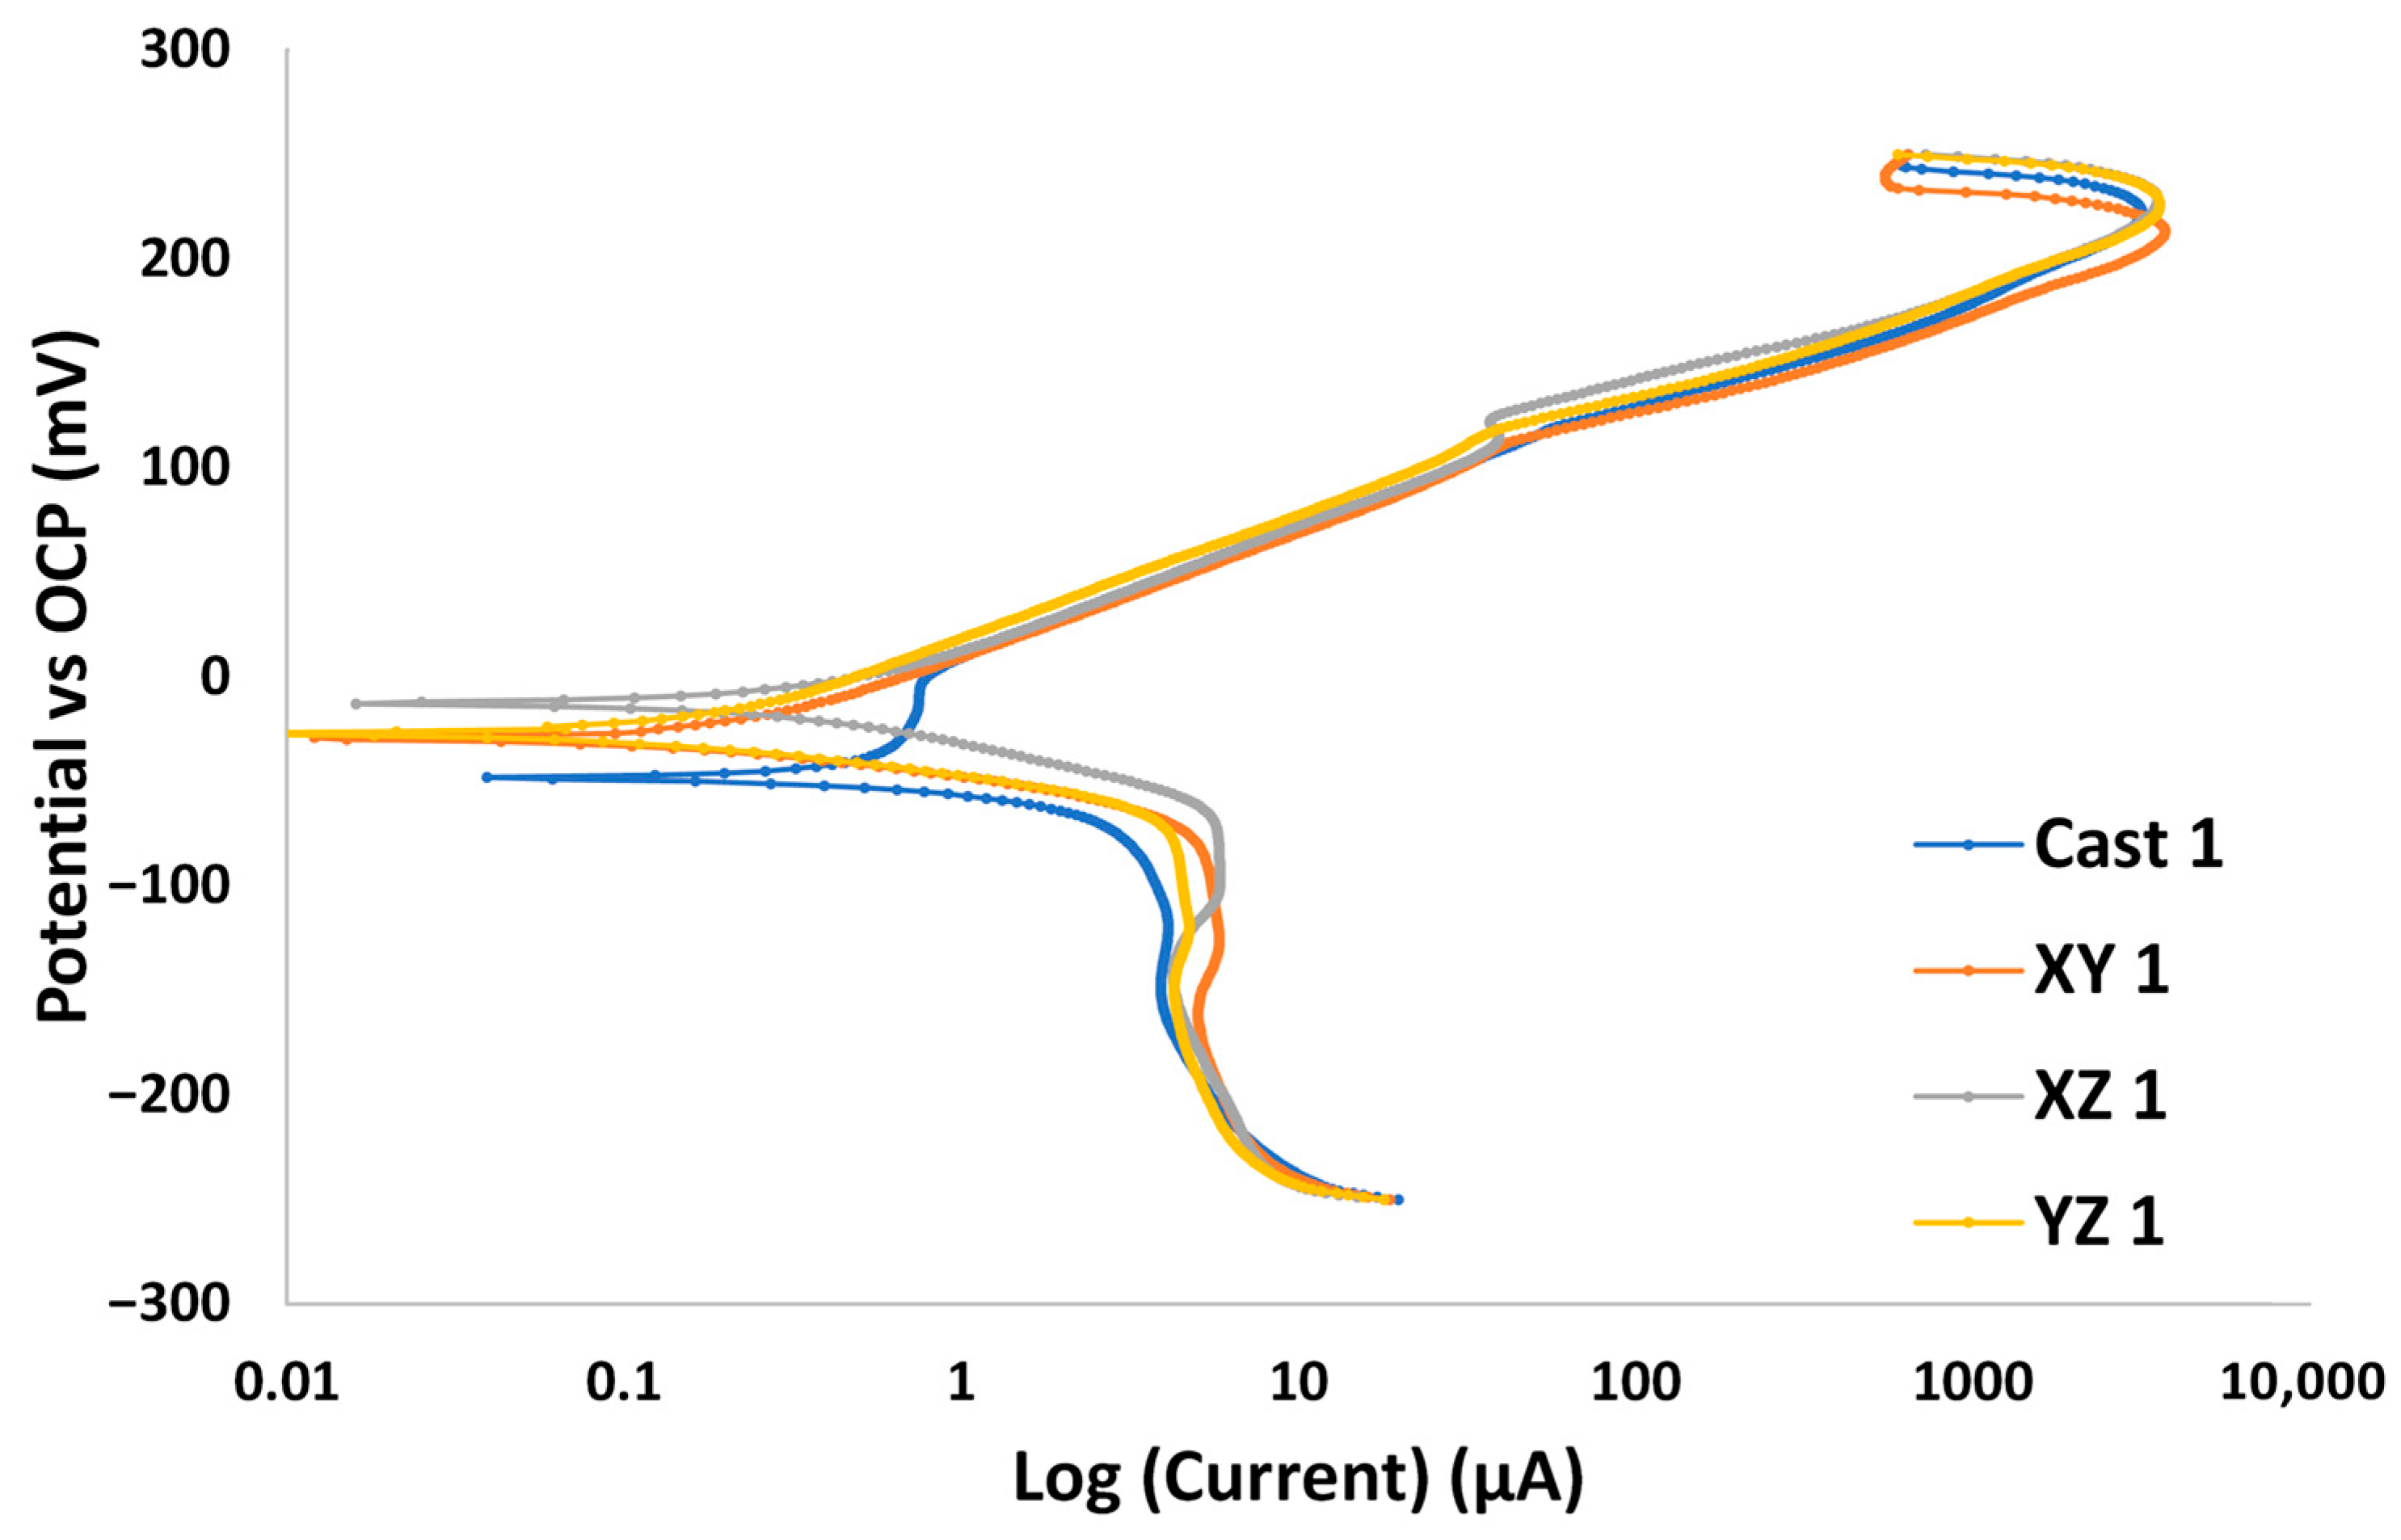
Figure 8 depicts the results from the LPS process for the first set of samples. The responses show non-linearity at the starting ends of the scanned region likely due to non-stationary effects upon measurement initiation [36]. A reduced ±10 mV region around the OCP shows a more linear behaviour and was used to determine the Rp values. The anodic and cathodic constants were extrapolated from the Tafel plot shown in Figure 9 and appear similar across all NAB samples. The current decrease seen in the +200 mV region of the plot may suggest passivation is occurring; however, a larger potential range is needed to determine if the current decreases further. In the cathodic region (where the potential sweeps across negative values), the current stops increasing linearly despite the applied overpotential, suggesting a limiting of the cathodic reaction, such as from a diffusion process.
Figure 8.
(a) Current–voltage response of the LPS data of cast and WAAM samples with (b) trendlines applied to the linear ±10 mV region. The polarisation resistance, Rp is represented by the reciprocal of the gradient.
Figure 9.
Tafel plot for cast and WAAM samples, showing the current response from a ±250 mV perturbation. It displays where the anodic and cathodic reactions are at equilibrium, the anodic (ba) and cathodic (bc) reaction rate slopes, as well as regions of passivity, characterised by a drop in current.
3.2.3. Electrochemical Impedance Spectroscopy
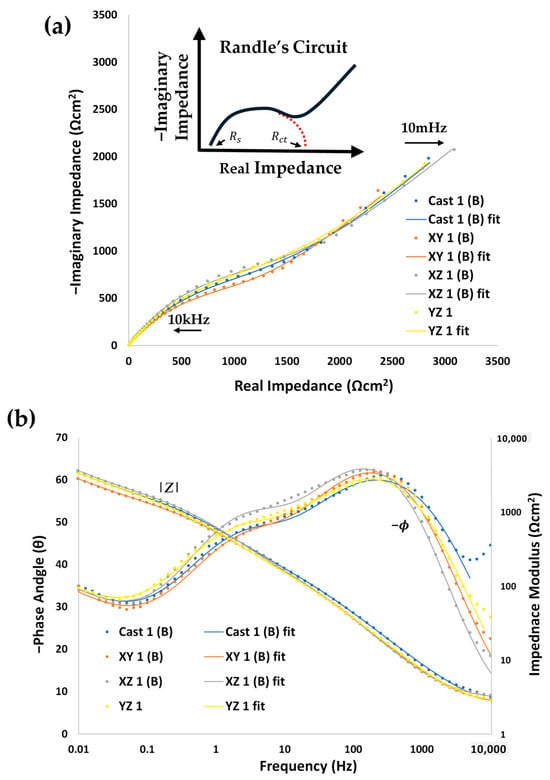
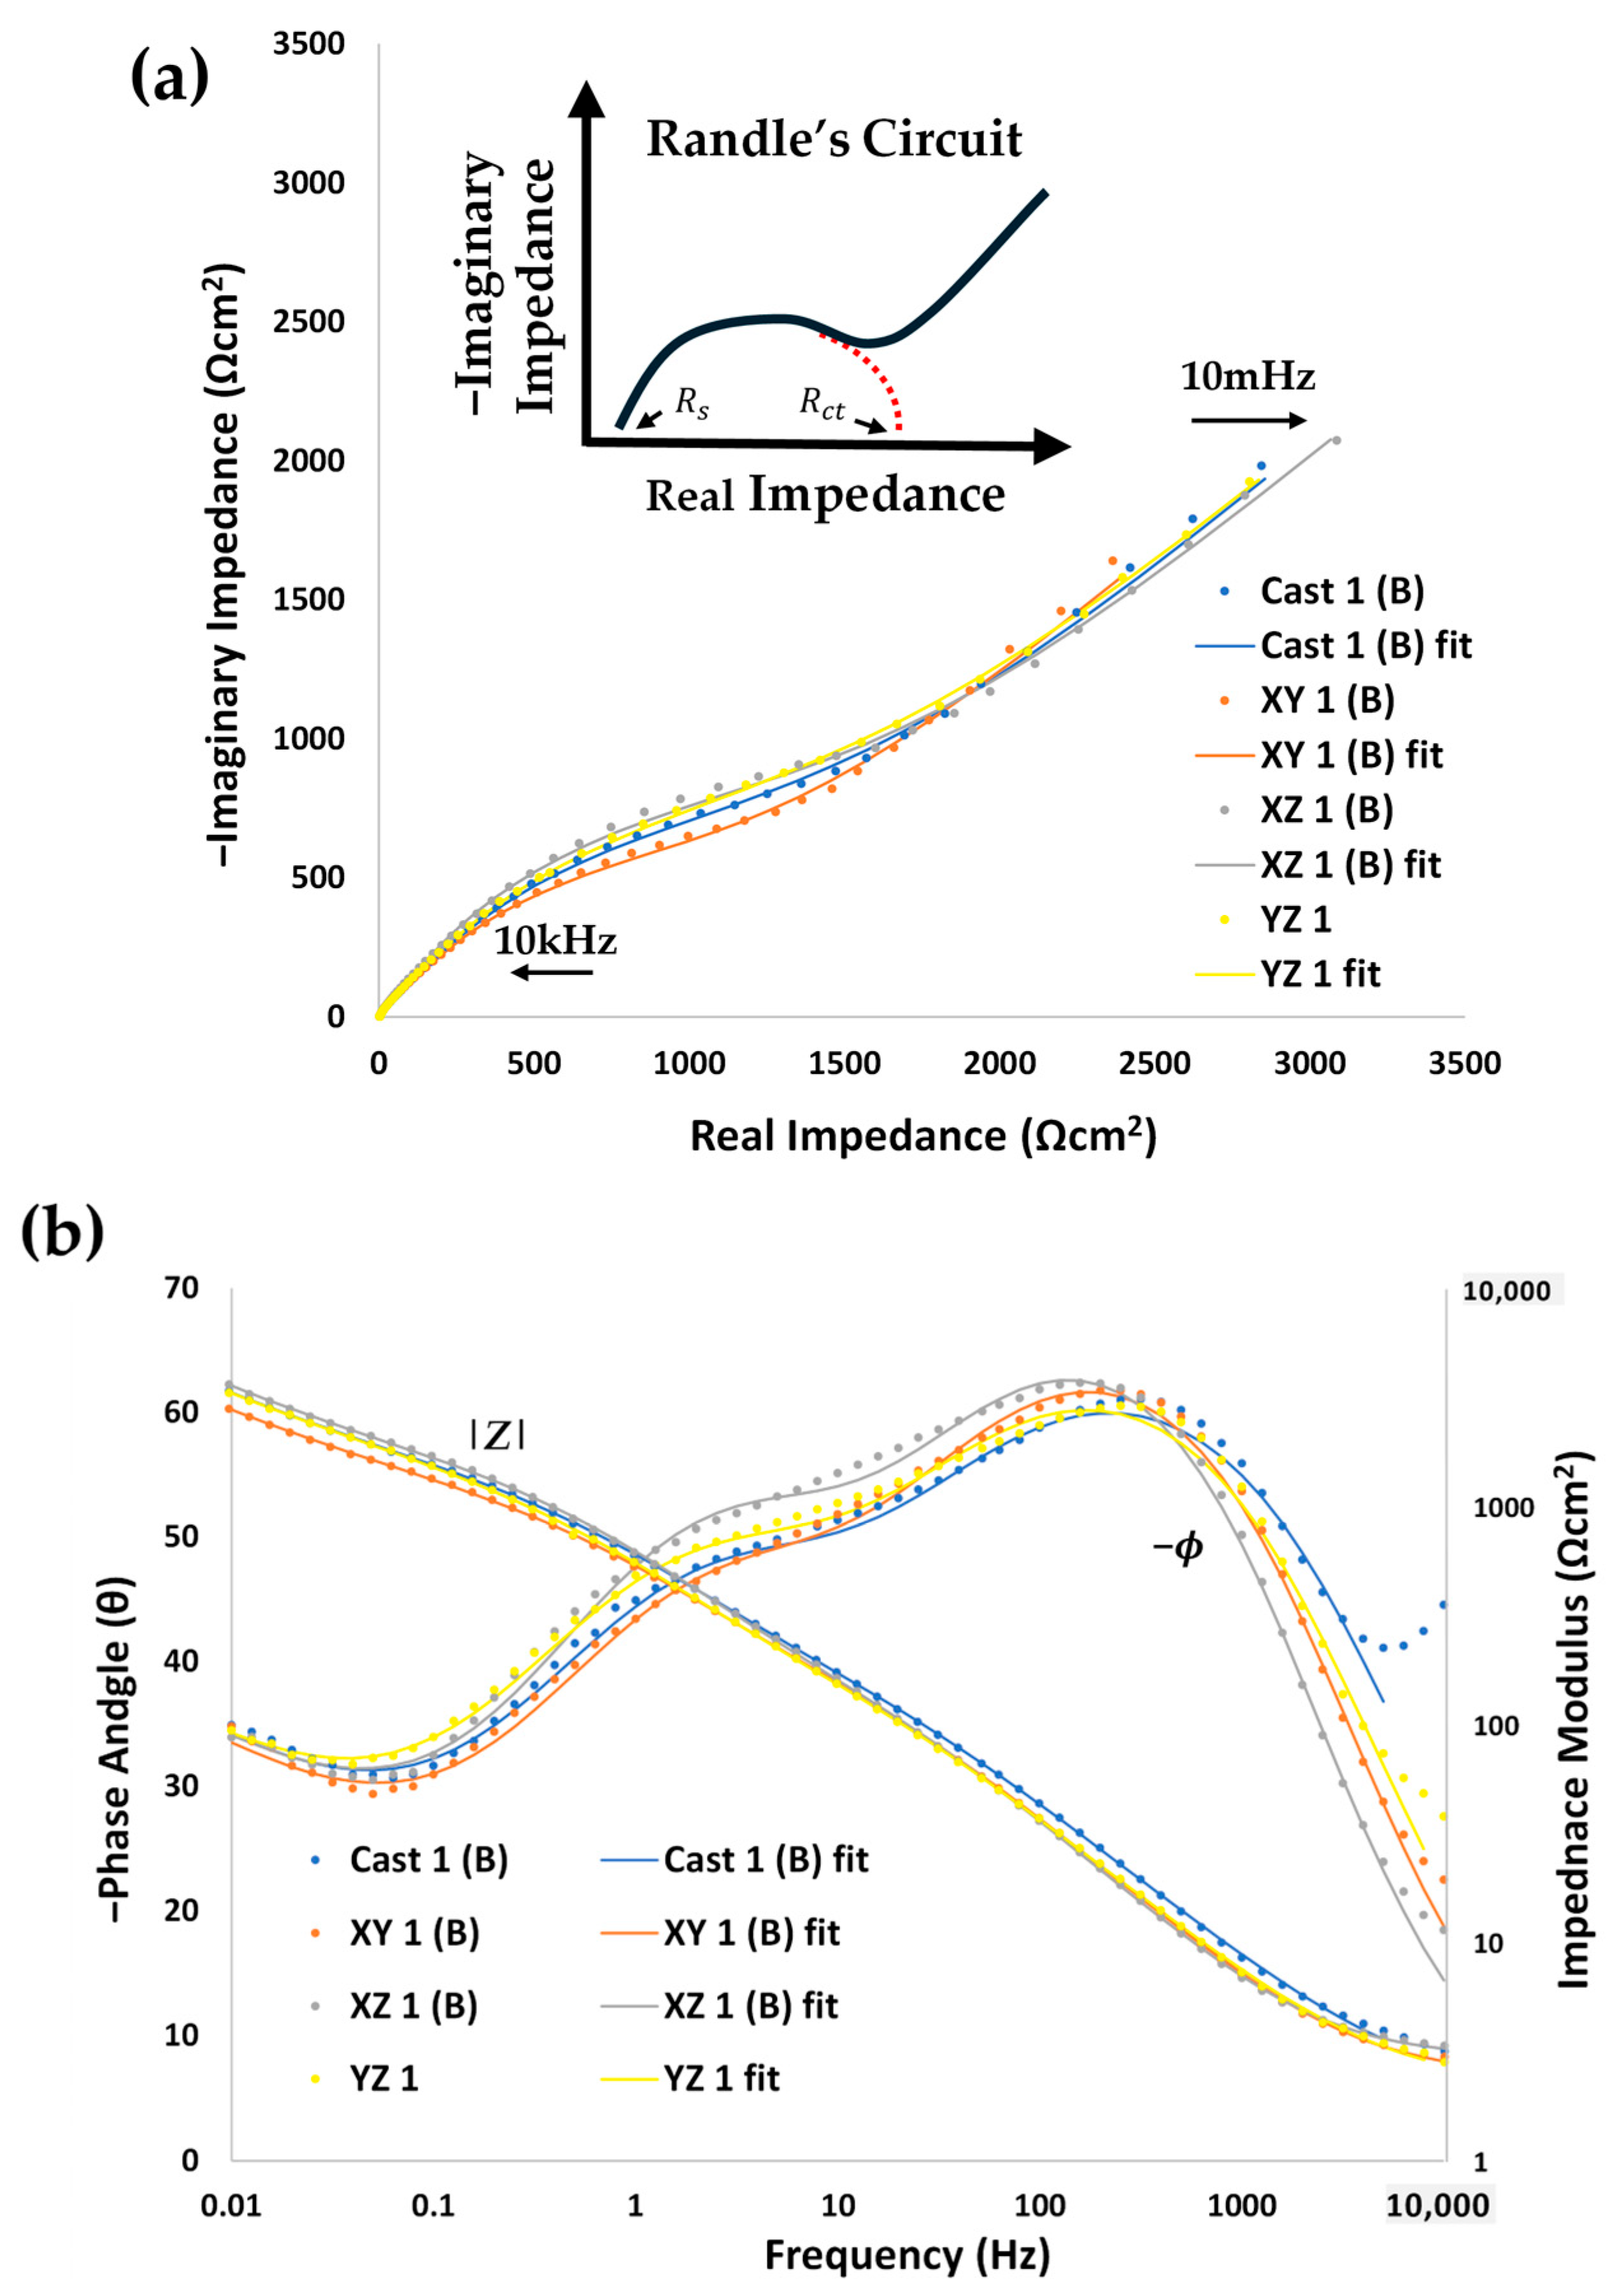
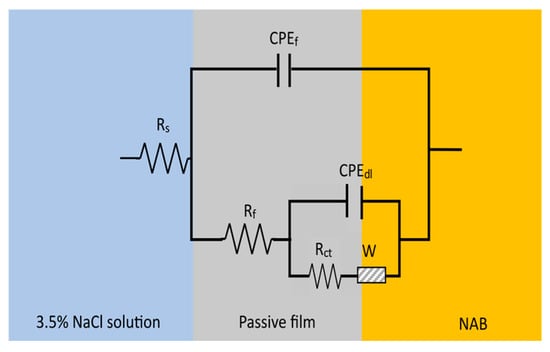
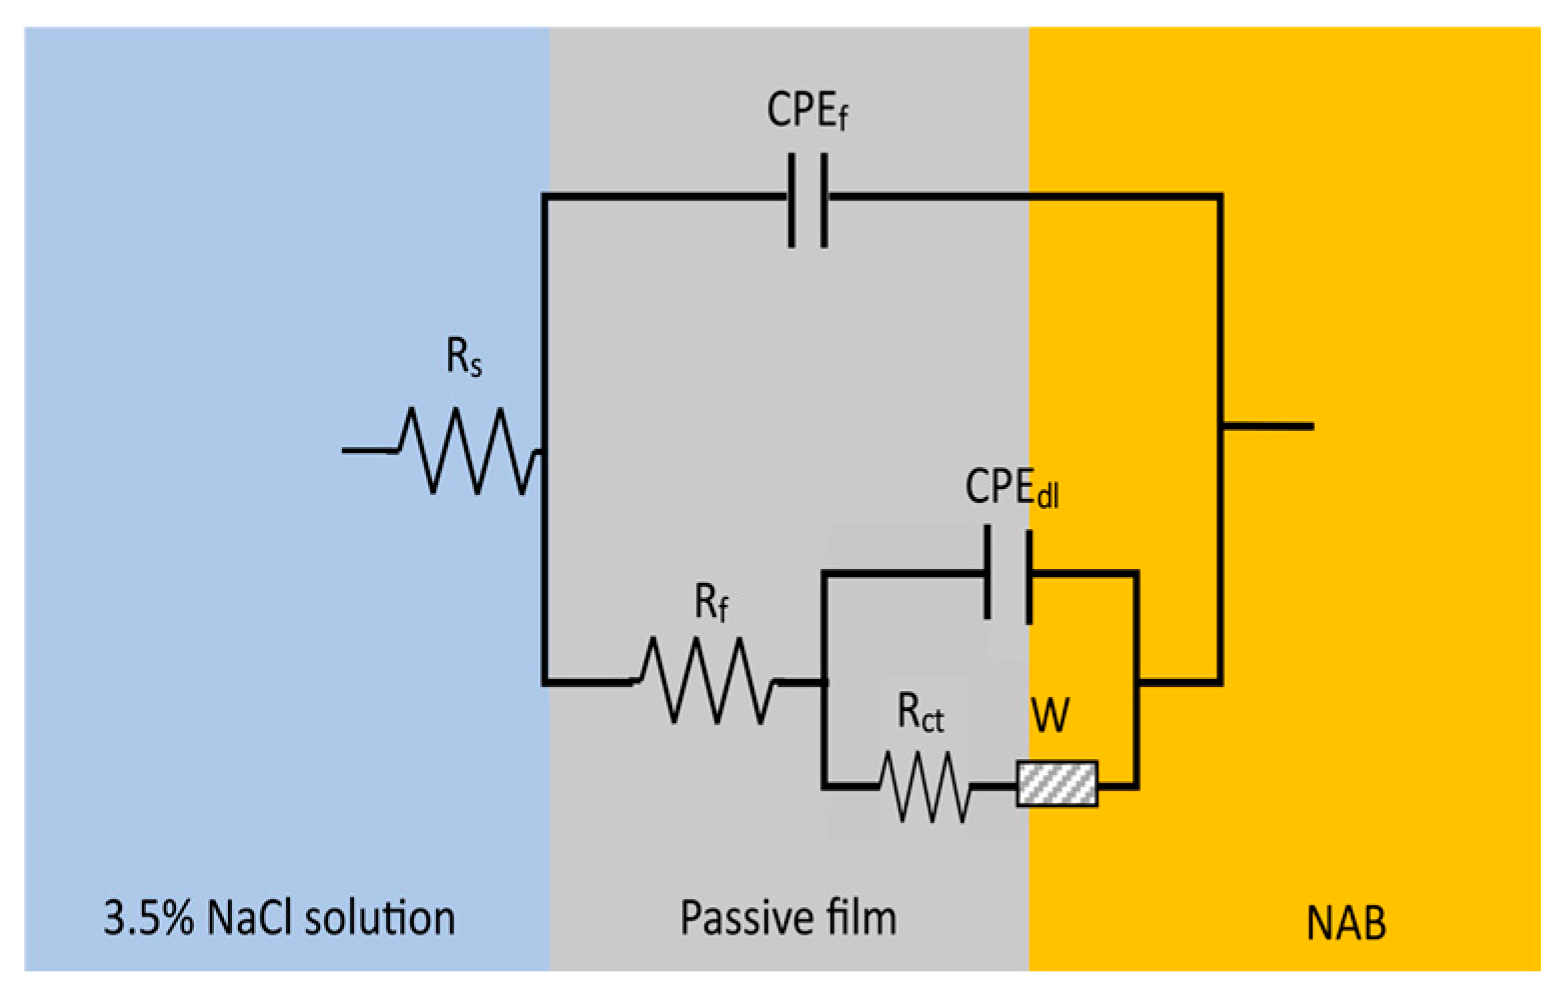
Electrochemical impedance spectroscopy (EIS) is often used to study the behaviour of the surface–solution interface in corroding systems. The impedance of the system is measured over a large frequency range to characterise the impedance response’s dependence on frequency and thus separate its resistive, capacitive, and inductive components [34]. In Figure 10, the shapes of the cast and the different orientations of the WAAM appear similar. The shapes of the Nyquist plots appear semi-circular in the medium to high frequency range and linear in the lower frequency range. These shapes are also matched for both forwards and reversed frequency sweep directions for all measurements suggesting reliable and valid data. This semi-circular behaviour is indicative of a double layer capacitance and a charge transfer resistance associated with the Faradaic reactions, both occurring at the metal electrode’s surface and thus in parallel. Additionally, however, a solution resistance is also present due to the non-zero resistance at high frequencies and a low-frequency linear region is usually associated with diffusion. This behaviour is often modelled by a Randle’s circuit; however, two peaks are observed in the phase shift response of the bode plots, suggesting a modification is needed. Other researchers use a nested Randle’s circuit with additional circuit elements corresponding to the properties of a passive film [37], shown in Figure 11. Despite other researchers using this equivalent circuit to fit their broadened phase shift peak, a broadened peak shoulder this stark is not often seen in Bode plots of cast or additively manufactured NAB in 3.5% NaCl, although it may be suggestive of increased stability [13].
Figure 10.
(a) Nyquist and (b) Bode Plot showing the phase shift and impedance modulus over the frequency range for the first sample from each sample type. A diagram of the features of a Randle’s Circuit is also shown in (a). Each impedance frequency sweep was done twice, to minimise errors: best of the two were included. Some outliers were excluded from the fitting—i.e., the high frequency artefacts in the cast. The first few datapoints shown here display the most extreme case of outlier exclusion.
Figure 11.
Schematic of the equivalent circuit used for modelling EIS data.
In Figure 11 Rs, Rf, and Rct are the resistances associated with the solution, passive film, and charge transfer process, respectively. CPEf and CPEdl are constant phase elements used to model the capacitance of the passive film and the electrode double layer. W is the Warburg impedance, a non-real circuit element used to model the diffusion. Constant phase elements (CPEs) are used instead of a regular capacitor to reflect the non-ideal nature of the physical capacitor, containing variables Q and n; the magnitude and an ideality factor between 0 and 1 (1 being for an ideal capacitor). The capacitance of a CPE can be calculated using the equation below when the CPE is in parallel with a resistor and is not too low (n > 0.75) [38].
The values in Table 4 allow quantification and comparison of the physicochemical processes of the cast and WAAM samples to be made. Considering the standard deviations in the averages, most of the parameters appear similar. The film and charge transfer resistances of cast and all WAAM orientations were within measurement uncertainty suggesting similar protections. The film and surface double layer capacitances also appeared similar across all samples studied.
Table 4.
Results from equivalent circuit fitting with their standard deviations. Values in parentheses are one standard deviation from three samples per orientation.
Values of nf were found in the range of 0.77–0.80 and thus there was not much difference in the ideality factor for the films present on the WAAM and cast surfaces. Chi-Squared values were all in the 10−4 range and all uncertainty values were below 20%, indicating good fits with the equivalent circuit chosen. Fitting with a simple Randle’s circuit was also attempted; however, the fitting statistics were consistently poorer and was not able to fit the observed phase shift shapes. The first EIS scan was generally used for fitting, though, if an anomalous datapoint was encountered, the reversed EIS scan was fit instead. An anomalous datapoint was indicated by single datapoint that sharply differed from the rest of the smooth dataset. High frequency artefacts were also encountered in the data likely due to stray capacitance in the reference electrode. Separate investigation of the artefact showed its removal when a different potentiostat was used (Gamry Instruments, Warminster, PA, USA) on the same setup as well as when a shunt connected in series to the reference electrode was used.
Polarisation resistance is extracted from EIS data via two methods. The “model” method determines Rp from Rf and Rct, after fitting the experimental data with the curve predicted for the equivalent circuit [37]. The other is extracted from the magnitude of the impedance as the frequency tends towards zero, which will be termed the EIS method, shown below [35]. As the frequency tends towards zero, the impedance should theoretically tend towards the real, resistive components only.
EIS: Rp = |Z|ω→0 − |Z|ω→∞
EIS Model: Rp = Rf + Rct
Rp values were extracted from EIS and LPS data and presented in Table 5. Triplicate averages of individual samples from each orientation are shown in bold, with their respective one standard deviation in parentheses. No clear difference can be seen between the cast and WAAM Rp values determined by any of the three methods.
Table 5.
Average electrochemical values. Values in parentheses are one standard deviation calculated from measurements of three samples per orientation.
4. Discussion
4.1. Microstructure
The microstructure of WAAM showed bead layers of coarse and fine microstructures, as reported previously in the literature [18,19,20,21,22]. This is attributed to a reheating from the deposition of the subsequent layer above or an adjacent weld pass causes a heat-affected zone because the temperature is sufficient to alter the microstructure, causing possible phase transitions or grain size changes—depending on the maximum temperature reached [39]. The smaller amount and size of κ phase seen in the WAAM samples is thought to be due to faster cooling in WAAM compared to that in the cast. A faster cooling rate decreases the time spent in elevated temperature ranges in which these phases precipitate [40]. WAAM NAB in this study contains microstructural features identified by others in the literature as both positive and negative. NAB surfaces with more homogeneous microstructures lead to more uniform passive films, and better corrosion resistance [41]. The greater homogeneity in elemental and phase distribution seen in WAAM may then explain a part of the corrosion behaviour. On the other hand, heterogeneities in grain structure resulting from complex heat-affected zones and excess α + κlll eutectic may also contribute, negatively, to the corrosion behaviour [13].
4.2. Corrosion
In pH neutral, aerated 3.5% NaCl, NAB is known to undergo a metal dissolution oxidation reaction coupled with an oxygen reduction reaction [42]. The reactions for the two main alloying elements copper and aluminium [42,43], along with the oxygen reduction reaction, are
Cu(s) → Cu+(aq) + e− and Cu(s) + Cl−(aq) → CuCl(aq) + e−
Al(s) + 4Cl−(aq) → AlCl4−(aq) + 3e−
O2(g) + 2H2O(l) +4e− → 4OH−(aq)
After some time, these metal chloride anions react with other species to form oxides and hydroxides that make up the passive film, such as shown below [13].
2CuCl2−(aq) + 2OH−(aq) → Cu2O(s) + H2O(l) + 4Cl−(aq)
2AlCl4−(aq) + 3H2O(l) → Al2O3(s) + 8Cl−(aq) + 6H+(aq)
The beginnings of passive film formation are supported by the EIS results, specifically the peaks observed in the phase shifts. The corrosion reactions are observed to be controlled by a charge transfer process, which is the transfer of electrons in the above reactions. The reactions, however, are also seen to be mass transfer (diffusion)-controlled. This is a result of the reactions being limited by the diffusion of reactants (mainly O2) to the surface as well as the products (CuCl−, etc.) away from the surface of the electrode [44]. This helps to explain the discrepancies in the values of Rp determined by the three methods. Rp is derived from LPS via measurement of the total current response which would be limited by diffusion. Extracting Rp from EIS, on the other hand, is less simple. Equating Rp to the resistive elements in the equivalent circuit, i.e., Rp = Rf + Rct, ignores any diffusional control and hence explains the increased corrosion suggested by the lower model Rp values in Table 5. The other method of attaining Rp via the magnitude of the impedance at the end frequencies encompasses the low-frequency, diffusion-related impedance producing higher Rp values and thus implying a slower corrosion. Practically, however, choosing a sufficiently low frequency, without jeopardising stability or drastically increasing measurements time, is challenging and so the Rp values from this method may be lower than if a smaller end frequency (<10 mHz) was chosen—see Figure 10 [35]. Quantitative corrosion rates can be calculated from polarisation resistance following ASTM G102 [45] and Stearn-Geary and Butler Volmer equations [46]. However, this method applies to a corrosion process solely controlled by charge transfer and without diffusion and so cannot be used in this case. Additional corrosion analysis techniques such as mass loss or solution analysis should also be used to support these results and provide quantitative corrosion rates.
This investigation into the corrosion of WAAM NAB and its cast counterpart has revealed a few key outcomes. First, the orientation appears to have minimal impact on the early-stage corrosion resistance of WAAM NAB. However, the electrochemical results present a noteworthy high local variation, especially in the XZ and YZ orientations sectioned from the near-top and near-end region of the wall. This implies that between WAAM samples, there is more variation in corrosion behaviour than there is in cast samples indicating that greater concern should be given to the effects of height and location within the WAAM wall. It is known that microstructure and corrosion behaviour in NAB alloys are highly influenced by thermal processing and cooling rates [40]. Thermal history has been shown to vary in WAAM [47]—for instance, the tops of walls receive no additional heating from subsequent deposited layers above [48], while the bottoms of walls experience faster cooling due to heat convection to the base metal [49]. These changing thermal conditions can cause stress relieving in lower layers [50] and cause coarsening along the build height in both overall grain structure and in the κ precipitates [23], all of which can impact the strength and homogeneity of the passive film. In addition to variation along build height, thermal conditions can also vary longitudinally along wall length due to arc initiation effects and concurrent preheating during deposition [51]. These effects are most prominent under unidirectional deposition and can produce significant geometric differences between wall ends [52]. Beyond geometric changes, however, variation in microstructure and material properties near the wall’s ends requires greater attention.
5. Conclusions
The aim of this study has been met by comparing the microstructure and corrosion behaviour of inner orientations within a WAAM NAB wall to its cast counterpart. YZ and XZ orientations in WAAM exhibit a layered microstructure due to reheating from subsequent weld layers and has noticeably finer and less intermetallic κ phase precipitates in comparison to cast NAB. In aerated 3.5% NaCl solution, the cast NAB and the XY, YZ and XZ orientations in WAAM in this work show minimal difference in early corrosion behaviour. EIS results indicate that passive films may be forming on the WAAM and cast NAB samples, which impart their corrosion resistant properties. Increased variability in the WAAM samples suggest that additional locational dependencies beyond just build direction may be present, potentially clouding the effects of orientation alone and suggesting varied corrosion susceptibilities between locations in WAAM. The intricacies in measuring corrosion behaviour from electrochemical methods were also discussed for a mixed activation–diffusion-controlled corroding system, highlighting the need for additional investigations such as film analysis with electron microspectroscopy and depth profiling as well as traditional mass loss or solution analysis methods.
Author Contributions
All authors contributed to the design of the research, analysis of data, written work and revisions of the manuscript. D.R. was responsible for acquisition of data. All authors have read and agreed to the published version of the manuscript.
Funding
This work was supported by AML3D.
Data Availability Statement
The datasets used in the current study are available from the corresponding author on reasonable request.
Acknowledgments
The authors acknowledge AML3D for their collaboration, support, and supply of materials. The authors acknowledge Flinders Microscopy and Microanalysis (FMMA) and Flinders University for their expertise and equipment. The authors acknowledge the facilities, and the scientific and technical assistance of Microscopy Australia and the Australian National Fabrication Facility (ANFF) under the National Collaborative Research Infrastructure Strategy, at the South Australian Regional Facility, Flinders Microscopy and Microanalysis, Flinders University.
Conflicts of Interest
Author Andrew M. Sales was employed by the company AML3D. The remaining authors declare that the research was conducted in the absence of any commercial or financial relationships that could be construed as a potential conflict of interest.
Abbreviations
The following abbreviations are used in this manuscript:
| WAAM | Wire-arc additive manufacturing |
| NAB | Nickel aluminium bronze |
| SEM | Scanning electron microscopy |
| AES | Auger electron microspectroscopy |
| HAZ | Heat-affected zone |
| OCP | Open circuit potential |
| LPS | Linear potential sweep |
| EIS | Electrical impedance spectroscopy |
References
- SmarTech Analysis, Additive Manufacturing Industry Grew 18 Percent in 2021 to $10.6B Reports SmarTech Analysis; Projects $50.8B By 2030. 2022. Available online: https://www.smartechanalysis.com/news/additive-manufacturing-industry-grew-18-percent-in-2021-to-10-6b-reports-smartech-analysis-projects-50-8b-by-2030/ (accessed on 24 June 2022).
- Awari, G.K.; Thorat, C.S.; Ambade, V.; Kothari, D.P. Additive Manufacturing and 3D Printing Technology: Principles and Applications, 1st ed.; Taylor & Francis Group: Oxfordshire, UK, 2020. [Google Scholar]
- Gibson, I. Additive Manufacturing Technologies, 3rd ed.; Springer: Cham, Switzerland, 2021. [Google Scholar]
- Pou, J.; Riveiro, A.; Davim, J.P. Additive Manufacturing; Elsevier: Amsterdam, The Netherlands, 2021. [Google Scholar]
- AML3D. Available online: https://aml3d.com/technology/ (accessed on 19 September 2023).
- Rodrigues, T.A.; Duarte, V.; Miranda, R.M.; Santos, T.G.; Oliveira, J.P. Current Status and Perspectives on Wire and Arc Additive Manufacturing (WAAM). Materials 2019, 12, 1121. [Google Scholar] [CrossRef] [Scilit] [PubMed]
- Ding, D.; Pan, Z.; Cuiuri, D.; Li, H. Wire-feed additive manufacturing of metal components: Technologies, developments and future interests. Int. J. Adv. Manuf. Technol. 2015, 81, 465–481. [Google Scholar] [CrossRef] [Scilit]
- Meigh, H.J. Cast and Wrought Aluminium Bronzes: Properties, Processes and Structure, 1st ed.; IOM Communications: London, UK, 2000. [Google Scholar]
- Govindaraj, R.B.; Junghans, E.; Andersen, I.; Lim, Y.K.; Lindström, P. Additive manufactured marine component–Ni Al bronze propeller. Procedia Struct. Integr. 2021, 34, 20–25. [Google Scholar] [CrossRef] [Scilit]
- Nota, C.; Rückert, G.; Heuzé, J.; Carlino, L.; Quenez, J.; Courregelongue, L. A first feedback on manufacturing and in-service behaviour of a WAAM-made propeller for naval application. Weld. World 2023, 67, 1113–1121. [Google Scholar] [CrossRef] [Scilit]
- Schüssler, A.; Exner, H.E. The corrosion of nickel-aluminium bronzes in seawater—I. Protective layer formation and the passivation mechanism. Corros. Sci. 1993, 34, 1793–1802. [Google Scholar] [CrossRef] [Scilit]
- Hasan, F.; Jahanafrooz, A.; Lorimer, G.W.; Ridley, N. The morphology, crystallography, and chemistry of phases in as-cast nickel-aluminum bronze. Metall. Trans. A 1982, 13, 1337–1345. [Google Scholar] [CrossRef] [Scilit]
- Ding, Y.; Zhao, R.; Qin, Z.; Wu, Z.; Wang, L.; Liu, L.; Lu, W. Evolution of the Corrosion Product Film on Nickel-Aluminum Bronze and Its Corrosion Behavior in 3.5 wt % NaCl Solution. Materials 2019, 12, 209. [Google Scholar] [CrossRef] [Scilit] [PubMed]
- Michels, H.T.; Kain, R.M. Effect of composition and microstructure on the seawater corrosion resistance of nickel aluminum bronze. In Proceedings of the CORROSION 2003, San Diego, CA, USA, 16–20 March 2003. [Google Scholar]
- Qin, Z.; Zhang, Q.; Luo, Q.; Wu, Z.; Shen, B.; Liu, L.; Hu, W. Microstructure design to improve the corrosion and cavitation corrosion resistance of a nickel-aluminum bronze. Corros. Sci. 2018, 139, 255–266. [Google Scholar] [CrossRef] [Scilit]
- Lv, Y.; Guo, J.; Zhang, G.; Cao, L.; Sun, X.; Qin, Z.; Xia, D.-H. Insights into the selective phase corrosion of as cast NiAl bronze alloy: Effect of electrical properties of each phase’s protective film. J. Alloys Compd. 2022, 891, 162008. [Google Scholar] [CrossRef] [Scilit]
- Jafari, D.; Vaneker, T.H.J.; Gibson, I. Wire and arc additive manufacturing: Opportunities and challenges to control the quality and accuracy of manufactured parts. Mater. Des. 2021, 202, 109471. [Google Scholar] [CrossRef] [Scilit]
- Ding, D.; Pan, Z.; Van Duin, S.; Li, H.; Shen, C. Fabricating Superior NiAl Bronze Components through Wire Arc Additive Manufacturing. Materials 2016, 9, 652. [Google Scholar] [CrossRef] [Scilit] [PubMed]
- Shen, C.; Pan, Z.; Ding, D.; Yuan, L.; Nie, N.; Wang, Y.; Luo, D.; Cuiuri, D.; van Duin, S.; Li, H. The influence of post-production heat treatment on the multi-directional properties of nickel-aluminum bronze alloy fabricated using wire-arc additive manufacturing process. Addit. Manuf. 2018, 23, 411–421. [Google Scholar] [CrossRef] [Scilit]
- Chen, W.; Chen, Y.; Zhang, T.; Wen, T.; Feng, X.; Yin, L. Effects of Location on the Microstructure and Mechanical Properties of Cu-8Al-2Ni-2Fe-2Mn Alloy Produced Through Wire Arc Additive Manufacturing. J. Mater. Eng. Perform. 2020, 29, 4733–4744. [Google Scholar] [CrossRef] [Scilit]
- Dharmendra, C.; Hadadzadeh, A.; Amirkhiz, B.S.; Janaki Ram, G.D.; Mohammadi, M. Microstructural evolution and mechanical behavior of nickel aluminum bronze Cu-9Al-4Fe-4Ni-1Mn fabricated through wire-arc additive manufacturing. Addit. Manuf. 2019, 30, 100872. [Google Scholar] [CrossRef] [Scilit]
- Cai, X.; Wang, Z.; Dong, L.; Yang, M.; Zhou, J.; Xue, F. Advanced mechanical properties of nickel-aluminum bronze/steel composite structure prepared by wire-arc additive manufacturing. Mater. Des. 2022, 221, 110969. [Google Scholar] [CrossRef] [Scilit]
- Dharmendra, C.; Gururaj, K.; Pradeep, K.G.; Mohammadi, M. Characterization of κ-precipitates in wire-arc additive manufactured nickel aluminum bronze: A combined transmission Kikuchi diffraction and atom probe tomography study. Addit. Manuf. 2021, 46, 102137. [Google Scholar] [CrossRef] [Scilit]
- Cai, X.; Song, B.; Dong, B.; Lin, S.; Zhu, Y. Microstructure and mechanical properties of S217 nickel aluminum bronze alloy fabricated by wire arc additive manufacturing. Virtual Phys. Prototyp. 2025, 20, e2447546. [Google Scholar] [CrossRef] [Scilit]
- Cai, X.; Yang, M.; Wang, S.; Wang, Z.; Zhou, J.; Xue, F. Experimental investigations on corrosion behavior and antibacterial property of nickel-aluminum bronze fabricated through wire-arc additive manufacturing (WAAM). Corros. Sci. 2023, 214, 111040. [Google Scholar] [CrossRef] [Scilit]
- Xu, C.; Peng, Y.; Chen, L.-Y.; Zhang, T.-Y.; He, S.; Wang, K.-H. Corrosion behavior of wire-arc additive manufactured and as-cast Ni-Al bronze in 3.5 wt% NaCl solution. Corros. Sci. 2023, 215, 111048. [Google Scholar] [CrossRef] [Scilit]
- Shahriari, A.; Shakerin, S.; Birbilis, N.; Mohammadi, M. On the morphology and composition of κ-phases on localized corrosion in wire arc additive manufacturing nickel aluminum bronze. Corros. Sci. 2025, 257, 113343. [Google Scholar] [CrossRef] [Scilit]
- Shahriari, A.; Chalasani, D.; Amirkhiz, B.S.; Mohammadi, M. Corrosion performance of wire arc additively manufactured NAB alloy. npj Mater. Degrad. 2023, 7, 85. [Google Scholar] [CrossRef] [Scilit]
- Aliyu, A.; Bishop, D.P.; Nasiri, A. Effect of heat treatment on microstructural evolution and corrosion behavior of wire-arc additive manufactured nickel aluminum bronze alloy. Corros. Sci. 2025, 249, 112812. [Google Scholar] [CrossRef] [Scilit]
- ASTM B505; Standard Specification for Copper Allloy Continous Castings. ASTM International: West Conshocken, PA, USA, 2008.
- ISO/TR 16208; Corrosion of Metals and Alloys—Test Method for Corrosion of Materials by Electrochemical Impedance Measurements. The International Organization for Standardization: Geneva, Switzerland, 2014.
- ASTM G106; Standard Practice for Verification of Algorithm and Equipment for Electrochemical Impedance Measurements. ASTM International: West Conshohocken, PA, USA, 2015.
- Schneider, C.A.; Rasband, W.S.; Eliceiri, K.W. NIH Image to ImageJ: 25 years of image analysis. Nat. Methods. 2012, 9, 671–675. [Google Scholar] [CrossRef] [Scilit] [PubMed]
- Ohtsuka, T.; Nishikata, A.; Sakairi, M.; Fushimi, K. Electrochemistry for Corrosion Fundamentals, 1st ed.; Springer: Singapore, 2018. [Google Scholar]
- Barsoukov, E.; Macdonald, J.R. Impedance Spectroscopy Theory, Experiment, and Applications, 2nd ed.; Wiley-Interscience: Hoboken, NJ, USA, 2005. [Google Scholar]
- ASTM G59; Standard Test Method for Conducting Potentiodynamic Polarization Resistance Measurements. ASTM International: West Conshohocken, PA, USA, 2004.
- Zeng, Y.; Yang, F.; Chen, Z.; Guo, E.; Gao, M.; Wang, X.; Kang, H.; Wang, T. Enhancing mechanical properties and corrosion resistance of nickel-aluminum bronze via hot rolling process. J. Mater. Sci. Technol. 2021, 61, 186–196. [Google Scholar] [CrossRef] [Scilit]
- Lacey, M. Constant Phase Elements. 2023. Available online: https://lithiuminventory.com/experimental-electrochemistry/eis/constant-phase-element/ (accessed on 19 July 2024).
- Dharmendra, C.; Rice, K.P.; Amirkhiz, B.S.; Mohammadi, M. Atom probe tomography study of κ-phases in additively manufactured nickel aluminum bronze in as-built and heat-treated conditions. Mater. Des. 2021, 202, 109541. [Google Scholar] [CrossRef] [Scilit]
- Orzolek, S.M.; Semple, J.K.; Fisher, C.R. Influence of processing on the microstructure of nickel aluminum bronze (NAB). Addit. Manuf. 2022, 56, 102859. [Google Scholar] [CrossRef] [Scilit]
- Song, Q.-N.; Li, H.-L.; Zhang, H.-N.; Hong, H.; Xu, N.; Zhang, G.-Y.; Bao, Y.-F.; Qiao, Y.-X. Correlation between microstructure and corrosion and cavitation erosion behaviors of nickel aluminum bronze. Trans. Nonferrous Met. Soc. China 2022, 32, 2948–2964. [Google Scholar] [CrossRef] [Scilit]
- Wharton, J.A.; Barik, R.C.; Kear, G.; Wood, R.J.K.; Stokes, K.R.; Walsh, F.C. The corrosion of nickel–aluminium bronze in seawater. Corros. Sci. 2005, 47, 3336–3367. [Google Scholar] [CrossRef] [Scilit]
- Liu, M.; Li, J. In-Situ Raman Characterization of Initial Corrosion Behavior of Copper in Neutral 3.5% (wt.) NaCl Solution. Materials 2019, 12, 2164. [Google Scholar] [CrossRef] [Scilit] [PubMed]
- Deslouis, C.; Tribollet, B.; Mengoli, G.; Musiani, M.M. Electrochemical behaviour of copper in neutral aerated chloride solution. I. Steady-state investigation. J. Appl. Electrochem. 1988, 18, 374–383. [Google Scholar] [CrossRef] [Scilit]
- ASTM G102; Standard Practice for Calculation of Corrosion Rates and Related Information from Electrochemical Measurements. ASTM International: West Conshohocken, PA, USA, 2015.
- Papavinasam, S. Electrochemical Polarization Techniques for Corrosion Monitoring. In Techniques for Corrosion Monitoring; Elsevier: Amsterdam, The Netherlands, 2021; pp. 45–75. [Google Scholar]
- Wang, Y.; Chen, X. Investigation on the microstructure and corrosion properties of Inconel 625 alloy fabricated by wire arc additive manufacturing. Mater. Res. Express 2019, 6, 106568. [Google Scholar] [CrossRef] [Scilit]
- Wittig, B.; Zinke, M.; Jüttner, S. Influence of arc energy and filler metal composition on the microstructure in wire arc additive manufacturing of duplex stainless steels. Weld. World 2021, 65, 47–56. [Google Scholar] [CrossRef] [Scilit]
- Kannan, A.R.; Shanmugam, N.S.; Ramkumar, K.D.; Rajkumar, V. Studies on Super Duplex Stainless Steel Manufactured by Wire Arc Additive Manufacturing. Trans. Indian Inst. Met. 2021, 74, 1673–1681. [Google Scholar] [CrossRef] [Scilit]
- Ozaner, O.C.; Karabulut, Ş.; Karakoç, H.; Sharma, A.; Talemi, R.; Tjahjowidodo, T. Influence of Deposition Sequence and Thermal Cycles on the Microstructure and Wear Behavior of WAAM-Fabricated SS309L and Inconel 625 Bimetallic Structures. Met. Mater. Int. 2025, 31, 3385–3408. [Google Scholar] [CrossRef] [Scilit]
- Lehmann, T.; Jain, A.; Jain, Y.; Stainer, H.; Wolfe, T.; Henein, H.; Qureshi, A.J. Concurrent geometry- and material-based process identification and optimization for robotic CMT-based wire arc additive manufacturing. Mater. Des. 2020, 194, 108841. [Google Scholar] [CrossRef] [Scilit]
- Kesarwani, S.; Yuvaraj, N.; Niranjan, M.S. CMT-based WAAM: A comprehensive review of process parameters, their effects, challenges, and future scope. J. Braz. Soc. Mech. Sci. Eng. 2024, 46, 699. [Google Scholar] [CrossRef] [Scilit]

Disclaimer/Publisher’s Note: The statements, opinions and data contained in all publications are solely those of the individual author(s) and contributor(s) and not of MDPI and/or the editor(s). MDPI and/or the editor(s) disclaim responsibility for any injury to people or property resulting from any ideas, methods, instructions or products referred to in the content. |
© 2026 by the authors. Licensee MDPI, Basel, Switzerland. This article is an open access article distributed under the terms and conditions of the Creative Commons Attribution (CC BY) license.