


Abstract
This study evaluates accelerated stress test (AST) protocols and introduces a framework for translating AST-derived degradation metrics into electrode lifetime predictions for heavy-duty vehicle fuel cells. Catalyst stability across ASTs of varying durations is compared using the electrochemically active surface area (ECSA) loss rate, which remains broadly consistent across catalyst systems and Pt loadings but is extremely sensitive to protocol design and exposure conditions. The corresponding cell performance decay is captured through ECSA loss and its impact on exchange current density and oxygen transport resistance. These degradation pathways are further shaped by catalyst particle size and composition, catalyst–support interactions, the catalyst–ionomer interface, and electrode microstructure. Building on these relationships, a practical procedure is developed to estimate electrode lifetime using the allowable ECSA loss predicted by the degradation model, the measured AST ECSA loss rate, and the duty-cycle lifetime of a reference catalyst with matching Pt loading. To generalize AST outcomes, an acceleration (loss) factor, ALF, is defined as the ratio of electrode lifetime to the AST duration required to reach an equivalent end-of-life ECSA loss. The ALF is uniquely determined by catalyst formulation, Pt loading, AST protocol, duty-cycle characteristics, end-of-life definition, and system-level mitigation strategies.
1. Introduction
The durability of polymer electrolyte membrane fuel cells (PEMFCs) has been a topic of great interest to researchers over the last three decades and several review papers describing the durability of PEMFC components have been published [1,2,3]. These durability studies have elucidated the degradation mechanisms operational in PEMFC membrane electrode assemblies (MEAs) and have suggested numerous mitigation strategies to improve lifetimes. These studies have been greatly aided by the publication of test protocols by agencies including the U.S. Department of Energy (DOE), Japanese New Energy and industrial technologies Development Organization (NEDO), United Nations Economic Commission for Europe (UNECE), International Electrotechnical Commission (IEC), US Fuel Cell Council (USFCC), and Fuel Cell and Hydrogen Energy Association (FCHEA) [4]. These protocols largely fall into two categories: (i) application-specific accelerated stress tests (ASTs) defined by load profile or drive cycle simulations [5,6], and (ii) component-specific ASTs [7,8,9,10]. While the former have been primarily applied to fuel cell stacks to determine acceleration factors relevant to particular applications, the latter have been used widely to evaluate the relative durability of new materials and components primarily in MEAs tested in single cells. Despite these previous efforts, a major challenge remains to quantitatively translate AST-derived degradation metrics into application-relevant lifetime predictions under realistic duty cycles.
Application-specific ASTs have been developed to replicate degradation observed under realistic operating conditions, such as automotive drive cycles, and have demonstrated good agreement with field performance. Takahashi et al. developed an AST to simulate the degradation observed in light-duty automobiles and validated it on a 13-cell stack [5]. They performed a test that included 30,000 start–stop cycles followed by 73,000 load cycles which corresponded to a 15-year, 200,000 km lifetime of the Mirai FC electric vehicle. They limited the conditions of testing to those encountered in the field: start–stop cycling from 0.05 V (18 s) to 0.88 V (30 s) at 0.415 V/s and 57 °C and voltage cycling from 0.6 V (10 s) to 0.9 V (15 s) @ 0.15 V/s and 70 °C. With this specific test, they were able to demonstrate only a 6% loss in cell voltage, which met their targets. While such specific tests are conducted by each fuel cell manufacturer to validate their system, more generic tests are of value to the fuel cell community. Thiele et al. developed a generic algorithm to shorten the lifetime of ASTs based on drive cycles [6]. They focused on those portions of the drive cycle related to voltage cycling, idling, humidity cycling and high-load operation and eliminated the non-degradation-inducing periods from the load profile. They were able to decrease the testing time of the Worldwide Harmonized Light Vehicles Test Cycle (WLTC) and New European Driving Cycle (NEDC) protocols by 46% and 60%, respectively. Another example of an accelerated stress test to project lifetime was published by Al Rafei et al. [11]. Here, they developed load profiles to accelerate the degradation observed in buses and were able to demonstrate a 5× acceleration factor by designing the load profile around voltage cycling, relative humidity (RH) cycling and near-idling conditions. While these three are specific examples of ASTs developed to project lifetimes, their applicability is extremely limited since the tests are specifically designed to accelerate the degradation very specific to a particular load profile selected based on the application.
Component-specific ASTs target degradation of the membrane, catalyst support, and electrocatalyst, each governed by distinct but coupled mechanisms. These component-specific protocols have been widely used to evaluate the durability of the membrane, catalyst support and electrocatalyst, respectively [12]. The membrane durability can be driven by thermal, mechanical or chemical stressors and different mechanisms and mitigation strategies have been proposed for each of these degradation modes [13]. Several protocols have been developed to accelerate either chemical degradation or mechanical degradation or a combination of the two [10]. Membrane chemical degradation is accelerated by exposing the membrane to open-circuit voltage conditions at high temperatures (usually 90 °C) and low RH (usually 30% RH) [14]. Moreover, both RH cycling and open-circuit voltage (OCV) holds have been shown to decrease the ductility of the membrane [15]. Finally, RH cycling under OCV conditions [10] and current cycling with low inlet humidity [16] result in accelerated membrane failure due to a combination of chemical and mechanical stressors. The fluoride release rate during the accelerated stress tests is usually measured and has a direct correlation to the membrane lifetime observed in these tests [17].
The electrocatalyst support (usually carbon) tends to oxidize at elevated potentials, with the corrosion rate highly dependent on electrode history and accelerated by dynamic operation, higher temperatures and higher relative humidities [18]. While carbon corrosion is a primary concern during shutdown and startup [19], the corrosion rates are still significant during regular operation, especially with potential cycling and higher-surface-area carbons [9]. The carbon corrosion can be monitored online by directly measuring the CO2 concentration in the cathode outlet or indirectly measuring the electrocatalyst surface area loss and increased mass transport resistance. The corrosion of the carbon supports leads to increased sintering/coalescence of the Pt electrocatalyst and the collapse of the pore structure of the carbon and subsequent electrode layer thinning [10].
Pt or Pt-alloy electrocatalysts tend to dissolve under the harsh conditions encountered in PEMFCs and this dissolution rate is highly potential-dependent [20]. Therefore, when a PEMFC MEA is subject to potential cycling, the Pt nanoparticle tends to grow due to Ostwald ripening in addition to coalescence/sintering. This increasing particle size is accompanied by a loss of ECSA, resulting in increased kinetic losses proportional to the loss in surface roughness of the electrocatalyst [21]. This electrocatalyst degradation is accelerated with increasing temperature and increasing relative humidity, resulting in the widespread use of electrocatalyst ASTs that subject the catalyst to changing potentials in the range of 0.6 V to 0.95 V, at 80 °C and 100% RH in a H2/N2 atmosphere [22]. An additional catalyst degradation mechanism when utilizing alloy catalysts is the dissolution of the base metal from the electrocatalyst and its incorporation into the ionomer, resulting in lower catalyst mass activity and increased transport losses, respectively [8]. The degradation rate of the electrocatalyst can be significantly slowed using porous carbon supports (HSC or high-surface-area carbon), where the Pt inside the pores is not subject to coalescence when compared to the Pt on the surface of solid carbons (Vulcan) [23]. Furthermore, mesoporous carbon supports with Pt within 2 to 5 nm pores not only provide the benefit of high durability but avoid the additional mass transport limitation observed with HSC [24].
The purpose of this work is to evaluate the durability of Pt and Pt-alloy catalysts supported on high-surface-area and hierarchical carbons under H2/N2 and H2/Air ASTs in both differential and integral cells. The specific objectives are as follows:
- Develop a unified metric for monitoring the relative stability of oxygen reduction reaction (ORR) catalysts across ASTs of varying duration;
- Develop a metric to characterize the loss in cell performance resulting from catalyst degradation;
- Formulate a method for using AST data to estimate electrode lifetime in heavy-duty vehicle (HDV) applications;
- Define and evaluate an acceleration factor to quantify the observed degradation under AST conditions.
This work builds on several ongoing efforts as well as related prior studies and publications. (a) It employs a two-part MEA AST that was developed and evaluated by the Million Mile Fuel Cell Truck (M2FCT) Consortium for HDV applications, in which Part I predominantly stresses the catalyst and Part II primarily stresses the membrane [25,26]. (b) It uses a previously developed model to project the effects of potential profile, RH and temperature on catalyst degradation rate in H2/Air cells using H2/N2 AST data and ex situ online measurements of Pt dissolution in aqueous media [27]. (c) It projects electrode lifetime using published methods and data for PtNi/HSC and PtCo/HSC catalysts, together with a drive cycle for hybrid fuel cell systems for Class 8 long-haul trucks [27].
The approach developed in this study for quantifying acceleration factors is broadly applicable to fuel cell systems used in light-duty vehicles, buses, off-road applications, and stationary power generation, including data center power supplies.
2. Materials and Methods
Four ORR catalyst systems were evaluated: annealed Pt supported on high-surface-area carbon (a-Pt/HSC) [28], de-alloyed PtCo on high-surface-area carbon (d-PtCo/HSC) [29], ordered intermetallic L10-PtCo on carbonized zeolitic imidazolate framework-8 (L10-PtCo/CZIF8) [30], and dispersed Pt on CZIF8 (Pt/CZIF8) [31]. The a-Pt/HSC (Elyst Pt50 0550) and d-PtCo/HSC (Elyst Pt50 0690) catalysts were purchased from Umicore, Hanau, Germany [32] and are representative of the current commercial state of the art. Pt/CZIF8 and L10-PtCo/CZIF8 were synthesized in-house using methods reported elsewhere [30,33]. These CZIF8-based catalysts remain at the experimental stage, are available only in limited quantities, and have thus far been evaluated exclusively in single-cell studies. They are considered representative of next-generation ORR catalysts that employ engineered supports and advanced synthesis strategies to achieve enhanced catalytic activity and durability.
2.1. Membrane Electrode Assembly
Commercial a-Pt/HSC (EKAT1112 K27) and d-PtCo/HSC (EKAT1113 K44) catalyst-coated membranes (CCMs) on NafionTM HP membrane were procured from Umicore. Pt/CZIF8 and L10-PtCo/CZIF8 CCMs were fabricated in-house by directly spray-coating catalyst inks onto a NafionTM NC700 membrane (Chemours, Wilmington, DE 19801, USA). The target Pt loading in all CCMs was 0.05 mg/cm2 at the anode and 0.25 mg/cm2 at the cathode. The cathode ionomer-to-carbon (I/C) ratio is 0.83 in commercial CCMs and 0.6 (NafionTM D2020 dispersion, Fuel Cell Store, Bryan, TX 77807, USA) in spray-coated CCMs. Some commercial a-Pt/HSC CCMs with 0.40 mg-Pt/cm2 at the cathode were also acquired. For the fabrication of Pt/CZIF8 MEAs, an ink was prepared by dispersing the catalyst in an ionomer solution (Nafion™ D2020, DuPont, Wilmington, DE 19805, USA) mixed with a 1-propanol/water solvent (3:4, v/v). The catalyst ink was sonicated for 25 min to ensure uniform dispersion and subsequently spray-coated onto a Nafion™ NC700 membrane (Chemours) using an ultrasonic system (Sono-Tek, Milton, NY 12547, USA). The spray rate was maintained at 0.19 mL/min, and approximately 20 coating passes were required to achieve the target Pt loading of 0.25 mg-Pt/cm2. The MEA was fabricated by sandwiching the CCMs with two pieces of calendared gas diffusion layers (GDLs) on both the anode and cathode sides. The GDLs were Freudenberg H23C8 and Sigracet 22 BB (Fuel Cell Store) in 50 cm2 integral and 5 cm2 differential cells, respectively. Polytetrafluoroethylene (PTFE) films of different thicknesses were used as gaskets and the GDL compression ratio was controlled to 18%. The sub-gasket used is 7 µm Kapton (CS Hyde company, Lake Villa, IL 60046, USA) to minimize the thickness differences and uneven compression.
2.2. Fuel Cell Test Protocols
The assembled MEAs were tested in a co-flow arrangement in 5 cm2 differential cells and a counterflow arrangement in 50 cm2 integral cells, using a 14-channel serpentine flow field on both anode and cathode sides. The single cell was assembled using 8 bolts, tightened to a torque of 40 in-lbf. The cells were tested using either automated, programmable Hydrogenics or Scribner 850g test stations.
Conditioning Process: The conditioning process consists of an initial break-in protocol followed by multiple voltage-recovery (VR) cycles [34]. During break-in, the cell was heated to 80 °C and supplied with H2 and air at flow rates of 1.0 slpm (anode) and 3.3 slpm (cathode) for differential cells, and 1.5 slpm (anode) and 3.7 slpm (cathode) for integral cells. The cells were cycled between 0.6 V (3 min hold) and 0.9 V (4 min hold) for a total break-in duration of 3.5 h. Because current density varies with voltage, the corresponding H2/air stoichiometries also change; the stoichiometries at 1 A/cm2 are for 29(a)/36(c) differential cells and 4.3(a)/4.5(c) for integral cells.
Following break-in, multiple VR cycles were applied. During each VR cycle, the cell was held at 40 °C, 150% RH and 0.1 V for 2 h, with H2 and air flow rates of 1.0 slpm and 0.1 slpm for differential cells and 0.9 slpm and 0.5 slpm for integral cells. As reported previously, VR cycling improves electrochemical performance across the full fuel cell potential range [30]. After each VR cycle, a cell polarization curve was recorded and compared with earlier cycles. VR cycling was terminated once the cell reached peak performance.
Polarization Curves: The mass activity was determined by measuring H2/O2 polarization curves at 80 °C, 100% RH and 150 kPa absolute pressure. The cell voltage was stepped anodically from 0.75 V to OCV, and at each voltage, the current density was recorded and averaged over 4 min. The cell performance was characterized using H2/Air polarization curves measured at different cell temperatures, RHs and backpressures. For these tests, the cell was operated under current control and varying current density from 2.25 to 0.01 A/cm2. Unless mentioned otherwise, the anode and cathode stochiometric ratios were 1.5 and 2.0, respectively. For one specific condition of 90 °C, 40% RH and 250 kPa absolute pressure, the stochiometric ratios were adjusted to 2.0 at the anode and 1.5 at the cathode [30].
Cyclic Voltammetry: Cyclic voltammetry (CV) was conducted at 30 °C and 100% RH in a H2/N2 gas environment. The cell voltage was swept in forward and backward directions from 0.05 to 1.2 V vs. the reversible hydrogen electrode (RHE) at a 50 mV/s scan rate. The electrochemically active surface area was calculated from the HUPD charge (QH) using a conversion factor (Qr) of 210 , corresponding to the theoretical charge density associated with a monolayer of adsorbed hydrogen on Pt, APt = QH/Qr. CO-stripping voltammetry was used, when necessary, to obtain an independent ECSA measurement and/or calibrate the HUPD-based method, using a reference conversion factor of 420 .
2.3. MEA-Specific Accelerated Stress Test
Catalyst Accelerated Stress Test in N2 (CAST-N2): This AST was conducted in 5 cm2 differential cells at 80 °C and 100% RH under H2/N2 and trapezoidal wave (TW) potential cycles between 0.6 and 0.95 V with 0.5 s ramp time and 2.5 s holds at upper (UPL) and lower (LPL) potential limits (see Table 1). A total of 90,000 cycles lasting 150 h were imposed to evaluate the durability of ORR catalysts for heavy-duty applications [8,30].
Table 1.
Catalyst and MEA ASTs. All potential cycles have trapezoidal waves (TW). The ramp rates are AST-specific and are listed in the body of the paper.
Catalyst Accelerated Stress Test in Air (CAST-Air): As summarized in Table 1, this AST was conducted in 50 cm2 integral cells with a counterflow configuration at 90 °C under H2/Air and TW potential cycles between 0.675 V and 0.925 V. Each cycle is of 1 min duration with 30 s holds at UPL and LPL including ramp time. The test was run for a total of 30,000 cycles lasting 500 h, with intermittent characterization every 6000 cycles or 100 h. The humidifier temperature was adjusted to achieve 30, 50 or 90% inlet RH. The test mainly stresses the catalyst at 90% inlet RH and the membrane at 30% inlet RH [25].
MEA Accelerated Stress Test in Air (MAST-Air): This sequential two-part AST was designed to evaluate electrode and membrane stability within a single cell and a single experiment, substantially reducing the time required for MEA fabrication and conditioning, cell preparation, and catalyst consumption. The protocol was conducted in 50 cm2 integral cells with a counterflow configuration at 90 °C under H2/Air, with flowrates set to achieve cathode and anode stoichiometries of 1.5 at 1.5 A/cm2 (see Table 1).
Part I, like the CAST-Air protocol at 100% inlet RH, is shorter because each potential cycle lasts 15 s, consisting of a 5 s hold at LPL and a 10 s hold at UPL, including ramp time. Part I primarily stresses the catalyst and comprises 30,000 cycles over 125 h, with intermittent characterization every 6000 cycles (25 h).
Part II primarily stresses the membrane by operating at 30% inlet RH under current cycling between an upper current density (UCD) of 1.5 A/cm2 for 30 s and a lower current density (LCD) of 0.02 A/cm2 for 30 s. Part II also consists of 30,000 cycles but spans 500 h, with characterization performed every 6000 cycles (100 h) [25].
2.4. MEA Characterization
MEA state of health was monitored during the intermittent characterization phases of the ASTs using several electrochemical techniques. Electrode health was assessed through cyclic voltammetry for ECSA, electrochemical impedance spectroscopy (EIS) at 0.4 V ± 5 mV between 100 kHz and 0.1 Hz (after stabilizing for > 30 min) for electrode resistance and high-frequency resistance (HFR), and H2/O2 polarization curves for catalyst mass activity.
Membrane health was evaluated through HFR measurements, linear sweep voltammetry (LSV) in H2/N2 at 80 °C and 100% RH for shorting resistance and H2 crossover, and selective ion chromatography for fluoride emission rate analysis.
Post-test characterization was conducted using scanning and transmission electron microscopy (SEM/TEM) to quantify changes in catalyst particle size distribution, Pt loss and redistribution, Co loss and migration, and electrode–membrane structural modifications.
3. Theoretical Background
A library of validated models is used to characterize the initial performance of ORR catalysts and electrodes, performance degradation over time and use, and stability on defined duty cycles including operating and accelerated stress conditions. The models are material-specific and supported by standardized protocols for conducting experiments and collecting data [28,30].
The performance model provides a methodology for calculating local overpotentials associated with (i) ORR charge transfer resistance, (ii) oxygen transport resistance in the electrode, and (iii) proton transport resistance in the membrane and cathode catalyst layer as a function of the key operating conditions: pressure P, temperature T, relative humidity Φ, oxygen mole fraction and current density i. The model was developed by measuring a series of polarization curves on fully conditioned differential cells in H2/Air over 1.5–2.5 atm, 60–95 °C, 30–100% RH and 5–21% O2 [30].
The performance degradation model quantifies aging by tracking the increase in cell overpotentials. It was developed by subjecting conditioned differential cells to 90,000 (90k) H2/N2 AST cycles and measuring H2/Air polarization curves after every 30,000 cycles [29].
The stability model quantifies the ECSA loss rate on AST cycles. It was developed by measuring ECSA loss on CAST-N2 at different temperatures (60–95 °C), RH (30–100%) and upper potential limits (0.8–0.95 V) [28].
The stability model is generalized for arbitrary duty cycles by correlating the ECSA loss rate with the Pt dissolution rate. The Pt dissolution model was informed by time-resolved, online inductively coupled plasma mass spectroscopy (ICP-MS) measurements collected during staircase potential protocols in aqueous media [27].
The performance, degradation and stability models are tightly coupled within a 1 + 1D framework designed for large-format cells with co-flowing or counterflowing H2, air and coolant streams.
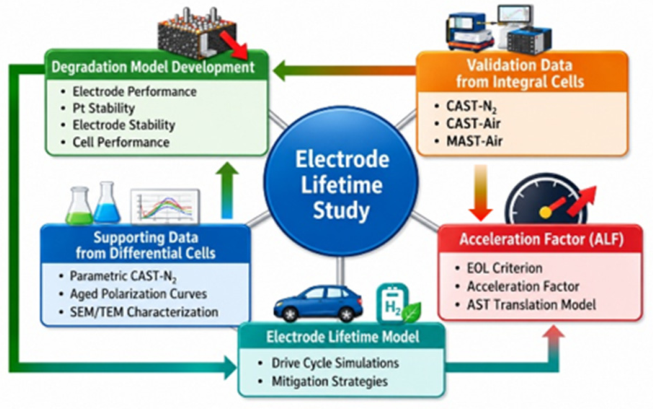
Framework Model Validation: Figure A1 illustrates the relationships and interactions between the degradation models, experimental datasets, and model applications. It summarizes the development of the cell degradation model, in which the key ORR kinetic constants and O2 transport resistance are determined from supporting data obtained in differential cell tests, followed by validation using AST data from integral cell experiments. Once validated, the model is applied to project electrode lifetime through drive cycle simulations that incorporate both operational practices and system-level mitigation strategies. As described in the next section, the lifetime model together with the AST data provides the basis for quantifying the acceleration loss factor.
4. Results and Discussion
In-cell diagnostics indicate that the membrane maintained its integrity throughout the ASTs. No evidence of pinhole formation was observed, as the H2 crossover current measured by LSV exhibited only minor, statistically insignificant variations. For example, after 90,000 CAST-N2 cycles, the H2 crossover decreased by only 0.2–0.5 mA/cm2 relative to the beginning of test (BOT) values of 4.6–4.7 mA/cm2. Post-test SEM imaging revealed localized membrane thinning, with thickness reductions of up to 30% under CAST-Air cycling near the cathode and in the inlet and outlet regions during low-RH operation. However, these localized features were not consistent with the measured membrane degradation indicators, including the decrease in H2 crossover with aging, low fluoride emission rates of only 2–5 ng/cm2.h measured by ion chromatography, and minimal changes in HFR (3–5 mΩ cm2 relative to an initial value of ~50 mΩ cm2 for the HP membrane) measured by EIS. Collectively, these results indicate that the observed decline in cell performance was primarily driven by catalyst degradation rather than membrane failure.
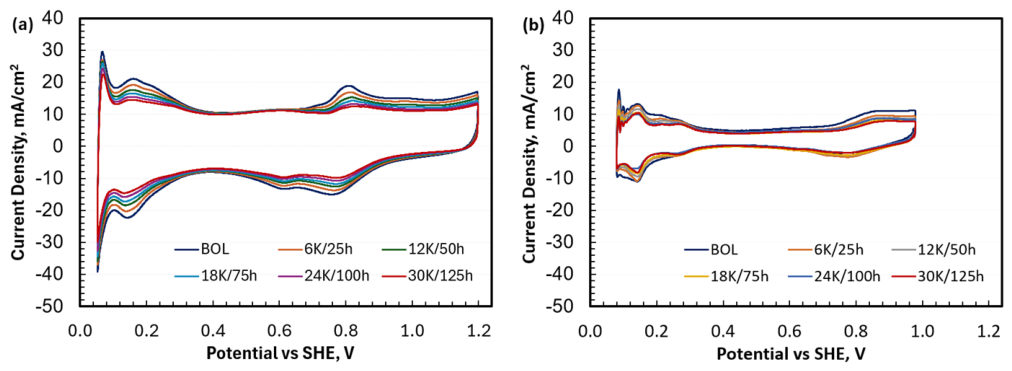
This conclusion is further supported by the cyclic voltammetry data shown in Figure A2, which reveal ECSA losses ranging from 10% to 50% over the course of the ASTs. Similarly, the measured mass activity decreased by approximately 80% for d-PtCo/HSC, 56–60% for a-Pt/HSC and Pt/CZIF8, and 40% for L10-PtCo/CZIF8 relative to the BOT values of 0.75 A/mg-Pt for d-PtCo/HSC, Pt/CZIF8, and L10-PtCo/CZIF8 and 0.4 A/mg-Pt for a-Pt/HSC. These losses in ECSA and mass activity are consistent with the particle growth observed by TEM after 90,000 CAST-N2 cycles, with the average particle diameter increasing from 4.4 to 5.8 nm for a-Pt/HSC, from 4.8 to 5.1 nm for d-PtCo/HSC, and from 2.4 to 5.5 nm for Pt/CZIF8.
4.1. Catalyst Stability on ASTs
The overall approach is to characterize degradation in ORR kinetics and O2 transport resistance using a single parameter, ECSA (APt). Within this framework (see Figure A1), the evolution of APt over a duty cycle implicitly captures the effects of multiple degradation mechanisms, including (i) loss of active area from particle growth/coarsening or migration of Pt into the membrane, (ii) transition metal leaching from alloy catalyst leading to strain relaxation and catalyst poisoning, and (iii) redistribution of catalyst within the support by migration between interior pores and outer surfaces.
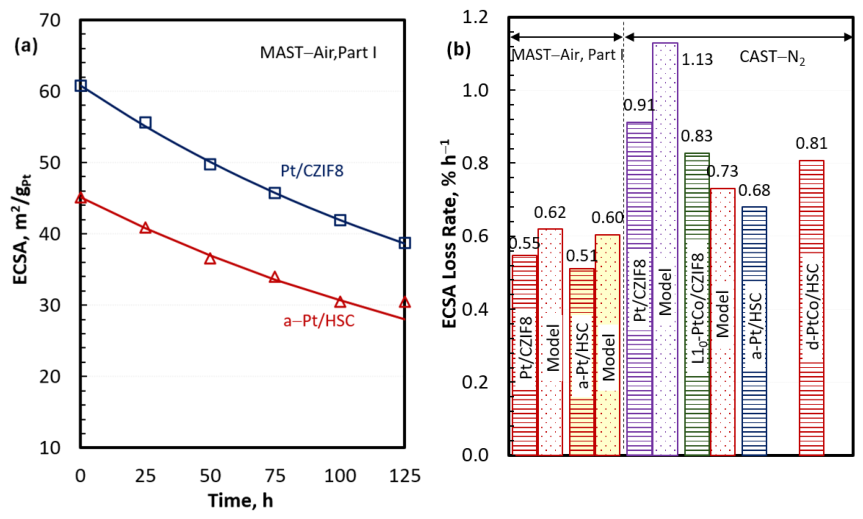
Figure 1a presents representative ECSA loss behavior for two Pt catalyst systems (Pt/CZIF8 and a-Pt/HSC) subjected to MAST-Air Part I in a 50 cm2 integral cell. Pt/CZIF8 exhibits a higher initial ECSA (60.8 m2/g-Pt) than a-Pt/HSC (45.1 m2/g-Pt), consistent with its smaller particle size (2.4 nm vs. 4.4 nm). However, the smaller particle size also corresponds to a larger ECSA decline during AST [35]: 36.3% for Pt/CZIF8 vs. 32.4% for a-Pt/HSC. This occurs even though most of the particles in Pt/CZIF8 reside within the interior pores, where they are less susceptible to coalescence than exterior particles [36].
Figure 1.
Stability of Pt/CZIF8, L10-PtCo/CZIF8, a-Pt/HSC, and d-PtCo/HSC on H2/N2 catalyst AST (CAST-N2) and H2/Air MEA AST (MAST-Air Part I). Catalyst stability is characterized in terms of ECSA loss rate that is faster on CAST-N2 than on MAST-Air and is similar for the different catalyst systems. The Pt loading at the cathode is 0.25 mg/cm2 in all four catalyst systems: (a) ECSA loss in MAST-Air Part I and (b) comparative ECSA loss rate.
The stability of ORR catalysts over ASTs of different durations can be quantified in terms of ECSA (APt) loss rate (k), assuming first-order kinetics [27,37]:
where , , and α is assigned a value of 0.3. The experimental values of k are derived by minimizing the error between ECSA measured at discrete times and APt calculated from Equation (1). The solid lines in Figure 1a show the calculated APt with k = 5.5 × 10⁻³h−1 for Pt/CZIF8 and k = 5.1 × 10⁻³h−1 for a-Pt/HSC on MAST-Air Part I. The model is seen to accurately predict ECSA loss for relatively stable catalysts, yielding a mean error of only 0.29 m2/g-Pt and a standard deviation of 1.04 m2/g-Pt. However, the modeled degradation rate constant is not applicable to less stable catalysts or more aggressive AST conditions that result in ECSA losses approaching the limiting value of (1 − α). Under such conditions, a smaller α should be employed to capture the increased degradation rate and preserve predictive accuracy. Because the degradation rate constant depends on the selected α, k must be recalibrated whenever α is changed.
Figure 1b summarizes the ECSA loss rate for different catalysts under two AST protocols. Under the H2/N2 AST (5 cm2 differential cell, 90k 0.6–0.95 V TW cycles at 80 °C, 100% RH, 6 s/cycle, 150 h exposure time), k is similar for all four catalyst systems and follows the order Pt/CZIF8 > L10-PtCo/CZIF8 > d-PtCo/HSC > a-Pt/HSC. As discussed above, this trend largely tracks the initial particle size, i.e., the smaller the diameter, the faster the ECSA loss rate.
Figure 1b indicates that the ECSA loss rate is faster under the H2/N2 AST than under the H2/Air AST Part I due to several contributing factors including a higher upper potential limit, (0.950 V vs. 0.925 V), a higher potential ramp rate, a shorter cycle duration (6 s vs. 15 s), a longer exposure time (150 h vs. 125 h), and a greater number of cycles (90k vs. 30k). These factors are partially offset by lower temperatures (80 °C vs. 90 °C). Numerous studies corroborate these trends and further quantify the impacts of these factors under dynamic potentials [8,20,21,22,27,28,30,37,38,39].
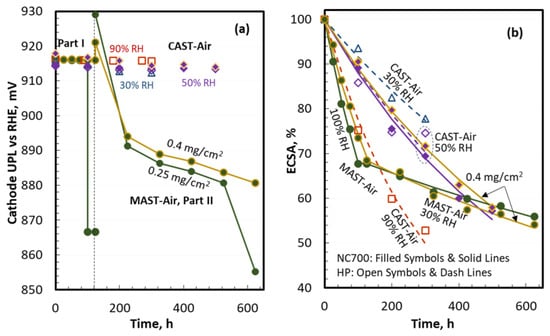
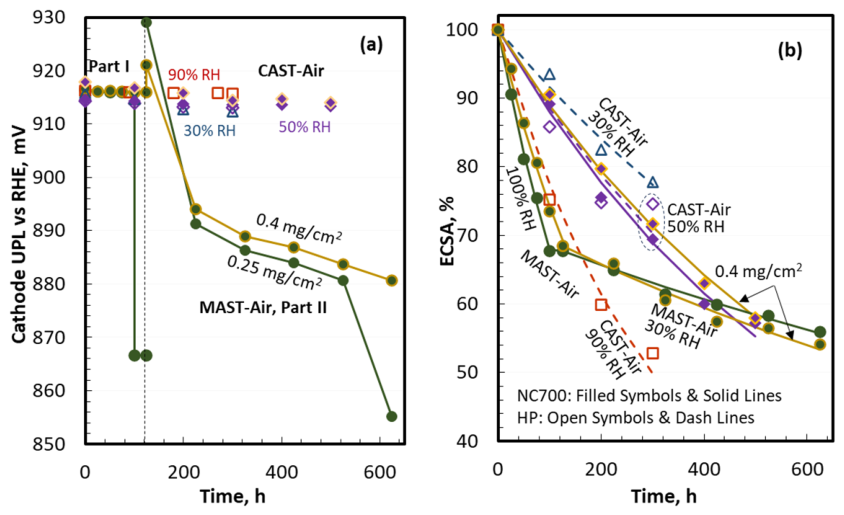
Figure 2 summarizes the effect of operating variables and MEA design parameters on ECSA loss for a-Pt/HSC under CAST-Air and MAST-Air. In Figure 2a, the imposed UPL is identical for CAST-Air and MAST-Air Part I (0.925 V). By contrast, the lower current density in MAST-Air Part II is fixed, so the UPL depends on Pt loading and decreases with aging from 0.930 V to 0.865 V. Consistent with this lower UPL (and lower RH), Figure 2b shows smaller ECSA loss in MAST-Air Part II than in Part I.
Figure 2.
Effect of operating variables and MEA parameters on a-Pt/HSC catalyst degradation (i.e., ECSA loss) during CAST-Air and MAST-Air, (a) cathode UPL during ASTs and (b) comparative ECSA loss. ECSA loss is seen to be greater at higher operating potential and/or RH and is less sensitive to MEA parameters such as Pt loading and membrane thickness. For CAST-Air cycles, blue triangles, purple diamonds, and red diamonds represent RH levels of 30%, 50%, and 90%, respectively. Open and filled symbols denote test durations of 300 and 500 h, respectively. Unless otherwise specified, the Pt loading is 0.25 mg/cm2; orange-bordered symbols and orange lines indicate a Pt loading of 0.4 mg/cm2. For MAST-Air cycles, solid dark-green symbols and lines represent a Pt loading of 0.25 mg/cm2, whereas dark-green filled symbols with orange borders and orange lines indicate a Pt loading of 0.4 mg/cm2.
ECSA loss shows the expected strong dependence on relative humidity: CAST-Air at 90% RH yields substantially higher loss than at 50% and 30% RH [40,41]. As shown in Figure 1a, ECSA loss is relatively insensitive to Pt loading. Finally, ECSA loss does not depend explicitly on membrane type (HP or NC700), though membrane thickness and the associated HFR indirectly shift the cathode potential and thus the aging severity.
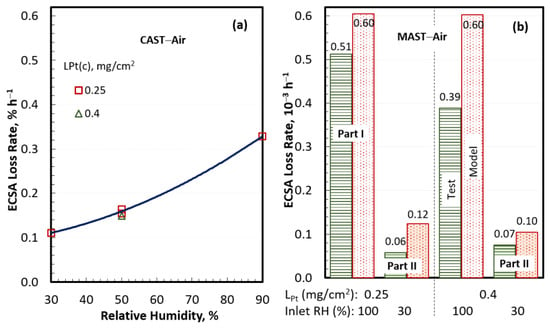
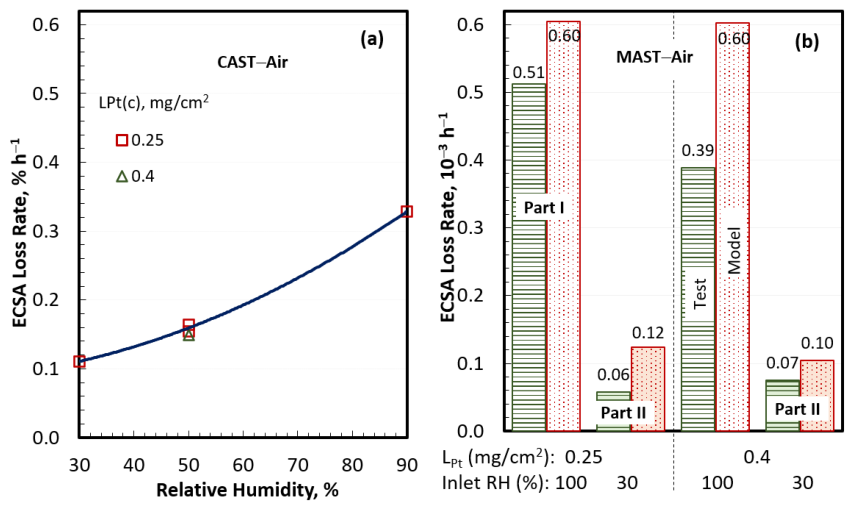
The effect of operating conditions and MEA parameters on catalyst stability are more readily discernible if Figure 2 results are recast in terms of the ECSA loss rate (k). In CAST-Air, Figure 3a shows substantially poorer stability under wet operation: k at 90% RH is more than 225% higher than at 30% RH. By comparison, k shows little dependence on Pt loading over 0.25–0.4 mg-Pt/cm2, remaining nearly unchanged across this range. Figure 3b highlights a strong potential dependence, with degradation accelerating at higher potentials; the experimentally derived k on MAST Part I is about 5–8× higher than on Part II.
Figure 3.
Degradation rate, characterized by ECSA loss rate, of a-Pt/HSC catalyst during CAST-Air and MAST-Air, (a) ECSA loss rate vs. RH and Pt loading and (b) ECSA loss rate in MAST-Air Part I vs. Part II. The measured ECSA loss rate weakly depends on Pt loading but is extremely sensitive to the operating UPL (higher in MAST-Air Part I than Part II) and RH.
4.2. Performance Degradation
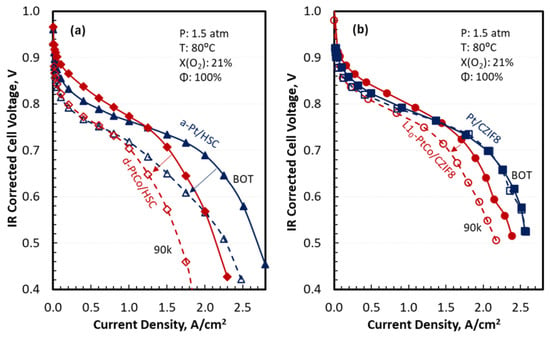
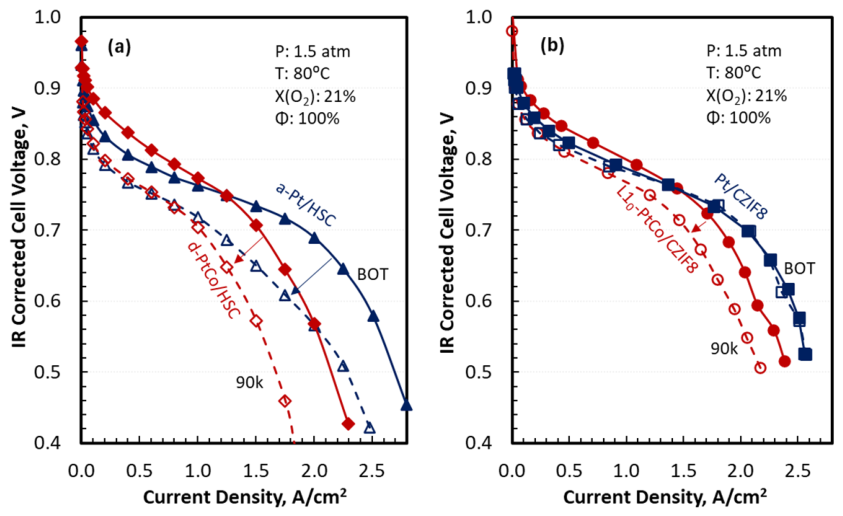
Figure 4 presents polarization curves in differential cells before and after 90k CAST-N2 cycles. The operating conditions are 1.5 atm, 80 °C, 100% RH and 21% O2. Although all four catalyst systems exhibit comparable stability in terms of ECSA loss (see Figure 1), the performance degradation is markedly different and is ordered as d-PtCo/HSC > a-Pt/HSC > L10-PtCo/CZIF8 > Pt/CZIF8.
Figure 4.
Performance degradation of MEAs with different ORR catalysts (0.25 mg/cm2 Pt loading in cathode) during CAST-N2 in 5 cm2 differential cells, (a) catalysts on HSC support and (b) catalysts on CZIF8 support. The solid lines and filled symbols are polarization curves at BOT. The dashed lines and open symbols are polarization curves after 90k cycles.
In the kinetic region, the voltage drop (∆V) at a given pressure (P), temperature (T), O2 mole fraction, RH and current density (i) is given by the following equation:
where R is the gas constant, αc is the symmetry factor (0.5), F is the Faraday constant, i0 is the exchange current density, and the superscript i denotes the initial (beginning of life) condition. The observed differences in voltage drops are attributed to the different way i0 decreases with the aging of the four catalyst systems. This decrease in i0 with aging is the largest for d-PtCo/HSC because of Co leaching and is the smallest for Pt/CZIF8. In a related study [30], it is shown that i0 for each catalyst system is uniquely related to APt through particle size, composition, catalyst–support interactions and microstructure. For the conditions illustrated in Figure 4, the voltage degradation rate is 0.39, 0.26, 0.23, and 0.15 mV/h in the kinetic region, i < ~0.5 A/cm2, for d-PtCo/HSC, a-Pt/HSC, L10-PtCo/CZIF8 and Pt/CZIF8, respectively. At higher current densities, total degradation can be much larger because aging also increases the O2 transport resistance, adding mass transport losses on top of kinetic losses.
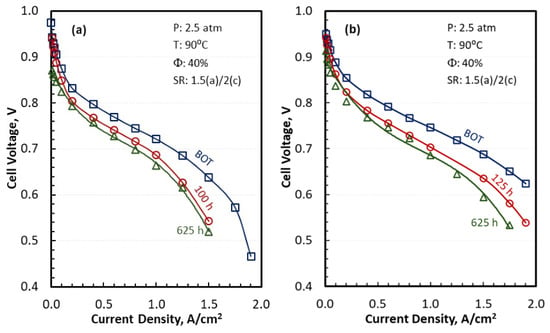
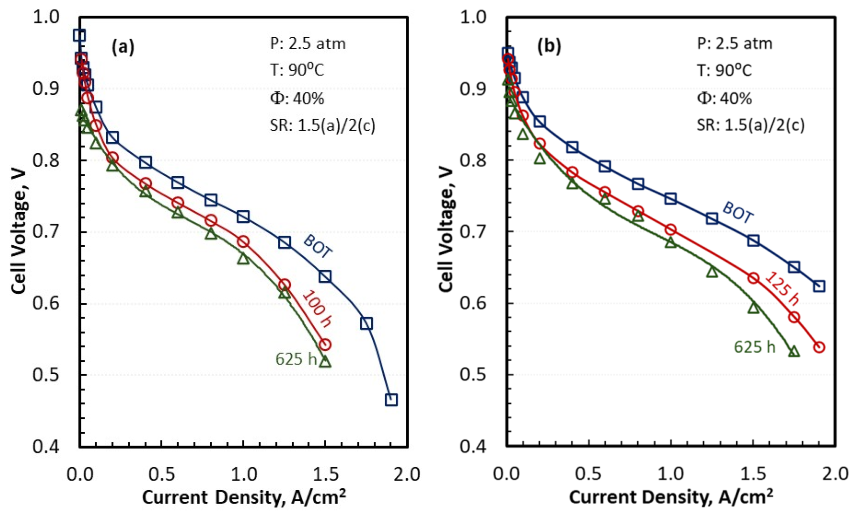
Figure 5 compares the polarization behavior of integral cells with a-Pt/HSC ORR cathodes at two Pt loadings (0.25 and 0.4 mg/cm2) measured before and after MAST-Air Part I and Part II, under HDV-relevant operating conditions: 2.5 atm inlet pressure, 90 °C, 40% inlet RH and 2/1.5 anode/cathode stoichiometry. Consistent with earlier results, the ECSA loss rate (a measure of catalyst stability) is essentially independent of Pt loading [42] and is higher in MAST-Air Part I than in Part II. Despite similar ECSA loss behavior across loadings, performance retention improves with higher Pt loading, i.e., voltage degradation at a fixed current density is reduced when the cathode has more Pt.
Figure 5.
Performance degradation of MEAs with a-Pt/HSC ORR catalyst during MAST-Air in 50 cm2 integral cells, (a) 0.25 mg/cm2 Pt loading and (b) 0.4 mg/cm2 Pt loading. The polarization curves are presented at BOT (blue lines and symbols), after 100 or 125 h in Part I (red lines and symbols), followed by additional 500 h in Part II (green lines and symbols). The operating conditions are 2.5 atm inlet pressure, 90 °C, 40% inlet RH and 1.5/2 anode/cathode stoichiometry.
At the HDV durability target point of 1.07 A/cm2, the 0.4 mg-Pt/cm2 cell starts at higher the beginning of life (BOL) voltage (738 mV) than the 0.25 mg-Pt/cm2 cell (711 mV) and degrades more slowly during Part I (0.357 mV/h vs. 0.417 mV/h). Degradation is substantially slower in MAST-Air Part II; at 1.07 A/cm2 the voltage decay rate for the 0.4 mg-Pt/cm2 cell drops to 0.038 mV/h, approximately an order of magnitude lower than in Part I.
4.3. Electrode Lifetime
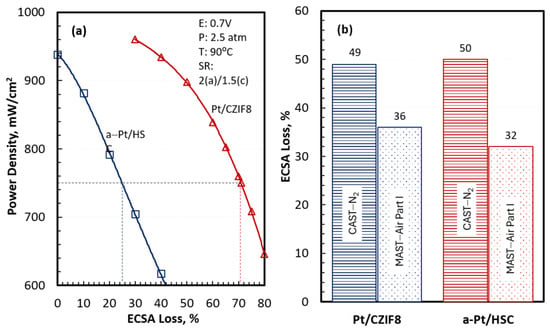
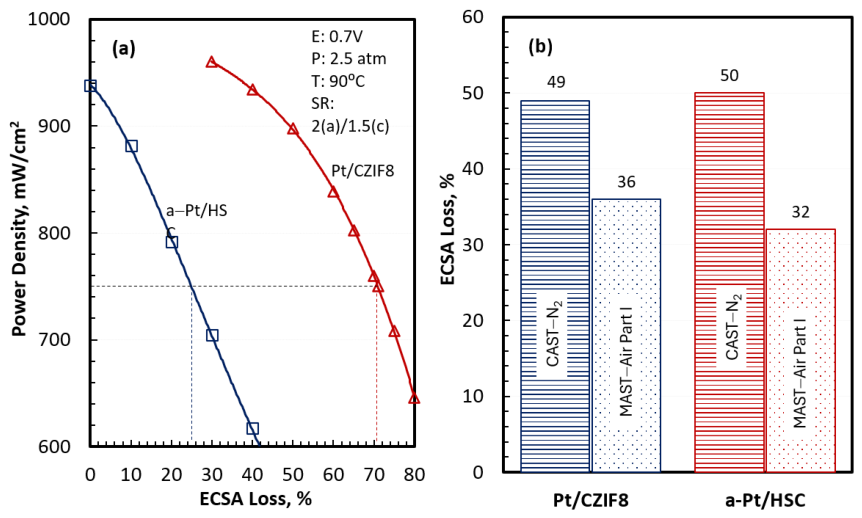
End of life (EOL) for an MEA in this study is defined as the point at which the cell power density drops to 750 mW/cm2 at 0.7 V, 2.5 atm, 90 °C, 40% inlet RH and 2/1.5 anode/cathode stoichiometry (SR) with a 14 μm, stabilized, reinforced membrane [27,30].
Figure 6a presents the modeled power density at 0.7 V as a function of ECSA loss in a large-area cell with co-flowing air/coolant and counter-flowing H2. The Pt loadings are 0.25 mg/cm2 at the cathode and 0.05 mg/cm2 at the anode. The operating conditions are 2.5 atm, 40% RH and 85 °C coolant temperature at inlet; 2/1.5 anode/cathode SR, 5 °C rise in coolant temperature; and 2.3 atm, 100% cathode RH, 100% anode RH and 90 °C coolant temperature at outlet. The dashed lines in Figure 6a denote the maximum acceptable ECSA loss corresponding to 750 mW/cm2 power density at EOL, consistent with 2.5 kW/g PGM (Pt group metal) utilization target; it is substantially higher for Pt/CZIF8 than a-Pt/HSC, 71% vs. 25%. These modeled thresholds can be compared to the measured ECSA losses on ASTs shown in Figure 6b: 49% on CAST-N2 and 36% on MAST-Air Part I for Pt/CZIF8 and 50% on CAST-N2 and 32% on MAST-Air Part I for a-Pt/HSC.
Figure 6.
Acceptable ECSA loss (dashed lines, left) as limited by 2.5 kW/g PGM utilization at 0.7 V, 2.5 atm, 90 °C, 40% RH and 1.5 cathode stoichiometry, (a) acceptable ECSA loss and (b) ECSA loss in CAST-N2 and MAST-Air Part I. This may be compared with the measured ECSA loss (right) in CAST-N2 and MAST-Air Part I. The Pt loading at the cathode is 0.25 mg/cm2.
The results in Figure 5 and Figure 6 highlight three main takeaways. First, Pt/CZIF8 has higher initial activity than a-Pt/HSC, resulting in higher BOL power density, 970 mW/cm2 vs. 940 mW/cm2. Second, Pt/CZIF8 not only starts higher but also retains activity better during aging than a-Pt/HSC. Third, despite differences in activity and activity retention, the two catalyst systems exhibit similar stability when defined by ECSA loss. The combination of higher initial activity, superior activity retention and similar stability lead to an acceptable ECSA loss that is much higher for Pt/CZIF8 than a-Pt/HSC.
We define electrode lifetime as the elapsed time on the Class-8 truck duty cycle at which the cell power density at 0.7 V declines to 750 mW/cm2. As discussed elsewhere [27,30], multiple engineered mitigation strategies can be applied to extend electrode lifetime, including hybridization to distribute transient load between the fuel cell and battery, MEA temperature control to reduce degradation rate, overloading the cathode catalyst to preserve performance as ECSA declines, MEA active area oversizing, and voltage clipping to avoid high-potential excursions that accelerate degradation. Table 2 summarizes outcomes from detailed dynamic simulations of a Class-8 truck duty cycle implementing these strategies [27,30]. The results are presented for two configurations of a 400 kWe fuel cell hybrid (FCH) powertrain: FCH-275, which pairs a 275 kWe fuel cell system (FCS) with a 106 kWh energy storage system (ESS) capable of delivering 125 kWe power, and FCH-175, which uses a smaller 175 kWe FCS combined with a larger 183 kWh ESS capable of providing 225 kWe power.
Table 2.
Projected lifetimes using drive cycle simulations with engineered mitigation strategies. Results for L10-PtCo/CZIF8 and a-Pt/HSC are documented in Ref. [30] and [33], respectively.
The baseline a-Pt/HSC catalyst with the target 0.25 mg/cm2 Pt loading, 25% acceptable ECSA loss, and 28% active area oversizing achieves 4700 h lifetime. Overloading the cathode to 0.4 mg-Pt/cm2 improves the acceptable ECSA loss to 38% and extends the lifetime to 17,440 h with 44% active area oversizing. A lifetime of 25,000 h is reached with the overloaded cathode if the EOL power density target is relaxed to 642 mW/cm2; in this case, the acceptable ECSA loss is 50%, and the active area oversizing is 67%.
Both L10-PtCo/CZIF8 and Pt/CZIF8 catalysts satisfy the 25,000 h lifetime requirement under the truck duty cycle at 0.25 mg/cm2 Pt loading at the cathode. The ECSA losses remain slightly below the acceptable limits, 53% vs. 55% for L10-PtCo/CZIF8 (margin 2 percentage points) and 64% vs. 71% for Pt/CZIF8 (margin 7 percentage points). As a result, the projected EOL power density exceeds the target of 750 mW/cm2, 760 mW/cm2 for L10-PtCo/CZIF8 (margin + 10 mW/cm2) and 810 mW/cm2 for Pt/CZIF8 (margin + 60 mW/cm2). These positive margins indicate there is operational headroom, suggesting that cell voltage limits and idle power constraints could potentially be relaxed for these two catalyst systems while meeting both lifetime and EOL performance targets.
4.4. Acceleration Factor
We define acceleration (loss) factor ALF as the ratio of electrode lifetime on Class 8 long-haul truck duty cycle to AST duration to produce the same ECSA loss. A higher ALF means the AST achieves the EOL-relevant ECSA loss in a shorter laboratory time, while still reproducing the dominant degradation mechanism seen in the field. Because different fuel cell components degrade via different pathways and stressors, separate ASTs are typically needed for membranes, catalyst supports and startup/shutdown transients. ALF therefore provides a direct quantitative bridge between laboratory durability testing and field-relevant lifetime.
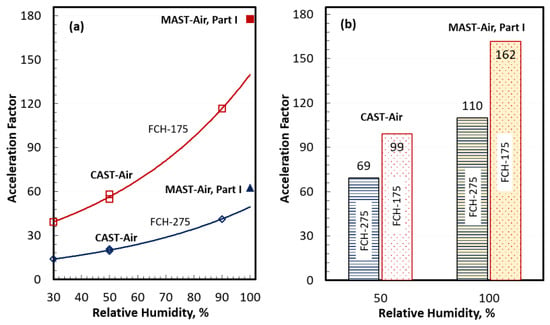
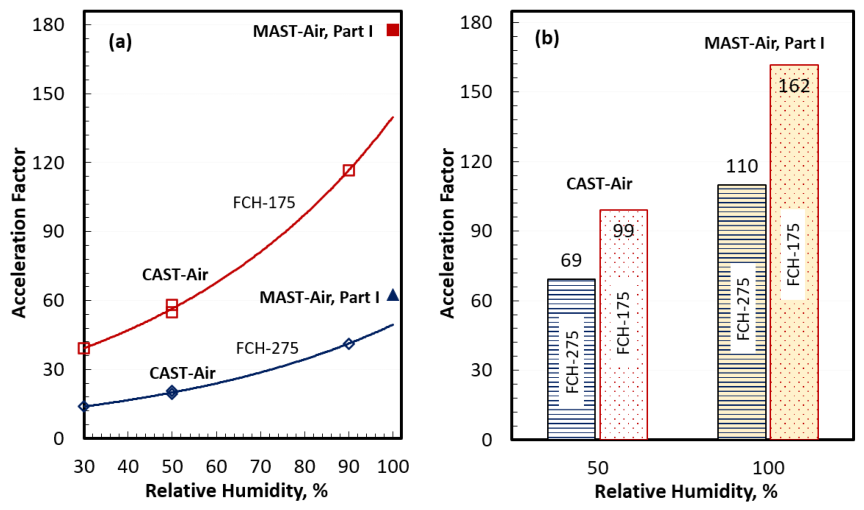
Figure 7a presents ALF for a-Pt/HSC with 0.25 mg-Pt/cm2 that achieves a lifetime of 4700 h on truck duty cycle before reaching 25% acceptable ECSA loss. On CAST-Air, this electrode suffers 25% ECSA loss after 118 h for an ALF of 40 at 90% RH, 313 h for an ALF of 15 at 50% RH, and 470 h for an ALF of 10 at 30% RH. On MAST-Air Part I with 100% inlet RH and shorter UPL/LPL holds, the ECSA loss reaches 25% after 74 h for an ALF of about 60. Because MAST-Air Part I achieves the same degradation endpoint faster, it yields a much higher acceleration factor and is more effective than CAST-Air for expediting AST.
Figure 7.
Acceleration factors (AF) for MEAs with a-Pt/HSC ORR catalyst subjected to CAST-Air and MAST-Air Part I, (a) 0.25 mg/cm2 Pt loading and (b) 0.4 mg/cm2 Pt loading. AF is higher for FCH-175 that experiences a less dynamic drive cycle than FCH-275. It is also higher for MAST-Air Part I that has shorter test time but the same number of cycles as CAST-Air.
Figure 7b presents ALF for a-Pt/HSC with 0.4 mg-Pt/cm2 that achieves a lifetime of 17,440 h on truck duty cycle before reaching 38% acceptable ECSA loss. On CAST-Air, this electrode suffers 38% ECSA loss after 253 h on CAST-Air for an ALF of 69 at 50% RH, and after 159 h on MAST-Air Part I for an ALF of 110 at 100% RH.
Figure 7 also includes results for a hybrid truck platform (FCH-175) with a 175 kWe FCS and 86 kWh energy storage system (ESS). A smaller FCS and a larger ESS extend the projected lifetime of the a-Pt/HSC electrode to 13,340 h with a cathode Pt loading of 0.25 mg/cm2 and to 25,600 h with a cathode Pt loading of 0.4 mg/cm2. The corresponding acceleration factors increase by 45% and 83% for 0.25 and 0.4 mg/cm2 Pt loading, respectively.
The acceleration factor is uniquely determined by multiple variables, including catalyst formulation, Pt loading, AST protocol, duty-cycle characteristics, the end-of-life criterion, and system-level mitigation strategies. ALF increases under AST conditions that accelerate ECSA loss, including elevated relative humidity, higher temperature, shorter cycle time, and higher upper potential limit. Conversely, ALF also increases when system-design and operating strategies extend catalyst lifetime on real-world drive cycle conditions. Examples include higher Pt loading, lower allowable power density at EOL, and implementation of durability-enhancing mitigation strategies, such as voltage clipping, MEA active area oversizing, and increased hybridization.
Table 3 outlines a simple procedure to translate AST-derived degradation data into an estimated electrode lifetime under a specified duty cycle. The required inputs are (i) the allowable ECSA loss from the degradation model (Figure 6a), (ii) the ECSA loss rate k measured during AST, and (iii) the duty-cycle lifetime of a reference catalyst system with the same Pt loading (e. g., a-Pt/HSC in Table 3). The procedure computes the projected AST duration to reach the allowable ECSA loss, then scales that result relative to the reference electrode to estimate the corresponding duty-cycle lifetime.
Table 3.
Projected lifetime and acceleration factor using H2/Air MEA AST Part I data.
The estimated lifetime on the duty cycle is valid only under the engineered mitigation strategies implemented in the reference electrode system. The estimate should be validated using detailed drive cycle simulations that incorporate electrode system-specific performance degradation and stability models.
5. Conclusions
Although accelerated stress tests are routinely used for rapid screening of fuel cell materials, there is growing interest in making them quantitative. The objective of this study was to evaluate several catalysts and MEA AST protocols and to develop methods for using AST data to project catalyst and electrode lifetimes on HDV-relevant duty cycles. The study considered three Pt and Pt-alloy catalysts, two catalyst supports, and three AST protocols conducted in both differential and integral cells. The main conclusions regarding catalyst stability, performance degradation, electrode lifetime and acceleration factors are briefly discussed below.
Catalyst Stability: The relative stability of the ORR catalysts during ASTs of different durations can be compared using the ECSA loss rate (k). In this study, k was broadly similar across the catalyst systems and Pt loadings investigated. In contrast, k depended strongly on the AST protocol—particularly UPL, ramp rate and cycle time—as well as on exposure conditions such as RH and temperature. It was relatively insensitive to the gas environment, whether H2/N2 or H2/Air.
Performance Degradation: Degradation in cell performance can be described through ECSA loss and the resulting changes in exchange current density, i0 (), and O2 transport resistance. These degradation effects depend on several factors, including catalyst particle size, composition, catalyst–support interactions, the catalyst–ionomer interface, and electrode microstructure. For a given ECSA loss, the severity of performance degradation among the catalyst systems investigated in this work follows the order d-PtCo/HSC > a-Pt/HSC > L10-PtCo/CZIF8 > Pt/CZIF8. In addition, the degradation becomes less severe at higher Pt loadings.
Electrode Lifetime: A simple procedure was developed to estimate electrode lifetime from AST-derived degradation data. The method uses the allowable ECSA loss predicted by the degradation model, ECSA loss rate measured during AST, and the duty-cycle lifetime of a reference catalyst system with the same Pt loading. This estimate is only valid under the engineered mitigation strategies applied in the reference electrode system and should be confirmed through detailed drive cycle simulations that account for electrode-system-specific performance degradation and stability behavior.
Acceleration Factor: The AST data can be quantified using an acceleration (loss) factor ALF, defined as the ratio of the electrode lifetime, measured in field tests or projected by simulations, to the AST duration required to produce the same ECSA loss at EOL. A larger ALF indicates that the AST reproduces the EOL-relevant degradation in a shorter laboratory time while maintaining the dominant field degradation mechanism. The ALF depends on the catalyst, Pt loading, AST protocol and the application duty cycle. For a-Pt/HSC at a Pt loading of 0.25 mg/cm2, the projected ALF in CAST-Air is 10, 15, and 40 at 30%, 50% and 90% RH, respectively, while MAST-Air Part I gives an ALF of 60. At a higher Pt loading, 0.4 mg/cm2, the ALF increases to 69 in CAST-Air at 50% RH, and to 110 in MAST-Air Part I. Under a milder hybrid duty cycle with enhanced load sharing and the same 0.4 mg/cm2 Pt loading, the ALF further increases to 99 in CAST-Air at 50% RH and to 162 on MAST-Air Part I.
To conclude, an innovative unified framework has been developed that (a) outlines the steps for constructing an electrode stability model, (b) specifies the supporting data to be collected in differential cells, (c) defines the validation data required from integral cell testing, (d) describes methods for projecting electrode lifetime under heavy-duty vehicle drive cycles, and (e) establishes a basis for determining acceleration loss factors from AST data. The validated model is particularly valuable for emerging ORR catalysts available only in limited quantities and for catalyst systems lacking field operational data.
There are avenues for future work. First, the degradation models developed in this study are based on experimental data from small-area differential and integral single cells. These models should be validated using data from large area stacks and calibrated against field data that include documented duty cycles, failure modes and criteria, and measured lifetimes. Second, the framework should be broadened to incorporate other degradation mechanisms, such as support corrosion during engineered startups and shutdowns. Third, following the down-selection of the optimal catalyst and catalyst support and the establishment of a volume manufacturing capability, replicate cell tests under identical operating conditions should be performed to quantify experimental variability and improve the statistical robustness of the reported results.
Author Contributions
Conceptualization, R.A., J.S.S., K.C.N. and R.M.; methodology, R.A., X.W. (Xiaohua Wang), L.H., T.V.C., X.W. (Xiaojing Wang), J.S.S., K.C.N. and R.M.; software, X.W. (Xiaohua Wang), K.C., C.M.Q. and E.Y.; validation, X.W. (Xiaohua Wang), L.H., T.V.C. and X.W. (Xiaojing Wang); formal analysis, X.W. (Xiaohua Wang), L.H., T.V.C. and X.W. (Xiaojing Wang); investigation, X.W. (Xiaohua Wang), L.H., K.C., C.M.Q., E.Y., T.V.C. and X.W. (Xiaojing Wang); resources, R.A., J.S.S., K.C.N. and R.M.; data curation, X.W. (Xiaohua Wang), L.H., T.V.C. and X.W. (Xiaojing Wang); writing—original draft preparation, R.A., L.H., T.V.C., X.W. (Xiaojing Wang) and R.M.; writing—review and editing, X.W. (Xiaohua Wang); visualization, R.A., X.W. (Xiaohua Wang), L.H., T.V.C. and X.W. (Xiaojing Wang); supervision, R.A., J.S.S., K.C.N. and R.M.; project administration, R.A., J.S.S., K.C.N. and R.M.; funding acquisition, R.A., J.S.S., K.C.N. and R.M. All authors have read and agreed to the published version of the manuscript.
Funding
This work was supported by the U.S. Department of Energy Office of Critical Minerals and Energy Innovation Alternative Fuels and Feedstocks Office through the Multi-Modal Fuel Cell Technologies consortium (DOE AOP project award: WBS 4.5.0.002), technology managers G. Kleen and D. Papageorgopoulos.
Institutional Review Board Statement
Not applicable.
Informed Consent Statement
Not applicable.
Data Availability Statement
Acknowledgments
Argonne National Laboratory is managed for the U.S. Department of Energy by the University of Chicago Argonne, LLC, also under contract DE-AC-02-06CH11357. This work was performed in part at the National Laboratory of the Rockies for the U.S. Department of Energy (DOE), operated under Contract No. DE-AC36-08GO28308, and at the Center for Integrated Nanotechnologies, an Office of Science User Facility operated for the U.S. Department of Energy Office of Science by Los Alamos National Laboratory (Contract 89233218CNA000001). The views expressed in the article do not necessarily represent the views of the DOE or the U.S. Government. The U.S. Government retains and the publisher, by accepting the article for publication, acknowledges that the U.S. Government retains a nonexclusive, paid-up, irrevocable, worldwide license to publish or reproduce the published form of this work, or allow others to do so, for U.S. Government purposes.
Conflicts of Interest
The authors declare no conflicts of interest. The funders had no role in the design of the study; in the collection, analyses, or interpretation of the data; in the writing of the manuscript; or in the decision to publish the results.
Nomenclature
| A | electrochemical specific area, m2/g |
| AST | accelerated stress test |
| ECSA | electrochemical specific surface area |
| F | Faraday constant |
| k | ECSA loss rate, 1/h |
| e | minimum attainable ECSA |
| H | hydrogen |
| i | initial |
| i0 | exchange current density |
| Pt | platinum |
| Q | total electric charge |
| r | reference |
| R | gas constant |
| T | temperature |
| αc | oxygen reduction reaction symmetric factor |
| ΔV | cell voltage drops |
Appendix A
Figure A1.
Streamlined framework for degradation model development, showing supporting differential cell data, integral cell validation, electrode lifetime modeling, and ALF calculation.
The heavy-duty vehicle considered in this study is a long-haul Class 8 truck, as defined by the 21st Century Truck Partnership [27], with a gross vehicle weight (GVW) of 36.3 metric tons (80,000 lb). The daily duty cycle spans 12 h and includes three extended parking periods totaling 2.5 h. The vehicle requires a traction motor input power of 500 kWe at peak load, 400 kWe continuously while climbing a 6% grade at 30 mph, and 160 kWe during sustained operation at 65 mph on a level road (0% grade). The average power demand on the duty cycle is 140 kWe.
Figure A2.
CVs collected during MAST−Air protocol Part I, with the derived ECSA values shown in Figure 1a: (a) Pt/CZIF8 and (b) a−Pt/HSC.
References
- Borup, R.; Meyers, J.; Pivovar, B.; Kim, Y.S.; Mukundan, R.; Garland, N.; Myers, D.; Wilson, M.; Garzon, F.; Wood, D.; et al. Scientific Aspects of Polymer Electrolyte Fuel Cell Durability and Degradation. Chem. Rev. 2007, 107, 3904–3951. [Google Scholar] [CrossRef] [Scilit] [PubMed]
- de Bruijn, F.A.; Dam, V.A.T.; Janssen, G.J.M. Review: Durability and Degradation Issues of PEM Fuel Cell Components. Fuel Cells 2008, 8, 3–22. [Google Scholar] [CrossRef] [Scilit]
- Dubau, L.; Castanheira, L.; Maillard, F.; Chatenet, M.; Lottin, O.; Maranzana, G.; Dillet, J.; Lamibrac, A.; Perrin, J.; Moukheiber, E.; et al. A Review of PEM Fuel Cell Durability: Materials Degradation, Local Heterogeneities of Aging and Possible Mitigation Strategies. WIREs Energy Environ. 2014, 3, 540–560. [Google Scholar] [CrossRef] [Scilit]
- Nguyen, H.L.; Han, J.; Nguyen, X.L.; Yu, S.; Goo, Y.-M.; Le, D.D. Review of the Durability of Polymer Electrolyte Membrane Fuel Cell in Long-Term Operation: Main Influencing Parameters and Testing Protocols. Energies 2021, 14, 4048. [Google Scholar] [CrossRef] [Scilit]
- Takahashi, T.; Ikeda, T.; Murata, K.; Hotaka, O.; Hasegawa, S.; Tachikawa, Y.; Nishihara, M.; Matsuda, J.; Kitahara, T.; Lyth, S.M.; et al. Accelerated Durability Testing of Fuel Cell Stacks for Commercial Automotive Applications: A Case Study. J. Electrochem. Soc. 2022, 169, 044523. [Google Scholar] [CrossRef] [Scilit]
- Thiele, P.; Gouveia, L.; Ulrich, O.; Yang, Y.; Liu, Y.; Wick, M.; Pischinger, S. Realistic Accelerated Stress Tests for PEM Fuel Cells: Operation Condition Dependent Load Profile Optimization. J. Power Sources 2024, 617, 234959. [Google Scholar] [CrossRef] [Scilit]
- Garland, N.; Benjamin, T.; Kopasz, J. DOE Fuel Cell Program: Durability Technical Targets and Testing Protocols. ECS Trans. 2007, 11, 923–931. [Google Scholar] [CrossRef] [Scilit]
- Stariha, S.; Macauley, N.; Sneed, B.T.; Langlois, D.; More, K.L.; Mukundan, R.; Borup, R.L. Recent Advances in Catalyst Accelerated Stress Tests for Polymer Electrolyte Membrane Fuel Cells. J. Electrochem. Soc. 2018, 165, F492–F501. [Google Scholar] [CrossRef] [Scilit]
- Macauley, N.; Papadias, D.D.; Fairweather, J.; Spernjak, D.; Langlois, D.; Ahluwalia, R.; More, K.L.; Mukundan, R.; Borup, R.L. Carbon Corrosion in PEM Fuel Cells and the Development of Accelerated Stress Tests. J. Electrochem. Soc. 2018, 165, F3148–F3160, Erratum in J. Electrochem. Soc. 2018, 165, X15. https://doi.org/10.1149/2.0611813jes. [Google Scholar] [CrossRef] [Scilit]
- Mukundan, R.; Baker, A.M.; Kusoglu, A.; Beattie, P.; Knights, S.; Weber, A.Z.; Borup, R.L. Membrane Accelerated Stress Test Development for Polymer Electrolyte Fuel Cell Durability Validated Using Field and Drive Cycle Testing. J. Electrochem. Soc. 2018, 165, F3085–F3093. [Google Scholar] [CrossRef] [Scilit]
- Al Rafei, T.; Steiner, N.Y.; Pahon, E.; Hissel, D. Toward a Representative Accelerated Stress Test for PEMFC Stacks in Automotive Applications. Appl. Energy 2025, 401, 126790. [Google Scholar] [CrossRef] [Scilit]
- Zhang, S.; Yuan, X.; Wang, H.; Merida, W.; Zhu, H.; Shen, J.; Wu, S.; Zhang, J. A Review of Accelerated Stress Tests of MEA Durability in PEM Fuel Cells. Int. J. Hydrogen Energy 2009, 34, 388–404. [Google Scholar] [CrossRef] [Scilit]
- Rodgers, M.P.; Bonville, L.J.; Kunz, H.R.; Slattery, D.K.; Fenton, J.M. Fuel Cell Perfluorinated Sulfonic Acid Membrane Degradation Correlating Accelerated Stress Testing and Lifetime. Chem. Rev. 2012, 112, 6075–6103. [Google Scholar] [CrossRef] [Scilit] [PubMed]
- Johnson, E.F.; Mukundan, R.; Weber, A.Z. Membrane Degradation in PEM Fuel Cells: Part I. Modeling Gas Crossover and the Pt Band. J. Electrochem. Soc. 2026, 173, 024504. [Google Scholar] [CrossRef] [Scilit]
- Huang, X.; Solasi, R.; Zou, Y.; Feshler, M.; Reifsnider, K.; Condit, D.; Burlatsky, S.; Madden, T. Mechanical Endurance of Polymer Electrolyte Membrane and PEM Fuel Cell Durability. J. Polym. Sci. B Polym. Phys. 2006, 44, 2346–2357. [Google Scholar] [CrossRef] [Scilit]
- Lai, Y.-H.; Rahmoeller, K.M.; Hurst, J.H.; Kukreja, R.S.; Atwan, M.; Maslyn, A.J.; Gittleman, C.S. Accelerated Stress Testing of Fuel Cell Membranes Subjected to Combined Mechanical/Chemical Stressors and Cerium Migration. J. Electrochem. Soc. 2018, 165, F3217–F3229. [Google Scholar] [CrossRef] [Scilit]
- Hicks, M.; Pierpont, D.; Turner, P.; Watschke, T. Accelerated Testing and Lifetime Modeling for the Development of Durable Fuel Cell MEAs. ECS Trans. 2006, 1, 229–237. [Google Scholar] [CrossRef] [Scilit]
- Maass, S.; Finsterwalder, F.; Frank, G.; Hartmann, R.; Merten, C. Carbon Support Oxidation in PEM Fuel Cell Cathodes. J. Power Sources 2008, 176, 444–451. [Google Scholar] [CrossRef] [Scilit]
- Reiser, C.A.; Bregoli, L.; Patterson, T.; Yi, J.S.; Yang, J.D.; Perry, M.L.; Jarvi, T.D. A Reverse-Current Decay Mechanism for Fuel Cells. Electrochem. Solid-State Lett. 2005, 8, A273–A276. [Google Scholar] [CrossRef] [Scilit]
- Myers, D.J.; Wang, X.; Smith, M.C.; More, K.L. Potentiostatic and Potential Cycling Dissolution of Polycrystalline Platinum and Platinum Nanoparticle Fuel Cell Catalysts. J. Electrochem. Soc. 2018, 165, F3178–F3190. [Google Scholar] [CrossRef] [Scilit]
- Della Bella, R.K.F.; Stühmeier, B.M.; Gasteiger, H.A. Universal Correlation between the Roughness Factor and PEMFC Performance Losses in Voltage Cycling Based Accelerated Stress Tests. Meet. Abstr. 2022, MA2022-01, 1427. [Google Scholar] [CrossRef] [Scilit]
- Borup, R.L.; Davey, J.R.; Garzon, F.H.; Wood, D.L.; Inbody, M.A. PEM Fuel Cell Electrocatalyst Durability Measurements. J. Power Sources 2006, 163, 76–81. [Google Scholar] [CrossRef] [Scilit]
- Padgett, E.; Yarlagadda, V.; Holtz, M.E.; Ko, M.; Levin, B.D.A.; Kukreja, R.S.; Ziegelbauer, J.M.; Andrews, R.N.; Ilavsky, J.; Kongkanand, A.; et al. Mitigation of PEM Fuel Cell Catalyst Degradation with Porous Carbon Supports. J. Electrochem. Soc. 2019, 166, F198–F207. [Google Scholar] [CrossRef] [Scilit]
- Yarlagadda, V.; Ramaswamy, N.; Kukreja, R.S.; Kumaraguru, S. Ordered Mesoporous Carbon Supported Fuel Cell Cathode Catalyst for Improved Oxygen Transport. J. Power Sources 2022, 532, 231349. [Google Scholar] [CrossRef] [Scilit]
- Borup, R.L.; Weber, A.Z. M2FCT: Million Mile Fuel Cell Truck Consortium ; U.S. Department of Energy: Washington, DC, USA, 2024. Available online: https://www.hydrogen.energy.gov/docs/hydrogenprogramlibraries/pdfs/review24/fc339_borup_weber_2024_o.pdf?sfvrsn=c704d564_3 (accessed on 1 October 2026).
- Multi Modal Fuel Cell Technologies. Formerly Million Mile Fuel Cell Truck, AST Protocols. Available online: https://m2fct.org/ast-protocols (accessed on 1 October 2026).
- Ahluwalia, R.K.; Wang, X. Performance and Durability of Hybrid Fuel Cell Systems for Class-8 Long Haul Trucks. J. Electrochem. Soc. 2024, 171, 034507. [Google Scholar] [CrossRef] [Scilit]
- Wang, X.; Hu, L.; Neyerlin, K.C.; Ahluwalia, R.K. Baselining Activity and Stability of ORR Catalysts and Electrodes for Proton Exchange Membrane Fuel Cells for Heavy-Duty Applications. J. Electrochem. Soc. 2023, 170, 024503–024512. Available online: https://iopscience.iop.org/article/10.1149/1945-7111/acb847/pdf (accessed on 27 October 2026). [CrossRef] [Scilit]
- Li, S.; Li, J.-J.; Xu, C.; Zhang, L.; Li, A.; Song, T.-W.; Zhang, W.; Tong, L.; Liang, H.-W. Multigram-Scale Synthesis of High-Pt-Content PtCo Intermetallic Catalysts for Proton Exchange Membrane Fuel Cells. ACS Mater. Lett. 2024, 6, 706–712. [Google Scholar] [CrossRef] [Scilit]
- Ahluwalia, R.K.; Wang, X.; Chen, K.; Wang, X.; Spendelow, J.S. Performance and Durability of Heavy-Duty Fuel Cell Systems with an Advanced Ordered Intermetallic ORR Alloy Catalyst and Novel Support. J. Electrochem. Soc. 2024, 171, 114512–114523. [Google Scholar] [CrossRef] [Scilit]
- Park, J.; Park, J.; Pappas, N.S.; Li, K.; Chen, K.; Wang, X.; Wu, G.; Myers, D.J.; Spendelow, J.S. Advancing Proton-Exchange Membrane Fuel Cell Catalyst Layers: Ink Processing and Performance Optimization of Novel PtCo and Pt Catalysts. ECS Meet. Abstr. 2025, MA2025-02, 2047. [Google Scholar] [CrossRef] [Scilit]
- Umicore. Fuel Cell and Stationary Catalysts. Available online: https://fcs.umicore.com/en/fuel-cells/products/ (accessed on 3 September 2026).
- Qiao, Z.; Wang, C.; Li, C.; Zeng, Y.; Hwang, S.; Li, B.; Karakalos, S.; Park, J.; Kropf, A.J.; Wegener, E.C.; et al. Atomically Dispersed Single Iron Sites for Promoting Pt and Pt3Co Fuel Cell Catalysts: Performance and Durability Improvements. Energy Environ. Sci. 2021, 14, 4948–4960. [Google Scholar] [CrossRef] [Scilit]
- Nguyen, H.; Stiegeler, J.; Liepold, H.; Schwarz, C.; Vierrath, S.; Breitwieser, M. A Comparative Study of Conditioning Methods for Hydrocarbon-Based Proton-Exchange Membrane Fuel Cells for Improved Performance. Energy Technol. 2023, 11, 2300202. [Google Scholar] [CrossRef] [Scilit]
- Sandbeck, D.J.S.; Secher, N.M.; Speck, F.D.; Sørensen, J.E.; Kibsgaard, J.; Chorkendorff, I.; Cherevko, S. Particle Size Effect on Platinum Dissolution: Considerations for Accelerated Stability Testing of Fuel Cell Catalysts. ACS Catal. 2020, 10, 6281–6290. [Google Scholar] [CrossRef] [Scilit]
- Liu, J.; Ji, Q.; Imai, T.; Ariga, K.; Abe, H. Sintering-Resistant Nanoparticles in Wide-Mouthed Compartments for Sustained Catalytic Performance. Sci. Rep. 2017, 7, 41773. [Google Scholar] [CrossRef] [Scilit] [PubMed]
- Kneer, A.; Wagner, N.; Sadeler, C.; Scherzer, A.-C.; Gerteisen, D. Effect of Dwell Time and Scan Rate during Voltage Cycling on Catalyst Degradation in PEM Fuel Cells. J. Electrochem. Soc. 2018, 165, F805–F812. [Google Scholar] [CrossRef] [Scilit]
- Zihrul, P.; Hartung, I.; Kirsch, S.; Huebner, G.; Hasché, F.; Gasteiger, H.A. Voltage Cycling Induced Losses in Electrochemically Active Surface Area and in H2/Air Performance of PEM Fuel Cells. J. Electrochem. Soc. 2016, 163, F492–F498. [Google Scholar] [CrossRef] [Scilit]
- Zhu, G.; Zhang, Q.; Li, C.; Yu, H.; Cullen, D.A.; Marina, O.C.; Li, Z.-H.; Wayne, D.M.; Xie, J. Durability of PGM Catalyst MEAs of Polymer Electrolyte Membrane Fuel Cells for Heavy-Duty Vehicles. Chem. Catal. 2025, 5, 101303. [Google Scholar] [CrossRef] [Scilit]
- Schneider, P.; Scherzer, A.-C.; Storey, B.D.; Klingele, M.; Zamel, N.; Gerteisen, D. The Effect of Ionomer to Carbon Ratio and Relative Humidity on Cathode Catalyst Degradation in PEM Fuel Cells. J. Electrochem. Soc. 2023, 170, 104505. [Google Scholar] [CrossRef] [Scilit]
- Ma, Y.; Zhang, J.; Yang, K.; Lin, Q.; Sun, B.; Hu, Z.; Zhai, S. Data-Driven Electrochemically Active Surface Area Loss Modeling and Its Application in Fuel Cell Stack Degradation Prediction. J. Power Sources 2025, 659, 238354. [Google Scholar] [CrossRef] [Scilit]
- Sgarbi, R.; Ait Idir, W.; Labarde, Q.; Mermoux, M.; Wu, P.; Mainka, J.; Dillet, J.; Marty, C.; Micoud, F.; Lottin, O.; et al. Does the Platinum Loading in Proton-Exchange Membrane Fuel Cell Cathodes Influence the Durability of the Membrane-Electrode Assembly? Ind. Chem. Mater. 2023, 1, 501–515. [Google Scholar] [CrossRef] [Scilit]

Disclaimer/Publisher’s Note: The statements, opinions and data contained in all publications are solely those of the individual author(s) and contributor(s) and not of MDPI and/or the editor(s). MDPI and/or the editor(s) disclaim responsibility for any injury to people or property resulting from any ideas, methods, instructions or products referred to in the content. |
© 2026 by the authors. Licensee MDPI, Basel, Switzerland. This article is an open access article distributed under the terms and conditions of the Creative Commons Attribution (CC BY) license.