


Abstract
Citizens’ social media posts can provide rapid, complementary situational information during emerging wildfires, alongside conventional sensing and official reporting. For Greek, no annotated wildfire corpus or end-to-end pipeline existed, and most systems stop at binary detection or depend on geotags. We present an end-to-end Greek-language NLP pipeline, a research prototype that turns keyword-retrieved, unlabeled X posts into a geolocated, near-real-time wildfire map: it detects active fires, types them as wildland, urban, or mixed, resolves toponyms, and clusters reports into incidents. On 3277 manually annotated posts from two fire seasons, the first publicly released, agreement-audited Greek wildfire corpus to our knowledge, fine-tuned transformers reached F2 = 0.911 for detection and macro-F1 = 0.874 for fire type, outperforming classical baselines and, under the tested prompting conditions, two large language models, while being faster and free of API costs. On a chronological hold-out of the unseen 2025 season, detection retains F2 = 0.850 (classification recall 0.907); fire-type classification degrades more (macro-F1 0.769 ± 0.085). Spatiotemporal toponym disambiguation raised geocoding accuracy from 54.68% to 80.58% (p < 0.001); a repeatability test revealed gazetteer drift. In a retrospective replay of 12 August 2024 posts, it resolved hundreds of reports of an Attica wildfire into one incident cluster, complementing emergency calls.
1. Introduction
The Mediterranean region faces one of the most serious environmental threats: wildfires, which increasingly occur in the built environment due to a warming climate and a longer fire season [1,2]. Greece has been one of the most severely impacted countries: the wildfire near the city of Alexandroupolis in 2023 was the largest single wildfire in Europe since systematic monitoring was started by the European Forest Fire Information System (EFFIS) in 2000 [3], and repeated fire seasons have put human life, ecosystems, and critical infrastructure at risk. One hallmark of this escalation is the growth of the Wildland–Urban Interface (WUI), the area where communities and wildland areas meet [4]. Even with a decrease in total area burned, the impacts are apparent: in 2024, although the area burned was significantly less than in past years, the societal impacts were disproportionately high [5]. The Varnavas fire of August 2024 is representative, affecting more than 1200 structures and some 4000 residents, with an estimated 90% of its burned area having already burned in the previous 20 years; across the 2017–2024 seasons, an estimated 26% of Attica’s total surface area—corresponding to 37% of its forest area—was burned [6]. Worse still, only 16.8% of recorded fires are investigated, and a cause is determined in just 12.1% of cases, even though more than 90% of fires are estimated to be associated with human activity or infrastructure [7].
Rapid wildfire detection is not just a technical issue; it is a public-health issue. The fire hazard and the heat hazard affect the same vulnerable populations; in recent years, fire seasons in the Mediterranean have been more likely to overlap with heat waves, and a recent meta-analysis of 55 observational studies has shown that heat-wave exposure is consistently associated with increased hospitalizations and emergency-department visits among frail older adults [8]. Wildfires add smoke exposure and evacuation to that burden, and early detection shortens the time during which residents, especially older residents, remain exposed and gives health and civil-protection services time to respond. Detection latency is thus a factor in health outcomes and territorial resilience, and not just in situational awareness.
Traditional detection and monitoring methods struggle to detect and monitor these high-intensity, frequent fires. With limited geographic reach and prohibitive operating costs, fire services are increasingly using drones and thermal cameras. Still, these have limitations in flight range, installation and maintenance costs, and coverage. On a larger scale, significant projects now combine satellite constellations with AI for early detection, such as the FireSat constellation of Google (Mountain View, CA, USA) [9] and the wildfire constellation of OroraTech (Munich, Germany) [10]. Greece recently announced the installation of what is said to be the world’s first national satellite system for natural disaster monitoring [11]. However, even the most sophisticated spaceborne systems have intrinsic limitations: data latency compromises situational awareness, and cloud cover, smoke, and sunlight reflections cause frequent false alarms [12]. These gaps have fostered continued interest in complementary, low-latency data sources, such as the rapid development since 2017 of deep learning approaches to fire detection using camera data [13]. One source, however, remains underused and is already widespread among the affected population.
That source is social media. The popularization of everyday communication in the digital realm has led researchers to think about the Internet as a real-time indicator of physical events, rather than just a series of posts: online activity is not just a form of communication, but a digital footprint that can be used in computational social science and citizen science [14]. Since most fires occur when people are around, people during a wildfire can become a distributed “social sensor” and share first-hand information. Kirilenko et al. describe X (previously Twitter) as a big system of mobile sensors that respond to external stimuli by sending out a burst of messages during extreme events [15], and Sakaki et al. have applied the idea to a real-world application: a Twitter-based earthquake-reporting system that sends alerts out before the Japan Meteorological Agency [16]. In the context of crisis informatics [17,18], such volunteered geographic information is a well-known means of supporting effective crisis response [19]. In Greece, self-organization around this task is already underway: the Facebook community “Πυρκαγιά Eνημέρωση” (“Fire Update”) was created in 2019 and, by early 2026, had reached over 166,000 members who post real-time information, evacuation alerts, and requests for assistance during a fire.
However, making Greek-language social media platforms actionable wildfire intelligence is not easy, and three gaps emerge. First, the Greek language is very under-resourced for crisis informatics compared to languages such as English or Portuguese, where annotated corpora are generally available; because no such fire-related corpus exists for Greek, any supervised system must be built from annotated data assembled from scratch [20]. The linguistic features of Greek social media, such as inflectional morphology, informal abbreviations and slang, and the use of “Greeklish” (Greek written in Latin letters), are not well supported by standard pipelines. Second, most wildfire detection work, including the few studies focused on Greece, treats the problem as binary classification, distinguishing only fire-related posts from noise. However, this is limiting; it loses finer distinctions, such as wildland, urban, or mixed, that determine resource allocation during an incident. Existing Greek approaches are also limited by their data sources: they rely on simulated user reactions [21] or heavily on official sources [22] (which are generally available only after verification), limiting social media’s early-warning potential. Third, location is a recurring challenge: less than 1% of posts have location tags [23], and the location must be recovered from free text, which is difficult because of the ambiguity of toponyms, as well as because of weak heuristics, such as only keeping the first place mentioned in a post [22], which can misplace events when multiple locations are mentioned in a single post. These gaps define the scope of this work.
In this paper, we propose an end-to-end machine-learning and natural-language-processing pipeline to detect, classify, and map active wildfire events in Greece directly from Greek X (formerly Twitter) posts. It is developed on a purpose-built, manually annotated Greek fire corpus. It follows four steps: text preprocessing, binary classification to isolate posts reporting active fires, multilabel classification to assign a fire type (wildland, urban, or mixed), and a spatial-analysis module that extracts place names from free text, disambiguates them, clusters them into incidents, and displays them on an interactive map. Evaluation is always geared toward the operational priority of emergency response: minimizing missed fire events. It therefore uses the F2-score as the primary classification metric throughout. The validation is done in four layers: The classifiers are evaluated on held-out partitions of the annotated corpus against classical and transformer baselines, across five random seeds with significance testing, and against two large language models under zero- and few-shot prompting; generalization to unseen events is tested with a chronological hold-out on a later fire season; the geoparsing module is scored against a separate gold standard of 147 toponyms in 100 posts, with a sensitivity analysis of its thresholds and a later repeatability test; and annotation reliability is quantified by an independent double-annotation audit. Finally, an end-to-end demonstration on an unlabeled stream from one fire evening illustrates the whole pipeline. The main contributions of this work are as follows:
- We build and publicly release what is, to our knowledge, the first agreement-audited Greek-language corpus of wildfire-related social media messages: 3277 X posts manually annotated for the presence of an active fire and the type of fire (wildland, urban, or mixed), with label reliability verified by an independent double-annotation audit, as well as a separate geoparsing gold standard of 147 toponyms across 100 posts. We release the dataset (post identifiers and labels), the annotation guidelines, and the accompanying code to ensure reproducibility, support future Greek crisis-informatics research, and quantify inter-annotator agreement.
- We present an end-to-end pipeline that transforms keyword-retrieved, unlabeled posts into an interactive, time-aware map, integrating active-fire detection, fire-type classification, geoparsing, density-based event clustering, and visualization. Unlike previous Greek research that only performs fire/non-fire classification, the pipeline assigns multiple fire-type labels, providing information that is more directly usable for resource allocation.
- We follow a recall-based evaluation that is aligned with emergency-response priorities (F2-score primacy) and evaluate four model families: an SVM/TF-IDF baseline, the monolingual GreekBERT [24], the multilingual XLM-RoBERTa [25], and the zero- and few-shot large language models under repeated runs with significance testing. A key finding is that compact fine-tuned encoders outperformed both large language models on this task under the tested prompting conditions, at much lower latency and cost.
- A toponym-disambiguation algorithm is introduced, which is based on a dynamic spatiotemporal memory of previously resolved locations and on pairwise-distance heuristics, and which increases the accuracy of the geocoding operation from 54.68% to 80.58%; a sensitivity analysis indicates that this improvement is robust to the choice of thresholds rather than an artifact of tuning to the evaluation benchmark.
The benefits to emergency-management stakeholders are pragmatic. At a classification latency of approximately half a second per post (Section 4.4), a civil-protection or fire-service operations room would receive a map of where the public is reporting fire, with each cluster classified as a wildland, urban, or mixed fire, so that reports of a fire that has reached homes can be distinguished from reports of a brush fire and prioritized accordingly. Because the pipeline aggregates many reports into one incident, it can corroborate an emergency call, show the geographical scope of public concern around an incident, and reveal secondary incidents that a single call would not, without dedicated sensors or field staff. These benefits are subject to the operational measures discussed in Section 5.5, and the present work is not intended as a deployment of such a service, but rather to establish its technical feasibility and accuracy envelope.
The rest of the paper is organized as follows: Section 2 reviews related work on using social media in wildfire and disaster management, focusing on Greece. Section 3 presents the materials and methods, including data collection and annotation, text preprocessing, classification models, and the spatial-analysis module. Section 4 presents experimental results for the binary and multilabel classification tasks and for geoparsing, and displays the resulting fire-event maps. Section 5 discusses the findings in relation to previous studies and outlines the study’s limitations. Section 6 concludes the paper and points out directions for future work.
2. Related Work
Studies on leveraging crowdsourced social media for disaster management have evolved from feasibility studies to conventional machine-learning pipelines and, more recently, to transformer-based systems. This section presents a brief review, especially in the Greek context.
2.1. Social Media as a Sensing Layer: Feasibility and Traditional Approaches
Boulton et al. [23] conducted an early feasibility study to determine whether social media could monitor wildfires in the United States by comparing social media posts with MODIS satellite imagery and US Forest Service records as ground truth. They found that their results confirmed the “social sensor” hypothesis but revealed three recurring challenges: the lack of geotags (only 0.51% of tweets and 12.04% of Instagram posts were geotagged); the noise generated by using keywords instead of trained classifiers; and a population-density bias, meaning that detection was much more successful in dense urban areas.
Future work has aimed to overcome these challenges using traditional machine learning. To reduce the number of features, Bhoi et al. [26] proposed a new disaster resource-management pipeline that first employed a hybrid sequence-to-sequence model [27] for lexically normalizing tweets, then TF-IDF representation, a forest-optimization feature-selection stage, and finally Multinomial Naïve Bayes for classification, which proved to be superior to SVM, k-NN, and decision trees. Their work has shown that traditional models remain competitive when computational resources are limited, provided they are carefully optimized. In contrast, Zielinski et al. [28] were more interested in decision support and developed an adaptive focused crawler that dynamically updated keywords based on newly discovered hashtags, a trustworthiness analysis using user metadata and network-centrality measures to combat misinformation, and a cross-lingual classification module, where locations were resolved by comparing tokenized n-grams with gazetteers like GeoNames and OpenStreetMap.
2.2. Modern Transformer-Based Approaches
With the advent of transformer architectures, the field changed. To address the end of free access to the X API, Silva et al. [29] presented a modern pipeline for Portuguese wildfire events, based on the Twikit library for scraping. A fire classifier was built using transformer models pre-trained on Portuguese (BERT, DeBERTa, GPTNeo) and consistently outperformed an SVM baseline, with F2-score used to emphasize recall and reduce fire-identification errors. The pipeline created fire-frequency and sentiment heatmaps in 10–20 s, which is operationally relevant. Verified posts were geoparsed using spaCy for named-entity recognition (NER), and coordinates were retrieved from the Nominatim API; sentiment analysis characterized public reaction.
Two studies directly focus on the Greek context. Thanos et al. [21] proposed a real-time fire-detection system trained on data from a custom comment platform that emulated social-media reactions. A hybrid LSTM-CNN model performed binary classification, feeding word embeddings into one-dimensional convolutions with max-pooling, then passing them to LSTM layers that captured temporal dependencies. An NLP stage (segmentation, tokenization, part-of-speech tagging, NER) extracted locations using hand-crafted regular expressions, followed by DBSCAN clustering to remove false alarms, an exponential reliability model to weight events by the number of reports, and a validation phase to map validated incidents. Valla et al. [22] suggested a dual-source approach that cross-validated Greek X posts with air quality anomalies from Sentinel-5P NO2 observations, with a small Greek adaptation of the RoBERTa architecture (relevance accuracy 77.75%) to classify fire-relevant posts, a bidirectional LSTM for NER, and DBSCAN for spatial clustering, where they observed that events in rural areas could be missed due to lower social media usage.
There are three more recent directions that frame the present work. First, foundation models are being applied to crisis informatics: CrisisTransformers are encoders and sentence embedders pre-trained on more than 15 billion tokens of tweets from more than 30 crisis events, which provide a crisis-specific starting point for fine-tuning [30]; general-purpose large language models are also being applied without task-specific training, such as a locally deployable vision-language model for zero-shot, two-stage classification of disaster posts [31]. Second, multimodal systems integrate text and images: Yin et al. employed GPT-4o to extract implicit geographic information from both the text and the images of Hurricane Harvey posts and connected it to mapping services for geolocalization [32]. Third, social media is no longer used alone but is increasingly combined with satellite observation: Zhong et al. combined Weibo posts with remote-sensing imagery, cell-phone signaling, terrain, and meteorological data to track a wildland–urban interface fire near Beijing [33], and Schmidt et al. demonstrated, for wildfires in Chile and British Columbia, that the spatiotemporal analysis of georeferenced tweets can serve as a detection signal before satellite-based emergency mapping [34]. These approaches are English- or Chinese-centric, rely on geotagged or image-bearing posts, or assume a mature multilingual foundation model, none of which holds for the sparse, text-only, Greek-language setting addressed here; they do, however, define the comparison we make in Section 4.4 between compact fine-tuned encoders and prompted large language models, and the fusion with official incident data we identify as future work in Section 5.5.
2.3. The Wider Context of Greek Wildfire Research
In addition to these two systems, domestic wildfire research has focused almost exclusively on pre- and post-fire analyses rather than on real-time social media monitoring. Palaiologou et al. [35] performed stochastic simulations of potential fire behavior in Greece using data from the EU FIRE-RES project for long-term community planning and fuel treatment, but not for operational use during an actual fire. Prescribed burning as a prevention measure has been the focus of a growing body of work, with Athanasiou et al. [36] documenting the reintroduction of prescribed burning in Greece, and Avramidou et al. [37] showing that prescribed burning increased the climatic resilience of Pinus brutia populations. Other research examines the impacts of wildfires after they occur, such as Misseyanni et al. [38] and Mavraki et al. [39], which examined their ecological and atmospheric impacts. These works are relevant for prevention and recovery, but they highlight the limited work on real-time crisis informatics at the domestic level.
2.4. Summary and Positioning
Table 1 summarizes the studies most directly comparable to this work along the dimensions of data, task, geolocation, evaluation, and deployment readiness.
Table 1.
Approach-level comparison of social-media wildfire-detection studies and this work.
Overall, the literature shows a well-developed, methodologically sophisticated field in English and Portuguese, with little work in Greek, and a field still dominated by binary fire/non-fire detection and geoparsing approaches with limited ability to address toponym ambiguity. Publicly available annotated fire corpora exist for other languages, but not for Greek, a situation further complicated by its morphology, informal register, and Greeklish usage. Current Greek systems use either simulated data [21] or official accounts [22], and both rely on heuristic location strategies that can misallocate events. In this context, the present work presents a purpose-built, agreement-quantified Greek fire corpus, extends the binary task of detecting Greek fire to that of multilabel fire typing, couples transformer-based NER with the addition of a spatiotemporal toponym-disambiguation algorithm, and bases model selection on a recall-oriented evaluation, with a comparison to the use of a large language model.
3. Materials and Methods
This section specifies the framework in three layers, and Figure 1 maps each subsection to its place in them. The data foundation (Section 3.2) provides the annotated corpus, the geoparsing gold standard, and the reliability audit of the labels. The inference pipeline (Section 3.3, Section 3.4 and Section 3.5) transforms a keyword-retrieved post into a mapped incident through five operators. These are preprocessing (Section 3.3), active-fire detection and fire-type classification (Section 3.4.1), toponym extraction (Section 3.5.1), geocoding and disambiguation (Section 3.5.2), and clustering and mapping (Section 3.5.4). The quantities passed between the operators are those of Equation (1), and two large language models serve as comparators for the classification step (Section 3.4.2). The evaluation layer (Section 3.4.3, Section 3.4.4 and Section 3.5.3, and 3.5.4) specifies how each component is tested and points to the subsections of Section 4 in which the results are reported.
Figure 1.
Methodological architecture of the framework: (A) data foundation; (B) inference pipeline, with the quantities of Equation (1) on the arrows; (C) evaluation protocols, with the subsections of Section 4 that report them. Tabs give the subsection that specifies each block. X, stream of keyword-retrieved posts; X′, cleaned text; ŷ, active-fire prediction (posts with ŷ = 0 are discarded); (w, u), wildland and urban fire-type labels; T, extracted toponyms; L′, validated locations; M_t, spatiotemporal memory of previously resolved locations; E, candidate fire incidents. P, f_θ, G, D, and Φ denote preprocessing, classification, toponym extraction, geocoding with disambiguation, and spatial clustering, respectively; ε and minPts are the neighborhood radius and minimum cluster size of DBSCAN; κ and α denote Cohen’s kappa and Krippendorff’s alpha.
3.1. Pipeline Overview
The proposed system is an end-to-end pipeline that converts keyword-retrieved Greek posts into an interactive map of active fire events. It consists of four steps: (i) data collection and annotation to obtain the labeled corpus; (ii) text preprocessing to obtain task-specific cleaned variants of each post; (iii) classification to detect active-fire posts and assign a fire type; and (iv) spatial analysis to extract and disambiguate locations, cluster them into incidents, and render them on a map. We implemented it in Python (version [3.13.15]; Python Software Foundation, Wilmington, DE, USA) and ran it in Google Colab (Google LLC, Mountain View, CA, USA), which provided cloud GPU resources for fine-tuning the transformer models.
Formally, the pipeline can be expressed as a composition of five operators applied to the raw post stream:
where X is the stream of keyword-retrieved posts; P denotes text preprocessing, producing cleaned text X′; fθ is the trained classification model, producing fire/fire-type predictions Y; G is geoparsing, returning candidate locations L; D is toponym disambiguation, returning validated locations L′; and Φ is spatial clustering, producing the final set of detected fire events E.
3.2. Data Collection and Annotation
3.2.1. Data Collection
Data were collected using the open-source scraping library Twikit [40], which simulates human browsing to retrieve posts. Free access to the X API ended in early 2023, making academic data collection prohibitively expensive [41,42]. Community pull requests and monkey patches kept Twikit working during collection, since it relies on the platform’s internal structure.
The search query used fire related Greek words (“πυρκαγιά”, “φωτιά”, “πυροσβεστική”, “καίγεται”, “φωτια”, “αναζωπύρωση”, “εκκένωση”) as well as Greeklish hashtags (#fwtia, #fotia, #pyrkagia, #pirkagia, #pyrosvestiki, #pirosvestiki). These choices took advantage of two properties of the platform and users: X search is case- and diacritic-insensitive, meaning that a single query term will also return the same term in unaccented and capitalized forms; and Greeklish is used primarily in hashtags, so limiting the Greeklish search to hashtags decreased the amount of cross-lingual noise. The collection was not limited to the summer season to capture non-wildland-fire types and metaphorical uses of fire language (hard negatives), and to target institutional actors (Fire Service, Civil Protection, the 112 emergency service, firefighting communities, and news agencies) and ordinary citizens. Date, post ID, raw text, likes, and reposts were kept for each post. This master dataset contains 3277 X posts.
Table 2 summarizes the corpus characteristics by collection period. The posts span 3 July 2024 to 21 September 2025 and fall on 58 distinct calendar days (UTC) across the 2024 and 2025 fire seasons and the intervening off-season months (July 2024: 500 posts; August 2024: 44; January–June 2025: 438; July 2025: 1087; August 2025: 1190; September 2025: 18). The 1100 active-fire posts are distributed over 46 distinct days (215, 34, 91, 474, 268, and 18 in the same periods, respectively), i.e., over multiple fire episodes in two fire seasons rather than a single event; the 12 August 2024 demonstration in Section 4.7 uses a separate, unlabeled stream of 2000 posts, of which only 4 also occur in this corpus.
Table 2.
Characteristics of the annotated corpus by collection period. Fire-type counts refer to active-fire posts.
This limitation to Greek-language posts from one platform is a scoping decision, not a convenience. Greek is the under-resourced case identified in Section 1, for which no annotated wildfire corpus existed, and the contribution of this work is the Greek corpus and the Greek-specific model chain (GreekBERT, GR-NLP-TOOLKIT, and disambiguation heuristics tuned to the duplicated toponymy of Greek settlements); cross-lingual transfer is a separate research question and would require retraining of the classifiers, a language-specific named-entity recognizer, and re-validation of the geocoding heuristics; the architecture is language-agnostic, but its components are not. X was selected because its posts are public, time-stamped, text-first, searchable by keyword and hashtag, and used in real time by the institutional actors listed above, making them suitable for keyword-based collection and geoparsing, and because previous wildfire social-sensing studies [21,22,29] also used it, so that the comparison in Section 5.1 is like-for-like. There are larger Greek communities on other platforms, like the Facebook group mentioned in Section 1, but these are closed groups without programmatic access and monitoring them would pose privacy concerns that do not arise with public posts. Generalization to other platforms, languages, and reporting cultures is therefore not tested and is explicitly indicated in Section 5.4 and Section 5.5.
3.2.2. Annotation
Two ground-truth datasets were created, one for both binary and multilabel classification, and a second one for the geoparsing evaluation. We also established a written annotation guideline in advance for each task to ensure consistency.
For binary classification, posts were marked as is_fire (1) if they included real-time situational information about a fire in Greece (where how big, evacuation, etc.) and is_fire (0) if not, either metaphorically, about past fires, or if they included fire-related vocabulary in political or emotional statements. This class imbalance, where noise (i.e., is_fire = 0) dominates, was maintained deliberately because it reflects the real distribution of social-media content.
For multilabel classification, each post that was identified as an active fire was assigned a fire type over two labels, is_wildland and is_urban, creating four combinations: wildland (1,0), urban (0,1), mixed (1,1), and an unidentified type (0,0) for active-fire posts that do not contain explicit type cues. Annotation followed the explicit textual content of each post treated in isolation; implicit inference was allowed only where the context was unambiguous (e.g., reference to aerial support or specialized forest crews as an indicator of a wildland fire); and geographic knowledge was deliberately excluded, so that a toponym known to be mountainous did not by itself determine the label. This prevents the model from learning relationships between locations and fire types. The multilabel set consists of 1100 active-fire posts and is imbalanced because of the strict rules, with the unidentified type most common and the mixed type least common (392, 389, 233, and 86 posts for the unidentified, urban, wildland, and mixed types, respectively). We also developed a separate gold standard for geoparsing: 100 active-fire posts containing 147 toponyms, for which we manually recorded each true toponym and its true coordinates and used it as the standard for the named-entity-recognition and geocoding stages. Two boundary conditions of the coding scheme are worth stating explicitly; both were clarified during the reliability audit described in Section 3.2.3. First, any fire that is reported as affecting, threatening, or having reached the built environment, such as being near infrastructure or civil-protection evacuation warnings issued to inhabited areas, is considered mixed type, not just when structures are reported burning. Second, the corpus contains only fires in Greece, and posts about fires outside Greece, even if written in Greek and operationally relevant to readers in Greece, are coded as non-active fire-related (is_fire = 0).
3.2.3. Inter-Annotator Agreement Protocol
To assess whether the annotation scheme was applied consistently and not merely the result of one annotator’s judgment, we conducted a reliability audit on a stratified subset of the corpus, which a second annotator re-annotated using the written guidelines and blind to the original annotations. For the binary task, we sampled 400 posts proportionately to the corpus class balance (266 is_fire = 0 and 134 is_fire = 1). For the multilabel task, 300 active-fire posts were sampled, with 75 posts allocated to each of the four fire-type states; relative to its corpus frequency of 7.8% of active-fire posts, the mixed state is thus deliberately over-represented, and corpus-level class frequencies are not recoverable from this subset. We double-annotated all 147 items in the gold standard for geoparsing. Agreement was quantified using Cohen’s κ [43] for the binary task, and per-label κ and Krippendorff’s α [44] for the multilabel task, and interpreted on the Landis–Koch scale [45], with confidence intervals derived by bootstrap resampling with 5000 replicates. Since the geoparsing gold standard has 147 toponyms across 100 posts, and each post contains up to 6 toponyms, we measured agreement not row-wise but per post for the set of extracted toponyms, using the Jaccard index and the geodesic distance between the coordinates assigned to matched toponyms. Disagreements were then resolved, and the updated labels are included in the public data release. The experiments reported in this paper use the original annotations, since the audit occurs after model training; we quantify the resulting discrepancy in Section 4. For reproducibility, we make the annotated data (post identifiers and labels), the guidelines, and the code public.
3.3. Text Preprocessing
Raw social-media text is noisy and informal, and downstream models need different conditioning, so preprocessing produced three cleaned versions of each post rather than a single normalized form. We used capitalization as a toponym cue and applied light cleaning to named-entity recognition and cased transformer inputs, removing URLs, mentions, and emojis while keeping casing, accents, and normalized punctuation. Uncased transformers like GreekBERT use advanced cleaning, which follows the model’s preprocessing conventions (lowercasing and removal of diacritics) rather than light cleaning. Traditional frequency-based models use hard cleaning, including segmenting hashtags, tokenizing, assigning part-of-speech tags, removing stop words and lemmatizing, and removing punctuation, diacritics, and numbers to reduce the feature space. These steps used the spaCy library [46] with the large pretrained Greek model el_core_news_lg.
3.4. Classification
3.4.1. Models
We trained and evaluated four model families for each classification task, ranging from traditional to transformer-based models. Formally, each post is mapped to a binary prediction:
where xi denotes the ith social-media post and yi = 1 indicates that the post reports an active fire. Formally, each active-fire post receives a two-dimensional binary label:
where ŷ{i,w} = 1 indicates a wildland fire and ŷ{i,u} = 1 indicates an urban fire, giving four possible combinations
corresponding to unidentified, wildland, urban, and mixed fire types, respectively.
yi ∈ {(0,0), (1,0), (0,1), (1,1)}
The baseline SVM was trained with TF-IDF features using default values. An advanced SVM was developed that incorporated five-fold cross-validation and grid search to optimize its hyperparameters. GreekBERT [24], a monolingual BERT model for Greek, and XLM-RoBERTa, a multilingual model, were fine-tuned for each task. The penalty C = 1.0 and maximum feature counts of 5000 and 10,000 were used for the baseline and advanced SVMs, respectively. Both transformers were fine-tuned for 4 epochs with a learning rate of 5 × 10⁻⁶ and a batch size of 16 for binary classification. Both SVMs were trained with C = 1.0 and 3000 max features; GreekBERT was fine-tuned for 4 epochs with a learning rate of 2 × 10⁻⁵ and a batch size of 8, while XLM-RoBERTa was fine-tuned for 5 epochs with a learning rate of 3 × 10⁻⁵ and a batch size of 8 for the multilabel classification task. These values were not exhaustively searched for, but lie within or near the range suggested for fine-tuning BERT-family encoders [47]; the checkpoint with the best validation score (F2 for the binary task, macro-F1 for the multilabel task) was kept for each run, and in the multilabel task the per-label decision thresholds were subsequently tuned on the validation set (Section 4.3). Other settings that were the same across all seeds and that are included in the released code were a maximum sequence length of 128 tokens, weight decay of 0.1, a warm-up ratio of 0.10 (binary) or 0.15 (multilabel), a linear (binary) or cosine (multilabel) learning-rate schedule, and, for the multilabel task, a binary cross-entropy loss with positive-class weights of 2.45 (is_wildland) and 1.32 (is_urban), which is the ratio of negative to positive examples in the active-fire set.
3.4.2. Large Language Model Baselines
We compared the fine-tuned encoders with two large language models (LLMs) assessed on the same tasks using zero-shot and few-shot prompting [48], which do not require task-specific training. We selected two complementary reference points: a state-of-the-art proprietary model (a strong upper bound) and an openly available model that can be self-hosted and fits an operational pipeline’s latency and cost constraints. The proprietary model used was Claude Sonnet 4.5 (API identifier claude-sonnet-4-5) accessed via the Anthropic API (Anthropic PBC, San Francisco, CA, USA), and the open model was Llama 3.3 70B Instruct (meta-llama/Llama-3.3-70B-Instruct; Meta Platforms, Inc., Menlo Park, CA, USA) accessed via the DeepInfra API (Deep Infra Inc., Palo Alto, CA, USA), both queried on 12 August 2026. We provide model identifiers and access date for reproducibility, as these services may change their behavior over time.
As shown in Table 3, we evaluated both models on the same held-out test sets as the fine-tuned models (492 posts for the binary task and 165 posts for the multilabel task), and constrained predictions to a fixed JSON schema; we set the temperature to 0 to ensure determinism. The prompts were written in Greek and followed the same labeling rules as the human annotators, such as judging only what is explicitly stated in each post and not inferring the type of fire based on geographic knowledge of the toponym (for the multilabel task). The model was prompted with only the above instructions in the zero-shot setting, and with 8 worked examples for the binary task and 8 worked examples for the multilabel task in the few-shot setting, where these examples were all drawn from the training split, stratified across classes, so that no test post was ever included as an example. We applied the same evaluation metrics used for the fine-tuned models to each model, and we also measured inference latency and cost per item, including them alongside predictive performance for an operational comparison.
Table 3.
Configuration of the large language model baselines.
Latency was defined as the end-to-end wall-clock time per request on the client side, including network transfer and time spent in the provider’s queue; the time spent on the provider’s side cannot be isolated from the client, so the comparison with the locally run encoders is an operational comparison, not a comparison of model compute speed. Cost was estimated from the input and output token counts returned by each API, at the rates used in the released code (USD 3.00 and 15.00 per million input and output tokens for Claude Sonnet 4.5; USD 0.35 and 0.40 for Llama 3.3 70B on DeepInfra), which approximate the published rates on the date of access and are meant for an order-of-magnitude comparison. Prompts consisted of a Greek system instruction with the labeling rules and the post, plus eight worked examples in the few-shot setting; responses were limited to 20 (binary) or 30 (multilabel) output tokens. The resulting cost per 1000 posts was USD 1.45 (zero-shot) and 3.64 (few-shot) for Claude and USD 0.09 and 0.25 for Llama on the binary task, and USD 1.59 and 4.16 and USD 0.10 and 0.30, respectively, on the multilabel task.
3.4.3. Data Splitting and Class Imbalance
The dataset was shuffled and then split into training (70%), validation (15%), and test (15%) sets using stratified sampling with a fixed random seed for reproducibility across both tasks. Different stratification variables were used for the two tasks. The binary task was stratified by the active-fire label, thereby maintaining the corpus’s strong class imbalance across partitions. To preserve the proportions of the four fire types (wildland, urban, mixed, and unidentified) within each partition, we stratified the multilabel task by the four-state combination of the two fire-type labels. A strict chronological split was not used: posts were scraped from a variety of accounts, and a tight temporal split would mean that an account could be split into multiple partitions, while a loose temporal split would mean that posts from several periods would be in a single partition, reducing the likelihood of memorizing individual incidents. A residual risk remains that posts from the same fire event may fall into different partitions. This risk was not taken for granted, but was assessed explicitly: since exact copies of the raw post text are already filtered out in the preprocessing, the documents were encoded as character n-gram TF-IDF vectors (n = 3–5) which are resilient to the inflectional variability of the Greek language, and all pairwise cosine similarities were calculated in the partitioned corpus of each task to find near-duplicate pairs that straddle a partition boundary. Section 4 presents results at multiple similarity thresholds, so the findings are not dependent on a single arbitrary threshold. A chronological hold-out that places the entire 2025 fire season after 1 August in the test set is reported in Section 4.8.
For the transformer models in the multilabel task, we tuned a per-label decision threshold on the validation set by sweeping from 0.10 to 0.90 in 0.05 increments to maximize the four-class macro-F1 score, since the severe imbalance causes the models to assign conservative probabilities to under-represented classes.
3.4.4. Evaluation Protocol
In addition to precision, recall, and F1, we used F2, which weights recall twice as much as precision, as the main measure of binary classification performance, in line with the operational priority of not missing fire events. Formally, the Fβ-score is defined as:
and, specifically for β = 2:
where P and R denote Precision and Recall, respectively. Choosing β = 2 assigns greater weight to recall, reflecting the operational priority of minimizing missed wildfire events.
To account for the multilabel imbalance, we used macro-averaged metrics and the exact-match ratio. For each task, we generated confusion matrices, plotted training and validation loss curves, and manually analyzed errors. We ran each model 5 times with different random seeds and reported the mean and standard deviation. We conducted paired t-tests across the top-performing models to determine whether differences in key metrics were statistically significant. Finally, we lowered the binary decision threshold for the integrated simulation from 0.50 to 0.30 to further favor recall, thereby retaining moderately confident fire reports.
The scope of the classification metrics should be stated precisely. All posts in the pipeline are those that come through the keyword and hashtag query of Section 3.2.1, which means that the classifier only ever sees candidate posts that contain at least one fire-related term. The recall reported in Section 4 is therefore classification recall within this keyword-retrieved candidate stream, that is, the proportion of retrieved active-fire posts that the classifier identifies; it is not the recall of the whole system over all posts on the platform, because a real fire report that uses none of the query terms will never be retrieved and never reach the classifier. The present corpus consists only of retrieved posts, so we cannot measure retrieval recall from it; we would need to estimate it by annotating a broad, non-keyword sample of Greek posts from a fire period, which we consider future work. The query was intentionally designed to be broad (seven Greek terms and six Greeklish hashtags, matched with case and diacritic sensitivity turned off) to ensure high retrieval recall at the cost of precision, which is then restored by the classifier. As such, the system should be interpreted throughout as a candidate-stream monitoring pipeline, not as an unrestricted social-media detector.
3.5. Spatial Analysis
3.5.1. Location Extraction
We performed geoparsing on the lightly cleaned text, as NER is sensitive to case and diacritics. We extracted toponyms with the GR-NLP-TOOLKIT [49], built on a transformer-based Greek model that outperforms spaCy [46] on Greek NER and retains three entity types: location (LOC), geopolitical entity (GPE), and facility (FAC).
3.5.2. Geocoding and Toponym Disambiguation
We converted the extracted toponyms to coordinates using the Nominatim API [50] and the geopy library, but only for Greece and Cyprus. Nominatim often returned multiple candidates for a given Greek toponym, sorted by popularity, and limited requests to 1 per second. We used a least-recently-used cache, so if we used the same toponym multiple times, we made no additional queries. We developed a disambiguation framework that used dynamic spatiotemporal memory and heuristic filtering to resolve ambiguity. Macro-locations (e.g., “Greece”) were pre-filtered because they did not contain any information; intra-post morphological duplicates were collapsed using fuzzy string matching; candidates that were classified as roads or highways were discarded, as this was likely to confuse a street name with a city, and embassies or consulates that occurred when foreign country names were mapped to their Greek missions were removed. The disambiguation mechanism subsequently kept a rolling window of the past five hours of previously resolved fire locations; a new toponym matching this memory was given the coordinates of the current event. This procedure can be formalized as follows. Let the memory of previously resolved fire locations be
and let the ranked candidate set returned by the geocoder for a given toponym be C = {c1, c2, …, ck}, with geographic distance given by the haversine formula, d (c, e) = Haversine (c, e). First, we check a toponym against memory; if a fuzzy name match exists in Mt, inherit its coordinates directly. Otherwise, for a post containing a single toponym, candidates are accepted according to their rank:
where At is the set of known active-fire locations at time t and d (c, At) = min {a ∈ At} d (c, a). For posts containing multiple toponyms, candidates from different toponyms corroborate another:
Mt = {ej ∣ t − 5h ≤ tj < t}
accept(ci, ci′) = 1 if d(ci, ci′) ≤ 40 km, i ≠ i′
Otherwise, we retain only the highest-importance candidate and discard all others exceeding 40 km from it.
If no match was found, the following rules were applied: if one toponym was extracted, the top-ranked candidate was accepted if it was within 40 km of a known active fire and the lower-ranked candidates were accepted if they were within 20 km of a known active fire; if multiple toponyms were extracted, candidates were accepted if two toponyms were within 40 km of each other, otherwise the highest-importance candidate was retained, and the other candidates were discarded if they were more than 40 km away. The full procedure is summarized in Algorithm 1 below:
| Algorithm 1. Spatiotemporal toponym disambiguation. | |
| Input: Extracted Toponyms T = {t1, t2, …, tn} from post xi at time τ; Memory of previously resolved locations Mτ = {ej | τ − 5h ≤ tj < τ}; known active-fire locations Aτ; Output: Validated location set L′ ⊆ ℝ2; | |
| # | Code |
| 1: | L′ ← ∅ |
| 2: | for each tk ∈ T do |
| 3: | if tk is a macro-location then |
| 4: | continue ▷ skip uninformative regions |
| 5: | end if |
| 6: | C ← Nominatim (tk, country ∈ {GR, CY}) ▷ ranked candidate set |
| 7: | C ← FilterRoads (C); C ← FilterEmbassies (C) |
| 8: | if ∃ ej ∈ Mτ: FuzzyMatch (tk, label (ej)) ≥ 0.80 then |
| 9: | L′ ← L′ ∪ {coords (ej)} ▷ memory hit |
| 10: | else if |T| = 1 then |
| 11: | if d (c1, Aτ) ≤ 40 km then |
| 12: | L′ ← L′ ∪ {c1} ▷ top candidate accepted |
| 13: | end if |
| 14: | for j = 2,…,|C| do |
| 15: | if d (cj, Aτ) ≤ 20 km then |
| 16: | L′ ← L′ ∪ {cj} ▷ lower-ranked accepted |
| 17: | end if |
| 18: | end for |
| 19: | else ▷ multi-toponym post |
| 20: | c* ← arg max importance (c) over C |
| 21: | L′ ← L′ ∪ {c*} |
| 22: | for each tk′ ≠ tk do |
| 23: | c′ ← top candidate for tk′ |
| 24: | if d (c*, c′) ≤ 40 km then |
| 25: | L′ ← L′ ∪ {c′} ▷ corroborated |
| 26: | end if |
| 27: | end for |
| 28: | end if |
| 29: | end for |
| 30: | return L′ |
The origin of the memory should be explicitly stated, as the disambiguation rules rely on it. At the beginning of each pipeline run, the memory Mt is empty, and it is populated only with the output of the pipeline: each location resolved for a post, whether by a memory match, by the distance rules, or by the fallback to the top-ranked candidate, is appended to Mt together with its coordinates and timestamp. At no point do ground-truth coordinates, official incident records, or externally validated locations enter the memory, either in the evaluation of Section 4.5 or in the demonstration of Section 4.7; the gold standard is used only to score the output. The set of “known active-fire locations” At in Algorithm 1 is thus the set of coordinates currently stored in Mt, i.e., locations previously resolved by the pipeline, not locations confirmed by an external source. Entries are timed out after 5 h without a matching toponym; a fuzzy match refreshes the timestamp, so a toponym that is continually reported persists. There is no other removal mechanism. There are two implications of this design: First, the memory can be self-reinforcing: if a location is incorrectly resolved early in an incident (for example by the fallback rule), it will anchor later mentions of the same name until it expires, which is the vulnerability discussed in Section 5.5. Second, Mt was non-empty for 1087 of the 1100 posts in the evaluation run, and most toponyms were resolved by a name match before any distance rule was applied, so the memory is the dominant component; the sensitivity analysis in Section 4.6 is consistent with this. The base geoparser of Section 4.5 is the configuration with no memory and no distance rules, so the improvement from 54.68% to 80.58% is due to the two components combined; an ablation of the distance rules alone was not conducted, as it would require re-querying the live geocoder, whose responses have since drifted (Section 4.6).
3.5.3. Geoparsing Evaluation and Sensitivity Analysis
The full set of 1100 active-fire posts was processed sequentially to ensure the spatiotemporal memory functioned properly, but evaluation was computed only over the 147-item gold standard, which was processed outside classification; thus, no leakage from the classification task affected the evaluation. Five metrics were applied: strict NER accuracy (perfect match of the toponym), operational NER accuracy (partial or overlapping match—more practical indicator), operational geocoding accuracy (percentage of predicted coordinates within 10 km of the true fire location), and mean and median distance error. The accuracy measures are presented as 95% confidence intervals, and the mean and median errors are presented as single points because outliers would make the intervals misleading. Two setups were assessed: the simplest possible geoparser, which takes the first candidate from Nominatim, and the geoparser with all the disambiguation methods enabled. We assessed the statistical significance of the difference between them using a McNemar’s test. A one-at-a-time sensitivity analysis was performed for the heuristic thresholds (temporal window, toponym radii, and pairwise distance) by testing each threshold in a range around the chosen value, to ensure that the performance lies on a stable plateau and not at a sharp optimum, and thus that the performance is not benchmark-specific tuning.
The analysis also captures, for each gold-standard toponym, the set of candidates returned by the geocoder at runtime to measure the geocoder’s contribution to overall performance and quantify the impact of changes in the underlying data over time.
3.5.4. Clustering and Mapping
A spatial threshold of 15 km and a minimum of two posts per cluster were chosen, and incidents were formed from the validated coordinates using the DBSCAN algorithm [51], which does not require a pre-specified number of clusters, an advantage for unpredictable events. Reports that did not meet these criteria were retained as isolated reports rather than discarded, as they could represent a small event that did not have a lot of social media attention; within each cluster, a mixed label was used when posts were independently classified as both wildland and urban, reflecting the nature of a spreading fire. The results were displayed in the form of an interactive map using the Folium library [52], which includes both satellite and street layers, pop-ups that show the location, timestamp, source post, and number of reports for each event, and a time slider (using the TimestampedGeoJson plugin) that has a fade effect to show the progression of fires over time.
Figure 2 bellow complements the architecture of Figure 1 with a worked example, following a real post from the replayed stream of Section 4.7 through each processing step: text cleaning, binary active-fire detection, multilabel fire-type classification, named-entity recognition and toponym disambiguation, spatial clustering, and placement on the map. In the figure, each stage is labeled with the model/algorithm used and, when applicable, the evaluation metric used, to make it easy to see the relationship between the methodological components introduced above and the results reported in Section 4. These components form one continuous process, from a keyword-retrieved, unlabeled post to a geolocated, classified, and clustered incident report, with no manual effort in between.
Figure 2.
Worked example: one post from the replayed stream of 12 August 2024 (Section 4.7) traced through the pipeline of Figure 1. The post text (username removed), its cleaned versions, the predicted probability and fire-type labels, the extracted toponyms, and their coordinates are actual pipeline outputs; the post is in Greek, with an English gloss in panel 1 and the transliterated toponyms (Penteli; Attica) in panels 5 and 7, and the cleaned versions in panel 2 are truncated (…) for space; panels 6 and 7 show the actual DBSCAN output for the 600 geolocated mentions of the stream on a Natural Earth base map (public domain). The metrics in the right-hand column are those reported in Section 4.2, Section 4.3, Section 4.4 and Section 4.5; the interactive map is presented in Section 4.7.
Figure 3 complements it with a sequence diagram of the information flow during near-real-time inference, including the decision points at which a post is discarded, kept as an unlocated report, resolved from memory without a geocoder call, or promoted from an isolated report to a candidate incident cluster.
Figure 3.
Sequence diagram of inference for one keyword-retrieved post: calls, early exits, the memory-hit branch, and the isolated-report versus candidate-incident decision.
3.6. Experimental Setup
The evaluation consists of six experiments, summarized in Figure 4 with the inputs, procedure, outputs, and results subsection for each. E1 audits the reliability of the labels on stratified subsets of the corpus (Section 3.2.3). E2 trains and tests the classifiers on the random stratified split (Section 3.4.1 and Section 3.4.3, and 3.4.4), and E3 evaluates the two large language models on the same test sets, adding latency and cost (Section 3.4.2). E4 repeats the classification experiments on a chronological hold-out, in which all posts from 1 August 2025 onward form the test set (Section 4.8). E5 scores the geoparsing module against the gold standard, with a threshold sweep and a later repeatability run (Section 3.5.3). E6 replays the whole pipeline, in chronological order, on an unlabeled stream from 12 August 2024 and compares the output with the official 112 warnings (Section 3.5.4 and Section 4.7). The random seeds, splits, and thresholds of all experiments are fixed in the released scripts (Data Availability Statement).
Figure 4.
Experimental setup: for each of the six experiments, the inputs, the procedure, the main outputs, and the subsection of Section 4 that reports the results.
4. Results
4.1. Inter-Annotator Agreement
A second annotator re-annotated a stratified subset of the corpus, also following the written guidelines, but unaware of the original annotations, to check annotation reliability. For the binary task, 400 posts were sampled in the ratio of the corpus class balance (266 non-fire, 134 active-fire). In the multilabel task, 300 active-fire posts were sampled, with equal frequency of posts assigned to each of the four fire-type states (75 posts per state), so that the mixed state, which represents only 7.8% of the active-fire posts in the corpus, is over-represented and the level of agreement on the rarest state can be estimated with sufficient accuracy; corpus-level class frequencies should not be inferred from this subset. All 147 items in the gold standard were double-annotated for geoparsing. We used bootstrap resampling with 5000 replicates to obtain confidence intervals for κ. Table 4 reports the resulting agreement scores.
Table 4.
Inter-annotator agreement between the two annotators. — indicates a statistic that is not applicable to, or was not computed for, that task.
All coefficients fall in the highest (“almost perfect”) band of the Landis–Koch scale, and the rare mixed class showed no degradation, with per-class agreement of 1.000 for the unidentified type, 0.987 for wildland, 0.973 for urban, and 0.960 for mixed. On the binary task, all four disagreements were posts that the second annotator marked as active fires and the first did not; on geoparsing, the second annotator identified fewer toponyms per post, but none were incorrect, so precision reached 1.000 while recall was 0.756.
The team then adjudicated the 10 cases of classification disagreement. The original annotation was confirmed in 9 cases, and 1 annotation was revised, resulting in a change rate of 0.14% across the 700 audited items. The first annotator scored 400/400 on the binary task and 299/300 on the multilabel task, while the second annotator scored 396/400 and 295/300, respectively. The adjudication also resolved two coding rules that the disagreements had revealed to be underspecified: that a fire should be coded as mixed if it is reported to affect, threaten, or have reached the built environment, even if the text does not explicitly say that a structure is burning; and that fires outside Greece, such as in Cyprus, should not be coded as part of the corpus even if they are reported in Greek. Because the agreement study was conducted as a reliability audit after training the models, the experiments reported here are based on the original annotations. Since only one label was revised among those audited, the impact on the reported results is minimal. The updated labels are part of the public data release.
4.2. Binary Active-Fire Classification
The baseline SVM was used with its default settings (C = 1.0, 5000 max features), while the advanced SVM was used with a grid-searched setting (C = 1.0, 10,000 max features); GreekBERT and XLM-RoBERTa were fine-tuned for 4 epochs with a learning rate of 5 × 10⁻⁶ and a batch size of 16. We repeated each model 5 times with different random seeds, and Table 5 shows the mean and standard deviation for each metric.
Table 5.
Binary active-fire classification performance (mean ± standard deviation over five seeds). Best F2-score in bold.
The F2-score is critical for this operation because it prioritizes minimizing missed fires. We retained both models because the two transformer models led on this measure: GreekBERT (0.911 ± 0.016) and XLM-RoBERTa (0.905 ± 0.019), with no statistically significant difference between them in a paired t-test over the five seeds (p > 0.05); a case-level paired bootstrap on identical test posts, reported in Section 4.8, does detect a small difference in favor of GreekBERT (ΔF2 = +0.026, 95% CI [0.002, 0.051]), which shows that seed-level tests on five observations are underpowered for differences in this size. The improvement over the SVMs stems from recall: the transformers raised it to nearly 0.93, compared with about 0.87 for the SVMs, at the expense of a slight drop in precision. This trade-off matters in emergency response, where a missed fire is far costlier than a false alarm. The SVM baselines remained competitive, with F2-scores close to 0.87 and the highest precision among the four models, indicating that well-tuned traditional models are a reasonable alternative when computational resources are limited (see Figure 5).
Figure 5.
Binary classification results: (a) precision, recall, F1 and F2 for all four models (mean ± SD, five seeds); (b) precision–recall trade-off; (c) F2 ranking, GreekBERT highest.
4.3. Multilabel Fire-Type Classification
Multilabel: Each active-fire post is assigned a fire type across the two labels: is_wildland and is_urban, resulting in four combinations. To address the high class imbalance, we swept a per-label decision threshold from 0.10 to 0.90 in 0.05 increments and tuned it on the validation set. When averaged across the five seeds, XLM-RoBERTa achieved the best performance, with a Macro-F1 score of 0.874 ± 0.024. Table 6 presents the per-class results for the representative optimized run, along with those for the advanced SVM.
Table 6.
Multilabel per-class results for XLM-RoBERTa and the advanced SVM. — not applicable (precision and recall are reported for the binary task, Mixed F1 for the multilabel task).
XLM-RoBERTa also outperformed the sophisticated SVM on Macro-F1 and exact-match ratio, and was superior across all fire types except urban, where the two were essentially tied. Both models performed worst on the mixed class, the least frequent in the corpus, with recall of 0.769 for XLM-RoBERTa and 0.692 for the SVM. This is what we would expect from a small class: 13 mixed posts in the test partition make it the most difficult class to learn and the least stable to assess, so the per-class figures should be interpreted with caution; the 95% bootstrap confidence interval for mixed-class F1 spans 0.55 to 0.95 (Section 4.8). The wildland class, in contrast, was recognized most reliably (F1 0.914), reflecting both its clearer linguistic cues and its larger number of examples. All the above results are presented in Figure 6 that follows.
Figure 6.
Multilabel fire-type results (representative run): (a) per-class F1, XLM-RoBERTa vs. advanced SVM; (b) XLM-RoBERTa precision vs. recall per class; (c) macro-F1 and exact-match, XLM-RoBERTa highest.
4.4. Comparison with Large Language Model Baselines
We tested the two large language models on the same held-out test sets, using both zero-shot and few-shot prompting, and compared predictive performance and inference latency (on the same CPU environment). Figure 7 summarizes the results, plotting accuracy against latency for both tasks.
Figure 7.
Accuracy versus inference latency: (a) binary task (F2-score); the inset magnifies the region of the four LLM configurations; (b) multilabel task (Macro-F1). Fine-tuned encoders (green) outperform both LLMs in accuracy and end-to-end latency under the tested conditions.
Neither LLM matched the fine-tuned encoders’ performance on the binary task. The best configuration of the large language model achieved an F2-score of 0.750 (Claude Sonnet 4.5, zero-shot), while the score for GreekBERT was 0.911, a difference of about sixteen points. The open model did about as well as the proprietary one, with F2-scores ranging from 0.722 to 0.741, and few-shot prompting did not consistently improve the scores, changing Claude’s F2-score from 0.750 to 0.744 and Llama’s from 0.722 to 0.741. This difference was significant on the multilabel task, where the fine-tuned XLM-RoBERTa model achieved a Macro-F1 score of 0.874, whereas the large language models’ scores ranged from 0.359 to 0.519. Few-shot prompting improved the proprietary model on this more challenging task, lifting Claude’s Macro-F1 from 0.484 to 0.519, but it was still over 35 points behind the fine-tuned model; few-shot prompting also harmed Llama’s performance, dropping it from 0.394 to 0.359. There are several plausible explanations for this gap, and for why it is larger on the multilabel task. First, the fire-type scheme is not world knowledge but a set of annotation conventions: a type is given only on explicit textual cues, geographic inference is not allowed, and posts without such cues are placed in the unidentified state. The fine-tuned encoders learn these conventions from 814 training posts, while the LLMs are only instructed about them and given at most eight worked examples; their prior knowledge (e.g., that a toponym is forested) then leads them to infer a type where the scheme calls for abstention. Second, the task is combinatorial: two independent decisions per post, so a single incorrect label results in the wrong four-state class and a failed exact match, exacerbating any per-label weakness. Third, the encoders’ per-label decision thresholds are optimized on the validation set, while the LLMs produce uncalibrated hard labels against a distribution in which the mixed state accounts for only 7.8% of posts. The pattern of the overall metrics also suggests that the failures are class-specific rather than uniform: macro-F1 (0.359–0.519) lies well below both macro-precision (0.503–0.588) and macro-recall (0.503–0.598), which can only happen if precision and recall diverge at the class level. Lastly, Greek is a small portion of the pretraining data of general-purpose LLMs, and the informal register of the posts may exacerbate this, while GreekBERT is Greek-specific and XLM-RoBERTa was fine-tuned on in-domain text. A per-class confusion analysis of the LLM baselines is left for future work, as the individual LLM predictions were not stored.
The latency measurements confirm this. The fine-tuned models took about 0.49 s (GreekBERT) and 0.43 s (XLM-RoBERTa) to classify a post when run locally on CPU, while LLM calls sent to a remotely hosted service took between 1.1 s and 1.9 s per post end to end, including network transfer and provider queueing (Section 3.4.2). Under the tested conditions, the fine-tuned encoders were more accurate and faster, in the favorable part of the accuracy–latency plane, and had zero API cost per call, as they run on locally held weights rather than a metered API, although they are not free of computing, energy, and hardware costs. The results apply to the models, prompts, access dates, and hosted-inference settings described in Section 3.4.2 and are not intended to be interpreted as a general statement about the capability of large language models; different prompting strategies, task-adapted or larger LLMs, or self-hosted deployment could narrow the gap. In this setting, however, higher accuracy, lower end-to-end latency, and zero API cost per call make it more practical to use compact fine-tuned encoders for continuous high-volume monitoring.
4.5. Geoparsing and Toponym Disambiguation
The geoparsing module was tested on the gold standard of 147 items, comparing a basic geoparser that uses only the best candidate from Nominatim against an optimized geoparser that uses the complete disambiguation framework. We report named-entity recognition, shared by both configurations, separately from geocoding; Table 7 reports the results.
Table 7.
Geoparsing performance on the 147-item gold standard, for the base and optimized geoparsers. Values in brackets are 95% confidence intervals.
The operational accuracy for named-entity recognition was 89.80%, while strict accuracy was lower (53.74%) because strict accuracy requires an exact string match, which is not acceptable for some partial or morphological variants of toponyms. As the disambiguation framework works only at the geocoding stage, the NER is the same for both setups. Disambiguation had a significant effect: operational geocoding accuracy increased from 54.68% to 80.58% (an increase of almost 26 percentage points), and the mean distance error decreased from 29.11 km to 10.87 km. This improvement was highly significant as confirmed by a McNemar’s test (p = 1.47 × 10⁻¹⁵). Interestingly, the median distance error remained the same (0.26 km): most toponyms were already disambiguated correctly by the base geoparser, and the disambiguation framework fixed the few cases where toponyms were grossly misplaced, which reduced the mean without affecting the median.
4.6. Sensitivity Analysis
Because we fixed the geoparsing thresholds a priori rather than tuning them, we performed a one-at-a-time sensitivity analysis to assess whether the reported performance is sensitive to the exact threshold values. We swept each threshold over a range around the operating point, reran the pipeline on the full set of active-fire posts, and evaluated it against the gold standard of 147 items, as shown in Figure 8. It is important to note that re-executing the pipeline reproduced the named-entity-recognition results of the original pipeline exactly, at 53.74% strict and 89.8% operational accuracy, confirming that the extraction stage is deterministic and that any downstream differences stem from geocoding.
Figure 8.
Operational geocoding accuracy as each threshold is swept one at a time, with the other thresholds held at their operating values: (a) disambiguation (primary) radius, 20–80 km; (b) strict-acceptance (secondary) radius, 5–40 km; (c) temporal window of the spatiotemporal memory, 1–24 h; (d) fuzzy-match threshold, 0.70–0.95. In each panel, the operating point (orange circle: 40 km, 20 km, 5 h, and 0.80, respectively) sits on a plateau. Values are from the re-executed pipeline; the difference from the 80.58% of Table 7 is due to changes in the geocoder’s data (Section 4.6).
The disambiguation and strict-acceptance radius were entirely inert on this benchmark: the main radius was swept from 20 km to 80 km, and the secondary radius from 5 km to 40 km, but there was no change in operational geocoding accuracy. This stability is because the spatiotemporal memory was not empty for 1087 of 1100 posts, meaning most toponyms were matched by fuzzy name matching in memory before the distance rules were applied. The temporal window was also consistent, with accuracy within one point of each window, ranging from one to twenty-four hours. The fuzzy-matching threshold showed a shallow optimum around the chosen value of 0.80, with accuracy of 71.4%, 72.8%, 73.5%, 73.5%, 72.8%, and 70.1% at thresholds of 0.70 to 0.95 in steps of 0.05. In each case, the operating point falls into a flat region rather than at a sharp peak, suggesting that the reported performance is not the result of tuning to the evaluation set and is relatively insensitive to threshold choice.
A mismatch exists between the value obtained in the re-execution of operational geocoding (73.47%) and the value reported for the experiments (80.58%). The difference is limited to the geocoding step, which relies on the Nominatim service and the underlying OpenStreetMap data [50], because the named-entity-recognition step results were reproduced exactly. When compared directly with the geocoder’s responses, with the same set of candidate coordinates that were saved from the original run, the data had materially changed in the intervening period: 26 of 141 comparable toponyms had different responses; 8 of 141 that were geocoded in the original run were no longer geocoded in the second run; 9 of 141 had been removed from the results completely; and 25 of 141 had a different candidate as the first choice. Several place names had an entirely different place of the same name; in the most extreme case, a village some 499 km away from the one originally retrieved. This is exactly the kind of name ambiguity the disambiguation mechanism is supposed to solve, and its persistence over time underscores both the mechanism’s importance and the inherent complexity of reproducing results from a live gazetteer. The sensitivity conclusions above are based on internally consistent re-execution and thus are not influenced by this drift.
4.7. Event Clustering and Mapping
The last step of the pipeline is to cluster the geolocated fire mentions into fire incident zones and visualize them. We used DBSCAN [51] for spatial clustering because it does not require the number of clusters to be specified in advance and is robust to noise, both of which suit the erratic spatial pattern of fire reports. It does require two parameters, which we set operationally: a neighborhood radius of 15 km and a minimum of two posts to form a candidate incident cluster. Reports that do not meet these criteria are not deleted, but kept as isolated incidents, as a single report may represent a true small-scale incident, e.g., a car fire. Fire types are combined within each candidate incident cluster: a cluster may be classified as both wildland and urban, and is labeled mixed, reflecting the spatial presence of both fire types as a fire progresses.
As shown in Figure 9 bellow, the clustered events are plotted on an interactive map created with Folium, using satellite and street base maps to differentiate affected forest and residential areas. Colored clusters are multi-report candidate incidents; grey markers are isolated reports. Each point is interactive, and a pop-up displays the location name, time, fire type, and originating post. To showcase the system end-to-end, we also replayed it retrospectively, in chronological order, on a stream of keyword-retrieved, unlabeled posts from the evening of 12 August 2024, when the northeastern Attica fire was burning. At the operational threshold of 0.30, 434 of the 2000 stream posts were passed to the spatial module (385 would have passed at 0.50). The pipeline automatically identified the event’s spatial signature: one large cluster of incident reports (499) over the area of “Penteli–Marathon–Grammatiko”, correctly classified as a mixed wildland–urban fire, and smaller clusters elsewhere in the country. The reports span only a few hours on a single evening, so the map shows the fire’s development as people reported it, illustrating in practice the idea of social media users acting as a distributed network of sensors.
Figure 9.
Static preview of the Greek fire map, evening of 12 August 2024: (a) clusters nationwide, with the Attica region boxed; (b) the Attica fire zoomed in, with an example incident pop-up. The full interactive HTML version of the fire map is available online at (https://alexlas73.github.io/FireMap/, accessed on 15 October 2026).
Since the two clustering parameters were set operationally rather than tuned, we tested the impact of different values on the demonstration output by re-clustering the 600 geolocated points of the stream of 12 August 2024 for all combinations of radius ε ∈ {5, 10, 15, 20, 30} km and minimum cluster size minPts ∈ {2, 3, 5}. The northeast Attica incident is invariant for ε between 10 and 30 km and for all values of minPts: it is a single cluster with all 470 points within 30 km of the fire, and 499 points at the operating point. The picture only changes when ε = 5 km, where the fire front of about 40 km is divided into five sub-clusters, the largest of which consists of 253 points. The minimum cluster size only affects the periphery: increasing minPts from 2 to 3 and 5 decreases the number of clusters nationwide from 14 to 8 and 6, respectively, and increases the number of isolated reports from 11 to 23 and 31, respectively, without changing the main incident. The operating point is thus in a flat area of the parameter space for this event, but this is evidence from one large fire front only. A radius suited to a large front might merge separate fires that are close together, and the robust radius is likely to vary with settlement density, terrain, and incident scale. Parameter selection should therefore be repeated across multiple geographically distinct incidents against an incident register when one becomes available (Section 5.5).
The extent of the demonstration should be clearly defined. It is not a prospective deployment but a retrospective replay, in chronological order, of posts collected after the event, and it covers the second evening of a fire that began on the afternoon of 11 August 2024; the first 112 public-warning message for the Varnavas fire was issued at 16:48 EEST on 11 August [53], about 29 h before the first post in the replayed stream (22:04 EEST on 12 August). The demonstration thus shows the ability of the pipeline to aggregate, type, and map an ongoing incident from unlabeled posts; it does not, and cannot, show early detection or a lead time over official channels. In the stream, the first report in the incident area was geolocated at 22:04:56 EEST and a second within 15 km at 22:05:03, so a candidate incident existed seven seconds after the stream started, processing latency aside. The annotated corpus of Section 3.2 includes posts from the first day of the same fire, the earliest of which about Varnavas is dated 17:31 EEST on 11 August, 43 min after the 112 alert; however, the corpus is a keyword-sampled subset and cannot determine when the fire first appeared on the platform. Measuring the detection delay with respect to official notification will require prospective collection over a full season, which we consider future work. For transparency, two additional observations on the replayed output are reported. Of the 600 geolocated mentions, 202 are the regional name ‘Aττική’ (Attica), which the macro-location filter, designed for country-level names, did not remove and which Nominatim resolved to the ‘Attiki’ metro station in central Athens; and 19 mentions of ‘Bαρνάβας’ (Varnavas) were disambiguated as ‘Πλατεία Bαρνάβα’ (Varnavas Square), a square in central Athens 32.6 km from the village, an error of the kind discussed in Section 3.5.2. Excluding both, the incident is still a single cluster of 278 reports, so the conclusion is unchanged, but the 499-report figure above should be read with this in mind, and regional units should be added to the macro-location filter.
A partial area-level comparison with official warnings is nevertheless possible, as the 112 service issued ten public-warning messages for this fire between 11 and 13 August 2024, each naming the localities to be evacuated [53]. Of the nine evacuated localities, eight had geolocated reports in the replayed stream; the exception is ‘Nταού Πεντέλης’ (Ntaou Pentelis), a small locality that is not mentioned in either dataset. This gives an area-level recall of 8/9 for the demonstration with respect to an official list. For timing, the stream itself begins after all but the last two alerts, so we used the annotated corpus, which contains 44 posts from 11 to 13 August. The earliest corpus post naming each locality preceded the respective 112 alert in three cases, Marathon (1.6 h), Stamata and Dionysos (6.2 h), and the Nea Makri area (7.3 h, from the stream), and followed it in three others, Varnavas (43 min), Penteli (23 min), and Drafi (6 min). These figures are indicative only: the corpus is a keyword-sampled subset, matching is by area name, and a post naming an area may report a fire approaching it rather than in it. They do, however, illustrate the intended role of the pipeline, which is to surface where the public is reporting fire, sometimes hours before an evacuation order for that locality, so that the information can be checked, not to replace the order.
4.8. Temporal Generalization: Chronological Hold-Out
The random post-level split of Section 3.4.3 leaves open the possibility that posts about the same fire fall on both sides of the partition, so that the scores in Section 4.2 and Section 4.3 partly reflect recognition of already-seen events. To assess generalization to truly unseen events, we ran the classification experiments again with a chronological hold-out: all posts before 1 August 2025 were used as the training pool, while all posts on or after 1 August 2025, which include the Patras fire and the late-August 2025 incidents, were used as the test set. This results in 1759 training, 310 validation, and 1208 test posts (286 active-fire) for the binary task and 692 training, 122 validation, and 286 test posts for the multilabel task, with all four fire types present in the test period (77 unidentified, 126 urban, 43 wildland, 40 mixed). The validation set is the last 15% of the training period, so checkpoint selection and threshold tuning are also done on earlier data only; therefore, the multilabel validation slice has only five mixed posts. The models, hyperparameters, and seeds are those of Section 3.4.1, and the random split was recomputed in the same run for a like-for-like comparison. We report the mean and standard deviation over five seeds, 95% bootstrap confidence intervals over the test posts (2000 resamples), and, for the encoder comparison, a paired bootstrap of the F2 difference on identical test posts (Table 8).
Table 8.
Random versus chronological (temporal) hold-out evaluation; mean ± SD over five seeds, threshold 0.50 unless stated, macro-F1 with per-label thresholds tuned on validation. — not applicable (precision and recall are reported for the binary task only, Mixed F1 for the multilabel task only).
Three findings follow. First, there is only a moderate drop in active-fire detection on the unseen season: GreekBERT drops from F2 = 0.915 to 0.850 and XLM-RoBERTa from 0.890 to 0.850, and in both cases the drop is almost entirely in precision (0.847 to 0.681 for GreekBERT) rather than recall (0.933 to 0.907). Even in a fire season the model has never seen, it still recognizes 91% of active-fire posts, at the cost of a higher false-alarm rate (8.5% to 13.2%), which is the preferable direction of degradation for early-warning use. In contrast, the advanced SVM drops from 0.886 to 0.694, suggesting that lexical TF-IDF features memorize event-specific vocabulary while the encoders capture more transferable cues. The paired bootstrap shows GreekBERT ahead of XLM-RoBERTa by a small but consistent margin on both splits (ΔF2 = +0.026, 95% CI [0.002, 0.051] random; +0.027 [0.003, 0.052] temporal). Second, at the operational threshold of 0.30 used in Section 4.7, F2 changes by less than half a point in either split, recall rises by one to two points, and the false-positive rate rises by three to four points (0.169 temporal), which quantifies the trade-off accepted for the demonstration. Third, fire-type classification is more sensitive to the shift. On the random split, XLM-RoBERTa reaches macro-F1 = 0.859 ± 0.012 when one run that failed to converge is excluded (the failure is visible in its validation score, 0.43 against at least 0.86 for the other runs, and would be caught by validation monitoring before deployment); on the temporal split, where all runs converged, the mean is 0.769 ± 0.085, with the variance concentrated in the mixed class (0.692 ± 0.171 over 40 test posts) and in the thresholds tuned on five validation examples. The run that validation would select reaches 0.849 (95% CI [0.803, 0.894]) with a mixed-class F1 of 0.850, but the spread across seeds is itself a result: fire-type labels transfer less reliably than active-fire detection, and a deployment should select and monitor the model on held-out recent data rather than on a random partition. GreekBERT is weaker on this task in both settings, consistent with the choice of XLM-RoBERTa in Section 4.3, and the SVM degrades less on fire type (0.883 to 0.746) than on detection.
Representative errors from the temporal hold-out and from the geoparsing gold standard are given in Table 9. The missed fires are first-person, affect-laden posts about the Patras fire that contain none of the typical fire vocabulary or place descriptions and refer to toponyms absent from the training period; the false alarms are news-style reports about concluded incidents, views of a fire from a distant location, and idiomatic uses of φωτιά. In effect, the model has learned the news register of fire reporting better than the citizen register of a new event, which relates to the coverage bias discussed in Section 5.5. Mixed-class errors occur when the built-environment cue is implicit or when a headline aggregates several incidents. The geoparsing cases show both the gain from the memory (a homonymous village resolved from 459.7 km to 0.28 km) and its cost (a town pulled 8.3 km toward an earlier resolved location), as well as administrative units and facilities that the gazetteer does not resolve.
Table 9.
Qualitative error analysis on the temporal hold-out (classification) and the geoparsing gold standard.
4.9. Comparison with Recently Published Results
To place the results of Section 4.2, Section 4.3, Section 4.4, Section 4.5, Section 4.6, Section 4.7 and Section 4.8 in context, Table 10 lists them alongside the results reported by recent journal studies on the same four subtasks: detection of relevant posts, multi-class categorization of posts, recognition of location mentions, and resolution of those mentions to coordinates. Studies were included if they were published between 2022 and 2026, processed social-media posts or comparable short texts, and reported quantitative results on held-out data. They cover landslides [54], wildfires [29,55], earthquakes [56], hurricanes [32,57,58], multi-hazard collections [30,31,59], and general-purpose toponym resolution [60], in Italian, Portuguese, Chinese, English, and French. Apart from the conference paper by Valla et al. [22], which is compared qualitatively in Section 5.1, we did not find a Greek-language study that reports results for these subtasks on wildfire posts.
Table 10.
Results of this work alongside those reported by recent journal studies on the same subtasks. Each study’s results refer to its own data; the rows are reference points, not a head-to-head ranking.
Because the studies differ in language, data, label sets, and metrics, Table 10 does not rank the systems; it shows where the present results fall within the published range. Three observations follow. First, the detection results are in the upper part of that range. The random-split F2 of 0.911 is higher than the F2 of 0.896 that Silva et al. [29] obtained on Portuguese news headlines, and the F2 of 0.850 comes from a chronological hold-out, a stricter protocol than the random splits reported by Silva et al. [29]. Second, the fire-type macro-F1 of 0.874 (random split) is above the 0.69–0.84 reported for multi-class crisis categorization [30,55,56], and the temporal value of 0.769 lies within that range; our label set of four fire-type states is, however, smaller than the six or eight categories of the CrisisMMD and CrisisNLP benchmarks [30]. The training-free results of Schwarz et al. [31] show the same pattern as the large language models in Section 4.4: a marked drop from the binary decision (F1 above 0.84) to multi-class categorization (weighted F1 of 0.61).
Third, the geocoding accuracy within 10 km (80.58%) is higher than the 65.20% of Yin et al. [32] and the 57% precision of Scalia et al. [58] at the same distance threshold, both on English hurricane posts. Hu et al. [60] report results only at 161 km, so their figures cannot be set against ours directly, but they show the same effect as Section 4.5: on tweet toponyms, context-aware resolution raised accuracy over Nominatim alone from 74% to 89% within 161 km, as our disambiguation framework raised it from 54.68% to 80.58% within 10 km. Two qualifications apply. The geocoder search is restricted to Greece and Cyprus, which bounds the maximum error and makes the 10 km criterion easier to meet than in worldwide settings such as that of [60]; and the gold standard is small (147 toponyms), so the 95% confidence interval is wide (74.19–86.97%), and the re-run of Section 4.6 gave 73.47% after gazetteer updates. On the other hand, our figure is end-to-end and includes recognition errors from the NER stage, whereas [60] starts from gold-standard toponyms. Both the lower confidence bound and the re-run value remain above the 65.20% and 57% reported in [32,58].
Overall, Table 10 indicates that the pipeline performs at the level of recently published systems on each subtask, in a lower-resourced language and under a chronological hold-out. Because the datasets differ, it does not establish that the pipeline outperforms them.
5. Discussion
5.1. System-Level Comparison with Related Wildfire Pipelines
Section 4.9 compared the results of this work quantitatively with those of recent journal studies on each subtask. This section turns to a system-level comparison with the three wildfire-detection pipelines closest in scope to the present one: the fire-burst detection system of Thanos et al. [21], the Greek-language X monitoring system of Valla et al. [22], and the Portuguese wildfire pipeline of Silva et al. [29]. Because these systems were evaluated with different protocols, and in one case only qualitatively, they are compared here by their design choices rather than by their scores. Table 11 summarizes the comparison across five dimensions; three points that motivated specific design choices in this work are discussed below.
Table 11.
Comparison with related wildfire-detection systems from social media.
Thanos et al. [21] proposed a rule-based information-extraction system with a deep-learning post-filter that they did not train or test on fire data; they also did not formally test the deployed system’s accuracy or F-scores, only qualitatively during a live pilot exercise. Valla et al. [22] constructed a bidirectional LSTM pipeline for location extraction in Greek and, when multiple locations were mentioned in a post, kept only the first one, because initial experiments showed that including all extracted locations produced too many false positives. This rule is illustrated by a hypothetical example: if a post reports that firefighters from Athens are heading to a fire in Megara, the heuristic selects Athens as the fire location because it is the first place mentioned. The toponym-disambiguation approach tested in Section 4.5, which instead infers from a spatiotemporal memory of recent fire events and pairwise distances between candidate locations, is specifically geared to prevent this class of error, and Section 4.6 shows that this disambiguation is robust across a wide range of threshold settings. At the event level, Valla et al. [22] achieved a precision of 16.12%, a recall of 50%, and an F1-score of 24.39% for social-media-only detection, against a ground truth of ten major wildfire events; this is not directly comparable to the precision and recall reported in Section 4.2 and Section 4.3, which are post-level against a held-out test set, but it does give an indication of the challenge that their system tackles.
Silva et al. [29] tested a variety of pre-trained transformer models on binary classification; however, they did not explore large language models or deployment costs. Section 4.4 directly addresses this gap by comparing two large language models (one proprietary and one open) with the fine-tuned encoders on the same test sets for predictive performance, inference speed, and cost. The fine-tuned encoders were shown to be more accurate, faster, and free of API cost per request, which is directly applicable to any system, including those of Thanos et al. [21], Valla et al. [22], and Silva et al. [29], designed to run continuously and at scale.
5.2. Operational Implications of the Encoder-Versus-LLM Comparison
The comparison in Section 4.4 has implications beyond predictive accuracy. Large language models are often touted as a general-purpose alternative to task-specific fine-tuning because they do not require labeled training data and can be used simply by providing a prompt. The results in Section 4.4 do not support this substitution for the present task. On both the binary and multilabel problems, the fine-tuned encoders outperformed both the proprietary and the open large language model by a wide margin (Section 4.4), suggesting the difference is more about task competence than the number of examples in the prompt.
This gap is compounded by another, purely operational gap. A system designed to continuously monitor social media should make many classification calls, and this is not free at that scale. The fine-tuned encoders in this pipeline run locally on modest hardware and have latency well under a second per post, with no API cost per call beyond the initial training and the hosting hardware (Section 4.4). By contrast, both large language models evaluated here were accessed via metered APIs that depend on the internet, cost money per call, and averaged more than a second per post. This reliance on an external service is also a liability for a pipeline designed to process a stream of posts as a wildfire is happening, where connectivity or provider availability may not always be assured, regardless of cost and latency. This trade-off between the generalizability of large language models and the efficiency of smaller, task-specific models aligns with recent surveys, which also highlight the cost of fine-tuning, inference latency, and edge deployability as the main challenges for large-scale LLM deployment [61].
Overall, these results indicate that large language models do not yet have a place to replace fine-tuned encoders in this space, but instead as a tool: for instance, in bootstrapping annotation, prototyping new label schemes, or in low-volume tasks where the general language capabilities of a large language model are more important than the cost of operating it. In the context of the core, high-volume classification task this work focused on (Section 4.2 and Section 4.3), the results suggest that compact, fine-tuned, self-hostable models are still the better option.
5.3. The Value of Disambiguation and Reproducibility
Beyond its direct impact on classification accuracy, the framework introduced and assessed in Section 4.5 to disambiguate toponyms addresses a source of error not typically present in the related work surveyed in Section 5.1: ambiguity between different places with the same or similar names. This is not unusual in Greek toponymy, where the same names of villages, neighborhoods, and administrative units are duplicated across regions. The framework is specifically designed to detect this class of error before it propagates to a mapped fire location by resolving candidate locations using a spatiotemporal memory of previously resolved locations and pairwise distances between candidates, rather than taking the first or most prominent match.
A second, independent finding further supports the significance of this design choice. This sensitivity analysis, reported in Section 4.6, revealed a significant difference between the geocoding accuracy achieved when the pipeline was first run and the accuracy achieved when it was rerun several months later, even though the named-entity recognition stage produced identical results when rerun. In the direct comparison of the two runs, a significant percentage of toponyms in the gold standard resolved to a different location, and this shift was due to updates to the underlying gazetteer rather than the pipeline itself. To the best of our knowledge, previous fire detection studies using social media rarely mention this, as they usually treat geocoding as a one-time evaluation. This finding suggests that any system using a live third-party geocoding service should treat geocoding accuracy as a variable, not a static pipeline attribute, and plan for periodic reassessment.
These two findings suggest that toponym disambiguation and geocoding reliability should be treated as real problems in engineering social media-based fire detection, not as a solved pre-processing step. A pipeline designed for long-term use should include a disambiguation mechanism, such as the one tested in Section 4.5, and a periodic reproducibility test, such as the one tested in Section 4.6, to identify changes in the geocoding component’s behavior that are independent of changes in the pipeline itself.
We therefore specify a four-part geocoding strategy for a system meant for sustained use, a strategy that was not put in place in the current prototype and that we regard as a requirement for operational deployment. (i) Versioning: Each resolved location should be associated with the version of the geocoder and the date of the extract of the underlying gazetteer, and a pinned instance of Nominatim, self-hosted and based on an extract of OpenStreetMap from a given date, should be preferred over the public instance, so that results can be reproduced and gazetteer updates are deliberate rather than silent. (ii) Persistent caching: The in-memory cache of this work should be extended to a persistent cache of versioned toponym-to-coordinate resolutions that not only reduces reliance on the live service but also maintains the exact mapping used during an incident. The cache should store the full ranked candidate list returned for each toponym, not only the selected coordinate, so that the components of the disambiguation framework can later be evaluated separately and offline (base geoparser, memory only, distance rules only, and both combined); this ablation could not be run retrospectively in this work because the live geocoder’s responses have since drifted (Section 4.6). (iii) Fallback geocoders: If the primary geocoder fails or provides no candidates, a second source (e.g., a curated gazetteer of Greek settlements and administrative units) should be consulted, and provenance noted. (iv) Periodic recalibration: The 147-item gold standard of Section 4.5 should be re-run periodically, e.g., prior to each fire season and after any gazetteer change, and a fall in operational accuracy below the lower bound of the 95% confidence interval of the original run should trigger a re-tuning of the disambiguation thresholds.
5.4. Limitations
We conducted a leakage analysis (Section 3.4.3) and measured the number of near-duplicate posts across splits, but posts about the same fire can still end up on either side of a random split. The chronological hold-out of Section 4.8 removes this for fires confined to a single season, and its figures, rather than those of the random split, should be taken as the estimate of generalization to new events. Temporal separation does not, however, imply that there is no thematic or linguistic similarity between seasons, for example, recurring place names, institutional accounts or reporting templates. A benchmark with independently reconstructed event identities, which would enable a formally event-disjoint split, would still be preferable and is left to future work.
- Single-platform data source. The pipeline was developed specifically for X, and posting conventions, user demographics, and reporting behavior may vary significantly on other social media platforms; therefore, the pipeline’s performance should not be assumed to apply to other social media sources without re-evaluation.
- Geoparsing benchmark size. The gold standard that we have used to assess the accuracy of geoparsing and toponym disambiguation consists of 147 items in 100 posts, which is adequate to provide headline accuracy figures as reported in Section 4.5 with reasonable confidence intervals, but a larger benchmark would enable more detailed analysis of failure modes by toponym type.
- The class for the mixed fire-type is small. The mixed class is the least frequent in the corpus (7.8% of active-fire posts) and the most challenging to classify. Two separate issues should be resolved. Label reliability for this class is high: it was deliberately over-sampled in the audit (75 of 300 posts), and per-class agreement was 0.960, meaning that the lower scores in Section 4.3 are indicative of actual linguistic difficulty and scarcity rather than inconsistent labeling. However, the representative test partition contains only 13 mixed posts, so a single misclassification changes per-class recall by about 7.7 points, and the per-class figures for this class are highly uncertain. A larger annotated sample would be required to establish them with confidence. This type of minority class, which is rare and structurally different, is a known issue in imbalanced classification in general, and has motivated the development of specific methods in other areas [62].
- Risk of leakage of events remains. While we performed a leakage analysis (Section 3.4.3) and quantified near-duplicate posts across splits, we cannot rule out some similarity between training and test posts describing the same underlying fire event, which may cause reported metrics to mildly overestimate performance on a truly unseen future event.
- Single-annotator original labeling. One annotator was responsible for the full corpus, and the reliability audit of Section 4.1 was conducted after the models had been trained. This has two implications for evaluation. First, because both the training and test labels come from the same annotator, the reported metrics reflect how well the models agree with one annotator’s interpretation of the guidelines; the models may learn and exploit a systematic idiosyncrasy at test time, inflating performance relative to a consensus standard. This risk is bounded by the audit, in which a second annotator, blind to the original labels, reproduced them with κ = 0.978 (binary) and 0.973 (four-state); raw disagreement was 1.0% and 2.0%, respectively, and adjudication attributed nine of the ten disagreements to the second annotator, so the systematic component in the audited sample is small. Second, the audit was performed after training, so it could neither affect model selection nor contaminate the test partition, but it also could not correct labels before training; the experiments therefore rely on the original labels, of which 1 of 700 audited was revised. The audit does not replace double annotation of the full corpus from the outset, and the two coding rules it clarified had been applied by the original annotator before they were written down, so unaudited boundary cases may exist.
- Heuristic disambiguation thresholds. The thresholds used in the toponym-disambiguation framework were operationally determined and validated afterward by the sensitivity analysis described in Section 4.6, but not optimized together on a validation set; the sensitivity analysis shows that performance is not very sensitive to the thresholds, but this does not guarantee they are optimal.
- Geocoder dependence and gazetteer drift. The pipeline is dependent on the availability of the X data stream and on a rate-limited, third-party geocoding service whose underlying data change over time. As demonstrated in Section 4.6, using the same pipeline to re-execute the geocoding step several months after the initial experiments resulted in an operational geocoding accuracy of 73.47% (compared to 80.58% during the initial experiments), and 26 of 141 comparable toponyms produced different outcomes. Reported geocoding figures are thus dependent on the state of the gazetteer on the day of the experiment, and an operational deployment cannot rely on such figures without the versioning, caching, fallback, and recalibration measures described in Section 5.3. These measures are not implemented in the current prototype.
- No incident-level benchmark across events. Evaluation is component-level (detection, fire type, geoparsing) plus one replayed event; the demonstration of Section 4.7 includes an area-level recall against the localities named in official 112 warnings (8 of 9) and a clustering sensitivity analysis, but incident-level precision, false incident clusters per day, duplicate clusters, and median detection delay have not been measured across multiple fires, as this requires an official incident register with ignition times and locations for a full season. The accuracy of the components does not add up to an end-to-end accuracy: false alarms from the classifier, mislocated toponyms like the ‘Πλατεία Bαρνάβα’ (Varnava Square) case, and clustering decisions can all cascade downstream. This multi-event, incident-level validation is the external validation identified in Section 5.5 and is the next step prior to any operational use.
5.5. Operational Readiness, Ethical and Societal Considerations
The process of moving from a validated model to an operational early-warning system is a known gap in other areas of AI for public-health surveillance. A recent global systematic review of 98 AI models for predicting mosquito-borne diseases found that only a small proportion of models had been translated into operational use, that 63 out of 98 studies had a high risk of bias, and that external validation was limited; the priorities it identified for real-world implementation were standardized reporting, rigorous external validation, and calibration to the local context [63]. The same criteria are applicable to the present framework. Temporal generalizability is addressed by the chronological hold-out evaluation in Section 4.8, where the models are evaluated on a fire season that they were not trained on. Class imbalance is addressed through macro-averaged metrics, weighted loss, and per-label decision thresholds optimized on the validation set, but the predicted probabilities have not been calibrated and are a prerequisite for use as confidence scores in an operations room. No external validation has been done on another platform, region, or language, and the data source is a single platform with a demographic skew (Section 5.4). By these standards, the framework should be described as a validated research prototype, not an operational system, and the geocoding approach outlined in Section 5.3 and the recalibration schedule it calls for are among what would be needed to bridge that gap.
Two further considerations concern where the approach adds value and where it does not. First, social sensing is not a replacement for emergency calls; it complements them. A call to 112 provides one confirmed report with the caller’s location, and the framework makes no claim to precede it. Its contribution is different in kind: it brings together many unverified public reports to produce a spatial and temporal signature of an incident, as in Section 4.7, where 499 reports were resolved into a single cluster with a fire-type label, and it can reveal secondary incidents and the public’s information needs while the primary incident is being addressed. Second, reporting density is related to population and connectivity, meaning that fires in sparsely populated or poorly connected areas will generate fewer and later reports than fires at the wildland–urban interface, and the map should be interpreted as a picture of public reporting rather than of fire occurrence. The corpus does include rural events: 233 of the 1100 active-fire posts (21.2%) are wildland-only, and the clustering step retains single reports as isolated reports rather than discarding them (Section 4.7). Quantifying this coverage bias requires comparing detected clusters with an official incident register over a complete season, which we identify as the external validation to prioritize in future work.
The framework considers all posts as reports and does not assign credibility to sources, making it vulnerable to misinformation and deliberate manipulation. Partial robustness is provided by two design decisions: a candidate incident cluster must be based on at least two posts within 15 km (Section 4.7), which means that a single false post appears only as an isolated report, and the fire-type label is based on multiple posts, not just one. Neither choice defends against coordinated posting, and the spatiotemporal memory is especially vulnerable, in the sense that a false location accepted early in the 5-h window would tend to bias the resolution of later toponyms towards it. In an operational scenario, we would thus need a minimum number of distinct accounts per cluster, weight the reports according to their source (institutional accounts, news agencies, and established users versus new accounts), cross-check clusters against official channels such as the Fire Service and Civil Protection accounts already present in the corpus, and have a human operator between the map and any dispatch decision. The prototype lacks all these safeguards, and the map should be read as a snapshot of what is being reported, not as verified ground truth.
There are also privacy and equity issues in large-scale monitoring of social media. This study processed only public posts, collected by fire-related keywords rather than by account, and the released dataset provides post text with usernames removed and in-text mentions masked, together with labels and identifiers, but no account-level data. No individual was identified, since geolocation is based on toponyms in the text rather than device positions. Continuous deployment would, however, process personal data on a large scale and would require a data-protection impact assessment, purpose limitation (here, to fire reporting), data minimization (e.g., discarding account identifiers once they have been aggregated into a cluster), and defined retention periods. There are three additional safeguards that follow from the nature of the output. First, there should be two views of the map: one for authorized emergency responders that includes the source post for verification, and one for the public that displays only aggregated clusters and fire types, without source posts, usernames, or times at the post level, since a public map that links a post, a location, and a time during an evacuation can reveal where individuals and households are. Second, posts deleted by their authors should be removed from the map and any cache promptly, in accordance with the platform’s developer terms; this is also why the released dataset carries no usernames and why removal requests will be honored in subsequent releases. Third, accounts of vulnerable individuals, for example, a resident reporting from a home that is being evacuated, deserve the same protection as the incident itself, and the fine-grained location should not be shown at a resolution that identifies a single property. The demonstration map of Section 4.7 was created for research purposes and shows source posts; an operational version would not do so publicly. These technical safeguards are necessary but not sufficient. An operational deployment would also require formal institutional governance: a designated data controller, role-based access control for the responder view, audit logging of who accessed which source posts and when, a documented retention schedule, and an assigned responsibility for handling deletion and objection requests within defined time limits.
Equity issues relate to who posts: the user base of X is not representative of the population, and the Greek-language scope excludes residents and visitors who post in other languages, so the reporting picture is skewed toward digitally active, urban, Greek-speaking users, and coverage of older, rural, or non-Greek-speaking communities is weaker (Section 5.4). These biases do not invalidate the signal, but the lack of reports should never be interpreted as absence of fire, and the framework should complement, rather than replace, the channels that serve those communities.
6. Conclusions
This work brought the concept of “people as sensors” to an end-to-end research prototype that translates social media postings into near-real-time, mapped visualization of wildfires in progress, in the language of the citizens. The pipeline takes as input keyword-retrieved, unlabeled X posts, determines whether each one reports an active fire, characterizes confirmed fire posts as wildland, urban, or mixed, extracts and disambiguates the toponym it mentions, and clusters the fire reports into incident clusters on an interactive map, all without requiring human intervention at inference time.
The results of the experiments can be summarized under four main conclusions. First, under the prompting and deployment conditions tested, compact fine-tuned transformer encoders performed better than two large language models and classical baselines in terms of accuracy, latency, and cost, running locally in a fraction of a second per post and with no API cost per call, which makes them more practical for continuous, high-volume monitoring. Second, on a chronological hold-out of a fire season not used in training, active-fire detection degraded moderately (F2 from 0.915 to 0.850, almost entirely in precision, with classification recall retained at 0.907), but fire-type classification degraded more and varied across seeds; fire-type models should therefore be selected and monitored on recent held-out data before any deployment. Third, the toponym-disambiguation framework presented in this paper offers a statistically significant and substantial improvement in geocoding accuracy over a naive baseline, and a follow-on reproducibility test conducted several months after the experiments showed that live gazetteer services change over time in ways that can have a material impact on geocoding performance, which future systems of this sort should explicitly account for. Fourth, a retrospective, chronologically ordered replay of the whole pipeline on real, unlabeled posts from the evening of 12 August 2024 showed that the system aggregated, typed, and mapped a real mixed wildland–urban fire in northeastern Attica as it was being reported, without any manual intervention, and that eight of the nine localities named in the official 112 warnings had geolocated reports in the stream. Overall, the framework is a research prototype validated at the component level, with one retrospective end-to-end demonstration; it has not been prospectively validated as an operational incident-detection or early-warning system. In this work, “near-real-time” refers to the processing latency of the pipeline, not a demonstrated lead time over official channels. The next step is incident-level validation across several fires against an official register of ignition times, coordinates, and event identities.
The main results of this work are summarized as follows:
- An end-to-end publicly documented NLP pipeline, in Greek, for fire detection, fire-type classification, toponym disambiguation, and interactive mapping, which has been evaluated on a manually annotated corpus of 3277 posts, with a formal inter-annotator reliability audit.
- A systematic study that compares the performance of fine-tuned encoders and large language models on the same test sets under zero- and few-shot prompting and measures the prediction accuracy, the inference latency, and the cost of each approach.
- A chronological hold-out evaluation on an unseen fire season, with bootstrap confidence intervals, paired significance tests, and a qualitative error analysis, quantifying how active-fire detection and fire-type classification transfer to new events.
- A spatiotemporal toponym-disambiguation method that significantly improves a naive geocoding baseline and a sensitivity analysis indicating robustness with respect to threshold selection.
- An empirical documentation of gazetteer drift in a live, third-party geocoding service, and a quantification of the effect of gazetteer drift on the accuracy of geoparsing over time.
- A real-world example of the whole pipeline showing the reconstruction of the spatial and temporal signature of an actual wildfire from keyword-retrieved social media posts.
Future work could take several directions. The open large language model evaluated here was used via a hosted API, and a clear next step would be to fine-tune a similar open-weight model that is fully self-hostable and could replace the proprietary and third-party services throughout this pipeline. The existing system is for formal Greek text and would benefit from being explicit about Greeklish (Greek written in Latin characters), which is still widely used in informal social-media posts. Because the training corpus is geographically and demographically biased, it could be expanded to reduce remaining bias toward more densely populated or more actively reporting regions, perhaps by combining it with other datasets like satellite imagery. Finally, sentiment or urgency analysis, as in related work [29], could enable the pipeline to prioritize the most severe or time-critical reports in a cluster, further helping emergency responders focus on rapidly evolving events.
Author Contributions
Conceptualization, A.L. and M.S.; methodology, A.L. and M.S.; software, A.L. and M.S.; validation, A.L. and M.S.; formal analysis, A.L. and M.S.; investigation, A.L. and M.S.; data curation, M.S.; writing—original draft preparation, A.L.; writing—review and editing, A.L. and M.S.; visualization, A.L.; supervision, A.L.; project administration, A.L. All authors have read and agreed to the published version of the manuscript.
Funding
This research received no external funding.
Institutional Review Board Statement
Ethical review and approval were waived for this study, as it involved analysis of publicly available social media posts, with no interaction with or intervention involving human participants and no collection of private or sensitive personal data, consistent with Article 30 of Greek Law 4624/2019 and Article 89 of Regulation (EU) 2016/679 (GDPR).
Informed Consent Statement
Not applicable.
Data Availability Statement
The code, analysis scripts, annotated corpus, geoparsing gold standard, inter-annotator agreement materials, annotation guidelines, and the evaluation outputs reported in this paper (including the chronological hold-out results, the clustering sensitivity analysis, and the comparison with the 112 warnings) are openly available in the GitHub repository at https://github.com/alexlas73/greek-wildfire-detection-pipeline (release v2.2; accessed on 15 October 2026)) and permanently archived on Zenodo at https://doi.org/10.5281/zenodo.22924108 (accessed on 15 October 2026). The full interactive fire map is available at https://alexlas73.github.io/FireMap/ (accessed on 15 October 2026). Post text is released with usernames removed and in-text mentions masked for non-commercial research use; post identifiers and timestamps are provided as recorded, and the precision of the identifiers is documented in the repository. Fine-tuned model weights are available on Hugging Face (links in the repository).
Acknowledgments
During the preparation of this manuscript and its revision, the authors used a large-language-model assistant Claude Opus 5.5 (Anthropic PBC, San Francisco, CA, USA) for language editing of author-written text, for assistance in drafting and restructuring passages under the authors’ direction, for verifying reference metadata, and for generating and debugging analysis scripts (the chronological hold-out, clustering sensitivity, and inter-annotator agreement scripts released with the code) and the schematics of Figure 1, Figure 2, Figure 3 and Figure 4 from author-specified designs. All scripts were executed by the authors on their own data, and all results were checked against the underlying outputs. No AI tool was used for data annotation, for model training decisions, or for the interpretation of results, and no AI-generated text was included without author review. The authors take full responsibility for the content of this publication.
Conflicts of Interest
The authors declare no conflicts of interest.
Abbreviations
The following abbreviations are used in this manuscript:
| AI | Artificial Intelligence |
| API | Application Programming Interface |
| BERT | Bidirectional Encoder Representations from Transformers |
| CNN | Convolutional Neural Network |
| CPU | Central Processing Unit |
| DBSCAN | Density-Based Spatial Clustering of Applications with Noise |
| EFFIS | European Forest Fire Information System |
| EU | European Union |
| FAC | Facility |
| F1 | F1-score |
| F2 | F2-score |
| FIRE-RES | Wildfire Risk Governance and Resilient Communities project |
| GPE | Geopolitical Entity |
| GDPR | General Data Protection Regulation |
| GPU | Graphics Processing Unit |
| JSON | JavaScript Object Notation |
| LLM | Large Language Model |
| LOC | Location |
| LSTM | Long Short-Term Memory |
| MODIS | Moderate Resolution Imaging Spectroradiometer |
| NER | Named-Entity Recognition |
| NLP | Natural Language Processing |
| SD | Standard Deviation |
| SVM | Support Vector Machine |
| TF-IDF | Term Frequency–Inverse Document Frequency |
| VIIRS | Visible Infrared Imaging Radiometer Suite |
| WUI | Wildland–Urban Interface |
| XLM-R | XLM-RoBERTa |
References
- Kelley, D.I.; Burton, C.; Di Giuseppe, F.; Jones, M.W.; Barbosa, M.L.F.; Brambleby, E.; McNorton, J.R.; Liu, Z.; Bradley, A.S.I.; Blackford, K.; et al. State of Wildfires 2024–2025. Earth Syst. Sci. Data 2025, 17, 5377–5488. [Google Scholar] [CrossRef] [Scilit]
- Copernicus Climate Change Service. A Partnership to Support Mitigation and Adaptation Efforts in the Mediterranean. Available online: https://climate.copernicus.eu/partnership-support-mitigation-and-adaptation-efforts-mediterranean (accessed on 17 August 2026).
- San-Miguel-Ayanz, J.; Durrant, T.; Boca, R.; Maianti, P.; Libertà, G.; Oom, D.; Branco, A.; de Rigo, D.; Suarez-Moreno, M.; Ferrari, D.; et al. Forest Fires in Europe, Middle East and North Africa 2023; Publications Office of the European Union: Luxembourg, 2024; Available online: https://effis-gwis-cms.s3.eu-west-1.amazonaws.com/effis/reports-and-publications/annual-fire-reports/Annual_Report_2023.pdf (accessed on 22 August 2026).
- U.S. Fire Administration. What Is the WUI? Available online: https://www.usfa.fema.gov/wui/what-is-the-wui/ (accessed on 1 August 2026).
- Giannaros, T. Quoted in: Early Fires an Ominous Greek Summer Warning: Experts; Agence France-Presse, 5 June 2024. Available online: https://www.france24.com/en/live-news/20240605-early-fires-an-ominous-greek-summer-warning-experts (accessed on 17 August 2026).
- Meteo.gr; National Observatory of Athens.gr; National Observatory of Athens. 37% of Attica’s Forests Burned in the Last 8 Years. ProtoThema English, 14 August 2024. Available online: https://en.protothema.gr/2024/08/14/meteo-37-of-atticas-forests-burned-in-the-last-8-years/ (accessed on 17 August 2026).
- WWF Greece; FLAME Group, National Observatory of Athens. Review of the 2025 Fire Season by WWF Greece and the FLAME Group of the National Observatory of Athens. Available online: https://wwf.mg/?20142366%2FReview-of-the-2025-Fire-Season-by-WWF-Greece-and-the-FLAME-Group-of-the-National-Observatory-of-Athens= (accessed on 17 August 2026).
- Pinto, A.; Pennisi, F.; Borlini, S.; De Ponti, E.; Signorelli, C.; Cozza, A.; Baldo, V.; Gianfredi, V. Effects of Heat Waves on Hospitalizations, Emergency Department Visits, and Outpatient Care in Frail Older Adults: A Systematic Review and Meta-Analysis. Diseases 2026, 14, 176. [Google Scholar] [CrossRef] [Scilit] [PubMed]
- Google Research. Google Research and the Fire Community Create FireSat, a New Constellation of Satellites Built to Detect and Track Wildfires. Available online: https://blog.google/company-news/outreach-and-initiatives/sustainability/google-ai-wildfire-detection/ (accessed on 17 August 2026).
- eoPortal. OroraTech Wildfire Constellation. Available online: https://www.eoportal.org/satellite-missions/ororatech-wildfire-constellation (accessed on 17 August 2026).
- OroraTech. Greece Launches World’s First National Wildfire Satellite System with OroraTech. Available online: https://ororatech.com/resources/news-blog/greece-launches-world-s-first-national-wildfire-satellite-system (accessed on 17 August 2026).
- Chen, Y.; Hantson, S.; Andela, N.; Coffield, S.R.; Graff, C.A.; Morton, D.C.; Ott, L.E.; Foufoula-Georgiou, E.; Smyth, P.; Goulden, M.L.; et al. California Wildfire Spread Derived Using VIIRS Satellite Observations and an Object-Based Tracking System. Sci. Data 2022, 9, 249. [Google Scholar] [CrossRef] [Scilit] [PubMed]
- Saleh, A.; Zulkifley, M.A.; Harun, H.H.; Gaudreault, F.; Davison, I.; Spraggon, M. Forest Fire Surveillance Systems: A Review of Deep Learning Methods. Heliyon 2024, 10, e23127. [Google Scholar] [CrossRef] [Scilit] [PubMed]
- Lazer, D.; Pentland, A.; Adamic, L.; Aral, S.; Barabási, A.-L.; Brewer, D.; Christakis, N.; Contractor, N.; Fowler, J.; Gutmann, M.; et al. Computational Social Science. Science 2009, 323, 721–723. [Google Scholar] [CrossRef] [Scilit] [PubMed]
- Kirilenko, A.P.; Molodtsova, T.; Stepchenkova, S.O. People as Sensors: Mass Media and Local Temperature Influence Climate Change Discussion on Twitter. Glob. Environ. Change 2015, 30, 92–100. [Google Scholar] [CrossRef] [Scilit]
- Sakaki, T.; Okazaki, M.; Matsuo, Y. Earthquake Shakes Twitter Users: Real-Time Event Detection by Social Sensors. In Proceedings of the 19th International Conference on World Wide Web (WWW 2010), Raleigh, NC, USA, 26–30 April 2010; pp. 851–860. [Google Scholar] [CrossRef] [Scilit]
- Hagar, C. Crisis Informatics: Introduction. Bull. Am. Soc. Inf. Sci. Technol. 2010, 36, 6–10. [Google Scholar] [CrossRef] [Scilit]
- Palen, L.; Vieweg, S.; Sutton, J.; Liu, S.B.; Hughes, A.L. Crisis Informatics: Studying Crisis in a Networked World. In Proceedings of the 3rd International Conference on e-Social Science, Ann Arbor, MI, USA, 7–9 October 2007. [Google Scholar]
- Tzavella, K.; Skopeliti, A.; Fekete, A. Volunteered Geographic Information Use in Crisis, Emergency, and Disaster Management: A Scoping Review and a Web Atlas. Geo-Spat. Inf. Sci. 2022, 27, 423–454. [Google Scholar] [CrossRef] [Scilit]
- Nikiforos, M.N.; Voutos, Y.; Drougani, A.; Mylonas, P.; Kermanidis, K.L. The Modern Greek Language on the Social Web: A Survey of Data Sets and Mining Applications. Data 2021, 6, 52. [Google Scholar] [CrossRef] [Scilit]
- Thanos, K.-G.; Polydouri, A.; Danelakis, A.; Kyriazanos, D.; Thomopoulos, S.C.A. Combined Deep Learning and Traditional NLP Approaches for Fire Burst Detection Based on Twitter Posts. In Text Mining—Analysis, Programming and Application; Sarnovský, M., Ed.; IntechOpen: London, UK, 2019; pp. 1–17. [Google Scholar] [CrossRef] [Scilit]
- Valla, E.; Moumtzidou, A.; Kaskara, M.; Girtsou, S.; Gialampoukidis, I.; Vrochidis, S.; Kontoes, C.; Kompatsiaris, I. Wildfire Event Detection Using Social Media and Earth Observation Data—A Use Case for Attica, Greece. In Proceedings of the Eleventh International Conference on Remote Sensing and Geoinformation of the Environment (RSCy2025), Paphos, Cyprus, 17–19 March 2025; Volume 13816. [Google Scholar] [CrossRef] [Scilit]
- Boulton, C.A.; Shotton, H.; Williams, H.T.P. Using Social Media to Detect and Locate Wildfires. In Proceedings of the 10th International AAAI Conference on Web and Social Media (ICWSM 2016), Cologne, Germany, 17–20 May 2016; pp. 178–186. [Google Scholar] [CrossRef] [Scilit]
- Koutsikakis, J.; Chalkidis, I.; Malakasiotis, P.; Androutsopoulos, I. GREEK-BERT: The Greeks Visiting Sesame Street. In Proceedings of the 11th Hellenic Conference on Artificial Intelligence (SETN 2020), Athens, Greece, 2–4 September 2020; pp. 110–117. [Google Scholar] [CrossRef] [Scilit]
- Conneau, A.; Khandelwal, K.; Goyal, N.; Chaudhary, V.; Wenzek, G.; Guzmán, F.; Grave, E.; Ott, M.; Zettlemoyer, L.; Stoyanov, V. Unsupervised Cross-Lingual Representation Learning at Scale. In Proceedings of the 58th Annual Meeting of the Association for Computational Linguistics (ACL 2020), Online, 5–10 July 2020; pp. 8440–8451. [Google Scholar] [CrossRef] [Scilit]
- Bhoi, A.; Balabantaray, R.C.; Sahoo, D.; Dhiman, G.; Khare, M.; Narducci, F.; Kaur, A. Mining Social Media Text for Disaster Resource Management Using a Feature Selection Based on Forest Optimization. Comput. Ind. Eng. 2022, 169, 108280. [Google Scholar] [CrossRef] [Scilit]
- Lourentzou, I.; Manghnani, K.; Zhai, C. Adapting Sequence to Sequence Models for Text Normalization in Social Media. In Proceedings of the 13th International AAAI Conference on Web and Social Media (ICWSM 2019), Munich, Germany, 11–14 June 2019; pp. 335–345. [Google Scholar] [CrossRef] [Scilit]
- Zielinski, A.; Middleton, S.E.; Tokarchuk, L.N.; Wang, X. Social media text mining and network analysis for decision support in natural crisis management. In Proceedings of the 10th International Conference on Information Systems for Crisis Response and Management (ISCRAM 2013), Baden-Baden, Germany, 12–15 May 2013; pp. 840–845. [Google Scholar]
- Silva, C.; Carvalho, I.; Ferreira, B.; Pinto, J.; Cardoso, A.; Gonçalo Oliveira, H. Twitter and Sentiment Analysis for Wildfire Heat Mapping. Expert Syst. 2025, 42, e70147. [Google Scholar] [CrossRef] [Scilit]
- Lamsal, R.; Read, M.R.; Karunasekera, S. CrisisTransformers: Pre-trained Language Models and Sentence Encoders for Crisis-Related Social Media Texts. Knowl.-Based Syst. 2024, 296, 111916. [Google Scholar] [CrossRef] [Scilit]
- Schwarz, F.; Schwarz, K.D.; Aranda, D.A.; Bollens, K.; Shivananjappa, N.; Creutzburg, R.; Dimitrova, V. Zero-Shot Social Media Crisis Classification: A Training-Free Multimodal Approach. Appl. Sci. 2026, 16, 2192. [Google Scholar] [CrossRef] [Scilit]
- Yin, W.; Xue, Y.; Liu, Z.; Li, H.; Werner, M. LLM-Enhanced Disaster Geolocalization Using Implicit Geoinformation from Multimodal Data: A Case Study of Hurricane Harvey. Int. J. Appl. Earth Obs. Geoinf. 2025, 137, 104423. [Google Scholar] [CrossRef] [Scilit]
- Zhong, W.; Mei, X.; Niu, F.; Fan, X.; Ou, S.; Zhong, S. Fusing Social Media, Remote Sensing, and Fire Dynamics to Track Wildland-Urban Interface Fire. Remote Sens. 2023, 15, 3842. [Google Scholar] [CrossRef] [Scilit]
- Schmidt, S.; Friedemann, M.; Hanny, D.; Resch, B.; Riedlinger, T.; Mühlbauer, M. Enhancing Satellite-Based Emergency Mapping: Identifying Wildfires through Geo-Social Media Analysis. Big Earth Data 2025, 9, 389–411. [Google Scholar] [CrossRef] [Scilit]
- Palaiologou, P.; Giannakopoulos, C.; Vasilakos, C.; Sakellariou, S.; Rodrigues, M.; Karali, A.; Katavoutas, G.; Varotsos, K.V.; Roussou, O.; Gelabert, P.J.; et al. A Dataset to Support Wildland Fire and Fuel Management in Greece Created with Stochastic Wildfire Simulations. Data Brief 2026, 64, 112304. [Google Scholar] [CrossRef] [Scilit] [PubMed]
- Athanasiou, M.; Bouchounas, T.; Korakaki, E.; Tziritis, I.; Xanthopoulos, G.; Sitara, S. Introducing the Use of Fire for Wildfire Prevention in Greece: Pilot Application of Prescribed Burning in Chios Island. In Proceedings of the Advances in Forest Fire Research 2022, Coimbra, Portugal, 11–18 November 2022; pp. 1487–1494. [Google Scholar] [CrossRef] [Scilit] [PubMed]
- Avramidou, E.; Korakaki, E.; Oikonomakis, N.; Athanasiou, M. Short-Term Epigenetic Responses of Pinus brutia to Fire Stress: Insights from a Prescribed Burning in Greece. Genes 2026, 17, 309. [Google Scholar] [CrossRef] [Scilit] [PubMed]
- Misseyanni, A.; Christopoulou, A.; Kougkoulos, I.; Vassilakis, E.; Arianoutsou, M. The Impact of Forest Fires on Ecosystem Services: The Case of Greece. Forests 2025, 16, 533. [Google Scholar] [CrossRef] [Scilit]
- Mavraki, M.; Matsouki, N.; Gareiou, Z. Forest Fires in Greece: Environmental Impacts and Restoration Methods. E3S Web Conf. 2025, 669, 04006. [Google Scholar] [CrossRef] [Scilit]
- Twikit: A Simple Twitter API Scraper. Available online: https://github.com/d60/twikit (accessed on 17 August 2026).
- Murtfeldt, R.; Alterman, N.; Kahveci, I.; West, J.D. RIP Twitter API: A Eulogy to Its Vast Research Contributions. arXiv 2024, arXiv:2404.07340. [Google Scholar] [CrossRef] [Scilit]
- Developer X. A New Developer Experience. Available online: https://developer.x.com/#pricing (accessed on 20 March 2026).
- Cohen, J. A Coefficient of Agreement for Nominal Scales. Educ. Psychol. Meas. 1960, 20, 37–46. [Google Scholar] [CrossRef] [Scilit]
- Krippendorff, K. Content Analysis: An Introduction to Its Methodology, 2nd ed.; Sage Publications: Thousand Oaks, CA, USA, 2004. [Google Scholar]
- Landis, J.R.; Koch, G.G. The Measurement of Observer Agreement for Categorical Data. Biometrics 1977, 33, 159–174. [Google Scholar] [CrossRef] [Scilit]
- Honnibal, M.; Montani, I.; Van Landeghem, S.; Boyd, A. spaCy: Industrial-Strength Natural Language Processing in Python. Available online: https://spacy.io (accessed on 16 August 2026). [CrossRef] [Scilit]
- Devlin, J.; Chang, M.-W.; Lee, K.; Toutanova, K. BERT: Pre-training of Deep Bidirectional Transformers for Language Understanding. In Proceedings of the 2019 Conference of the North American Chapter of the Association for Computational Linguistics: Human Language Technologies (NAACL-HLT 2019), Minneapolis, MN, USA, 2–7 June 2019; pp. 4171–4186. [Google Scholar] [CrossRef] [Scilit]
- Brown, T.B.; Mann, B.; Ryder, N.; Subbiah, M.; Kaplan, J.; Dhariwal, P.; Neelakantan, A.; Shyam, P.; Sastry, G.; Askell, A.; et al. Language Models Are Few-Shot Learners. In Proceedings of the 34th Conference on Neural Information Processing Systems (NeurIPS 2020), Online, 6–12 December 2020. [Google Scholar]
- Loukas, L.; Smyrnioudis, N.; Dikonomaki, C.; Barbakos, S.; Toumazatos, A.; Koutsikakis, J.; Kyriakakis, M.; Georgiou, M.; Vassos, S.; Pavlopoulos, J.; et al. GR-NLP-TOOLKIT: An Open-Source NLP Toolkit for Modern Greek. In Proceedings of the 31st International Conference on Computational Linguistics: System Demonstrations (COLING 2025), Abu Dhabi, United Arab Emirates, 19–24 January 2025. [Google Scholar]
- OpenStreetMap Contributors. OpenStreetMap and Nominatim Geocoding Service. Available online: https://www.openstreetmap.org/copyright (accessed on 16 August 2026).
- Ester, M.; Kriegel, H.-P.; Sander, J.; Xu, X. A Density-Based Algorithm for Discovering Clusters in Large Spatial Databases with Noise. In Proceedings of the 2nd International Conference on Knowledge Discovery and Data Mining (KDD-96), Portland, OR, USA, 2–4 August 1996; pp. 226–231. [Google Scholar]
- Folium: Python Data, Leaflet.js Maps. Available online: https://python-visualization.github.io/folium/ (accessed on 16 August 2026).
- 112 Greece (@112Greece). Public Warning Messages on X, 11–13 August 2024. Available online: https://x.com/112Greece/status/1822631123660218548 (accessed on 23 September 2026).
- Franceschini, R.; Rosi, A.; Catani, F.; Casagli, N. Detecting Information from Twitter on Landslide Hazards in Italy Using Deep Learning Models. Geoenviron. Disasters 2024, 11, 22. [Google Scholar] [CrossRef] [Scilit]
- Malik, M.S.I.; Younas, M.Z.; Jamjoom, M.M.; Ignatov, D.I. Categorization of Tweets for Damages: Infrastructure and Human Damage Assessment Using Fine-Tuned BERT Model. PeerJ Comput. Sci. 2024, 10, e1859. [Google Scholar] [CrossRef] [Scilit] [PubMed]
- Han, J.; Zheng, Z.; Lu, X.-Z.; Chen, K.-Y.; Lin, J.-R. QuakeBERT: Accurate Classification of Social Media Texts for Rapid Earthquake Impact Assessment. Int. J. Disaster Risk Reduct. 2024, 109, 104574. [Google Scholar] [CrossRef] [Scilit]
- Hu, Y.; Mai, G.; Cundy, C.; Choi, K.; Lao, N.; Liu, W.; Lakhanpal, G.; Zhou, R.Z.; Joseph, K. Geo-Knowledge-Guided GPT Models Improve the Extraction of Location Descriptions from Disaster-Related Social Media Messages. Int. J. Geogr. Inf. Sci. 2023, 37, 2289–2318. [Google Scholar] [CrossRef] [Scilit]
- Scalia, G.; Francalanci, C.; Pernici, B. CIME: Context-Aware Geolocation of Emergency-Related Posts. GeoInformatica 2022, 26, 125–157. [Google Scholar] [CrossRef] [Scilit]
- Caillaut, G.; Auclair, S.; Gracianne, C.; Abadie, N.; Touya, G. Entity Linking for Real-Time Geolocation of Natural Disasters from Social Network Posts. PLoS ONE 2024, 19, e0307254. [Google Scholar] [CrossRef] [Scilit] [PubMed]
- Hu, X.; Kersten, J.; Klan, F.; Farzana, S.M. Toponym Resolution Leveraging Lightweight and Open-Source Large Language Models and Geo-Knowledge. Int. J. Geogr. Inf. Sci. 2026, 40, 670–697. [Google Scholar] [CrossRef] [Scilit]
- Wang, F.; Chen, J.; Yang, S.; Al-Lawati, A.; Tang, L.; Liu, H.; Wang, S. A Survey on Collaborating Small and Large Language Models for Performance, Cost-effectiveness, Cloud-edge Privacy, and Trustworthiness. arXiv 2025, arXiv:2510.13890. [Google Scholar] [CrossRef] [Scilit]
- Lazanas, A.; Kampouropoulos, G. Breaking the Homogeneity Assumption: Specialized Multi-Generator Adversarial Learning for Rare Failure Detection in Predictive Maintenance. Int. J. Comput. Appl. 2026, 187, 25–37. [Google Scholar] [CrossRef] [Scilit]
- Pennisi, F.; Pinto, A.; Borgonovo, F.; Scaglione, G.; Ligresti, R.; Santangelo, O.E.; Provenzano, S.; Gori, A.; Baldo, V.; Signorelli, C.; et al. Artificial Intelligence Models for Forecasting Mosquito-Borne Viral Diseases in Human Populations: A Global Systematic Review and Comparative Performance Analysis. Mach. Learn. Knowl. Extr. 2026, 8, 15. [Google Scholar] [CrossRef] [Scilit]
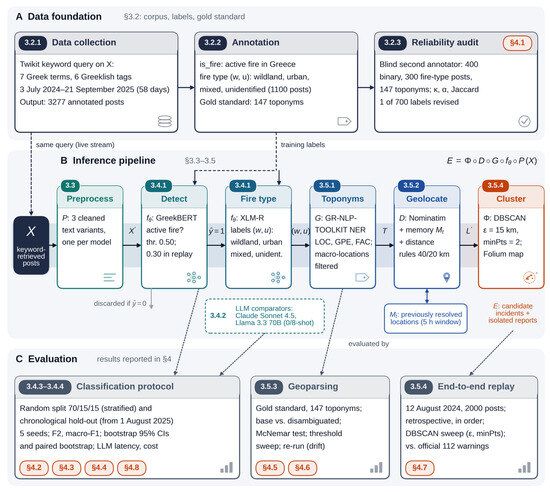
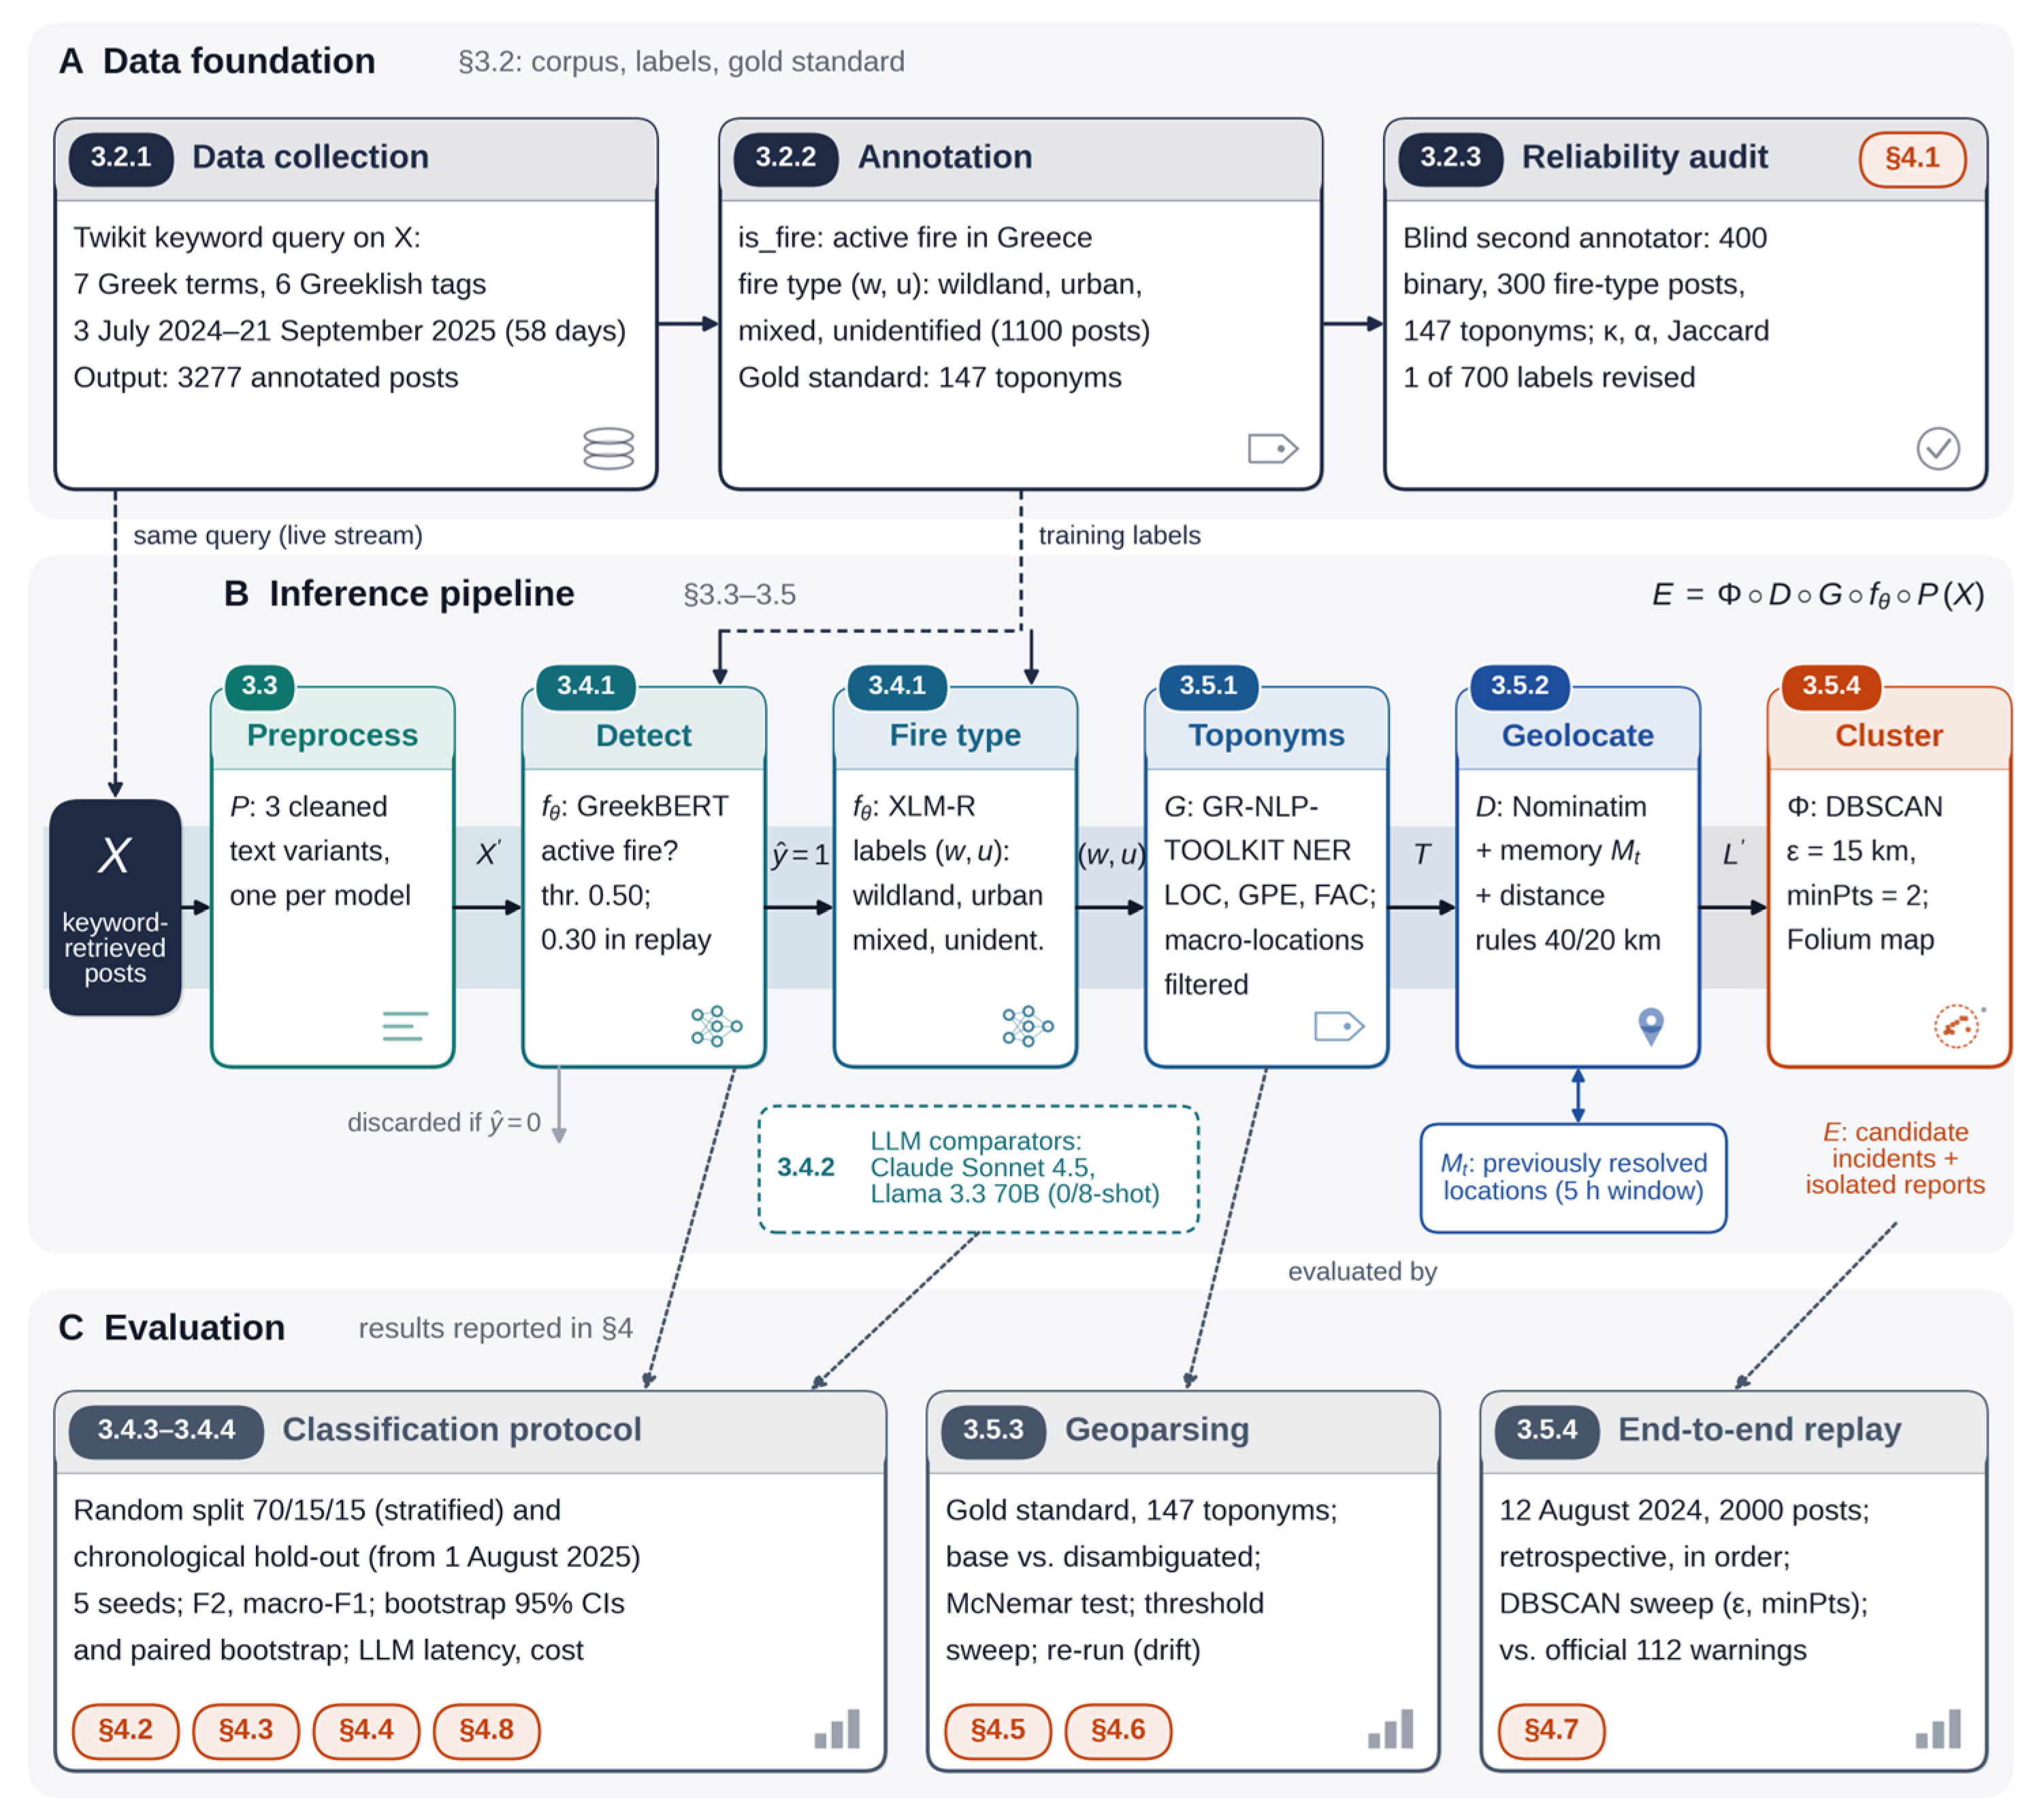
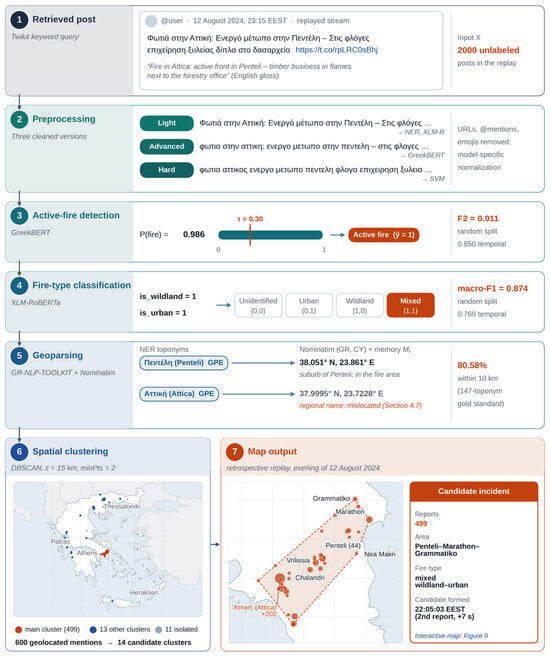
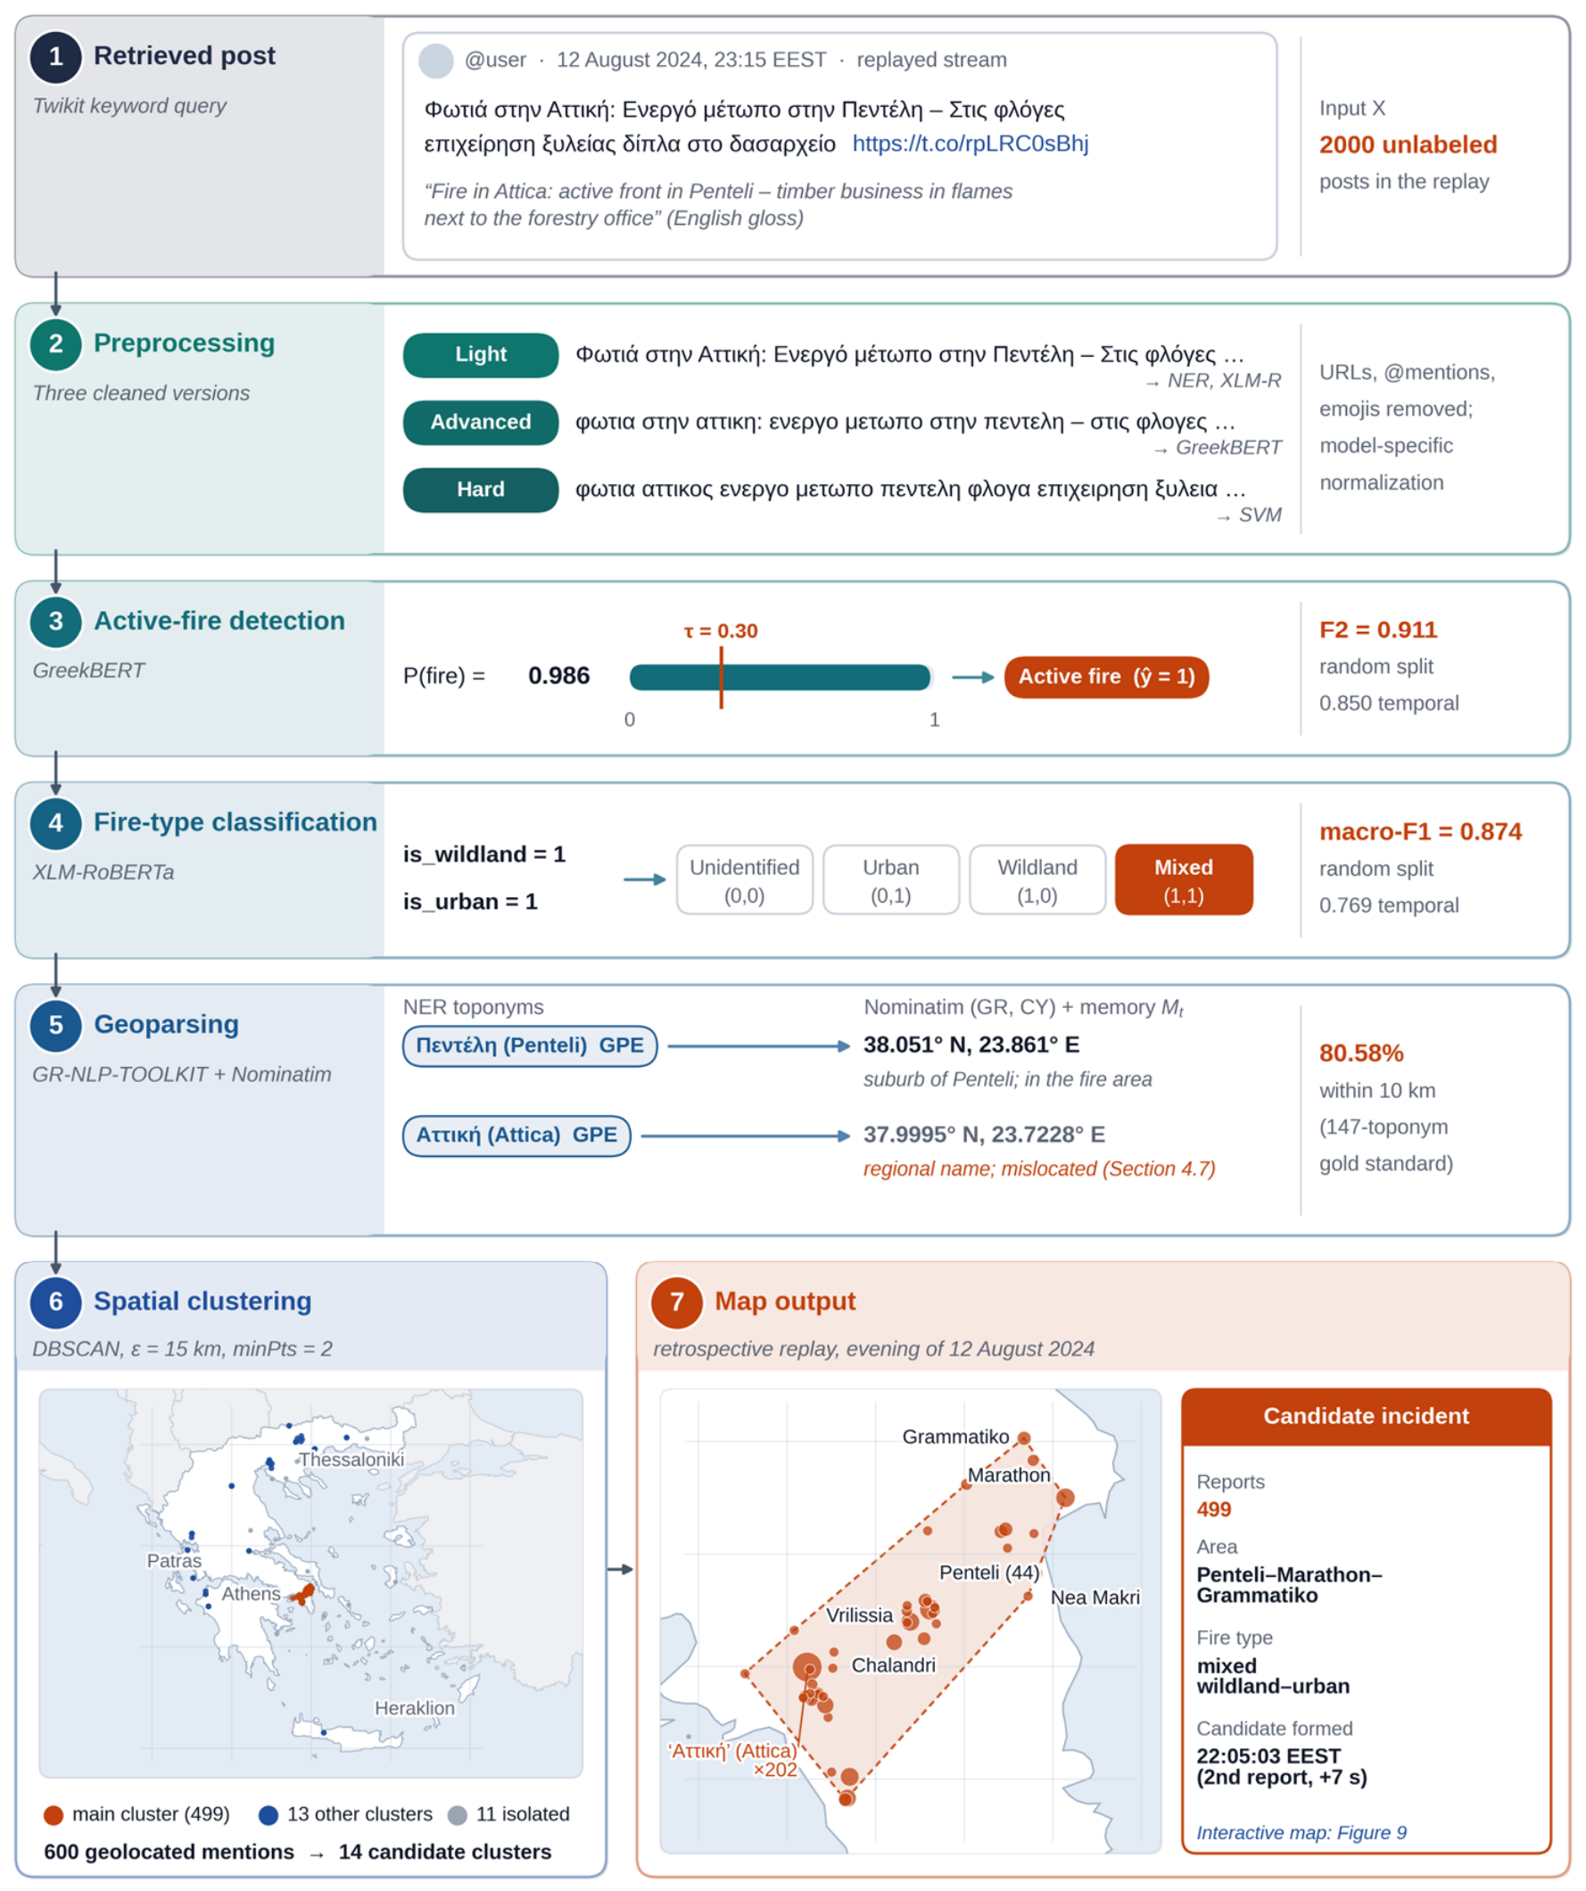
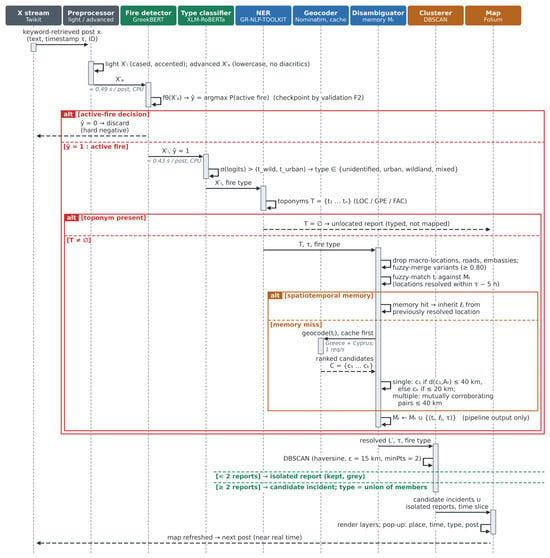
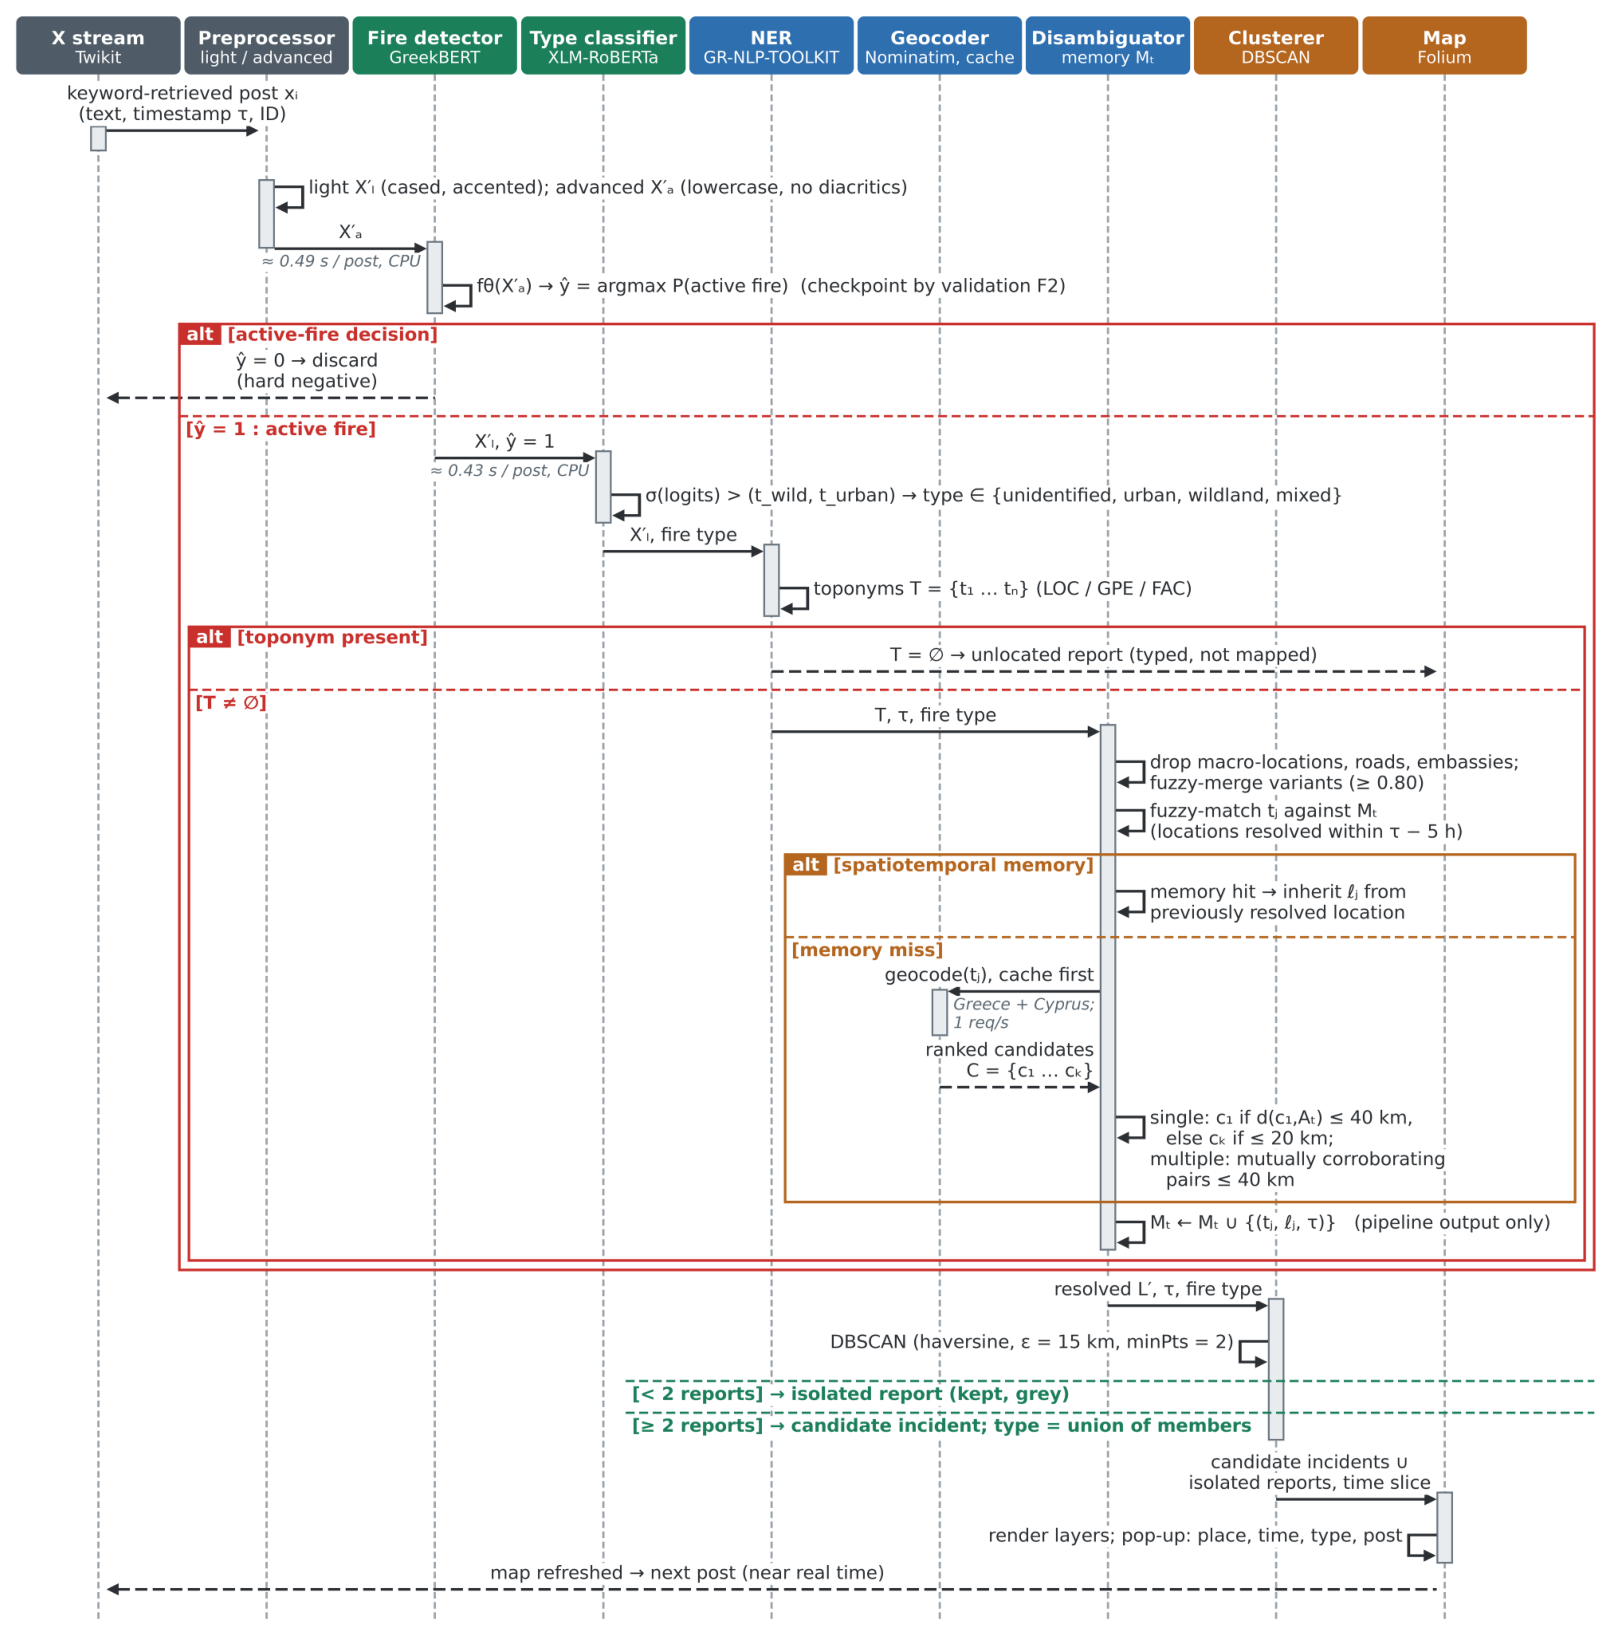
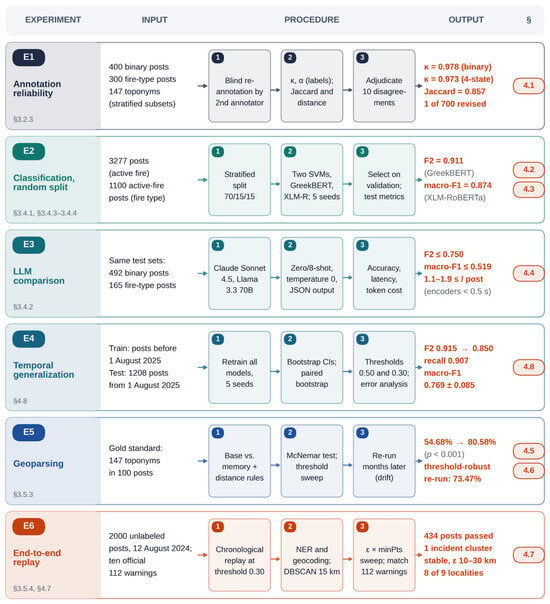
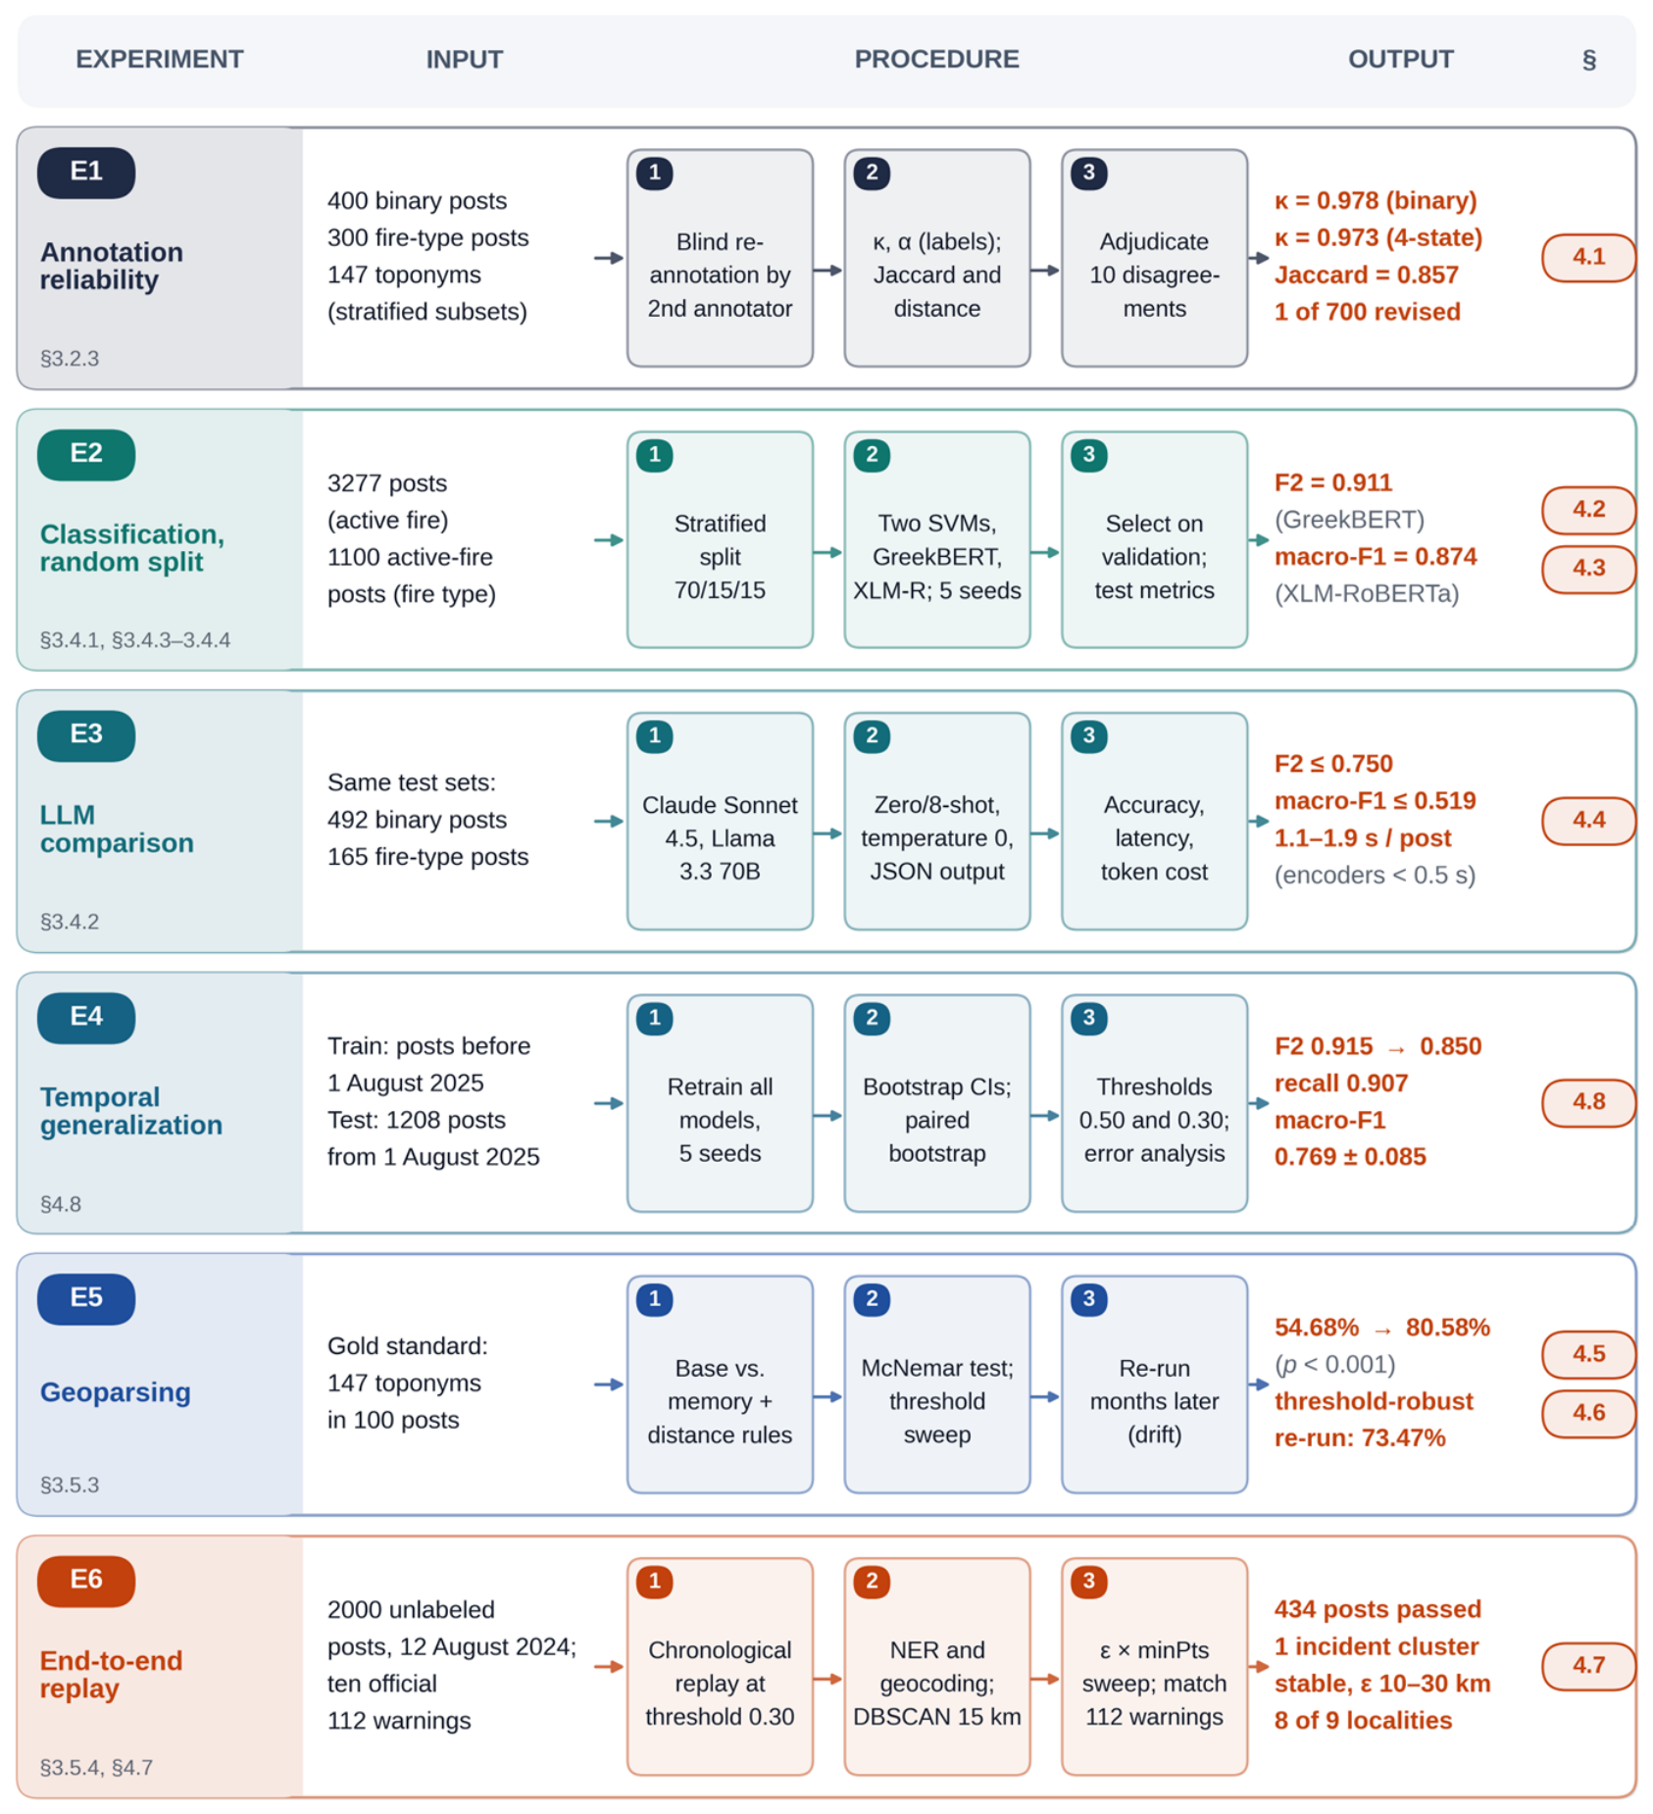
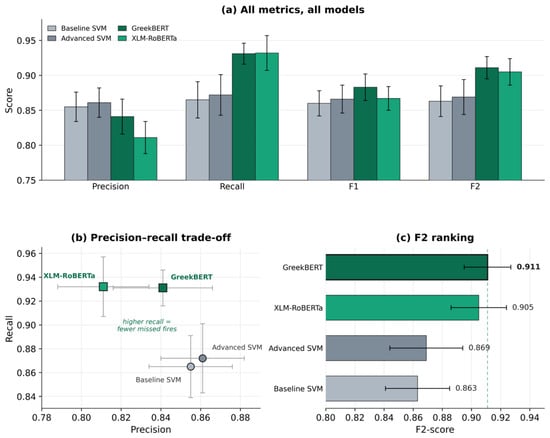
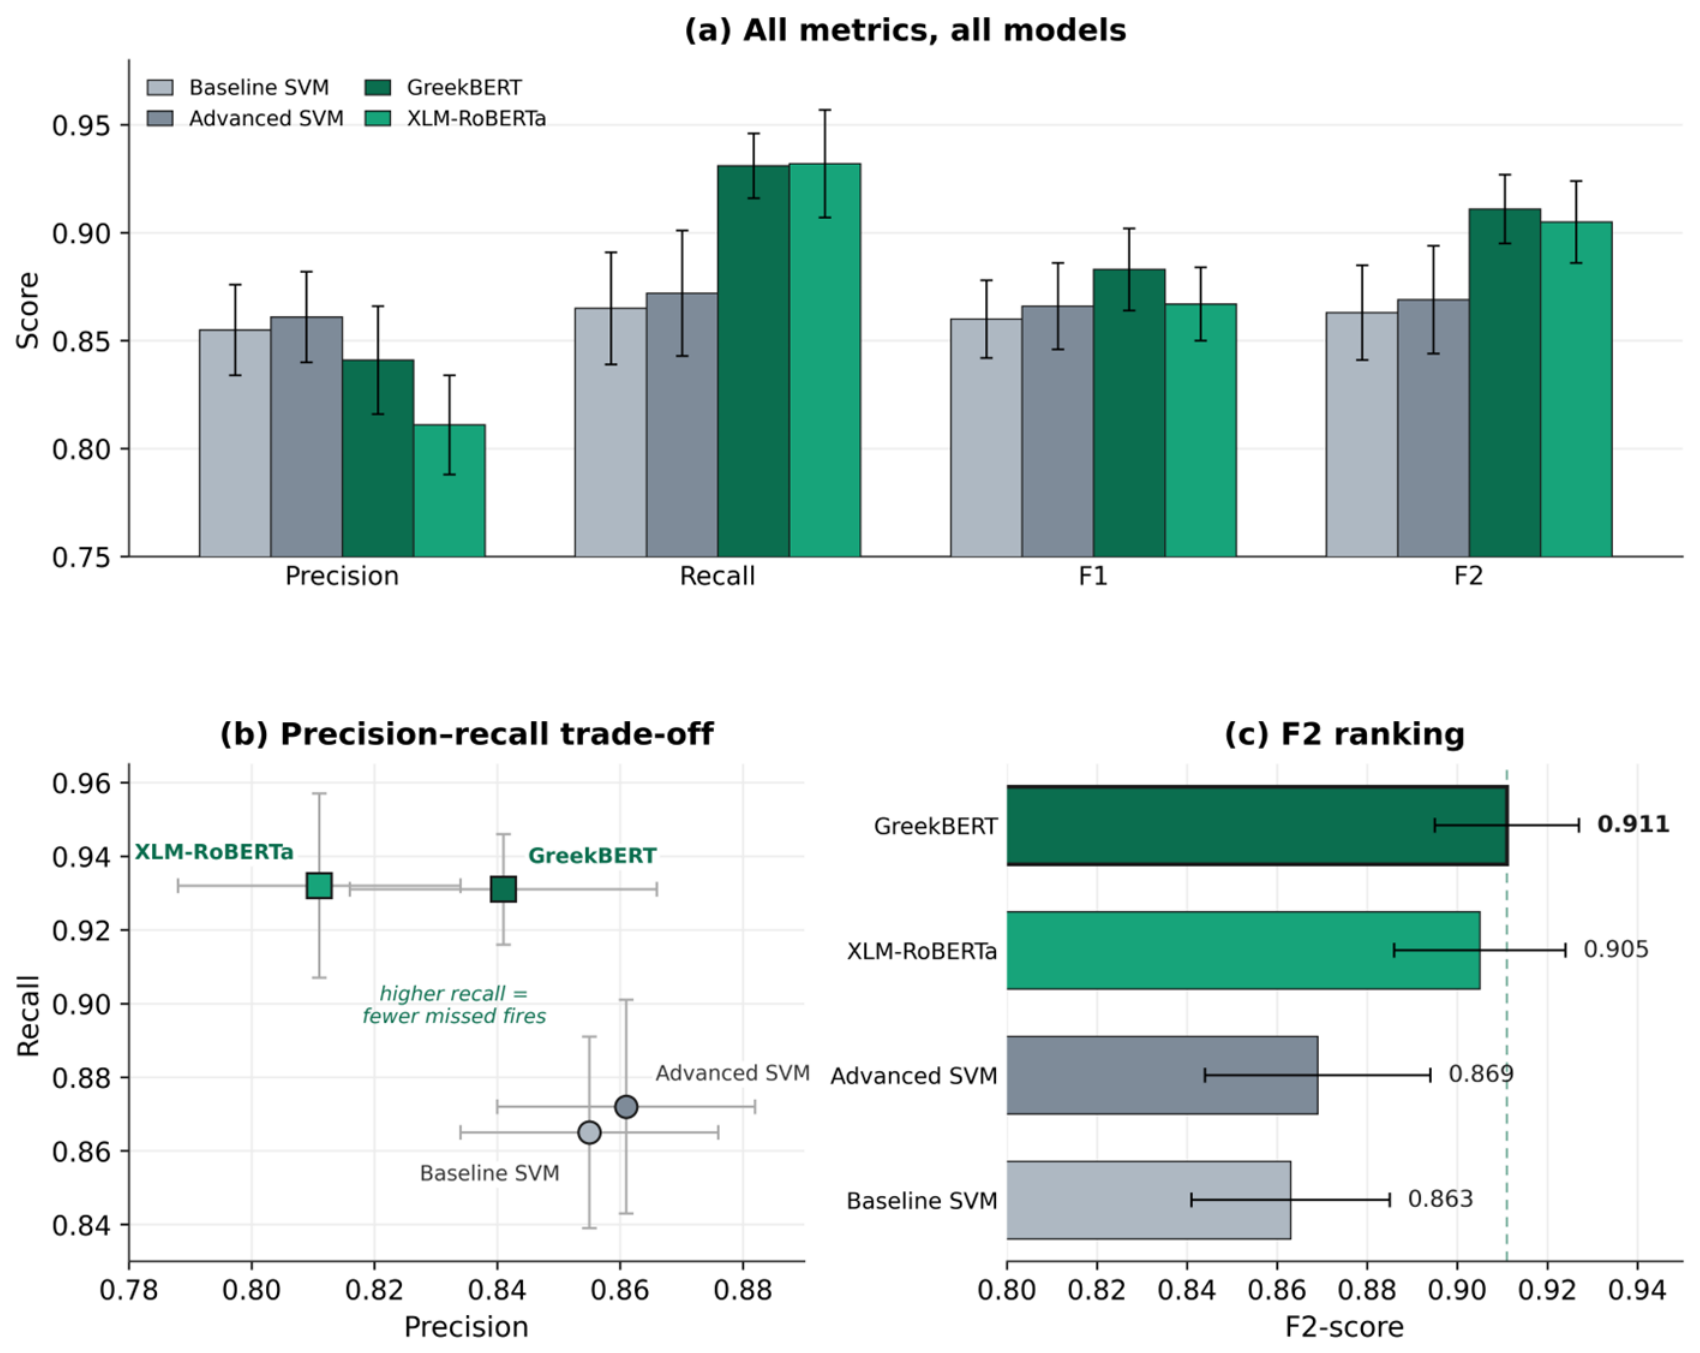
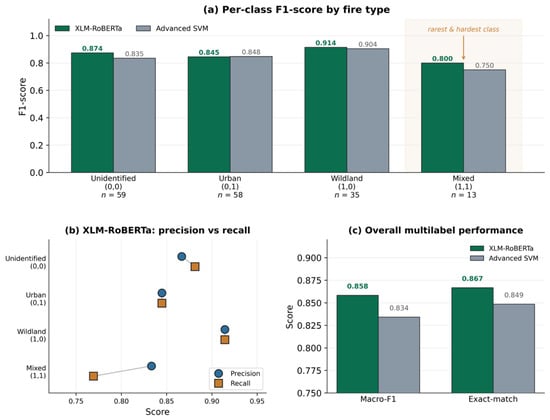
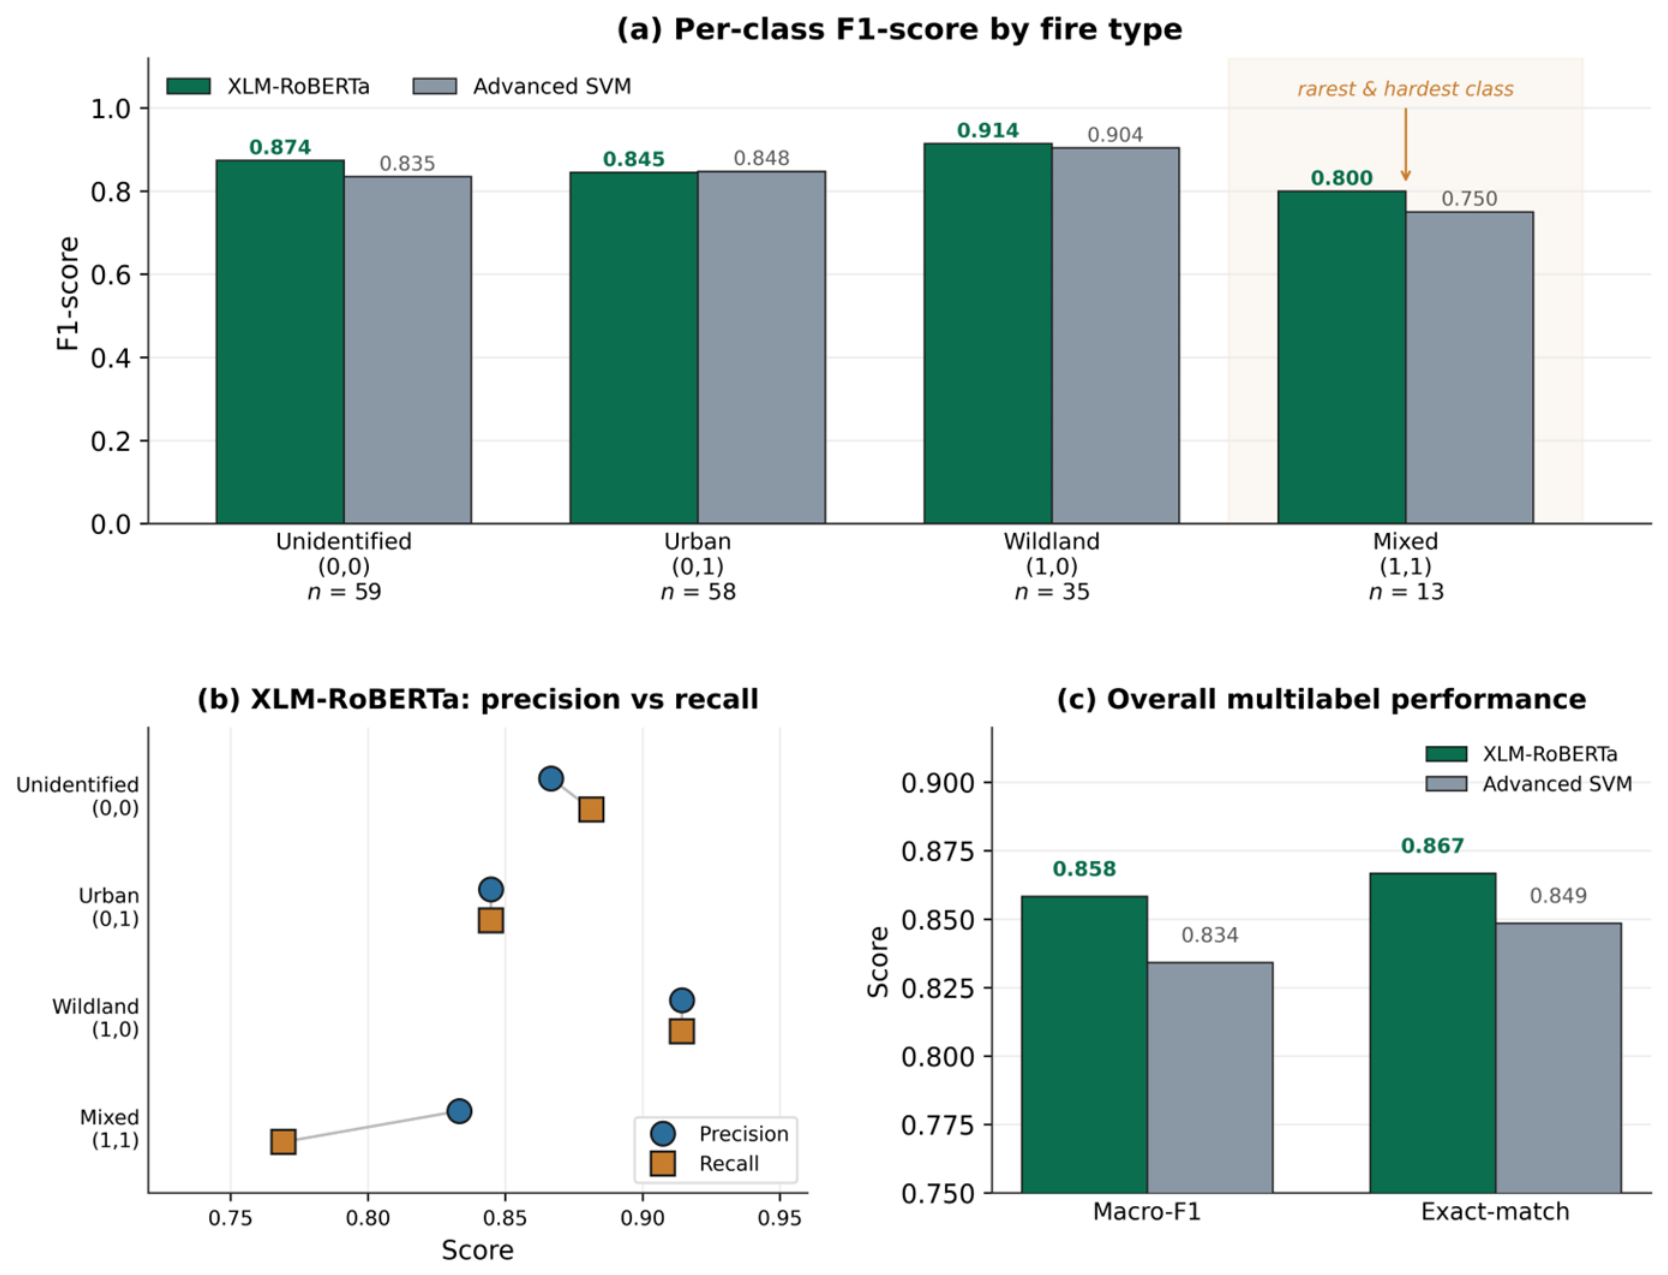
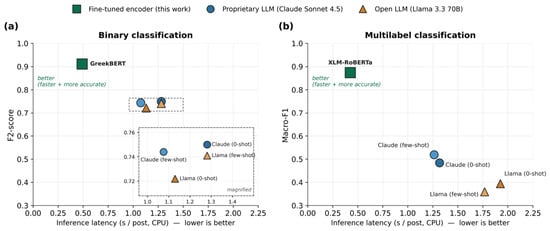
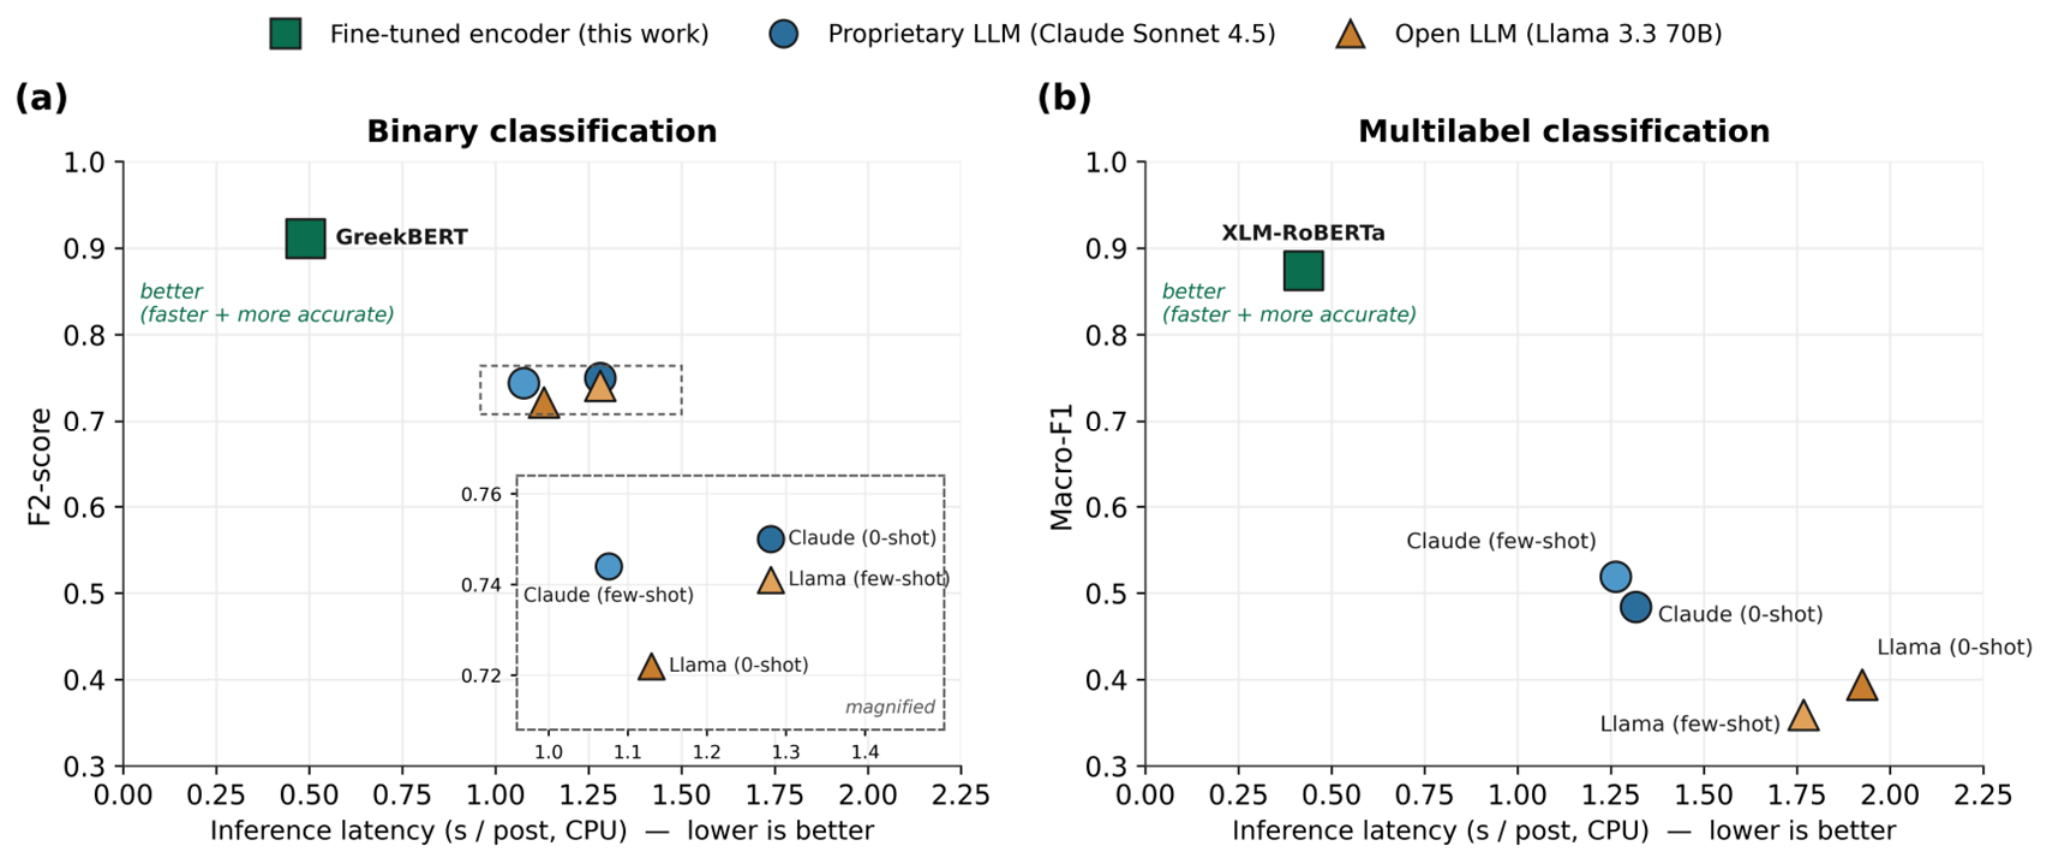
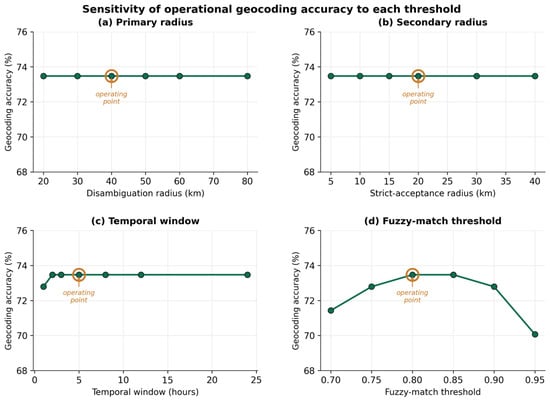
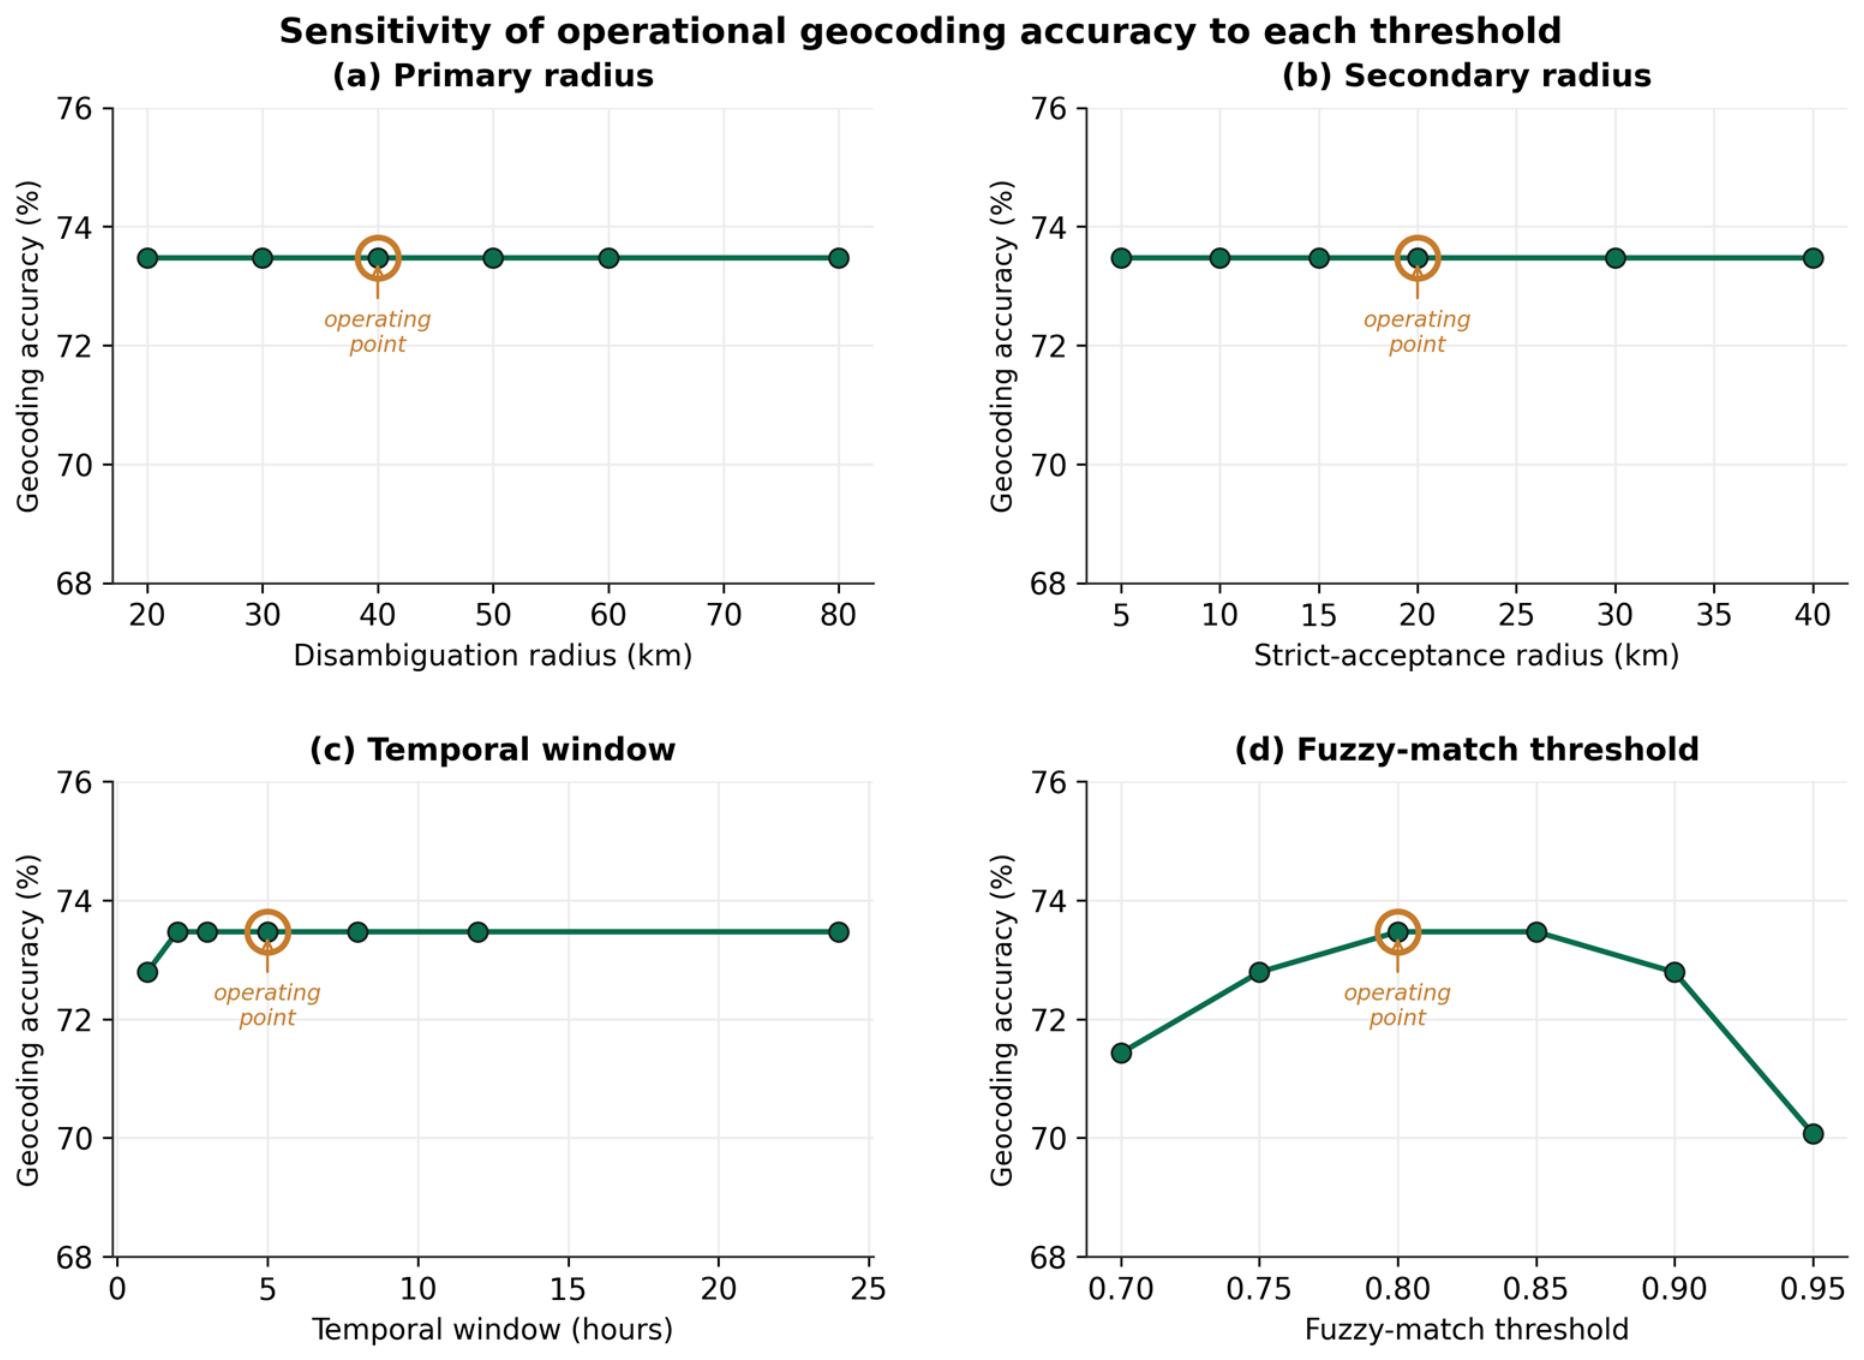
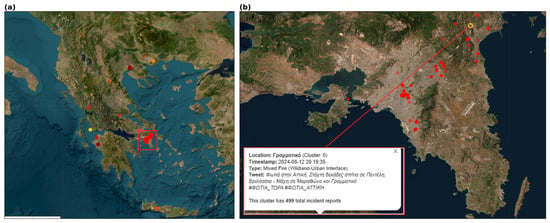
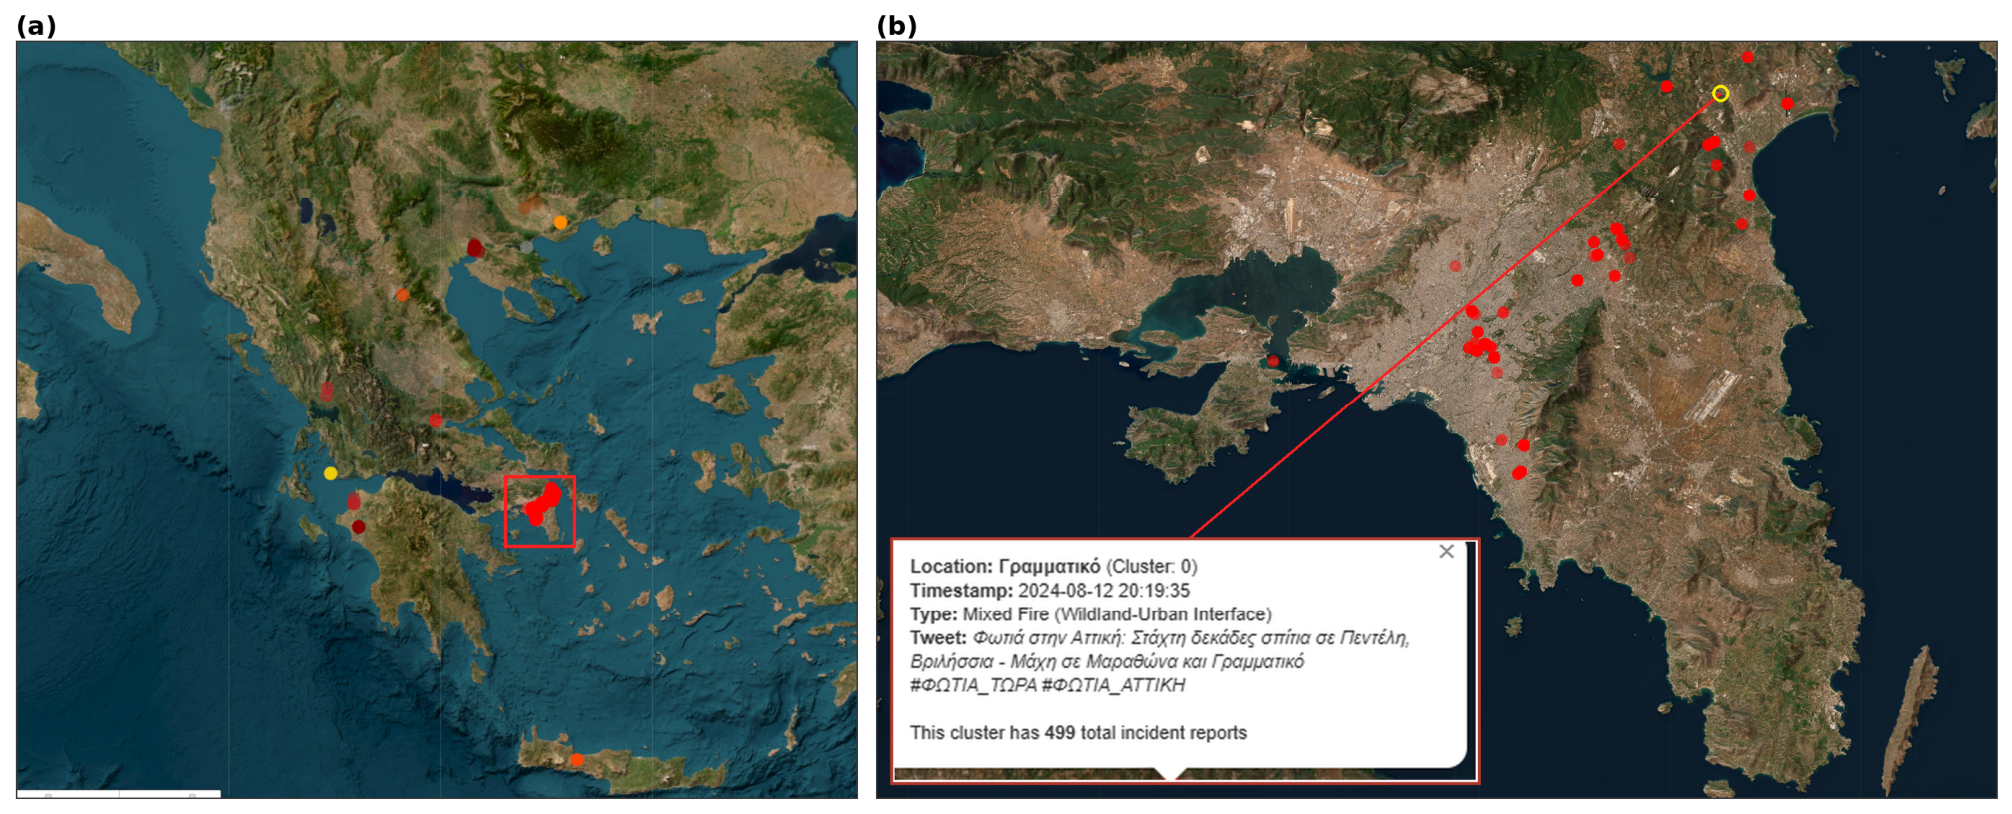

Disclaimer/Publisher’s Note: The statements, opinions and data contained in all publications are solely those of the individual author(s) and contributor(s) and not of MDPI and/or the editor(s). MDPI and/or the editor(s) disclaim responsibility for any injury to people or property resulting from any ideas, methods, instructions or products referred to in the content. |
© 2026 by the authors. Licensee MDPI, Basel, Switzerland. This article is an open access article distributed under the terms and conditions of the Creative Commons Attribution (CC BY) license.