


Abstract
Accurately recognizing maize leaf diseases requires analyzing visual information expressed across multiple spatial scales. This includes the leaf’s overall appearance, intermediate-scale texture structures, and localized lesion patterns. This study proposes a coarse–medium–fine (CMF) architecture inspired by the human visual system that uses a convolutional neural network to classify maize leaf images into four categories: blight, common rust, gray leaf spot, and healthy. The CMF architecture contains three parallel convolutional branches that learn complementary coarse, medium, and fine representations. The feature maps are integrated through a weighted fusion strategy and processed by a fully connected classifier. The model was trained from scratch using a balanced subset of 2000 original images selected from the Corn or Maize Leaf Disease Dataset. The experimental protocol used 1600 images for training and 400 for testing. Augmentation was applied to the training set only; the testing set remained unchanged. The Coarse, Medium, and Fine branches achieved accuracies of , , and , respectively. A fixed held-out test partition was used to evaluate the three individual branches and the complete CMF model. Five balanced random subsets of 300 images (75 images per class) were employed for this evaluation. The resulting performance was summarized using the mean and standard deviation across the five test-subset evaluations. The complete CMF model achieved accuracy, as well as macro-averaged precision, recall, and F1-score values of , , and , respectively. Under a common, repeated, random subsampling evaluation protocol applied to the three individual branches and the complete CMF model, the fused model improved accuracy by 4.15 percentage points relative to the Fine branch. Blight and Healthy achieved recall values of , while Gray Leaf Spot and Common Rust achieved recall values of and , respectively. The branch-level and fused-model results support the complementary role of the three spatial representations under the evaluated experimental conditions. The proposed CMF architecture provides an explicit, multiscale learning framework for image-based maize leaf disease classification and motivates further evaluation under practical agricultural conditions.
1. Introduction
Automatic disease diagnosis in agriculture has become increasingly feasible owing to recent advances in artificial intelligence (AI) and deep learning. Image-based methods are now widely employed to detect diseases affecting plants, fruits, and vegetables. Among deep learning approaches, convolutional neural networks (CNNs) have demonstrated outstanding performance in learning discriminative visual features for complex image classification tasks [1,2]. Unlike traditional machine-learning methods, which depend on manually engineered descriptors such as edges, colors, textures, and image regions [3], CNNs automatically learn hierarchical feature representations directly from RGB images. Through successive convolutional layers, the network progressively transforms low-level visual patterns into increasingly abstract semantic representations. This hierarchical feature-learning process enables CNNs to capture highly discriminative information, making them particularly effective for a broad range of computer vision tasks. The success of early deep learning architectures, particularly AlexNet in the ImageNet Large Scale Visual Recognition Challenge [4], accelerated the widespread adoption of CNN-based methods across numerous research domains. More recently, CNNs have become one of the predominant approaches in precision agriculture for the detection and classification of plant diseases across a wide variety of crop species [5].
Maize (Zea mays) is one of the most widely cultivated crops worldwide and is primarily grown for human consumption, animal feed, and the production of sweeteners such as high-fructose corn syrup. However, maize production is frequently threatened by pests and diseases that significantly reduce crop yield and quality. Among the most prevalent foliar diseases are common rust, northern leaf blight, and gray leaf spot. These diseases impair leaf function by reducing photosynthetic capacity, ultimately affecting both grain yield and quality [6]. Consequently, the rapid and accurate identification of maize leaf diseases has become an important objective in agricultural research. Early studies demonstrated that convolutional neural network-based models can effectively recognize disease symptoms from leaf images. Most of these approaches relied on computationally intensive, or “heavyweight”, architectures originally developed for general-purpose image recognition tasks [7,8]. Although these models achieved high classification accuracy on plant disease datasets, they require substantial computational resources. For example, ResNet-based architectures have reported classification accuracies exceeding 97% for maize disease recognition, while DenseNet-based models have achieved comparable performance [7,8].
More recently, the focus of computer vision research in agriculture has shifted from demonstrating the feasibility of automated disease diagnosis toward developing practical solutions suitable for real-world deployment. Early studies primarily emphasized maximizing classification accuracy under controlled laboratory conditions, with limited attention to computational constraints and deployment requirements. In practical agricultural environments, however, disease diagnosis is commonly performed on handheld devices or embedded edge platforms with limited computational resources. Consequently, considerable effort has been devoted to developing neural network architectures that achieve an effective balance between predictive performance and computational efficiency. Recent studies have therefore concentrated on lightweight architectures capable of learning discriminative visual features while requiring fewer parameters and lower computational cost. This capability is particularly important for deployment on resource-constrained devices, including mobile platforms and embedded systems. The objective is to achieve an appropriate trade-off between computational efficiency and representational capacity while maintaining high classification accuracy. Architectures such as MobileNet and EfficientNet exemplify this new generation of computationally efficient convolutional neural networks. By incorporating techniques such as depthwise separable convolutions, compound scaling, and efficient parameter allocation, these architectures substantially reduce computational cost during both training and inference while maintaining competitive classification performance [9].
A widely adopted strategy for image classification is to train a deep neural network on a large source dataset and subsequently adapt it to a target task through transfer learning (TL) [10]. Rather than training a model from scratch, TL initializes the target network using parameters learned from a large-scale dataset and subsequently fine-tunes it with data from the target application domain. This approach substantially reduces both training time and computational cost while often improving convergence. Transfer learning is particularly advantageous when only a limited amount of labeled training data is available, as pre-trained models already encode general visual features that can be effectively transferred to related tasks [11].
Despite its advantages, transfer learning has several limitations. Its effectiveness decreases as the domain gap between the source dataset (e.g., ImageNet) and the target dataset (e.g., maize leaf images) increases. Large domain discrepancies reduce the transferability of previously learned visual features and may introduce additional challenges, including catastrophic forgetting, in which the network progressively loses generic knowledge acquired during pre-training while adapting to the target domain. Consequently, the resulting model may become biased or more difficult to optimize effectively [12].
Motivated by these limitations, we introduce a convolutional neural network trained from scratch and inspired by the hierarchical processing mechanism of the human visual system (HVS) [13,14]. The proposed Coarse–Medium–Fine architecture explicitly models three complementary levels of visual representation: coarse (C), medium (M), and fine (F), corresponding to global leaf structure, intermediate spatial patterns, and fine local details, respectively. The CMF model comprises three sequential stages: data conditioning and augmentation, feature extraction, and classification. The proposed approach was evaluated using the “Corn or Maize Leaf Disease” dataset, which consists of four classes: (a) blight, (b) common rust, (c) gray leaf spot, and (d) healthy. Performance was assessed using a repeated random sub-sampling validation, yielding an overall classification accuracy of 99.25%.
2. State of the Art
Image-based diagnosis of maize leaf diseases has evolved from approaches based on handcrafted descriptors to deep learning methods that learn visual representations directly from image data. Earlier machine-learning pipelines typically extracted color, texture, shape, or local-pattern descriptors and subsequently used a conventional classifier. Although such approaches can be useful under controlled conditions, their performance depends strongly on the selected feature representation and may be affected by variations in illumination, leaf orientation, symptom severity, image quality, and background complexity. In contrast, CNNs learn hierarchical feature representations directly from images and have consequently become a widely used approach for plant disease recognition [1,5,15]. Maize leaf disease recognition remains challenging because disease symptoms may occur at different spatial scales. Global leaf morphology and large lesions can provide coarse contextual information, whereas disease identification may also depend on intermediate-level texture patterns and localized visual details, such as rust pustules, chlorotic regions, lesion boundaries, and necrotic areas. Moreover, the visual separation between disease classes can be affected by background interference, nonuniform illumination, image blur, leaf overlap, and substantial intra-class variation. These factors can limit the generalization of models evaluated primarily on controlled images and motivate the development of architectures that preserve complementary information across multiple spatial scales [15,16,17].
2.1. CNN-Based Maize Disease Classification
Conventional CNN architectures, often combined with transfer learning, have been extensively evaluated for maize leaf disease classification. Architectures such as VGG, ResNet, DenseNet, Inception, MobileNet, and EfficientNet are commonly used as baseline or comparison models because they provide different trade-offs between representational capacity and computational cost. ResNet- and DenseNet-based models have reported strong results for maize disease recognition; however, their performance cannot be compared solely on the basis of reported accuracy because datasets, class definitions, train–test partitions, augmentation procedures, input resolutions, and pretraining strategies differ among studies [17,18].
Lightweight CNNs are particularly relevant when the intended application includes mobile or edge deployment. MobileNet architectures reduce computational cost through depthwise separable convolutions, while MobileNetV2 [19] introduced inverted residual blocks with linear bottlenecks to improve computational efficiency in resource-constrained settings. In a comparative study of lightweight CNNs for maize leaf disease detection, Mitro et al. [20] reported that their customized MobileNetV3 achieved 97.63% accuracy on their experimental dataset. This result indicates that lightweight architectures can achieve competitive classification performance; however, the reported value should be interpreted within the specific dataset and experimental protocol rather than as an architecture-independent benchmark.
The public Corn or Maize Leaf Disease Dataset has also been used in several comparative studies. The dataset contains 4188 RGB images belonging to four classes: Blight, Common Rust, Gray Leaf Spot, and Healthy [21]. Using this dataset, Askale et al. [22] compared VGG16, AlexNet, and ResNet50, reporting test accuracies of 95%, 91%, and 72%, respectively. Based on these results, VGG16 was selected for deployment in a mobile application. Tariq et al. [23] evaluated a VGG16-based model enhanced with Layer-wise Relevance Propagation (LRP) on the same four-class dataset and reported a test accuracy of 94.67% and a precision of 92.91%. These studies provide a relevant comparison context for the present work because they use the same dataset source and class structure. Nevertheless, differences in data splitting, augmentation, input resolution, training initialization, and testing protocols still prevent a definitive ranking based on accuracy alone.
2.2. Efficient CNNs and Attention Mechanisms
EfficientNet [9] is another widely used CNN family because its compound-scaling strategy jointly adjusts network depth, width, and input resolution. In maize disease recognition, attention mechanisms have been integrated with CNN backbones to emphasize disease-related features and reduce the influence of irrelevant background information. For example, Albahli and Masood proposed the Efficient Attention Network (EANet), an EfficientNetV2-based architecture that combines spatial and channel attention with transfer learning and multiclass focal loss. Their experiments used a multisource maize disease dataset containing images from controlled and real-world environments. EANet [16] achieved a test accuracy of 98.94%, it was evaluated using a dataset containing five maize disease-related classes, including Southern Leaf Blight, its reported accuracy should not be treated as a directly equivalent benchmark to the four-class dataset used in the present study.
Other task-specific CNN designs have sought to address complex backgrounds, limited sample sizes, and visually similar symptoms. Chen et al. [24] proposed DFCANet, a lightweight architecture that combines dual feature fusion, coordinate attention, and down-sampling modules for corn disease identification. The authors reported an average recognition accuracy of 98.47% on real-scene images and showed that the model outperformed several conventional CNN baselines under their experimental protocol. Li et al. [17] investigated maize disease classification under small-sample and complex-background conditions using multiple CNN architectures, including DenseNet121, ResNet50, MobileNetV2, NASNetMobile, and a modified dense network. Collectively, these studies indicate that preserving disease-relevant information while reducing the influence of complex backgrounds is an important consideration in maize leaf disease classification.
2.3. Multi-Scale and Transformer-Based Approaches
Recent studies have also incorporated explicit multi-scale processing, self-attention, and Vision Transformer (ViT) components. Multi-scale architectures are particularly relevant to maize disease recognition because lesions may vary substantially in size and appearance, requiring the representation of both broader leaf structure and localized disease characteristics. Wang et al. [25] proposed the TC-MRSN model, which combines texture and color information with multiscale residual shrinkage modules to improve maize leaf disease recognition under complex field backgrounds. The model achieved an average accuracy of 94.88% on a complex-background dataset and 99.59% on a PlantVillage dataset. These results support the use of multiscale feature extraction as a strategy for handling variations in lesion size and background complexity, although performance remains dependent on the dataset and evaluation protocol.
General-purpose CNN architectures have also addressed multi-scale representations. Inception modules [26] and Res2Net [27] combine receptive fields of different sizes within a single block. In contrast, Octave Convolution [28] factorizes feature maps into high- and low-frequency components that exchange information at every layer. Feature Pyramid Networks (FPN) [29] and HRNet [30] fuse representations across resolutions at several stages of a shared backbone. Feature fusion using heterogeneous sources has also been explored. For example, Chen et al. [31] proposed a sparse-to-dense guided fusion framework for three-dimensional object detection in railway environments. In this framework, sparse LiDAR voxel features guide the retrieval of dense camera features through cross-modal attention. Robust visual representation learning has also been approached by explicitly modeling image formation conditions. For example, CoralSMIA [32] incorporates a physically grounded model of underwater light scattering and illumination adaptation to generalize coral segmentation across imaging environments. In these approaches, scales or sources interact throughout the network or through learned guidance mechanisms. Alternatively, robustness is obtained by modeling the physics of image acquisition. In contrast, the CMF architecture investigated in this work extracts three scale-specific representations from a single RGB image in parallel using independent branches with different downsampling schedules and integrates them at a single weighted fusion stage without modeling image formation physics. This design keeps each representation separable, allowing the contribution of each spatial scale to be analyzed individually.
Vision Transformers and CNN–ViT hybrid models have also been investigated as alternatives to purely convolutional architectures. Shandilya et al. [33] presented an integrated CNN–ViT model evaluated on a combination of the Kaggle maize dataset and a Mendeley dataset, reporting a mean accuracy of 99.06% under five-fold cross-validation. Özüpak et al. [34] proposed a stacking framework that combines MobileNetV2 and a Vision Transformer with explainable-AI analysis, reporting 96.73% accuracy on a modified version of the maize disease dataset. Waema et al. [35] introduced ConvDeiT-Tiny, which incorporates depthwise convolutional branches into a lightweight DeiT-based architecture to introduce local inductive bias while retaining transformer-based global feature modeling. The model achieved 98.60% accuracy on the Kaggle maize leaf disease dataset under transfer learning. Ullah et al. [36] proposed EDISP, a hybrid CNN–ViT framework evaluated using a multisource dataset combining Kaggle and additional Mendeley samples. These studies indicate that attention-based and hybrid architectures can provide effective representations for maize disease recognition. However, results obtained from merged datasets, modified class definitions, or different validation schemes should not be treated as strictly comparable with results obtained on the original four-class Corn or Maize Leaf Disease Dataset.
Overall, the literature shows that high classification performance can be obtained with conventional CNNs, lightweight CNNs, attention-based networks, and CNN–ViT hybrid architectures. However, reported accuracy values are strongly influenced by the data source, class distribution, image-acquisition conditions, preprocessing and augmentation strategies, use of transfer learning, and evaluation protocol. Therefore, meaningful comparisons should consider class-wise precision, recall, and F1-score in addition to accuracy, together with computational complexity, model size, and inference time. Evaluation should also rely on a clearly defined held-out test set that is not used for model optimization. Building on this evidence, the present work investigates an explicit Coarse–Medium–Fine CNN in which parallel branches preserve global, intermediate, and localized visual information before feature fusion. This design provides a task-specific multi-scale representation for the four-class maize leaf disease classification problem.
3. Proposed DLM Methodology
In this section, the proposed Coarse–Medium–Fine deep learning model is presented together with the dataset, the training procedure, and the performance metrics used for its evaluation. Figure 1 illustrates the overall methodology proposed for maize leaf disease classification.
Figure 1.
Schematic overview of the proposed Coarse–Medium–Fine deep learning architecture. The model processes image information at coarse, medium, and fine levels, enabling progressive feature specialization across multiple levels of visual abstraction.
The proposed model is inspired by how the human visual system (HVS) processes spatial information. Rather than arising from a single serial pathway, coarse-to-fine visual processing in the HVS involves parallel spatial-frequency channels that operate simultaneously but exhibit different temporal dynamics [37,38]. Information associated with low spatial frequency, predominantly from the faster magnocellular pathway, can reach higher cortical areas earlier than information associated with high spatial frequency, which is more strongly associated with the parvocellular pathway. These complementary representations are subsequently integrated into a coherent percept [13,14,39,40].
The proposed Coarse–Medium–Fine (CMF) architecture uses three parallel convolutional branches to process the same input image at coarse, medium, and fine spatial scales, adopting an analogous organization. The outputs of these branches are integrated through a weighted fusion stage and passed to fully connected layers for classification. However, because a feed-forward CNN does not explicitly model temporal processing latency, the temporal precedence of coarse information observed in the HVS is not directly represented in the proposed architecture. Instead, the relative contribution of the three spatial-frequency representations is controlled through the fusion weights.
As shown in Figure 1, the fine CNN is located at the top, the medium CNN in the middle, and the coarse CNN at the bottom. The flattening layer, where the features extracted by the three branches are merged, is located at the center of the figure. The model performs classification into four categories: Blight, Common_Rust, Gray_Leaf_Spot, and Healthy.
The image dataset used for training employs data augmentation techniques to enhance the robustness of the proposed model. This dataset is described in the following subsections.
3.1. Datasets
The image dataset used in this study is the Corn or Maize Leaf Disease dataset [21], which contains 4188 JPG/PNG images. The images are grouped into four classes: northern leaf blight (Blight), common rust (Common_Rust), gray leaf spot Gray_Leaf_Spot), and healthy leaves (Healthy). All images have a resolution of pixels in RGB format. Additional details are provided in Table 1. Representative examples of each class are shown in Figure 2.
Table 1.
Main characteristics of the Corn or Maize Leaf Disease Dataset.
Figure 2.
Sample images from the Corn or Maize Leaf Disease dataset: (a) Blight, (b) Common rust, (c) Gray leaf spot, and (d) Healthy.
To ensure that each class was equally represented during the experiments, the number of samples was determined by the smallest class in the dataset (see Table 1). Since the Gray Leaf Spot class contained 574 images, 500 images were randomly selected from each class, resulting in a balanced dataset of 2000 original images ().
Data Augmentation Diversity
Adhering strictly to the no-data-leakage principle, the original 2000 images (500 per class) were divided into a training set (80%) and a testing set (20%). Thus, 1600 images were used for training, and 400 were used for testing. The training set was the only set to which data augmentation was applied.
The augmentation strategy was designed to increase variability within each disease class, not to create statistically independent observations. Seven transformations were selected to represent complementary sources of visual variability relevant to maize leaf images. These transformations include orientation (rotation and horizontal flipping), spatial position (horizontal and vertical translation), scale (zoom), illumination (brightness), and color balance (channel shifting). Ten independent random realizations were generated for each transformation of each original training image, resulting in 70 augmented realizations per image. Since some transformations involve continuous parameter ranges (e.g., rotation, translation, brightness, channel shift, and zoom), the repeated samples represent different points within the corresponding transformation spaces rather than simple copies of the original image. This strategy aligns with established data augmentation practices in image-based deep learning, where randomized transformations are employed to enhance training diversity and encourage invariance to irrelevant variations [41,42,43,44,45]. Therefore, the resulting 112,000 images should be interpreted as augmented training realizations derived from 1600 original images rather than as 112,000 independent observations.
The seven data augmentation techniques described below were applied (see Figure 3). For each of the seven techniques, the process was randomly applied to each image.
Figure 3.
An example of one of the seven types of data augmentation that comprise the training dataset.
For each original image, each of the seven augmentation techniques was applied ten times, yielding 70 augmented images per original image. Therefore, 112,000 augmented images were generated from the 1600 training images. The 400 test images have not changed.
The data augmentation techniques applied to the original images are described below.
- 1.
- Rotation_range = 45: Randomly rotates the image within the range of to .
- 2.
- Width_shift_range = 0.1: Randomly shifts the image horizontally by up to 10% of its width.
- 3.
- Height_shift_range = 0.1: Randomly shifts the image vertically by up to 10% of its height.
- 4.
- Brightness_range = (0.5, 1.5): Randomly adjusts image brightness by multiplying the pixel intensities by a factor ranging from 0.5 (50% brightness) to 1.5 (150% brightness).
- 5.
- Channel_shift_range = 40: Randomly shifts the RGB channel values by up to , producing variations in color balance without modifying the image geometry.
- 6.
- Zoom_range = 0.2: Applies a random zoom, scaling the image between 80% (zoom out) and 120% (zoom in).
- 7.
- Horizontal_flip = True: Randomly flips the image horizontally to generate a mirror image.
For augmentation techniques involving geometric transformations, the fill_mode parameter is set to wrap, which defines how empty pixels generated during the transformation are filled. Specifically, pixels shifted beyond one image boundary reappear on the opposite side.
3.2. Model Architecture
Image classification remains one of the fundamental challenges in computer vision, with applications spanning medical diagnosis, autonomous driving, industrial inspection, remote sensing, security surveillance, and large-scale image retrieval. Although deep learning has significantly advanced image classification performance, most conventional convolutional neural network architectures rely on a sequential processing strategy in which visual representations are progressively extracted through a fixed hierarchy of layers. While effective, this design may limit the network’s ability to simultaneously exploit visual information at different levels of abstraction, potentially reducing the contribution of features that are relevant at specific spatial scales.
To address this limitation, the proposed Coarse–Medium–Fine architecture adopts a three-branch CNN inspired by the hierarchical processing mechanism of the human visual system (see Figure 1). The architecture is designed to extract visual features simultaneously at three complementary levels of representation: coarse, medium, and fine. Rather than relying exclusively on a single sequential feature extraction pathway, the three branches learn complementary information that is subsequently combined to obtain a more discriminative representation for image classification.
The CMF architecture consists of three parallel convolutional branches that independently learn visual features at different levels of abstraction. The coarse branch captures global spatial organization and large structural patterns within the image. The medium branch focuses on intermediate structures and texture information, whereas the fine branch emphasizes localized details, including edges, contours, and subtle texture variations. The features extracted by the three branches are fused via element-wise addition and then converted into a vector through a flattening layer, generating a unified feature representation that is subsequently processed by fully connected layers to perform the final classification.
This multi-level representation enables the network to integrate complementary visual information extracted at different spatial scales. By combining global context with progressively finer image details, the proposed architecture generates a richer feature representation that supports the discrimination of visually similar classes while preserving relevant structural information throughout the classification process.
- Coarse Feature Extraction: The coarse branch captures the global spatial organization of the input image by identifying large-scale structures and the most prominent visual patterns. This representation provides a global contextual description that that provides global contextual information.
- Medium Feature Extraction: The medium branch extracts intermediate-level features that describe structural relationships, object shapes, and texture patterns. These features provide additional discriminative information.
- Fine Feature Extraction: The fine branch focuses on localized, high-frequency image information, capturing detailed visual characteristics such as edges, contours, texture variations, and subtle color changes. These fine-grained features contribute to the discrimination of visually similar classes during the final classification stage.
3.2.1. Feature Extraction
The feature extraction stage consists of three parallel convolutional neural networks organized according to the proposed Coarse–Medium–Fine framework, as introduced in [46,47]. The rationale of this architecture is to explicitly decompose visual feature extraction into three complementary levels of abstraction inspired by the hierarchical processing mechanism of the human visual system. Following the parallel spatial-frequency channels of the HVS, as described in Section 3, the proposed architecture comprises three parallel branches, denoted as CNN-Fine, CNN-Medium, and CNN-Coarse, each responsible for extracting features at a different level of abstraction. The architectural configuration of each branch is described below. All convolutional layers employ zero padding.
(a) CNN-Fine. The CNN-Fine branch consists of six two-dimensional convolutional layers that progressively transform the input RGB image into a compact and discriminative feature representation. The network receives RGB images of pixels as input, which are processed by an initial convolutional layer with 128 filters of size . The relatively large receptive field of this layer enables the extraction of broad spatial structures and global visual patterns that provide an initial description of the diseased leaf.
As feature extraction progresses, the network learns increasingly discriminative visual representations. The number of filters is reduced in the second convolutional layer to 64, allowing the model to capture a richer set of intermediate visual features, including texture patterns, structural characteristics, and local spatial relationships.
The subsequent convolutional layers progressively reduce the number of filters to 32, and 16, while simultaneously performing spatial down-sampling. This gradual reduction compresses the learned feature representation by preserving the most informative visual characteristics while discarding redundant information. The resulting balance between feature expansion and progressive compression improves the discriminative capability of the final feature representation.
Except for the first convolutional layer, all remaining layers employ convolutional kernel size, providing an appropriate trade-off between receptive field size and computational efficiency. Each convolutional block incorporates a Leaky-ReLU activation function with a negative slope coefficient of , which mitigates gradient degradation during training [48]. The activation maps are subsequently processed by a size of max-pooling operation, as illustrated on Figure 4 and the left side of Figure 5. Max pooling increases spatial invariance while preserving the most discriminative visual information, including boundaries, texture variations, and localized image abnormalities associated with maize diseases. Collectively, these operations generate a hierarchical feature representation that is subsequently used by the classification network.
Figure 4.
Architecture of the CNN-Fine branch. Inspired by the fine-detail processing stage of the human visual system, this branch captures localized, high-frequency visual information, including edges, contours, texture variations, and subtle color changes. These fine-grained features complement the multi-scale representation used for the final classification.
Figure 5.
Structure of the whole proposed deep learning model: On the top left is the extraction of “Fine” attributes, in the center are the “Medium” attributes, and on the right are the “Coarse” attributes. The bottom is the classification task.
(b) CNN-Medium. The CNN-Medium branch is designed to extract intermediate-level visual representations that bridge the gap between global structural information and fine local details. Unlike the CNN-Fine branch, which emphasizes highly localized features, the CNN-Medium branch focuses on capturing structural patterns, object shapes, and texture information at an intermediate spatial scale. This branch consists of four convolutional layers that progressively transform the input image into a compact intermediate-level feature representation.
The network receives RGB images of pixels as input. The first convolutional layer employs a kernel size with 128 filters to capture broad structural information and intermediate spatial relationships. As feature extraction progresses, the number of filters is progressively reduced from 64 to 32 and subsequently to 16, allowing the network to preserve the most discriminative features while reducing feature redundancy. From the second convolutional layer onward, all convolutions employ a kernel size to refine intermediate-level texture patterns and structural characteristics.
Each convolutional block incorporates a Leaky-ReLU activation function with a negative slope coefficient of [48], followed by a max-pooling operation. This combination improves gradient propagation during training while increasing spatial invariance by preserving the most informative activations. As detailed in Table 2, the first three convolutional layers employ a stride of 1, whereas the fourth layer utilizes a stride of 2 to progressively reduce the spatial dimensions of the feature maps. This configuration ensures that the feature maps generated by the CNN-Medium branch are spatially compatible with those produced by the CNN-Fine branch, facilitating their subsequent feature fusion (see Figure 6 and the center of Figure 5).
Table 2.
Architectural configuration of the proposed CNN-Fine, CNN-Medium, and CNN-Coarse feature-extraction branches.
Figure 6.
Architecture of the CNN-Medium branch. This branch extracts intermediate-level visual features, including structural patterns, object shapes, and texture information, providing a complementary representation that bridges global contextual information and fine-grained local details.
(c) CNN-Coarse. The CNN-Coarse branch is designed to capture the global spatial organization of the input image by extracting large-scale structural features. Unlike the CNN-Fine branch, which focuses on localized visual details, the CNN-Coarse branch emphasizes broad contextual information and dominant structural patterns that provide a global representation of the maize leaf. This branch consists of three two-dimensional convolutional layers. The first convolutional layer processes the original RGB image using 128 filters of size , providing a sufficiently large receptive field to capture broad spatial structures and global visual patterns. The remaining two convolutional layers use 32 and 16 filters, respectively, with a kernel size of .
Each convolutional block incorporates a Leaky-ReLU activation function with a negative slope coefficient of , followed by a max-pooling operation size. In addition, all convolutional layers employ a stride of to progressively reduce the spatial dimensions of the feature maps. This configuration ensures that the output feature maps are spatially compatible with those generated by the CNN-Medium and CNN-Fine branches, facilitating their subsequent feature fusion.
The three branches operate in parallel, each extracting complementary visual information at a different level of abstraction. The CNN-Coarse branch provides global contextual information that complements the intermediate structural representations extracted by the CNN-Medium branch and the fine-grained visual features captured by the CNN-Fine branch. The resulting feature maps are subsequently fused to construct the final multi-scale representation (see Figure 7 and the right side of Figure 5).
Figure 7.
Architecture of the CNN-Coarse branch. This branch extracts global contextual information by capturing large-scale structural patterns and the overall spatial organization of the input image, providing complementary features for the multi-scale representation used during feature fusion.
The outputs generated by the CNN-Coarse, CNN-Medium, and CNN-Fine branches are integrated through a weighted feature-fusion strategy to construct a unified multi-scale representation. This representation combines complementary visual information extracted at three different levels of abstraction, including global contextual information, intermediate structural patterns, and fine-grained local features. Consequently, the resulting feature vector provides a comprehensive visual description of the input image for the subsequent classification stage.
This fusion strategy is inspired by the hierarchical processing mechanism of the human visual system, in which global contextual information and localized visual details are integrated to form a coherent visual representation [46,47]. Within the proposed architecture, the CNN-Fine branch emphasizes fine-grained visual features and therefore receives the largest contribution during feature fusion. The CNN-Medium branch contributes intermediate-scale structural information, whereas the CNN-Coarse branch provides global contextual information that complements the representations extracted by the other two branches. Accordingly, following the perceptual principles reported in [13,14], the fusion process assigns weights of 0.5, 0.3, and 0.2 to the Fine, Medium, and Coarse branches, respectively (see Figure 8). The weighted feature maps are subsequently fused via element-wise addition and flattened to produce a 1024-dimensional feature vector (16 filters × 8 × 8 matrix size), which serves as the input to the classification network (see Figure 5 on flattening layer).
Figure 8.
Weighted feature-fusion strategy. The feature maps generated by the CNN-Fine, CNN-Medium, and CNN-Coarse branches are weighted according to their relative contributions and then combined via element-wise addition to construct the final multi-scale feature representation used by the classification network. All branches receive RGB images of size as input.
The resulting multi-scale representation integrates complementary visual information across different spatial scales, providing a discriminative feature representation for image classification. The detailed architectural configuration of the CNN-Fine, CNN-Medium, and CNN-Coarse branches is presented in Table 2. The spatial-scale representations of the three branches are not determined by the kernel size of an individual convolutional layer. Rather, they are determined by the cumulative effect of network depth, convolutional stride, and pooling operations. All three branches start with the same input and an initial convolutional layer with 128 of filters, a stride of 1, and same padding. This is followed by max pooling, which reduces the spatial resolution from to . While all three branches ultimately produce feature maps, they achieve this resolution via different downsampling schedules and network depths (see Table 2 and Table 3).
Table 3.
Spatial-resolution reduction of the Coarse, Medium, and Fine branches. The resolution after each convolutional layer (including stride and max-pooling) and the downsampling factor per layer are reported for a input image; all branches produce output feature maps.
- The Coarse branch combines a stride-2 convolution with max-pooling in its second and third layers. Each of these layers therefore reduces the resolution by a factor of four ( px), so the branch reaches the final map in only three layers, using few filters (32 and 16). Fine spatial detail is rapidly discarded, and the branch retains mainly the global organization of the leaf.
- Medium branch reduces the resolution by a factor of two per layer through max-pooling ( px) and applies stride 2 together with pooling only in its fourth layer ( px).
- Fine branch uses stride 1 in all six layers and reduces the resolution only by a factor of two per layer through max-pooling ( px), with no pooling in its fifth layer. It therefore processes the image at higher resolution for more layers, applying at least one convolution at every resolution level before reaching .
The classification stage is shown in Table 4 and at the end of Figure 5. As shown in Table 4, classification is carried out by nine layers of fully connected neurons that progressively reduce the number of neurons. Layer 1 has 1024 input neurons, which are reduced to 512. Layer 2 has 512 neurons using Batch Normalization and a dropout rate of 0.45. This process continues with subsequent layers. The final output layer reduces the number of neurons from 16 to 4 (corresponding to the four types of corn leaf disease), and a “softmax” activation function is used without normalization or dropout.
Table 4.
Architectural configuration of the fully connected classification network.
3.2.2. General Loss Function
The general loss function comprises the feature extraction and classification stages, representing the complete deep learning model. The overall optimization objective is defined as Equation (1), where the optimization jointly updates the parameters associated with feature extraction and the classification stage through a unified end-to-end objective.
where
- denotes the loss function associated with the feature extraction stage.
- denotes the loss function associated with the classification stage.
- denotes the parameter set of the CNN-Fine branch.
- denotes the parameter set of the CNN-Medium branch.
- denotes the parameter set of the CNN-Coarse branch.
Since the proposed deep learning model consists of feature extraction and classification stages, the optimization process is formulated in terms of their corresponding parameter sets. The feature extraction stage comprises three parallel branches, namely CNN-Fine (), CNN-Medium (), and CNN-Coarse (), whereas the classification stage is parameterized by . Consequently, the optimization process is performed for a four-class disease classification problem ().
The general loss function can be expressed in terms of entropy, as defined in Equation (2).
where
- denotes the disease class, where “Blight”, “Common rust”, “Gray leaf spot”, and “Healthy”}.
- denotes the conditional probability of disease class given the parameter set of the CNN-Fine, CNN-Medium, CNN-Coarse, and classification stage.
The optimization of Equation (2) is performed using gradient-based optimization. Assuming a mini-batch X of size , the corresponding gradient is expressed by Equation (3).
During backpropagation, the gradient defined in Equation (3) is used to update all trainable parameters by minimizing the overall loss function defined in Equation (2). The optimization process jointly updates the parameters associated with the three feature-extraction branches and the classification network, namely .
3.3. Training and Validation Protocol
Experiments were conducted on a workstation equipped with a 12th-generation Intel Core i9 processor, 128 GB RAM, 2 TB SSD/HDD storage, and an NVIDIA GeForce RTX 3090 GPU with 24 GB GDDR6X memory. Ubuntu 22.04 LTS was used as the operating system, and the software environment was implemented in Python 3.9 using TensorFlow/Keras 2.13 together with Scikit-learn 1.9.1, NumPy 2.5.3, and Matplotlib 3.11.2.
The experimental protocol consisted of four stages: (1) dataset balancing, (2) data augmentation, (3) training the model using the proposed optimization strategy, and (4) evaluating performance through repeated random subsampling validation under an independent blind test.
The feature extraction and classification stages were trained using the categorical cross-entropy loss function and the Adam optimizer with the following hyperparameters: learning rate (), , , and . The optimization process employed a batch size of 15, 200 training epochs, and the evaluation metrics “loss” and “accuracy”. Since the dataset was relatively small, the Adam optimizer was selected because of its fast convergence. The learning rate was selected empirically after preliminary experiments, providing stable convergence and consistent optimization performance throughout training.
The proposed deep learning model was trained for 200 epochs using a batch size of 15. Following the data augmentation procedure described in Section Data Augmentation Diversity, the resulting training dataset contained 112,000 (80%) images for training. The remaining 20% of images, amounting to 400 in total, are set aside for testing.
After training the model, a repeated balanced random test-subset evaluation test was performed. The same five randomly selected test subsets were used to evaluate the Coarse, Medium, Fine, and Complete CMF models. Each subset contained 300 test images, with 75 images per class. Thus, all four models were evaluated on identical test samples under the same repeated random subsampling protocol. No test image was used for training or data augmentation. The reported metrics are: accuracy, precision, recall (sensitivity), and F1-score; an a global confusion matrix.
The evaluation procedure used in this study differs from classical repeated random subsampling validation and Monte Carlo cross-validation. After the initial train–test split, the 400-image test partition was fixed, and five balanced subsets of 300 images were sampled from it. The models were not retrained between repetitions. Thus, the repeated evaluations quantify the variation associated with the balanced random subsampling of the fixed test partition rather than the variation across independent train–test partitions or repeated model training.
3.4. Performance Evaluation Metrics
To comprehensively evaluate the proposed model, four standard performance metrics were considered: accuracy, precision, recall (sensitivity), and F1-score. These metrics were computed from the confusion matrix, which summarizes the agreement between predicted and ground-truth class labels. While accuracy provides an overall measure of classification performance, precision, recall, and F1-score provide complementary information regarding the reliability and completeness of the classifier, resulting in a comprehensive assessment of its performance across the four maize disease categories. Unless otherwise stated, all reported evaluation metrics were computed using the independent blind test.
The following notation is adopted for the definition of the evaluation metrics: , , , and denote the numbers of true positives, true negatives, false positives, and false negatives, respectively.
- Accuracy. Accuracy measures the overall proportion of correctly classified samples among all evaluated instances, as defined in Equation (4). Although widely used, accuracy alone may not adequately reflect classification performance when class distributions are imbalanced.
- Precision. Precision quantifies the proportion of correctly classified positive samples among all samples predicted as positive, thereby measuring the reliability of positive predictions, as defined in Equation (5).
- Recall. Recall (or sensitivity) measures the proportion of actual positive samples correctly identified by the classifier, thereby quantifying its ability to detect instances belonging to a given class, as defined in Equation (6).
- F1-score. The F1-score combines precision and recall into a single performance measure by computing their harmonic mean, providing a balanced evaluation when both false positives and false negatives are important. It is computed as defined in Equation (7).
4. Results
This section presents the experimental results obtained with the individual Coarse, Medium, and Fine branches and with the complete Coarse–Medium–Fine (CMF) model. The branch-level experiments were conducted to assess the discriminative contribution of each spatial scale independently of the feature-fusion stage. All branch models and the complete CMF model were trained and evaluated using the same data partitioning procedure, preprocessing pipeline, and evaluation protocol described in Section 3.
4.1. Layer-by-Layer Activation Analysis and Grad-Cam Analysis
Figure 9 shows representative activation maps for the Fine, Medium, and Coarse branches using a Corn Gray Spot input image. The color intensity of the activation maps visually indicates the response produced by the learned filters: lighter and brighter regions correspond to higher activation responses, and darker regions correspond to lower activation responses. Thus, the activation patterns that change progressively illustrate how the three branches transform the input image and respond selectively to visual information at different spatial scales. The coarse branch consists of three convolutional layers with 128, 32, and 16 filters, respectively. Its spatial resolution decreases from to and finally to , with downsampling factors of , , and . This rapid reduction in spatial resolution produces increasingly compact activation maps, in which stronger responses represent broad, persistent spatial patterns. This is consistent with the objective of the Coarse branch, which is to capture global leaf organization and large-scale structural information.
Figure 9.
Layer-by-layer activation maps for the (a) Coarse, (b) Medium, and (c) Fine branches using a Corn Gray Leaf Spot input image.
The medium branch contains four convolutional layers with 128, 64, 32, and 16 filters. This reduces the spatial resolution from to , , and finally . The activation maps of the Medium branch retain an intermediate level of spatial detail. Brighter regions indicate stronger responses to structural relationships, object shapes, and texture patterns at an intermediate scale.
The fine branch contains six convolutional layers with 128, 128, 64, 64, 32, and 16 filters, respectively. It performs a gradual spatial reduction from to , , and . It remains at in the fifth layer and reaches only in the final layer. This greater preservation of spatial resolution enables the activation maps to retain more localized patterns. Higher-intensity regions reflect stronger responses to local structures, such as edges, contours, texture variations, and subtle visual changes. While only eight representative activation maps (F1-F8) are shown for each layer, each complete layer contains the number of filters specified in Table 2. Importantly, all three branches ultimately generate an feature representation, making their outputs spatially compatible for subsequent weighted fusion. The activation maps visually represent the progressive specialization of the three branches: broader, more spatially compressed responses in the Coarse branch; more localized, spatially detailed responses in the Fine branch; and an intermediate representation in the Medium branch.
Gradient-Based Branch Importance Analysis
Figure 10 shows a Grad-CAM analysis of the three CMF branches using the same input image of a maize leaf, along with their normalized relative importance. The color scale ranges from blue, indicating low importance, to red, indicating high importance, with green and yellow in between. The Fine branch exhibits the most spatially distributed high-importance responses, with several yellow-to-red regions concentrated around localized structures and lesion-like patterns across the leaf surface. Its normalized relative importance is 0.62, the largest contribution among the three branches in this analysis. This behavior is consistent with the intended role of the Fine branch, which is to extract localized visual information, including edges, contours, texture variations, and subtle color changes. The Medium branch shows intermediate yellow-to-red responses concentrated in broader regions of the leaf while retaining localized areas of higher activation, with a normalized importance of 0.26. These responses align with the branch’s intended role of representing intermediate-scale structural relationships, object shapes, and texture patterns. The coarse branch presents a more spatially concentrated region of high importance, with a prominent red-to-yellow area in the central portion of the leaf, and a normalized importance of 0.12. This pattern is consistent with its role in capturing global spatial organization and large-scale structural patterns. Overall, the gradient-based analysis indicates that the Fine branch contributes the largest relative gradient-based importance for the example shown, followed by the Medium and Coarse branches. This ordering is consistent with the predefined feature fusion weights of 0.5, 0.3, and 0.2 assigned to the fine, medium, and coarse branches, respectively. However, the Grad-CAM importance values should be interpreted as an analysis of the input image rather than as a direct replacement for the model’s fusion weights.
Figure 10.
Gradient-based analysis of branch importance using Grad-CAM.
4.2. Ablation Analysis
Performance of Individual Feature-Extraction Branches
To assess the contribution of each spatial representation under a common evaluation protocol, the coarse, medium, and fine branches were trained independently and evaluated using the same random subsampling procedure as the complete CMF model. Specifically, five subsets of 300 images were selected from the held-out 400-image test partition. Each subset contained 75 images per class and was used for all four models. This procedure ensures that the branch-level and fused-model results are based on identical test samples and sampling conditions.
Figure 11 shows the training accuracy and loss curves for the three individual branches, illustrating their convergence behavior during optimization. The corresponding confusion matrices are presented in Figure 12, while the class-specific and overall quantitative results are summarized in Table 5.
Figure 11.
Training curves for the individual feature-extraction branches: (a) Coarse branch, (b) Medium branch, and (c) Fine branch. Each panel shows the evolution of training accuracy and categorical cross-entropy loss during optimization.
Figure 12.
Confusion matrices obtained for the individual feature-extraction branches: (a) Coarse, (b) Medium, and (c) Fine. The matrices summarize the class-wise predictions for Blight, Common Rust, Gray Leaf Spot, and Healthy leaves.
Table 5.
Classification performance of the individual branches and the complete CMF model under the same repeated balanced random test-subset evaluation. Values are reported as mean ± standard deviation over five repetitions using balanced subsets of 300 images (75 images per class) randomly sampled from the fixed held-out 400-image test partition.
The Coarse branch achieved an overall accuracy of , indicating that global visual information provided discriminative information for the four-class classification task. The Medium branch obtained accuracy, reflecting the contribution of intermediate-scale structural and texture patterns. The Fine branch achieved accuracy, indicating that fine-scale visual information also contributed to disease discrimination. The corresponding precision, recall, and F1-score values are reported in Table 5. The complete CMF model is highly accurate, with a score of .
Although each branch was capable of learning discriminative representations when evaluated independently, the corresponding confusion matrices show that certain class pairs remained more difficult to separate when only a single spatial scale was available. These results support the integration of complementary coarse, medium, and fine representations in the complete CMF model.
It should be noted that because the spatial scale of each branch is determined by its depth, stride, and pooling schedule (see Table 2 and Table 3), the branches also differ in the number of layers, parameters, and computational cost. Therefore, the accuracy differences reported in Table 5 cannot separate the contribution of scale-specific representations from that of network capacity. For this reason, the branch-level results are supplemented by layer-by-layer activation maps (see Figure 9) and Grad-CAM analysis (see Figure 10), which demonstrate that the three branches encode the same input image differently, focusing on distinct leaf regions while producing identical-size feature maps () processed by the same classification network. These analyses provide qualitative evidence of scale-specific, non-redundant representations. A capacity-matched ablation study, in which all branches have comparable parameters and operations, will be addressed in future work.
4.3. Performance of the Complete Coarse–Medium–Fine Model
The complete CMF model combines the feature maps generated by the Coarse, Medium, and Fine branches through the weighted feature-fusion strategy described in Section 3. This configuration integrates global context, intermediate structural information, and localized visual patterns into a unified multi-scale representation for four-class maize leaf disease classification.
Under the repeated random sub-sampling evaluation protocol described in Section 3, the complete model achieved an overall accuracy of . The macro-averaged precision, recall, and F1-score were , , and , respectively, indicating consistently high predictive performance across the four classes. Table 6 reports the class-specific metrics. Blight and Healthy achieved recall values of , whereas Gray Leaf Spot and Common Rust obtained recall values of and , respectively.
Table 6.
Class-specific classification results for the complete Coarse–Medium–Fine model under the repeated random sub-sampling evaluation protocol.
Figure 13 presents the training curves of the complete CMF model. The training accuracy increased progressively during optimization, while the categorical cross-entropy loss showed a corresponding decreasing trend. The confusion matrix in Figure 14 shows that most predictions were concentrated along the main diagonal. The remaining errors involved Common Rust samples misclassified as Healthy and Gray Leaf Spot samples misclassified as Blight.
Figure 13.
Training learning curves of the proposed Coarse–Medium–Fine model, showing the evolution of (a) classification accuracy and (b) categorical cross-entropy loss during optimization.
Figure 14.
Confusion matrix of the complete Coarse–Medium–Fine model under the repeated random sub-sampling evaluation protocol.
Compared with the individual branch models, the fused CMF model achieved the highest overall classification performance. This result supports the use of complementary coarse, medium, and fine spatial representations for discriminating visually similar maize disease classes.
4.4. Computational Complexity of the Proposed CMF Model
Table 7 compares the proposed Coarse–Medium–Fine model with representative baseline architectures based on the number of parameters, computational complexity, model size, and classification accuracy. The baseline architectures correspond to their original configurations with a input. In contrast, the CMF model and its individual branches were evaluated using a input.
Table 7.
Computational complexity and accuracy of the proposed CMF model compared with representative baseline architectures. Parameters, operations (GMACs), and model size (FP32) of the baselines correspond to their original configurations at a input; values for CMF correspond to a input.
The CMF model achieves 99.25% accuracy with only 1.93 million parameters, requiring 15.36 GMACs and occupying just 7.7 MB of memory, as shown in Table 7. These results demonstrate that the CMF architecture combines a relatively compact parameter count with high classification performance.
Table 7 also reports the contribution of the individual CMF branches. The Fine branch contains 0.80 million parameters, requires 8.90 GMACs, and achieves 95.00% accuracy. The Medium branch uses 0.29 million parameters, 4.80 GMACs, and achieves 89.75% accuracy. The Coarse branch uses 0.13 million parameters, requires 1.66 GMACs, and achieves 88.00% accuracy. Thus, the three branches exhibit different levels of computational complexity and classification performance. Their integration into the complete CMF architecture results in 99.25% accuracy.
The CMF model has substantially fewer parameters than the baseline architectures ResNet50 and VGG16, with 1.93 million parameters compared to 23.85 million and 14.78 million, respectively. The CMF model also achieves a higher reported accuracy of 99.25%, compared to 72.00% for ResNet50 and 95.00% for VGG16. The CMF model is also considerably smaller at 7.7 MB compared to 90.98 MB for ResNet50 and 56.38 MB for VGG16. These comparisons are summarized in Table 7.
In terms of computational complexity, the CMF model requires 15.36 gigamultiplications per second (GMACs), which is comparable to the 15.5 GMACs reported for VGG16. However, the CMF model achieves this computational cost with only 1.93 million parameters, whereas the VGG16 model requires 14.78 million. EfficientNet-B0 requires substantially fewer operations (0.39 GMACs), yet it contains 5.3 million parameters and reports an accuracy of 94.00%. The results in Table 7 therefore highlight the computational and parameter characteristics of CMF relative to the selected baselines.
Importantly, the proposed CMF model boasts a classification accuracy of 99.25%, a model size of 7.7 MB, and just 1.93 million parameters. The model requires 15.36 GMACs per inference, which demonstrates its compact architecture and high classification performance.
4.5. Discussion of the Experimental Results
The experimental results support the effectiveness of the proposed Coarse–Medium–Fine (CMF) architecture for combining visual information extracted at different spatial scales. When evaluated independently, the Coarse, Medium, and Fine branches achieved accuracies of , , and , respectively. These results indicate that each branch learned discriminative representations for the four-class maize leaf disease classification task; however, no individual spatial representation matched the performance of the fused model.
Among the individual branches, the Fine branch achieved the highest accuracy, precision, recall, and F1-score. This result is consistent with the potential importance of localized visual patterns, including lesion boundaries, localized symptom regions, and fine-grained texture variations, for discriminating among the evaluated disease classes. In contrast, the Coarse and Medium branches obtained lower but comparable performance. Their results suggest that global leaf appearance, broader lesion distribution, and intermediate-scale texture patterns also contain useful discriminative information, although these representations alone were insufficient to resolve all visually similar samples.
The complete CMF model achieved accuracy, with macro-averaged precision, recall, and F1-score values of , , and , respectively. This represents an improvement of 11.3 percentage points, 9.40 percentage points, and 4.15 percentage points over the Coarse, Medium, and Fine branches, respectively. Thus, the improvement cannot be attributed solely to the fine-scale branch. Instead, the result supports the interpretation that the weighted fusion of global, intermediate, and localized representations contributed complementary information to the final classification.
The confusion matrix of the complete model further supports this interpretation. Blight and Healthy achieved recall values of 100.00%, while Gray Leaf Spot and Common Rust achieved recall values of 99.00% and 98.00%, respectively. The remaining errors occurred between Common Rust and Healthy, and between Gray Leaf Spot and Blight. These misclassifications may be related to factors such as early disease symptoms, low-contrast lesions, partial leaf views, and within-class variability, which can reduce the visual distinction between categories. Nevertheless, the low number of misclassifications indicates that the fused representation provided strong discrimination for the evaluated test samples.
The learning curves showed increasing training accuracy and decreasing categorical cross-entropy loss, indicating stable optimization under the selected training configuration. However, the high performance obtained in this study should be interpreted within the scope of the evaluated dataset and protocol. The experiments used a balanced four-class subset of the Corn or Maize Leaf Disease Dataset; consequently, the reported results do not by themselves establish robustness to field conditions, unseen geographic regions, different cultivars, severe illumination changes, or additional disease categories. Future work should evaluate the model on strictly image-disjoint external test sets acquired under diverse field conditions and should compare computational cost, parameter count, and inference latency with lightweight CNN and CNN–Transformer baselines.
Overall, the results support the proposed CMF design as an effective multi-scale CNN for the evaluated four-class maize leaf disease classification task. The branch-level analysis indicates that the three spatial representations provide complementary discriminative information, while the performance of the fused model indicates that their integration can provide a more discriminative representation than using coarse, medium, or fine features independently.
4.6. Comparison with Competitive Methods
Table 8 compares the proposed Coarse–Medium–Fine (CMF) model with previously published methods evaluated on the Corn or Maize Leaf Disease Dataset [21]. The original dataset contains 4188 RGB images distributed across four classes: Blight, Common Rust, Gray Leaf Spot, and Healthy. Only studies that explicitly reported using this dataset were included in the comparison.
The proposed CMF model achieved an accuracy of 99.25%, with macro-averaged precision, recall, and F1-score values of 99.25%. Within the present experimental setting, the complete CMF model achieved higher classification accuracy than its individual Coarse, Medium, and Fine branches, which achieved 88.00%, 89.75%, and 95.00% accuracy, respectively. The 4.25-percentage-point improvement over the Fine branch supports the contribution of the multi-scale feature-fusion strategy beyond the Fine branch alone.
Among the previously published studies, Askale et al. [22] trained VGG16, AlexNet, and ResNet50 using the 4188-image dataset and a 75:15:10 training–validation–testing partition. They reported testing accuracies of 95.00%, 91.00%, and 72.00%, respectively. Tariq et al. [23] used the four-class, 4188-image dataset with a 70:30 training–testing split and reported a testing accuracy of 94.67% and an overall precision of 92.91% for a VGG16-based classifier with Layer-wise Relevance Propagation (LRP). Pamungkas et al. [51] explicitly used the Corn or Maize Leaf Disease Dataset and reported accuracies of 94.00% for EfficientNet-B0 and 93.00% for ResNet-50 using a 70:30 training–validation partition.
Parashar et al. [49] proposed MaizeNet, a residual network with channel–spatial squeeze-and-excitation attention, which was trained from scratch on the same four-class, 4188-image dataset. With approximately 2.1 million parameters and a capacity comparable to the CMF model, MaizeNet achieved an accuracy of 95.95% and a macro-averaged F1 score of 95.09% using an 80:20 partition and five-fold cross-validation. Since MaizeNet shares the dataset, class structure, absence of ImageNet pre-training, and similar model size with the present study, it provides the closest available reference for the proposed method.
The reported CMF accuracy is higher than the accuracy values reported by the selected studies. However, this observation should be interpreted carefully, because the experiments were not conducted under an identical protocol. Differences in image selection, data partitioning, preprocessing, augmentation, model initialization, optimization settings, and evaluation procedures may affect the reported results. In particular, the selected studies used different data partitions and evaluation sets, including testing and validation sets. Therefore, Table 8 provides contextual evidence of the performance of the proposed method relative to previous studies using the same public dataset, but it does not constitute a controlled comparison of the underlying architectures.
Table 8.
Comparison with published methods evaluated using the Corn or Maize Leaf Disease Dataset. Reported values were taken from the corresponding studies. Differences in data partitioning, preprocessing, augmentation, and evaluation procedures prevent a strict head-to-head comparison.
5. Conclusions and Future Work
This study presented a Coarse–Medium–Fine convolutional neural network for classifying maize leaf images into four categories: blight, common rust, gray leaf spot, and healthy. The proposed architecture was inspired by coarse-to-fine visual processing and was designed to learn complementary visual representations at three spatial scales. The coarse branch was designed to capture global leaf structure and broad lesion distribution; the medium branch was designed to model intermediate texture and structural patterns; and the fine branch was designed to emphasize localized, disease-related details. The feature maps from each branch were integrated through weighted fusion, with weights of 0.2, 0.3, and 0.5 assigned to the coarse, medium, and fine branches, respectively.
Experimental results showed that each branch provided useful discriminative information for recognizing maize leaf diseases. The Coarse, Medium, and Fine branches achieved accuracies of , , and , respectively. The Fine branch produced the strongest performance among the individual branches, indicating that localized lesions, texture variations, lesion boundaries, and subtle color differences were particularly informative for distinguishing the evaluated disease classes. However, the performance of the individual branches was surpassed by the complete CMF architecture, demonstrating that disease-related information is not fully represented at a single spatial scale.
Under the repeated random subsampling evaluation procedure applied to the held-out test partition, the complete CMF model achieved an overall accuracy of , as well as macro-averaged precision, recall, and F1-score values of , , and , respectively. Compared to the strongest individual model, the Fine branch, the fused CMF architecture improved accuracy by 4.15 percentage points. This result supports the central premise of the study: integrating global contextual information, intermediate structural patterns, and fine-grained local details produces a more discriminative representation than using any individual spatial representation alone.
The class-wise analysis further demonstrated strong and balanced performance across the four disease categories. Blight and Healthy achieved recall values of , while Gray Leaf Spot and Common Rust achieved recall values of and , respectively. The remaining classification errors occurred between common rust and healthy samples and between gray leaf spot and blight samples. These misclassifications may reflect visual overlap between disease classes, including differences in lesion appearance, contrast, spatial extent, and within-class variability. Nevertheless, the low number of errors indicates that the multi-scale fused representation effectively separated the four maize leaf categories under the experimental conditions evaluated in this study.
The proposed CMF model provides an explicit, multi-scale learning framework for image-based maize leaf disease classification. Unlike architectures that rely on a single, sequential feature-extraction pathway, the proposed method preserves complementary feature representations before integrating them into a unified classification descriptor. Branch-level analysis indicates that the complete model’s improved performance is associated with feature complementarity across spatial scales rather than with the fine branch alone.
Future work will focus on deploying the proposed CMF model on embedded edge-computing platforms, such as Raspberry Pi- and NVIDIA Jetson-class devices, to assess its practical feasibility for real-time maize leaf disease recognition. This evaluation will measure inference latency, memory consumption, computational requirements, and predictive performance using live image acquisition under operational conditions.
Author Contributions
Conceptualization, C.A.-C. and J.F.S.-T.; methodology, C.S.-G., C.A.-C. and J.F.S.-T.; formal analysis, C.S.-G. and C.A.-C.; investigation, C.A.-C., L.C.R.-G., H.A.D.-M. and J.A.L.-C.; writing—original draft, C.A.-C., M.A.-S.; writing—review & editing, C.A.-C. All authors have read and agreed to the published version of the manuscript.
Funding
This research received no external funding.
Institutional Review Board Statement
Not applicable.
Informed Consent Statement
Not applicable.
Data Availability Statement
The data presented in this study are available on request from the corresponding author.
Acknowledgments
The authors used DeepL Write Pro V2 (DeepL SE, Cologne, Germany) solely to improve the English language, grammar, and scientific-technical style of the manuscript. The tool was not used to generate scientific ideas, research hypotheses, experimental designs, data analyses, results, interpretations, or conclusions. All scientific content, including the study design, methodology, analyses, and final manuscript, was developed, critically reviewed, and approved by the authors, who assume full responsibility for the accuracy, originality, and integrity of the published work.
Conflicts of Interest
The authors declare no conflicts of interest.
References
- Upadhyay, A.; Kumar, N.; Jain, R.; Singh, V.; Singh, A. Deep learning and computer vision in plant disease detection: A comprehensive review. Artif. Intell. Rev. 2025, 58, 92. [Google Scholar] [CrossRef] [Scilit]
- Panchal, A.; Shah, P.; Patel, D. Image-based plant diseases detection using deep learning. Mater. Today Proc. 2023, 80, 3500–3506. [Google Scholar] [CrossRef] [Scilit]
- Zhou, H.; Su, Y.; Chen, J.; Li, J.; Ma, L.; Liu, X.; Lu, S.; Wu, Q. Maize leaf disease recognition based on improved convolutional neural network shufflenetv2. Plants 2024, 13, 1621. [Google Scholar] [CrossRef] [Scilit]
- El Sakka, M.; Ivanovici, M.; Chaari, L.; Mothe, J. A review of cnn applications in smart agriculture using multimodal data. Sensors 2025, 25, 472. [Google Scholar] [CrossRef] [Scilit]
- Wang, S.; Xu, D.; Liang, H.; Bai, Y.; Li, X.; Zhou, J.; Su, C.; Wei, W. Advances in deep learning applications for plant disease and pest detection: A review. Remote Sens. 2025, 17, 698. [Google Scholar] [CrossRef] [Scilit]
- Kumar, B.; Ninoria, S.; Vishnoi, V. Maize disease detection through cnn using leaf images: A review. In Advances in Science, Engineering and Technology; CRC Press: Boca Raton, FL, USA, 2025; pp. 214–218. [Google Scholar]
- Rachmad, A. Convolutional neural network-based classification model of corn leaf disease. Math. Model. Eng. Probl. 2023, 10, 530–536. [Google Scholar] [CrossRef] [Scilit]
- Mohanappriya, K.; Vennila, C.; Joshua, R.; Kumar, A. Comparative evaluation of cnn models for precision agriculture in deep learning-based weed detection. J. Neonatal Surg. 2025, 14, 354–360. [Google Scholar]
- Tan, M.; Le, Q.V. EfficientNet: Rethinking Model Scaling for Convolutional Neural Networks. In Proceedings of the 36th International Conference on Machine Learning, Long Beach, CA, USA, 9–15 June 2019; Proceedings of Machine Learning Research (PMLR): Brookline, MA, USA, 2019; Volume 97, pp. 6105–6114. [Google Scholar]
- Chilamkurthy, S. Transfer Learning for Computer Vision Tutorial. Available online: https://docs.pytorch.org/tutorials/beginner/transfer_learning_tutorial.html (accessed on 17 August 2025).
- Petru, P. What Is Transfer Learning? 2025. Available online: https://blog.roboflow.com/what-is-transfer-learning/ (accessed on 17 August 2025).
- Iman, M. Expanse: A Deep Continual/Progressive Learning System for Deep Transfer Learning. Ph.D. Thesis, University of Georgia, Athens, GA, USA, 2022. [Google Scholar]
- Schyns, P.; Oliva, A. From blobs to boundary edges: Evidence for time- and spatial-scale-dependent scene recognition. Psychol. Sci. 1994, 5, 195–200. [Google Scholar] [CrossRef] [Scilit]
- Palmer, S. Vision Science: Photons to Phenomenology; MIT Press: Cambridge, MA, USA, 1999. [Google Scholar]
- George, R.; Thuseethan, S.; Ragel, R.; Mahendrakumaran, K.; Nimishan, S.; Wimalasooriya, C.; Alazab, M. Past, present and future of deep plant leaf disease recognition: A survey. Comput. Electron. Agric. 2025, 234, 110128. [Google Scholar] [CrossRef] [Scilit]
- Albahli, S.; Masood, M. Efficient Attention-Based CNN Network (EANet) for Multi-Class Maize Crop Disease Classification. Front. Plant Sci. 2022, 13, 1003152. [Google Scholar] [CrossRef] [Scilit]
- Li, E.; Wang, L.; Xie, Q.; Gao, R.; Su, Z.; Li, Y. A Novel Deep Learning Method for Maize Disease Identification Based on Small Sample-Size and Complex Background Datasets. Ecol. Inform. 2023, 75, 102011. [Google Scholar] [CrossRef] [Scilit]
- Subedi, S.; Burlakoti, S.; Adhikaree, P.; Acharya, N. Evaluation of resnet50 and efficientnetb0 models for maize leaf disease detection. J. Sci. Eng. 2025, 2, 64–68. [Google Scholar]
- Sandler, M.; Howard, A.; Zhu, M.; Zhmoginov, A.; Chen, L.C. MobileNetV2: Inverted Residuals and Linear Bottlenecks. In Proceedings of the IEEE/CVF Conference on Computer Vision and Pattern Recognition, Salt Lake City, UT, USA, 18–23 June 2018; pp. 4510–4520. [Google Scholar] [CrossRef] [Scilit]
- Mitro, S.; Ahamed, A.S.; Nakib, A.M. Comparative Study of Lightweight CNN Architectures for Maize Leaf Disease Detection. Eur. J. Appl. Sci. Eng. Technol. 2025, 3, 4–13. [Google Scholar] [CrossRef] [Scilit]
- Ghose, S. Corn or Maize Leaf Disease Dataset. 2020. Available online: https://www.kaggle.com/datasets/smaranjitghose/corn-or-maize-leaf-disease-dataset (accessed on 10 January 2026).
- Askale, G.T.; Yibel, A.B.; Taye, B.M.; Wubneh, G.D. Mobile Based Deep CNN Model for Maize Leaf Disease Detection and Classification. Plant Methods 2025, 21, 72. [Google Scholar] [CrossRef] [Scilit]
- Tariq, M.; Ali, U.; Abbas, S.; Hassan, S.; Naqvi, R.A.; Khan, M.A.; Jeong, D. Corn Leaf Disease: Insightful Diagnosis Using VGG16 Empowered by Explainable AI. Front. Plant Sci. 2024, 15, 1402835. [Google Scholar] [CrossRef] [Scilit]
- Chen, Y.; Chen, X.; Lin, J.; Pan, R.; Cao, T.; Cai, J.; Zhang, X. DFCANet: A Novel Lightweight Convolutional Neural Network Model for Corn Disease Identification. Agriculture 2022, 12, 2047. [Google Scholar] [CrossRef] [Scilit]
- Wang, H.; Pan, X.; Zhu, Y.; Li, S.; Zhu, R. Maize Leaf Disease Recognition Based on TC-MRSN Model in Sustainable Agriculture. Comput. Electron. Agric. 2024, 221, 108915. [Google Scholar] [CrossRef] [Scilit]
- Szegedy, C.; Liu, W.; Jia, Y.; Sermanet, P.; Reed, S.; Anguelov, D.; Erhan, D.; Vanhoucke, V.; Rabinovich, A. Going Deeper with Convolutions. In Proceedings of the IEEE Conference on Computer Vision and Pattern Recognition (CVPR), Boston, MA, USA, 7–12 June 2015; pp. 1–9. [Google Scholar] [CrossRef] [Scilit]
- Gao, S.H.; Cheng, M.M.; Zhao, K.; Zhang, X.Y.; Yang, M.H.; Torr, P. Res2Net: A New Multi-Scale Backbone Architecture. IEEE Trans. Pattern Anal. Mach. Intell. 2021, 43, 652–662. [Google Scholar] [CrossRef] [Scilit]
- Chen, Y.; Fan, H.; Xu, B.; Yan, Z.; Kalantidis, Y.; Rohrbach, M.; Yan, S.; Feng, J. Drop an Octave: Reducing Spatial Redundancy in Convolutional Neural Networks with Octave Convolution. In Proceedings of the IEEE/CVF International Conference on Computer Vision (ICCV), Seoul, Republic of Korea, 27 October–2 November 2019; pp. 3435–3444. [Google Scholar] [CrossRef] [Scilit]
- Lin, T.Y.; Dollar, P.; Girshick, R.; He, K.; Hariharan, B.; Belongie, S. Feature Pyramid Networks for Object Detection. In Proceedings of the IEEE Conference on Computer Vision and Pattern Recognition (CVPR), Honolulu, HI, USA, 21–26 July 2017; pp. 2117–2125. [Google Scholar] [CrossRef] [Scilit]
- Wang, J.; Sun, K.; Cheng, T.; Jiang, B.; Deng, C.; Zhao, Y.; Liu, D.; Mu, Y.; Tan, M.; Wang, X.; et al. Deep High-Resolution Representation Learning for Visual Recognition. IEEE Trans. Pattern Anal. Mach. Intell. 2021, 43, 3349–3364. [Google Scholar] [CrossRef] [Scilit]
- Chen, Z.; You, K.; Yang, J.; Chen, L.; Li, F.; Feng, Z.; Jia, L. A Sparse-to-Dense Guided Fusion Framework for Three-Dimensional Object Detection in Railway Environments. Eng. Appl. Artif. Intell. 2026, 178, 115095. [Google Scholar] [CrossRef] [Scilit]
- Zhao, F.; Xue, F.; Wang, J.; Yi, J.; Zhang, D.; Liu, Y.; Shao, X.; Chen, Y.; Song, J.; Li, N.; et al. CoralSMIA: Physically-Grounded Scattering Modeling and Illumination Adaptation for Generalized Underwater Coral Segmentation. IEEE Trans. Geosci. Remote Sens. 2026, 64, 4210116. [Google Scholar] [CrossRef] [Scilit]
- Shandilya, G.; Gupta, S.; Mohamed, H.G.; Bharany, S.; Ur Rehman, A.; Hussen, S. Enhanced Maize Leaf Disease Detection and Classification Using an Integrated CNN-ViT Model. Food Sci. Nutr. 2025, 13, e70513. [Google Scholar] [CrossRef] [Scilit]
- Özüpak, Y.; Alpsalaz, F.; Aslan, E.; Uzel, H. Hybrid Deep Learning Model for Maize Leaf Disease Classification with Explainable AI. N. Z. J. Crop Hortic. Sci. 2025, 53, 2942–2964. [Google Scholar] [CrossRef] [Scilit]
- Waema, D.; Mwangi, W.; Muriithi, P. ConvDeiT-Tiny: Adding Local Inductive Bias to DeiT-Ti for Enhanced Maize Leaf Disease Classification. Plants 2026, 15, 982. [Google Scholar] [CrossRef] [Scilit]
- Ullah, A.; Hussain, S.; Hou, Q.; Fang, D.; Deng, L. EDISP: A Hybrid CNN-ViT Framework for Robust Maize Leaf Disease Detection and Classification. Front. Plant Sci. 2026, 17, 1873194. [Google Scholar] [CrossRef] [Scilit]
- Campbell, F.W.; Robson, J.G. Application of Fourier Analysis to the Visibility of Gratings. J. Physiol. 1968, 197, 551–566. [Google Scholar] [CrossRef] [Scilit]
- Bullier, J. Integrated Model of Visual Processing. Brain Res. Rev. 2001, 36, 96–107. [Google Scholar] [CrossRef] [Scilit]
- Bar, M. A Cortical Mechanism for Triggering Top-Down Facilitation in Visual Object Recognition. J. Cogn. Neurosci. 2003, 15, 600–609. [Google Scholar] [CrossRef] [Scilit]
- Hegdé, J. Time Course of Visual Perception: Coarse-to-Fine Processing and Beyond. Prog. Neurobiol. 2008, 84, 405–439. [Google Scholar] [CrossRef] [Scilit]
- Shorten, C.; Khoshgoftaar, T.M. A survey on Image Data Augmentation for Deep Learning. J. Big Data 2019, 6, 60. [Google Scholar] [CrossRef] [Scilit]
- Cubuk, E.D.; Zoph, B.; Mane, D.; Vasudevan, V.; Le, Q.V. AutoAugment: Learning Augmentation Strategies From Data. In Proceedings of the IEEE/CVF Conference on Computer Vision and Pattern Recognition, Long Beach, CA, USA, 15–20 June 2019; pp. 113–123. [Google Scholar] [CrossRef] [Scilit]
- Cubuk, E.D.; Zoph, B.; Shlens, J.; Le, Q.V. Randaugment: Practical Automated Data Augmentation with a Reduced Search Space. In Proceedings of the IEEE/CVF Conference on Computer Vision and Pattern Recognition Workshops, Seattle, WA, USA, 14–19 June 2020; pp. 3008–3017. [Google Scholar] [CrossRef] [Scilit]
- Ramanjot; Mittal, U.; Wadhawan, A.; Singla, J. Plant Disease Detection and Classification: A Systematic Literature Review. Sensors 2023, 23, 4769. [Google Scholar] [CrossRef] [Scilit]
- Antwi, K.; Bennin, K.E.; Asiedu, D.K.P.; Tekinerdogan, B. On the application of image augmentation for plant disease detection: A systematic literature review. Smart Agric. Technol. 2024, 9, 100590. [Google Scholar] [CrossRef] [Scilit]
- Avilés-Cruz, C.; Ferreyra-Ramírez, A.; Zúñiga López, A.; Villegas-Cortéz, J. Coarse-fine convolutional deep-learning strategy for human activity recognition. Sensors 2019, 19, 1556. [Google Scholar] [CrossRef] [Scilit]
- Avilés-Cruz, C.; Celis-Escudero, G. 3G-AN: Triple-generative adversarial network under coarse-medium-fine generator architecture. IEEE Access 2023, 11, 105344–105354. [Google Scholar] [CrossRef] [Scilit]
- Maas, A.L.; Hannun, A.Y.; Ng, A.Y. Rectifier Nonlinearities Improve Neural Network Acoustic Models. In Proceedings of the 30th International Conference on Machine Learning (ICML) Workshop on Deep Learning for Audio, Speech and Language Processing, Atlanta, GA, USA, 16 June 2013; pp. 3–6. [Google Scholar]
- Parashar, N.; Johri, P.; Elbeltagi, A.; Salem, A.; Choudhary, P.; Kumar, V.; Agrawal, T. Enhanced Residual-Attention Deep Neural Network for Disease Classification in Maize Leaf Images. Sci. Rep. 2025, 15, 29452. [Google Scholar] [CrossRef] [Scilit]
- Sharma, M.K.; Sharma, R.; Kumar, G. Enhanced corn leaf disease detection using sharpness-aware minimization optimized CNNs. Plant Methods 2026, 22, 49. [Google Scholar] [CrossRef] [Scilit]
- Pamungkas, B.A.; Ramdhani, R.; Pratama, R.A. Leaf Image Identification: CNN with EfficientNet-B0 and ResNet-50 Used to Classified Corn Disease. J. RESTI Rekayasa Sist. Dan Teknol. Inf. 2023, 7, 326–333. [Google Scholar] [CrossRef] [Scilit]
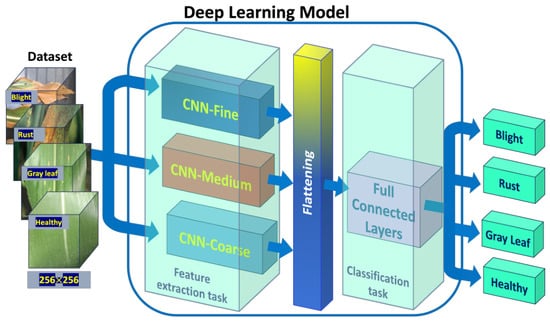
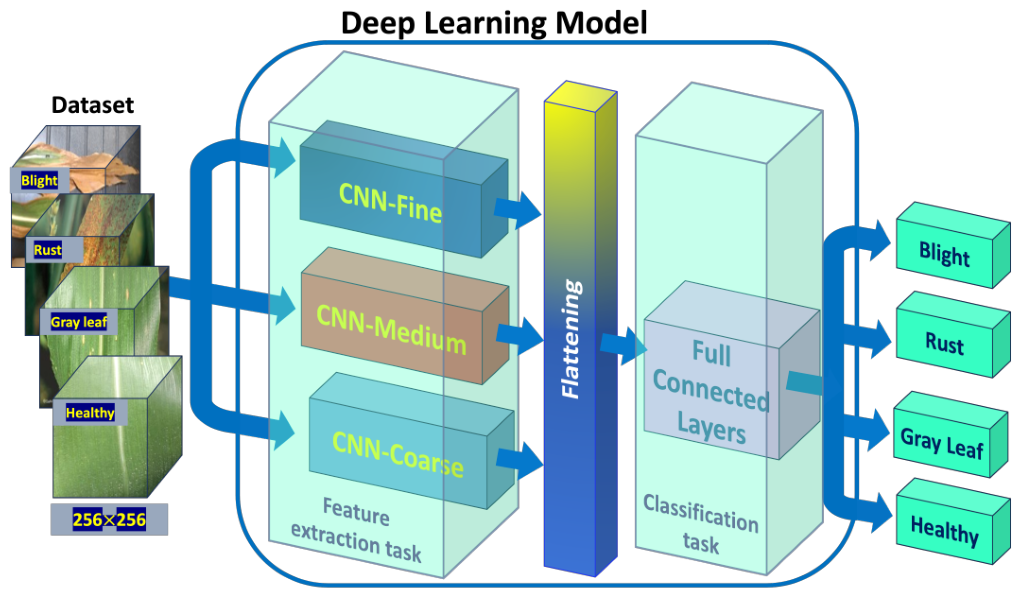
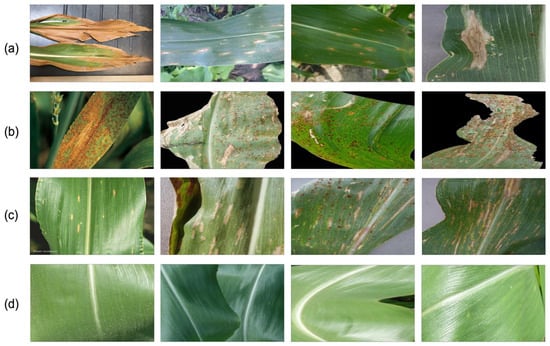
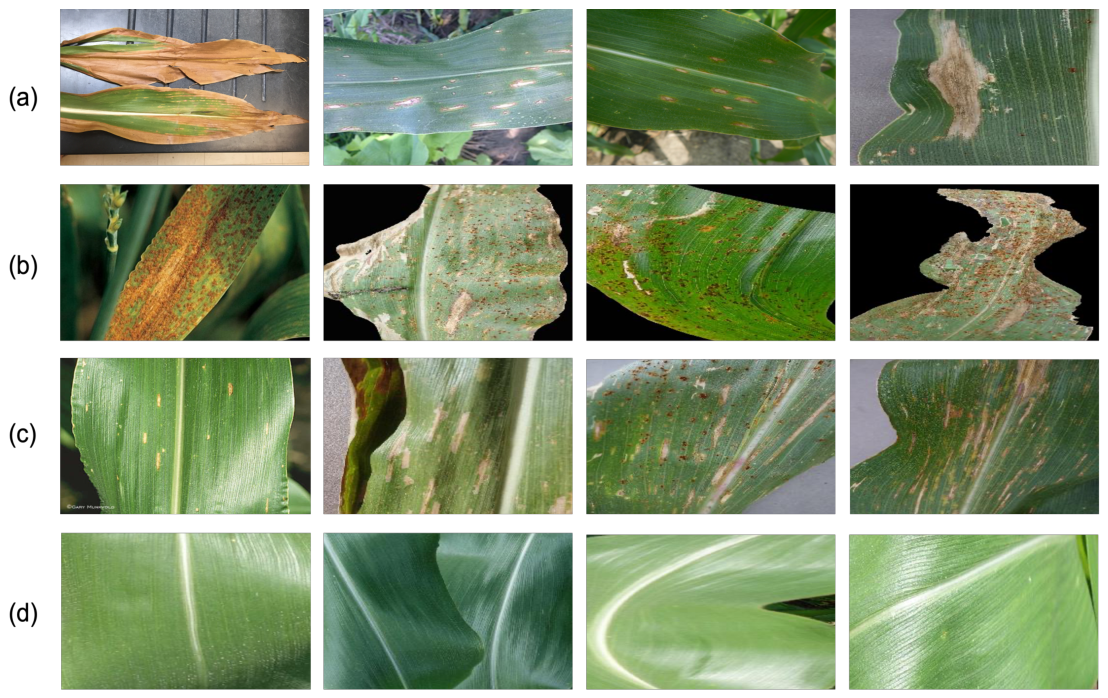
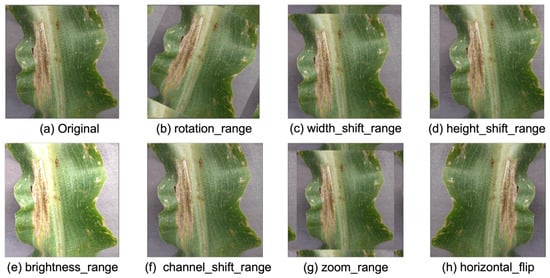
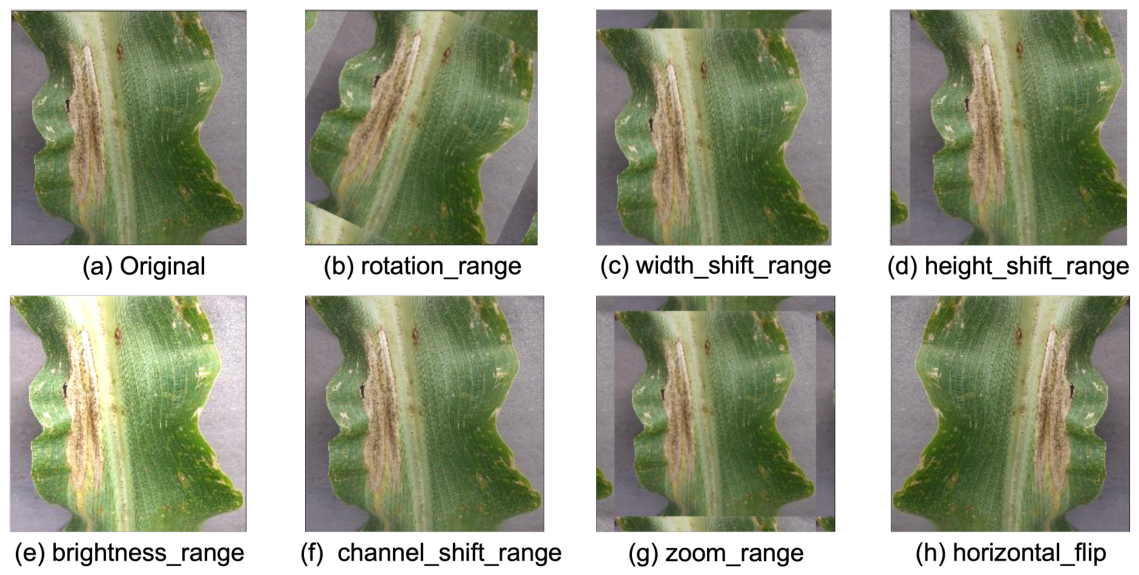
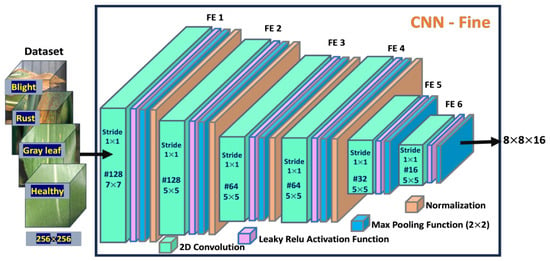
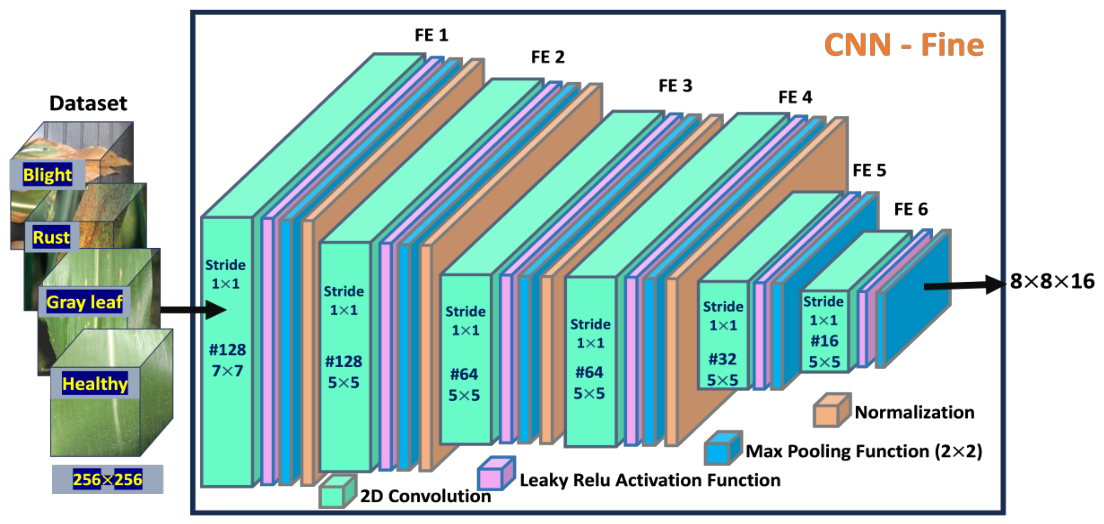
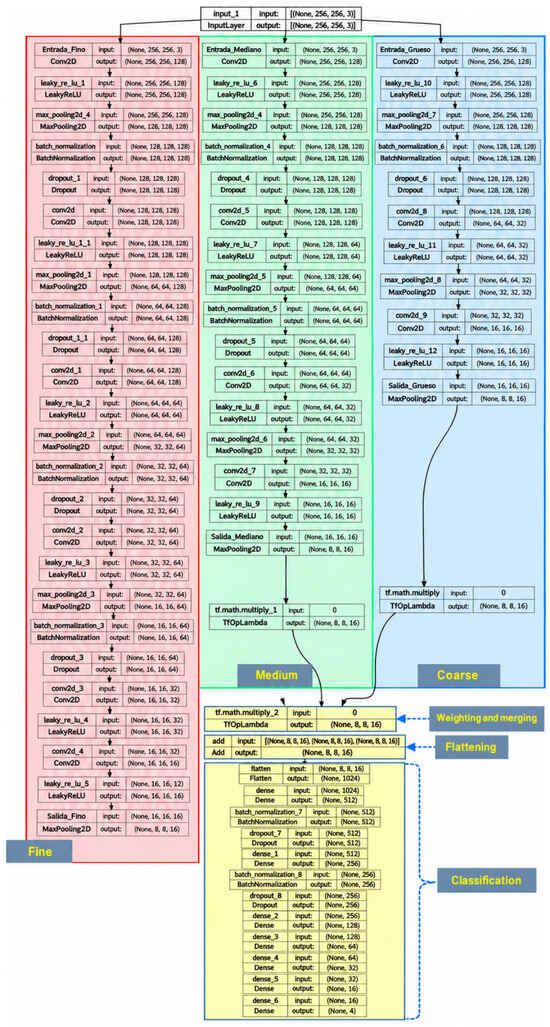
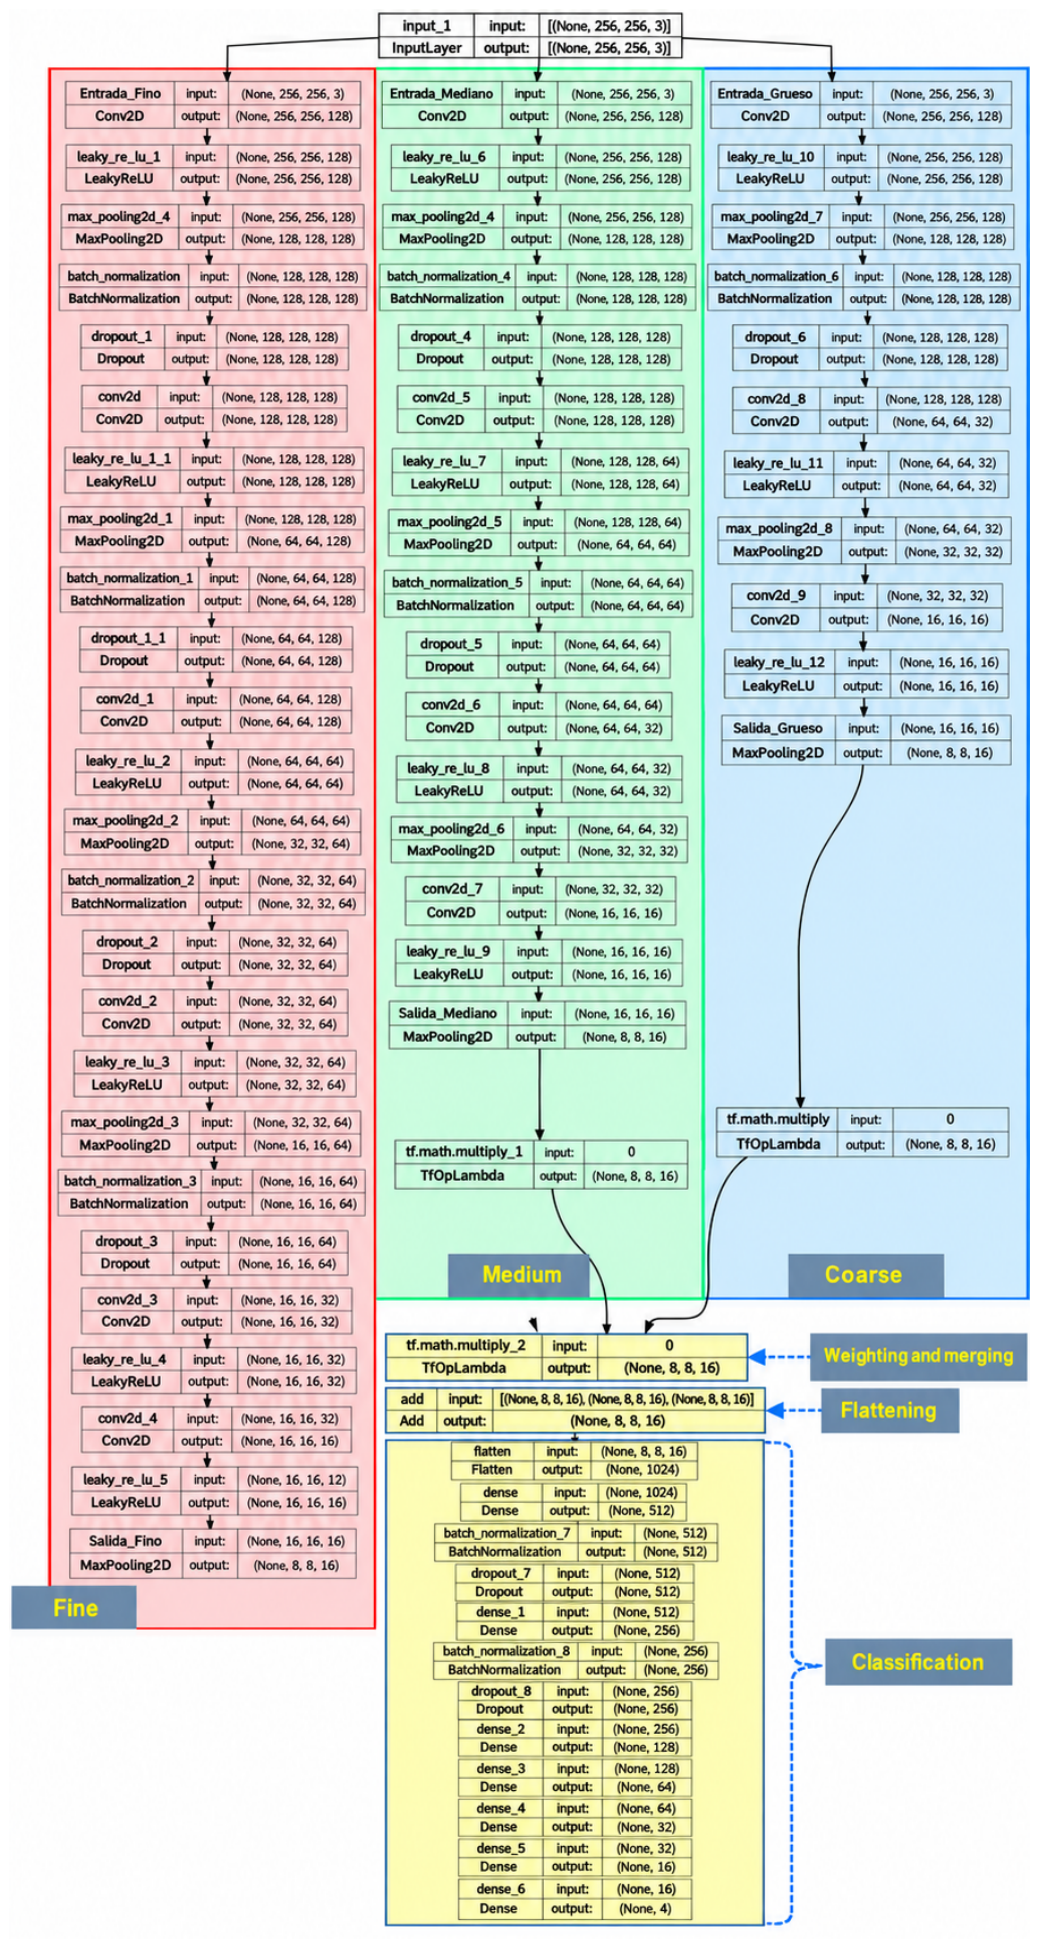
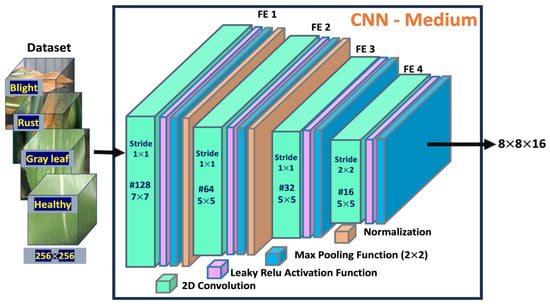
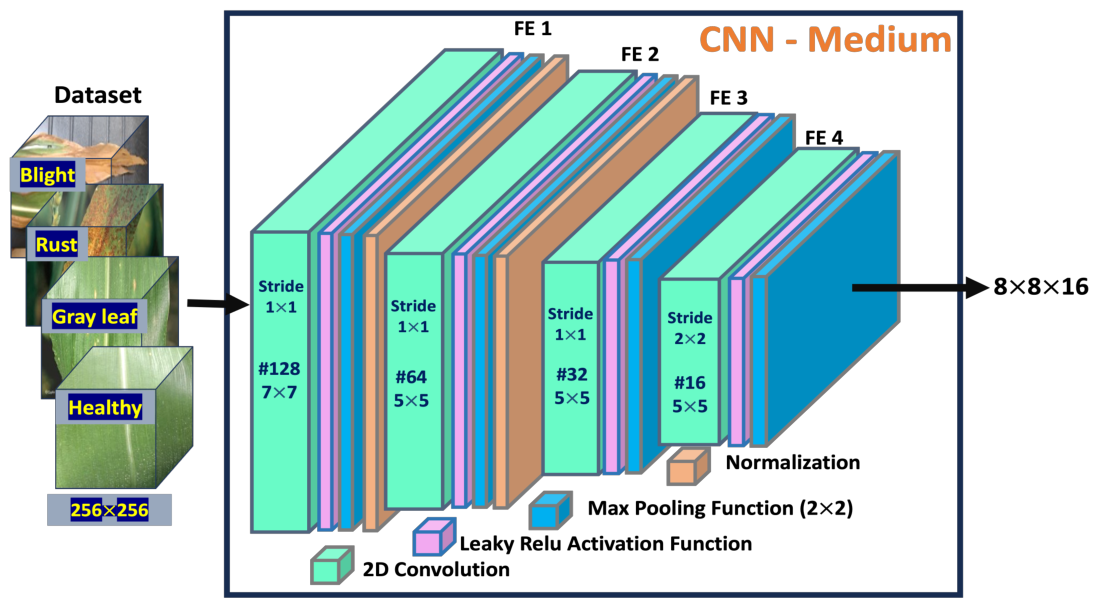
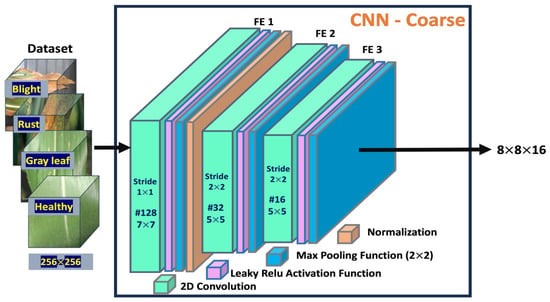
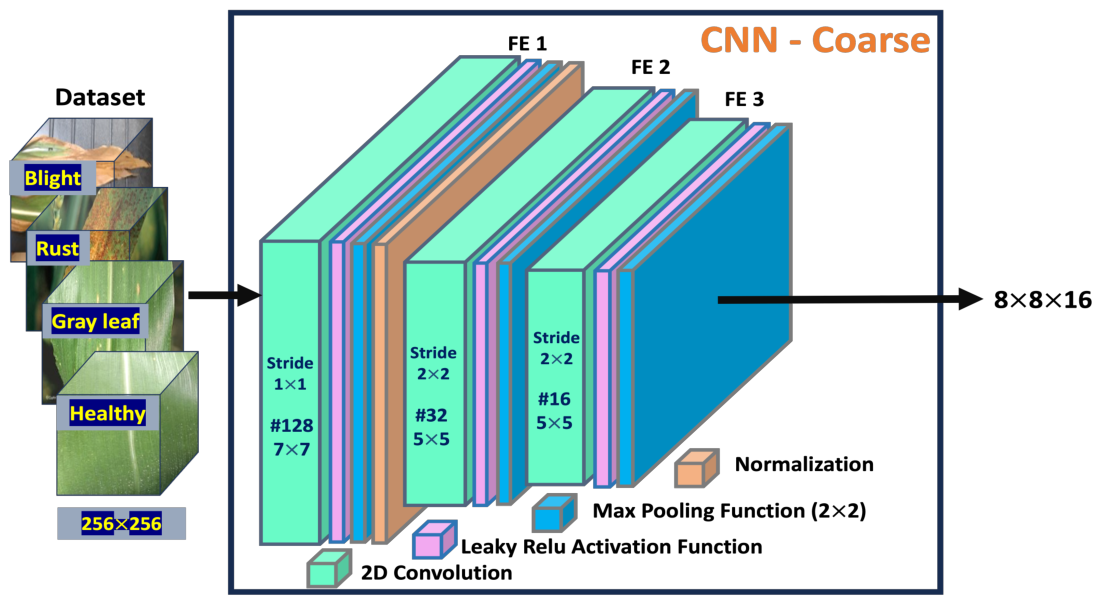
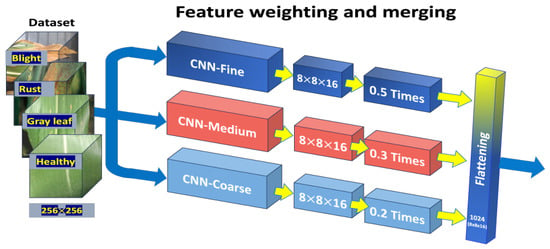
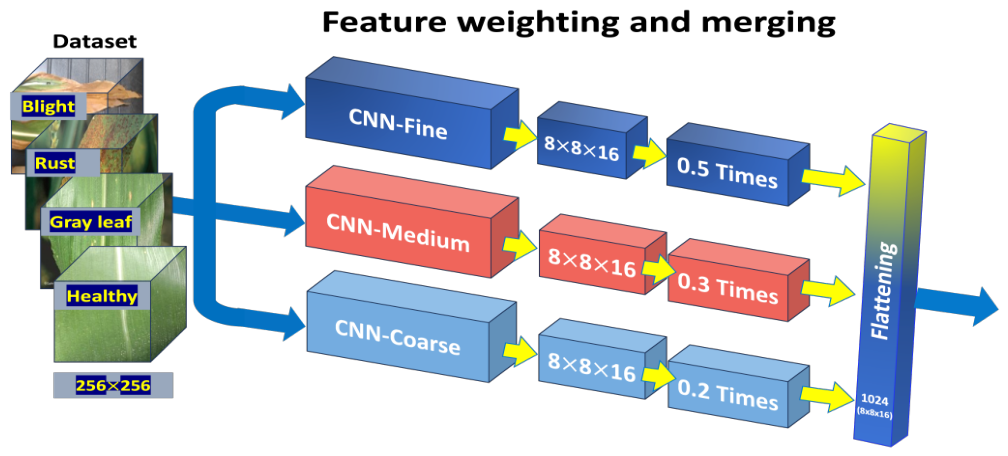
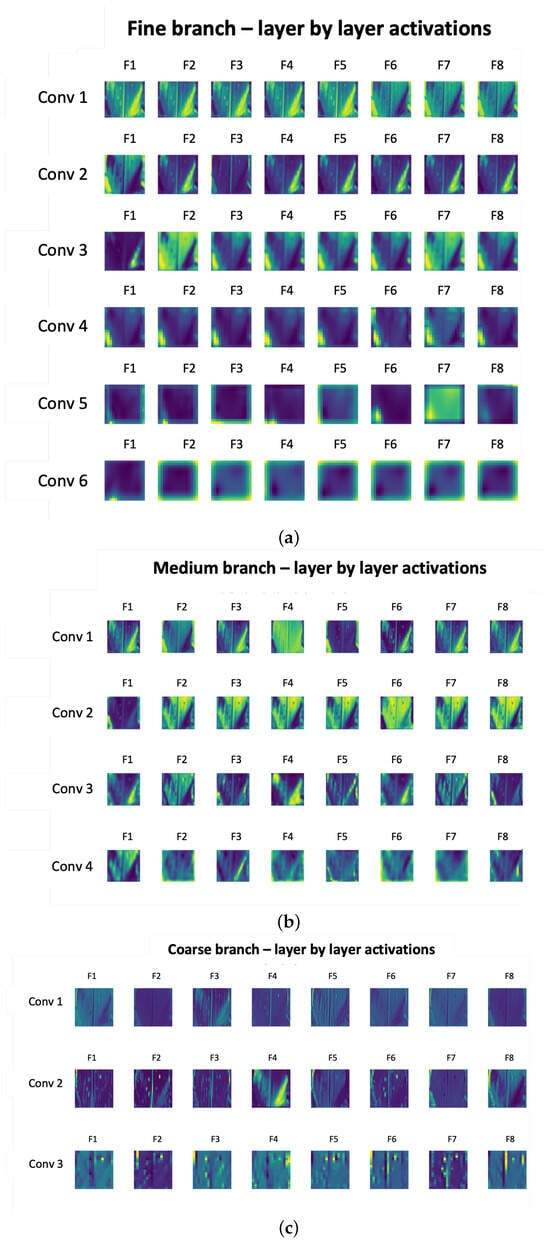
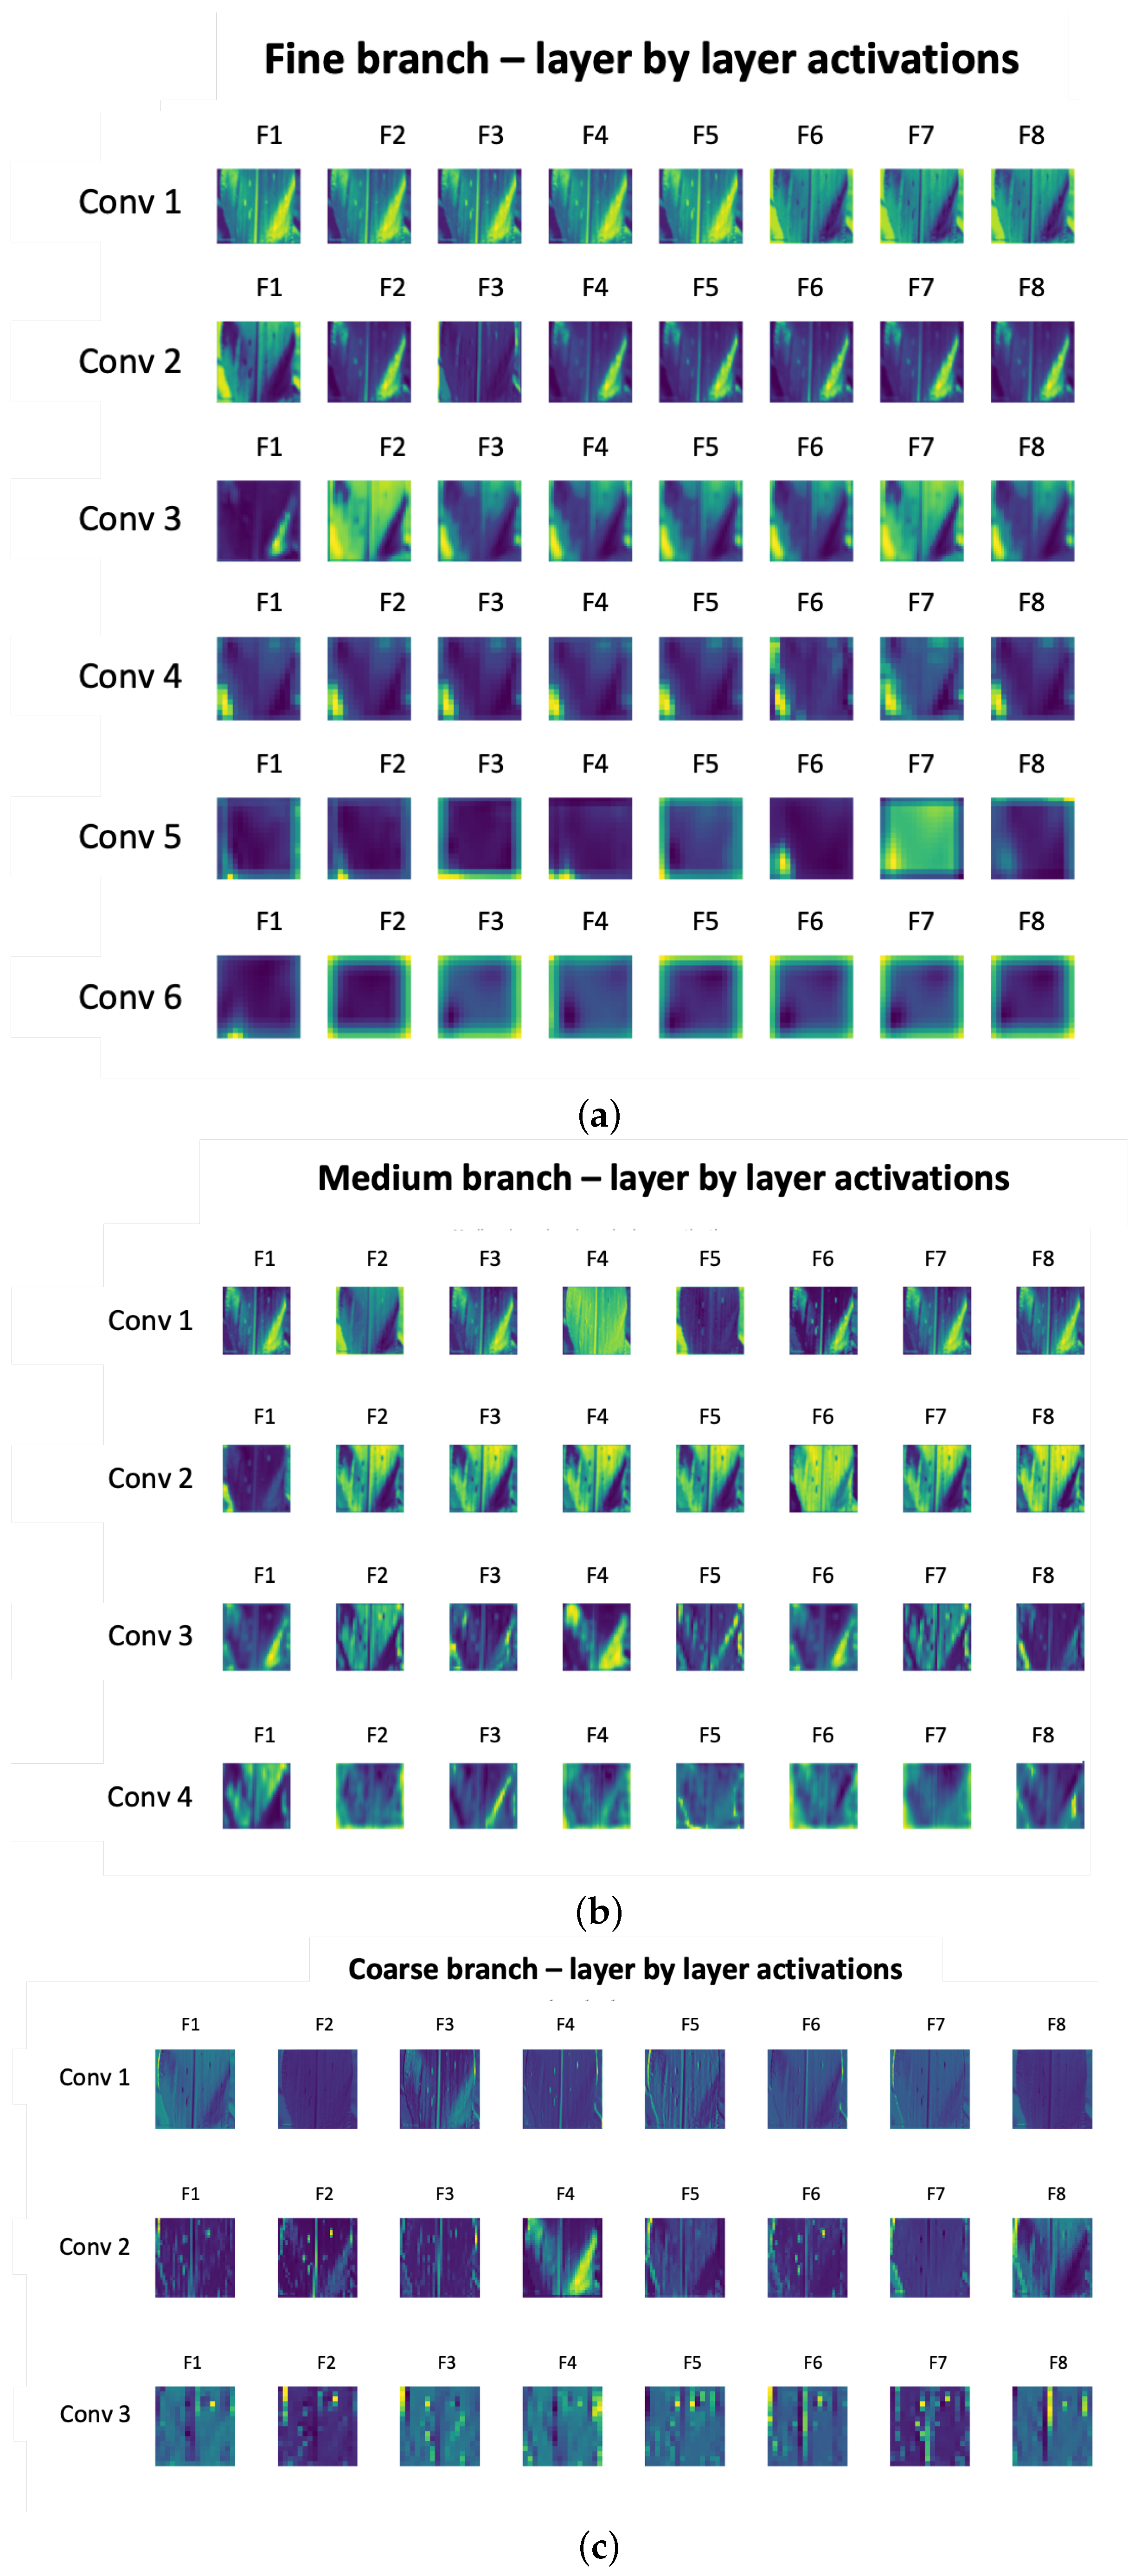
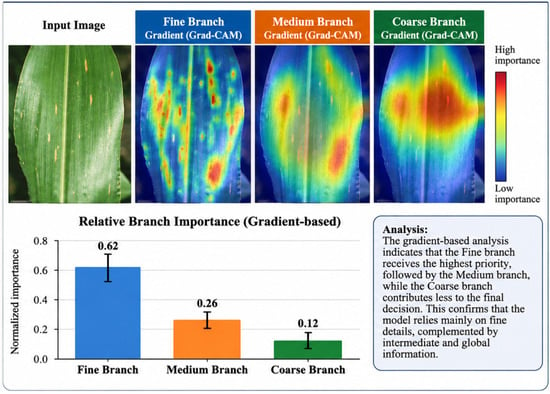
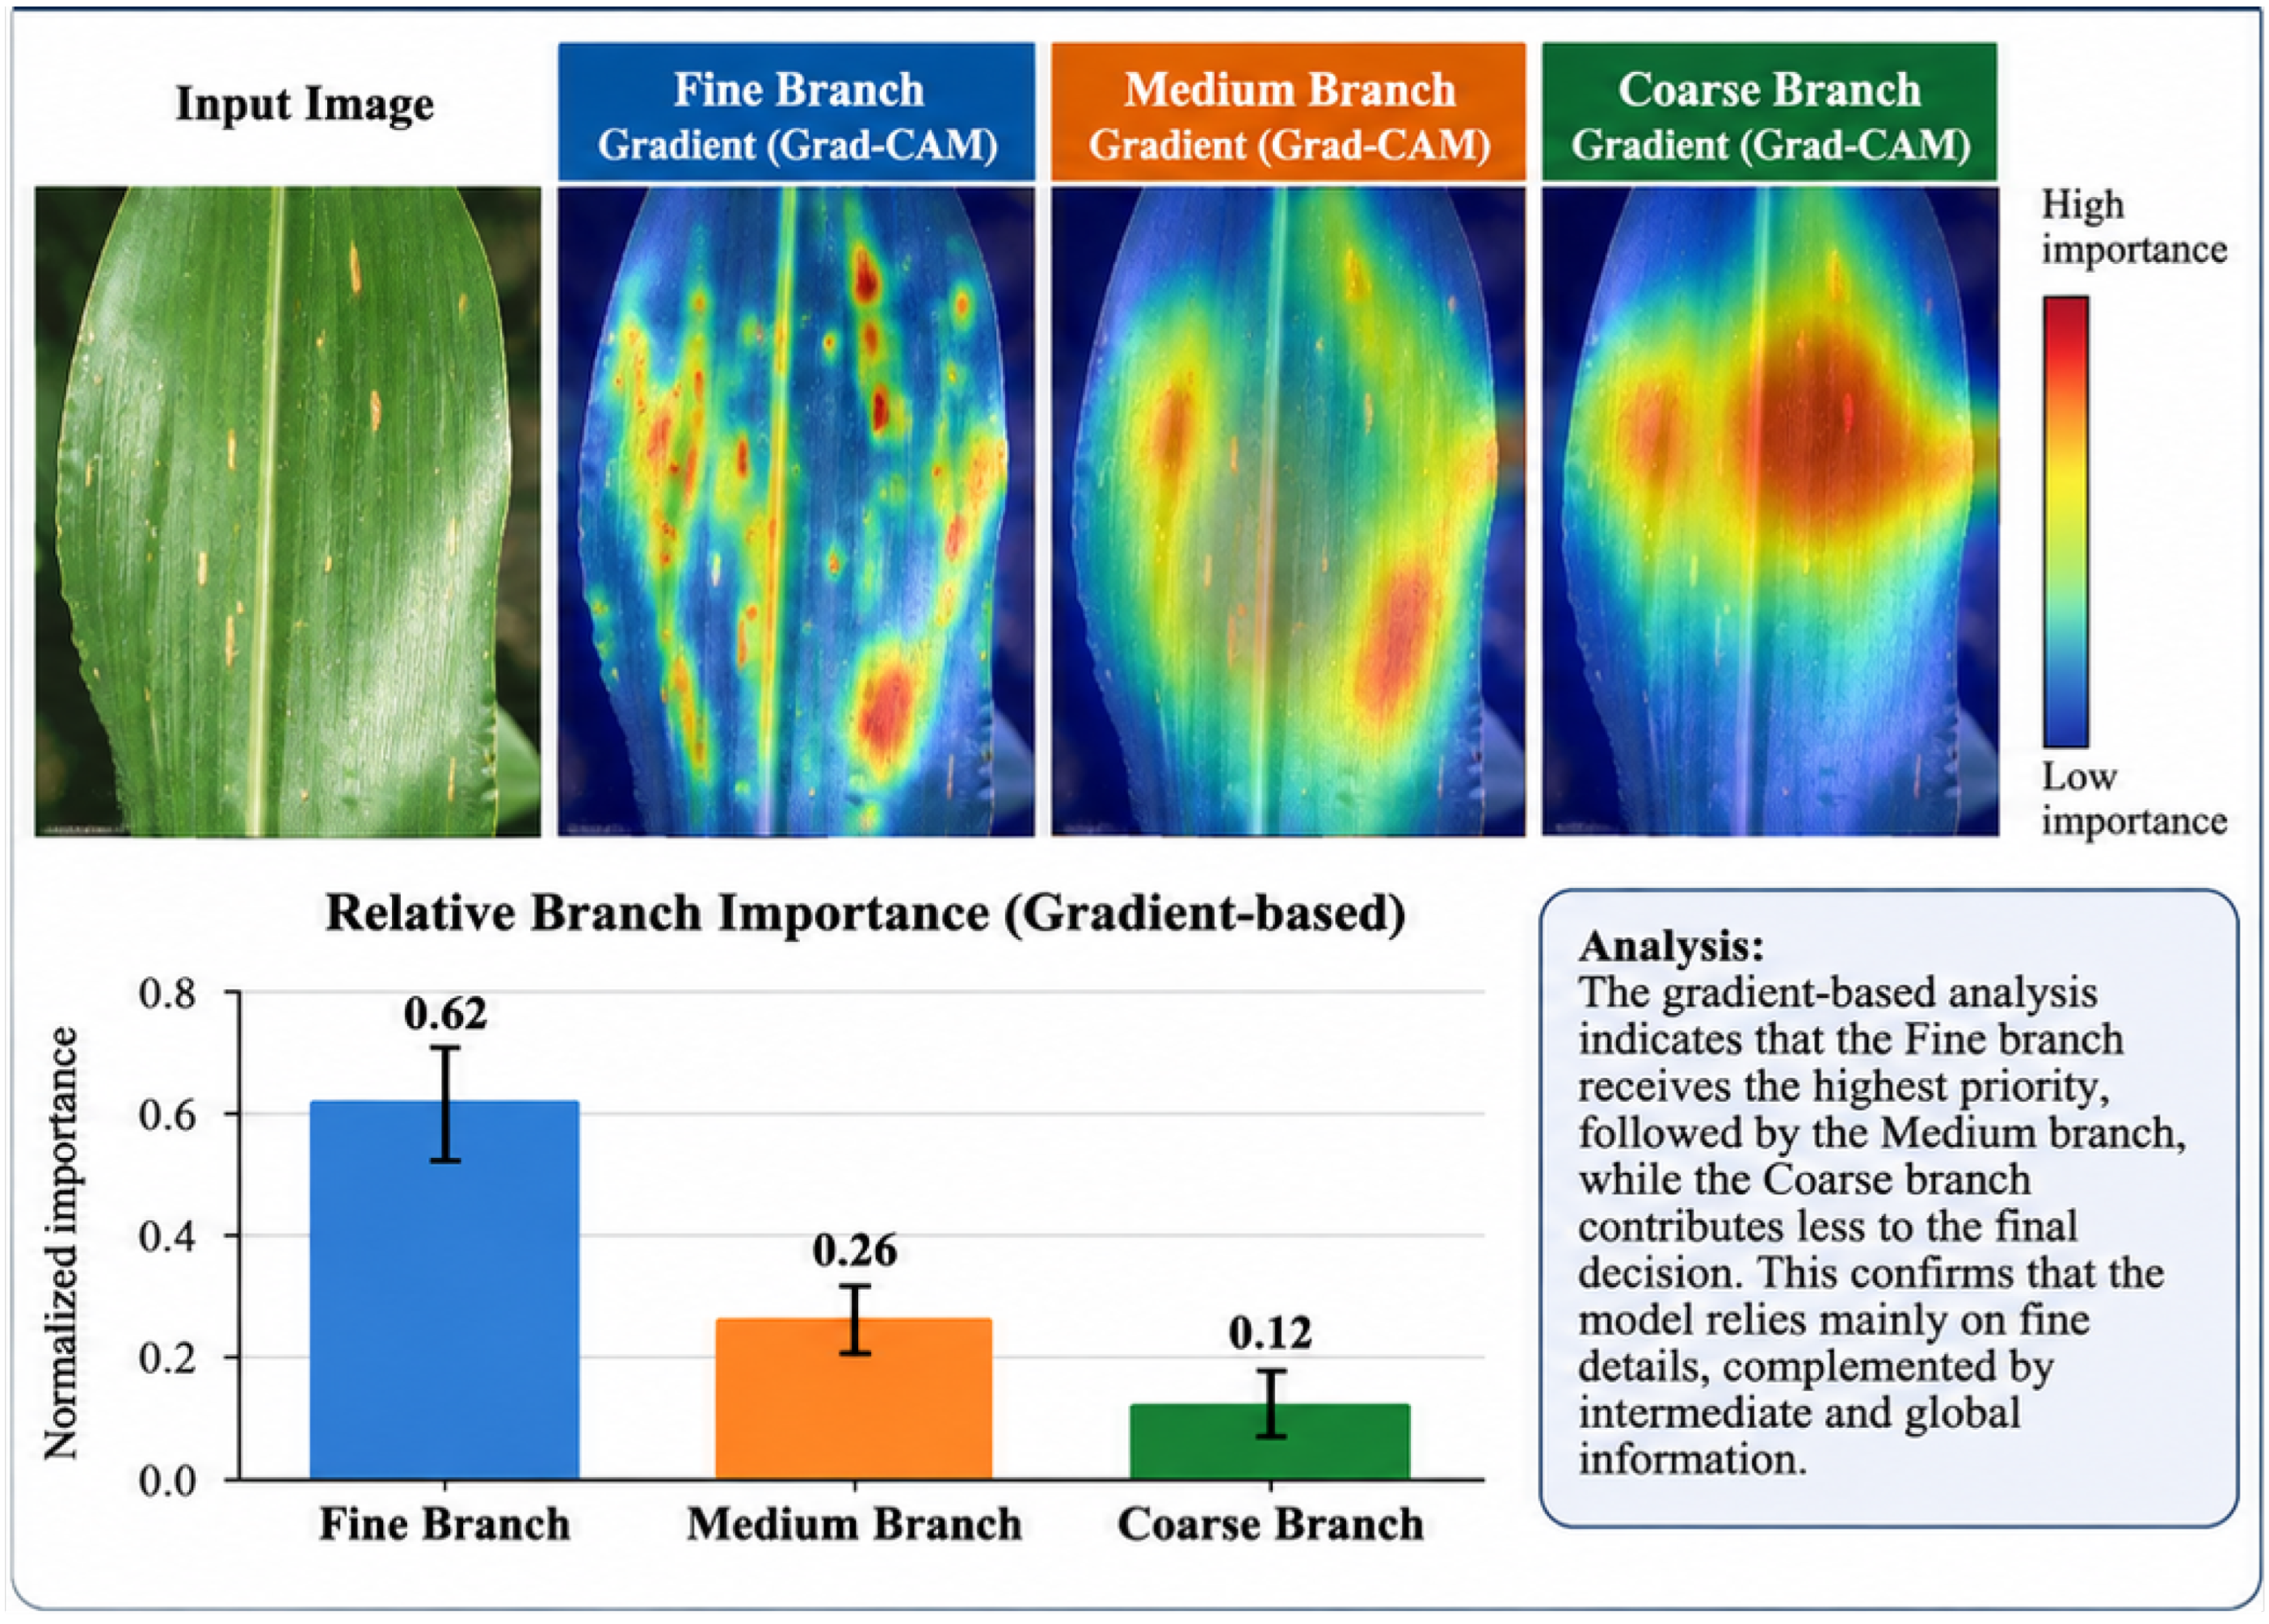
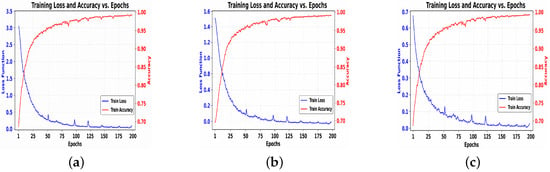
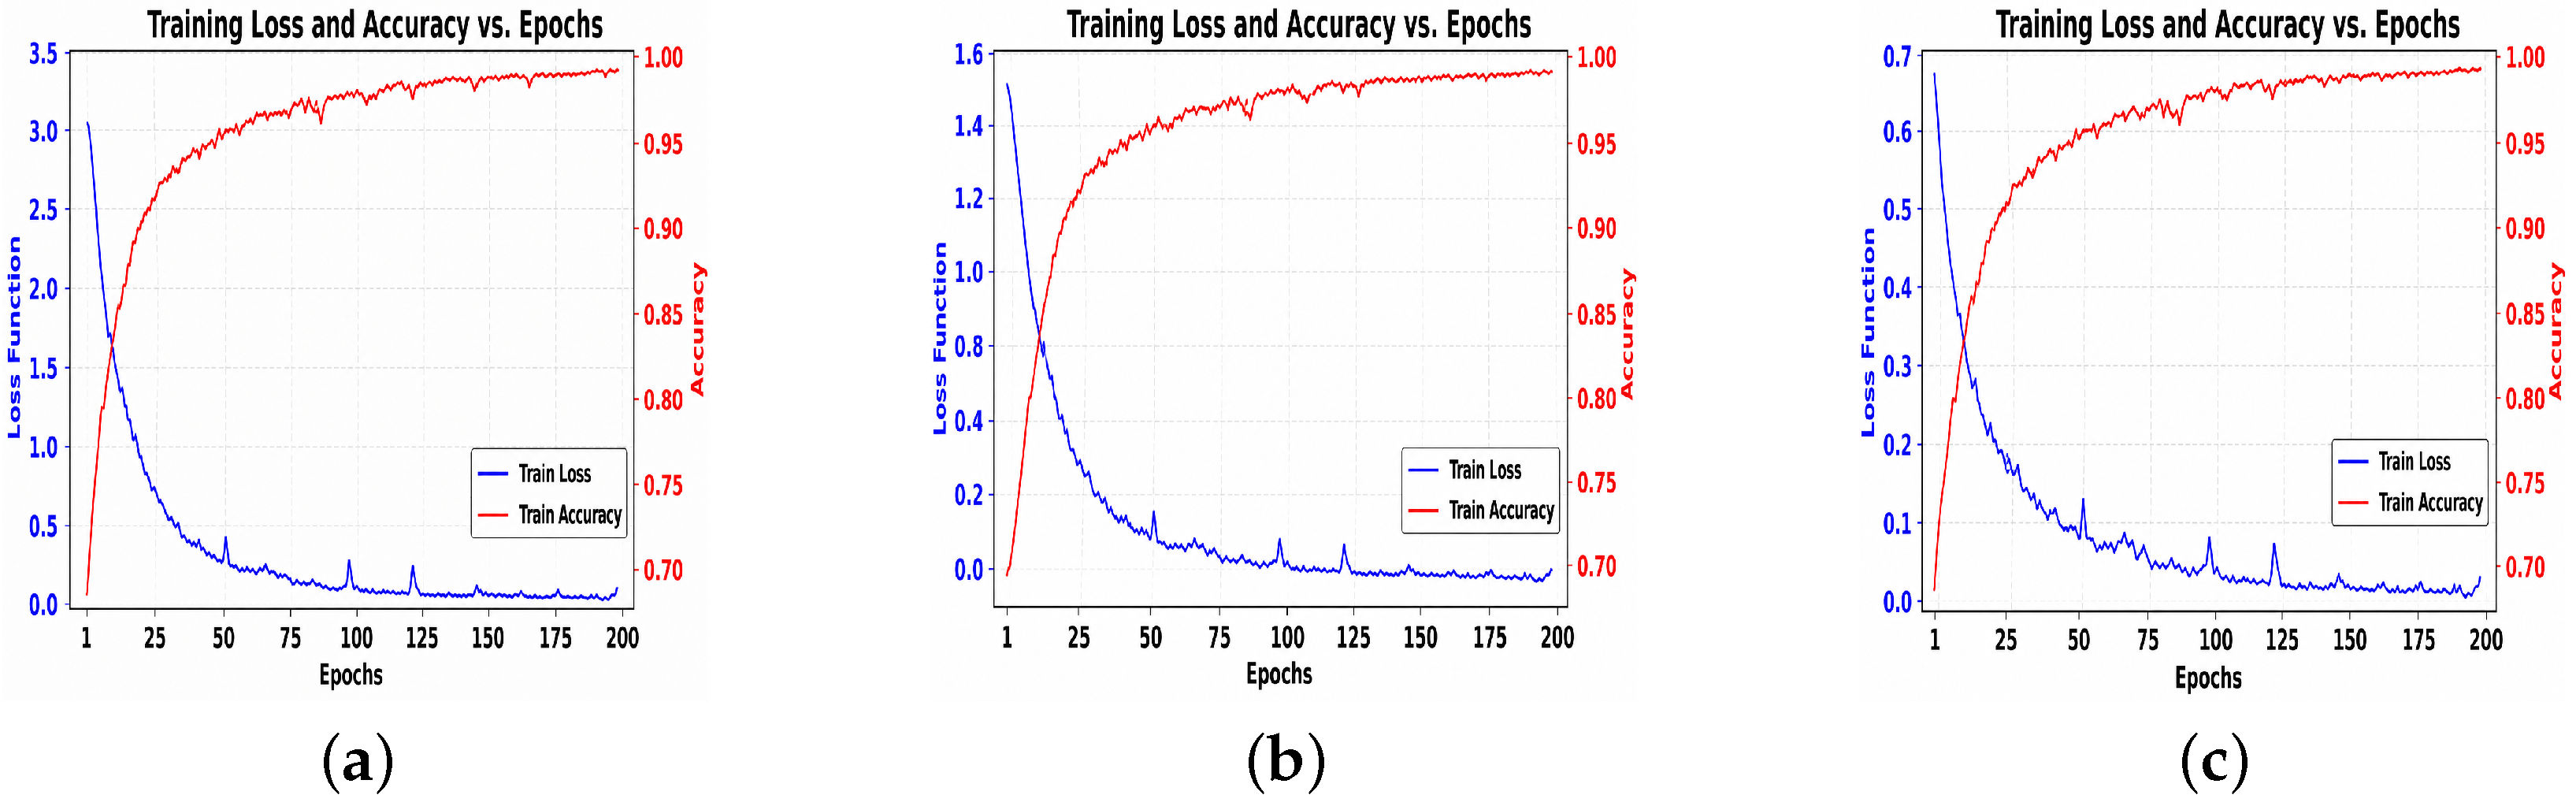
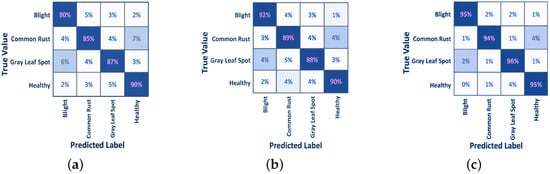
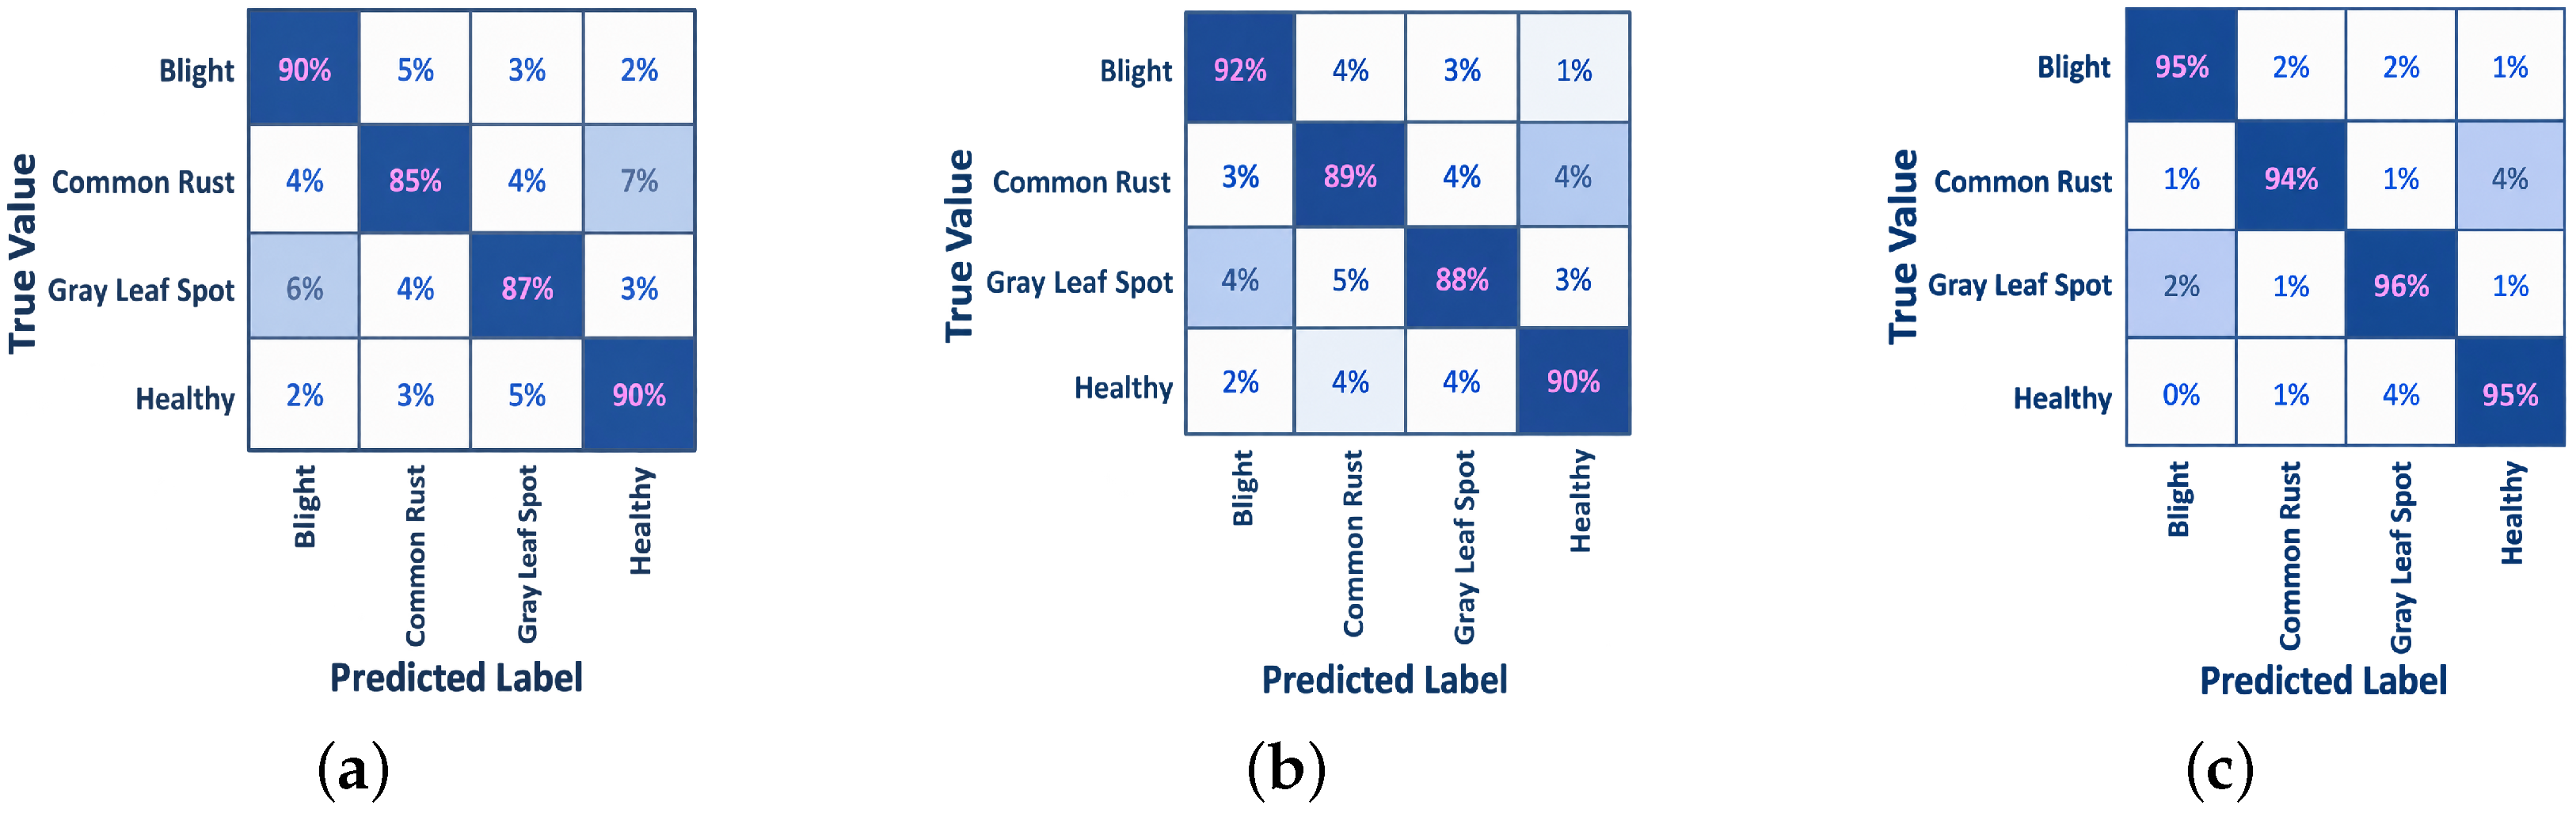
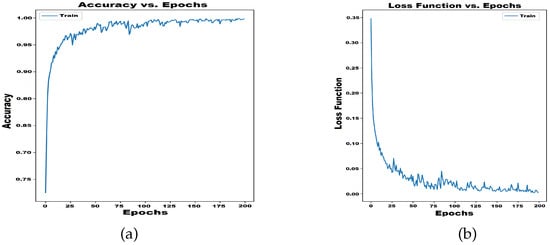
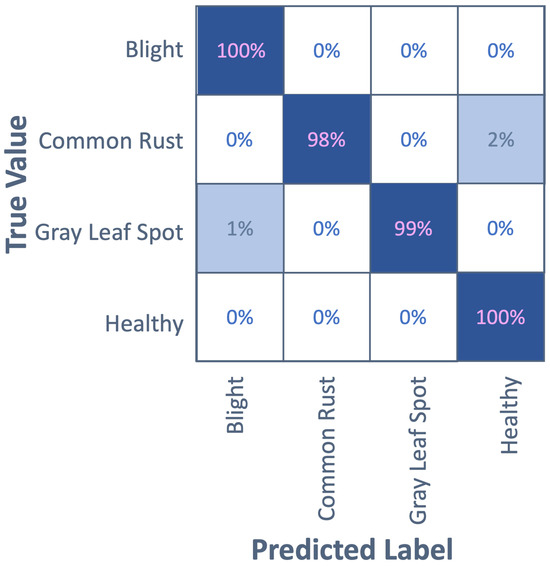
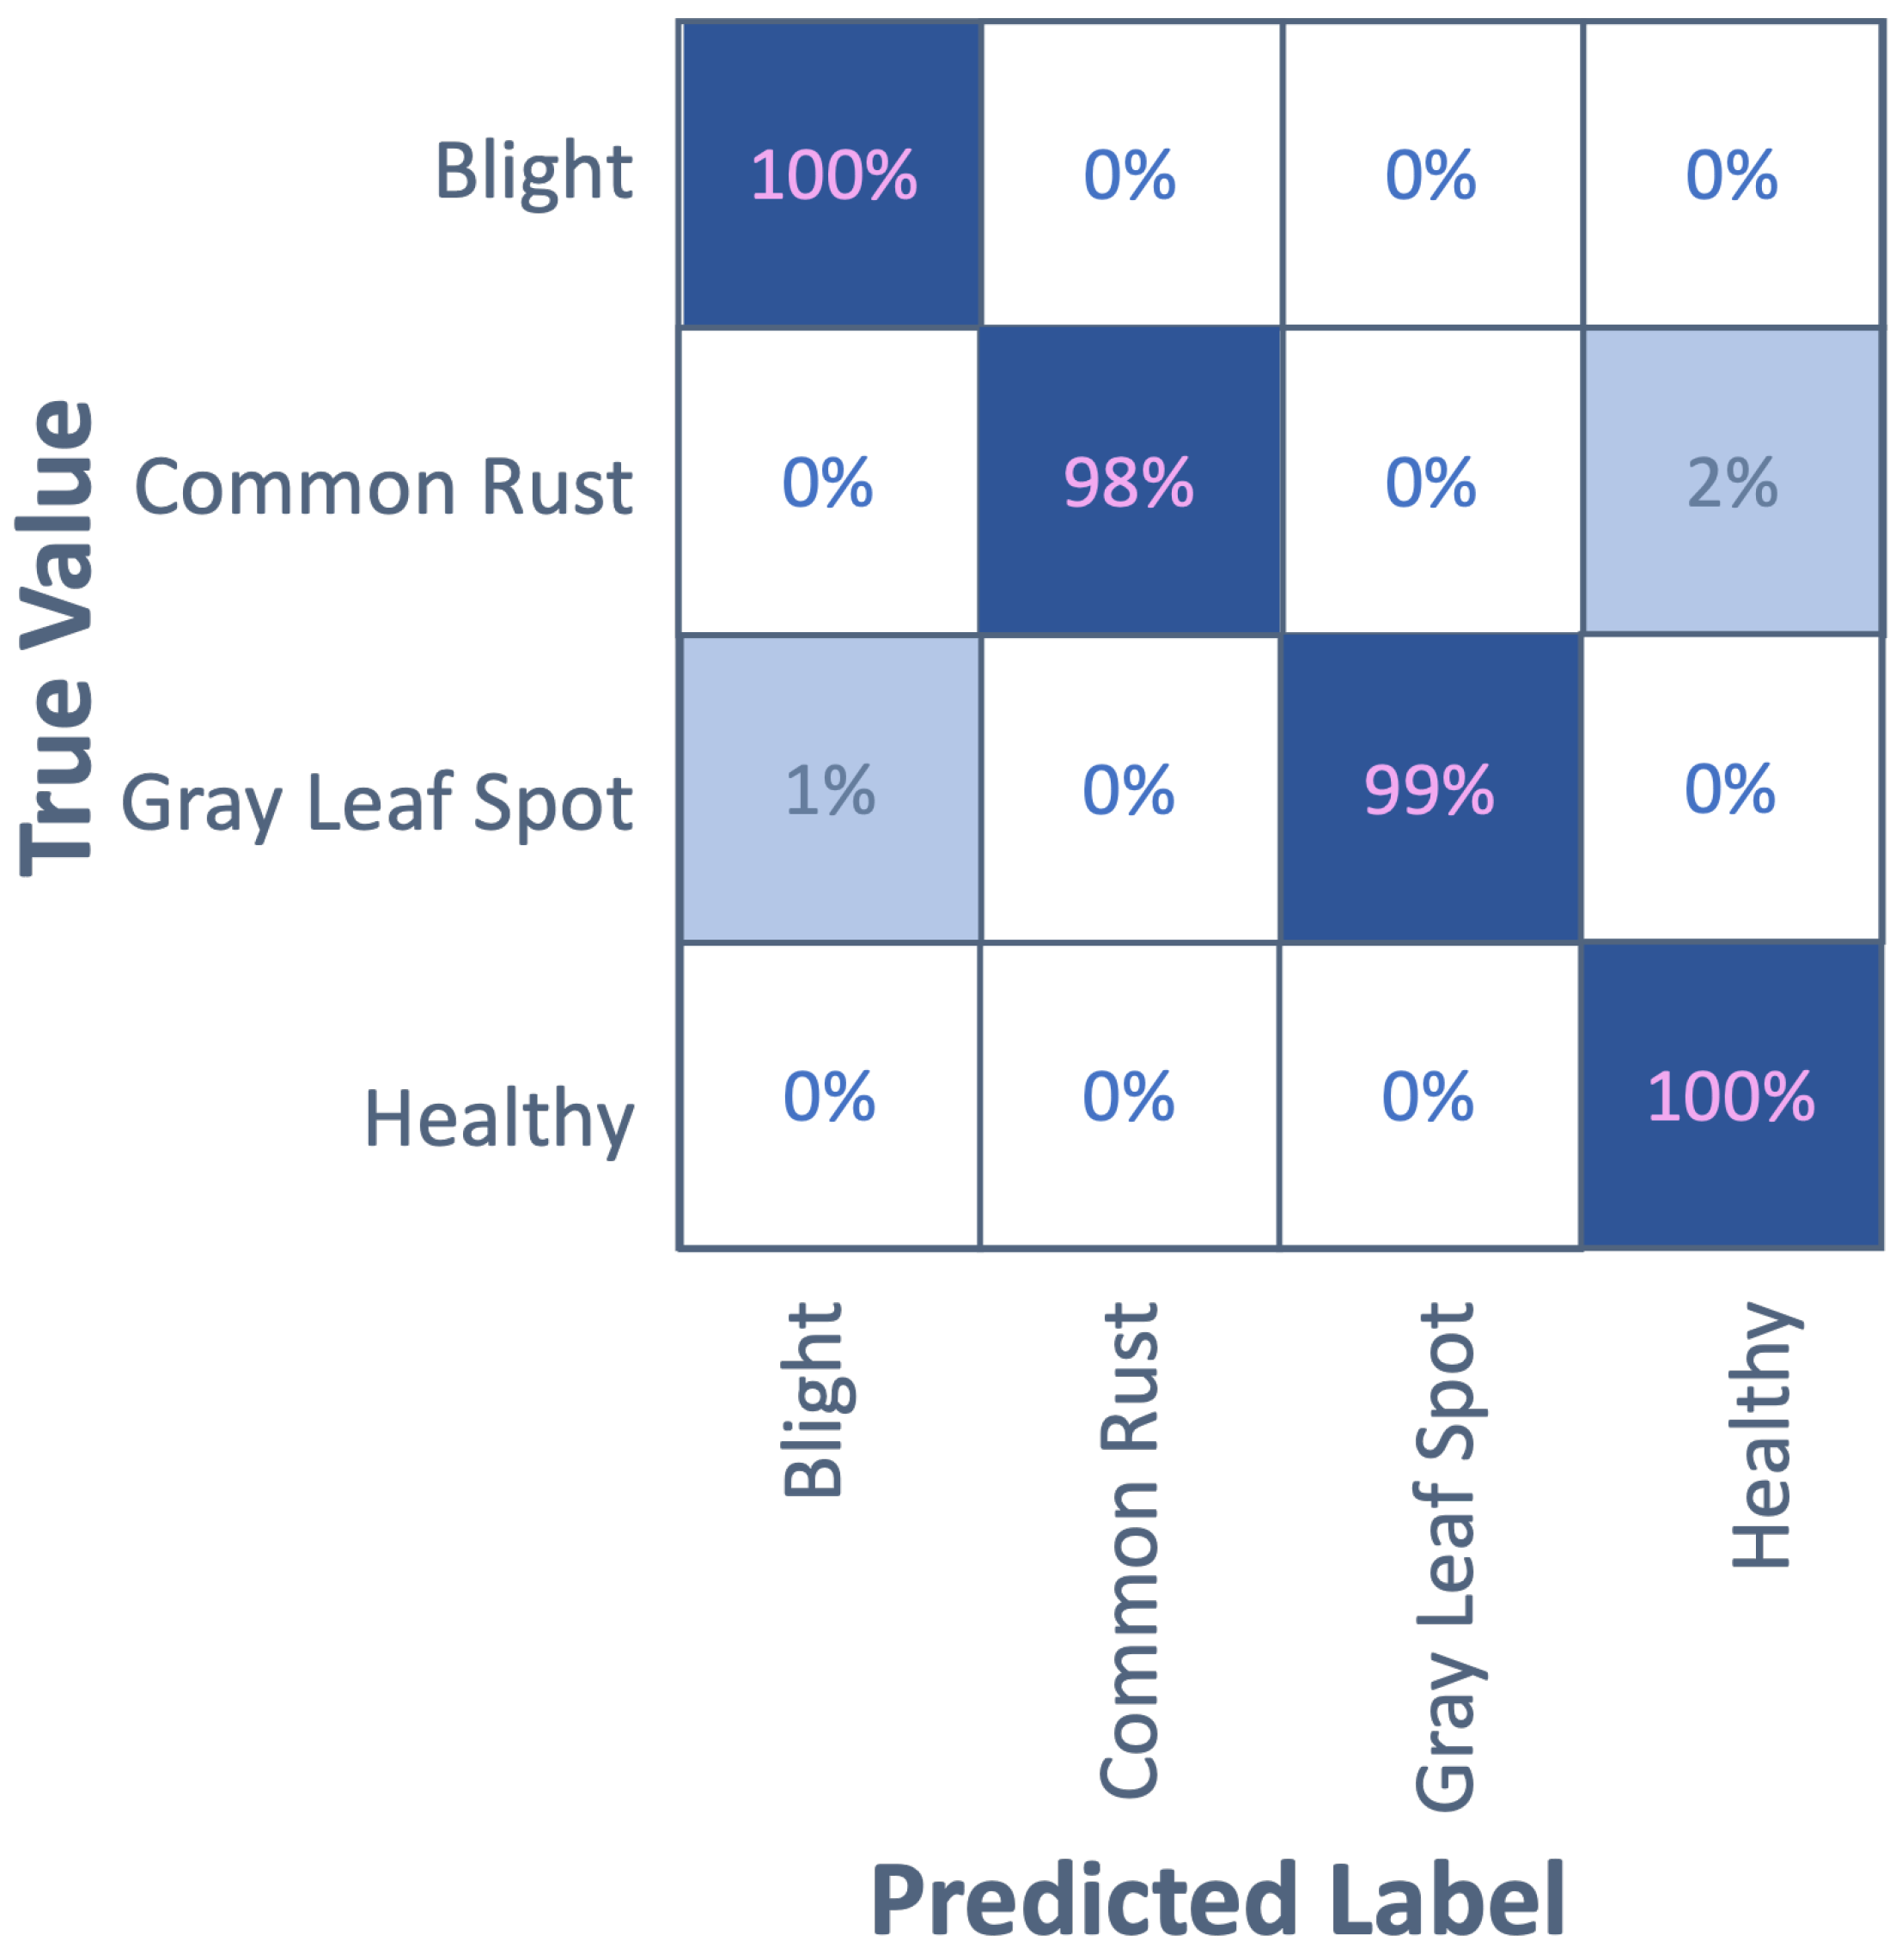

Disclaimer/Publisher’s Note: The statements, opinions and data contained in all publications are solely those of the individual author(s) and contributor(s) and not of MDPI and/or the editor(s). MDPI and/or the editor(s) disclaim responsibility for any injury to people or property resulting from any ideas, methods, instructions or products referred to in the content. |
© 2026 by the authors. Licensee MDPI, Basel, Switzerland. This article is an open access article distributed under the terms and conditions of the Creative Commons Attribution (CC BY) license.