


Abstract
Carukia barnesi is a small tropical Cubozoan that causes painful and potentially fatal stings (Irukandji syndrome) along the north-eastern coast of Australia during the summer monsoonal months between November and May. This research establishes the thermal and osmotic tolerance of the medusa stage of the Irukandji jellyfish C. barnesi to determine if environmental parameters influence the marked seasonality of this species. By quantifying oxygen consumption over a range of temperatures, the theoretical minimum thermal requirement for the long-term persistence of C. barnesi medusae (i.e., theoretical zero) was estimated at 21.5 °C, which does not explain the seasonal occurrence of this species. The highest bell contraction frequency was determined to fall between 27.5 °C and 30.9 °C, which encompassed the typical thermal regime in situ. This research concludes that the deleterious effects of reduced performance associated with a departure from suitable environmental temperatures may better describe the seasonal pattern of this species than the theoretical thermal limits. Conversely, departure from suitable thermal regimes did not explain the southern distribution limits of this species, suggesting that C. barnesi could theoretically persist further south than their loosely defined southern distribution limits. Salinity also had a significant effect on C. barnesi medusae whereby the highest bell contraction frequency occurred at salinity levels above 33.6‰. Salinity levels below 29‰ reduced swimming capacity and became lethal below 25‰. This result supports the hypothesis that C. barnesi medusae are oceanic and/or neritic and cannot persist in estuarine environments where low salinity conditions commonly occur. Furthermore, the respiration rate of C. barnesi was lower at night, providing further evidence that this species is less active during night conditions, presumably to conserve energy.
1. Introduction
Cubozoans are complex gelatinous animals with sophisticated visual structures [1,2,3,4,5,6], advanced prey capture techniques [7,8], toxic venoms [9,10,11,12], diurnal behaviour patterns [13,14], elevated swimming capacities [15,16], and metagenic life cycles [17,18,19,20,21,22,23,24]. The medusa stage of many species exhibits high levels of seasonality; however, in most cases, little is known about the factors that contribute to, or cause, the observed seasonal patterns [25,26,27,28,29,30,31]. Although these seasonal patterns are thought to be, at least partially, caused by environmental factors, such as seasonal temperature variations and/or seasonal salinity fluctuations, the thermal and osmotic tolerances of the medusa stage have received far less attention. Quantifying the effects of these environmental parameters on the medusa stage may provide insight into why some species are highly seasonal. The thermal ecology of cubozoans may also explain the latitudinal distribution limits with many species restricted to tropical regions [9,28]. Understanding the thermal limitations of cubozoans, particularly those known to be dangerous to humans, would be beneficial for predicting future distributional range changes under current and projected sea temperature rise scenarios.
One oceanic cubozoan that occurs along the eastern coast of Australia, between Lizard Island and Fraser Island, that demonstrates marked seasonality, is the ‘Irukandji’ jellyfish Carukia barnesi [9,29,30,32]. This species is typically located near reefs, islands, and under certain circumstances, along beaches during the summer monsoonal months between November and May, with a high amount of spatial and temporal variability [29,30,32]. This species, as with all other cubozoans, has a metagenic life cycle, which alternates between benthic sessile polyps that reproduce asexually, and motile planktonic medusae that reproduce sexually [21,33,34,35]. The polyp stage of C. barnesi, alongside the majority of all other cubozoan polyps, have not yet been located in situ. However, laboratory-based cultures of C. barnesi polyps have been produced from wild caught adult medusae [19]. Thermal and osmotic tolerance experiments conducted on these C. barnesi polyps have indicated that these polyps may occur inshore, near river mouths, due to their increased survivorship and asexual reproduction in response to low salinity conditions [36], which do not occur in the waters of the Great Barrier Reef, or Coral Sea, where the medusa stage is found.
The annual arrival of many tropical Australian cubozoans is typically correlated with increasing sea temperature during the summer monsoonal months. This has led to the general consensus that the medusa stage of many tropical species (e.g., Chiropsella bronzie, Chironex fleckeri) require warm temperatures for persistence, and subsequently disappear when the temperature becomes too low, presumably dying [28,30,33,37,38]. Although this pattern is routinely observed, very little data exists on the thermal tolerance of cubozoan medusae. One difficulty in determining the thermal and/or osmotic tolerance of cubozoan medusae is the inability to maintain specimens in laboratory conditions for extended periods, due to limitations in animal husbandry practices [39].
Investigations into the effects of temperature on other taxon, particularly insects, focus on development times, survivorship, growth rates, reproductive output, metabolic rate, and/or motor control [40,41]. Of these measures, respiration rate, which is often used as a surrogate measure of metabolism, and motor control, such as bell contraction frequency in the case of jellyfish, may provide an avenue for determining a thermophysiological profile of C. barnesi by means that do not require maintaining specimens in artificial environments for extended periods [42]. These profiles can, in turn, be used to estimate critical thermal limits, including the theoretical minimum temperature required for long-term persistence (i.e., theoretical zero) [40,43]. Methods for respiration rate trials on gelatinous species have been developed and applied [44,45,46]. However, very few studies explicitly target minimum and maximum thermal and/or osmotic thresholds, and no thermophysiological data exists for cubozoan medusae.
The aim of this study was to quantify the thermal and osmotic tolerance of the medusae stage of C. barnesi. Specifically, this study measured the oxygen consumption rate of C. barnesi medusae, over a range of temperatures, to define the thermal limits of the medusae of this species. Additionally, the effect of temperature on bell contraction frequency (a measure of swimming capacity), which is assumed to be a proxy for physiological performance [42], was quantified to better define the thermal tolerance of this species. Finally, the effect of varying salinity levels on bell contraction frequency was determined to gain insight into the possible environmental parameters that may affect the survival of C. barnesi medusae, and to ascertain the likelihood of medusae entering low salinity conditions to spawn.
2. Materials and Methods
2.1. Specimen Identification
Carukia barnesi is a small species in the family Carukiidae with a bell height of up to 35 mm and tentacles up to 1.2 m long [8,30,32,47,48]. Some of the identifying features of this species include: a single tentacle that extends from each of the four pedalia (i.e., four tentacles in total, one extending from each pedalia); rhopaliar niches with two horns; tentacles that have an alternating pattern of large and small nematocyst crescents that resemble ‘neckerchiefs’; and lack of gastric cirri [30,32,47,48].
2.2. Capture Method
Adult medusae of C. barnesi were collected at night near Double Island, North Queensland, Australia (16°43.5′ S, 145°41.0′ E), between the 28th of January and the 17th of February 2013, following a previously published method [8,19,49]. During these collection trips, the sea surface temperature varied from 27.5 °C to 30 °C, with an average salinity of 35‰. In brief, specimens were attracted to a small vessel with underwater lights. The specimens were collected from the sea surface with a net and transferred into individual 500 mL containers for transport. Prior to experimental trials, all specimens were held overnight in temperature-controlled cabinets at 28 °C ± 0.5 °C [8,19]. All specimen collections were conducted in accordance with Permit Numbers G11/34552.1 and G15/37396.1.
2.3. Experimental Equipment
The ratio between respiration rate, chamber volume, and test animal wet weight (mass) affects the respiration rate of scyphozoan medusae, resulting in a new recommendation of a ratio of >50 mL of water per gram of test animal, and ideally 100 mL of water per gram has been suggested [44]. Following these recommendations, respiration rate chambers of 70 mL volume were used to accommodate C. barnesi medusae that ranged in mass between 0.1 g and 0.7 g wet weight.
A Strathkelvin 929 six-chamber respirometer unit (Strathkelvin Instruments, Motherwell, Scotland, UK), fitted with polyographic membrane-type probes, was used to determine dissolved oxygen concentration at a rate of two measures per second in each chamber. Each respiration measure consisted of six chambers: five chambers containing one specimen in each, and one blank (no specimen) chamber used as a control to compensate for intrinsic factors (i.e., background respiration) and extrinsic factors (i.e., atmospheric and thermal variation). Respiration rate was calculated through linear regression as the change in dissolved oxygen concentration per hour minus the control. All probes were calibrated prior to each experiment using a dual-point calibration method. Zero calibration solution was obtained by mixing a 4% solution of sodium sulphite (Na2SO3), and oxygen saturation was obtained by aerating the test water with room air. Temperature, salinity and atmospheric pressure were recorded and compensated for during calibration. The experimental temperatures were controlled by conducting the respiration experiments in a temperature-controlled water-bath, which maintained each test temperature ±0.3 °C.
2.4. The Influence of Temperature on Respiration Rate
To quantify the effect of temperature on the respiration rate, C. barnesi medusae were exposed to one of seven thermal treatments between 22 °C and 33 °C. During preliminary data analysis, a distinct pattern arose between respiration rate trials that were conducted during the day and those conducted during the night, even though the night trials were conducted under full laboratory lighting. As evidence for diurnal fluctuations in activity have been previously noted in C. fleckeri [14], and shown in C. barnesi [8], the time of the respiration rate trial (night or day) was included as a separate analysis. Explicitly, seven thermal treatments between 22 °C and 33 °C during the day; 22 °C (n = 4), 23.5 °C (n = 4), 25 °C (n = 5), 27.5 °C (n = 14), 30 °C (n = 13), 31.5 °C (n = 5), and 33 °C (n = 4) and four additional thermal treatments between 24 °C and 33 °C at night; 24 °C (n = 4), 27.5 °C (n = 17), 30 °C (n = 13), and 31.5 °C (n = 5). This thermal range was chosen to encompass the temperatures this species is likely to experience in the waters of the Great Barrier Reef, which was then subdivided into 1 °C to 2.5 °C increments in order to provide adequate resolution for analysis and spaced sufficiently to reduce overlap of test temperatures.
Each specimen was transferred from the 28 °C temperature-controlled cabinet to each test temperature at a rate of 2 °C per hour, and were held for one hour at the testing temperature to reach equilibrium with the incubation temperature prior to each experimental trial. Each specimen was then transferred into a respiration rate chamber, which contained oxygen-saturated seawater of the same water quality parameters at the desired test temperature. Each respiration trial was conducted over one to two hours, and each trial was terminated prior to reaching 80% oxygen saturation to reduce the assumed deleterious effects of low oxygen levels. This method was repeated at each test temperature. During preliminary analyses, it was evident that the respiration rate was lower when trials were conducted at night, which was a necessary constraint due to when the specimens were captured. Consequently, nighttime respiration trials were analysed separately to test for circadian and/or endogenous rhythm.
To compensate for the displacement of each specimen within each chamber, which changes the effective water volume, the wet mass of each specimen was subtracted from the known volume of each chamber (70 mL − wet mass g). Jellyfish are known to have a high water content [44,50], and the largest C. barnesi exposed to experiments in this study was approximately 0.7 g (e.g., displaced a maximum of 1% of the chamber volume).
To compare the respiration rate of specimens of different sizes, it was necessary to define the influence of mass on oxygen consumption. Dry mass is considered to be one of the most stable measures of mass for species with high water content [51]; therefore, dry mass was regressed against oxygen consumption at the near-capture site average temperature of 30 °C. The up-scaling respiration mass exponent for cubozoans has not previously been determined, and due to the small variation in mass range in these experiments, the relationship was analysed through linear regression. To compensate for the influence of mass statistically in further analysis, oxygen consumption was divided by the dry mass of the specimen (i.e., μmol O2 g−1 Dry Mass h−1).
Data analysis included a two-way ANOVA with replication to test the effect of temperature and day/night on the mass-adjusted respiration rate of C. barnesi, which was followed by a post hoc LSD to indicate significant differences. As these data were essentially linear between 22 °C and 30 °C, these data were further analysed through linear regression to extrapolate to the minimum temperature for long-term persistence (theoretical zero). Oxygen consumption was regressed against thermal treatments between 22 °C and 30 °C for measures conducted during the day. The equation of best fit was determined and the intercept with zero was calculated along with 95% confidence intervals. We included both linear (regression) and categorical (ANOVA) analyses to develop a better understanding of the broader relationship between temperature and oxygen consumption, and to compare oxygen consumption at the particular rates tested, respectively.
2.5. The Influence of Temperature on Swimming Pulse Rate
To determine how temperature affects bell contraction frequency (i.e., swimming pulse rate) of C. barnesi, 23 specimens were exposed to thermal treatments between 16 °C and 38 °C ± 0.5 °C in two-degree increments. Each specimen was removed from the 28 °C temperature-controlled cabinet in which they were housed in individual 500 mL containers. These containers were then placed into an approximately 100 L water-bath system which maintained each experimental temperature ±0.5 °C. Beginning at 28 °C, temperature was ramped down by 2 °C over one hour. The specimens were then held at each temperature for an additional hour to allow them to reach equilibrium with the test temperature prior to measurement. Each specimen was monitored for 30 to 60 s, and the number of bell contractions was recorded as beats per minute. Measures were only taken while the specimens were actively swimming or pulsing. This process was repeated at each test temperature down to 16 °C. This procedure was then repeated with a new set of specimens where the temperature was ramped up in 2 °C increments starting at 28 °C, concluding at 38 °C.
Specimen size was expected to influence the bell contraction frequency, where smaller specimens were assumed to have a higher standard swimming pulse rate than larger specimens. Therefore, it was necessary to quantify the relationship between bell size and swimming pulse rate prior to analysis. The bell contraction frequencies at near-capture conditions were examined from this trial and ‘the influence of salinity on swimming pulse rate trial’ (explained below) of 28 °C and 35‰. Bell size was determined as niche bell height, a longitudinal measure from the centre of the rhopaliar niche to the apex of the bell (NB). Swimming pulse rate was then regressed against bell size to determine the relationship between these two factors.
We used a non-linear mixed effect modelling approach to evaluate the effect of temperature on the bell contraction frequency of the medusae. The authors wish to note that the term “optimum” used here refers specifically to the “highest” modelled swimming pulse rate (Topt) and does not necessarily represent conditions that are optimal for the animal in situ. In the model, F(T) describes the decline in swimming pulse rate as temperatures depart from optimum as asymmetrical reparametrized polynomials, with monotonic decreases in swimming pulse rate as temperature either increases or decreases from optimum. We allowed increases in temperature to have a different effect on swimming pulse rate than decreases in temperature from optimal such that the performance curve is asymmetrical. Expected swimming pulse rates range from the maximum rate, described by parameter A at the optimal temperature (Topt) to zero at the estimated critical thermal minimum (CTmin) and maximum (CTmax). Because it is unrealistic to have swimming pulse rates with negative values, the model was constrained outside of the inhabitable temperature range, such that temperatures less than the critical temperature minimum and greater than the critical temperature maximum (CTmin and CTmax, respectively) were set to zero. The specific parameterization is described as,
The parameter ej2 describes the distribution of pulse rates among C. barnesi medusae and follows a Gaussian distribution with a mean of zero and a variance of σj2 (i.e., a random effect of individual medusa). This random effect accounts for repeated sampling of the same specimen in different treatments and also accounts for variations in pulse rates between individuals, such as bell size. The parameter eo2 describes the observation error, which we assume follows a Gaussian distribution with a mean of zero and a variance of σo2. The random effect parameter ej2 is only included for values where positive pulse rates are expected. This necessitates the following two assumptions. First, the variation between C. barnesi medusae only occurs within the inhabitable range, and second, the total variation for values with non-zero expected values (σj2 + σo2) is more than the variation for data with values expected to be zero (σo2) (i.e., unequal variance). Evaluation of other distributions for the observation error either provided poorer fits or would not converge due to inability to integrate over the two types of distributions (i.e., the Gaussian specimen random effect and a non-Gaussian experimental error) [52]. The log-likelihood, maximum likelihood estimates, and 95% maximum likelihood confidence limits were calculated for the general non-linear mixed effect model described above using the nlmixed procedure in SAS, version 9.4 [53].
2.6. The Influence of Salinity on Swimming Pulse Rate
To determine how salinity affects the bell contraction rate of C. barnesi, which is essentially a proxy for fitness [42], 120 medusae were exposed to one of eight salinity treatments (i.e., 15 replicates of each salinity treatment) of 20, 23, 26, 29, 32, 35, 38 and 41‰ ± 0.5‰ at 29 °C ± 0.5 °C (ambient temperature). This trial was conducted in 500 mL plastic containers, and the salinity levels were lowered by adding reverse osmosis water to seawater collected from the capture site (salinity at the capture site was 35‰ ± 0.5‰). Salinity was increased by adding aquarium grade sea salt. Each specimen was removed from its transport container and placed directly into the specific salinity treatment. This experiment was designed to test the response to acute salinity changes, which may happen near river mouths when rainfall events occur. The pulse rate of each individual was then measured after 24 h exposure. All pulse rate measures were conducted following the same protocol presented above. To determine the effect of salinity on the bell contraction frequency of C. barnesi medusae, the data were interpreted through piecewise regression with two change points. We assumed a negative binomial distribution to account for overdispersion typical of count data [52] (i.e., the pulse rate data were measured as integers). We also assumed the slope before and after the change points to be zero. The slope between the two change points was determined by the change point values. This approach was compared to various linear and non-linear models, and the piecewise regression provided the best explanation of these data. We further evaluated the best fit model by comparing it to an alternative model that assumed a constant pulse rate irrespective of salinity and analysed the model fits through a likelihood ratio test assuming a chi-squared approximation of the log-likelihood ratio. These analyses were conducted in the statistical package R, version 3.2.4 [54,55].
3. Results
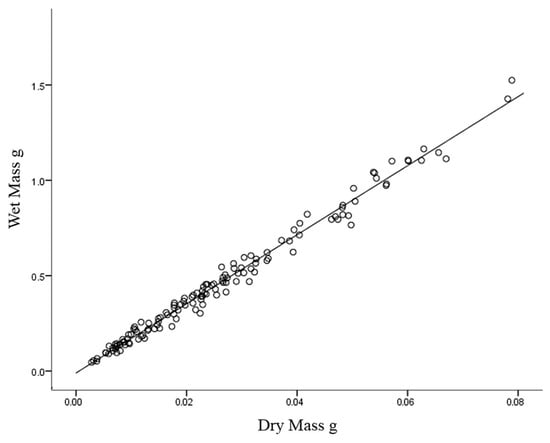
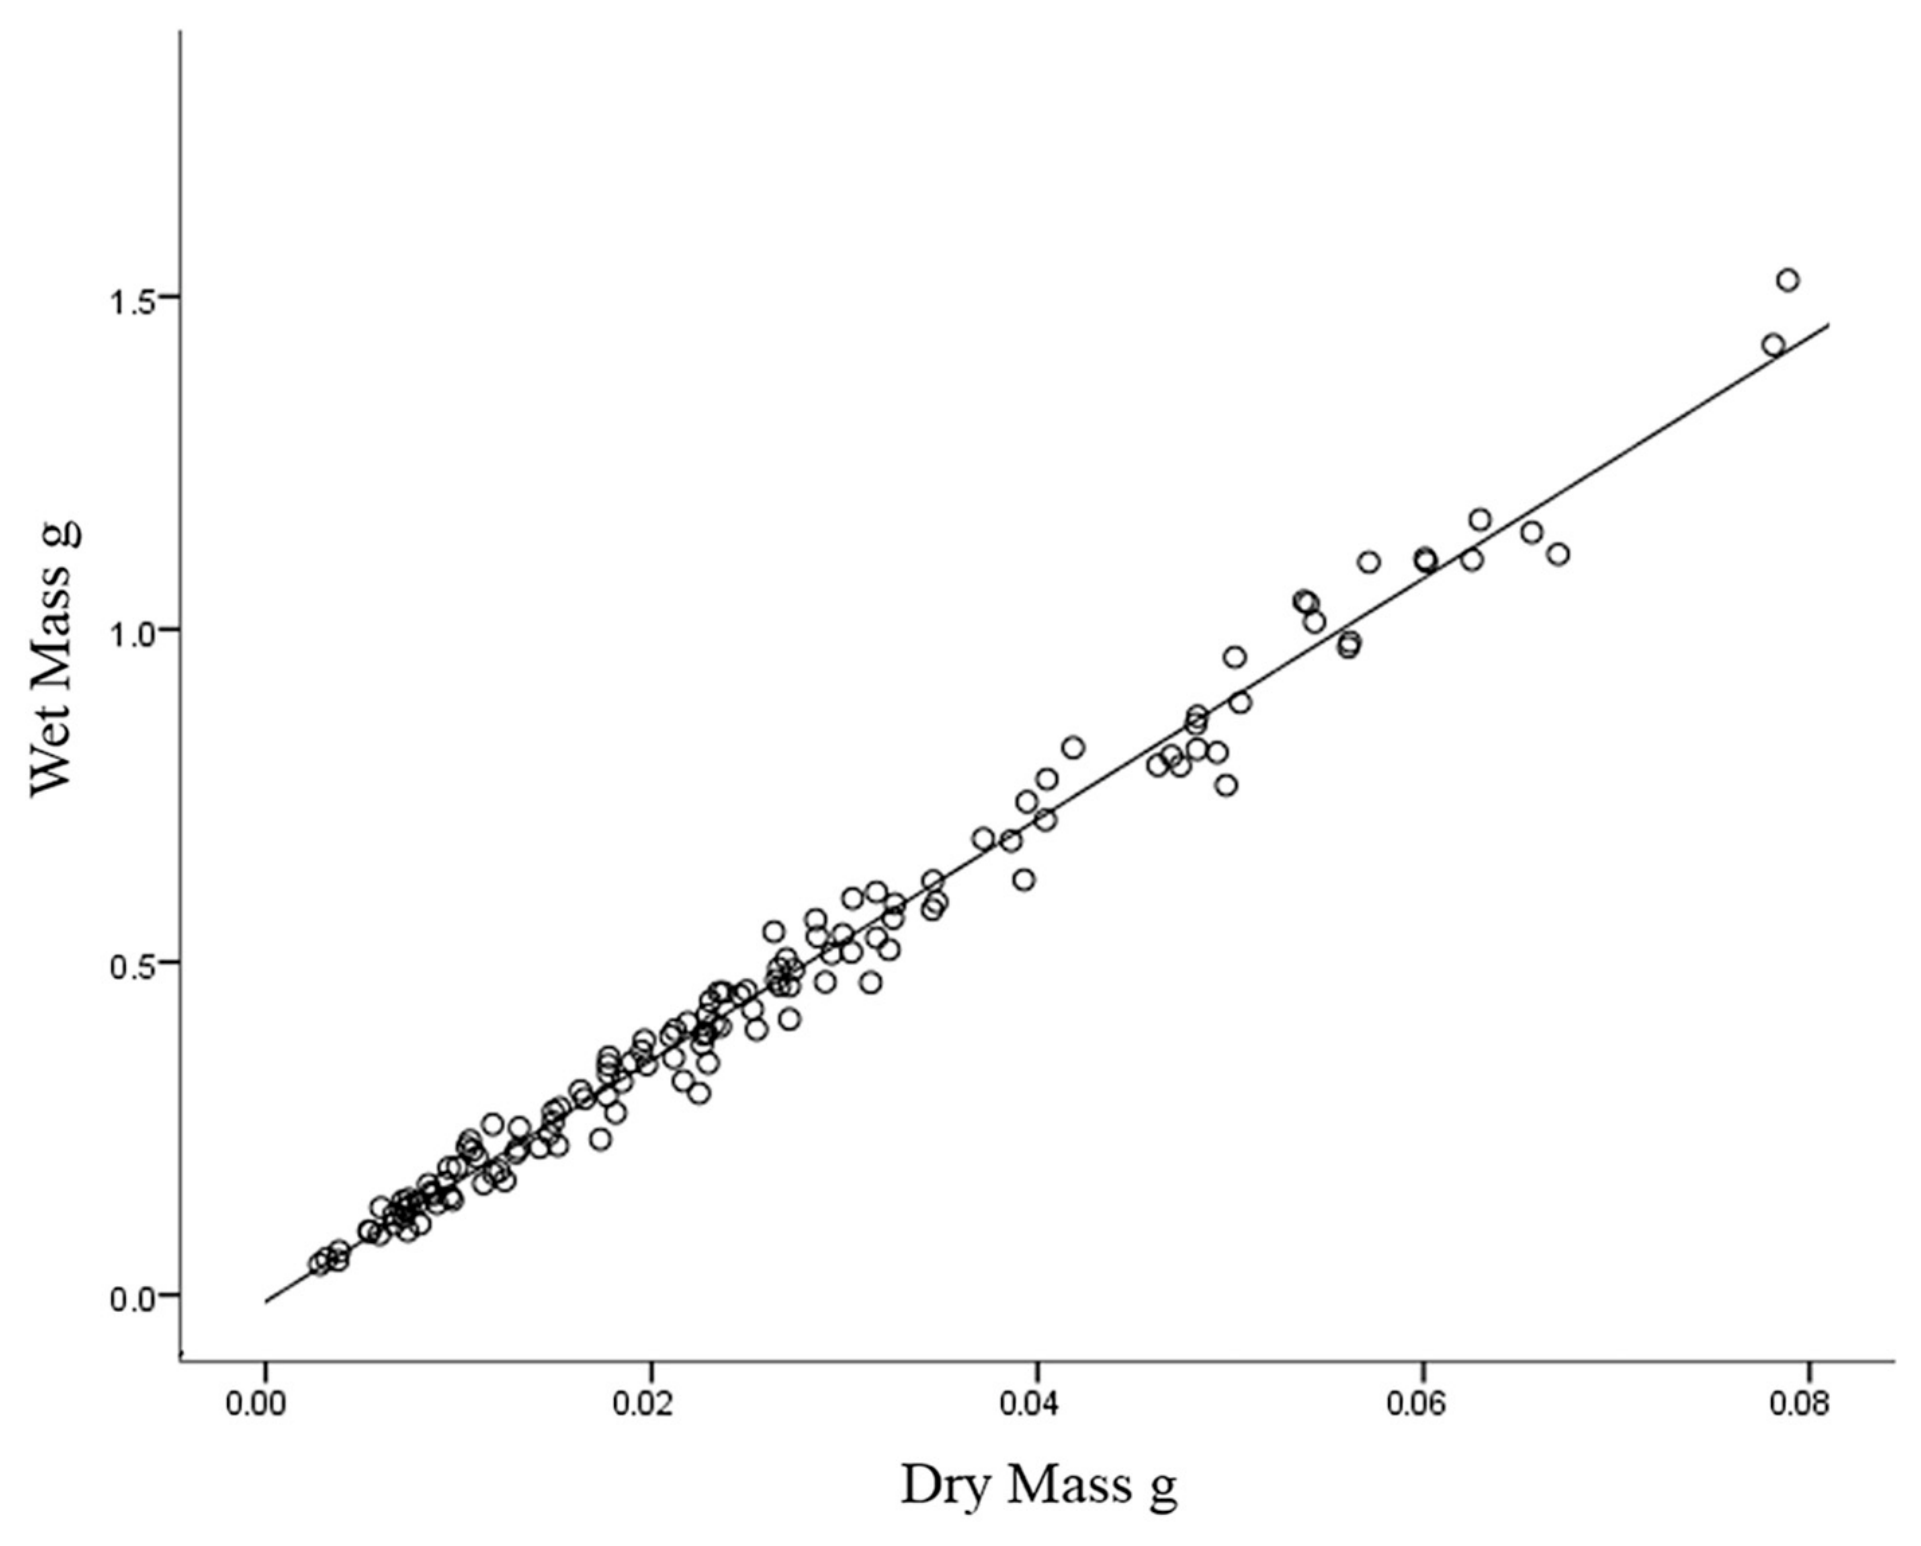
Regression analysis revealed that wet mass was positively correlated with dry mass of C. barnesi (R2 = 0.986, F1,131 = 8962.71, p < 0.001) with wet mass explaining 98.6% of the variance of dry mass. The linear equation of best fit was [Wet Mass (g) = (9.8 × 10⁻³) + 18.11 × Dry Mass (g)] (see Figure 1). The water content of C. barnesi was also calculated as the percentage change between wet mass and dry mass for each specimen and the average water content was 94.3% water (n = 133, = 94.3%, SD = 0.6%).
Figure 1.
The relationship between wet mass and dry mass for Carukia barnesi medusae. Linear regression explained 98.6% of the variance between wet mass and dry mass (n = 133).
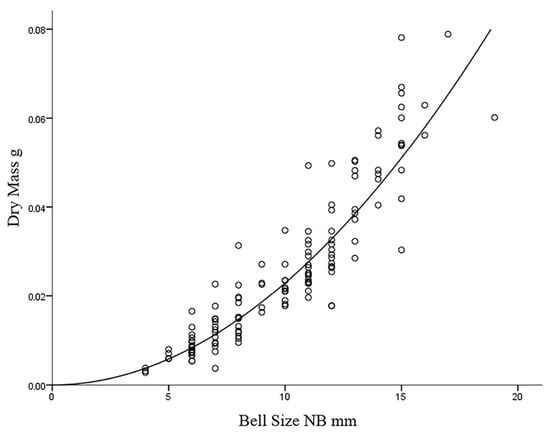
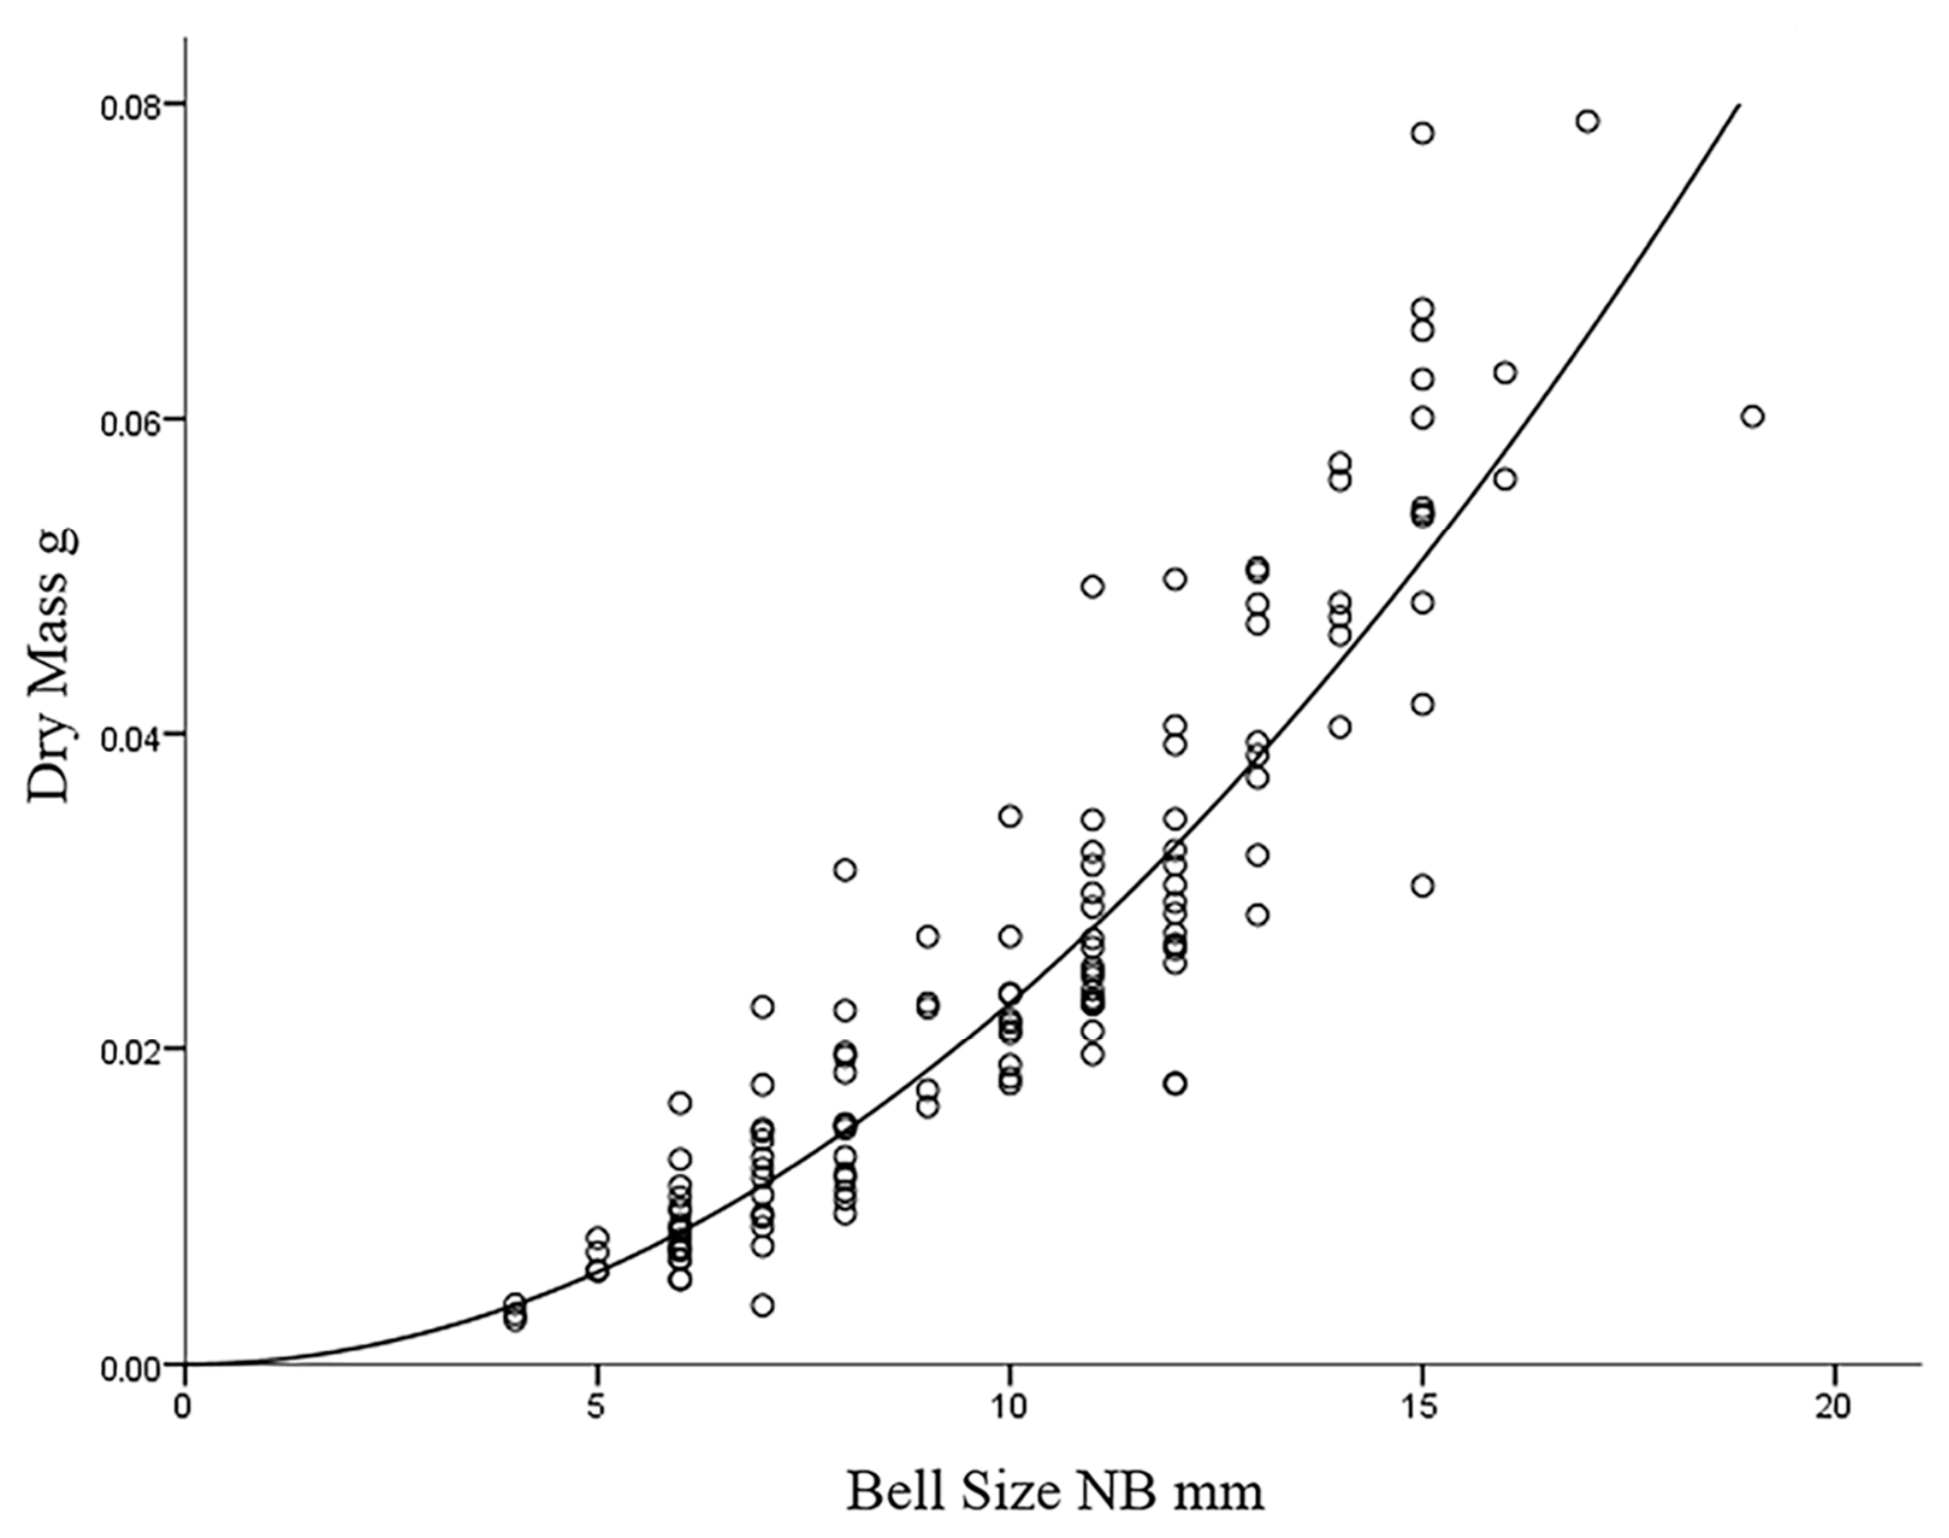
Dry mass was positively correlated with bell size. Curve estimation revealed the equation of best fit was a power curve, specifically [Dry Mass (g) = (2.44 × 10⁻⁴) (bell size1.97 NB mm)] (see Figure 2). The curvilinear relationship was statistically significant (R2 = 0.867, F 1,131 = 851.68, p < 0.001) with dry mass explaining 87% of the variance of bell size.
Figure 2.
The curvilinear relationship between dry mass and bell size for Carukia barnesi medusae. Curve estimation revealed that a power curve explained 87% of the variance between dry mass and bell size (n = 133). Bell size was determined as niche bell height, a longitudinal measure from the centre of the rhopaliar niche to the apex of the bell (NB).
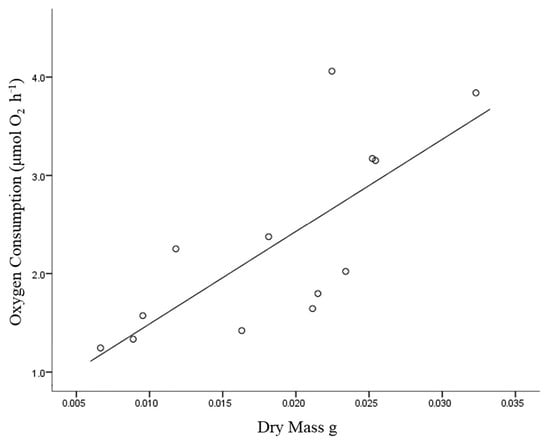
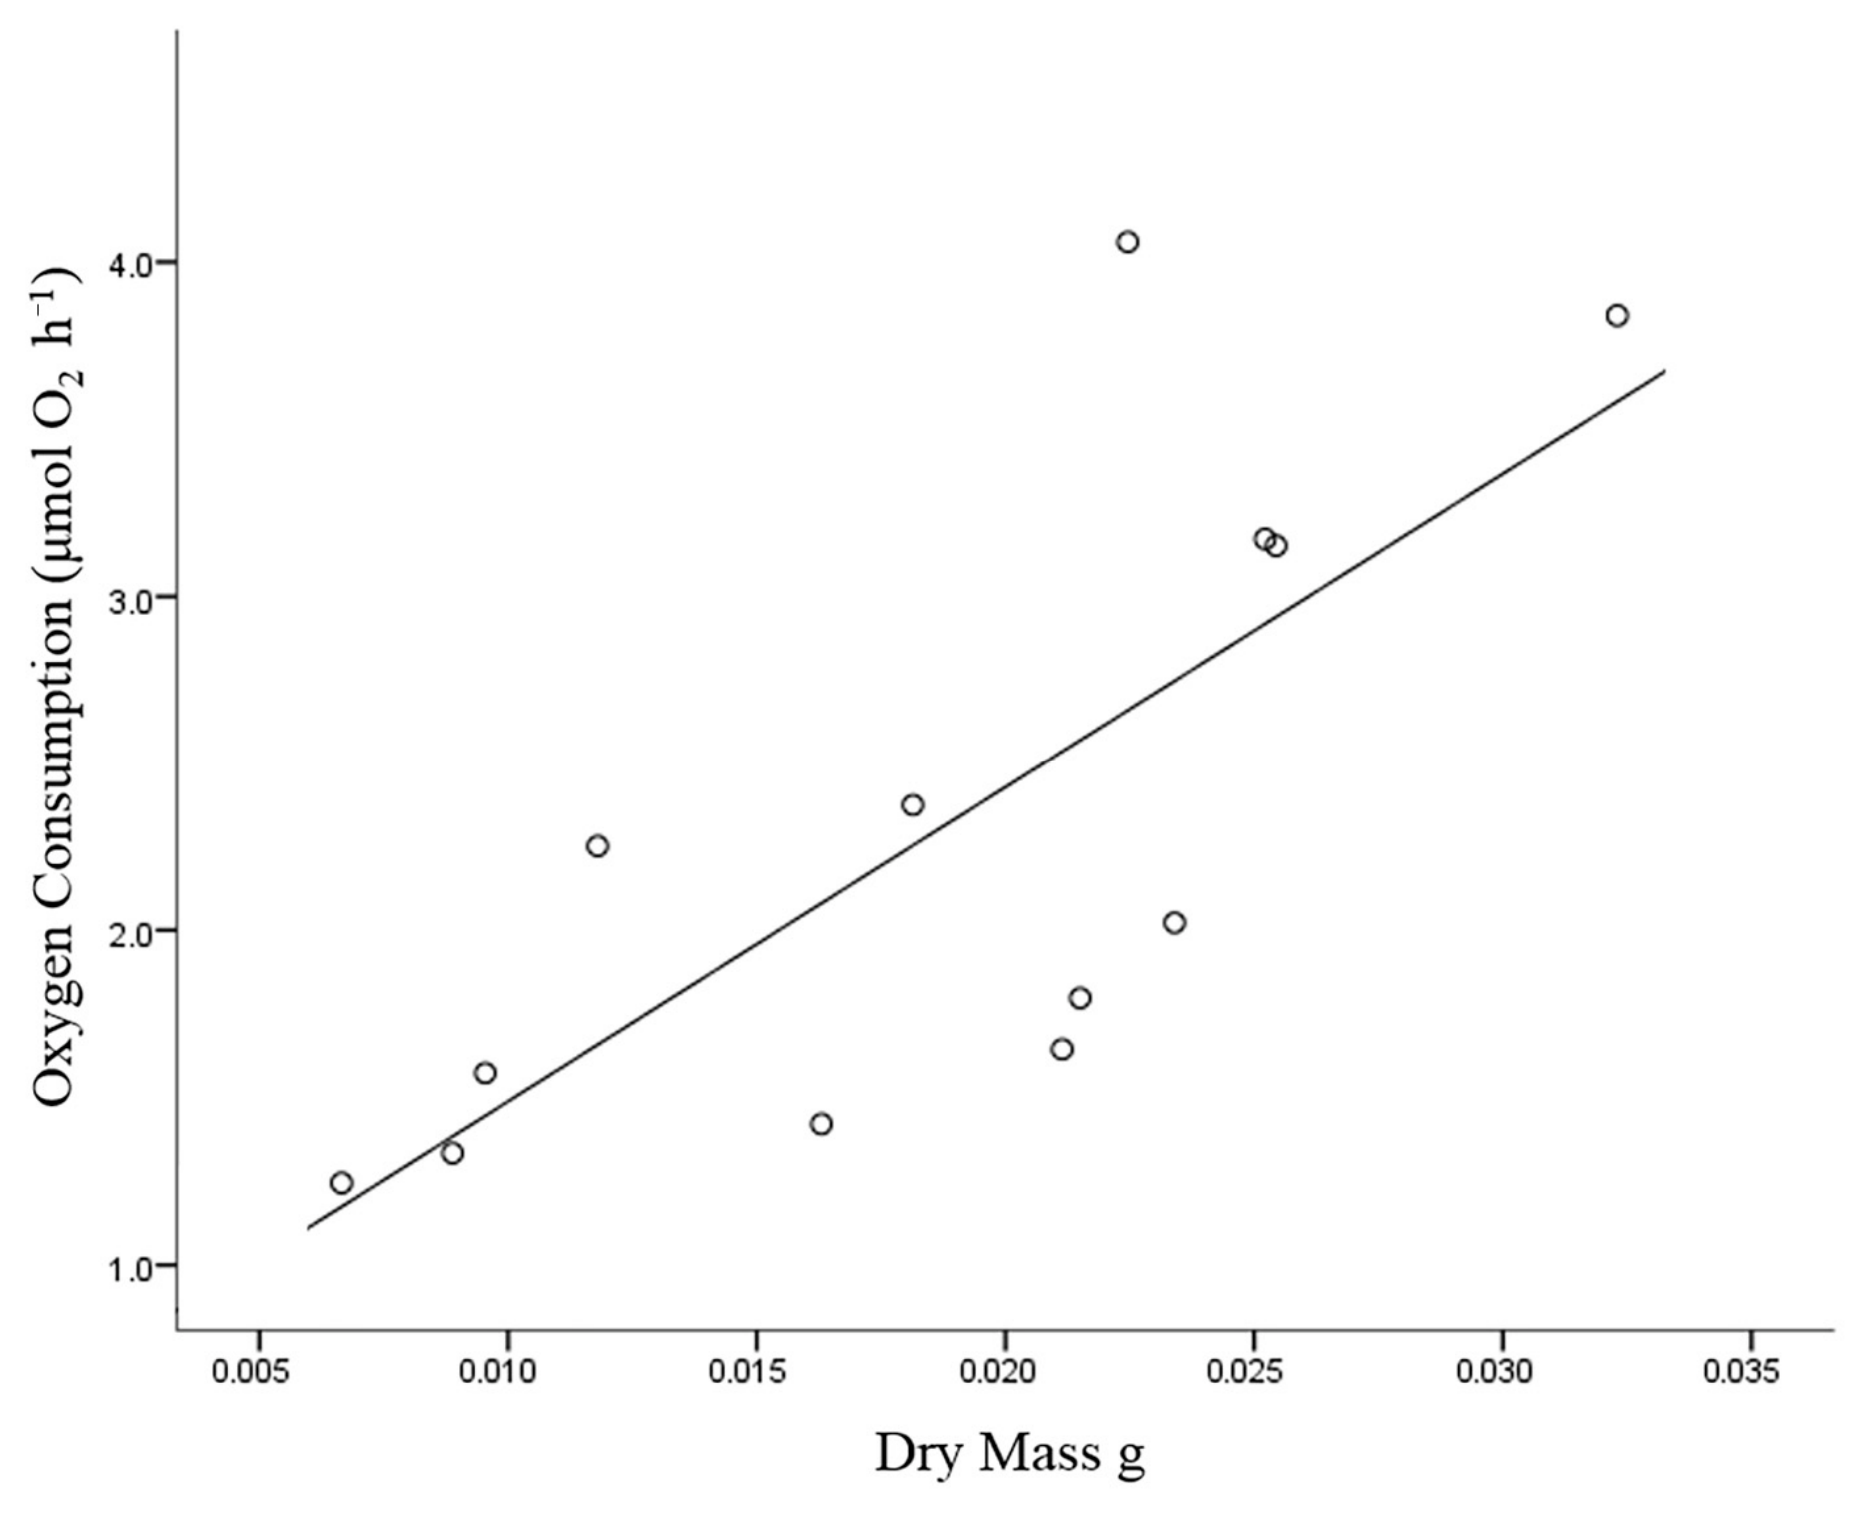
The relationship between oxygen consumption and dry mass was determined through linear regression, which revealed a statistically significant positive relationship (R2 = 0.559, F1,11 = 13.961, p = 0.003). This indicates that mass explains 56% of the variance in oxygen consumption over the tested size range, and is described by the equation [Oxygen Consumption (μmol O2 h−1) = 0.55 + 93.91 × Dry Mass (g)] (see Figure 3).
Figure 3.
The relationship between oxygen consumption and dry mass of Carukia barnesi medusae. The oxygen consumption of 13 C. barnesi medusae of different dry mass.
3.1. The Influence of Temperature on Respiration Rate
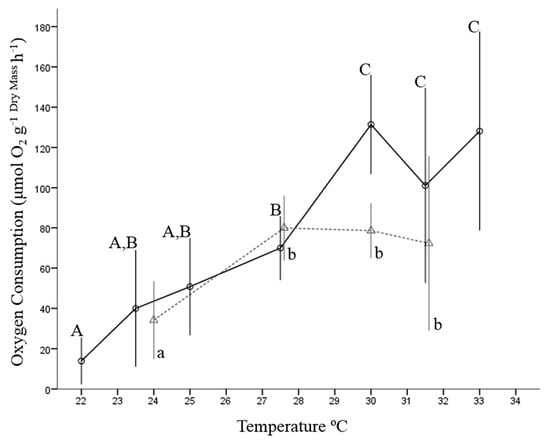
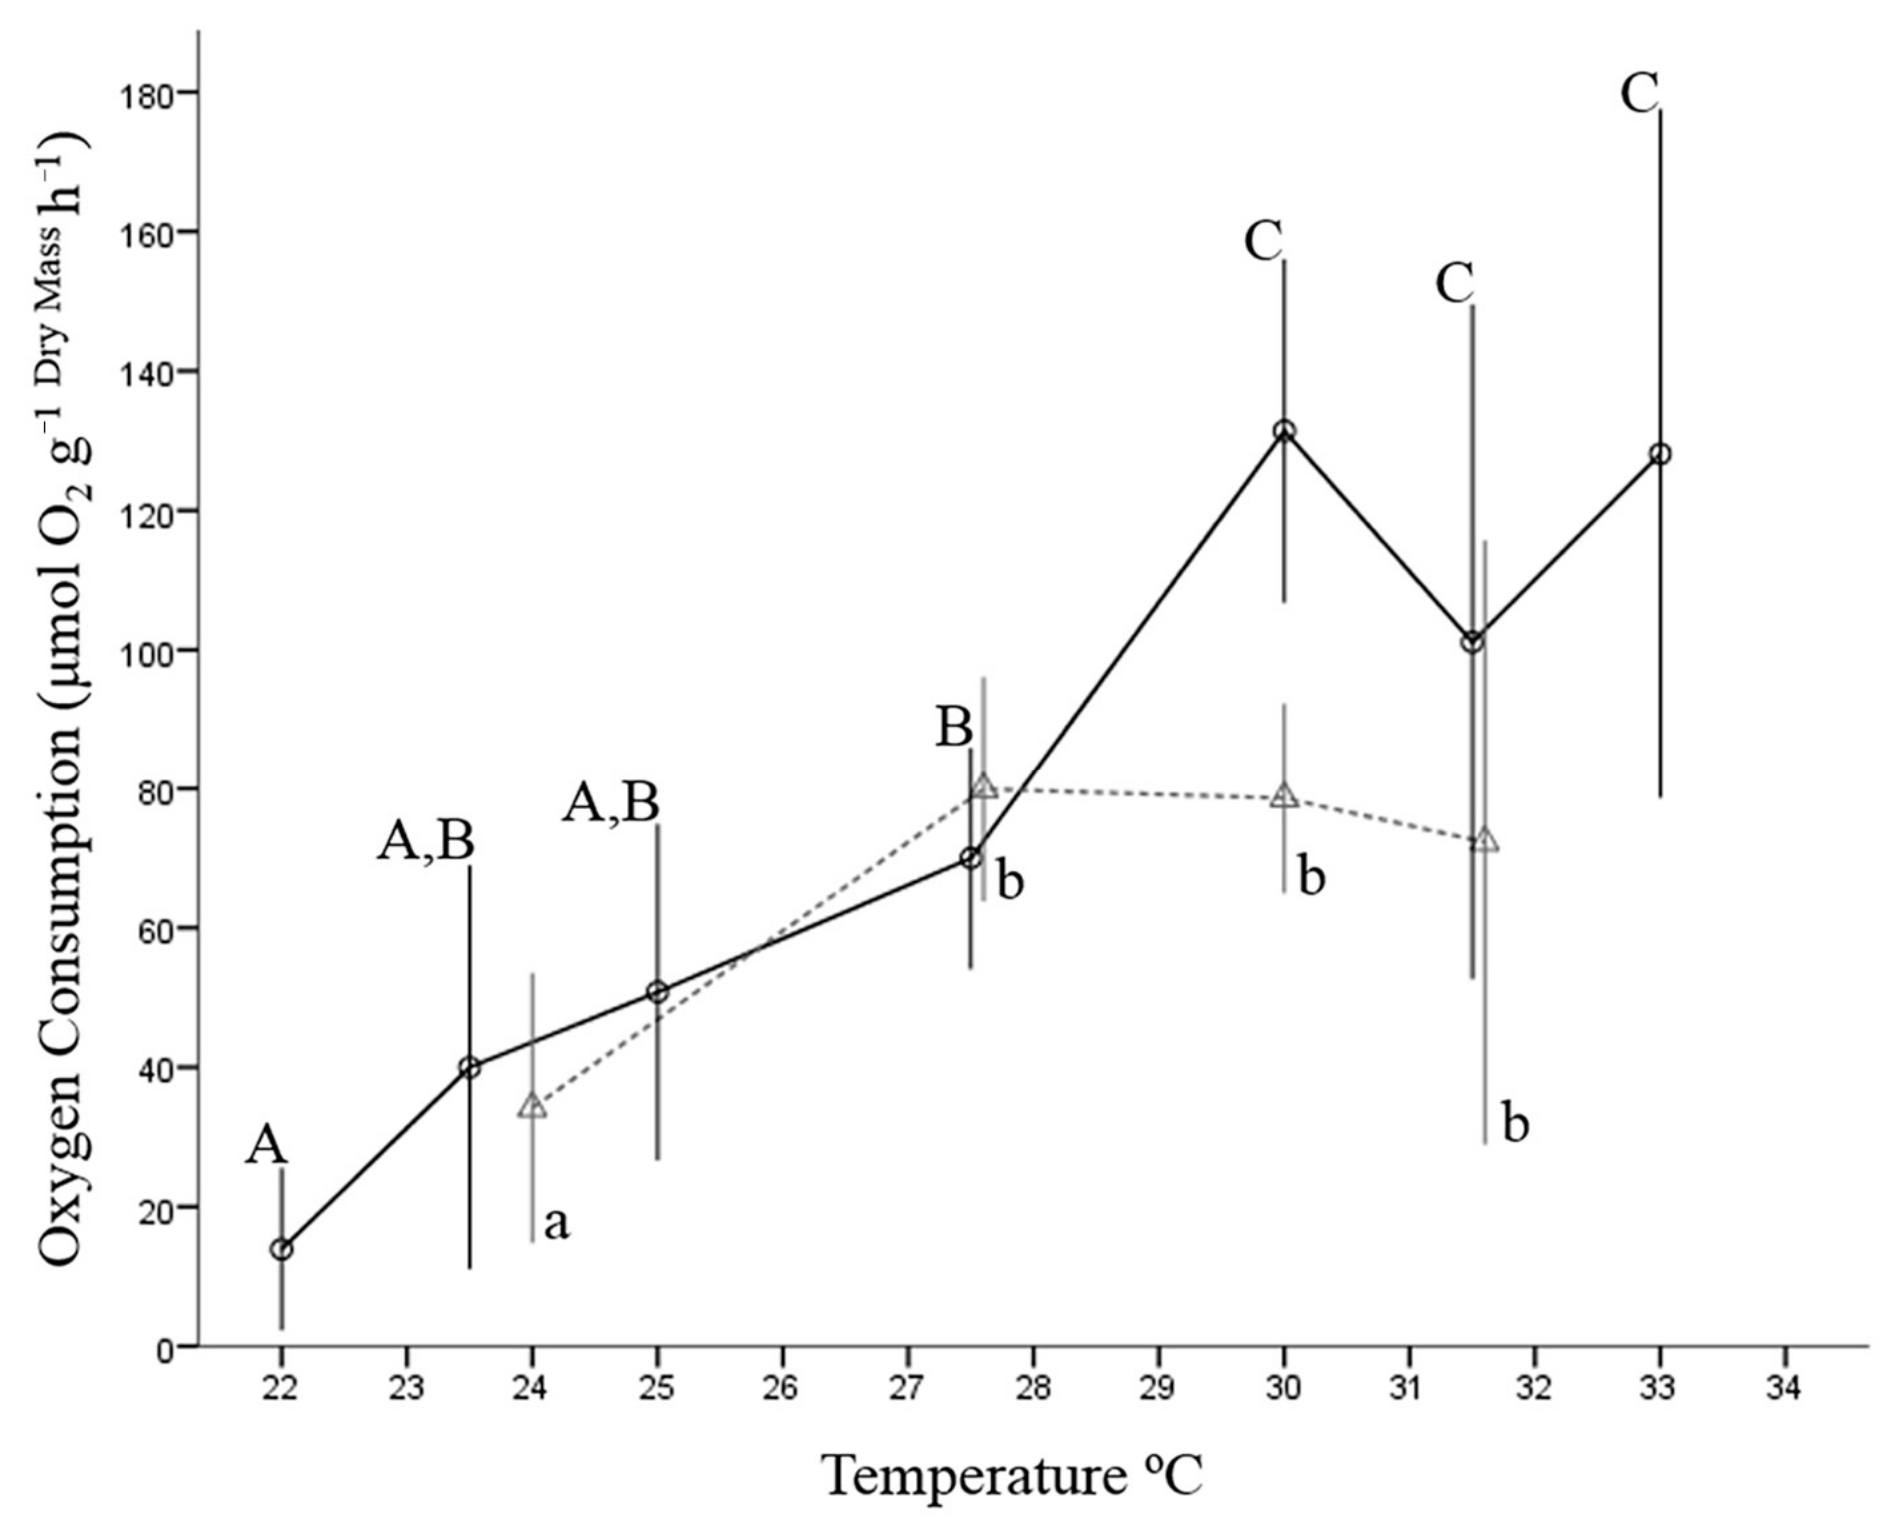
Oxygen consumption per gram dry weight was significantly affected by temperature, both during the day (F6,42 = 12.495, p < 0.001), and at night (F3,35 = 3.096, p = 0.039). The respiration rates were similar between the day and night between 25 °C and 27.5 °C; however, they were dissimilar between 30 °C and 32 °C, where the night measures were suppressed compared to those recorded during the day. The highest respiration rates were recorded between 30 °C and 33 °C during the day, which were not significantly different from each other. Below 30 °C, during the day, the oxygen consumption rate decreased with a relatively linear trend to the lowest recorded measure at 22 °C (see Figure 4).
Figure 4.
Mass-adjusted oxygen consumption of Carukia barnesi medusae at different temperatures. Respiration rate trials were conducted during the day (Black Circles) and at night (Grey Triangles). Corresponding letters indicate non-significant differences at alpha 0.05. Overlapping error bars at 27.5 °C and 31.5 °C have been offset horizontally for error bar presentation. Error bars represent 95% confidence intervals, solid and dashed lines represent interpolation between means.
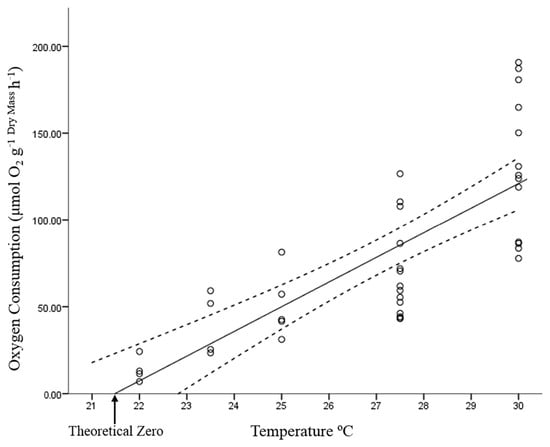
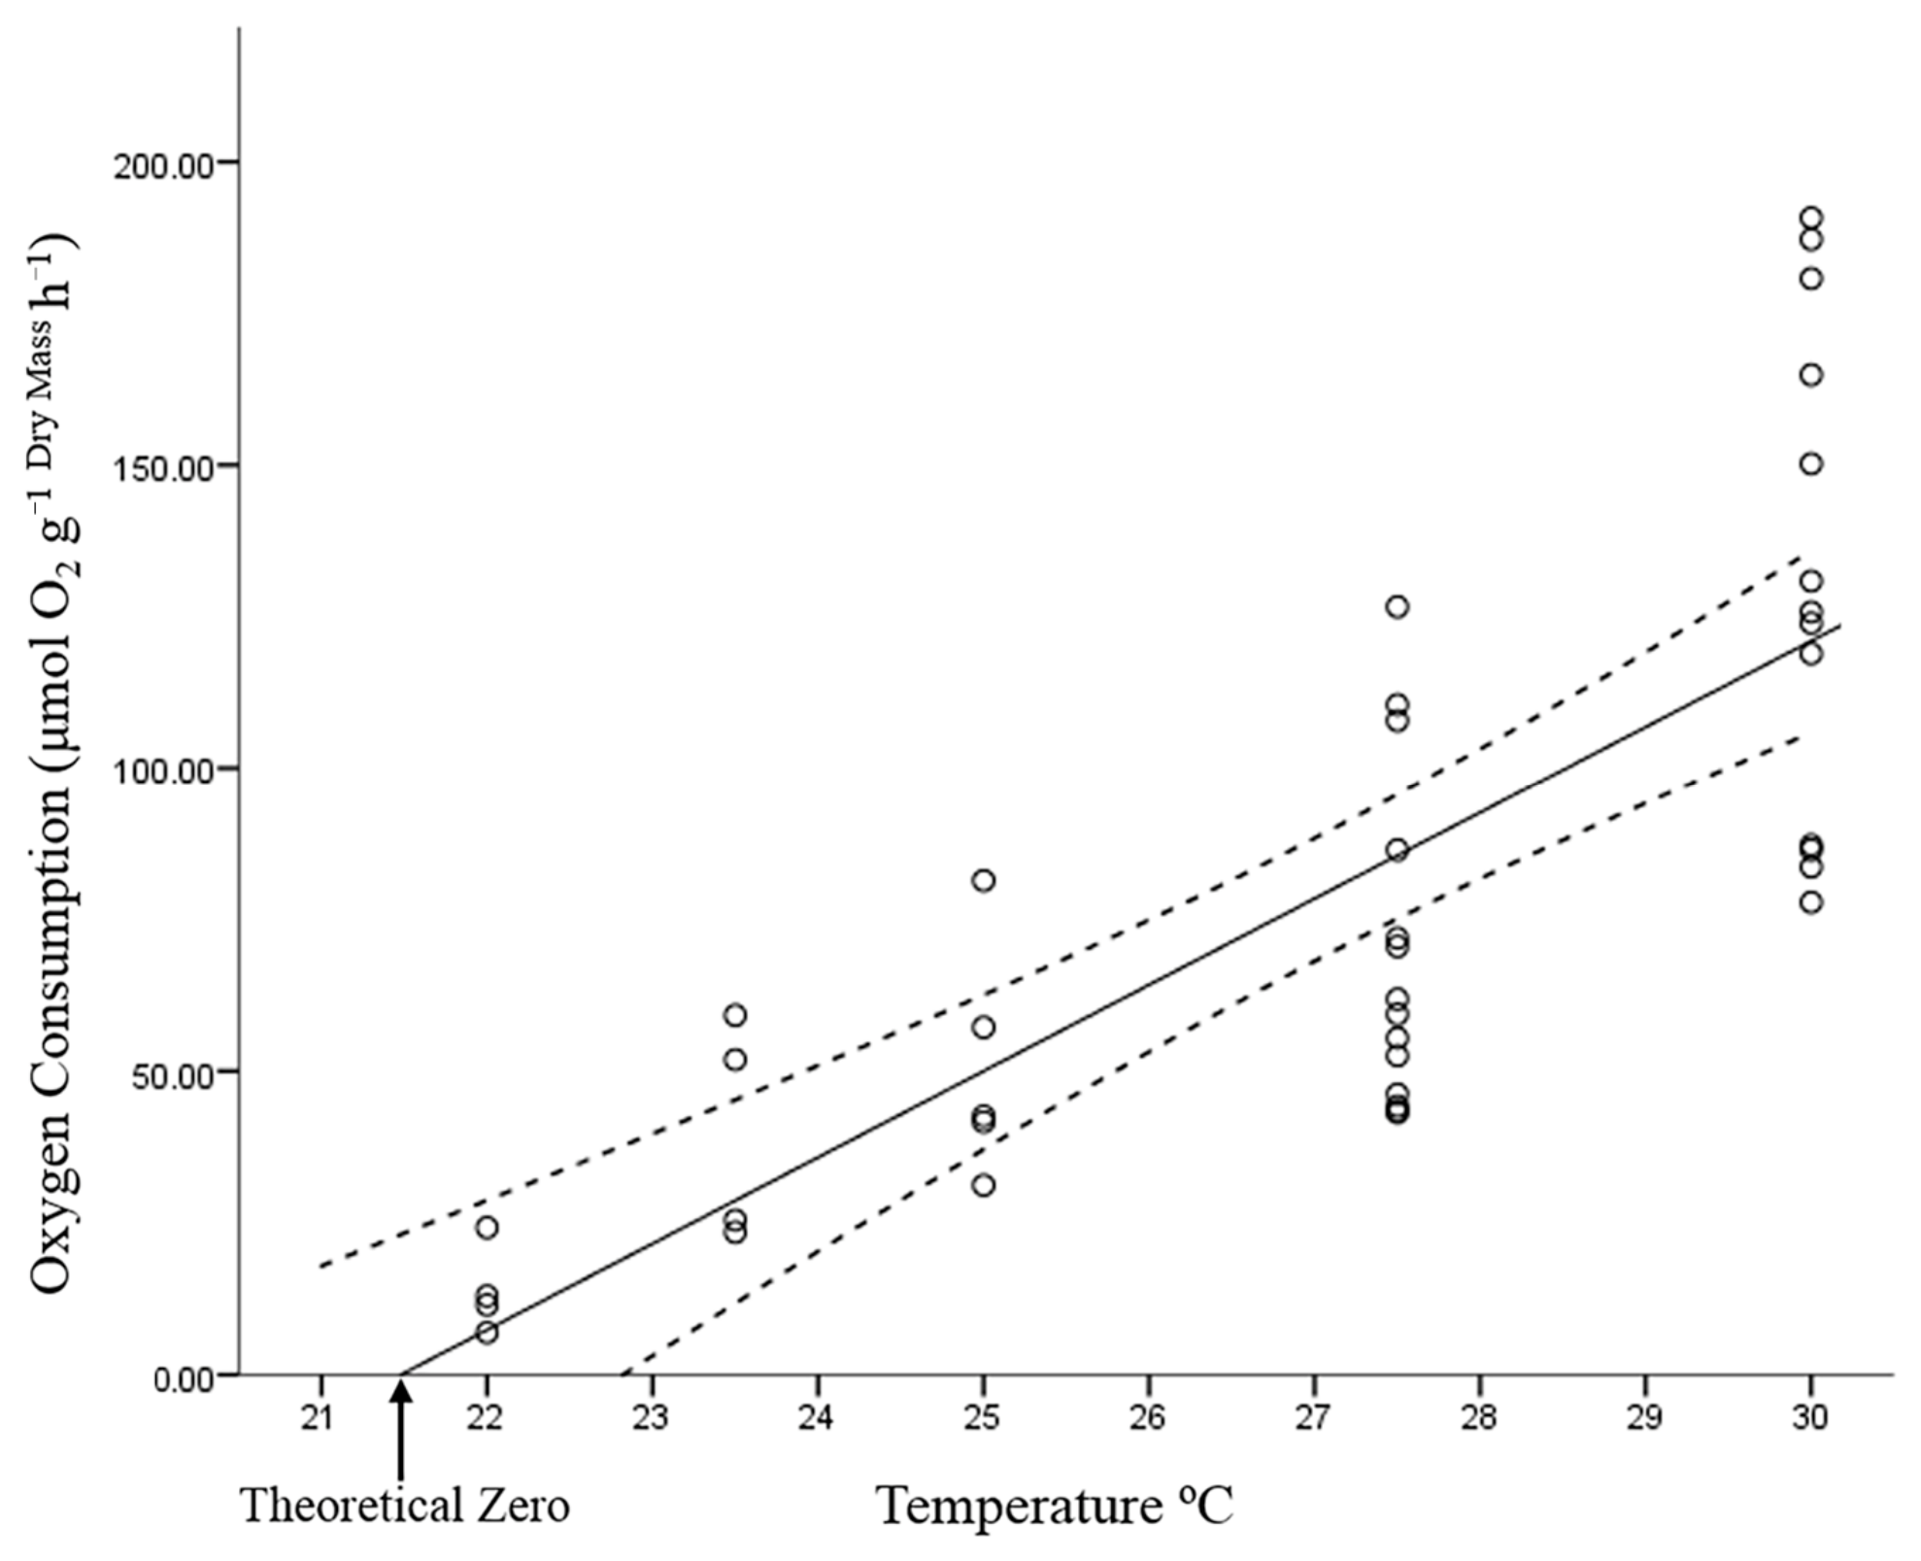
To determine the theoretical minimum thermal threshold of C. barnesi medusae, the mass-adjusted oxygen consumption was further analysed by selecting only respiration measures obtained during the day and from treatments of less than 30 °C. These data were then analysed via linear regression, which revealed a statistically significant positive linear relationship between oxygen consumption and temperature (R2 = 0.606, F 1,38 = 58.454, p < 0.001) (see Figure 5). The equation that describes this relationship is [Oxygen Consumption (μmol O2 g−1 Dry Mass h−1) = −305 + 14.2 × Temperature (°C)], which was used to extrapolate to the x-axis intercept as theoretical zero (21.48 °C). Although theoretical zero (theoretical biological zero) has no biological significance to the animal, it may be used as an approximation of temperatures which are becoming too cold for long-term persistence [51].
Figure 5.
Mass-adjusted oxygen consumption of Carukia barnesi medusae at different temperatures during the day. Raw values used to generate the fit line to theoretical zero which is explained by the equation [Oxygen Consumption (μmol O2 g−1 Dry Mass h−1) = −305 + 14.2 × Temperature (°C)], which has an x-axis intercept of 21.48 °C. Linear regression explains 61% of the variation. Dashed lines indicate 95% confidence limits.
3.2. The Influence of Bell Size on Pulse Rate
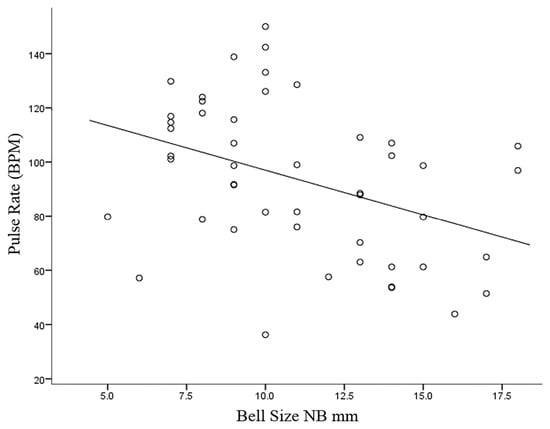
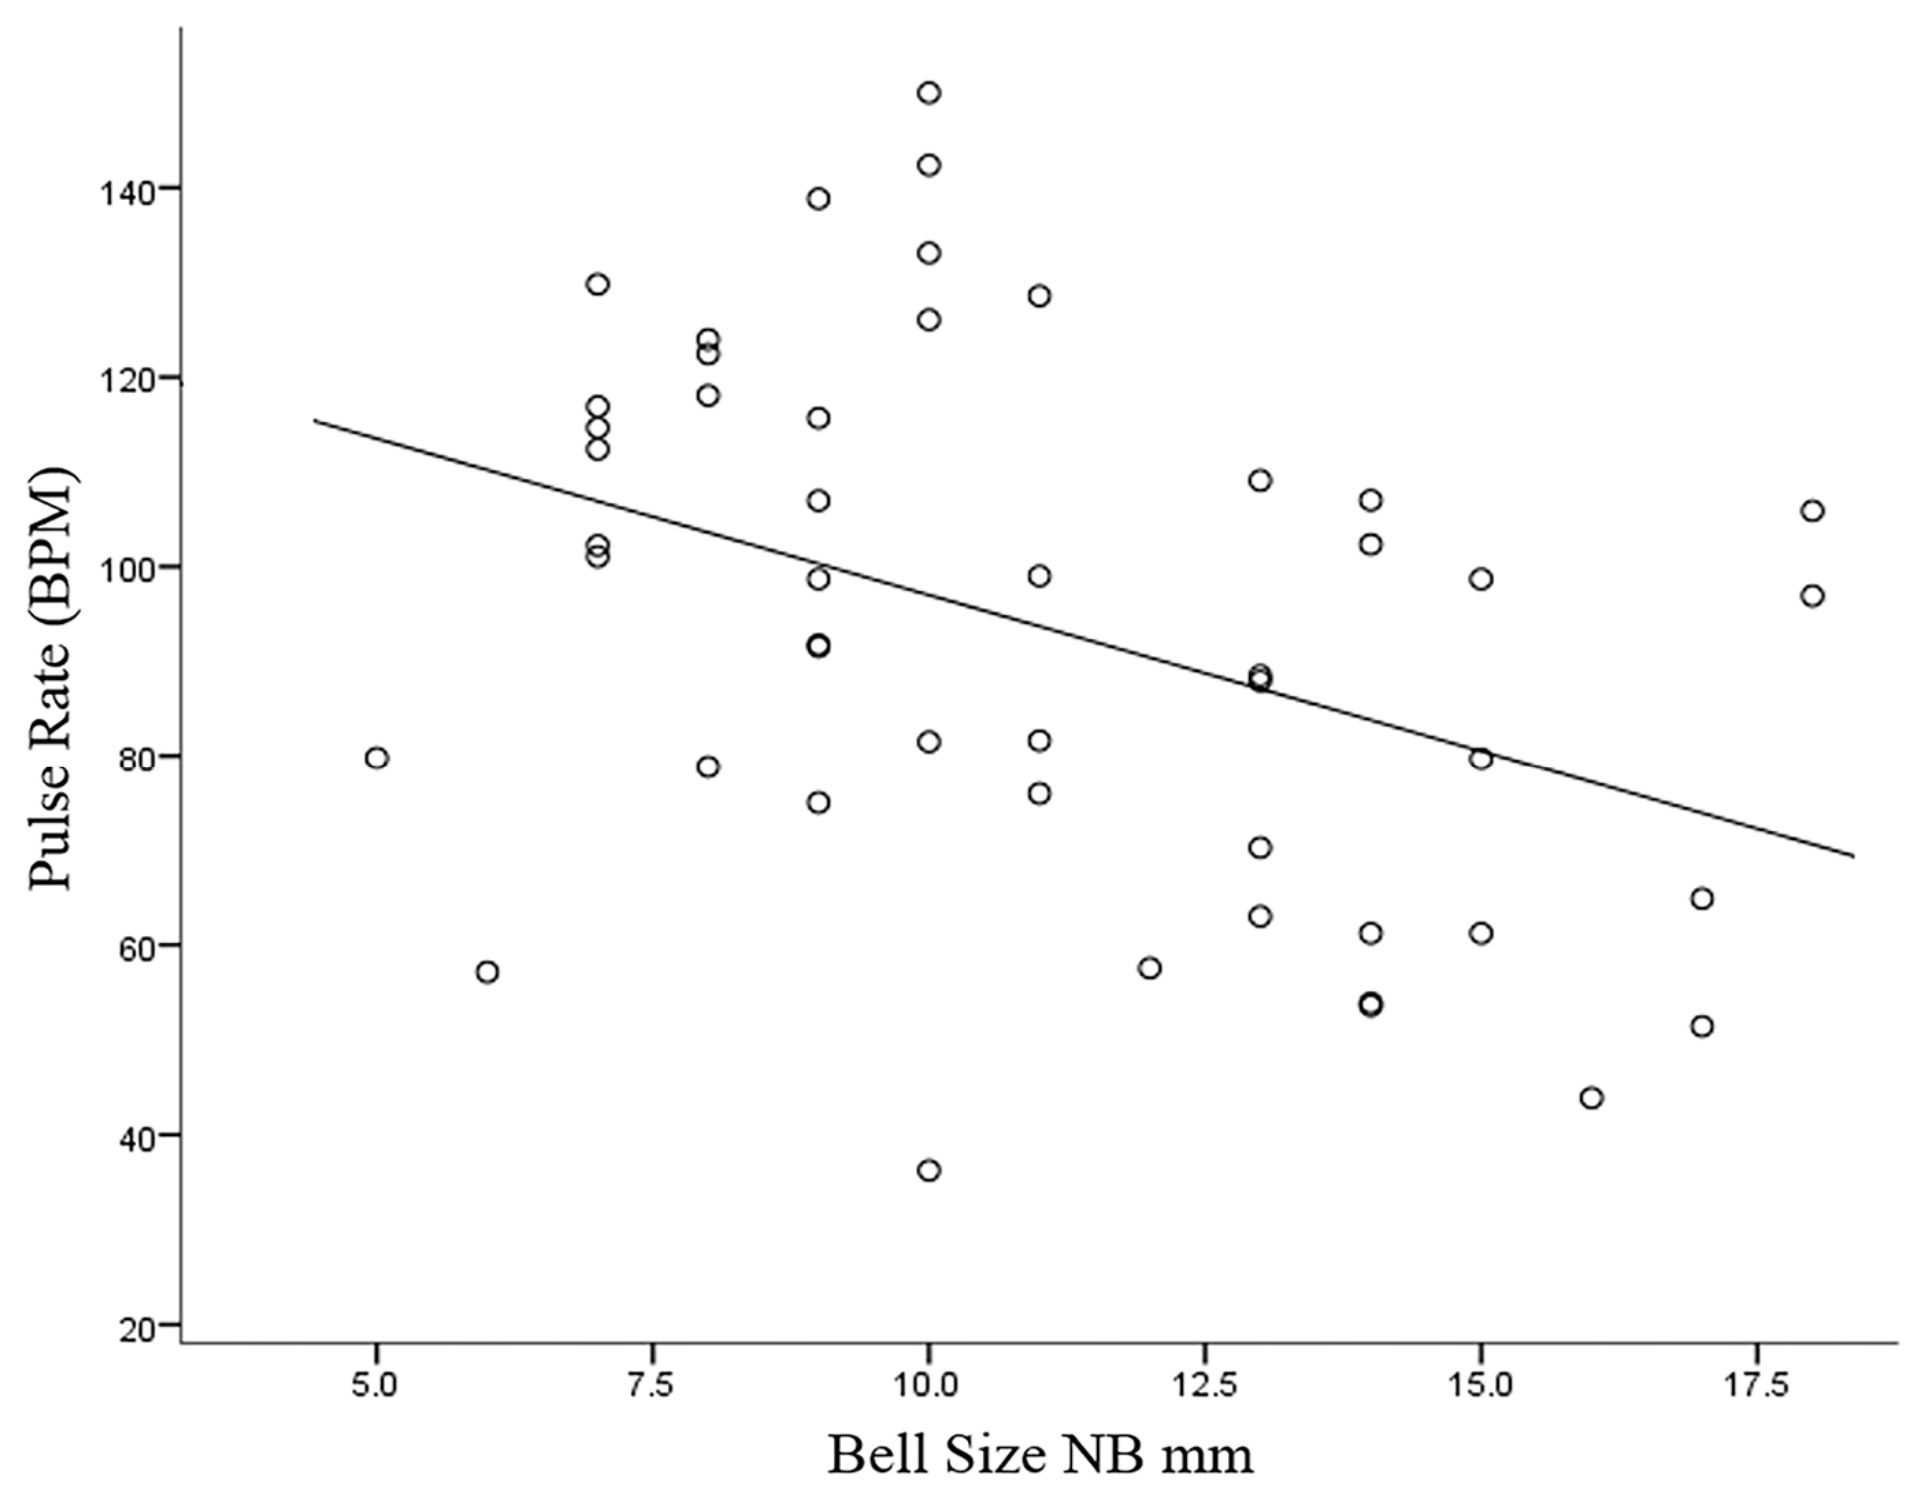
A linear regression was conducted to quantify the relationship between bell contraction frequency and bell size. There was a statistically significant negative relationship between the pulse rate of C. barnesi medusae and size (R2 = 0.157, F 1,46 = 8.55, p = 0.005), where small specimens had a higher standard pulse rate than larger specimens (see Figure 6). Over the tested size range, 16% of the variation in pulse rate was explained by bell size, and this relationship was explained by the equation [Pulse Rate (BPM) = 130 − 3.3 × Bell Size (NB mm)]. This result indicates that although size has a statistically significant effect on pulse rate, it only explains 16% of the variance over the tested size range.
Figure 6.
The relationship between pulse rate and bell size for Carukia barnesi medusae. Pulse rate was recorded as beats per minute (BPM) for 48 C. barnesi medusae to determine the relationship between pulse rate and bell size. Bell size was determined as niche bell height, a longitudinal measure from the centre of the rhopaliar niche to the apex of the bell (NB).
3.3. The Influence of Temperature on Pulse Rate
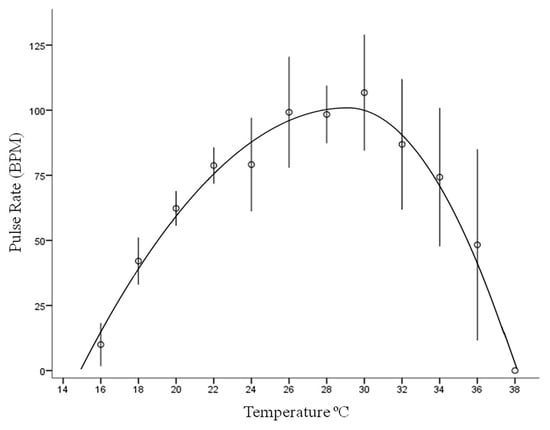
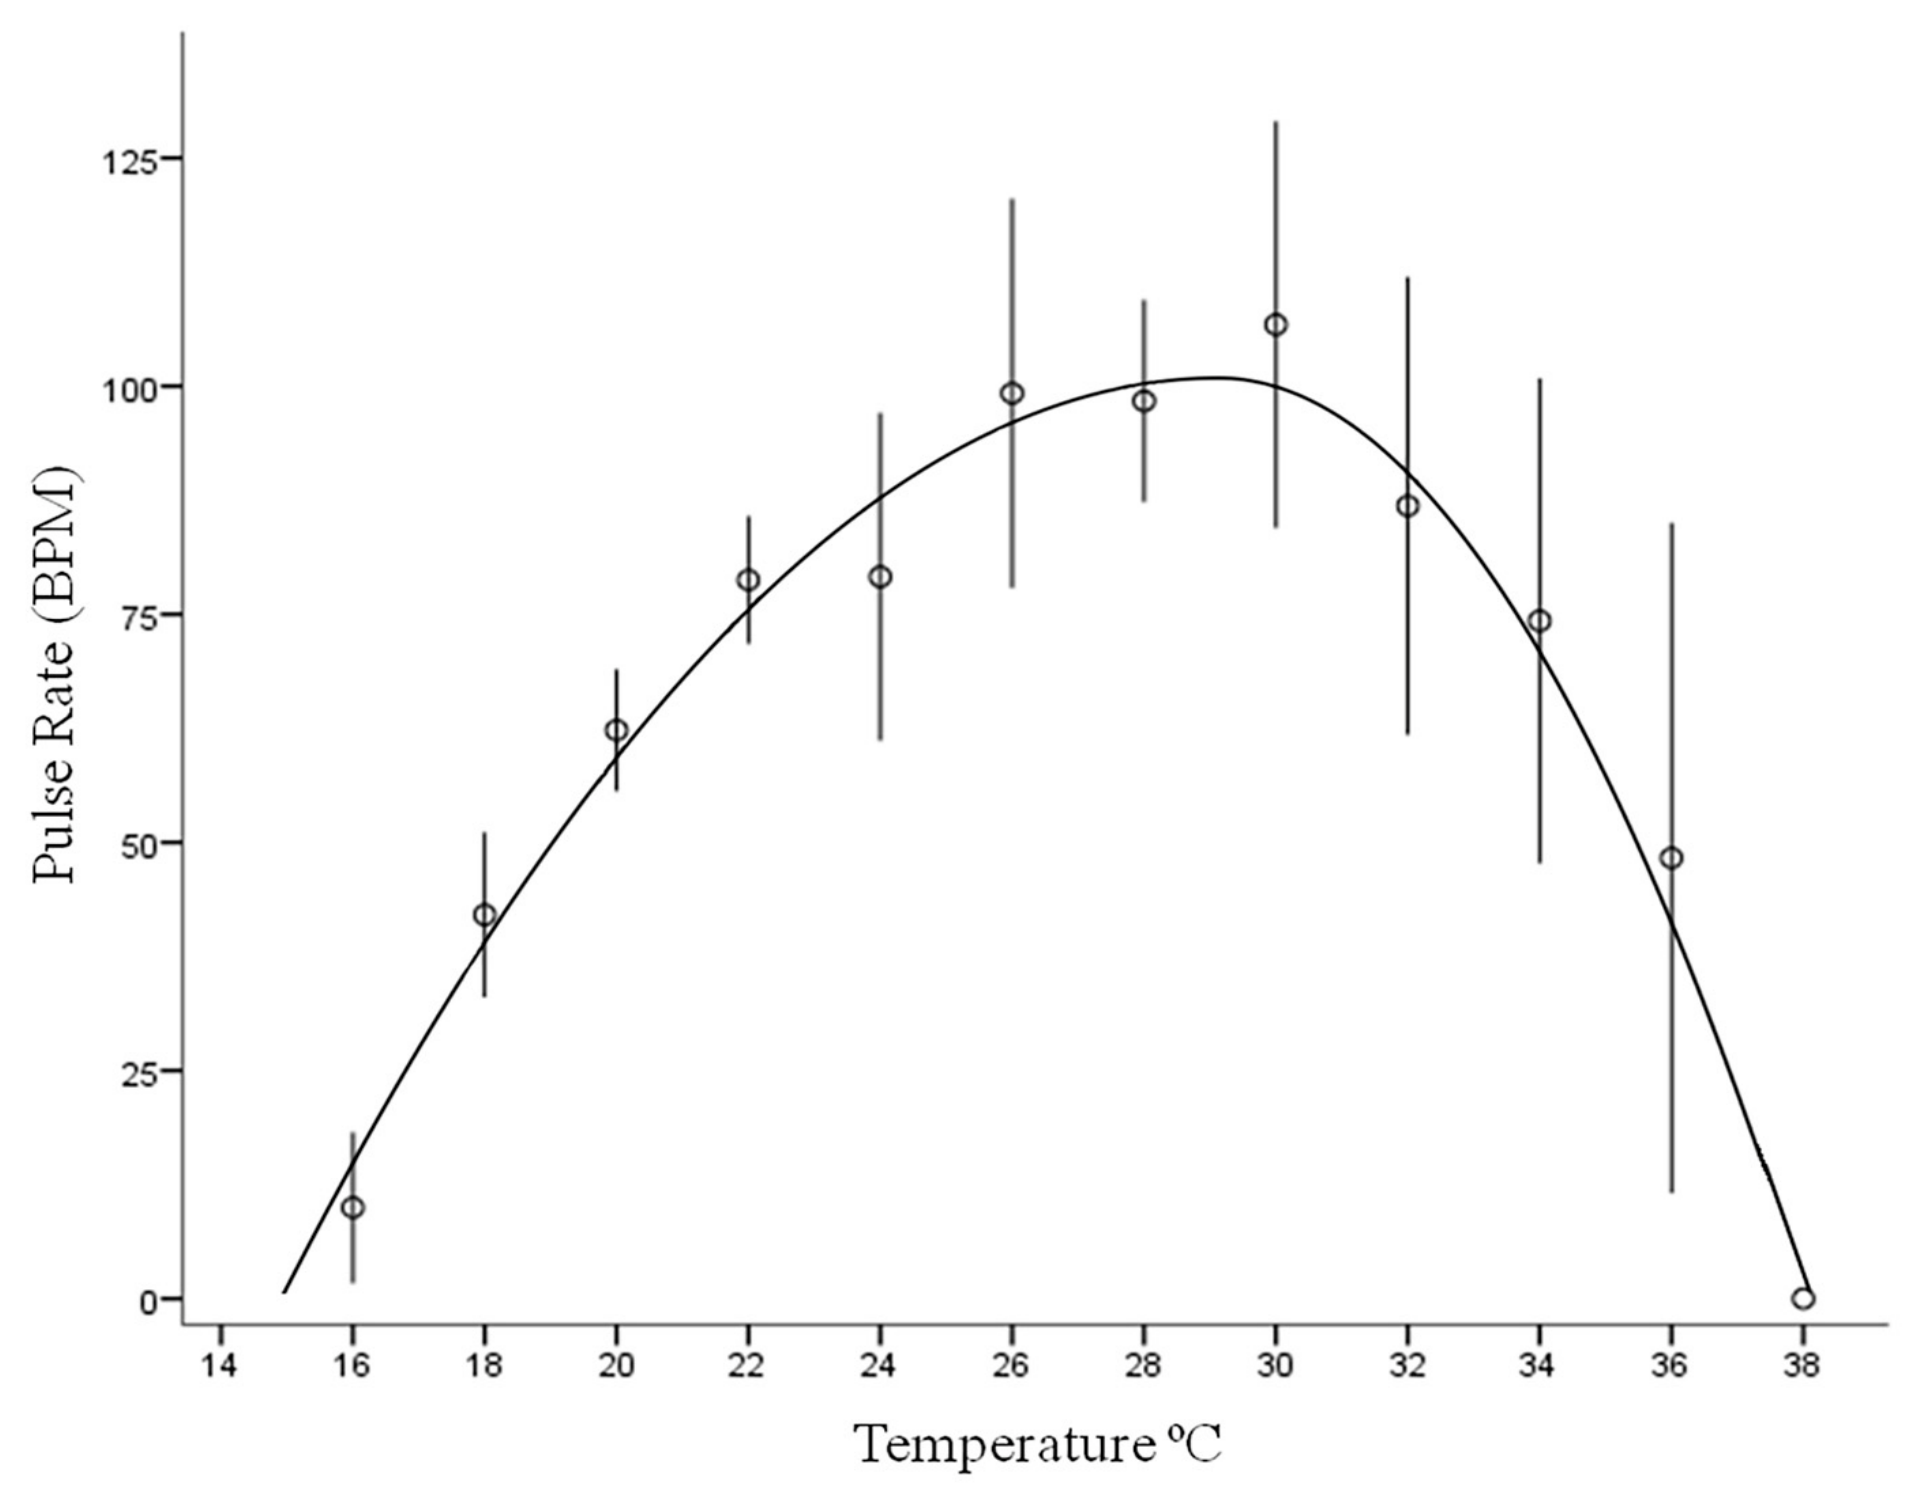
The optimum temperature (Topt) for bell contraction frequency was estimated as 29.18 °C where maximum pulse rate was estimated at 102 beats per minute. The 95% confidence limits associated with the optimum temperature indicates that the optimum temperature is between 27.46 °C and 30.9 °C (see Table 1 in conjunction with Figure 7). The bell contraction frequency of C. barnesi medusae decreased as temperature deviated from optimum, reaching zero at the critical lower thermal threshold (CTmin) at 14.96 °C and the critical upper thermal threshold (CTmax) at 38.11 °C. Temperatures above CTmax were associated with 100% mortality. There was no significant variation in the pulse rate between individual experimental medusae (σj2 as described in Equation (1)), which also implies that, after accounting for temperature, individual characteristics, such as bell size, did not contribute to significant variation in pulse rate.
Table 1.
Maximum likelihood estimates and confidence intervals for parameters describing the bell contraction frequency of Carukia barnesi medusae modelled as a function of temperature.
Figure 7.
The influence of temperature on the pulse rate of Carukia barnesi medusae. Values are presented as means and error bars represent 95% confidence intervals. Model output (solid line) describes pulse rate as a function of temperature as described in Equation (1). The decline in pulse rates as temperatures depart from optimum (Topt) was modelled as asymmetrical reparametrized polynomials, with the particular polynomial dependant on whether temperature was increasing or decreasing from optimum as described in Equation (1).
3.4. The Influence of Salinity on Pulse Rate
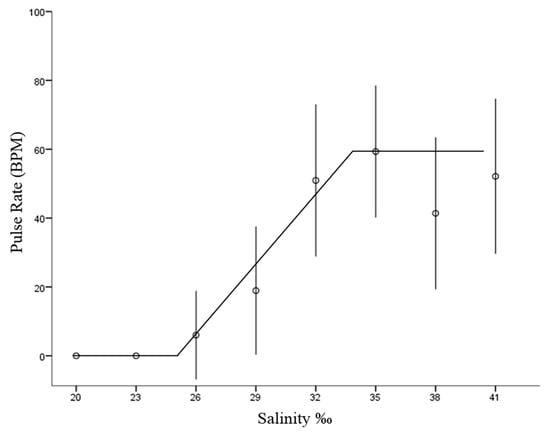
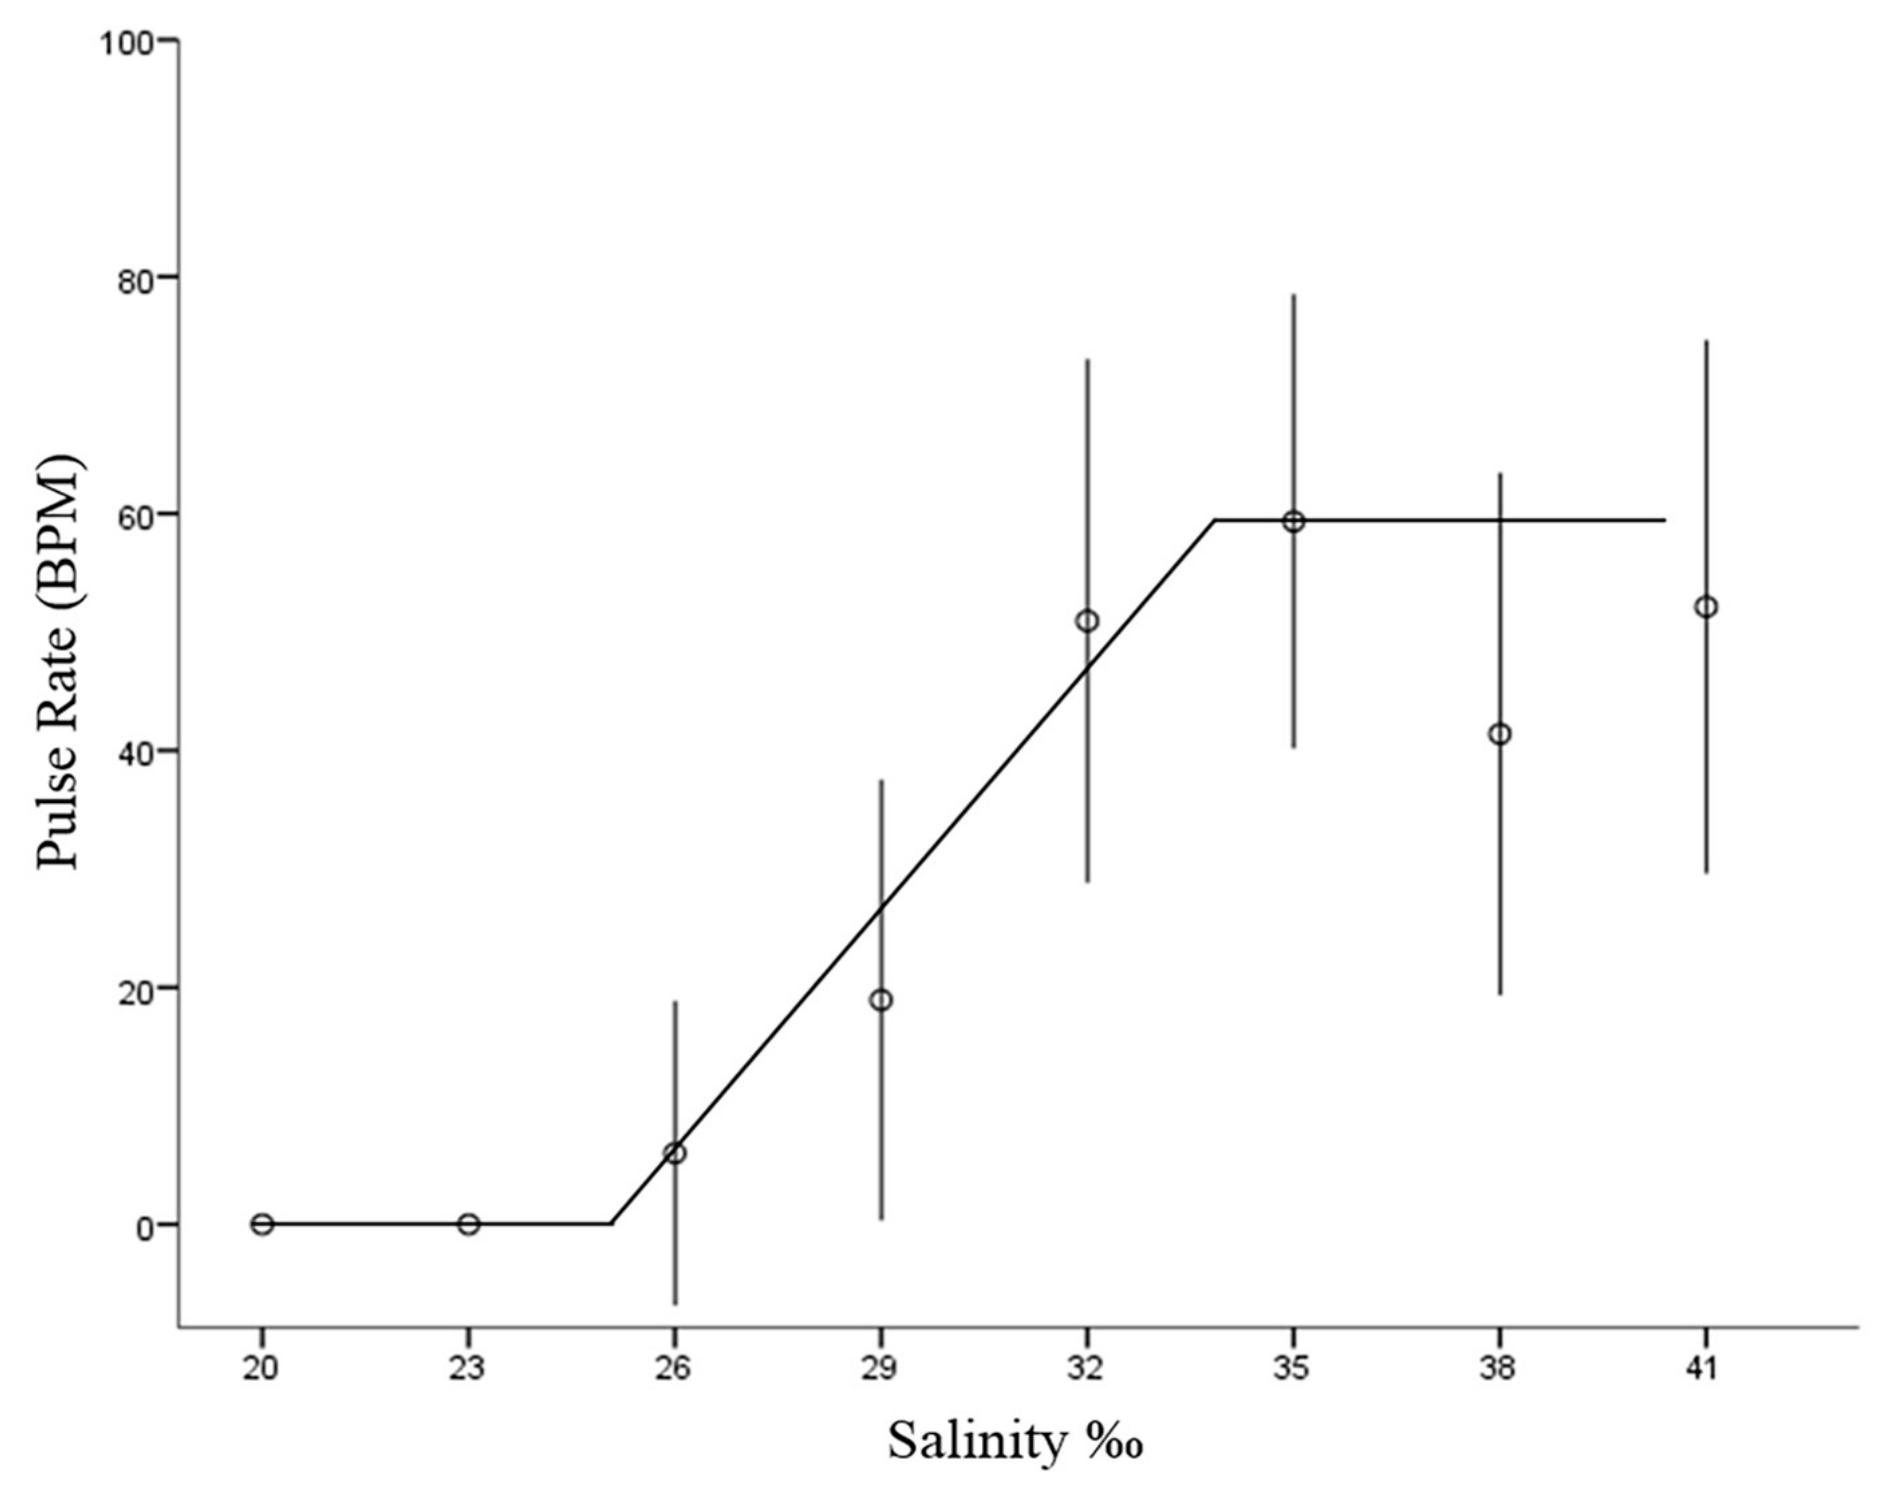
Salinity had a significant effect on the pulse rate of C. barnesi medusae, whereby the highest recorded pulse rates occurred at salinities above 32‰; conversely, 23‰ and 20‰ were lethal. The best fit model suggests a positive linear relationship between pulse rate and salinity between the modelled change point values of 25‰ and 33.6‰. Within the range, the pulse rate increased from zero beats per minute at 25‰ to 59.4 beats per minute at 33.6‰. The model suggests a low point pulse rate of zero beats per minute at salinity levels below 25‰ and a high point pulse rate of 59.4 beats per minute at salinity levels above 33.6‰ (see Figure 8). The best fit model was also compared to an alternative model that assumed pulse rate does not depend on salinity through a likelihood ratio test assuming a chi-squared approximation of the log-likelihood ratio (X23,n=120 = 50.619, p < 0.001). This result indicates that salinity influences the pulse rate of C. barnesi medusae and that the best fit model describes this relationship better than a straight, horizontal line.
Figure 8.
The influence of salinity on the pulse rate of Carukia barnesi medusae. Values are presented as means and error bars represent 95% confidence intervals assuming a normal distribution. Model output (solid line) describes the pulse rate as a function of salinity.
4. Discussion
The highest mean respiration rate of C. barnesi medusae, at the average capture site ambient temperature of 30 °C, was approximately an order of magnitude higher than previously reported respiration rates of scyphozoans recorded under ambient conditions [44]. This may indicate the elevated metabolic cost of cubozoans which are known to have: fast growth rates [33,38,56]; elevated swimming speeds [15,16]; complex sensory systems [1,2,5] and behaviours [13,14]; and relatively toxic venoms [9,10,57], compared to scyphozoans. Temperature had a significant effect on the metabolic rate of C. barnesi and maximum oxygen consumption occurred at 30 °C, which was not significantly different from higher temperatures between 31.5 °C and 33 °C (Figure 4). Conversely, oxygen consumption was significantly reduced as temperature was reduced below 30 °C. The theoretical minimum thermal requirement for the long-term persistence of this species, theoretical zero, was calculated at 21.5 °C (Figure 5), suggesting that this species could theoretically persist at temperatures above this. As the oxygen consumption experiments did not include thermal treatments high enough to significantly suppress the respiration rate, it was not possible to evaluate the theoretical thermal maximum based on these respiration rate data alone. However, when the respiration rate results are compared in conjunction with results from the effect of temperature on the pulse rate of C. barnesi medusae, a notable similarity exists. The temperature that resulted in the highest pulse rate was determined to occur between 27.5 °C and 30.9 °C (Table 1), essentially mirroring the results from the respiration rate trials. Outside of this range, both higher and lower, the pulse rate was significantly reduced, reaching zero at 38 °C and near zero at 16 °C (Figure 7).
It should be noted that the presented temperature experiments were conducted as shock exposure type experiments, with very short acclimation times, which may have confounding effects when extrapolated to in situ applications. There is little doubt that if given the opportunity to extend pre-experimental acclimation times, which is currently not possible for cubozoan medusae due to animal husbandry limitations, the thermal range presented here may be underestimated. Therefore, we believe the critical upper and lower thresholds presented here to be conservative, and do not discount the potential presence of this species in thermal conditions below the theoretical thermal minimum of 21.5 °C. Also, the specimens examined during this study were captured in the Cairns region of Australia, which is well within the loosely estimated distribution of this species, between Lizard Island and Fraser Island. Furthermore, there are expected to be broader biological and physical factors that may contribute to or define the seasonal periodicity and/or distributional limits of this species, for example the location of the polyps, suitable habitat for the polyps, and possibly prey dynamics for both the polyps and medusae.
With the primary thermal limitations of this species theoretically determined, it is possible to compare the laboratory-based results with in situ temperature conditions. The theoretical suitable thermal range based on oxygen consumption occurs between 21.5 °C (theoretical zero) and over 32 °C, which not surprisingly includes all temperatures that occur during the monsoonal summer months (November to May) in the Cairns region where the specimens were captured [58]. Unexpectedly, this also encompassed the winter thermal regime in the Cairns region, suggesting that the seasonality of the medusa stage is not driven by the theoretical lower thermal limitations alone. During the winter months, the sea surface temperature rarely, if ever, falls below 21.5 °C [58]. This suggests that the seasonality of these medusae may not be driven by thermal extremes at either end of the summer, but may be driven by reduced fitness as the environmental conditions depart from suitable thermal regimes. For example, the temperature that resulted in the highest swimming pulse rate for C. barnesi medusae falls between 27.5 °C and 30.9 °C, and was estimated at 29.2 °C (see Table 1), which are typical summer conditions during the monsoonal months in situ.
These results indicate that the local oceanic temperature and salinity regimes during the Irukandji season are encompassed by the thermal and osmotic preference of the medusae. However, during the winter months, the water temperature falls outside of the thermal preference range of the medusae, which theoretically causes the end of the Irukandji season. Conversely, temperature does not explain the consistent timing of the start of the Irukandji season. It would seem that the water temperature is sufficiently within the thermal range of the medusae well before the beginning of the Irukandji season (late October). We believe that the beginning of the Irukandji season is not driven by temperature, and the polyp stage may use an environmental cue, such as photoperiod, to induce synchronous medusae production [36], which may explain the consistent periodicity of the beginning of the Irukandji season [25].
Although temperature explains part of the seasonal timing of the medusae, there seems to be a mismatch between the thermal preference of the medusae and thermal regimes near their proposed southern distribution limit (i.e., Fraser Island), as summer water temperatures are sufficiently within the preferred range of the medusae at least 170 km south of this location (i.e., Brisbane) [59]. Vital future research is now required to ground-truth these results, which could be conducted by sampling for this species near, and south of, Fraser Island. Although the physiological tolerances have been determined under laboratory conditions, there is little doubt these parameters may be further refined in situ. Further defining the factors that limit the southern distribution of C. barnesi is essential as there is anecdotal evidence that the southern distribution of this species has extended south over the last 50 years [60]. If this species is extending its distribution south, it will be shifting from rural regions with low populations, into the most heavily populated marine areas of Queensland. For example, if the southern distribution of this species increases by just 170 km south of Fraser Island, it will include the Sunshine Coast and Brisbane; Australia’s third largest city. If this occurs, it is expected to have a substantial negative impact on the Queensland tourism industry as currently there are no procedures to deal with this species other than beach closures.
The bell contraction frequency of C. barnesi was also significantly affected by salinity, whereby the highest swimming pulse rate was estimated to occur at salinity levels above 33.6‰. Decreases in salinity below this point reduced fitness, eventually leading to lethal dilution at 23‰. Furthermore, the minimum tolerable salinity was estimated to occur at 25‰ (Figure 8). This low tolerance to low salinity conditions is expected to exclude the medusae from inshore estuarine areas near river mouths where low salinity conditions commonly occur. This result also strengthens the hypothesis that the medusae of this species are oceanic, where the salinities in the waters of the Great Barrier Reef are relatively stable and rarely drop below 33‰ or rise above 36‰.
Previous research on the feeding ecology of C. barnesi demonstrated that this species actively targets larval fish during the day and not at night, presumably to conserve energy [8]. This type of resting behaviour has also been documented in Chironex fleckeri, which have been shown to rest at night [14]. Here we have shown that the respiration rate of this species is reduced at higher temperatures at night, which provides further evidence of a circadian diurnal activity pattern. This period of rest may be necessary to sustain the elevated respiration rate recorded during the day.
In conclusion, this research quantifies the thermal and osmotic tolerance of the medusae stage of C. barnesi and provides a replicable method for determining the oxygen consumption of cubozoans. As research into the thermal ecology of cubozoans is in its infancy, further studies are required to quantify the thermal and osmotic tolerances of additional species and to assess clinal variation in these tolerances across their distribution. From this, a better understanding of the factors that drive the strong seasonal periodicity of many cubozoans may be determined. After the physiological profiles of cubozoans are known, they can be modelled, and ground-truthed against the observed species occurrence records (i.e., through eDNA, sting and capture records, or dedicated field surveys). An empirical understanding of the physiological limitations of cubozoans, in combination with observed species occurrence records, may provide an avenue to produce a predictive model of the occurrence of these species. Such models may also help to highlight the factors driving distributional and/or seasonal range changes in these animals.
Author Contributions
Conceptualization, R.L.C. and J.E.S.; methodology, R.L.C. and J.E.S.; formal analysis, R.L.C., J.E.S., T.D.N. and D.L.-B.; investigation, R.L.C. and J.E.S.; resources, J.E.S.; data curation, R.L.C. and D.L.-B.; writing—original draft preparation, R.L.C.; writing—review and editing, R.L.C., J.E.S., T.D.N. and D.L.-B.; visualisation, R.L.C. and J.E.S.; supervision, J.E.S.; project administration, R.L.C. and J.E.S.; funding acquisition, R.L.C. and J.E.S. All authors have read and agreed to the published version of the manuscript.
Funding
This research was partially funded by The Australian Lions Foundation. The lead author also received an Australian Post Graduate Award scholarship to undertake this work.
Data Availability Statement
The raw data supporting the conclusions of this article will be made available by the authors upon request.
Acknowledgments
The authors would like to acknowledge Richard Fitzpatrick, Jessica Sleeman, Bjoernar Hauge, Julian Davis-Deutsch and Sally Turner, for assistance in the field and in the laboratory, Nik Sachlikidis and Rhondda Jones for project assistance, and The Australian Lions Foundation for providing the research vessel and collection equipment.
Conflicts of Interest
The authors declare no conflicts of interest. The funders had no role in the design of the study; in the collection, analyses, or interpretation of data; in the writing of the manuscript; or in the decision to publish the results.
References
- Coates, M.M. Visual ecology and functional morphology of cubozoa (cnidaria). Integr. Comp. Biol. 2003, 43, 542–548. [Google Scholar] [CrossRef] [Scilit] [PubMed]
- Garm, A.; Coates, M.M.; Gad, R.; Seymour, J.; Nilsson, D.E. The lens eyes of the box jellyfish Tripedalia cystophora and Chiropsalmus sp. are slow and color-blind. J. Comp. Physiol. 2007, 193, 547–557. [Google Scholar] [CrossRef] [Scilit] [PubMed]
- Hamner, W.; Jones, M.; Hamner, P. Swimming, feeding, circulation and vision in the Australian box jellyfish, Chironex fleckeri (Cnidaria: Cubozoa). Mar. Freshw. Res. 1995, 46, 985–990. [Google Scholar] [CrossRef] [Scilit]
- Martin, V.J. Photoreceptors of cnidarians. Can. J. Zool. 2002, 80, 1703–1722. [Google Scholar] [CrossRef] [Scilit]
- Nilsson, D.-E.; Gislén, L.; Coates, M.M.; Skogh, C.; Garm, A. Advanced optics in a jellyfish eye. Nature 2005, 435, 201–205. [Google Scholar] [CrossRef] [Scilit] [PubMed]
- Piatigorsky, J.; Horwitz, J.; Kuwabara, T.; Cutress, C.E. The cellular eye lens and crystallins of cubomedusan jellyfish. J. Comp. Physiol. A 1989, 164, 577–587. [Google Scholar] [CrossRef] [Scilit]
- Buskey, E.J. Behavioral adaptations of the cubozoa medusa Tripedalia cystophora for feeding on copepod. Mar. Biol. 2003, 142, 225–232. [Google Scholar] [CrossRef] [Scilit]
- Courtney, R.; Sachlikidis, N.; Jones, R.; Seymour, J. Prey Capture Ecology of the Cubozoan Carukia barnesi. PLoS ONE 2015, 10, e0124256. [Google Scholar] [CrossRef] [Scilit] [PubMed]
- Carrette, T.J.; Underwood, A.H.; Seymour, J.E. Irukandji syndrome: A widely misunderstood and poorly researched tropical marine envenoming. Diving Hyperb. Med. 2012, 42, 214–223. [Google Scholar]
- Chaousis, S.; Smout, M.; Wilson, D.; Loukas, A.; Mulvenna, J.; Seymour, J. Rapid short term and gradual permanent cardiotoxic effects of vertebrate toxins from Chironex fleckeri (Australian box jellyfish) venom. Toxicon 2014, 80, 17–26. [Google Scholar] [CrossRef] [Scilit]
- Little, M.; Pereira, P.; Mulcahy, R.; Cullen, P.a.; Carrette, T.; Seymour, J. Severe cardiac failure associated with presumed jellyfish sting. Irukandji syndrome? Anaesth. Intensive Care 2003, 31, 642–647. [Google Scholar] [CrossRef] [Scilit] [PubMed]
- Williamson, J.A.; Fenner, P.J.; Burnett, J.W.; Rifkin, J.F. Venomous and Poisonous Marine Animals: A Medical and Biological Handbook; UNSW Press: Coogee, NSW, Australia, 1996. [Google Scholar]
- Gordon, M.; Seymour, J. Quantifying movement of the tropical Australian cubozoan Chironex fleckeri using acoustic telemetry. In Jellyfish Blooms: Causes, Consequences, and Recent Advances, Proceedings of the Second International Jellyfish Blooms Symposium, Gold Coast, QLD, Australia, 24–27 June 2007; Springer: Dordrecht, The Netherlands, 2008; pp. 87–97. [Google Scholar]
- Seymour, J.E.; Carrette, T.J.; Sutherland, P.A. Do box jellyfish sleep at night? Med. J. Aust. 2004, 181, 707. [Google Scholar] [CrossRef] [Scilit] [PubMed]
- Colin, S.P.; Costello, J.H.; Katija, K.; Seymour, J.; Kiefer, K. Propulsion in cubomedusae: Mechanisms and utility. PLoS ONE 2013, 8, e56393. [Google Scholar] [CrossRef] [Scilit]
- Shorten, M.; Davenport, J.; Seymour, J.E.; Cross, M.C.; Carrette, T.J.; Woodward, G.; Cross, T.F. Kinematic analysis of swimming in Australian box jellyfish, Chiropsalmus sp. and Chironex fleckeri (Cubozoa, Cnidaria: Chirodropidae). J. Zool. 2005, 267, 371–380. [Google Scholar] [CrossRef] [Scilit]
- Arai, M.N. A Functional Biology of Scyphozoa; Springer Science & Business Media: New York, NY, USA, 1997. [Google Scholar]
- Arneson, A.C.; Cutress, C.E. Life history of Carybdea alata Reynaud, 1830 (cubomedusae). In Coelenterate Ecology and Behavior; Springer: New York, NY, USA, 1976; pp. 227–236. [Google Scholar]
- Courtney, R.; Browning, S.; Seymour, J. Early Life History of the ‘Irukandji’ Jellyfish Carukia barnesi. PLoS ONE 2016, 11, e0151197. [Google Scholar] [CrossRef] [Scilit]
- Cutress, C.; Studebaker, J.P. Development of the Cubomedusae Carybdea marsupialis. In Proceedings of the Association of Island Marine Laboratories of the Caribbean, Cumaná, Venezuela, 11 October 1971. [Google Scholar]
- Hartwick, R.F. Distributional Ecology and Behavior of the Early Life Stages of the Box-Jellyfish Chironex fleckeri. Hydrobiologia 1991, 216, 181–188. [Google Scholar] [CrossRef] [Scilit]
- Toshino, S.; Miyake, H.; Iwanaga, S. Development of Copula sivickisi (Stiasny, 1926) (Cnidaria: Cubozoa: Carybdeidae: Tripedaliidae) collected from the Ryukyu Archipelago, southern Japan. Plankton Benthos Res. 2014, 9, 32–41. [Google Scholar] [CrossRef] [Scilit]
- Werner, B.; Cutress, C.E.; Studebaker, J.P. Life cycle of Tripedalia cystophora Conant (cubomedusae). Nature 1971, 232, 582–583. [Google Scholar] [CrossRef] [Scilit]
- Yamaguchi, M. Early life history of the sea wasp, Chironex fleckeri (Class Cubozoa). In Development and Cellular Biology of Coelenterates; Elsevier/North Holland Biomedical Press: Amsterdam, The Netherlands, 1980; pp. 11–16. [Google Scholar]
- Carrette, T.J.; Seymour, J.J. Long-term analysis of Irukandji stings in Far North Queensland. Diving Hyperb. Med. 2013, 43, 9–15. [Google Scholar] [PubMed]
- Chiaverano, L.M.; Holland, B.S.; Crow, G.L.; Blair, L.; Yanagihara, A.A. Long-term fluctuations in circalunar Beach aggregations of the box jellyfish Alatina moseri in Hawaii, with links to environmental variability. PLoS ONE 2013, 8, e77039. [Google Scholar] [CrossRef] [Scilit] [PubMed]
- Crow, G.L.; Chiaverano, L.M.; Crites, J.; Khramov, M.A.; Holland, B.S. Box jellyfish (Cubozoa: Carybdeida) in Hawaiian waters, and the first record of Tripedalia cystophora in Hawaii. Bull. Zool. 2015, 9, 93–108. [Google Scholar]
- Kingsford, M.J.; Mooney, C.J. The ecology of box jellyfishes (Cubozoa). In Jellyfish Blooms; Springer: Dordrecht, The Netherlands, 2014; pp. 267–302. [Google Scholar]
- Kingsford, M.; Seymour, J.; O’Callaghan, M. Abundance patterns of cubozoans on and near the Great Barrier Reef. In Jellyfish Blooms IV: Interactions with Humans and Fisheries; Springer: Dordrecht, The Netherlands, 2012; Volume 69, pp. 257–268. [Google Scholar]
- Kinsey, B.; Barnes, J.T. More Barnes on Box Jellyfish; Sir George Fisher Centre for Tropical Marine Studies, James Cook University of North Queensland: Townsville, Australia, 1988. [Google Scholar]
- Mooney, C.J.; Kingsford, M.J. The influence of salinity on box jellyfish (Chironex fleckeri, Cubozoa) statolith elemental chemistry. Mar. Biol. 2016, 163, 103. [Google Scholar] [CrossRef] [Scilit]
- Southcott, R. Revision of some Carybdeidae (Scuphozoa: Cubomedusae) including a description of the jellyfish responsible for the ‘Irukandji syndrome’. Aust. J. Zool. 1967, 15, 651–671. [Google Scholar] [CrossRef] [Scilit]
- Gordon, M.; Hatcher, C.; Seymour, J. Growth and age determination of the tropical Australian cubozoan Chiropsalmus sp. Hydrobiologia 2004, 530, 339–345. [Google Scholar] [CrossRef] [Scilit]
- Hartwick, R.F. Observations on the Anatomy, Behavior, Reproduction and Life-Cycle of the Cubozoan Carybdea sivickisi. Hydrobiologia 1991, 216, 171–179. [Google Scholar] [CrossRef] [Scilit]
- Toshino, S.; Miyake, H.; Ohtsuka, S.; Okuizumi, K.; Adachi, A.; Hamatsu, Y.; Urata, M.; Nakaguchi, K.; Yamaguchi, S. Development and polyp formation of the giant box jellyfish Morbakka virulenta (Kishinouye, 1910) (Cnidaria: Cubozoa) collected from the Seto Inland Sea, western Japan. Plankton Benthos Res. 2013, 8, 1–8. [Google Scholar] [CrossRef] [Scilit]
- Courtney, R.; Browning, S.; Northfield, T.; Seymour, J. Thermal and Osmotic Tolerance of ‘Irukandji’ Polyps: Cubozoa; Carukia barnesi. PLoS ONE 2016, 11, e0159380. [Google Scholar] [CrossRef] [Scilit] [PubMed]
- Kinsey, B. Barnes on Box Jellyfish; Sir George Fisher Centre for Tropical Marine Studies, James Cook University of North Queensland: Townsville, Australia, 1986. [Google Scholar]
- Gordon, M.; Seymour, J. Growth, development and temporal variation in the onset of six Chironex fleckeri medusae seasons: A contribution to understanding jellyfish ecology. PLoS ONE 2012, 7, e31277. [Google Scholar] [CrossRef] [Scilit] [PubMed]
- Courtney, R. Life Cycle, Prey Capture Ecology, and Physiological Tolerances of Medusae and Polyps of the ‘Irukandji’ Jellyfish: Carukia barnesi. Doctoral Dissertation, James Cook University, Townsville, Australia, 2016. [Google Scholar]
- Damos, P.; Savopoulou-Soultani, M. Temperature-Driven Models for Insect Development and Vital Thermal Requirements. Psyche J. Entomol. 2012, 2012, 123405. [Google Scholar] [CrossRef] [Scilit]
- Roy, M.; Brodeur, J.; Cloutier, C. Relationship between temperature and developmental rate of Stethorus punctillum (Coleoptera: Coccinellidae) and its prey Tetranychus mcdanieli (Acarina: Tetranychidae). Environ. Entomol. 2002, 31, 177–187. [Google Scholar] [CrossRef] [Scilit]
- Mangum, C.P.; Oakes, M.J.; Shick, J.M. Rate-temperature responses in scyphozoan medusae and polyps. Mar. Biol. 1972, 15, 298–303. [Google Scholar] [CrossRef] [Scilit]
- Ikemoto, T.; Takai, K. A new linearized formula for the law of total effective temperature and the evaluation of line-fitting methods with both variables subject to error. Environ. Entomol. 2000, 29, 671–682. [Google Scholar] [CrossRef] [Scilit]
- Purcell, J.E.; Fuentes, V.; Atienza, D.; Tilves, U.; Astorga, D.; Kawahara, M.; Hays, G.C. Use of respiration rates of scyphozoan jellyfish to estimate their effects on the food web. In Jellyfish Blooms: New Problems and Solutions; Purcell, J.E., Angel, D.L., Eds.; Springer: Dordrecht, The Netherlands, 2010; pp. 135–152. [Google Scholar]
- Ikeda, T. Synthesis toward a global model of metabolism and chemical composition of medusae and ctenophores. J. Exp. Mar. Biol. Ecol. 2014, 456, 50–64. [Google Scholar] [CrossRef] [Scilit]
- Lilley, M.K.S.; Lombard, F. Respiration of fragile planktonic zooplankton: Extending the possibilities with a single method. J. Exp. Mar. Biol. Ecol. 2015, 471, 226–231. [Google Scholar] [CrossRef] [Scilit]
- Bentlage, B.; Lewis, C. An illustrated key and synopsis of the families and genera of carybdeid box jellyfishes (Cnidaria: Cubozoa: Carybdeida), with emphasis on the “Irukandji family” (Carukiidae). J. Nat. Hist. 2012, 46, 2595–2620. [Google Scholar] [CrossRef] [Scilit]
- Underwood, A.H.; Seymour, J.E. Venom Ontogeny, Diet and Morphology in Carukia barnesi, a species of Australian Box Jellyfish that causes Irukandji syndrome. Toxicon 2007, 49, 1073–1082. [Google Scholar] [CrossRef] [Scilit]
- Rowley, O.C.; Courtney, R.; Northfield, T.; Seymour, J. Environmental drivers of the occurrence and abundance of the Irukandji jellyfish (Carukia barnesi). PLoS ONE 2022, 17, e0272359. [Google Scholar] [CrossRef] [Scilit] [PubMed]
- Cooper, K.W. The Elementary Chemical Composition of Marine Organisms. J. Am. Chem. Soc. 2002, 77, 1712–1713. [Google Scholar] [CrossRef] [Scilit]
- Lucas, A. Bioenergetics of Aquatic Animals, English edn. ed.; Taylor & Francis: London, UK, 1996. [Google Scholar]
- Bolker, B.M.; Brooks, M.E.; Clark, C.J.; Geange, S.W.; Poulsen, J.R.; Stevens, M.H.; White, J.S. Generalized linear mixed models: A practical guide for ecology and evolution. Trends Ecol. Evol. 2009, 24, 127–135. [Google Scholar] [CrossRef] [Scilit] [PubMed]
- SAS Institute Inc. SAS/STAT User’s Guide: Examples: The NLMIXED Procedure. Available online: https://documentation.sas.com/doc/en/pgmsascdc/9.4_3.5/statug/statug_nlmixed_examples.htm (accessed on 1 April 2026).
- Bolker, B.M. Ecological Models and Data in R; Princeton University Press: Princeton, NJ, USA, 2008. [Google Scholar]
- R Core Team. R: A Language and Environment for Statistical Computing; R Foundation for Statistical Computing: Vienna, Austria, 2026; Available online: https://www.R-project.org/ (accessed on 1 April 2026).
- Kawamura, M.; Ueno, S.; Iwanaga, S.; Oshiro, N.; Kubota, S. The relationship between fine rings in the statolith and growth of the cubomedusa Chiropsalmus quadrigatus (Cnidaria: Cubozoa) from Okinawa Island, Japan. Plankton Biol. Ecol. 2003, 50, 37–42. [Google Scholar]
- Pereira, P.; Barry, J.; Corkeron, M.; Keir, P.; Little, M.; Seymour, J. Intracerebral hemorrhage and death after envenoming by the jellyfish Carukia barnesi. Clin. Toxicol. 2010, 48, 390–392. [Google Scholar] [CrossRef] [Scilit] [PubMed]
- The Queensland Government Coastal Data System. Wave Rider Buoy Project, Cairns. Available online: https://www.data.qld.gov.au/dataset/coastal-data-system-waves-cairns (accessed on 17 April 2026).
- The Queensland Government Coastal Data System. Wave Rider Buoy Project, Brisbane. Available online: https://www.data.qld.gov.au/dataset/coastal-data-system-waves-brisbane (accessed on 17 April 2026).
- Carette, T.J. Etiology of Irukandji Syndrome with Particular Focus on the Venom Ecology and Life History of One Medically Significant Carybdeid Box Jellyfish Alatina moseri. Ph.D. Thesis, James Cook University, Townsville, Australia, 2014. [Google Scholar]

Disclaimer/Publisher’s Note: The statements, opinions and data contained in all publications are solely those of the individual author(s) and contributor(s) and not of MDPI and/or the editor(s). MDPI and/or the editor(s) disclaim responsibility for any injury to people or property resulting from any ideas, methods, instructions or products referred to in the content. |
© 2026 by the authors. Licensee MDPI, Basel, Switzerland. This article is an open access article distributed under the terms and conditions of the Creative Commons Attribution (CC BY) license.