


Abstract
This study presents a city-scale physical coastal vulnerability assessment of the 21 km Monrovia coastline (Liberia) using a multi-parameter coastal vulnerability index (CVI). Nine physical parameters—geology/geomorphology, shoreline change rate, elevation, slope, bathymetry, wave height, tidal range, relative sea level rise, and coastal landform characteristics—were integrated within an equal-weight ranking framework. The results identify spatially concentrated high vulnerability segments associated with low elevation, sandy geomorphology, and persistent shoreline retreat. The CVI represents a relative exposure screening rather than a predictive risk model. Limitations related to parameter weighting, classification dependency, and temporal heterogeneity are acknowledged. The findings support preliminary spatial prioritization for coastal adaptation planning
1. Introduction
Coastlines are dynamic transitional areas that are influenced by both marine and terrestrial forces [1]. Urban low-lying sandy coasts are particularly sensitive to interacting coastal drivers, including wave forcing, tidal modulation, shoreline erosion, and relative sea level rise (RSRL). These drivers may operate through additive effects, such as cumulative shoreline retreat under rising mean sea level, or through nonlinear interactions where hydrodynamic forcing amplifies geomorphic susceptibility. Climate change is intensifying pressures on coastal habitats worldwide [2], especially in low-lying coasts, river estuaries, and islands [3,4]. Despite this exposure, ~40% of the global population lives along the coast [4], and areas within 100 km of the shoreline host ~25% of the world’s population at roughly three times the global average population density [5].
Understanding how these interacting processes shape spatial patterns of vulnerability is critical for rapidly urbanizing coastal environments such as Monrovia. In this study, sea level rise is treated as a chronic, long-term morphodynamic driver that influences shoreline adjustment over decadal scales, whereas storms and surges represent episodic hazards that may temporarily accelerate erosion. The shoreline change rates analyzed here capture multi-decadal trends rather than individual event responses.
Continued sea level rise (SLR) can exacerbate shoreline erosion, seawater intrusion into aquifers, wetland and estuary flooding, and threats to cultural assets and infrastructure [3,4,6]. For decades now, multiple qualitative and quantitative approaches have been used to assess coastal vulnerability—a spatial concept identifying people and places susceptible to coastal hazards [7,8].
Coastal vulnerability index (CVI) methodologies have evolved from early equal-weight physical exposure frameworks [3,9] toward multi-criteria and weighted approaches incorporating Analytical Hierarchy Process (AHP), fuzzy logic, and principal component analysis. While advanced weighting schemes may enhance parameter differentiation, classical equal-weight CVI formulations remain widely applied for transparent first-order exposure screening, particularly in data-constrained settings. The present study adopts this transparent screening philosophy while explicitly clarifying parameter heterogeneity and classification implications. Recent methodological developments in coastal vulnerability assessment include: hierarchical segmentation using a multi-dimensional composite index at national scale [10], refined beach erosion-specific indicators [11], integration of geotechnical parameters using fuzzy AHP and PCA [12], and integrated coastal vulnerability frameworks balancing tourism and risk [13]. Recent studies emphasize that coastal vulnerability indices often incorporate parameters related to hazard and exposure and therefore may be interpreted within broader coastal risk assessment frameworks [14]. However, the present study focuses specifically on physical coastal vulnerability, aiming to evaluate the spatial variability of geomorphological and environmental susceptibility along the Monrovia coastline. Socio-economic exposure and adaptive capacity indicators, which are typically included in comprehensive coastal risk assessments, were not considered in this analysis.
While global projections provide contextual understanding of long-term exposure, the CVI parameterization in this study uses a regionally extracted relative sea level rise trend (~3.5 mm year−1) derived from the Copernicus Marine Service data, representative of the Monrovia coast. Existing coastal vulnerability assessments along the Liberian coast [15,16] have not provided a spatially continuous, city-scale integration of geomorphology, shoreline change dynamics, hydrodynamic forcing, and bathymetric controls within a unified framework. Furthermore, limited discussion of uncertainty and classification effects has constrained interpretability. This study addresses these methodological gaps by implementing a transparent, multi-parameter CVI with explicit acknowledgment of parameter heterogeneity and uncertainty.
Previous classifications yielding very low vulnerability despite documented erosion may reflect limited parameter integration, threshold selection, or insufficient treatment of shoreline change uncertainty. By integrating nine physical parameters and explicitly reporting shoreline change error envelopes, the present study reduces such inconsistencies and strengthens interpretability.
This study fills the documented gap in Liberia by providing the first city-scale, multi-parameter CVI tailored to Monrovia to screen and prioritize relative coastal vulnerability. Building on the national assessment that combined exposure, sensitivity, and adaptive capacity [16], this study pursues three objectives: (i) to develop a comprehensive CVI for Monrovia by integrating remote sensing, GIS tools, and empirical data for mapping relative vulnerability; (ii) to examine spatial associations among sea level rise, wave height, and shoreline change; and (iii) to identify coastal settlement that are vulnerable erosional hotspots. Methodologically, this study introduces a continuous transect-based CVI at city scale, integrates heterogeneous resolution datasets within a unified ranking framework, and explicitly incorporates shoreline change uncertainty into vulnerability interpretation.
Beyond addressing a geographic data gap, this study contributes methodologically by (i) implementing a spatially continuous, transect-based city-scale CVI along a 21 km urban coastline of Monrovia, (ii) explicitly distinguishing spatially uniform forcing parameters from spatially discriminating geomorphic controls, and (iii) incorporating shoreline change uncertainty into vulnerability interpretation. These refinements strengthen conceptual clarity and improve the robustness of CVI application in data-constrained West African urban coasts. This study does not propose a new vulnerability index; rather, it implements a transparent physical CVI framework at city scale to provide a reproducible first-order exposure screening in a data-constrained urban context. The contribution lies in methodological clarity, spatial continuity, and explicit acknowledgment of classification and parameter heterogeneity rather than in index innovation.
2. Materials and Methods
2.1. Study Area
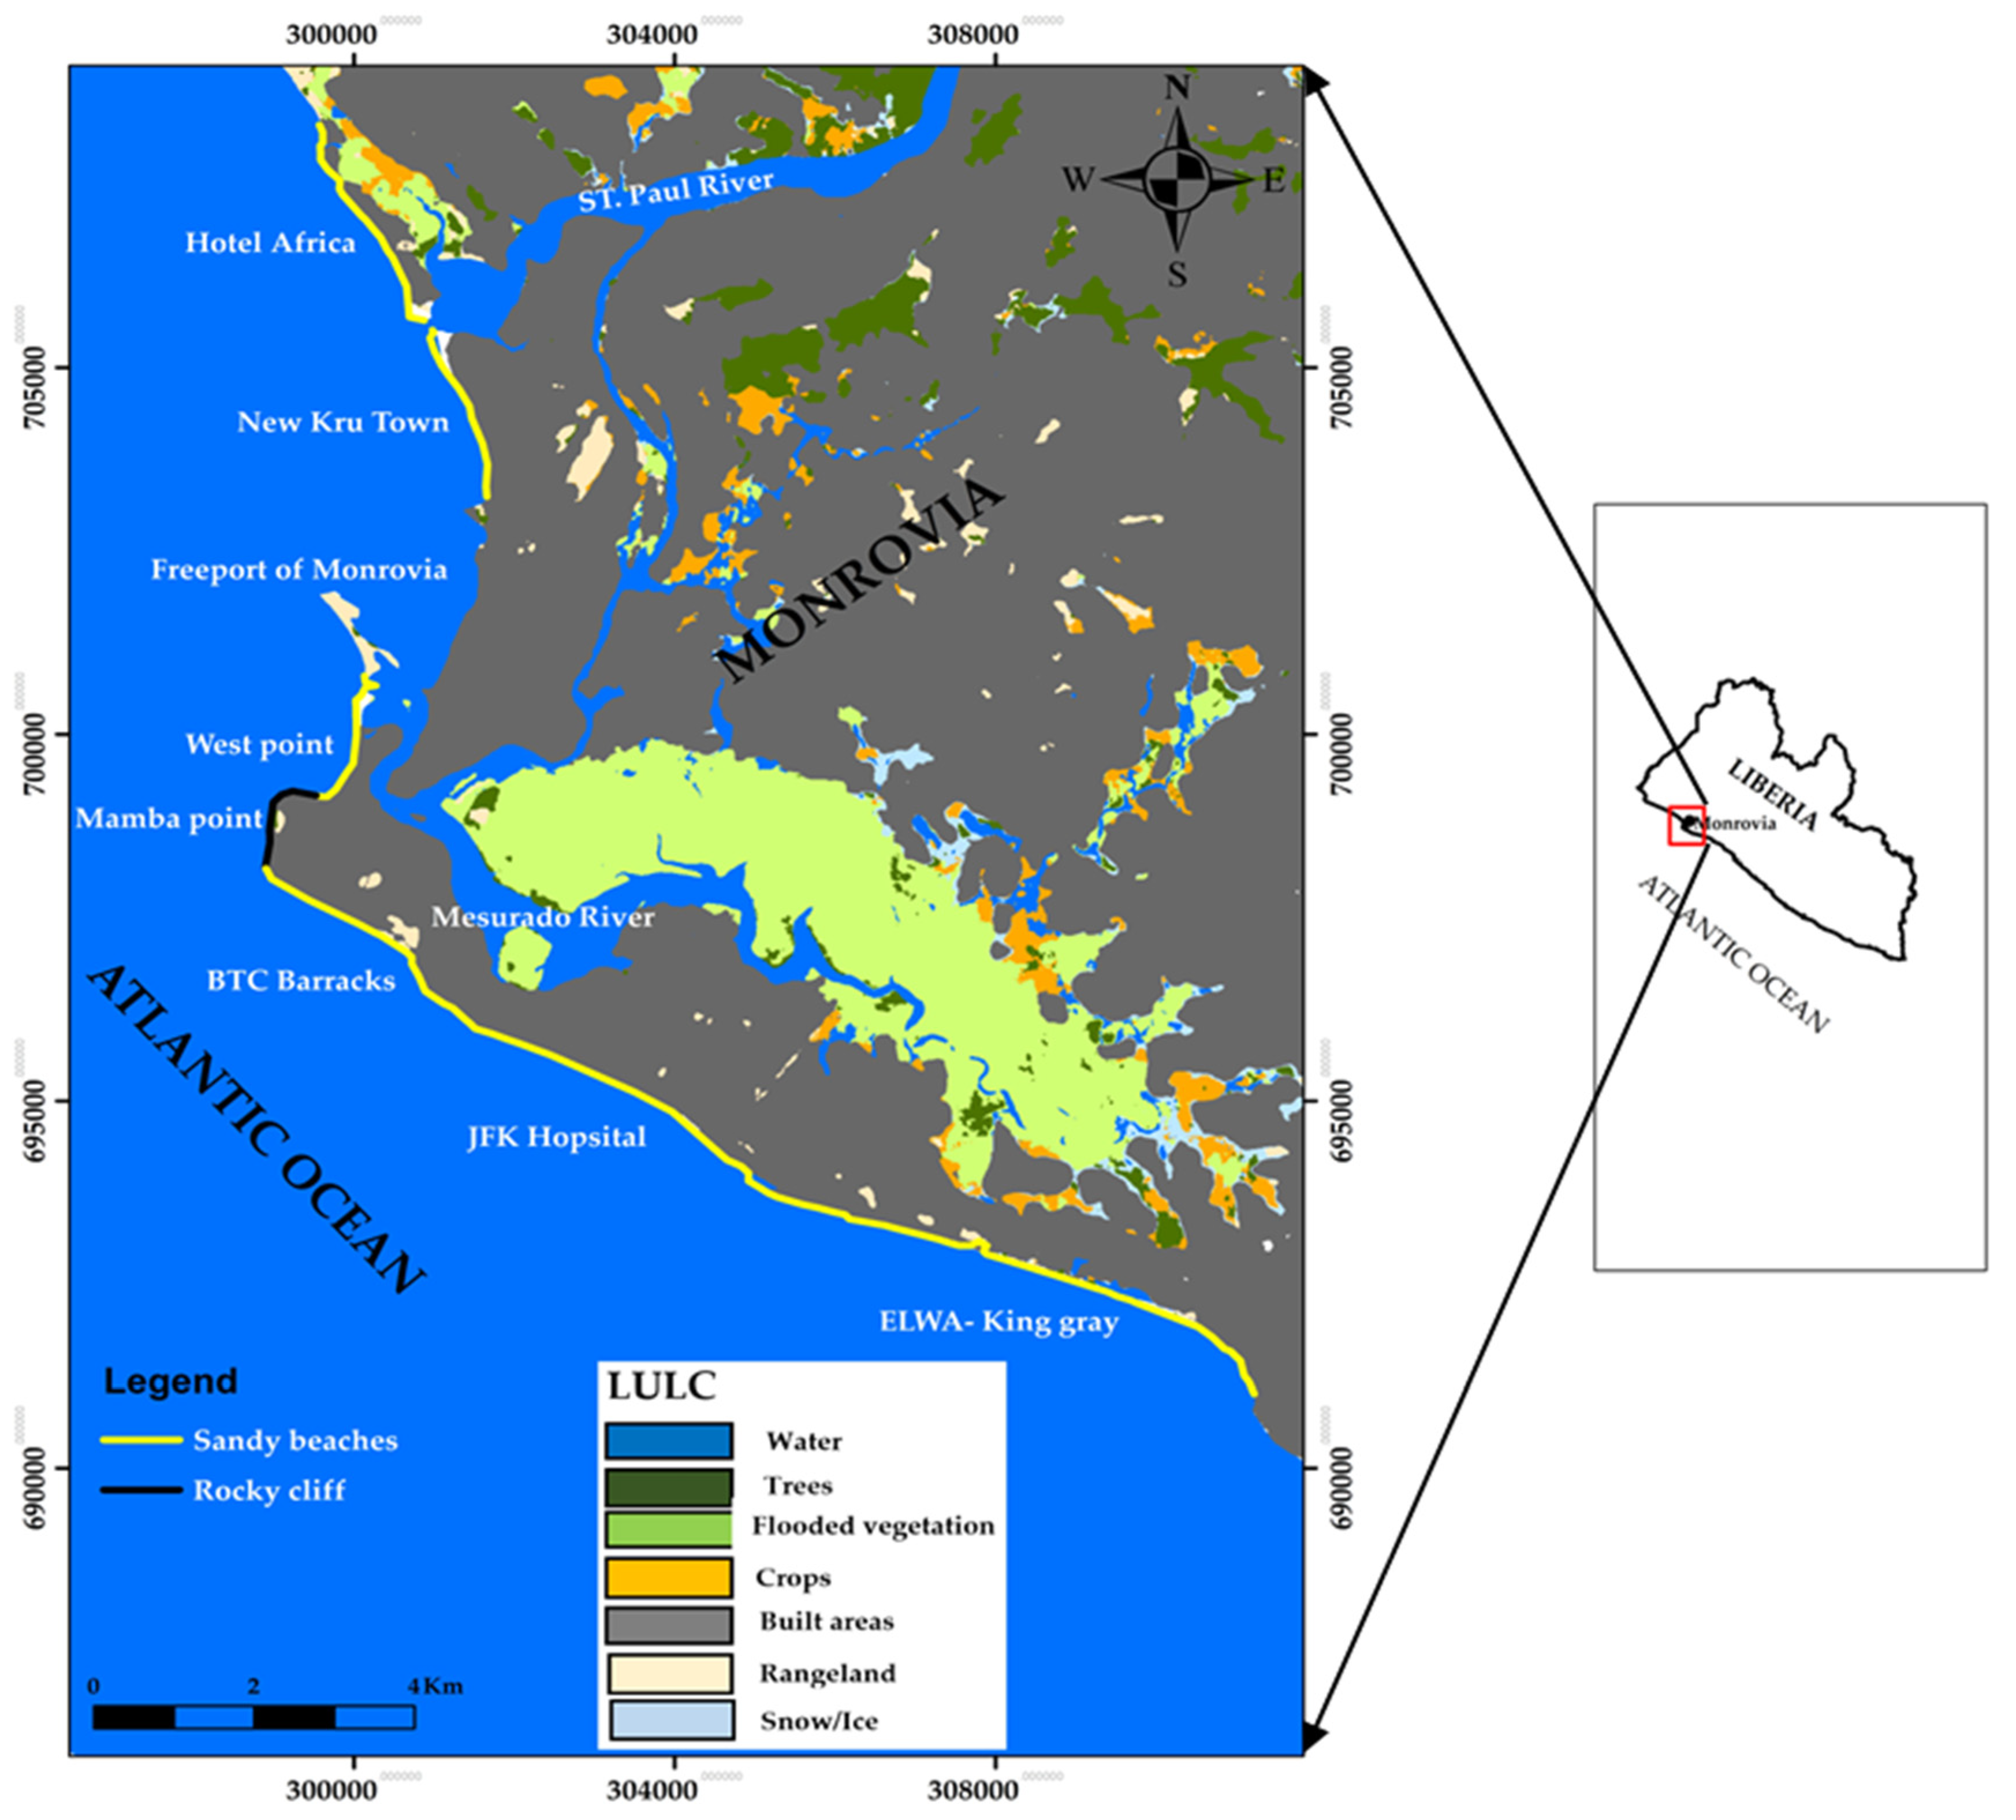
The Republic of Liberia has a coastline of about 559 km along the Atlantic Ocean that stretches from Sierra Leone in the northwest to the Ivory Coast in the southeast. With an estimated population of ~5.2 million [17], approximately 58% of Liberia’s population resides along its long coastal stretch [17,18], while Monrovia accounts for about ~30% of the national total [17],with many communities occupying low-lying areas and informal housing [19,20,21]. The climate is humid tropical with a wet season (April to October) and a dry season (November to March); coastal areas receive higher rainfall, with monthly totals of ~22.1 mm (January) to ~383.6 mm (September) [22]. Overall, annual temperature variability is modest due to the moderating influence of the Atlantic [22]. The coast experiences a semi-diurnal tide (two highs and two lows daily) and a northwest-directed littoral drift. A significant wave height of approximately 1.3 m has been reported for the coast [23]. Our selected study area extends about 21 km along the Monrovia coastline (Figure 1), from Hotel Africa to King gray community. The dominant coastal landforms along the study area include sandy beaches, low dunes, estuaries, rocky cliff, lagoons, mangrove swamps, and the artificial Freeport of Monrovia harbor complex. The granulometry of sandy beaches consists mostly of medium-coarse sand in the lower parts of the beaches, while upper parts are dominated by coarse sand within the offshore areas [16]. Also, the estuary areas are mostly dominated by very coarse sediments, while the Mesurado lagoon areas are characterized by fine sediments [16]. This zone, which serves as a critical natural and economic asset, with several beaches, sea port, and fishery zones is threatened due ongoing climate change, sea level rise, and sand mining, making it especially susceptible to coastal erosion [24]. Multiple sources identify West Point in Monrovia and low-lying coastal areas as highly vulnerable, where progressive erosion has affected housing and everyday services and triggered relocations [21,24,25]. Because the wave approach becomes increasingly oblique north of Mamba Point, before depth contours align more closely with the shoreline [22]. Global projections indicate a potential SLR of ~0.5–1.0 m by 2100, depending on emissions, while regional assessments suggest an SLR of 0.13–0.56 m by the 2090s, relative to 1980–1999 [26]. It is predicted that a 1 m SLR could inundate ~95 km2 of Liberia’s coastal zone, with ~48 km2 along sheltered coasts [22].
Figure 1.
Study area map (province of Monrovia) with coastal communities: Hotel Africa, New Kru Town, West Point, ELWA to King Gray, and land use/land cover (LULC) classes.
2.2. Selected Parameters and Data Sources
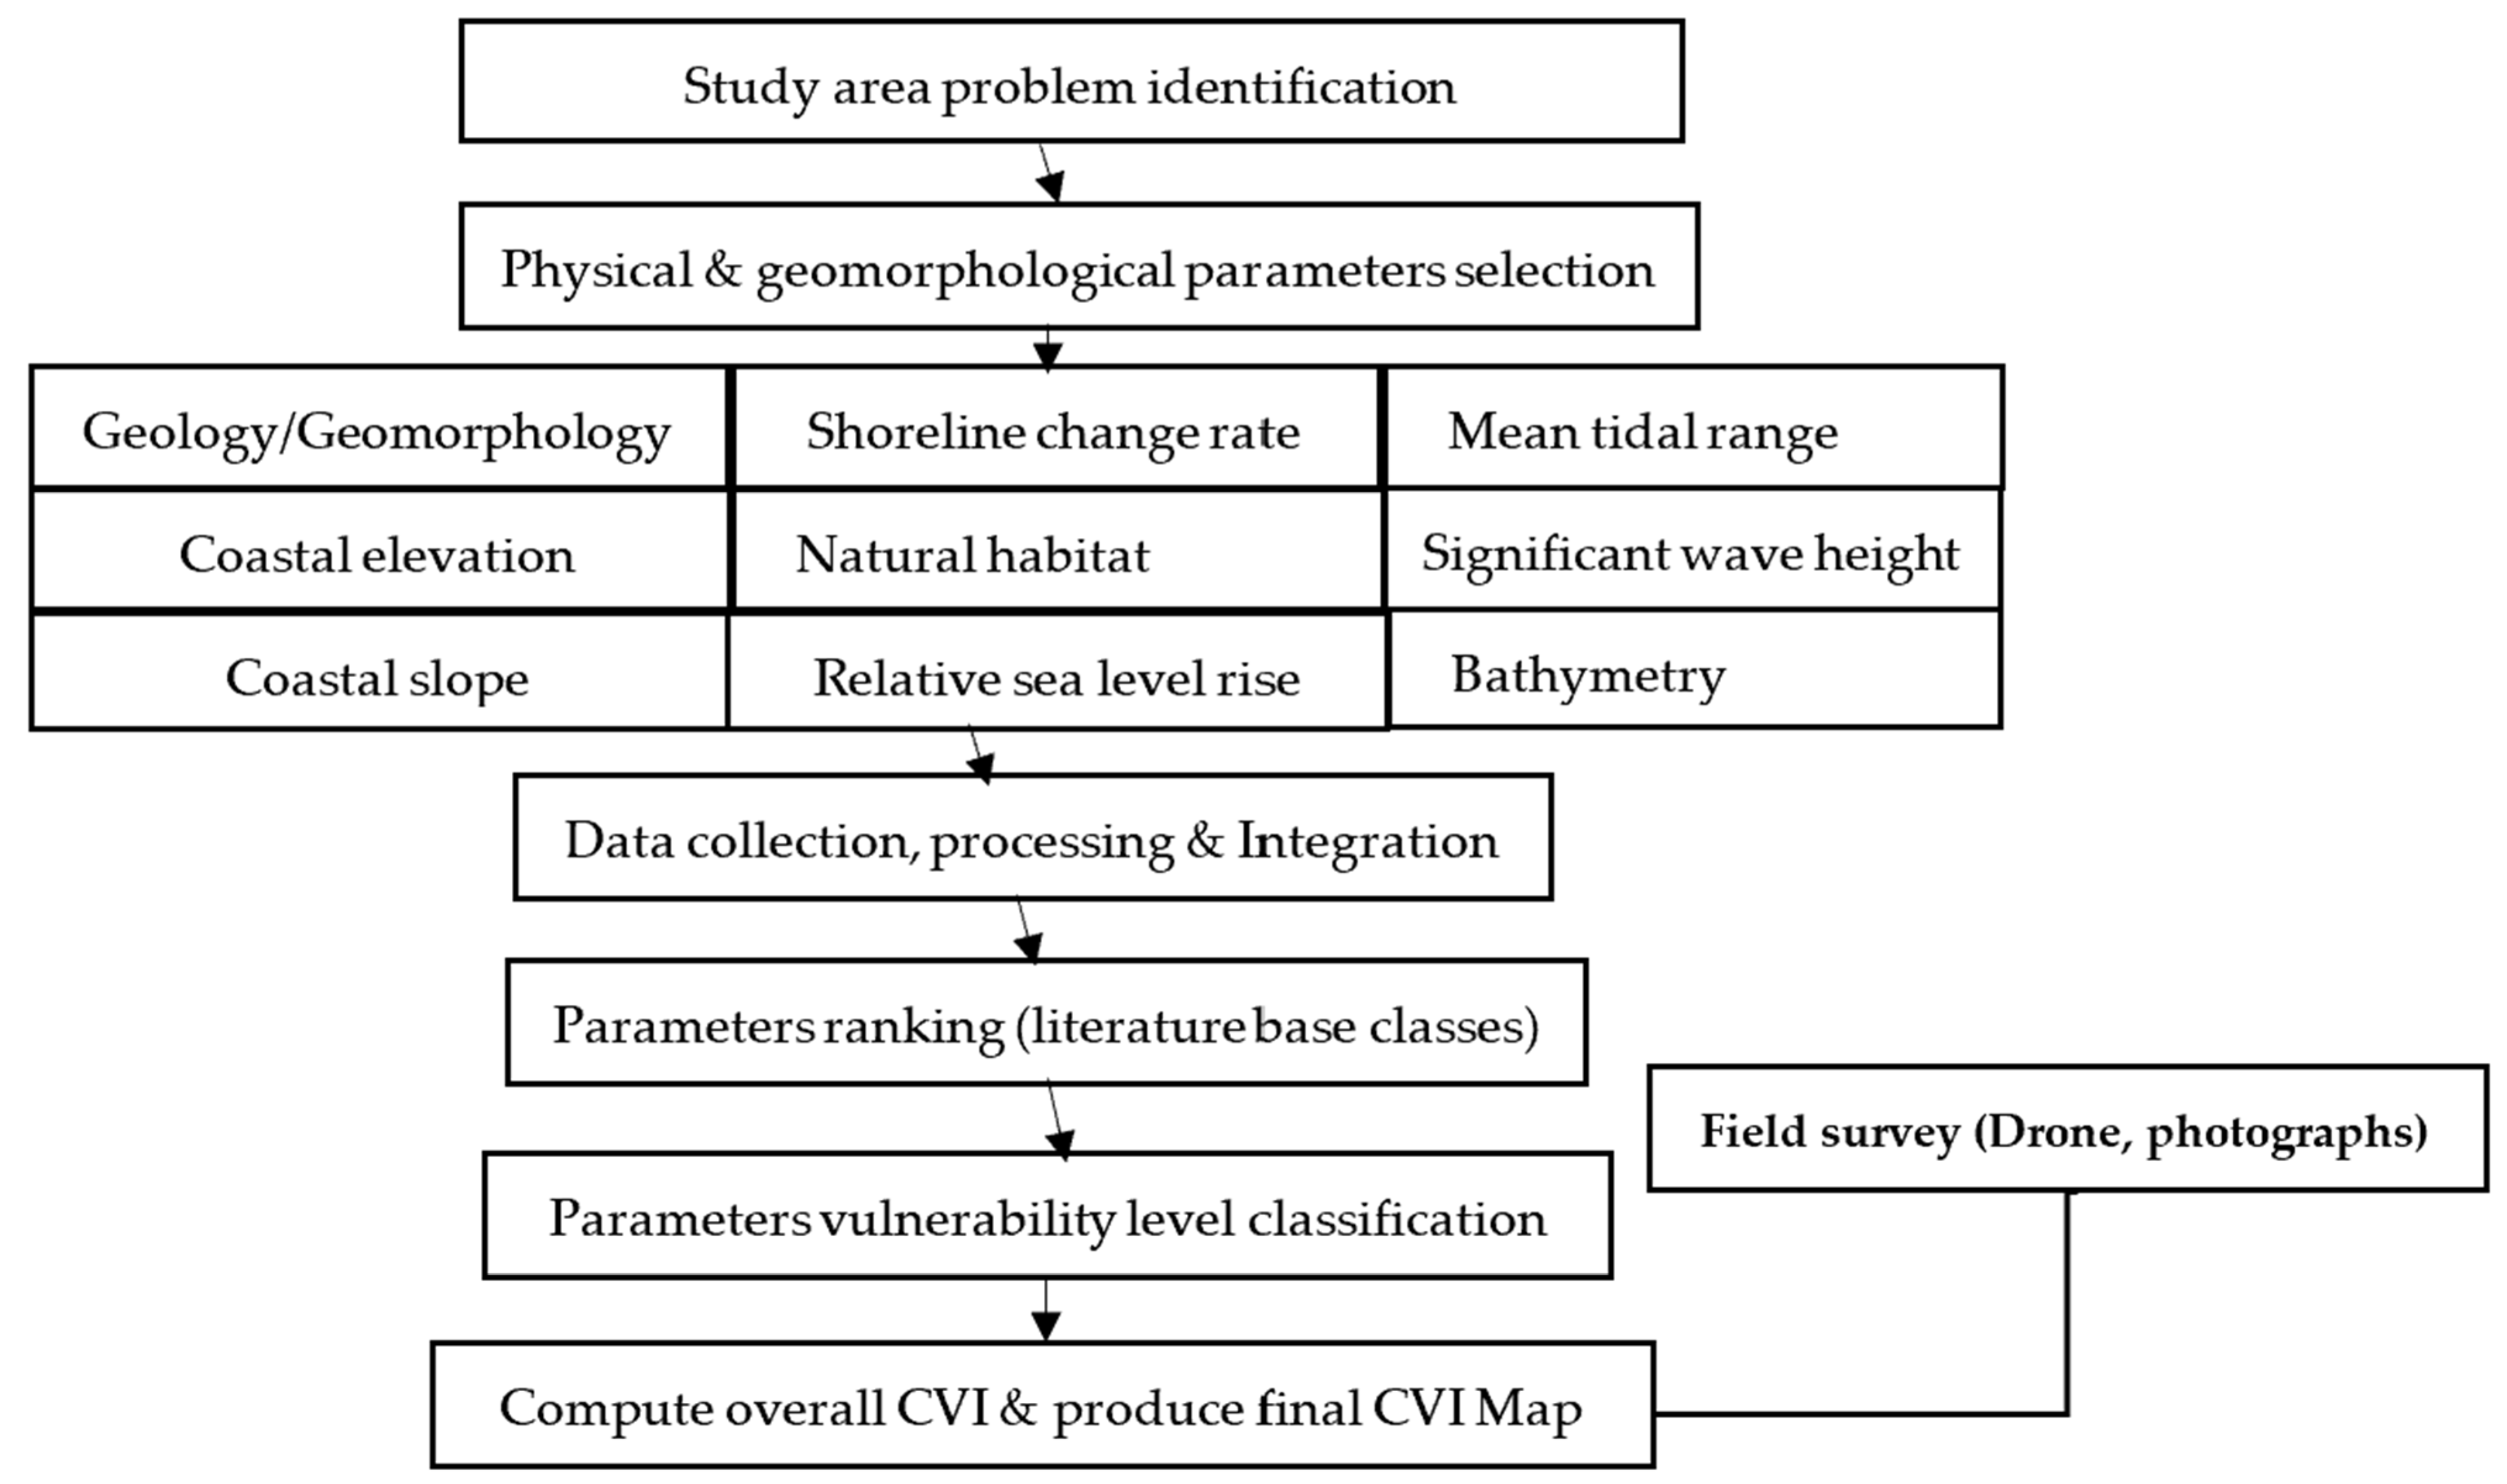
We assembled a total of nine geomorphological and physical parameters and their sources (Table 1)—geology/geomorphology, elevation (m), slope (%), shoreline change rate (m year−1), natural habitat, bathymetry (m), mean significant wave height Hs_sHs (m), mean tidal range (m), and relative sea level change (mm year−1)—to map relative coastal vulnerability along the coast of Monrovia. Open-access datasets from the United States Geological Survey (USGS), OpenTopography, Copernicus Data Space Ecosystem, NOAA, and the Copernicus Marine Service were downloaded, pre-processed, and clipped to the study area prior to parameter extraction. The spatial resolution of datasets ranges from 10 m (Sentinel 2) to 30 m (Shuttle Radar Topography Mission and Landsat), while temporal coverage spans multi-decadal reanalysis products to recent in situ measurements. The overall CVI workflow is summarized in Figure 2.
Table 1.
Selected parameters, data sources, and temporal coverage used to assessed coastal vulnerability of the coast of Monrovia.
Figure 2.
Flowchart of the methodology used to assessed coastal vulnerability of the coast of Monrovia.
The datasets incorporated in this study differ in spatial resolution and temporal coverage. Multi-decadal climatological means (e.g., wave height and sea level trend) represent long-term forcing conditions, whereas shorter observational windows (e.g., tidal range) reflect recent representative measurements. Given the screening-scale objective of the CVI, all datasets are treated as representative indicators of relative exposure rather than temporally synchronous measurements. This distinction is important for transparency and reproducibility.
2.3. CVI Parameters: Definition and Ranking
The coastal vulnerability index (CVI) is a widely used, as it represents a transparent screening method for evaluating relative coastal vulnerability [27]. In this study, we followed established formulations of [9,28,29,30] and compiled the parameters listed in Table 2 to map each of coastal vulnerability. The present implementation adheres to classical physical CVI formulations in parameter structure and equal weighting. Local adaptations include parameter threshold adjustment to reflect site-specific ranges and the use of continuous transect-based sampling to enhance spatial resolution along the 21 km coastline. Within the CVI framework, ranking procedures normalize these differences to ensure comparability at the screening scale. Quantile classification was applied during parameter ranking to standardize heterogeneous datasets within a comparable ordinal scale. Final CVI class grouping using Jenks natural breaks serves cartographic visualization purposes and does not imply physically defined threshold values. This distinction prevents artificial enforcement of uniform class proportions in the final vulnerability interpretation.
Table 2.
Assigned vulnerability ranking of each parameter based on previous studies.
We mapped each parameter along the 21 km coastline at each DSAS transect line (Table 3) and reclassified values to the CVI ranks of 1 to 5 (very low to very high) using the thresholds in Table 2. The subsections below summarize the acquisition, processing, evaluation, and mapping of each variable used in the CVI.
Table 3.
Dataset of the nine selected parameters of the coastal vulnerability index.
2.3.1. Geology/Geomorphology
The coastal geology/geomorphology is defined as the physical landform type along the coastline (e.g., sandy beaches and rocky cliffs). It governs how coastal terrain responds to extreme events and rising sea levels [31]. The intrinsic resistance of the coastline to wave-driven erosion depends on the existing landforms [9]. Using satellite imagery supported by a field/drone survey, we mapped two landforms—segmented sandy beaches, and a rocky cliff (Figure 1)—in a vector layer, which were ranked as per [9]: rocky cliffed coast (1) and sand beaches (5).
2.3.2. Coastal Elevation
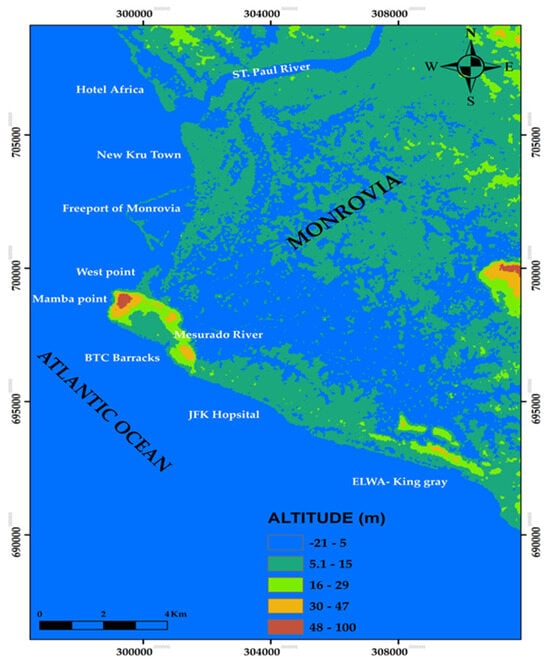
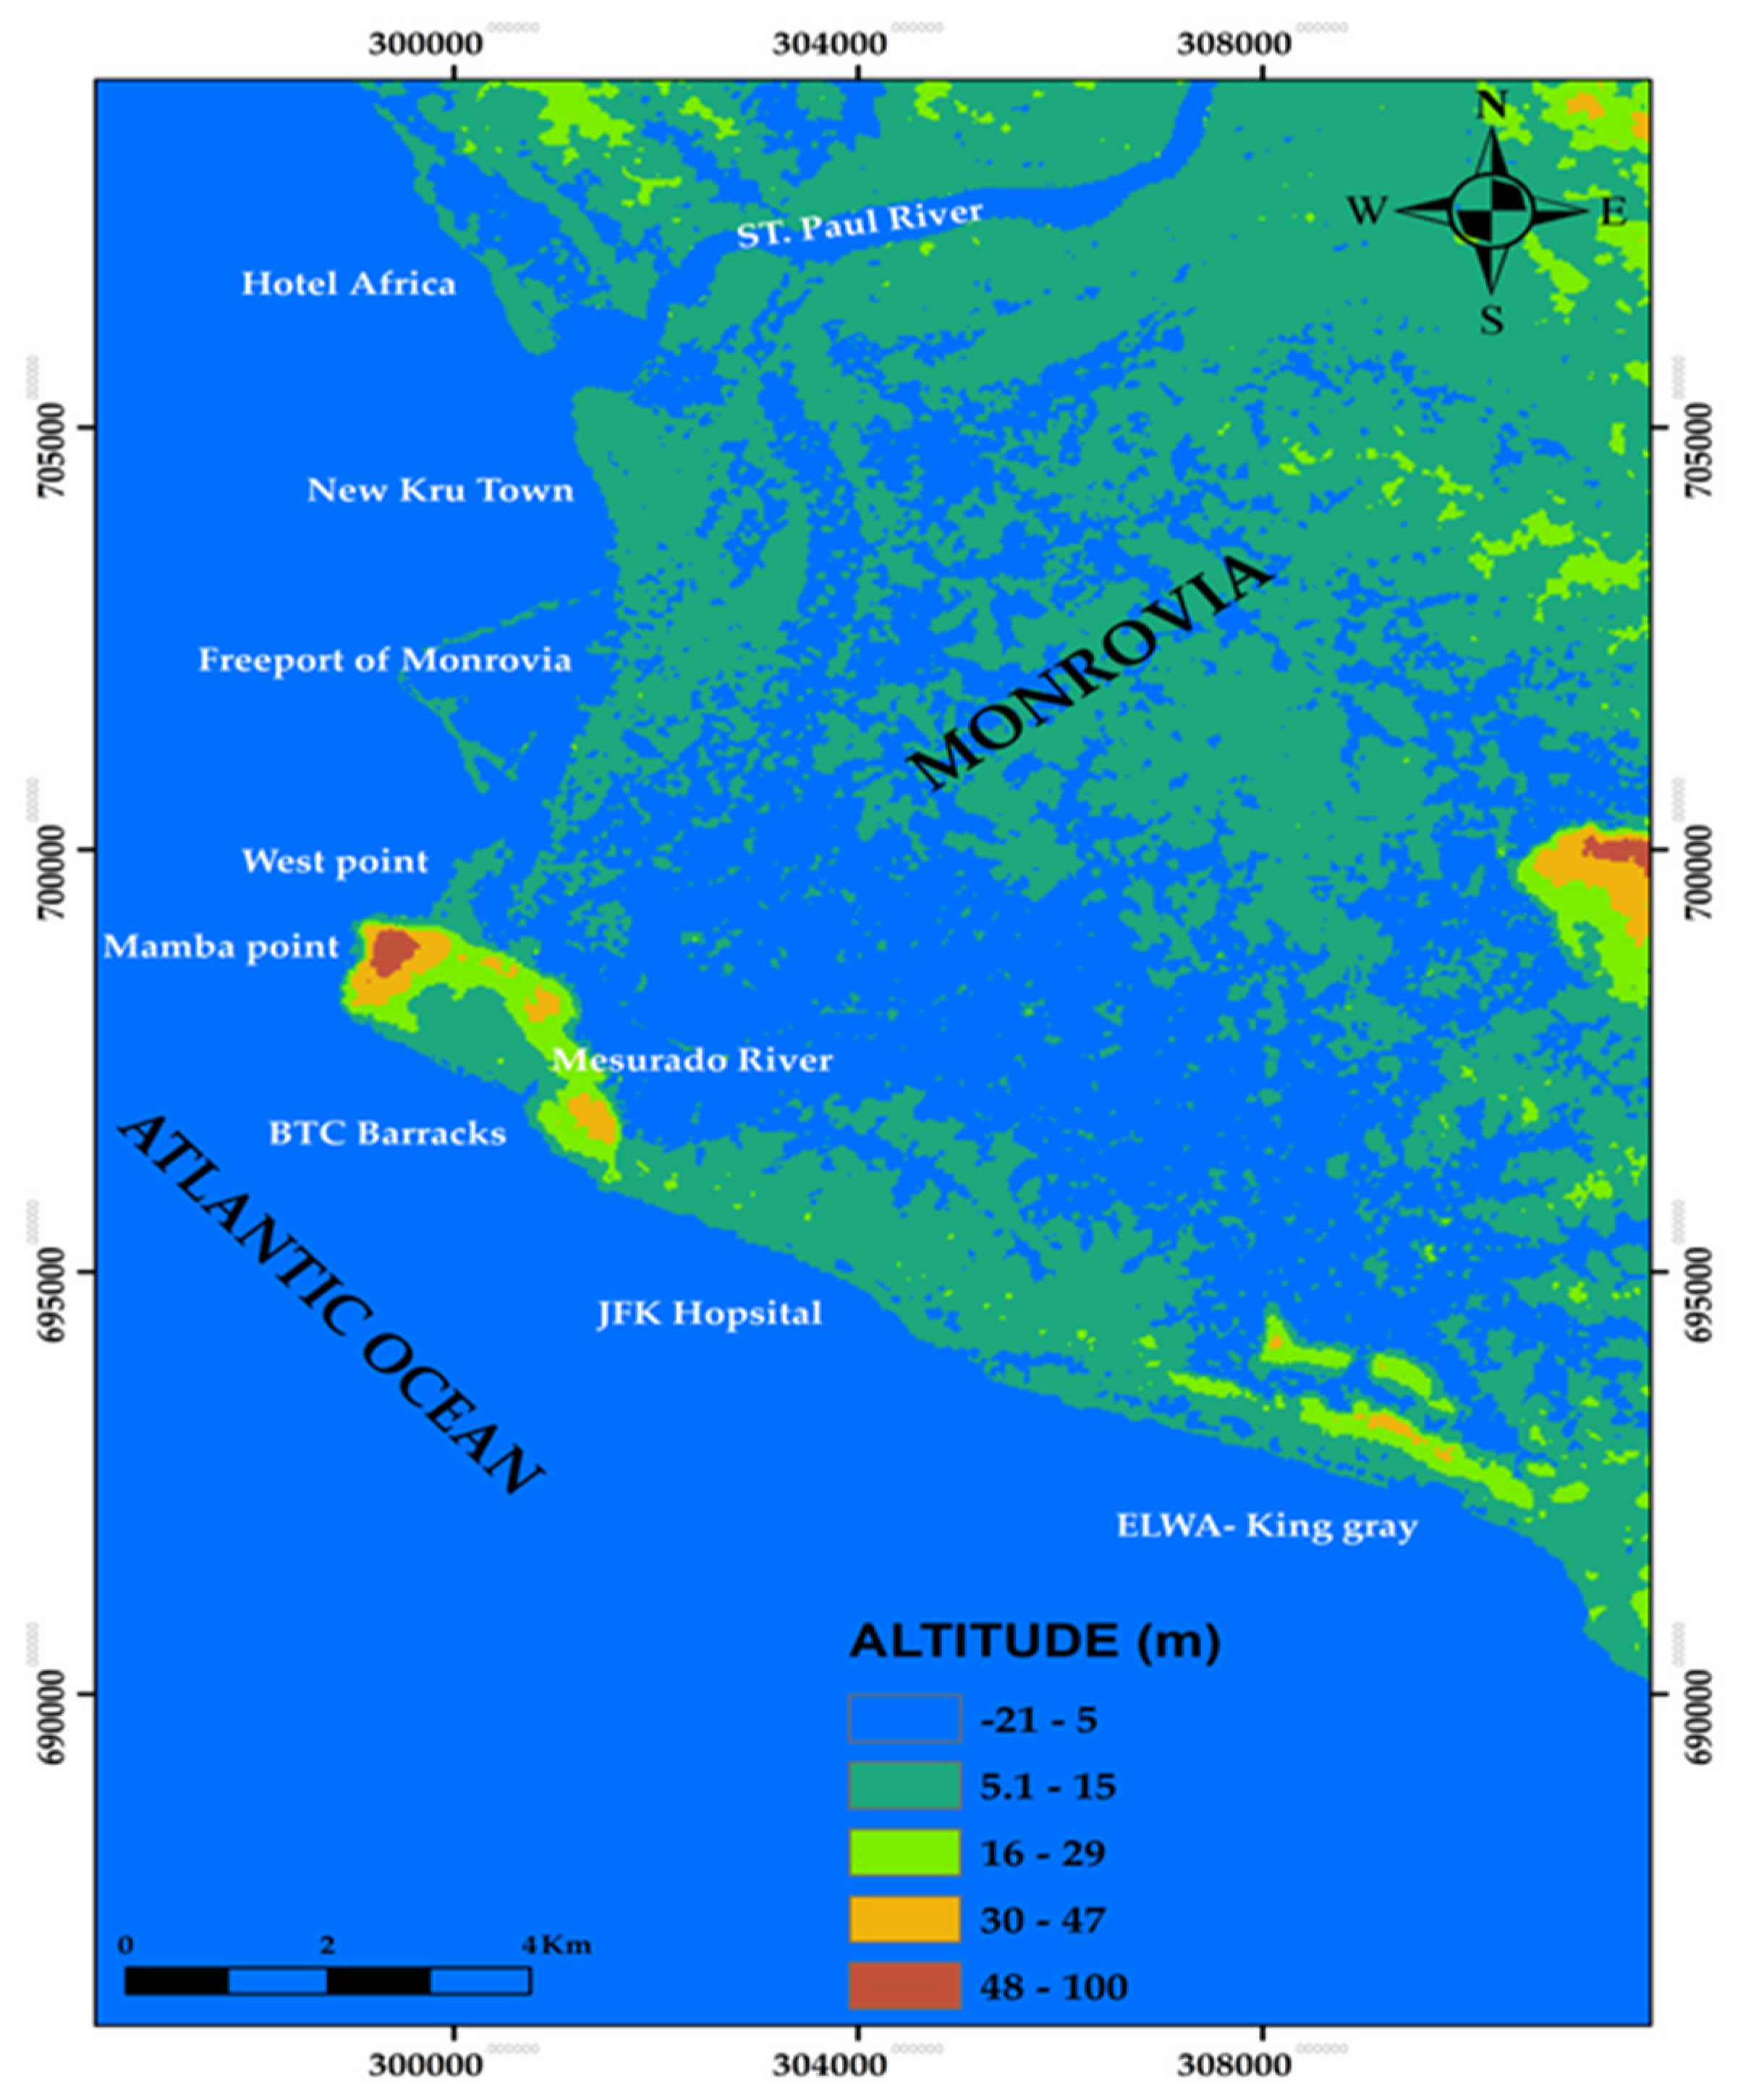
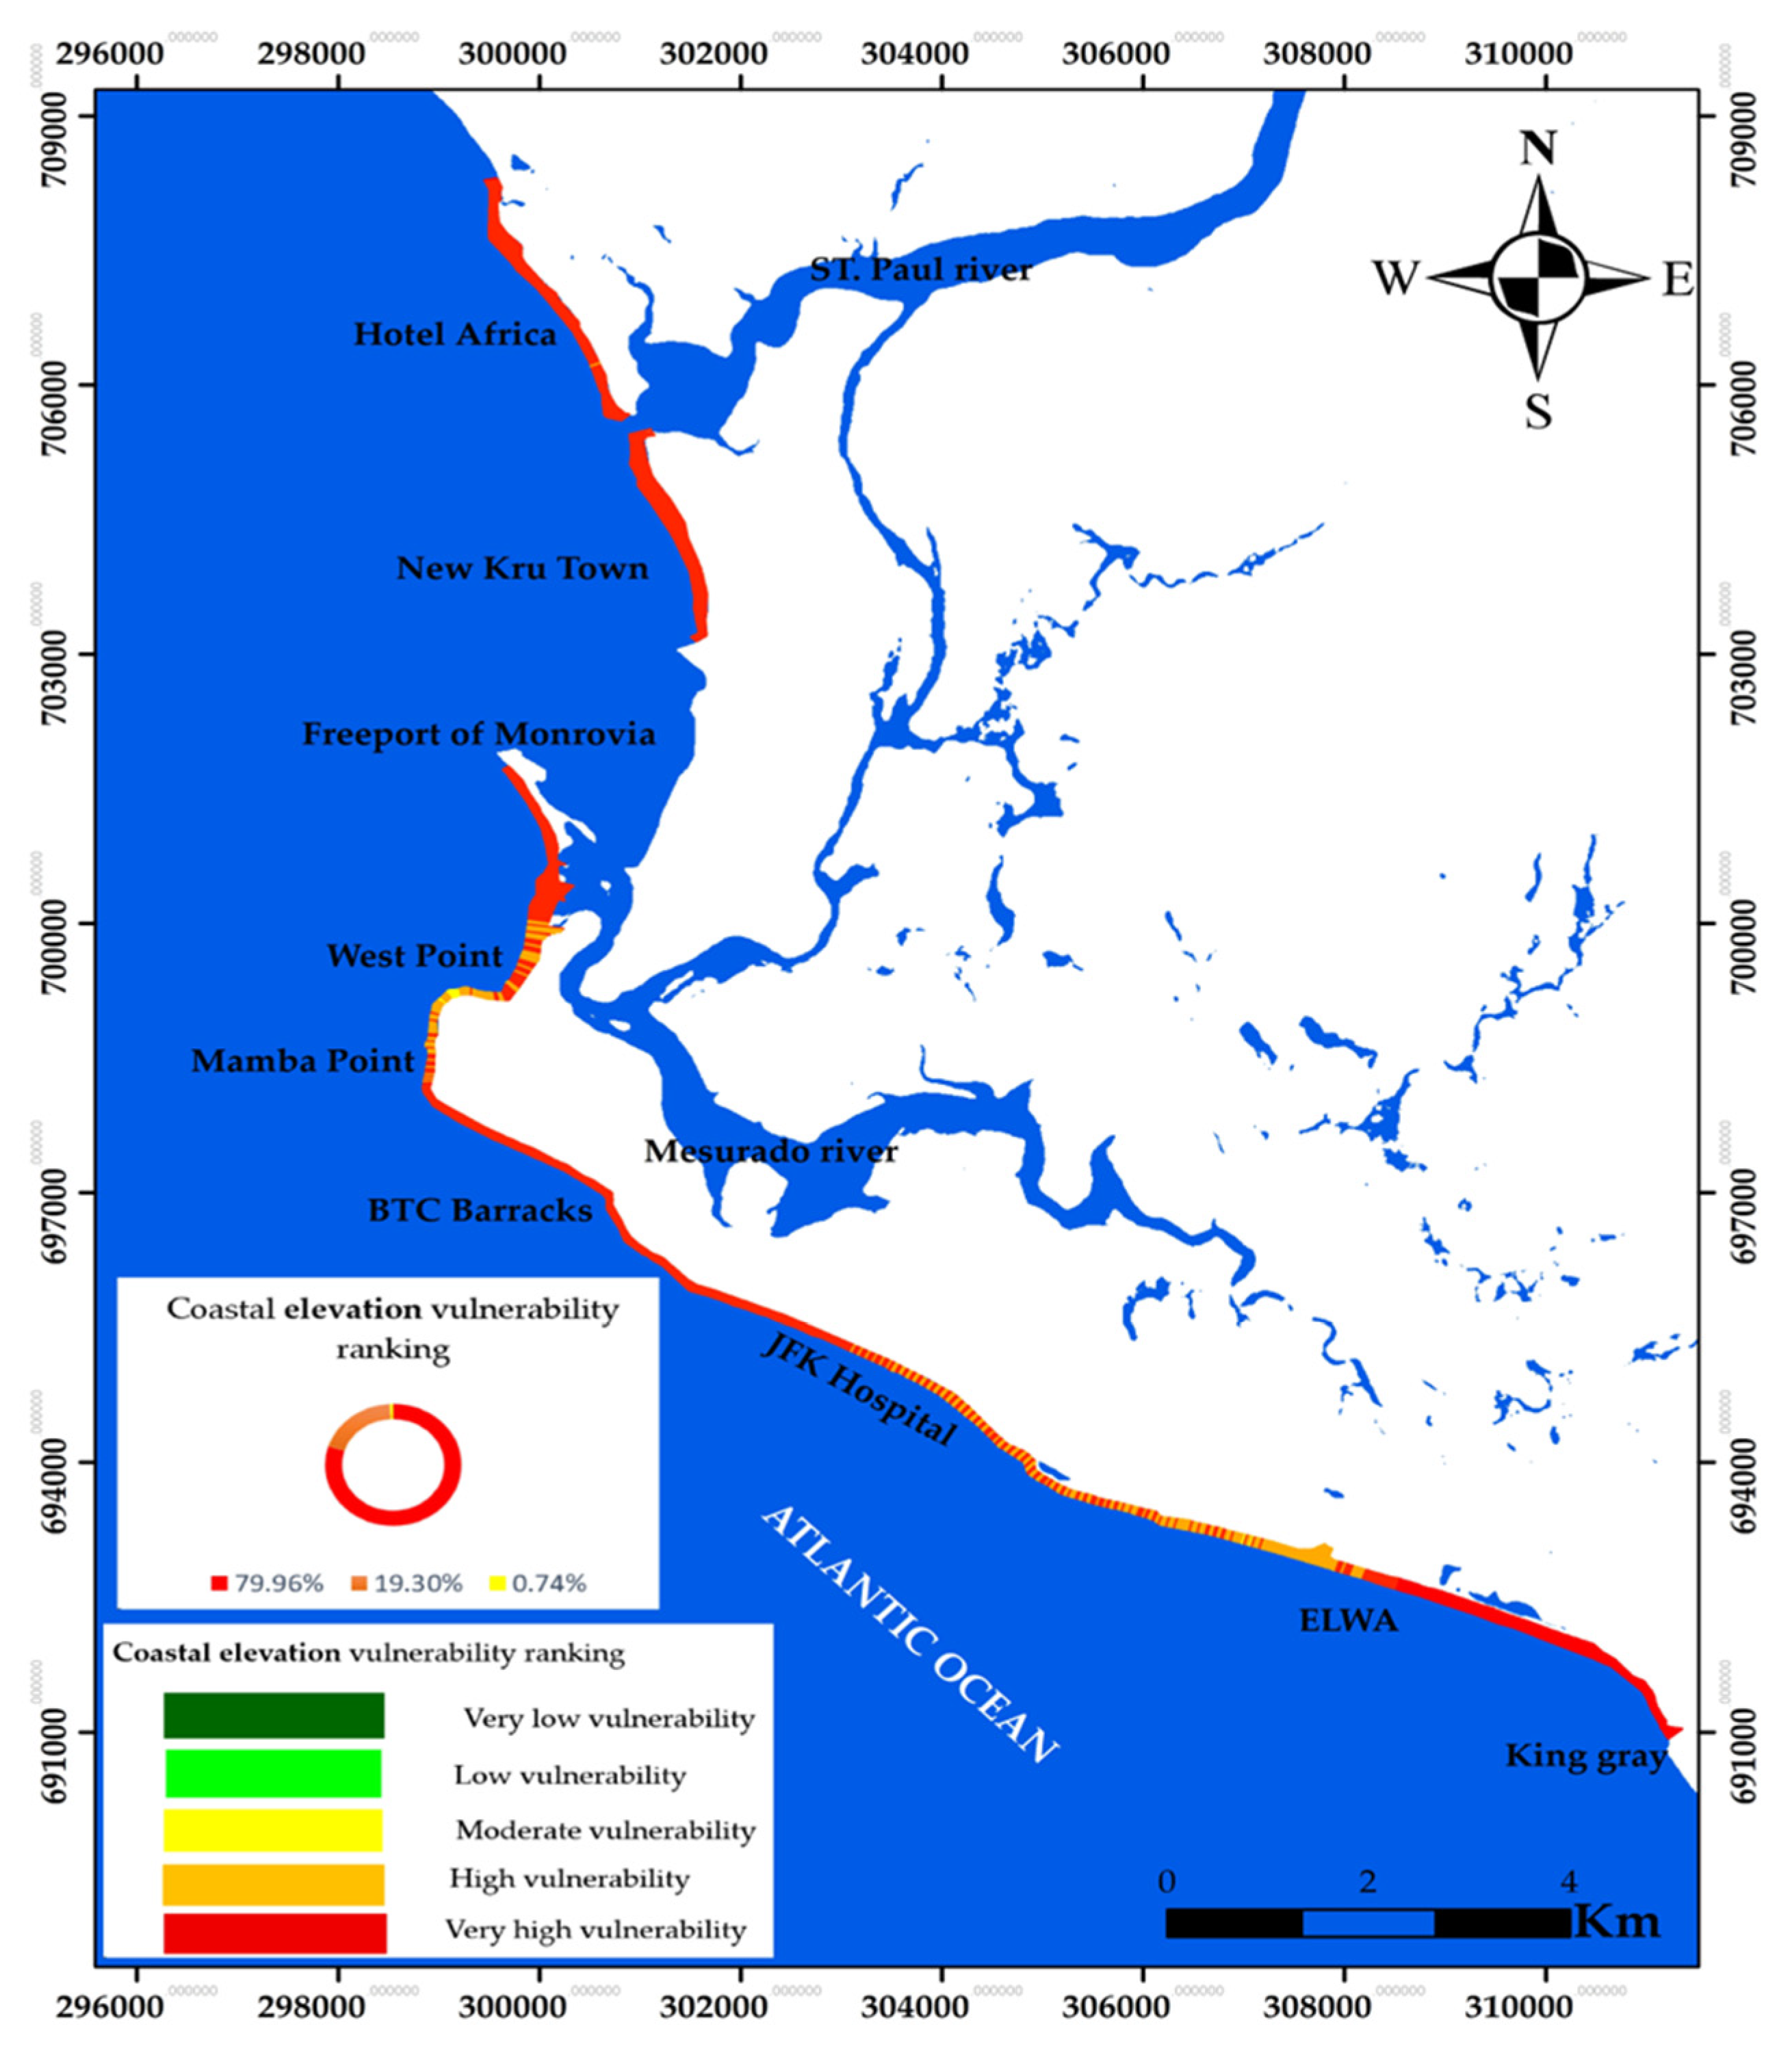
Coastal elevation informs: (1) the extent susceptible to inundation from sea level rise, (2) potential accommodation space for wetland migration, and (3) the exposure of people and infrastructure [32]. Higher elevations are generally less vulnerable to inundation and storm surge [32]. We derived elevation from the Shuttle Radar Topography Mission Global 1 (SRTM GL1) 30 m Digital Elevation Model (DEM) 2013 raster obtained via OpenTopography and checked it with in situ data of 2018 from CDR International/Shore Monitoring prior to extracting elevation points in ArcGIS 10.5 (Figure 3). The extracted values were ranked following [29]: 10 to <20 (3), 5 to <10 (4), and <5 (5).
Figure 3.
Coastal elevation map of the province of Monrovia.
The 30 m SRTM DEM provides regional-scale topographic representation; however, vertical accuracy limitations (±5–10 m depending on the terrain and vegetation) may influence vulnerability classification in low-relief coastal environments. While adequate for screening-scale assessment, higher-resolution LiDAR data would improve precision in future studies.
2.3.3. Coastal Slope
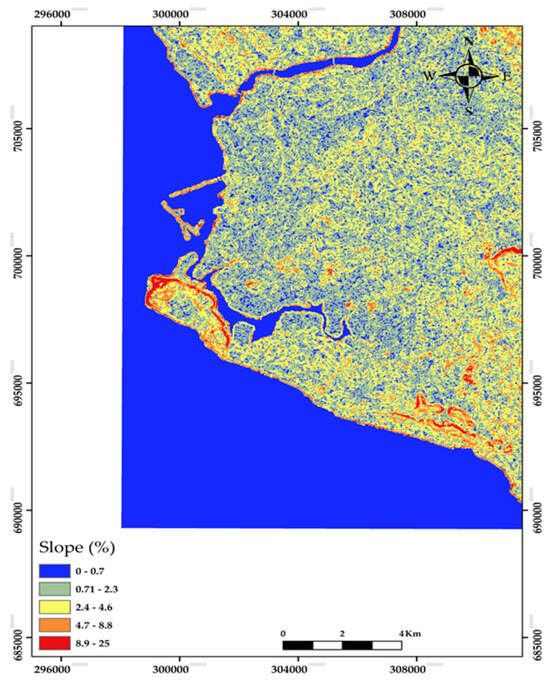
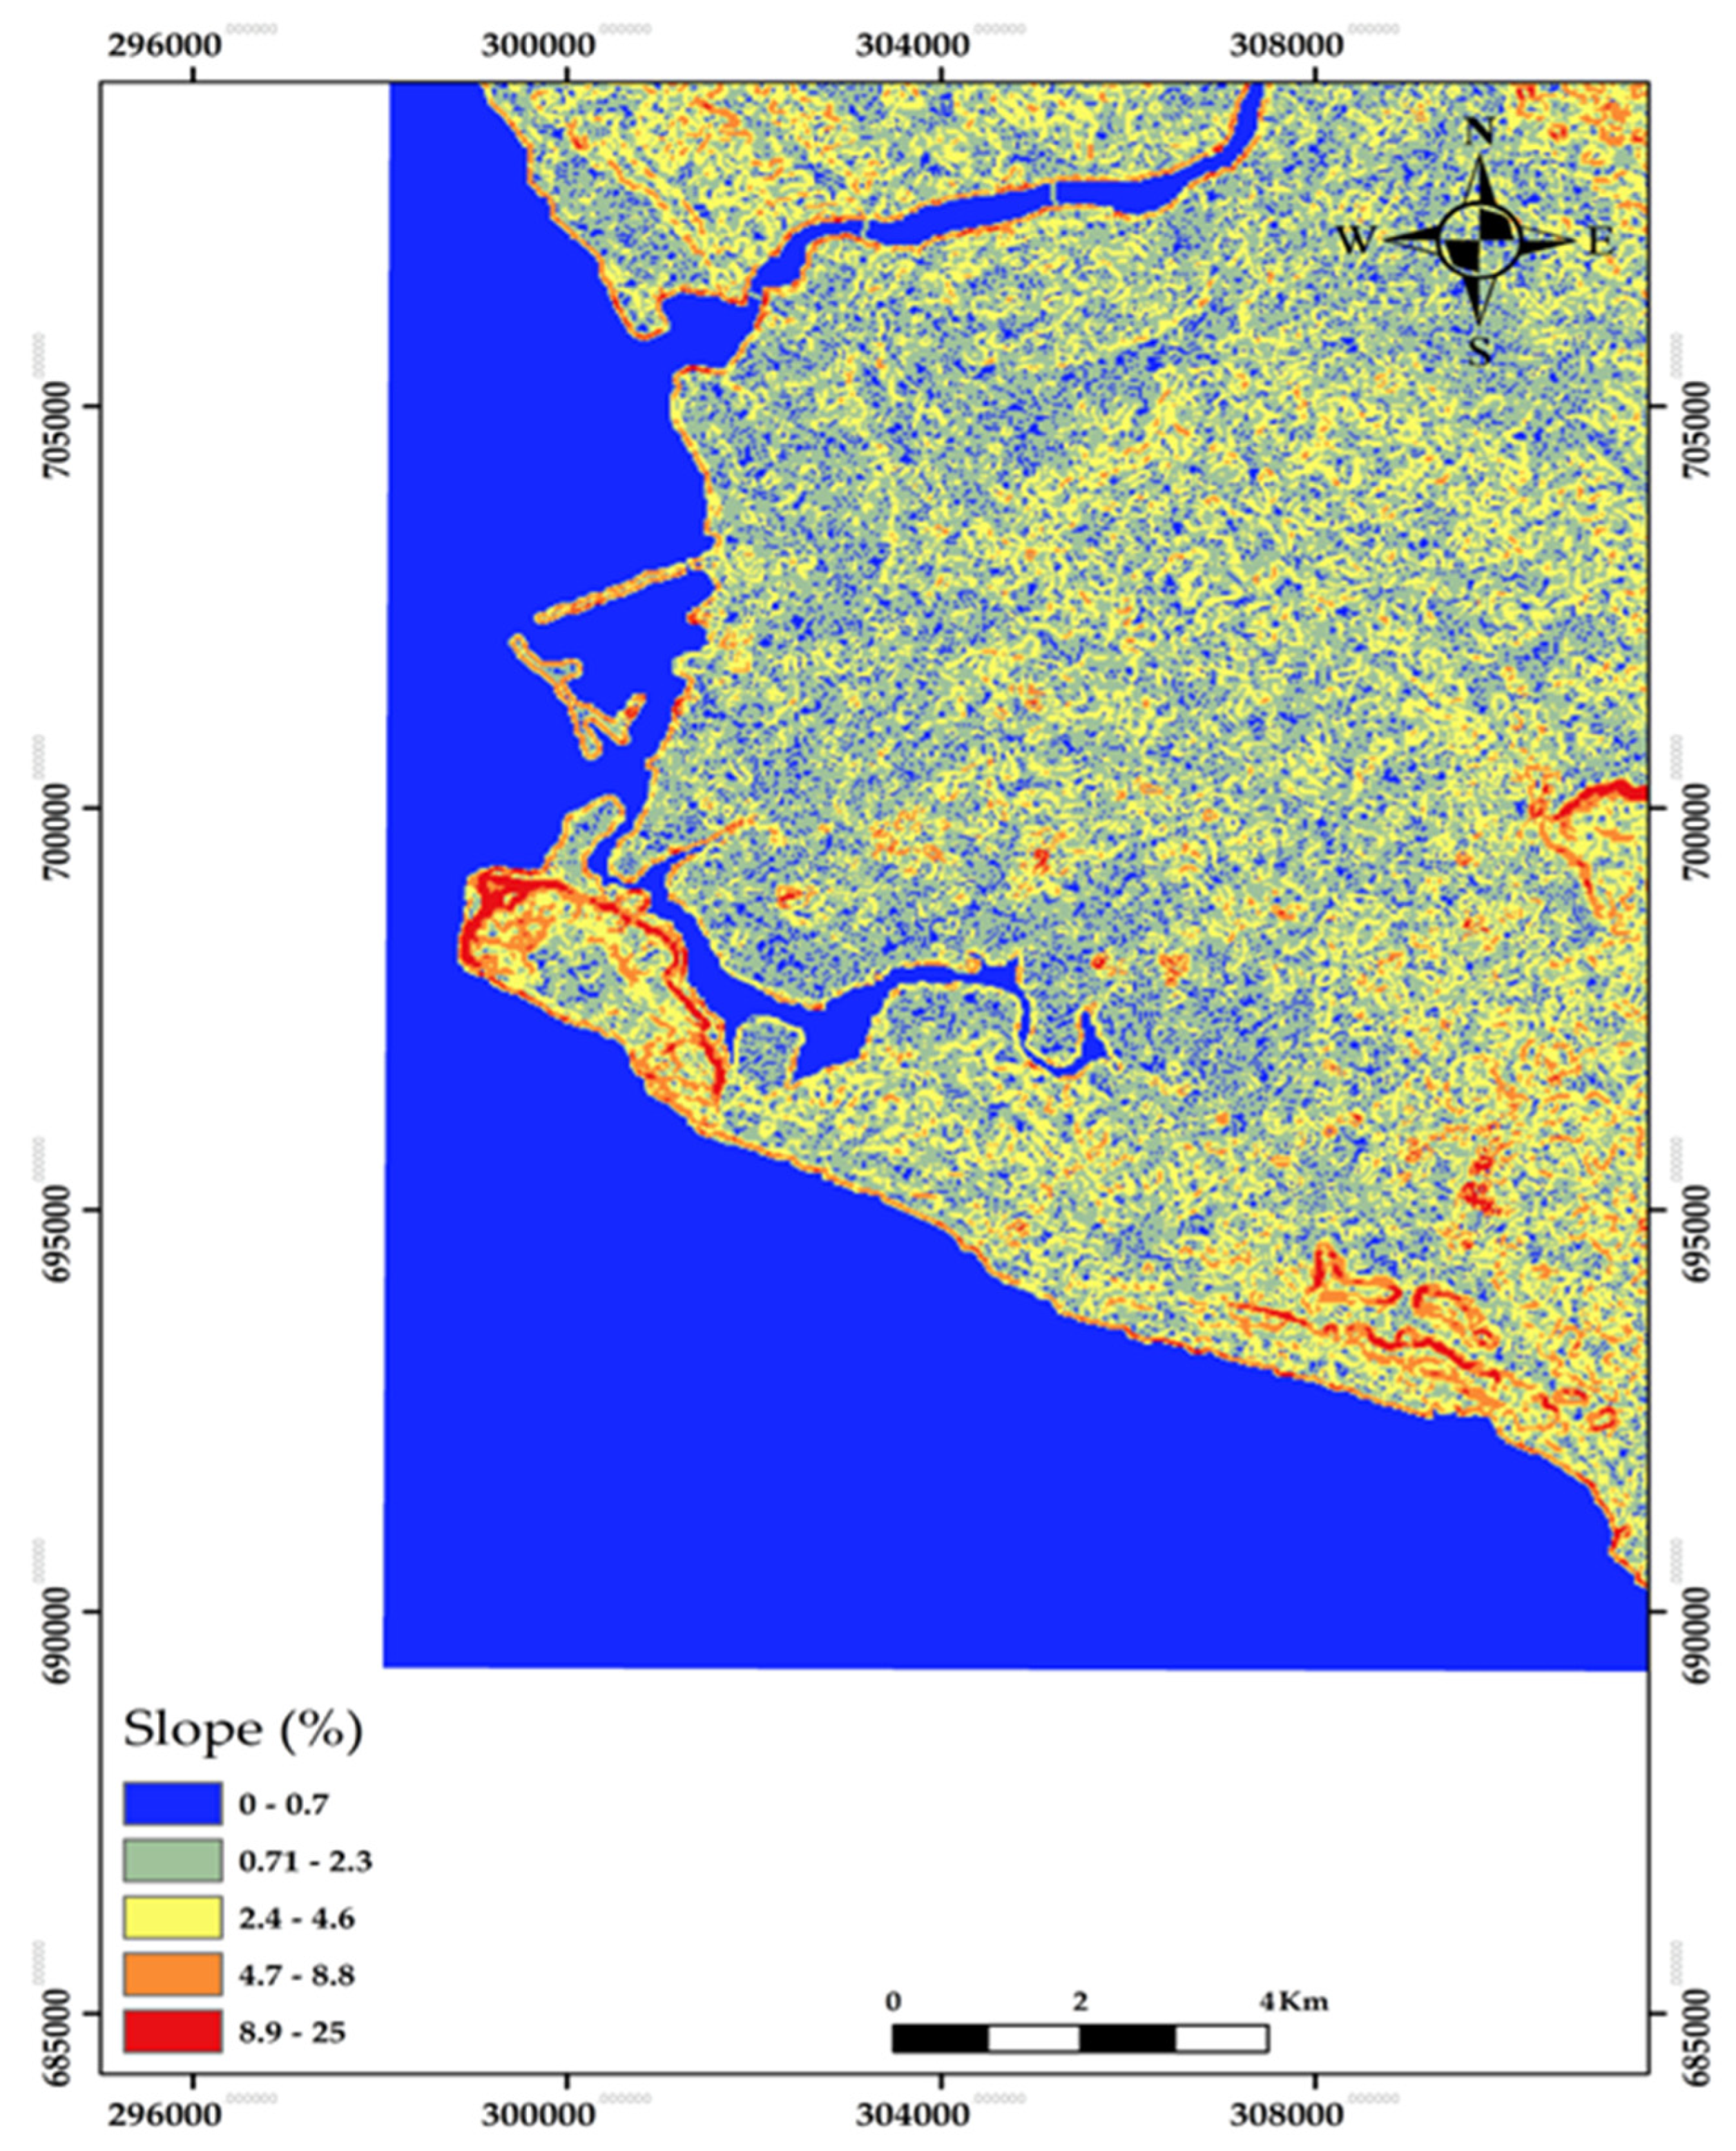
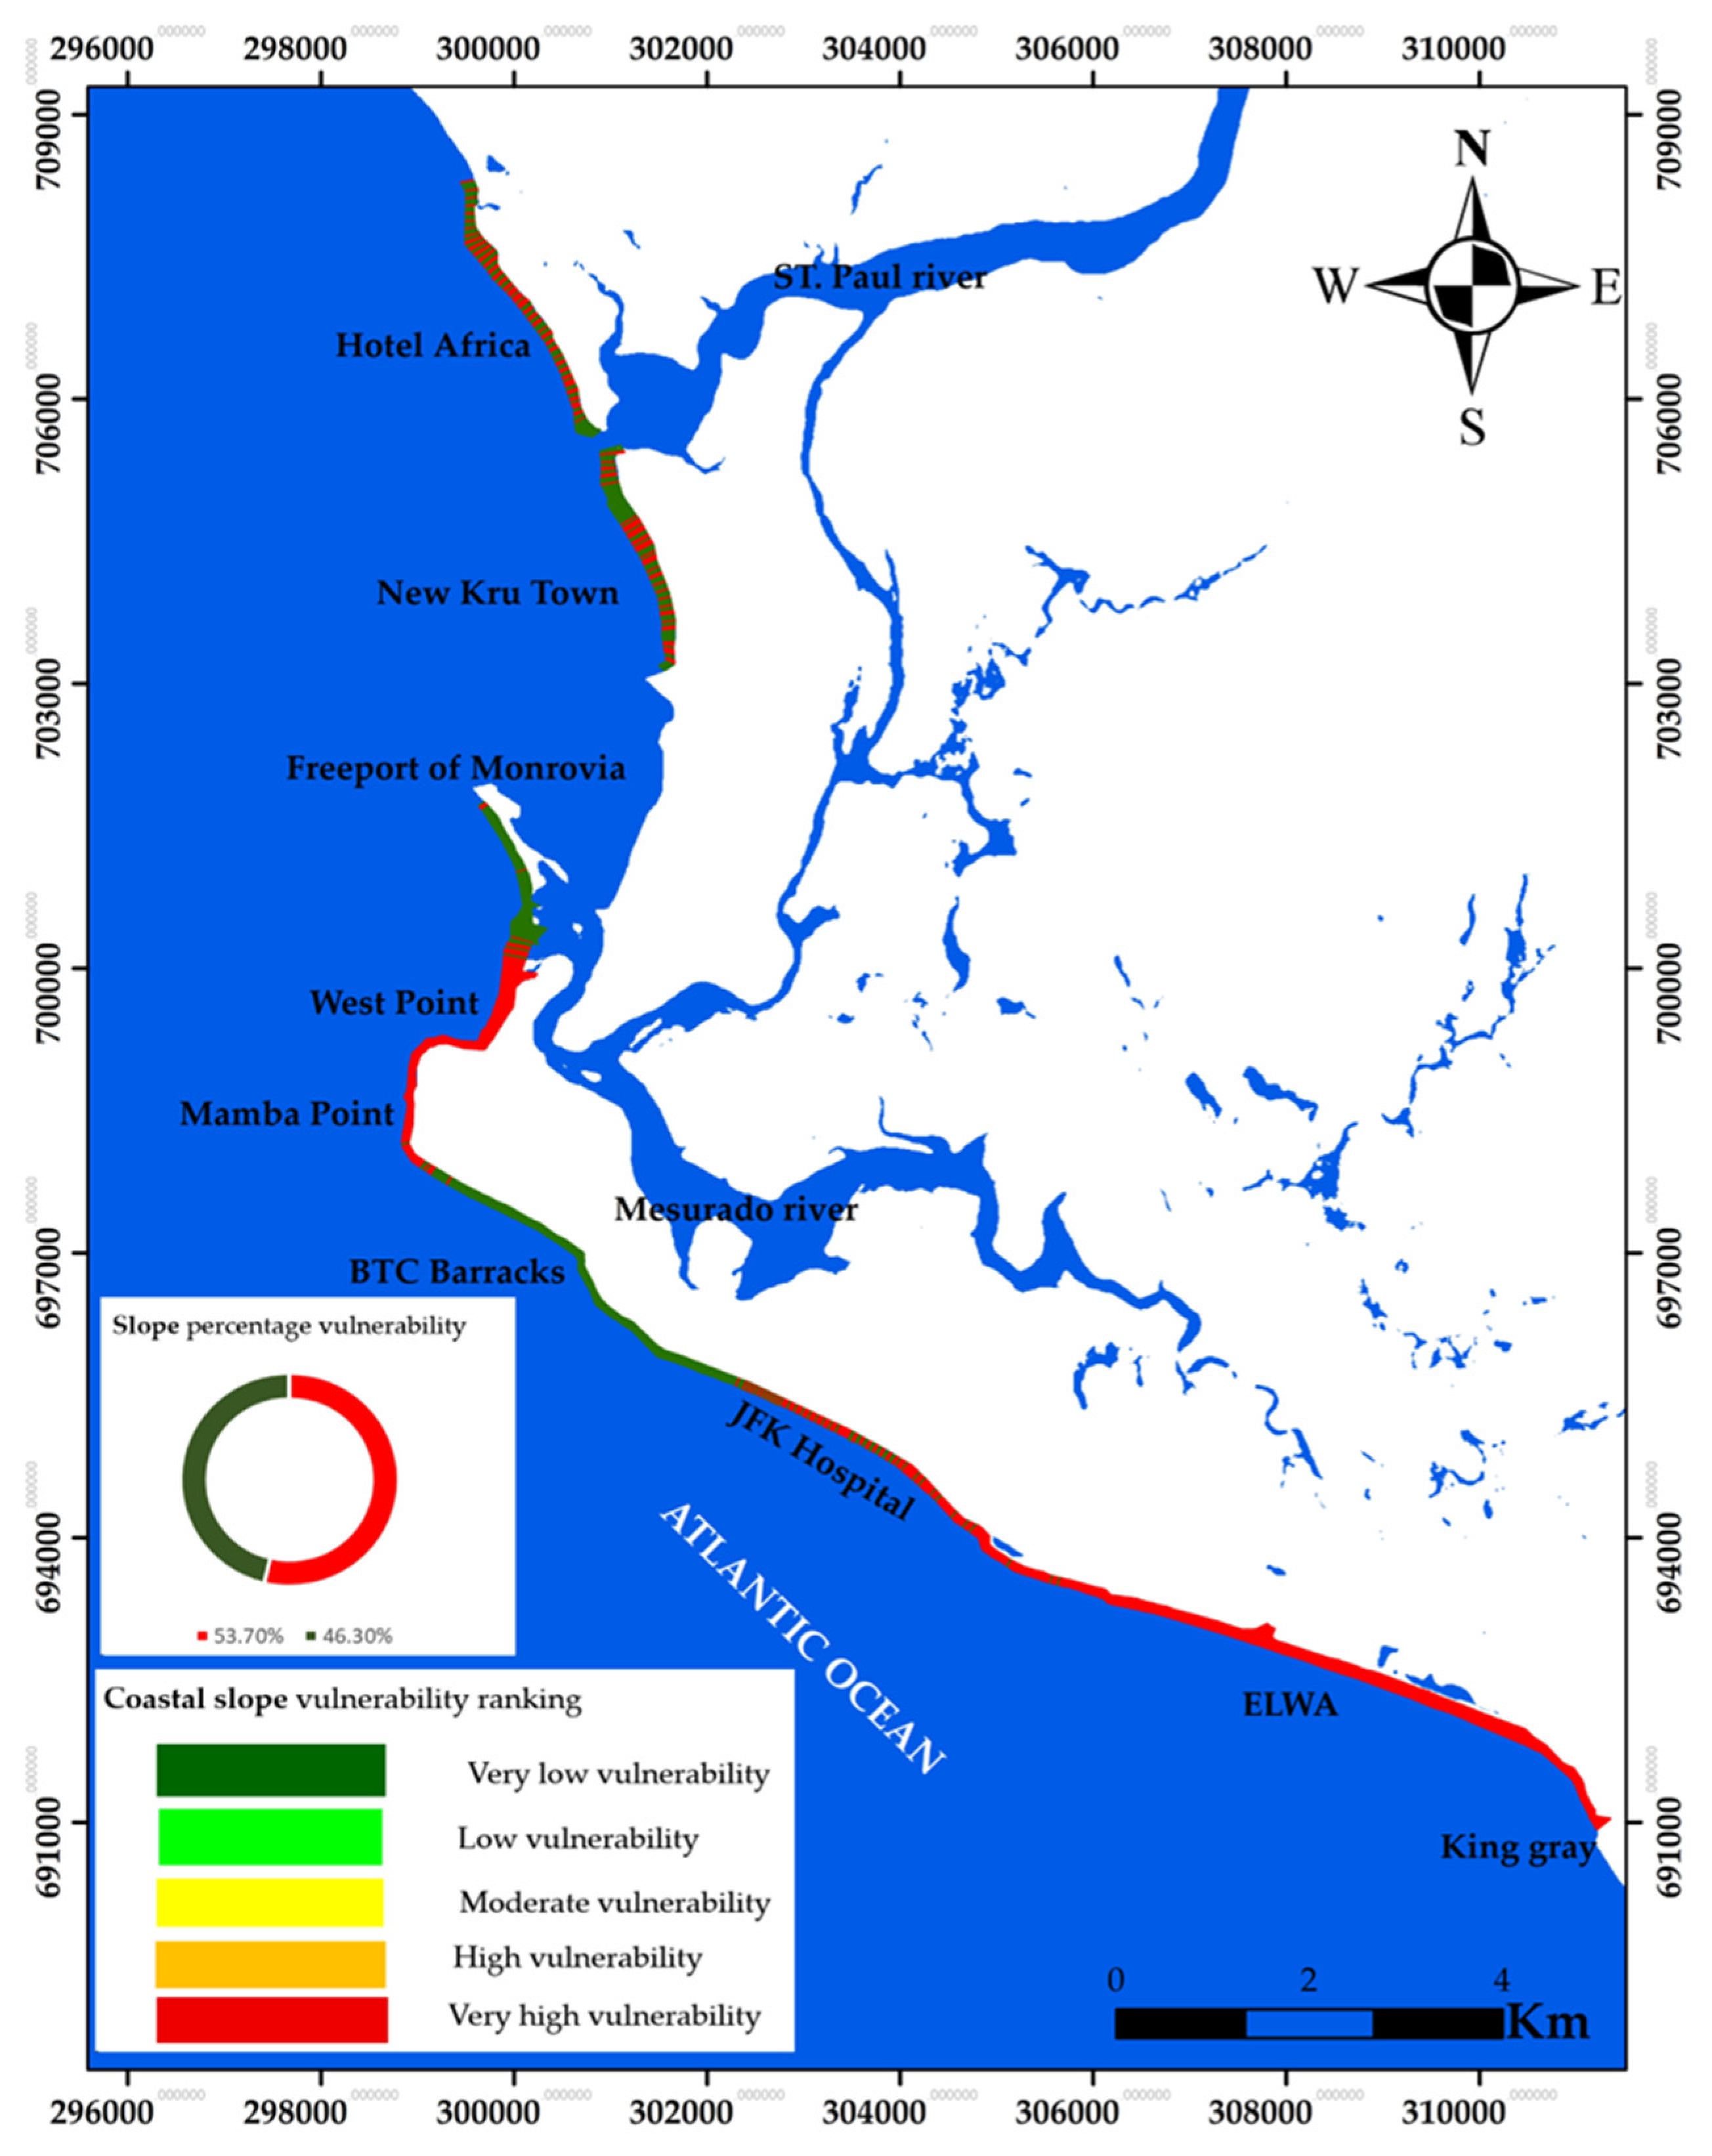
Coastal slope—the steepness or flatness of the nearshore/backshore—correlates with flooding potential and shoreline retreat [9]. Ref. [16] characterizes most of the study coast as gently sloping, with steeper reaches adjacent to the rocky cliff. Ref. [15] found high vulnerability when slope is considered alone. From the Shuttle Radar Topography Mission Global 1 (SRTM GL1) 30 m Digital Elevation Model (DEM) 2013, we produced a percent-slope raster in ArcGIS (values 0–29%; Figure 4). DEM-derived percent slopes were ranked as per [9]: >20% (1) and <2.5% (5).
Figure 4.
Percentage slope map of the province of Monrovia.
2.3.4. Rate of Shoreline Change
In this study, “coastline” refers to the overall 21 km study reach along Monrovia, whereas “shoreline” refers to the mapped land–water interface extracted from satellite imagery for shoreline change analysis. It represents the position of the coast at a given time, which shifts overtime either by accretion, stability, or erosion. We used medium-resolution Landsat satellite 5 TM (1986) and Landsat 8 OLI (2025) scenes (30 m; USGS Earth Explorer) for the shoreline change analysis. While high-resolution DJI Air 2S (2025) orthophoto drone data and Sentinel-2 MSI (10 m; Copernicus) imagery were employed to extract a reference shoreline and ground-truth classifications but were not included in the trend analysis. A 1:7500 topographic map (1969; Liberia Geological Service) provided control for georeferencing to UTM WGS84 Zone 29N; ground control points were applied to minimize residual distortions [33]. We selected dry-season, low-tide scenes with minimal cloud, according to [34]. The shorelines were extracted using a threshold band-ratio method in ArcGIS 10.5, with a total position error, Ept = √(Ep2+Eg2+Ed2+Ew2) (m), and annualized error, Eα = Ept/39 (m year−1), calculated as per [5,35], as listed in (Table 4).
Table 4.
Data source and the estimated errors for each shoreline.
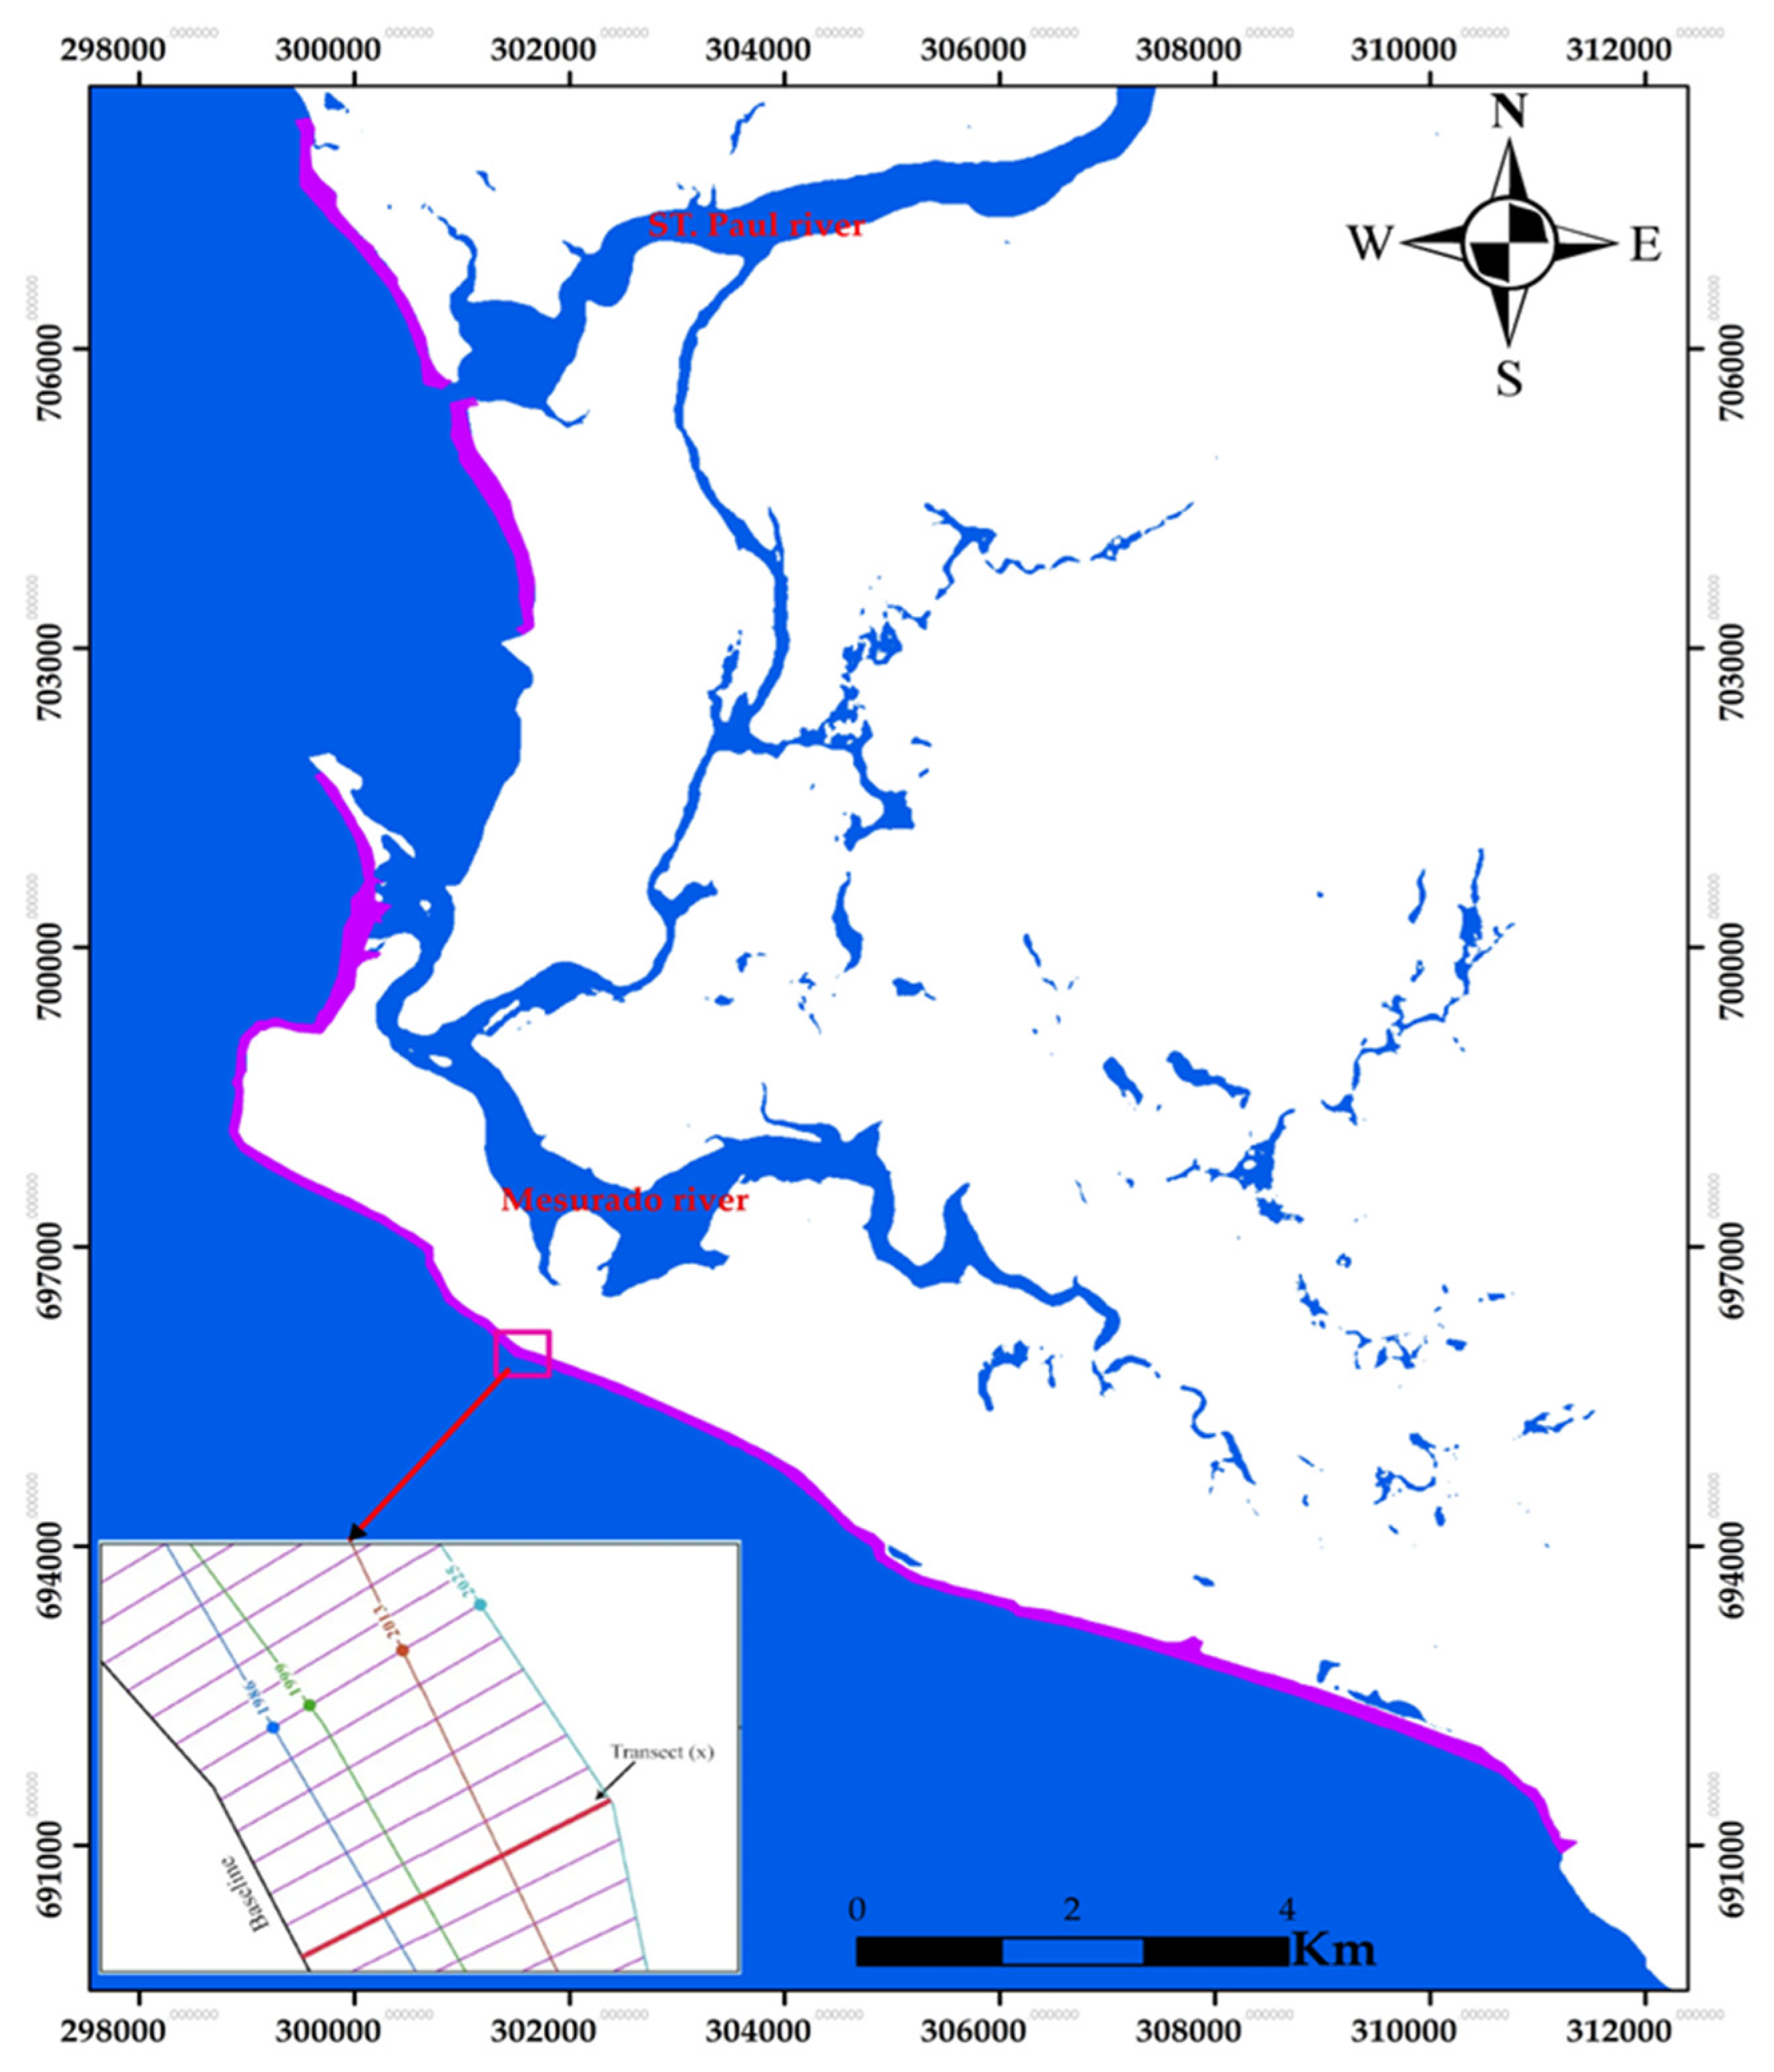
The DSAS transects were generated at 20 m spacing along the baseline, resulting in 1285 transects (Figure 5).
Figure 5.
Baseline (black), historical shorelines 1986 (blue), 1999 (green), 2013 (orange), 2025(cyan), and transects (n = 1285) cast along the coast of Monrovia.
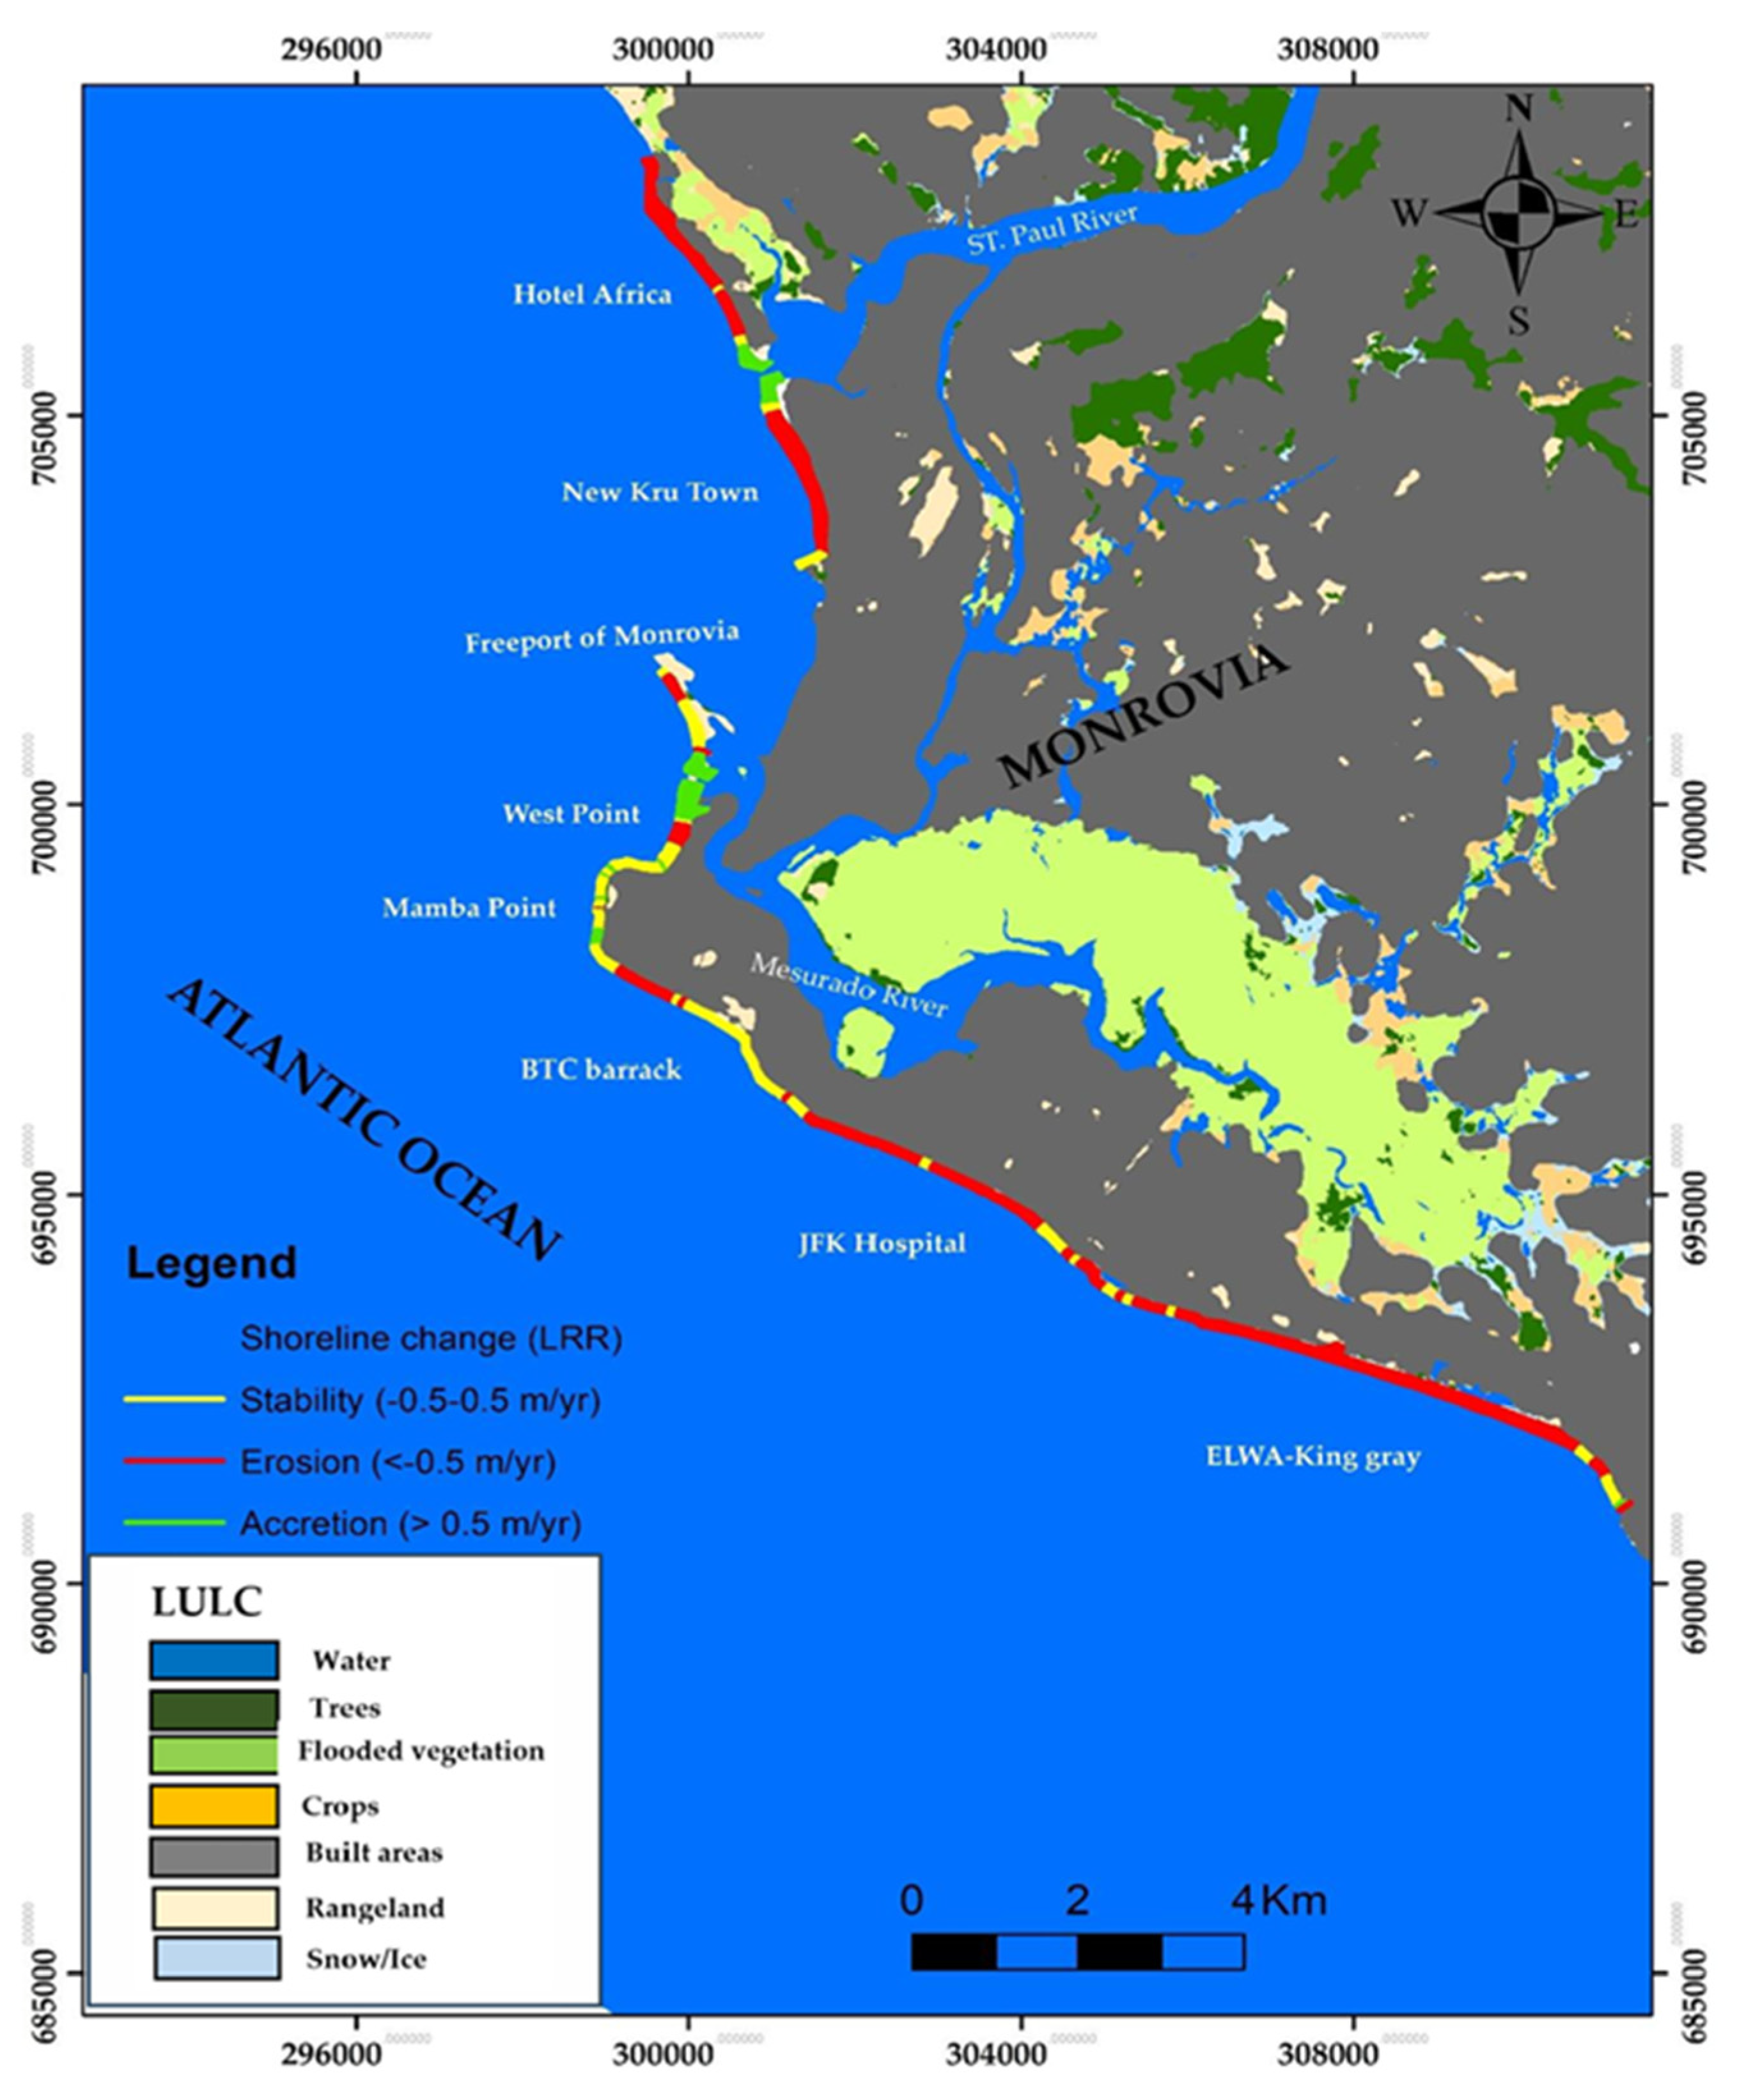
The shoreline change was computed using the Linear Regression Rate (LRR) in DSAS 5.0 to estimate long-term shoreline change (m year−1) (Figure 6). Although shoreline change estimation is based on two temporally separated Landsat epochs (1986 and 2025), the 39-year interval captures long-term morphodynamic adjustment and minimizes short-term variability effects.
Figure 6.
Shoreline change rate (erosion, accretion, and stability) results between 1986 and 2025, land use/land cover (LULC) along the coast of Monrovia.
Nevertheless, interannual fluctuations and storm-driven variability may not be fully resolved, and this limitation is acknowledged in the interpretation of the CVI results. Following the ranking of [9], the quantified shoreline change rate (LRR) was ranked as: >2 (1), 1.0 to −2.0 (2) −1.0 to 1.0 (3), and −1.1 to −2.0 (4). The LRR statistics show erosional trends along all of the sandy beaches, while localized accretion and stable state occur mostly at river mouths and the rocky cliffs. The rate of shoreline change is a key vulnerability parameter and is widely used to assess coastal dynamics and hazards.
2.3.5. Coastal Natural Habitat
Coastal ecosystems (e.g., coastal forests, mangrove, reefs, and cliffs) reduce disaster risk and support adaptation; degradation increases exposure through resource loss and livelihood change [36]. The degradation of ecosystems, which will deplete water and food resources, as well as changes in livelihoods owing to increased weather and climatic hazards, are the two reasons why climate change may raise the likelihood of disaster by making people more vulnerable to physical hazards [36].
Habitats reduce risk by attenuating waves and retaining sediment [37,38]. The field survey permits us to map features of low dune with declining vegetation as a vector layer along the coast. Using [30], the natural habitat was ranked as low dune (3).
2.3.6. Bathymetry
Bathymetry controls wave propagation and, hence, coastal forcing along the Monrovia coastline [16], and it supports flood/hydrodynamic modeling [32,39]. The bathymetry data collected along the study area by CDR International B.V and Shore Monitoring 2018 was integrated in ArcGIS and was joined to the attribute table after comparing against GEBCO global grids of 2023 and SRTM15+ (via OpenTopography) to map nearshore/offshore depths. Following [31], the depths were ranked as >−4 m (1), −4 m to −3 m (2), −3 m to −2 m (3), −2 m to −1 m (4), and <−1 m (5).
2.3.7. Relative Sea Level Rise (RSLR)
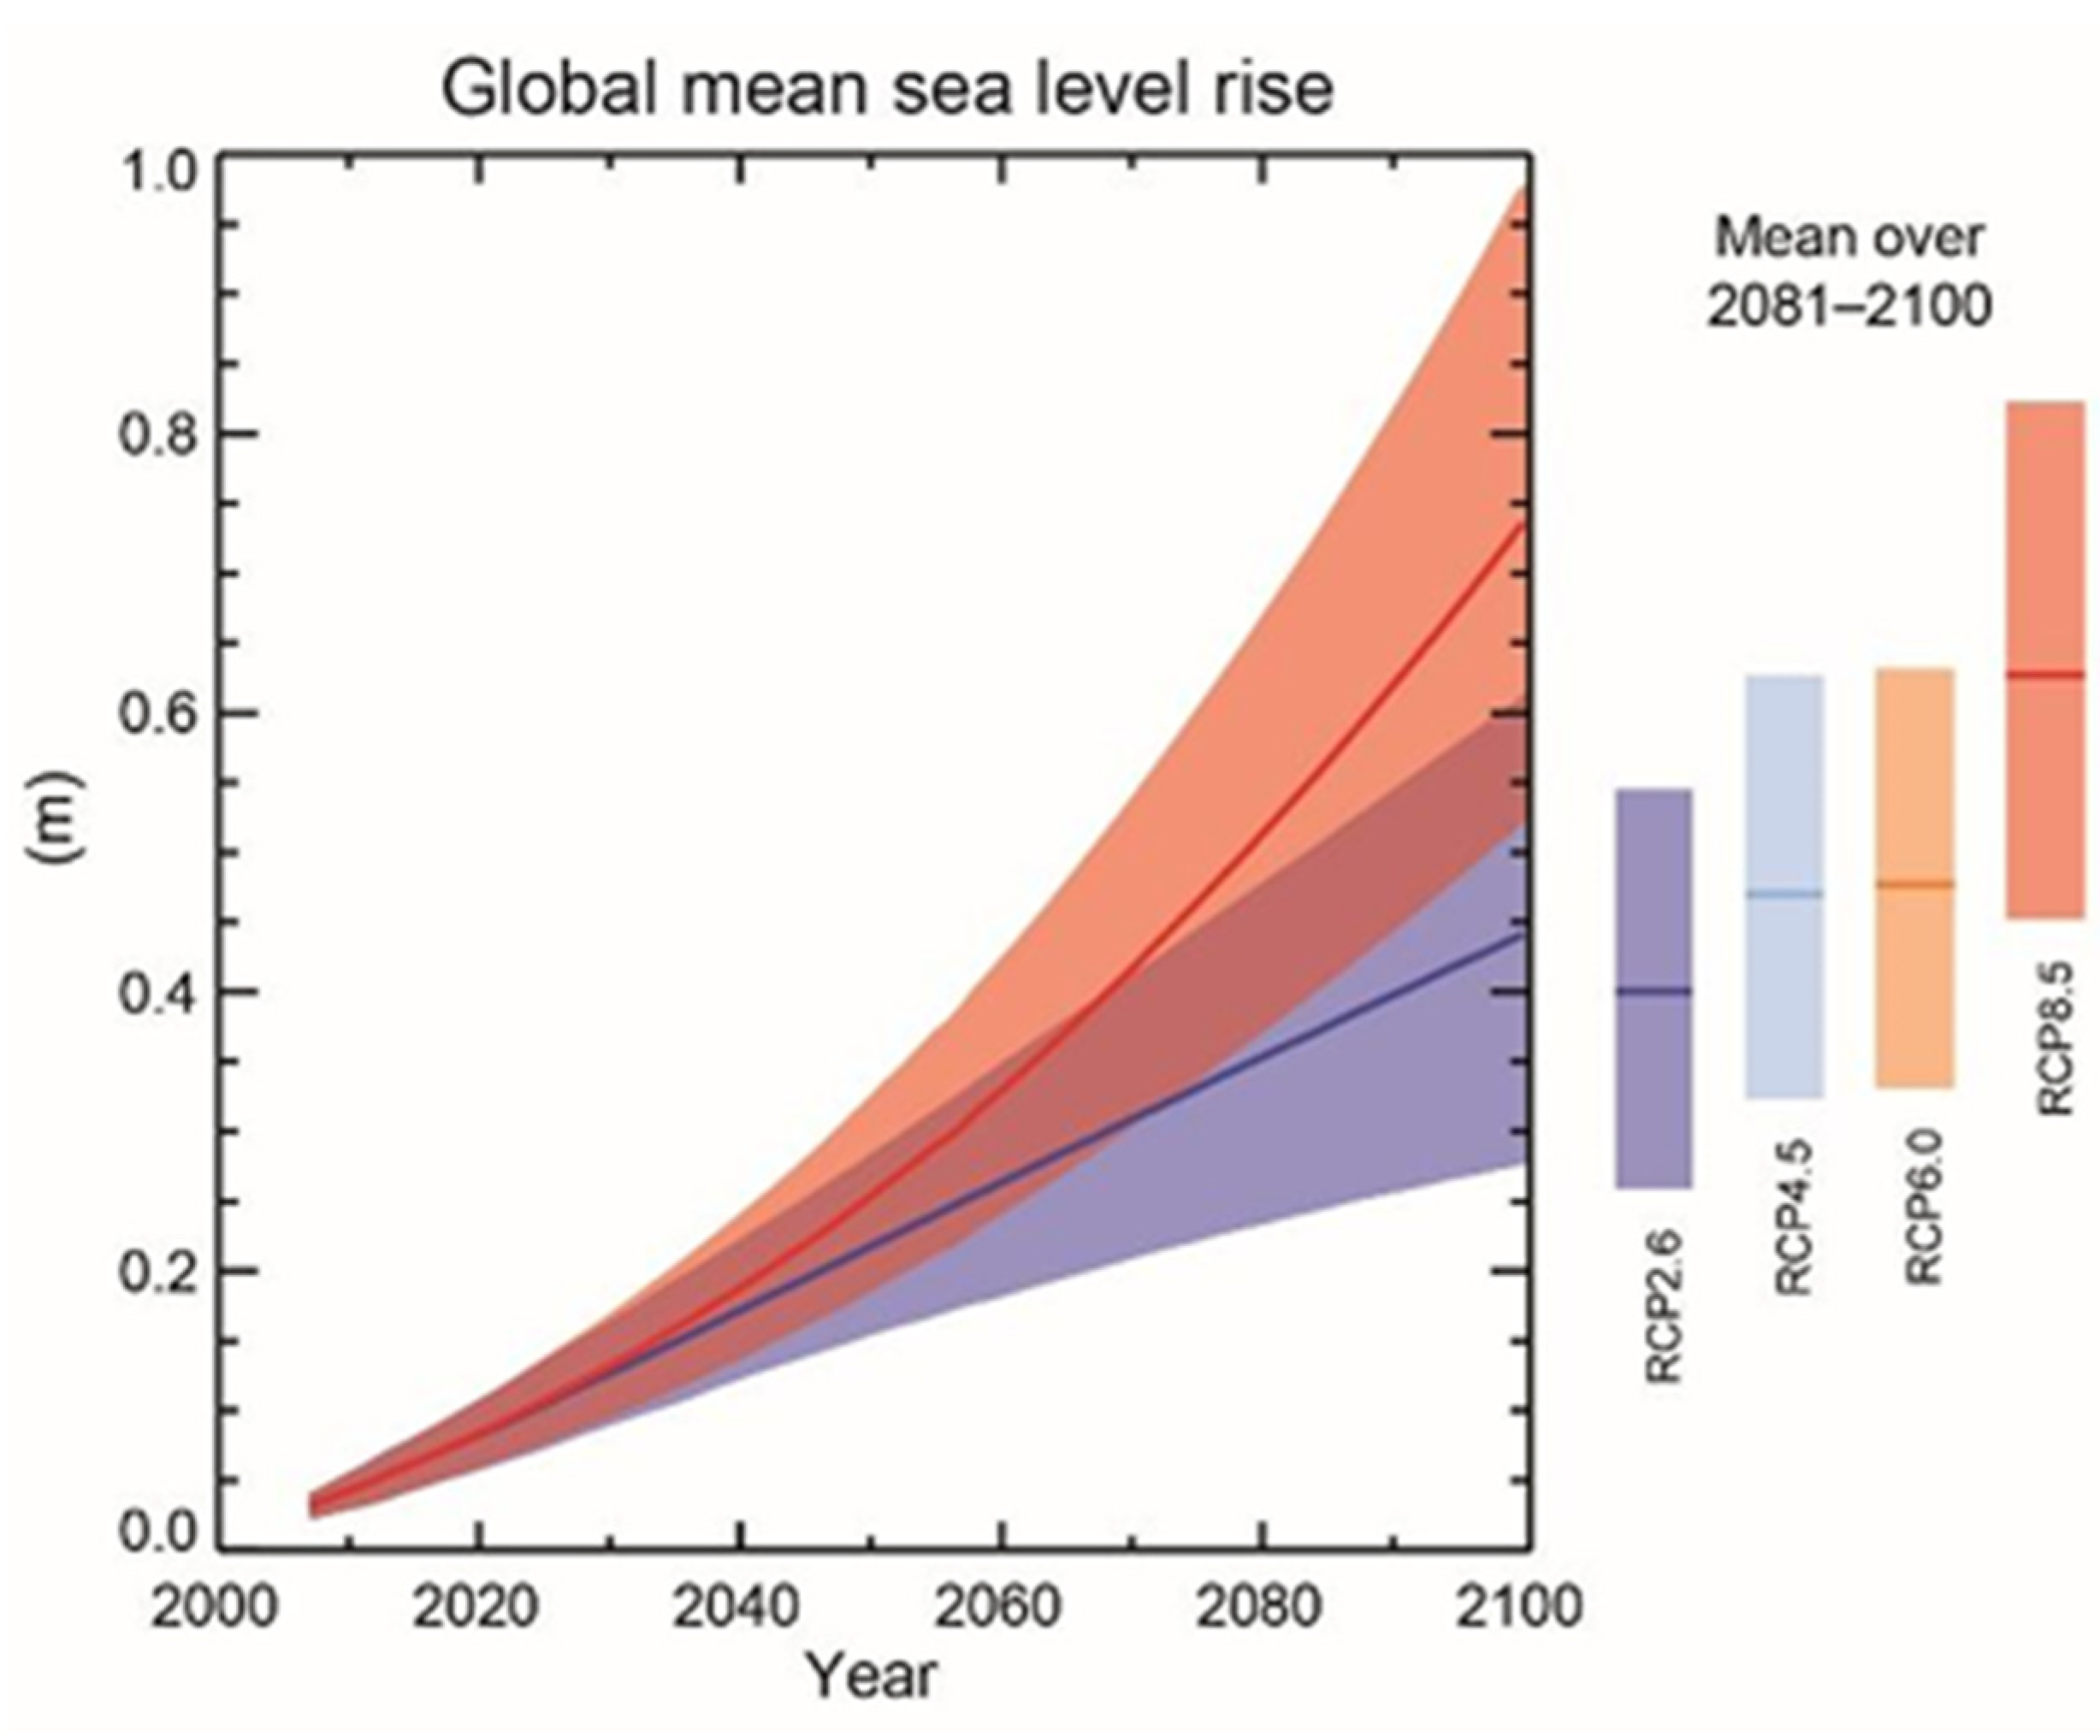
Sea level varies at regional and global scales; higher mean levels increase the frequency and severity of coastal water level extremes [40] and make inundation more common in low-elevation areas [18]. Over recent decades, the global sea level has risen at rates up to ~3.3 mm year−1, faster than at any time in the last two millennia [41], and it is projected to continue rising [6] (Figure 7).
Figure 7.
IPCC (2014) global mean sea level change projection.
For this study, we obtained an average trend of the relative sea level rise of ~3.5 mm year−1 from the Copernicus Marine Service global mean sea level trend product for 1999–2024 at a location representative of the Monrovia (≈6.00° N, 11.00° W). This value was integrated as a constant into the ArcGIS attribute table as the sea level parameter, following the ranking in [9]: >3.4 (5).
The applied relative sea level rise trend represents a regional baseline condition and is assumed spatially uniform at the city scale. Given the limited alongshore extent (21 km), significant spatial variability in the mean sea level trend is not expected. Therefore, this parameter contributes to the baseline exposure rather than spatial discrimination of vulnerability.
2.3.8. Significant Wave Height (Hs)
Significant wave height is the mean of the highest one-third of waves in a sea state; as wave height increases, wave energy and sediment mobilization also increase [32], driving larger morphodynamic adjustments [42]. We extracted the data from NOAA/NCEP WAVEWATCH III (NWW3) for 1970–2019 at 3 h resolution near the study area, yielding an average of Hs ≈ 1.75 m and an average peak period of ≈12 s. The predominant swell is from the SSW (~200° N), with a secondary component from the SSE (~160° N). ERA-Interim hindcast patterns were consistent with Wavedroid observations collected locally in 2018 by [16] in association with Shore Monitoring and the Environmental Protection Agency of Liberia (EPA Liberia). The coast is wave-dominated [43], enhancing longshore transport and run-up [42,44]. Per [9], the significant wave height was ranked as >1.25 (5). While wave height represents multi-decadal climatological forcing, tidal range measurements reflect representative local tidal characteristics. The CVI integrates relative exposure indicators rather than temporally synchronous forcing events. Therefore, combining climatological and representative observational parameters is conceptually consistent within a screening-scale framework.
2.3.9. Mean Tidal Range
Tidal range was calculated from daily tide gauge records [45] and reflects astronomical forcing [46]. In microtidal sandy environments, lower tidal ranges may concentrate wave energy within a narrow vertical zone of interaction, potentially increasing erosional susceptibility. Therefore, following classical CVI formulations [9], lower tidal ranges were assigned higher vulnerability ranking in this study.
Tide gauge measurements at the Freeport of Monrovia from 22 September to 22 November 2023 recorded 0.10–1.68 m; the semi-diurnal regime exhibited a mean tidal ≈ 0.91 m, as reported by the Environmental Protection Agency (EPA) of Liberia for the Monrovia Metropolitan Coastal Resilience Project 2023. Following the ranking classes of [9], the mean tidal range was <1.0 (5).
2.4. CVI Calculation
The methodology flowchart (Figure 2) was used to assess the study area’s (1285 transect lines) coastal vulnerability following the five classes raking (Table 2), as per [9,28,29,30]: very low (1), low (2), moderate (3), high (4), very high (5). All of the nine ranked parameters were computed using Equation (1) for the CVI. All raster datasets were harmonized to a 30 m spatial resolution prior to ranking. The effective alongshore resolution of the final CVI corresponds to the DSAS transect spacing (20 m), representing the spatial unit of vulnerability assessment. Raster-based parameters (elevation, slope, and bathymetry) were sampled at each DSAS transect intersection with the shoreline. For bathymetry, values were extracted at a fixed offshore buffer distance from each transect to represent nearshore wave-transformation conditions. This procedure ensured consistent translation of area-based raster data into line-based CVI computation.
with n = 9 and parameters defined as: a) geomorphology, b) coastal slope, c) coastal elevation, d) shoreline change rate, e) natural habitat, f) relative sea level rise rate, g) mean significant wave height, h) mean tidal range, and i) bathymetry.
The CVI values range between 45.64 and 279.50, with a mean of 149.67 and a standard deviation of 60.92. The CVI was then classified into five classes: 45.64–70.40 (very low 1), 70.40–101.50 (low 2), 101.58–128.18 (moderate 3), 128.18–175.87 (high 4), and 175.87–279.50 (very high 5), showing the degree of vulnerability for the coastline Monrovia.
The selection of the nine parameters follows the established physical CVI framework [3,9,29], which integrates geomorphic susceptibility, hydrodynamic forcing, and shoreline behavior into a transparent screening index. Equal weighting was intentionally adopted to preserve methodological transparency and comparability with classical CVI applications. Final CVI class grouping using Jenks natural breaks serves cartographic visualization purposes and does not imply physically defined threshold values. This distinction prevents artificial enforcement of uniform class proportions in the final vulnerability interpretation.
2.5. Field Survey
We conducted two field survey campaigns in December 2024 and March 2025 along Hotel Africa, New Kru Town, West Point, and ELWA-King gray using DJI Air 2S (1″ CMOS) imagery, handheld GPS, and a camera for ground photos. The field observations are presented as qualitative corroboration of mapped exposure patterns rather than as independent quantitative input validation of the CVI results. Field observations included qualitative geomorphological characterization of beach type, sediment composition, and evidence of erosion or accretion. These observations were used to corroborate the remote sensing-based geomorphology classification. The field survey was conducted to qualitatively verify geomorphological classifications and shoreline conditions derived from remote sensing. Because the CVI parameters are derived from physical variables observable in the field (e.g., geology/geomorphology, elevation, shoreline condition), the comparison serves to illustrate spatial consistency rather than to statistically test predictive accuracy.
3. Results
This section presents the spatial distribution of the individual CVI parameters and the resulting coastal vulnerability index along the coast of Monrovia. To provide a quantitative overview of the spatial classification results, the percentage distribution of vulnerability classes for each CVI variable is presented within each figure. This chart illustrates the proportion of coastline segments classified under each vulnerability category (very low, low, moderate, high, and very high) for the individual parameters used in the CVI calculation, thereby highlighting the relative influence of each variable on the overall coastal vulnerability pattern.
3.1. Coastal Characteristics Parameters Classification
3.1.1. Geology/Geomorphology
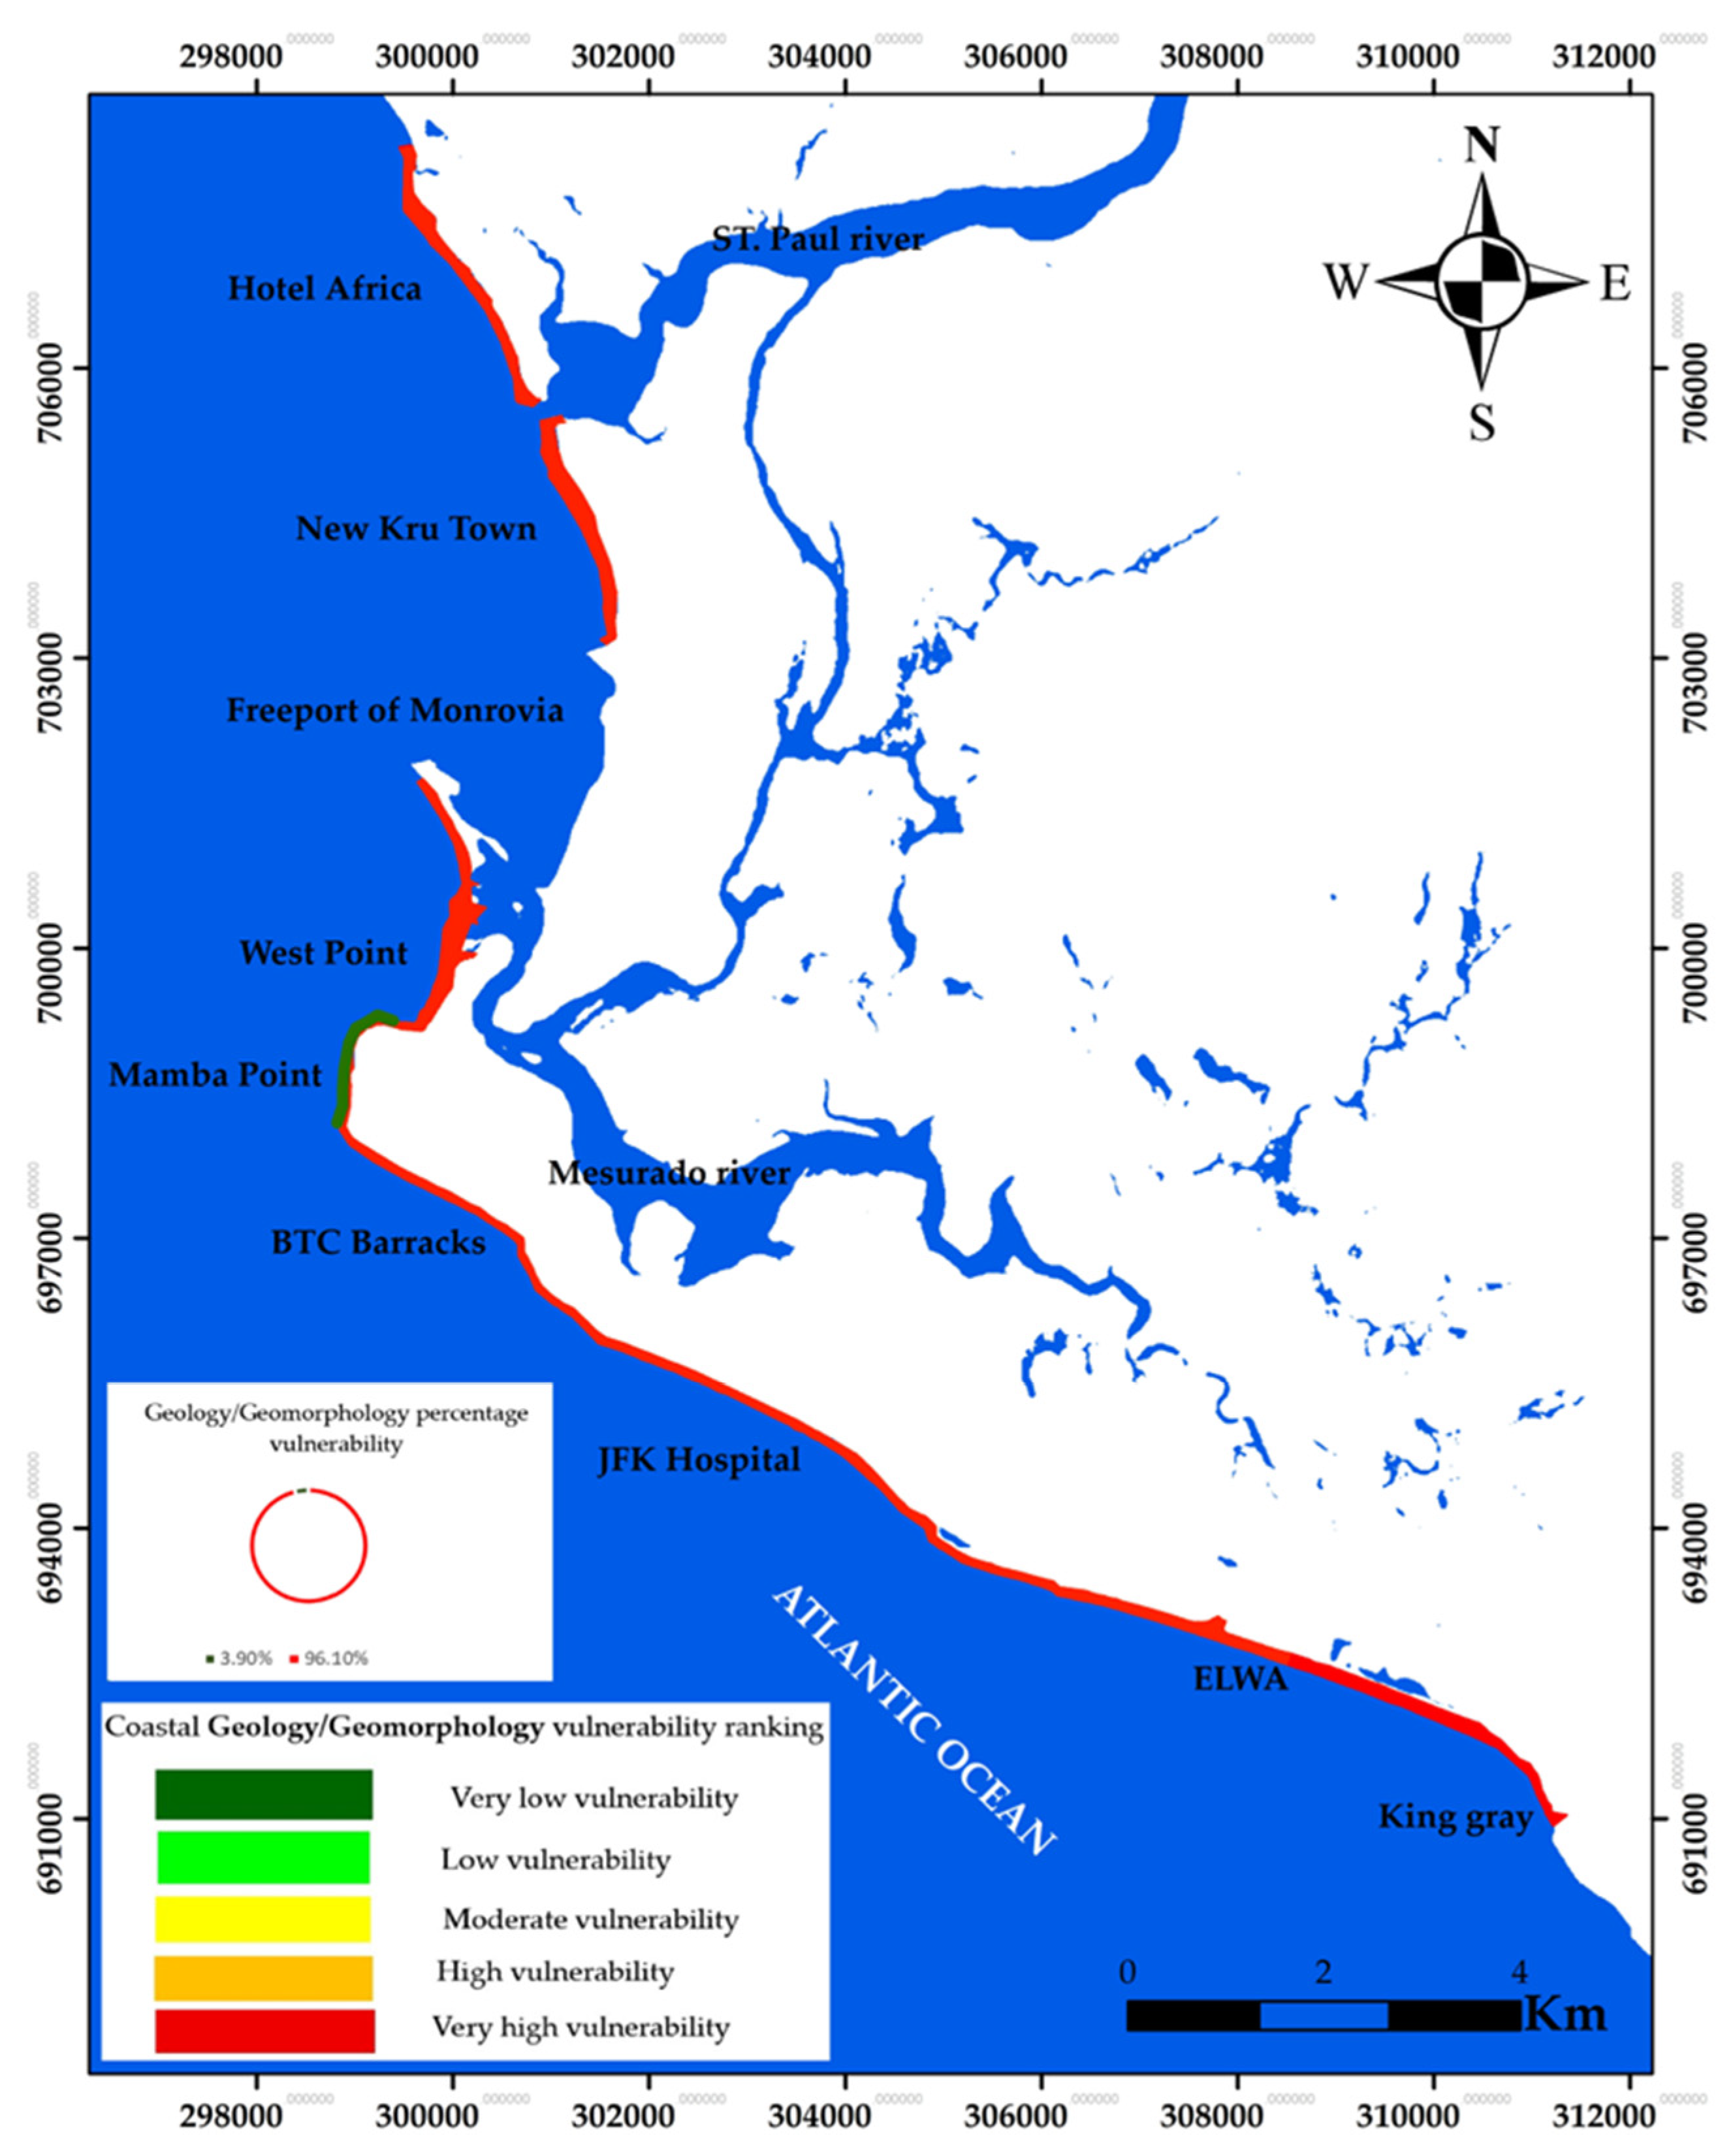
Figure 8 represents the mapped vulnerability of the geology/geomorphology parameter. The Mamba Point community (Figure 8) along the rocky cliff shows a very low vulnerability, whereas sandy beaches along the rest of the sandy beaches of the coastal communities of Hotel Africa, New Kru Town, West Point/BTC Barracks, and King Gray, exposed to the Atlantic Ocean, exhibit very high vulnerability.
Figure 8.
Coastal geology/geomorphology map of vulnerability ranking along the coast of Monrovia.
3.1.2. Coastal Elevation
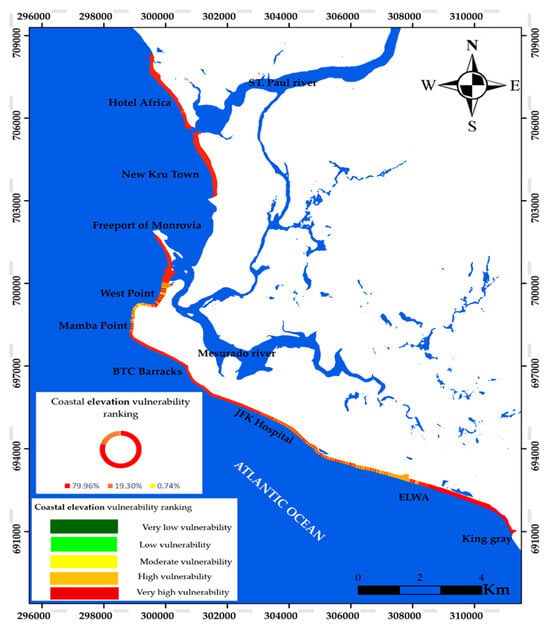
Figure 9, which shows the coastal elevation parameter, depicts a very high vulnerability along the sandy beaches along Hotel Africa, New Kru Town, and BTC Barracks through to King Gray (Figure 1), while high and localized very high elevation vulnerability is observed along the natural rocky cliff of Mamba Point and the sandy beach of BTC Barracks. A small patch of localized moderate vulnerability is situated along the JFK Hospital.
Figure 9.
Coastal elevation map of vulnerability ranking along the coast of Monrovia.
3.1.3. Coastal Slope
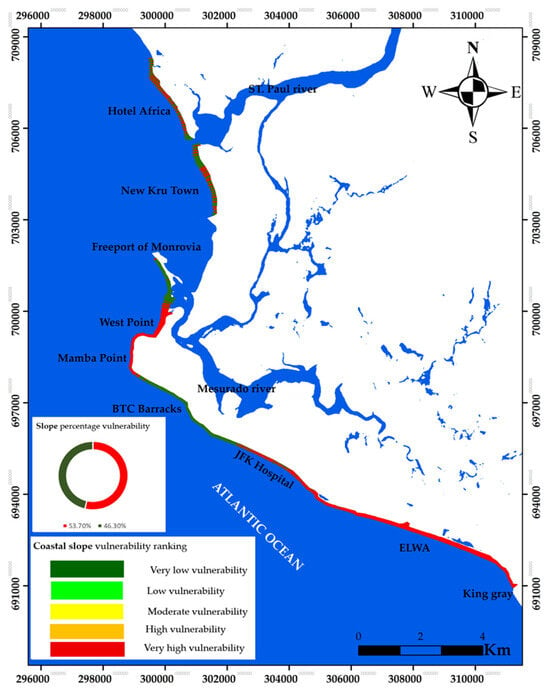
Figure 10, which represents the coastal slope (steepness from each coastal cell of an elevation raster) parameter of the Monrovia’s coast, shows an alternation of very low and very high vulnerability; however very high vulnerability was observed along Mamba Point through to West point and from JFK Hospital to King Gray.
Figure 10.
Coastal slope map of vulnerability ranking along the coast of Monrovia.
3.1.4. Rate of Shoreline Change
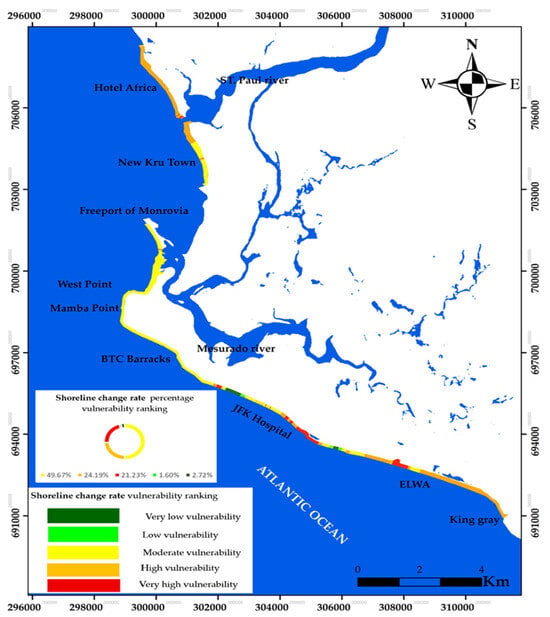
Figure 11 illustrates the spatial distribution of shoreline change rates along the Monrovia coastline. The shoreline change map reveals clear spatial variability along the coast of Monrovia, with several segments showing persistent erosional trends. The exposed open-coast sandy beaches exhibited high vulnerability, except New Kru Town, Westpoint, and JFK Hospital, which showed moderate vulnerability. Low to very low vulnerability is shown along the Mamba Point and upper Westpoint areas. All sandy beaches from Hotel Africa to King Gray yielded moderate, high, and very high vulnerability. Nevertheless, interannual fluctuations and storm-driven variability may not be fully resolved, and this limitation is acknowledged in the interpretation of the CVI results.
Figure 11.
Shoreline change rate map of vulnerability ranking along the coast of Monrovia.
3.1.5. Natural Habitat
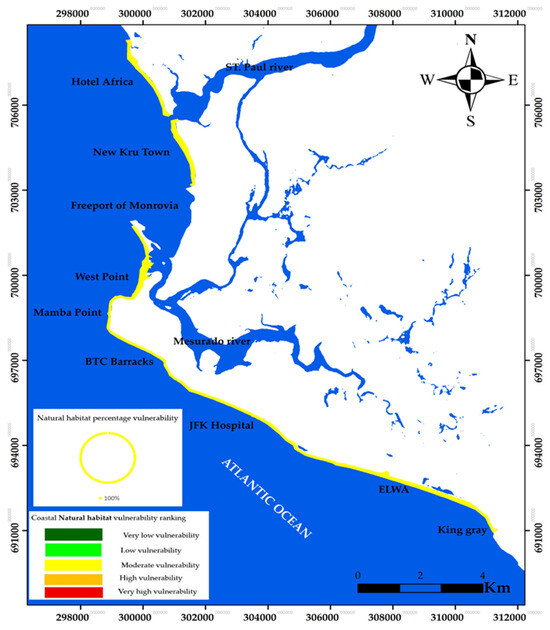
Figure 12, which represents the coastal natural habitat vulnerability ranking, illustrates a moderate vulnerability ranking for the coast of Monrovia.
Figure 12.
Coastal natural habitat map of vulnerability ranking along the coast of Monrovia.
3.1.6. Bathymetry
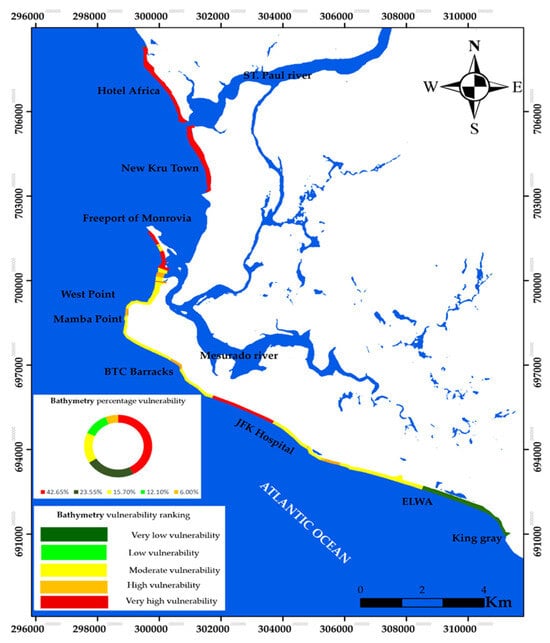
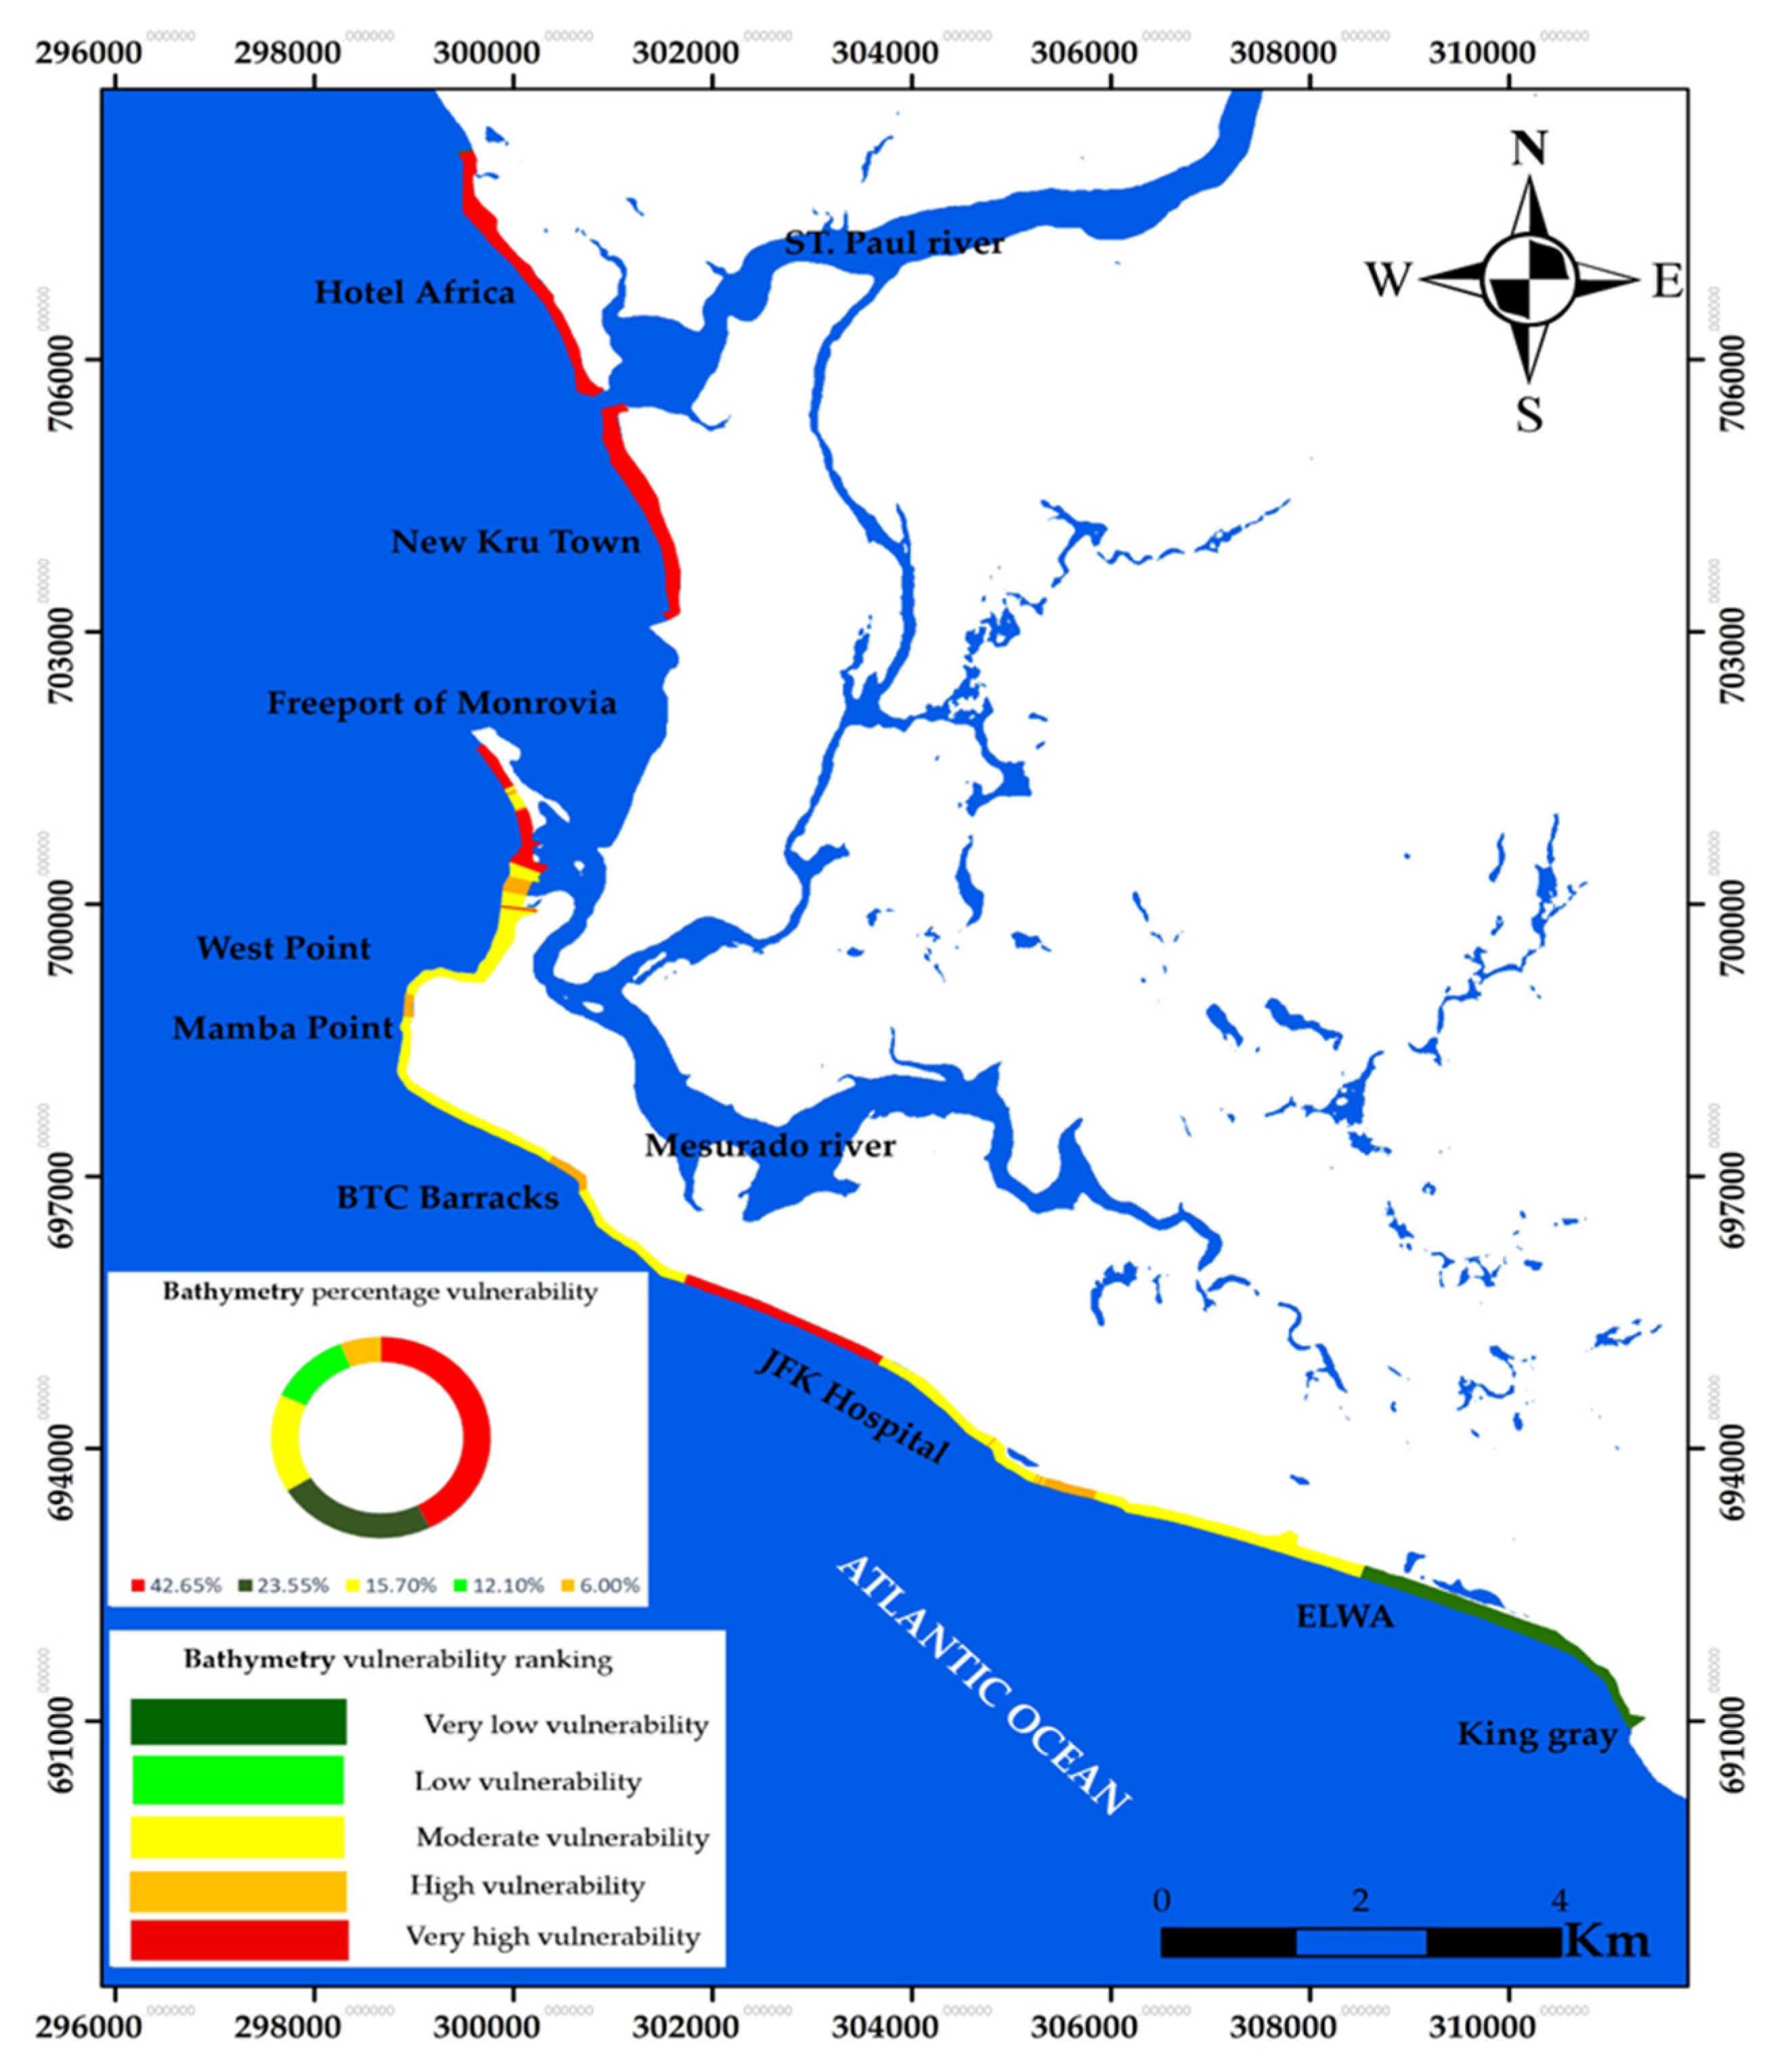
Figure 13 illustrates the bathymetric vulnerability ranking of the coastline of Monrovia. It shows very high vulnerability along Hotel Africa and the upper part of New Kru Town, as well as between BTC Barracks and JFK Hospital. Furthermore, moderate vulnerability is observed in Lower New Kru Town, Westpoint, and Mamba Point, as well as along the JFK Hospital coastal stretch, while low vulnerability is concentrated along the coastal stretch of ELWA/King Gray areas.
Figure 13.
Bathymetry map of vulnerability ranking along the coast of Monrovia.
3.2. Coastal Forcing Parameters (Relative Sea Level Rise, Significant Wave Height, and Mean Tidal Range) Classification
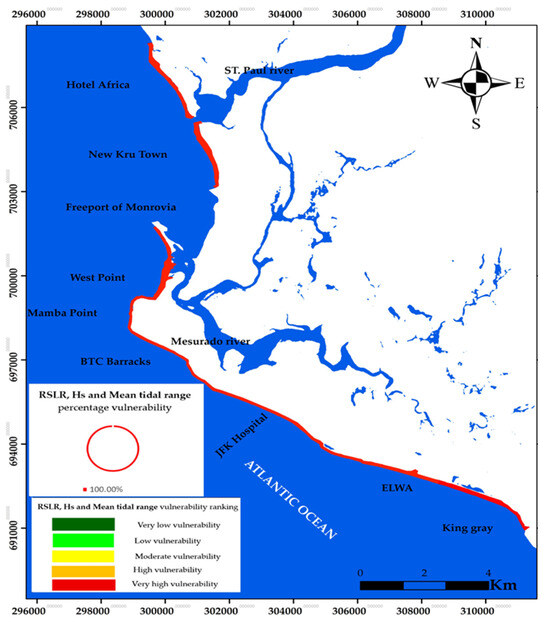
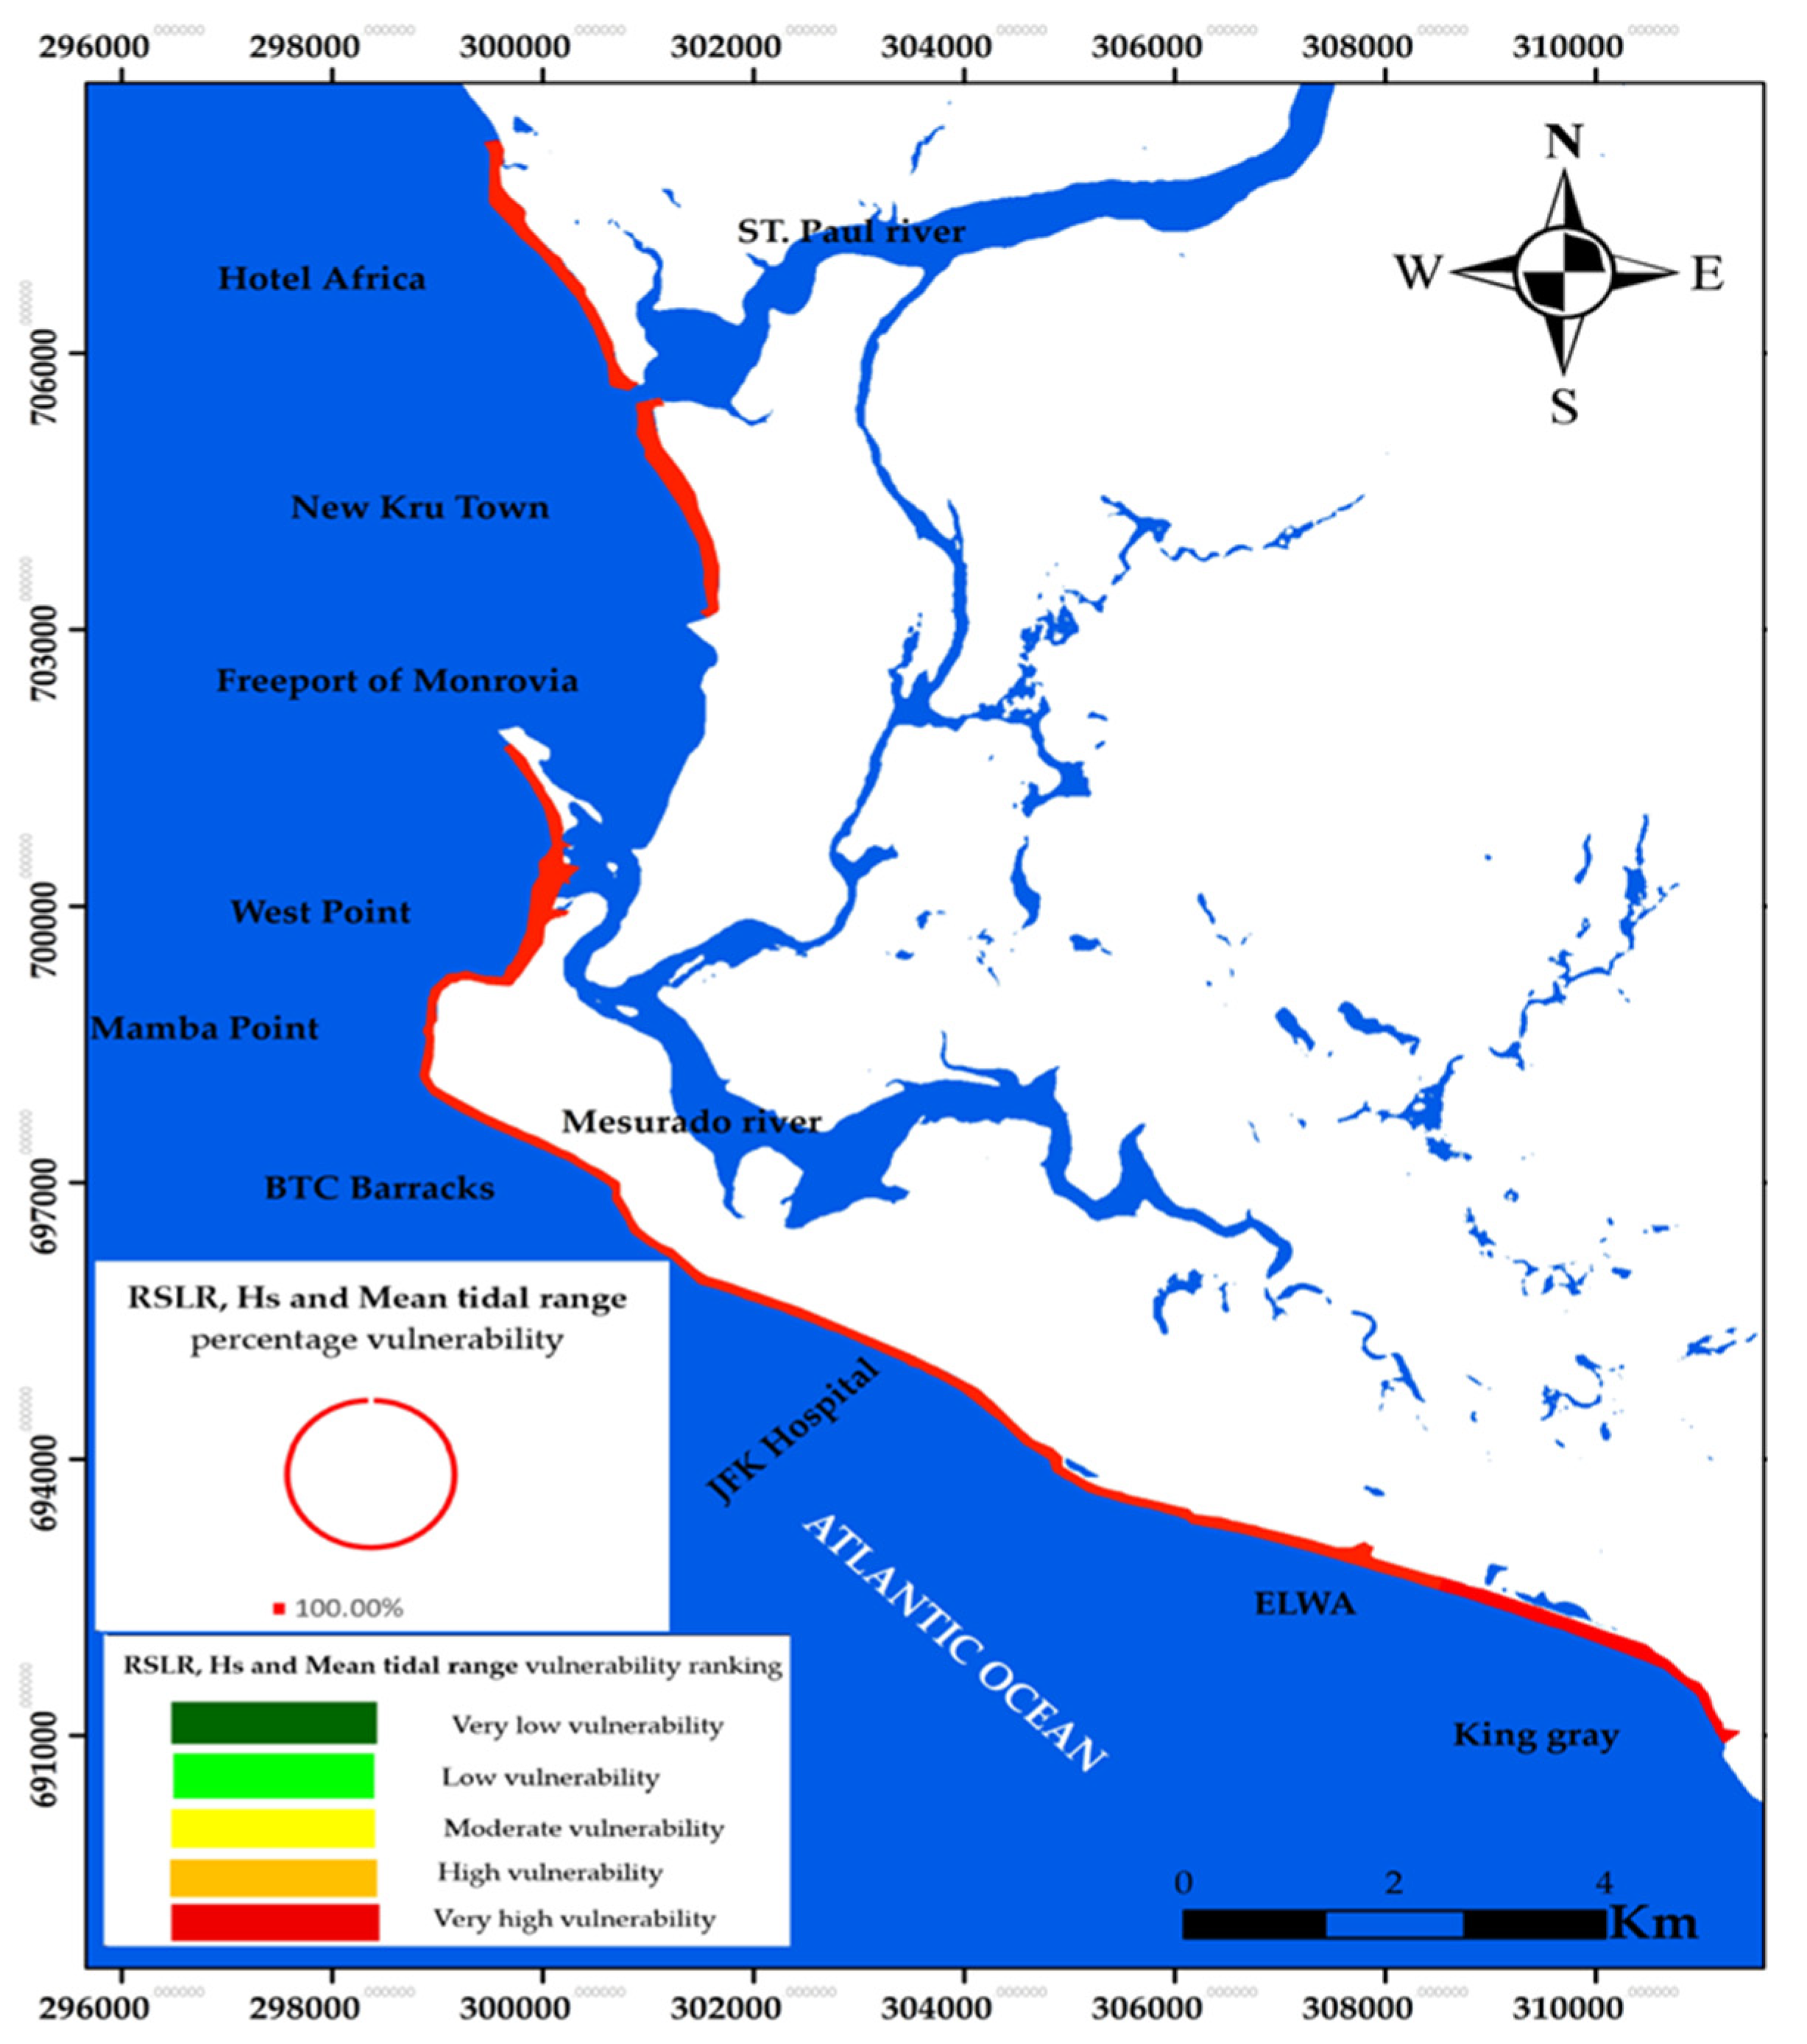
The results of the three parameters were merged into a single composite figure to avoid redundancy. Figure 14 shows the merged uniform vulnerability ranking, which is classified as very high uniform vulnerability for the three forcing parameters along the coast of Monrovia. While wave height represents multi-decadal climatological forcing, tidal range measurements reflect representative local tidal characteristics. The CVI integrates relative exposure indicators rather than temporally synchronous forcing events. Therefore, combining climatological and representative observational parameters is conceptually consistent within a screening-scale framework. Similarly, the applied relative sea level rise trend represents a regional baseline condition and is assumed spatially uniform at the city scale. Given the limited alongshore extent (21 km), significant spatial variability in mean sea level trend is not expected. Therefore, this parameter contributes to the baseline exposure rather than spatial discrimination of vulnerability. In microtidal sandy environments, lower tidal ranges may concentrate wave energy within a narrow vertical zone of interaction, potentially increasing erosional susceptibility. Therefore, following classical CVI formulations [9], lower tidal ranges were assigned higher vulnerability ranking in this study.
Figure 14.
Map of relative sea level rise, significant wave height, and mean tidal range vulnerability ranking along the coast of Monrovia.
3.3. Coastal Vulnerability Index Classification
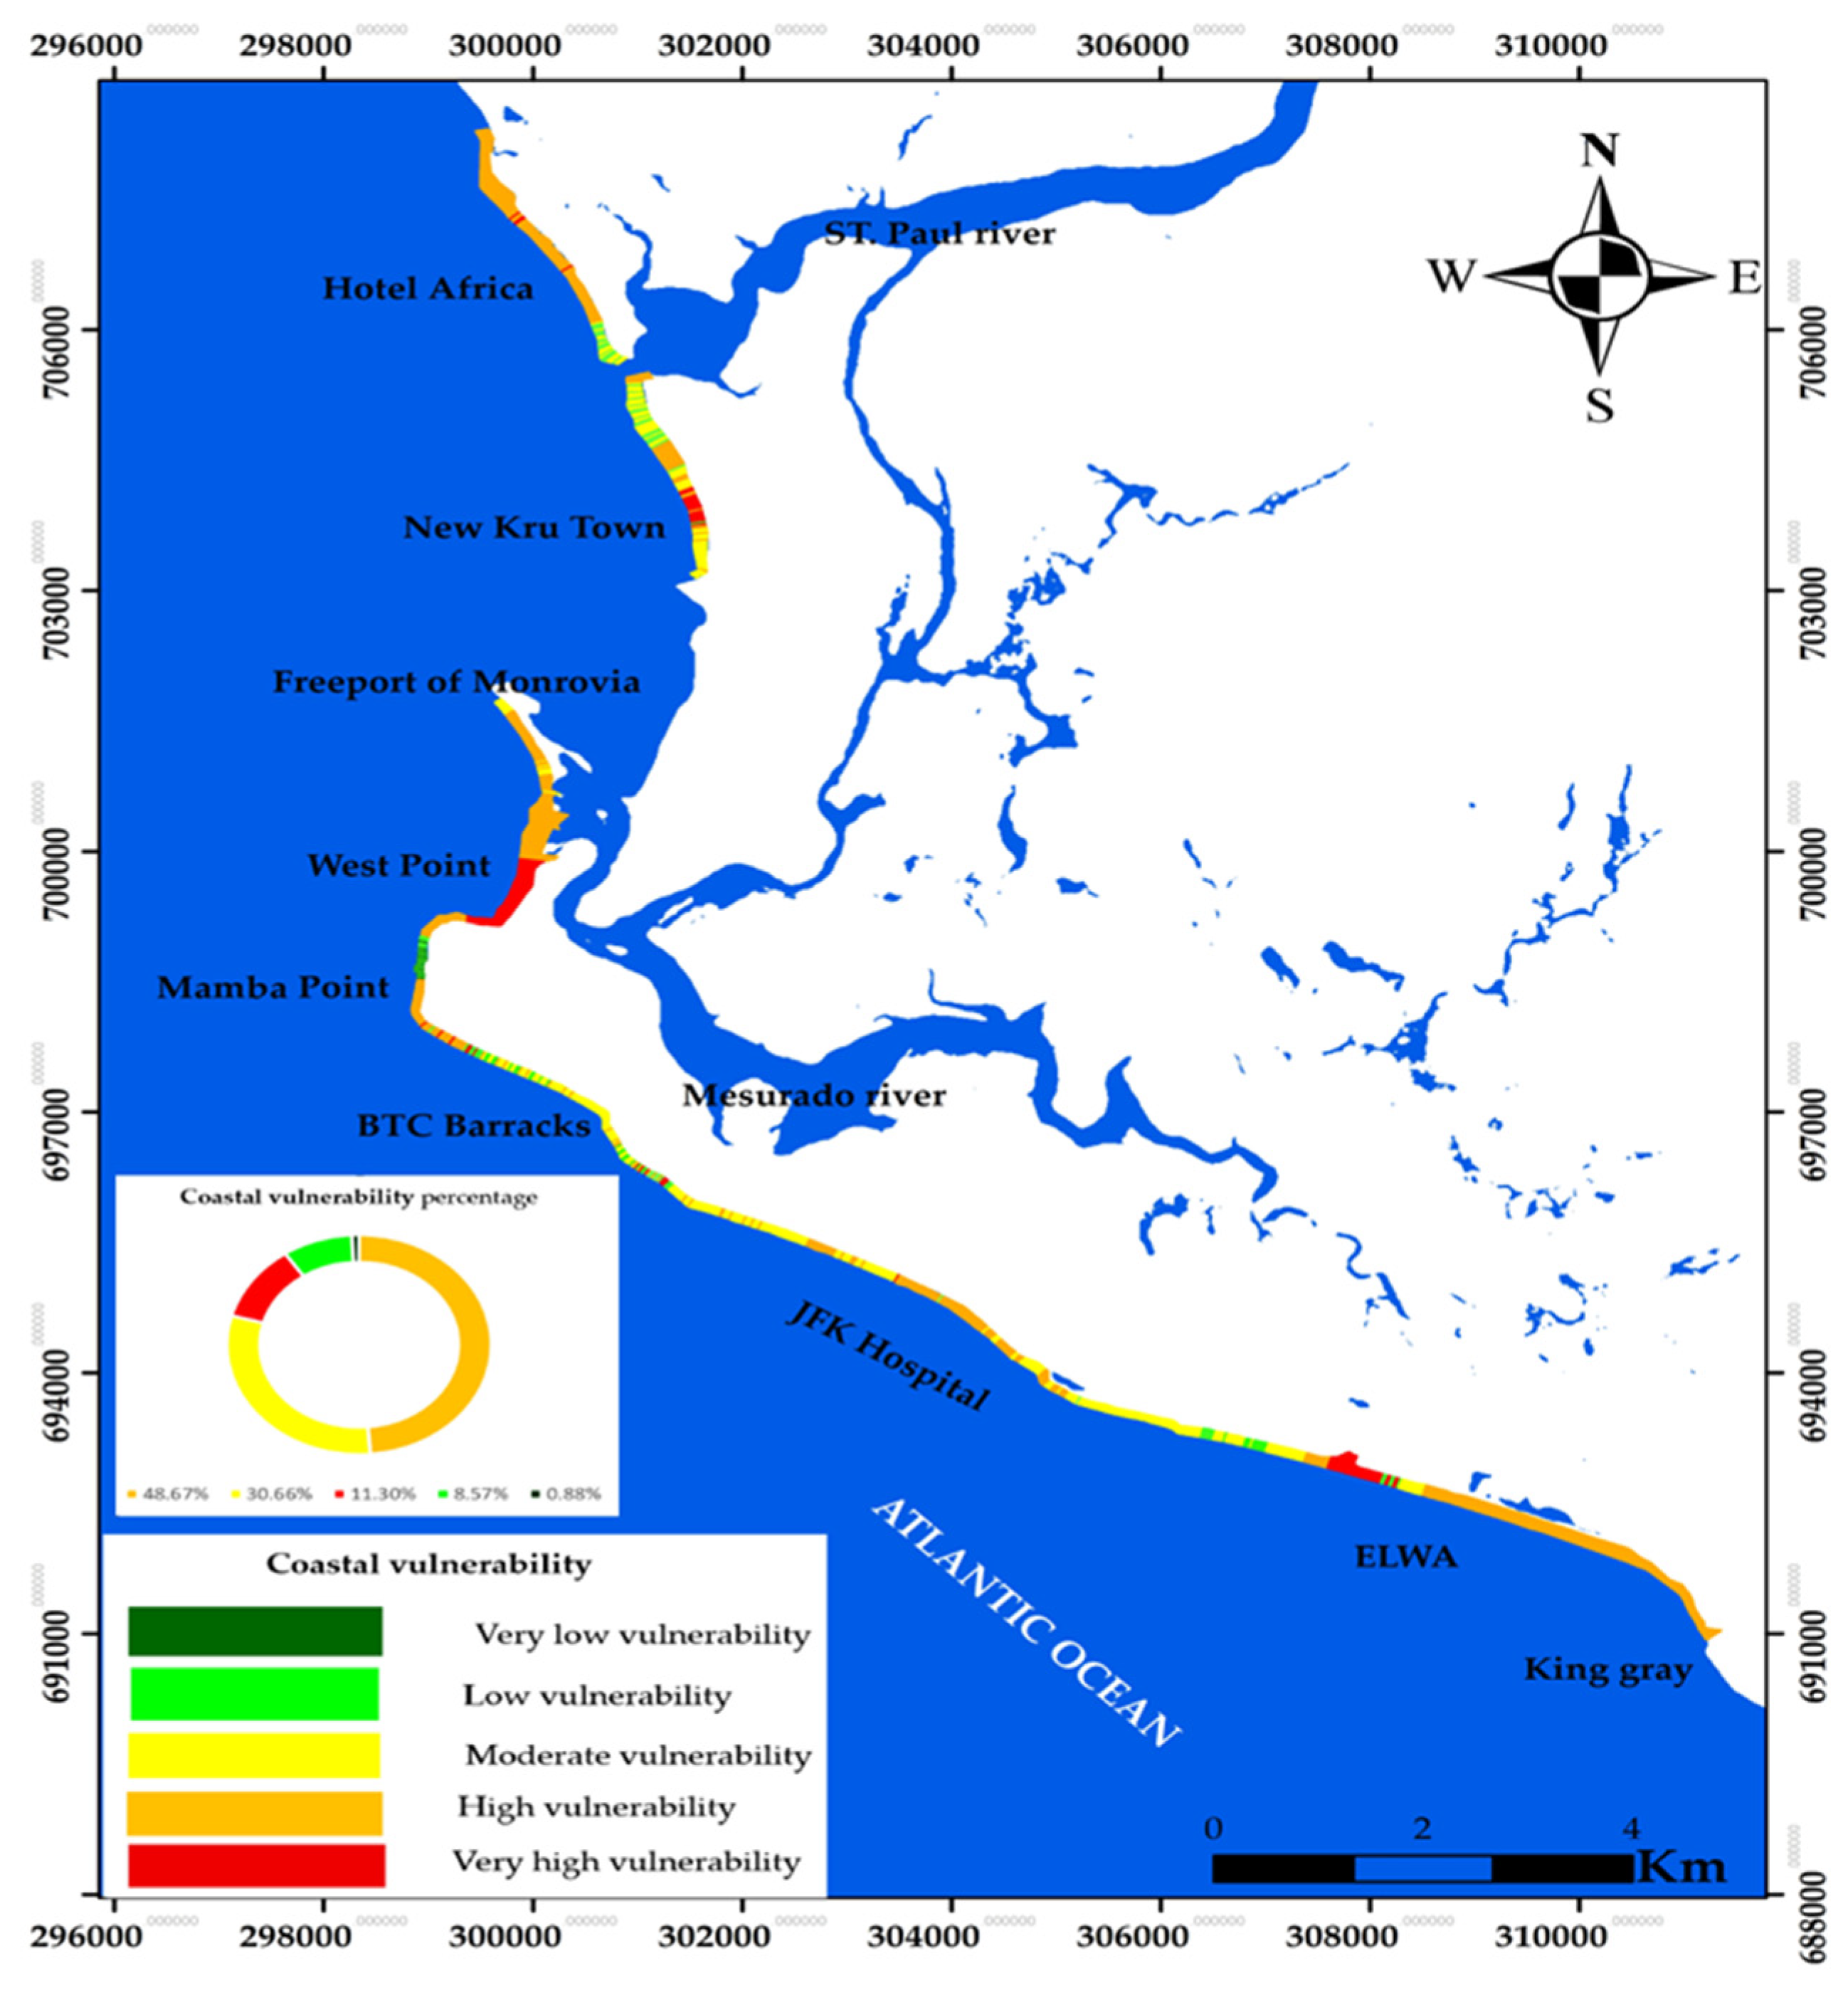
The coastal vulnerability index map (Figure 15) depict an overall dominant moderate to high vulnerability, with localized very high vulnerability. However, a few segments observed low to very low vulnerability. Moderate vulnerability is mostly observed along the rocky cliff and where rip-rap revetment has been constructed. Areas classified as high vulnerability areas correspond to sandy beaches within the predefined additive CVI structure. This reflects the cumulative aggregation inherent in the index formulation rather than emergent or nonlinear interaction among drivers.
Figure 15.
Coastal vulnerability lines CVI, including 1284 lines along the coast of Monrovia.
3.4. Field Survey
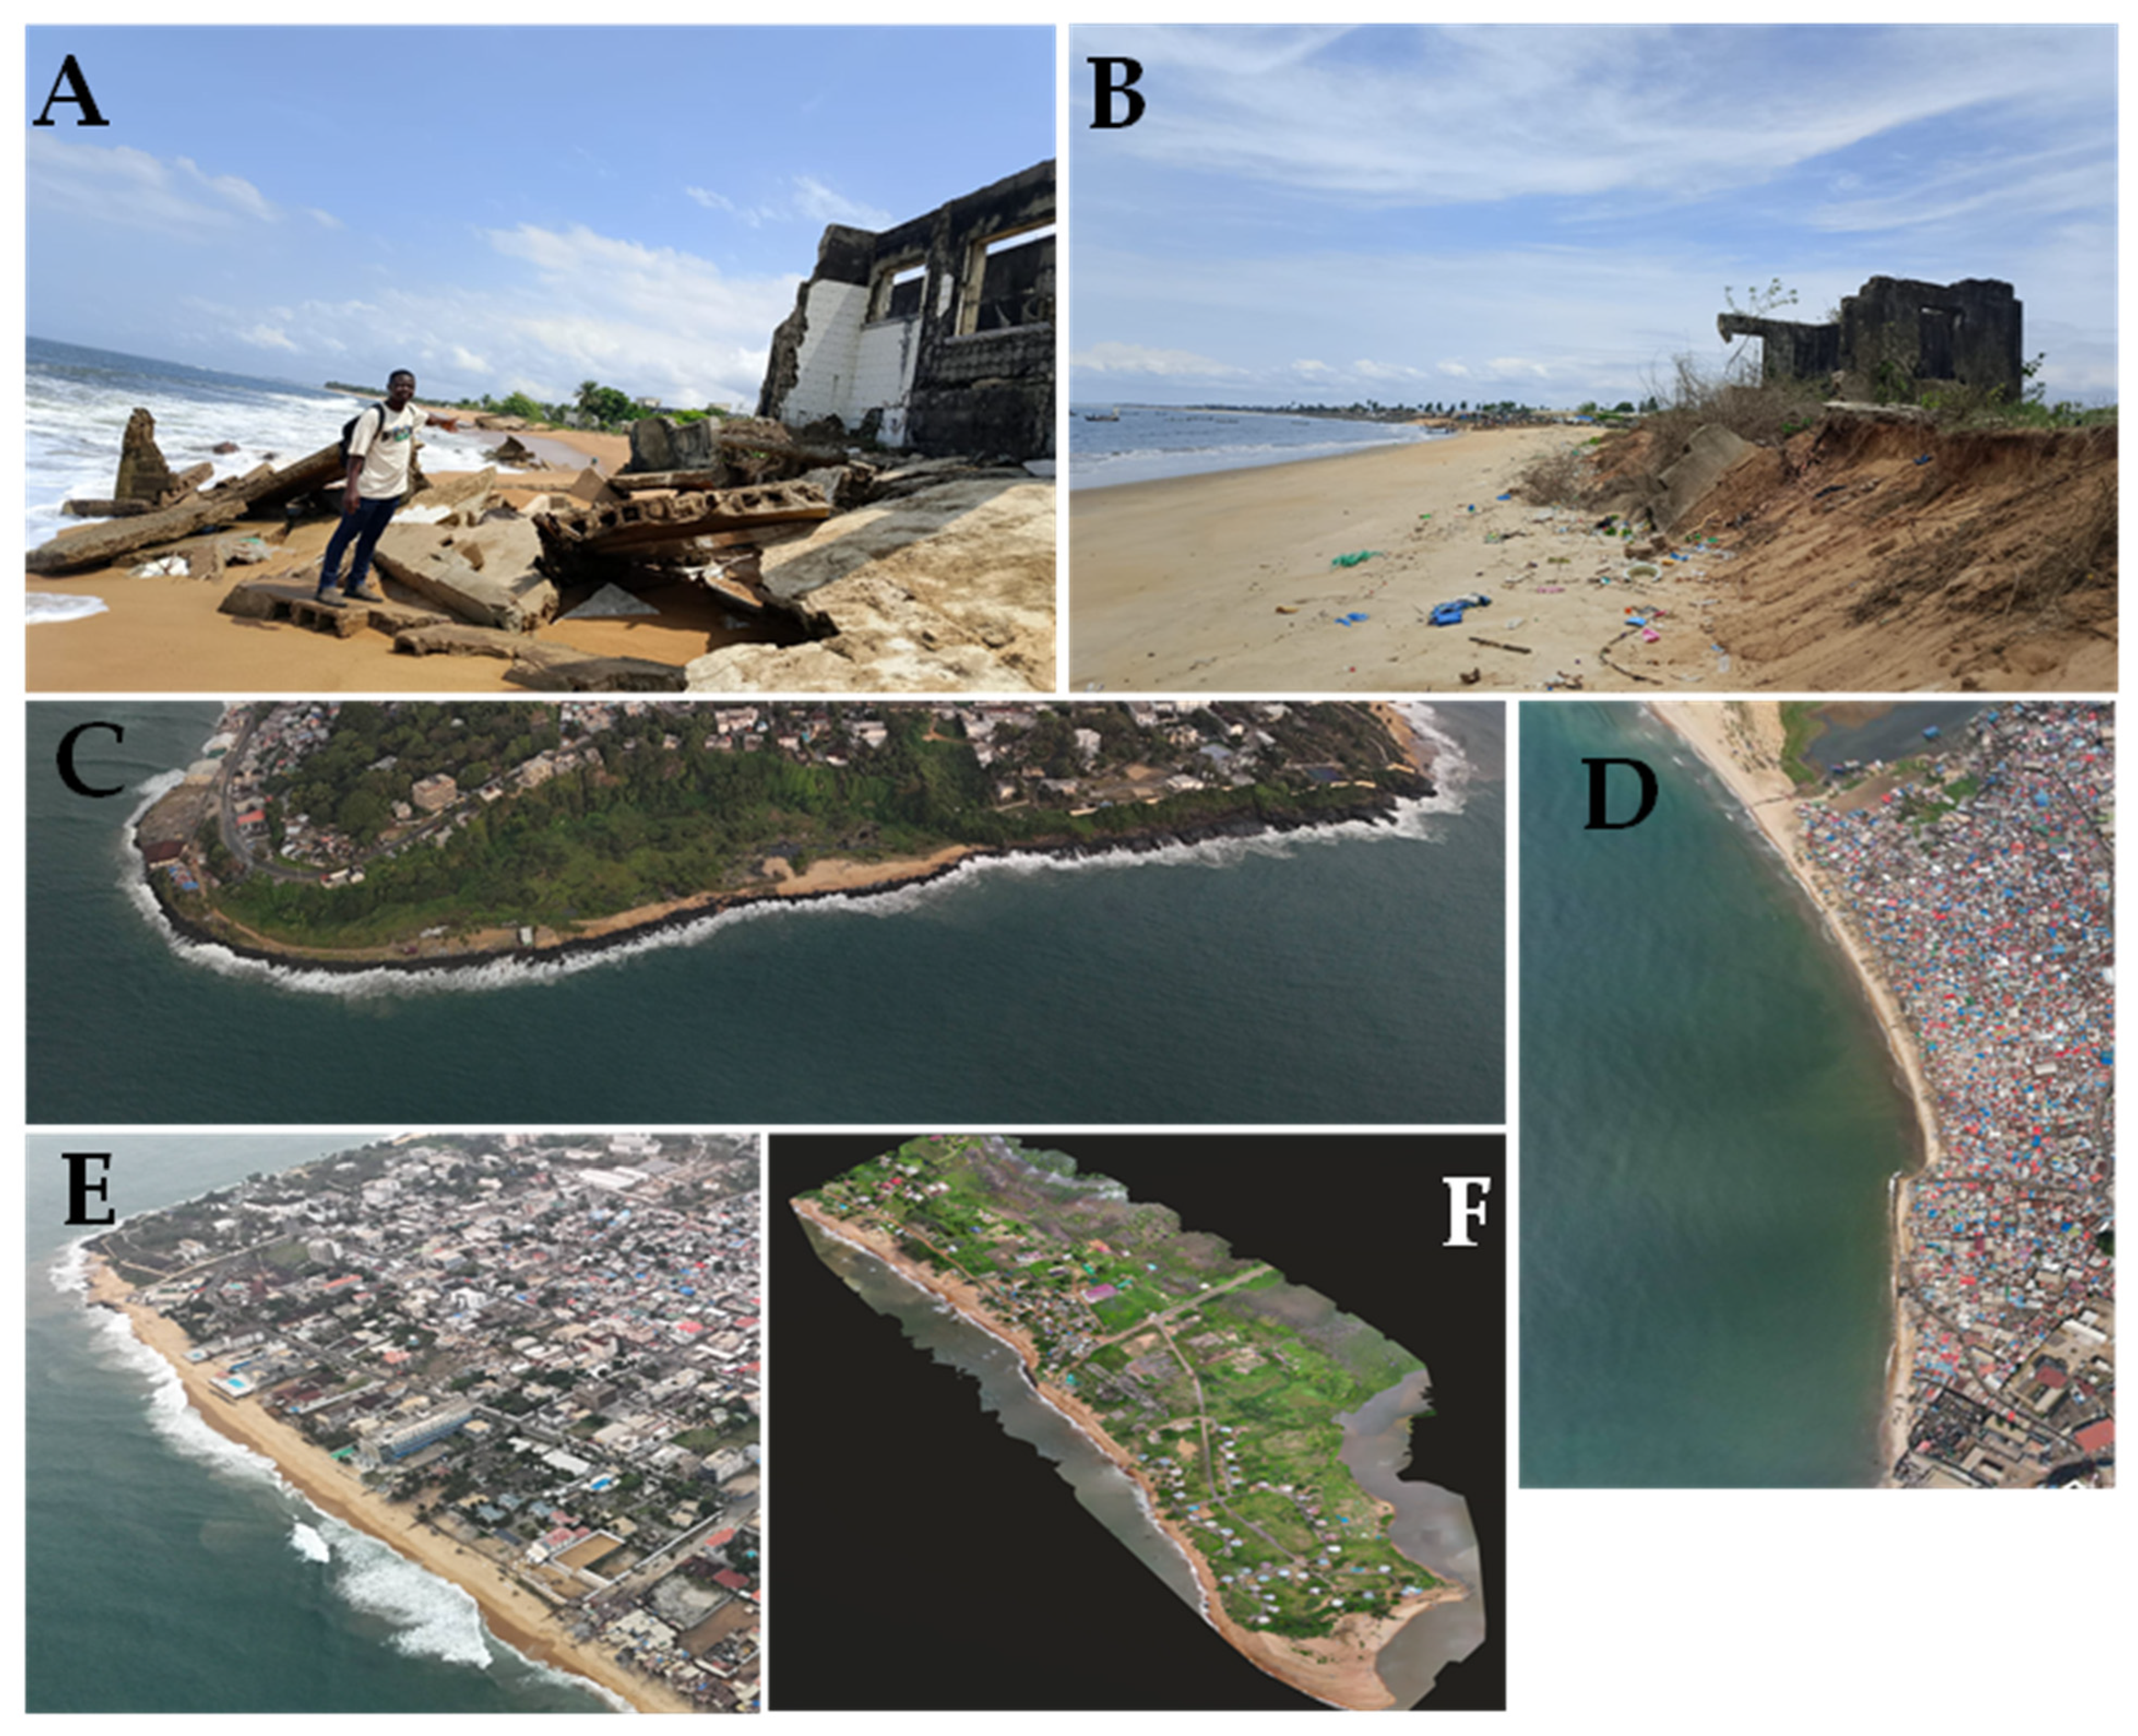
Figure 16 (images A to F) depicts erosion impact on infrastructures, different geomorphology, and urban exposure. Image A shows erosion impact on coastal building undermined by wave action, resulting in severe shoreline retreat along the Hotel Africa coastal stretch, while Image F shows an orthomosaic photo of the Hotel Africa stretch with dominant sand beaches.
Figure 16.
(A,B) Erosion impact on coastal building along Hotel Africa and New Kru Town; (C–E) Aerial snapshot of Mamba point rocky cliff, Westpoint, and Mamba Point/BTC Barracks sandy beaches, respectively. (F) An orthomosaic photo showing Hotel Africa coastal stretch with dominant sand beaches and vegetation.
Image B shows the remaining impacted coastal buildings along the New Kru Town coastal stretch, damaged by high-energy waves. The removal of sand and debris shows ongoing coastal erosion. Image C shows an aerial view of Mamba Point, illustrating breaking waves along the hard rocky cliff, with smaller-sized sandy back-beach area covered by vegetation. Image D shows an aerial view of the informal urbanized Westpoint coastal stretch with a narrow beach buffer, exposing the population and infrastructures. Image E shows the long sand beach between Mamba Point and BTC Barracks, with planned urban development and limited and active wave zones with high erosion risk.
The ground photographs and orthomosaic photos were used to cross-check features interpreted from Landsat/Sentinel scenes. These data served for classification verification rather than metric shoreline change. The erosion affected sites were selected for the survey to sample each geomorphic setting, and acquisitions were made during daylight, fair-weather, and low-tide windows to maximize shoreline visibility, especially during the dry season. A total of six survey points were distributed along the coastline of three major zones: Hotel Africa, New Kru Town, and Westpoint with approximately 500 m intervals. Two points at each site, geomorphological characteristics, shoreline condition, and evidence of erosion or accretion were documented. The observations were qualitatively compared with corresponding CVI classes to assess consistency in spatial patterns. A fully quantitative validation would require long-term in situ shoreline monitoring and independent hydrodynamic datasets, which were beyond the scope of the present screening-scale assessment.
4. Discussion
The interpretation of the spatial patterns identified by the coastal vulnerability index (CVI) requires careful consideration of the methodological structure of the index itself. The CVI aggregates ranked physical parameters into a composite exposure score; therefore, the mapped vulnerability patterns primarily reflect the spatial distribution of the physical variables included in the analysis. Consequently, the interpretations related to hydrodynamic forcing, structural controls, or sea level influence are discussed cautiously and framed within the established coastal process understanding rather than assumed causal relationships.
Spatial variability in the mapped CVI is largely controlled by parameters that exhibit strong spatial heterogeneity along the Monrovia coastline, including geology/geomorphology, coastal elevation, coastal slope, bathymetry, and shoreline change rate. In contrast, parameters such as significant wave height, tidal range, and relative sea level rise display limited spatial variability across the study area and therefore act primarily as baseline exposure conditions rather than drivers of spatial differentiation in vulnerability patterns. This distinction helps prevent overinterpretation of spatially uniform forcing parameters when analyzing the distribution of vulnerability classes.
The relative contribution of the different CVI parameters can also be examined through the proportional distribution of vulnerability classes presented in each parameter’s figures (Figure 8, Figure 9, Figure 10, Figure 11, Figure 12, Figure 13 and Figure 14) and the overall CVI figure (Figure 15), which summarizes the percentage of coastline segments classified under each vulnerability level for all variables included in the analysis. This comparison confirms that parameters linked to coastal morphology and shoreline dynamics play a dominant role in determining the spatial pattern of vulnerability along the Monrovia coastline, whereas the hydrodynamic forcing parameters contribute more uniformly across the study area.
Liberia’s coastal region is widely recognized as highly vulnerable to climate-driven erosion and flooding, processes that have intensified in recent decades and have already displaced coastal populations [24]. In the West Point township of Monrovia, chronic shoreline retreat has damaged infrastructure including roads, markets, clinics, housing, and fishing assets, thereby disrupting local livelihoods [21,25,47]. The projections of approximately 1 m of sea level rise by 2100 further indicate increasing risks to coastal infrastructure and economic activities [22].
Within this broader regional context, the present study developed a coastal vulnerability index for the entire Monrovia coastline using remote sensing data, GIS analysis, and empirical coastal datasets. To the best of our knowledge, this represents the first city-scale CVI assessment for the Monrovia coastline, applying parameter ranking schemes adapted from previous coastal vulnerability studies [9,28,29,30]. Similar index-based approaches have been widely applied in different coastal environments worldwide to identify areas susceptible to erosion, flooding, and shoreline instability [9,27,28,46,48,49,50].
4.1. Controls on Coastal Vulnerability Patterns
The spatial distribution of vulnerability along the Monrovia coastline reflects the interaction between coastal morphology, hydrodynamic forcing, and sediment transport processes. The dominance of SSW–SSE swell waves under microtidal conditions produces persistent wave energy along the exposed sandy coastal sectors. Under these conditions, microtidal ranges limit vertical shoreline accommodation, while mean offshore waves promote both cross-shore sediment mobilization and longshore sediment transport.
Where these forcing conditions coincide with low coastal elevations, gentle coastal slopes, and shallow nearshore bathymetry, shoreline adjustment tends to favor erosion. These conditions correspond closely with the mapped high and very high CVI zones, indicating sectors where morphological susceptibility and hydrodynamic exposure jointly increase vulnerability. Conversely, coastal segments characterized by rocky substrates, engineered shorelines, or deeper nearshore bathymetry display lower CVI values, reflecting greater resistance to wave-induced sediment transport and shoreline retreat.
4.2. Influence of Coastal Infrastructure and Sediment Dynamics
Anthropogenic coastal structures also influence vulnerability patterns along the Monrovia coastline. Harbor breakwaters and engineered shorelines modify local wave sheltering and disrupt alongshore sediment transport pathways, producing sediment shadow effects immediately downdrift of coastal structures. These processes are particularly evident along the coastal sectors extending from Hotel Africa to New Kru Town and parts of the Mamba Point–BTC Barracks coastline, where clusters of high CVI values correspond with areas influenced by harbor infrastructure and shoreline engineering.
In contrast, the St. Paul and Mesurado estuarine systems exhibit lower vulnerability levels due to localized sediment accumulation, partial hydrodynamic sheltering, and fluvial sediment supply. These natural buffering mechanisms are closely linked to estuarine shoaling processes and the presence of wetlands and mangrove systems. However, the persistence of these protective conditions depends on maintaining wetland ecosystems and channel morphology, as the loss of mangroves or channel modification could significantly reduce these natural protective functions [51,52].
4.3. Spatial Interpretation of Vulnerability Across Coastal Sectors
A sector-based interpretation helps clarify the mechanisms controlling vulnerability along the Monrovia coastline. The coastal segment extending from Hotel Africa to New Kru Town exhibits predominantly high to very high vulnerability due to the combination of sandy geology/geomorphology, low elevation, gentle slopes, shallow nearshore bathymetry, and persistent shoreline erosion. Immediately downdrift of the Freeport harbor structures, abrupt transitions in geomorphology and CVI values suggest structurally induced sediment deficits.
In the Mamba Point sector, vulnerability patterns are more heterogeneous. Rocky cliff provides localized resistance to erosion, while deeper nearshore bathymetry reduces exposure in adjacent areas, resulting in a mixture of low, moderate, and high CVI classes.
Along the Mamba Point to the BTC Barracks sector, limited back-beach accommodation combined with persistent wave forcing contributes to elevated vulnerability levels. Field observations indicate foundation exposure and narrowing berm widths at several locations, supporting the vulnerability classifications identified through the CVI analysis. Further east along the ELWA–King Gray coastal stretch, vulnerability remains generally high along exposed sandy sectors, while localized estuarine shoals display lower vulnerability due to sediment accumulation and partial hydrodynamic sheltering.
4.4. Implications for Coastal Management
The vulnerability patterns identified through the CVI analysis provide valuable guidance for coastal management and adaptation planning. Areas classified as high or very high vulnerability represent priority zones for monitoring and intervention. Traditional engineering measures such as seawalls and jetties may provide localized protection but often involve high construction and maintenance costs and may exacerbate erosion in adjacent downdrift areas [53].
Nature-based solutions, including mangrove restoration, dune stabilization, and coastal vegetation management, offer complementary strategies for reducing wave energy and enhancing sediment retention. These ecosystem-based approaches can provide broader system-wide benefits where natural coastal habitats remain intact [51,52].
Consequently, the CVI results support the development of hybrid coastal management strategies, combining structural protection measures, ecosystem restoration, and spatial planning tools such as setback zoning and managed retreat in highly exposed coastal sectors. Based on the CVI map, which depicts a dominant moderate to high vulnerability and localized very high vulnerability along coastal segment, these coastal management implications propose:
- Establishing new coastal setback regulations and enforcing the existing ones: coastal setback line should be properly defined scientifically and physically, which will prevent continuous encroachment on coastal dunes and beaches.
- Strengthening monitoring and data integration: a continuous monitoring of shoreline incorporates socio-economic risk assessment: the physical CVI should starts to integrate population density, infrastructure cost, and livelihood dependency.
4.5. Limitations
A comprehensive quantitative validation of the CVI would require long-term in situ shoreline monitoring, high-resolution elevation surveys, and detailed hydrodynamic measurements. Future studies integrating RTK-GPS shoreline surveys, wave buoy observations, and tide gauge datasets would enable more robust validation of index-based vulnerability classifications.
The CVI applied in this study represents a relative exposure assessment tool and therefore has several limitations. The assumption of equal weighting across the nine parameters simplifies parameter interactions and may not fully capture process dominance variations. Additionally, the analysis relies on datasets collected over different time periods, which may introduce temporal representativeness constraints. Uncertainties associated with shoreline change estimates, bathymetric data, and elevation measurements may also propagate through the ranking process [5,35].
Nevertheless, the consistent agreement among multiple vulnerability indicators, including low elevation, gentle slopes, shallow nearshore bathymetry, and sandy geology/geomorphology, supports the robustness of the spatial vulnerability patterns identified in this study.
5. Conclusions
This study provides a first-order spatial screening of the Monrovia coastline using a multi-parameter physical CVI framework. High vulnerability segments are spatially concentrated in low-elevation, sandy, and actively eroding sections of the coastline, highlighting areas where geomorphological susceptibility and shoreline change trends coincide.
However, the CVI represents a relative exposure index rather than a predictive risk model. The results are conditioned by equal parameter weighting, classification procedures, mixed temporal datasets, and the inclusion of spatially uniform forcing parameters that represent baseline exposure rather than spatial discrimination. Future work integrating storm surge events, socioeconomic exposure indicators, alternative weighting schemes, and higher-resolution topographic data would strengthen risk-based coastal adaptation planning.
Mapped results indicate that moderate, high, and very high classes dominate large portions of the study area, reflecting the co-occurrence of low elevations, gentle coastal slopes, shallow nearshore bathymetry, sandy beach facies, energetic wave climate, rising sea levels, and widespread erosion (with ≈80% of DSAS transects showing negative long-term rates).
This work demonstrates the practicality of the city-scale, equal-weight CVI for the coast of Monrovia and provides a baseline for routine updates. Future iterations can incorporate additional geomorphic, physical, and socioeconomic indicators (e.g., storm surge, sediment budgets, and coastal infrastructure exposure) to advance from exposure screening toward fully risk-based adaptation planning across the Monrovia coast.
Supplementary Materials
The following supporting information can be downloaded at: https://www.mdpi.com/article/10.3390/oceans7020033/s1, Table S1: Complete Dataset of the nine selected parameters of the Coastal Vulnerability Index.
Author Contributions
Conceptualization, T.K.W., A.A., A.B. and A.M.; methodology, Y.F., T.B. and A.M.; software, T.K.W. and Y.F.; validation, T.K.W. and I.T.; investigation, T.K.W., Y.F. and Z.E.; resources, T.B.; data curation, Y.F. and Z.E.; writing—original draft preparation, T.K.W. and A.M.; writing—review and editing, A.B., A.M., Y.F. and Z.E.; visualization, T.K.W., Y.F. and Z.E.; supervision, A.A., A.B. and A.M.; funding acquisition, I.T. All authors have read and agreed to the published version of the manuscript.
Funding
This research received no external funding.
Data Availability Statement
The original contributions presented in this study are included in the article. The datasets generated and analyzed during the current study are available from the corresponding author upon reasonable request.
Acknowledgments
The authors would like to sincerely acknowledge George H. Fahnbulleh and Isaac Vah Tukpah Jr., affiliated with Liberia Aerial Services (LAS), for kindly providing the UAV imagery used in this study at no cost. Their support significantly contributed to the field-based interpretation and qualitative validation of shoreline dynamics presented in this research. During the preparation of this work, the authors used ChatGPT 5.0 in order to rephrase some sentences. After using this tool, the authors reviewed and edited the content as needed and take full responsibility for the content of the publication.
Conflicts of Interest
Isaac Tukpah is affiliated with Pepperbird Aerial Services (PAS) and Lake Piso Solution. The remaining authors declare that the research was conducted in the absence of any commercial or financial relationships that could be construed as a potential conflict of interest.
References
- Williams, T.K.; Belrhaba, T.; Aangri, A.; Fannassi, Y.; Ennouali, Z.; Mayson, J.C.L.; Fahnbulleh, G.K.; Benmohammadi, A.; Masria, A. Assessing Historical Shoreline Change and Forecasting Future Trends Along Monrovia’s Coastline, Liberia. Geomatics 2026, 6, 6. [Google Scholar] [CrossRef] [Scilit]
- Nicholls, R.J.; Brown, S.; Goodwin, P.; Wahl, T.; Lowe, J.; Solan, M.; Goldbold, J.A.; Haigh, I.D.; Lincke, D.; Hinkel, J.; et al. Stabilization of global temperature at 1.5 °C and 2.0 °C: Implications for coastal areas. Philos. Trans. R. Soc. Math. Phys. Eng. Sci. 2018, 376, 20160448. [Google Scholar] [CrossRef] [Scilit]
- Gornitz, V. Global coastal hazards from future sea level rise. Palaeogeogr. Palaeoclimatol. Palaeoecol. 1991, 89, 379–398. [Google Scholar] [CrossRef] [Scilit]
- Nicholls, R.J.; Wong, P.P.; Burkett, V.; Codignotto, J.; Hay, J.; McLean, R.; Ragoonaden, S.; Woodroffe, C.D.; Abuodha, P.A.O.; Arblaster, J.; et al. Coastal Systems and Low-Lying Areas. 2007. Available online: http://ro.uow.edu.au/scipapers/164 (accessed on 6 December 2025).
- Ferreira, J.C.; Cardona, F.S.; Jóia Santos, C.; Tenedório, J.A. Hazards, Vulnerability, and Risk Analysis on Wave Overtopping and Coastal Flooding in Low-Lying Coastal Areas: The Case of Costa da Caparica, Portugal. Water 2021, 13, 237. [Google Scholar] [CrossRef] [Scilit]
- IPCC. Climate Change 2014: Synthesis Report. Contribution of Working Groups I, II and III to the Fifth Assessment Report of the Intergovernmental Panel on Climate Change; Pachauri, R.K., Meyer, L.A., Eds.; IPCC: Geneva, Switzerland, 2014; p. 151. [Google Scholar]
- Bevacqua, A.; Yu, D.; Zhang, Y. Coastal vulnerability: Evolving concepts in understanding vulnerable people and places. Environ. Sci. Policy 2018, 82, 19–29. [Google Scholar] [CrossRef] [Scilit]
- Contestabile, P.; Vicinanza, D. Coastal Vulnerability and Mitigation Strategies: From Monitoring to Applied Research. Water 2020, 12, 2594. [Google Scholar] [CrossRef] [Scilit]
- Thieler, E.R.; Hammar-Klose, E.S. National Assessment of Coastal Vulnerability to Sea-Level Rise; U.S. Geological Survey: Woods Hole, MA, USA, 1999.
- Furlan, E.; Pozza, P.D.; Michetti, M.; Torresan, S.; Critto, A.; Marcomini, A. Development of a Multi-Dimensional Coastal Vulnerability Index: Assessing vulnerability to inundation scenarios in the Italian coast. Sci. Total Environ. 2021, 772, 144650. [Google Scholar] [CrossRef] [Scilit] [PubMed]
- Ortiz, P.; López, I.; Pagán, J.I. Assessment of Beach Erosion Vulnerability in the Province of Valencia, Spain. J. Mar. Sci. Eng. 2024, 12, 2111. [Google Scholar] [CrossRef] [Scilit]
- Boumpoulis, V.; Depountis, N.; Dimas, A.; Papatheodorou, G. Presentation and analysis of the Geotechnical Coastal Vulnerability Index and validation of its application to coastal erosion problems. Sci. Rep. 2025, 15, 1424. [Google Scholar] [CrossRef] [Scilit]
- Theocharidis, C.; Prodromou, M.; Doukanari, M.; Kalogirou, E.; Eliades, M.; Kontoes, C.; Hadjimitsis, D.; Neocleous, K. Integrated Coastal Vulnerability Index (ICVI) Assessment of Protaras Coast in Cyprus: Balancing Tourism and Coastal Risks. Geographies 2025, 5, 12. [Google Scholar] [CrossRef] [Scilit]
- Rocha, C.; Antunes, C.; Catita, C. Coastal indices to assess sea-level rise impacts—A brief review of the last decade. Ocean Coast. Manag. 2023, 237, 106536. [Google Scholar] [CrossRef] [Scilit]
- Awange, J.L.; Saleem, A.; Konneh, S.S.; Goncalves, R.M.; Kiema, J.B.K.; Hu, K.X. Liberia’s coastal erosion vulnerability and LULC change analysis: Post-civil war and Ebola epidemic. Appl. Geogr. 2018, 101, 56–67. [Google Scholar] [CrossRef] [Scilit]
- CDR International B.V. Provision of Consultancy Services for Engineering and Safeguards Assessment of Proposed Interventions in the Coastal Areas of the Monrovia Metropolitan Area (MMA) in Liberia. 2019. Available online: https://www.ungm.org/Public/Notice/70595 (accessed on 23 January 2023).
- LIGIS. Liberia Population and Housing Census Final Results. 2022. Available online: https://lisgis.gov.lr/document/LiberiaCensus2022Report.pdf (accessed on 28 January 2024).
- Nicholls, R.J.; Cazenave, A. Sea-Level Rise and Its Impact on Coastal Zones. Science 2010, 328, 1517–1520. [Google Scholar] [CrossRef] [Scilit] [PubMed]
- USAID. Liberia Climate Change Assessment. 2013. Available online: https://epa.gov.lr/epa-documents/liberia-climate-change-assessment/ (accessed on 11 January 2026).
- UN DESA. World Population Prospects 2015: 2015 Revision. 2015. Available online: https://esa.un.org/unpd/wpp/ (accessed on 20 January 2024).
- Global Environmental Facility. LDCF—Liberia—Enhancing Resilience of Vulnerable Coastal Areas to Climate Change Risks. 2010. Available online: https://www.thegef.org/newsroom/news/ldcf-liberia-enhancing-resilience-vulnerable-coastal-areas-climate-change-risks (accessed on 16 January 2025).
- Wiles, D.L. Coastal Zone Vulnerability and Adaptation to Climate Change in Liberia. 2005. Available online: https://unfccc.int/files/national_reports/non-annex_i_natcom/meetings/application/pdf/20050419wiles.pdf (accessed on 28 January 2025).
- Titus, J.G. Climate Changes and the Coast: Western Africa, the Americas, the Mediterranean Basin, and the Rest of Europe. In Miami Conference on Adaptive Responses to Sea Level Rise and Other Impacts of Global Climate Change: Changing Climate and the Coast; U.S. Environmental Protection Agency: Washington, DC, USA, 1990; Volume 2. [Google Scholar]
- UNDP. Enhancing Resilience of Vulnerable Coastal Areas to Climate Change Risks in Liberia. 2010. Available online: https://www.adaptation-undp.org/projects/enhancing-resilience-vulnerable-coastal-areas-climate-change-risks-liberia (accessed on 25 January 2025).
- Macdougall, C. Fearing the Tide in West Point, a Slum Already Swamped With Worry. The New York Times, 2016. Available online: https://alnap.org/help-library/resources/fearing-the-tide-in-west-point-a-slum-already-swamped-with-worry/ (accessed on 1 December 2025).
- McSweeney, C.; New, M.; Lizcano, G.; Lu, X. The UNDP Climate Change Country Profiles: Improving the Accessibility of Observed and Projected Climate Information for Studies of Climate Change in Developing Countries. Bull. Am. Meteorol. Soc. 2010, 91, 157–166. [Google Scholar] [CrossRef] [Scilit]
- Addo, K.A. Assessing Coastal Vulnerability Index to Climate Change: The Case of Accra—Ghana. J. Coast. Res. 2013, 165, 1892–1897. [Google Scholar] [CrossRef] [Scilit]
- Hoque, M.A.-A.; Ahmed, N.; Pradhan, B.; Roy, S. Assessment of coastal vulnerability to multi-hazardous events using geospatial techniques along the eastern coast of Bangladesh. Ocean Coast. Manag. 2019, 181, 104898. [Google Scholar] [CrossRef] [Scilit]
- McLaughlin, S.; Cooper, J.A.G. A multi-scale coastal vulnerability index: A tool for coastal managers. Environ. Hazards 2010, 9, 233–248. [Google Scholar] [CrossRef] [Scilit]
- Tahri, M.; Maanan, M.; Maanan, M.; Bouksim, H.; Hakdaoui, M. Using Fuzzy Analytic Hierarchy Process multi-criteria and automatic computation to analyse coastal vulnerability. Prog. Phys. Geogr. Earth Environ. 2017, 41, 268–285. [Google Scholar] [CrossRef] [Scilit]
- Rao, K.N.; Subraelu, P.; Rao, T.V.; Malini, B.H.; Ratheesh, R.; Bhattacharya, S.; Rajawat, A.S.; Ajai. Sea-level rise and coastal vulnerability: An assessment of Andhra Pradesh coast, India through remote sensing and GIS. J. Coast. Conserv. 2008, 12, 195–207. [Google Scholar] [CrossRef] [Scilit]
- Kumar, T.S.; Mahendra, R.S.; Nayak, S.; Radhakrishnan, K.; Sahu, K.C. Coastal vulnerability assessment for Orissa State, east coast of India. J. Coast. Res. 2010, 26, 523–534. [Google Scholar] [CrossRef] [Scilit]
- El-Asmar, H.M.; Hereher, M.E. Change detection of the coastal zone east of the Nile Delta using remote sensing. Environ. Earth Sci. 2011, 62, 769–777. [Google Scholar] [CrossRef] [Scilit]
- Kumaravel, S.; Ramkumar, T.; Gurunanam, B.; Suresh, M.; Dharanirajan, K. An Application of Remote Sensing and GIS Based Shoreline Change Studies—A Case Study in the Cuddalore District, East Coast of Tamilnadu, South India. Int. J. Innov. Technol. Explor. Eng. 2013, 2, 4. [Google Scholar]
- Juigner, M.; Robin, M.; Fattal, P.; Maanan, M.; Le Guern, C.; Gouguet, L.; Baudouin, V.; Debaine, F. Cinématique d’un trait de côte sableux en Vendée entre 1920 et 2010. Dyn. Environ. 2013, 30, 29–39. [Google Scholar]
- Sudmeier-Rieux, K.; Ash, N.; Murti, R. Environmental Guidance Note for Disaster Risk Reduction: Healthy Ecosystems for Human Security and Climate Change Adaptation; IUCN: Gland, Switzerland, 2013; p. 34. [Google Scholar]
- Lopes, N.D.R.; Li, T.; Matomela, N.; Sá, R.M. Coastal vulnerability assessment based on multi-hazards and biogeophysical parameters: Case study—Northwestern coastline of Guinea-Bissau. Nat. Hazards 2022, 114, 989–1013. [Google Scholar] [CrossRef] [Scilit]
- Sajjad, M.; Chan, J.C.L. Risk assessment for the sustainability of coastal communities: A preliminary study. Sci. Total Environ. 2019, 671, 339–350. [Google Scholar] [CrossRef] [Scilit]
- Kumar, A.A.; Kunte, P.D. Coastal vulnerability assessment for Chennai, east coast of India using geospatial techniques. Nat. Hazards 2012, 64, 853–872. [Google Scholar] [CrossRef] [Scilit]
- Steinberg, D.; Martinson, D.; Costa, D. Two Decades of Pelagic Ecology of the Western Antarctic Peninsula. Oceanography 2012, 25, 56–67. [Google Scholar] [CrossRef] [Scilit]
- Antonioli, F.; De Falco, G.; Lo Presti, V.; Moretti, L.; Scardino, G.; Anzidei, M.; Bonaldo, D.; Carniel, S.; Leoni, G.; Furlani, S.; et al. Relative Sea-Level Rise and Potential Submersion Risk for 2100 on 16 Coastal Plains of the Mediterranean Sea. Water 2020, 12, 2173. [Google Scholar] [CrossRef] [Scilit]
- Koroglu, A.; Ranasinghe, R.; Jiménez, J.A.; Dastgheib, A. Comparison of Coastal Vulnerability Index applications for Barcelona Province. Ocean Coast. Manag. 2019, 178, 104799. [Google Scholar] [CrossRef] [Scilit]
- Pilkey, O.H.; Davis, T.W. Analysis of Coastal Recession Models: North Carolina Coast; SEPM Society for Sedimentary Geology: Tulsa, OK, USA, 1987; Volume 41. [Google Scholar] [CrossRef] [Scilit]
- Sahana, M.; Rehman, S.; Paul, A.K.; Sajjad, H. Assessing socio-economic vulnerability to climate change-induced disasters: Evidence from Sundarban Biosphere Reserve, India. Geol. Ecol. Landsc. 2021, 5, 40–52. [Google Scholar] [CrossRef] [Scilit]
- Hakkou, M.; Maanan, M.; Belrhaba, T.; Leone, F.; Benmohammadi, A.; El Khalidi, K.; Zourarah, B. Assess and mapping the flooding hazards using geospatial tools and empirical model along Kenitra coast, Morocco. Ocean Coast. Manag. 2019, 169, 264–272. [Google Scholar] [CrossRef] [Scilit]
- Mani Murali, R.; Ankita, M.; Amrita, S.; Vethamony, P. Coastal vulnerability assessment of Puducherry coast, India, using the analytical hierarchical process. Nat. Hazards Earth Syst. Sci. 2013, 13, 3291–3311. [Google Scholar] [CrossRef] [Scilit]
- Williams, M.R. Investigating the Impact of Coastal Erosion at Coastal Communities in Liberia. 2022. Available online: https://commons.wmu.se/all_dissertations/2094/ (accessed on 16 January 2025).
- Cao, C.; Cai, F.; Qi, H.; Liu, J.; Lei, G.; Zhu, K.; Mao, Z. Coastal Erosion Vulnerability in Mainland China Based on Fuzzy Evaluation of Cloud Models. Front. Mar. Sci. 2022, 8, 790664. [Google Scholar] [CrossRef] [Scilit]
- Gornitz, V.; Daniels, R.C.; White, T.W.; Birdwell, K.R. The development of a coastal risk assessment database: Vulnerability to sea-level rise in the U.S. southeast. J. Coast. Res. 1994, 12, 327–338. [Google Scholar]
- Wang, X.; Zhang, W.; Yin, J.; Wang, J.; Ge, J.; Wu, J.; Luo, W.; Lam, N.S.N. Assessment of coastal erosion vulnerability and socio-economic impact along the Yangtze River Delta. Ocean Coast. Manag. 2021, 215, 105953. [Google Scholar] [CrossRef] [Scilit]
- Hereher, M.; Al-Awadhi, T.; Al-Hatrushi, S.; Charabi, Y.; Mansour, S.; Al-Nasiri, N.; Sherief, Y.; El-Kenawy, A. Assessment of the coastal vulnerability to sea level rise: Sultanate of Oman. Environ. Earth Sci. 2020, 79, 369. [Google Scholar] [CrossRef] [Scilit]
- Ahammed, K.K.B.; Pandey, A.C. Coastal Social Vulnerability and Risk Analysis for Cyclone Hazard Along the Andhra Pradesh, East Coast of India. KN J. Cartogr. Geogr. Inf. 2019, 69, 285–303. [Google Scholar] [CrossRef] [Scilit]
- Harman, B.P.; Heyenga, S.; Taylor, B.M.; Fletcher, C.S. Global Lessons for Adapting Coastal Communities to Protect against Storm Surge Inundation. J. Coast. Res. 2015, 314, 790–801. [Google Scholar] [CrossRef] [Scilit]

Disclaimer/Publisher’s Note: The statements, opinions and data contained in all publications are solely those of the individual author(s) and contributor(s) and not of MDPI and/or the editor(s). MDPI and/or the editor(s) disclaim responsibility for any injury to people or property resulting from any ideas, methods, instructions or products referred to in the content. |
© 2026 by the authors. Licensee MDPI, Basel, Switzerland. This article is an open access article distributed under the terms and conditions of the Creative Commons Attribution (CC BY) license.