1. Introduction
The heavy-duty road freight sector is a primary contributor to global greenhouse gas emissions, making its decarbonization imperative for achieving international climate targets [
1]. Recent assessments highlight the urgency of this transition: the Clean Hydrogen JU Annual Work Programme 2025 emphasizes the accelerated deployment of hydrogen-based solutions for heavy-duty applications, while the IDTechEx FCEV 2025–2045 report projects a 60-fold market growth for fuel cell electric vehicles by 2045, driven by zero-emission mandates [
2,
3]. Similarly, the U.S. DOE medium- and heavy-duty vehicle plan outlines strategies to achieve 30% zero-emission heavy-duty vehicle sales by 2030, aligning with global efforts to reduce emissions from long-haul logistics [
4].
In recent years, while battery electric vehicles (BEVs) have demonstrated zero-emission viability for short-haul urban logistics, their deployment in long-haul transit faces formidable technological and economic barriers [
5]. The relatively low energy density of lithium-ion batteries necessitates the installation of massive battery packs, often weighing between 5 and 9 tons, which severely restricts the permissible cargo payload capacity of Class 8 trucks and undermines fleet profitability [
6,
7]. Furthermore, the rapid charging of these immense battery capacities demands megawatt-scale infrastructure, introducing profound challenges such as extended operational downtime, severe space capacity constraints at charging stations, and disruptive peak loads on the electrical distribution grid [
8,
9]. To circumvent the range and payload limitations inherent to battery-centric systems, fuel cell hybrid electric vehicles have emerged as a highly strategic alternative for heavy-duty transportation [
10]. Among these, Proton Exchange Membrane Fuel Cells (PEMFC) currently dominate the commercial landscape due to their rapid cold-start capabilities [
11]. Nevertheless, the integration of PEMFCs into heavy-duty trucks is fundamentally constrained by severe thermal management bottlenecks and inherent durability issues [
12]. Operating at relatively low temperatures (typically 60–80 °C), PEMFCs exhibit a marginal temperature differential with the ambient environment. Consequently, rejecting the massive waste heat generated during uphill or high-load operations necessitates extraordinarily large radiators and cooling systems, imposing critical aerodynamic and packaging constraints on the vehicle chassis [
13]. Additionally, the aggressive dynamic load cycling dictated by real-world driving conditions induces severe thermal shocks and rapid voltage degradation within the polymer membrane. This accelerated degradation significantly curtails the remaining useful life (RUL) of the stack, thereby rendering the total cost of ownership (TCO) economically prohibitive for freight operators [
14,
15].
To overcome the inherent thermal management bottlenecks of PEMFCs, solid oxide fuel cells (SOFCs) have emerged as a highly efficient alternative for heavy-duty powertrains. Operating at elevated temperatures (typically 600–800 °C), SOFCs facilitate high-grade waste heat recovery and exhibit superior tolerance to fuel impurities. Recent advancements in metal-supported SOFCs (MS-SOFCs) have significantly enhanced their mechanical robustness and power density, making them increasingly viable for demanding automotive applications [
16,
17,
18]. For instance, Zhang et al. (2025) reviewed MS-SOFC applications in transportation, highlighting improved dynamic start-up performance compared to anode-supported designs [
17], while Ren et al. (2025) compared the behaviours of anode-supported and metal-supported SOFCs during hot start-up, demonstrating the faster thermal response capabilities of MS configurations [
18]. However, the deployment of SOFCs in highly dynamic environments, such as long-haul trucking, is fundamentally constrained by their susceptibility to thermal fatigue. Rapid load fluctuations, characteristic of real-world driving cycles involving steep gradients and frequent braking, inherently generate severe spatial temperature gradients within the stack. These thermal shocks accelerate irreversible degradation mechanisms, including nickel particle coarsening in the anode and flexural strength deterioration in the ceramic layers [
19,
20].
A widely explored strategy to maximize the system-level efficiency of high-temperature fuel cells is their integration with Micro Gas Turbines (MGTs) to recover exhaust heat [
21]. While SOFC-MGT hybrid systems exhibit exceptional steady-state performance, their dynamic operation in vehicular applications introduces critical control conflicts. Conventional thermostatic (bang-bang) or aggressive load-following control strategies impose severe mechanical stress on MGT air foil bearings and induce thermal fatigue in the recuperator [
22,
23]. To effectively decouple the SOFC’s thermal transients from the MGT’s mechanical limitations, this study proposes a novel powertrain topology incorporating a high-temperature PCM, specifically a eutectic Al–Si alloy [
24], as a latent heat buffer. While PCMs have been extensively studied for stationary energy storage [
25], their integration into mobile SOFC-MGT architectures remains largely unexplored. Recent advances in metallic PCMs for SOFC thermal management include microencapsulated Al–Si alloys for high-temperature stability [
26] and PCM-integrated stacks for operating range extension [
27], demonstrating reduced thermal gradients and enhanced durability. By coupling this physical thermal buffer with an advanced Energy Management Strategy (EMS) [
28], the control paradigm is shifted from rigid load-following to a continuous, thermal-state-of-charge (SOC
th)-proportional modulation. This integrated approach aims to entirely dampen the destructive thermal gradients on the SOFC, minimize MGT mechanical wear, and significantly extend the system’s remaining useful life (RUL) under realistic heavy-duty operations.
Despite the proven theoretical merits of PCMs in stationary high-temperature thermal energy storage, their dynamic integration into mobile SOFC-MGT hybrid powertrains remains a conspicuous gap in the literature. Previous studies have predominantly concentrated on steady-state part-load operations or employed conventional thermostatic control strategies. Furthermore, the simultaneous multi-objective sizing of the latent heat buffer and the electrical energy storage system, tightly coupled with a degradation-aware control logic, has not been comprehensively investigated to date [
29,
30]. The commercial deployment of SOFCs in heavy-duty transportation has been historically impeded by their vulnerability to thermal shocks and prolonged start-up times. Dynamic vehicular load fluctuations inherently induce severe thermal gradients, leading to mechanical degradation and micro-cracking of the ceramic electrolyte. Therefore, integrating a thermal buffering mechanism, such as a PCM, becomes physically imperative to decouple the transient electrical demands from the stack’s thermal response, thereby unlocking the true potential of SOFCs for dynamic applications.
The aim of this study is to develop and rigorously evaluate a novel, degradation-aware hybrid powertrain topology tailored for Class 8 heavy-duty trucks, which seamlessly integrates a metal-supported SOFC, a micro gas turbine, a lithium-ion battery pack, and a high-temperature Al–Si eutectic PCM buffer. The specific objectives are threefold: first, to formulate a high-fidelity dynamic simulation framework that accurately captures the coupled electrochemical, thermodynamic, and mechanical domains of the proposed system; second, to employ the Non-dominated Sorting Genetic Algorithm II (NSGA-II) to resolve the techno-economic trade-off between capital expenditure and system degradation through optimal sizing of the PCM buffer and battery capacity; and third, to design and demonstrate a continuous, Thermal-SOC-proportional Energy Management Strategy that minimizes MGT mechanical wear and extends the projected remaining useful life of the SOFC stack under realistic long-haul drive cycles, thereby establishing the proposed architecture as a durable, economically viable, and robust paradigm for next-generation heavy-duty vehicles.
The present study is motivated by three interconnected gaps in the current literature: (i) the absence of high-temperature PCM integration strategies for mobile SOFC-MGT architectures, despite proven benefits in stationary thermal storage; (ii) the lack of degradation-aware control frameworks that explicitly link thermal buffering to component lifetime extension; and (iii) insufficient techno-economic analyses that simultaneously resolve CAPEX, durability, and operational robustness for long-haul heavy-duty applications. To address these gaps, this work makes three specific contributions: first, a novel powertrain topology that physically decouples SOFC thermal transients from MGT mechanical constraints via an Al–Si eutectic PCM buffer; second, a continuous, Thermal-SOC-proportional Energy Management Strategy that minimizes mechanical wear and thermal fatigue through intelligent, state-based modulation; and third, a comprehensive NSGA-II multi-objective optimization framework that quantifies the trade-off between capital investment and projected stack lifetime. Collectively, these contributions establish a durable, economically viable, and climatically robust pathway for zero-emission heavy-duty freight logistics.
2. Materials and Methods
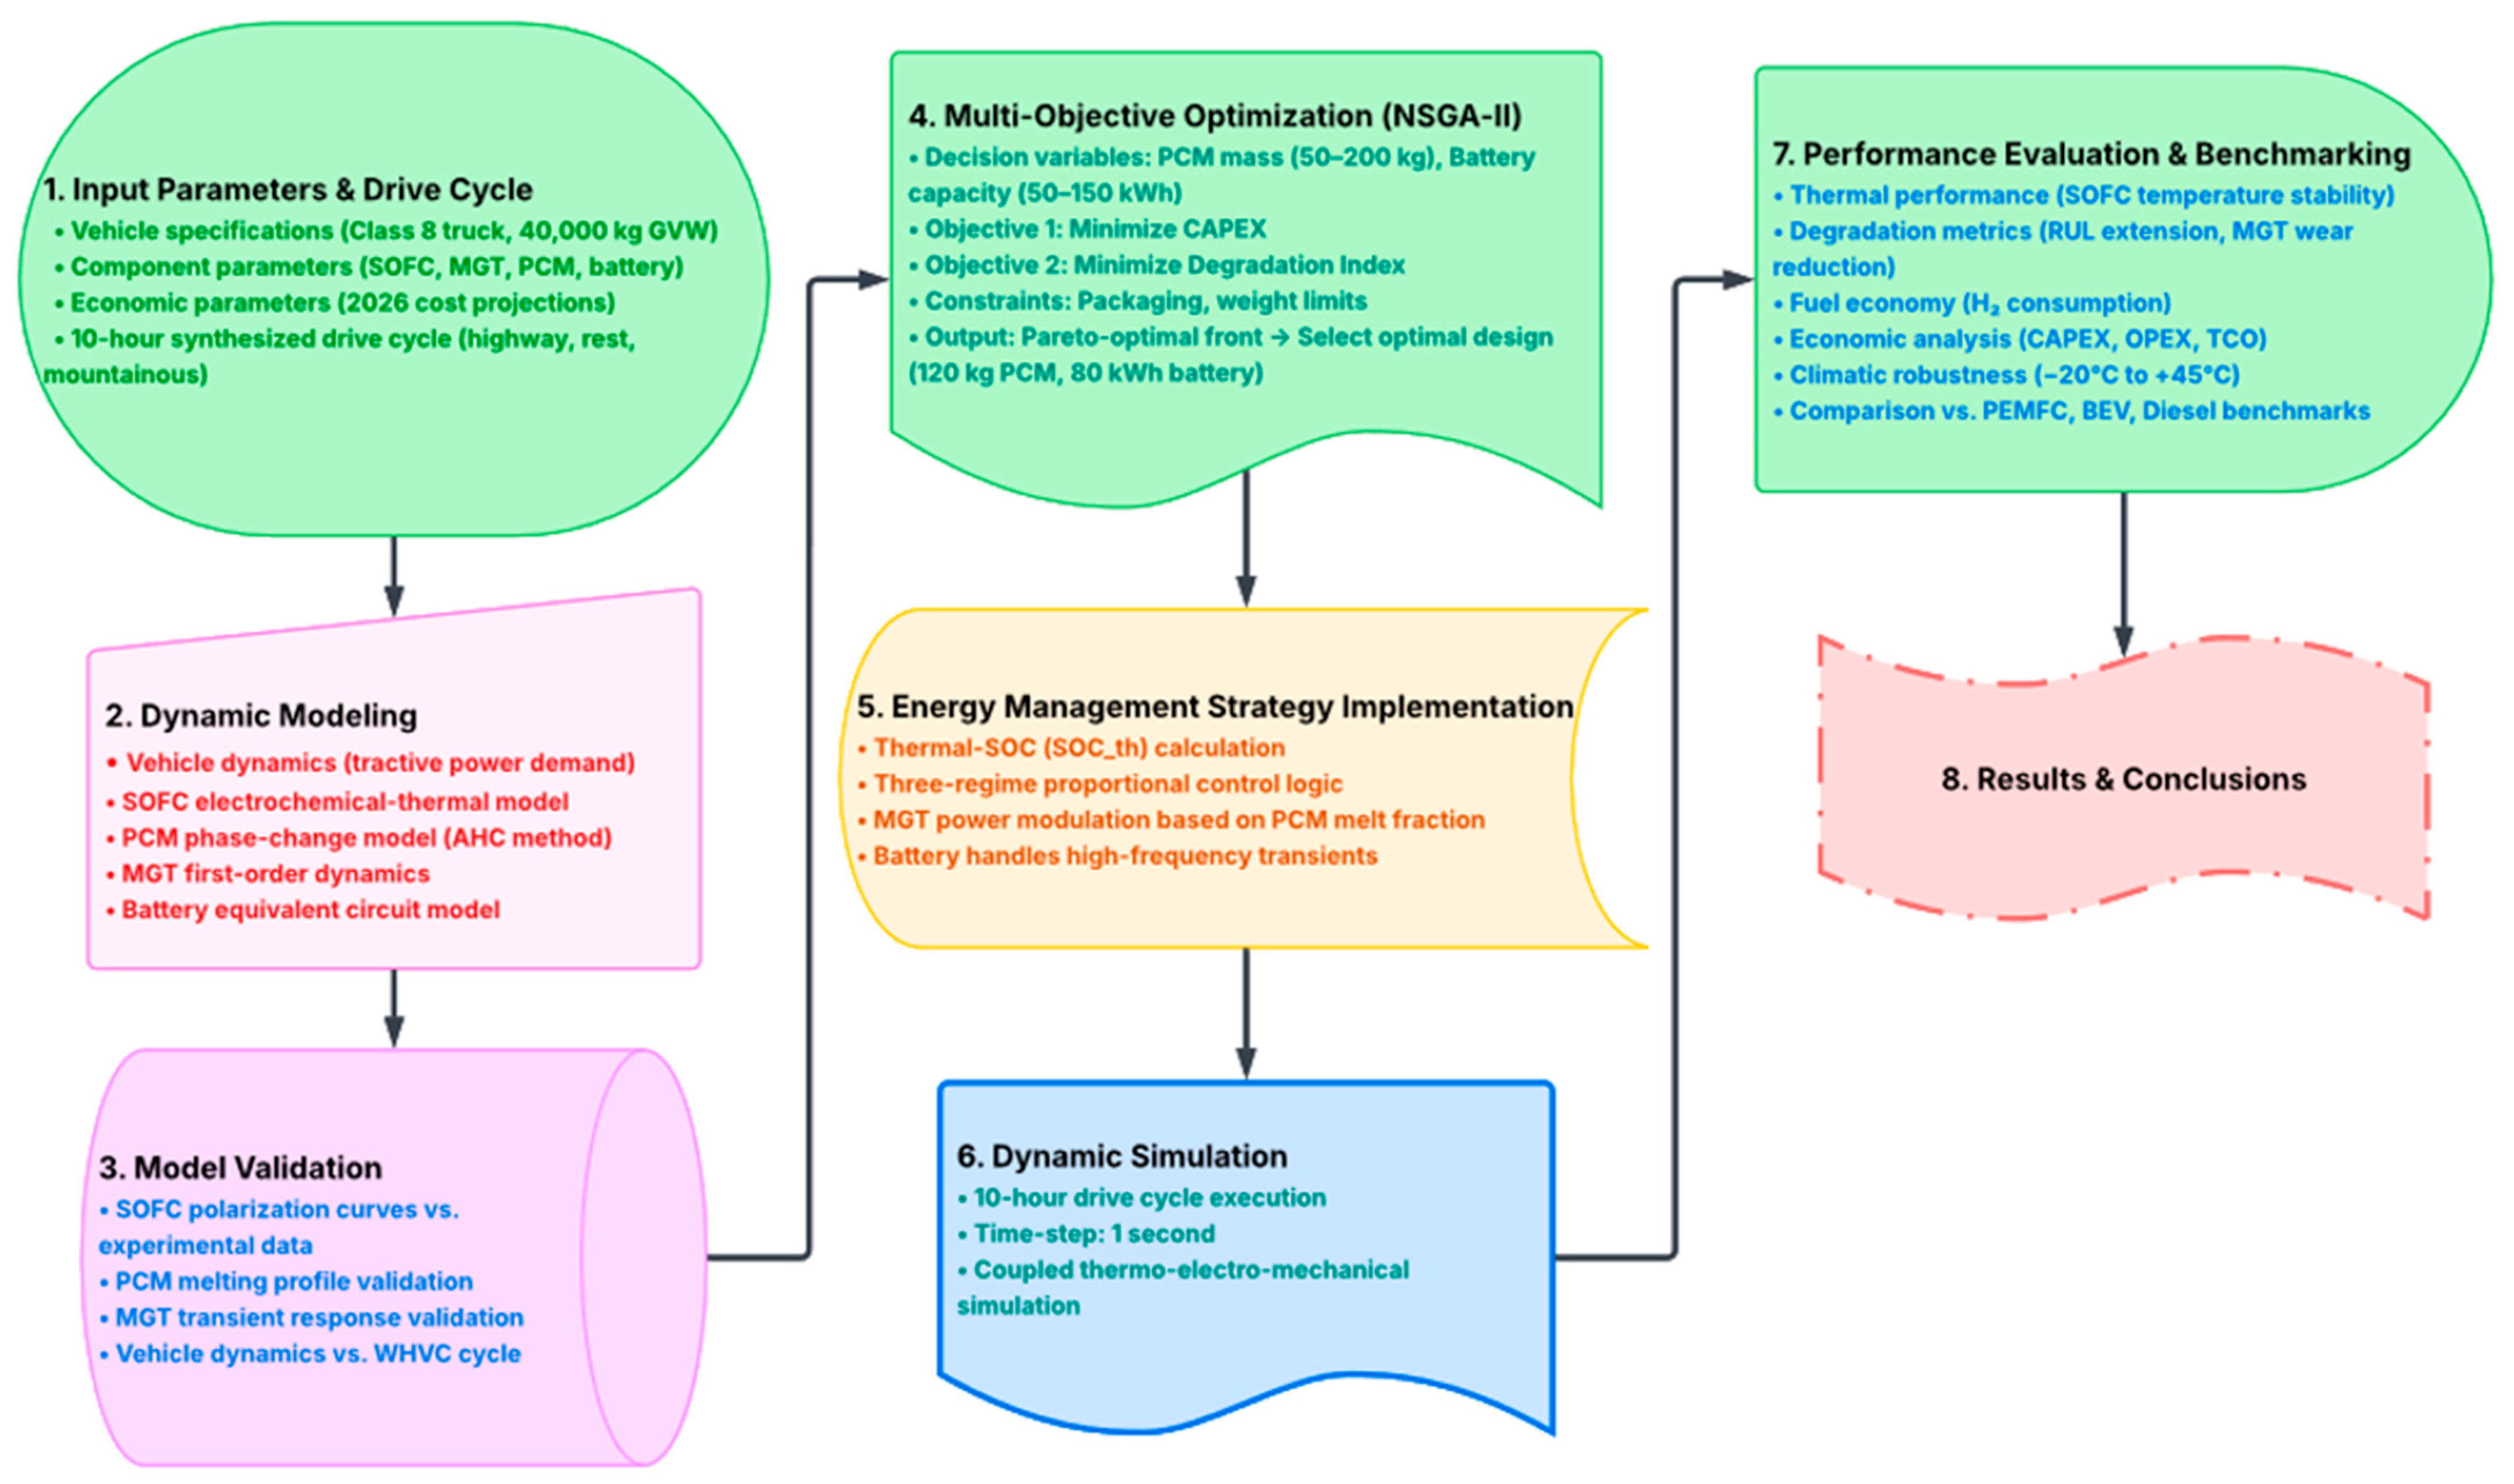
The integrated analytical framework for the proposed SOFC-MGT-PCM hybrid powertrain is illustrated in
Figure 1. The workflow consists of six sequential stages: first, definition of vehicle specifications and drive cycle; second, high-fidelity dynamic modelling of all subsystems; third, multi-level validation using experimental and standard cycle data; fourth, NSGA-II optimization that balances capital expenditure against degradation; fifth, implementation of the Thermal-SOC Energy Management Strategy; and sixth, comprehensive dynamic simulation and comparative evaluation. The following subsections elaborate on each phase, presenting the governing equations, parameter sets, and computational protocols necessary for full reproducibility.
2.1. Powertrain Architecture and Vehicle Dynamics Modelling
The hybrid powertrain architecture proposed in this study is meticulously designed to accommodate the transient load demands of a 40-ton Class 8 heavy-duty truck operating under long-haul conditions. To accurately quantify the instantaneous tractive power demand (
) at the wheels, a comprehensive longitudinal vehicle dynamics model is utilized, adopting established formulations from advanced vehicle propulsion and dynamics literature [
31,
32]. The system integrates four principal components that operate synergistically to optimize both electrical power dispatch and waste heat recovery. The required power is formulated as the dynamic equilibrium of aerodynamic drag, rolling resistance, road grading, and acceleration inertia:
where
is the instantaneous velocity derived from the driving cycle,
is the gross vehicle mass (40,000 kg),
represents the rolling resistance coefficient,
is the road gradient angle,
denotes air density,
is the frontal area, and
is the aerodynamic drag coefficient. The electrical power balance across the DC microgrid is strictly governed by Equation (2), ensuring that the tractive demand is continuously met:
where
encompasses the cumulative efficiency of the drivetrain components.
At the core of the power generation module is an MS-SOFC with a rated capacity of 150 kW, designated to supply the baseload power. To recuperate the high-grade thermal energy from the SOFC exhaust, a 30 kW MGT, modelled based on the operational characteristics of the Capstone C30 turbine which exhibits a thermal-to-electric conversion efficiency of 26%, is integrated downstream [
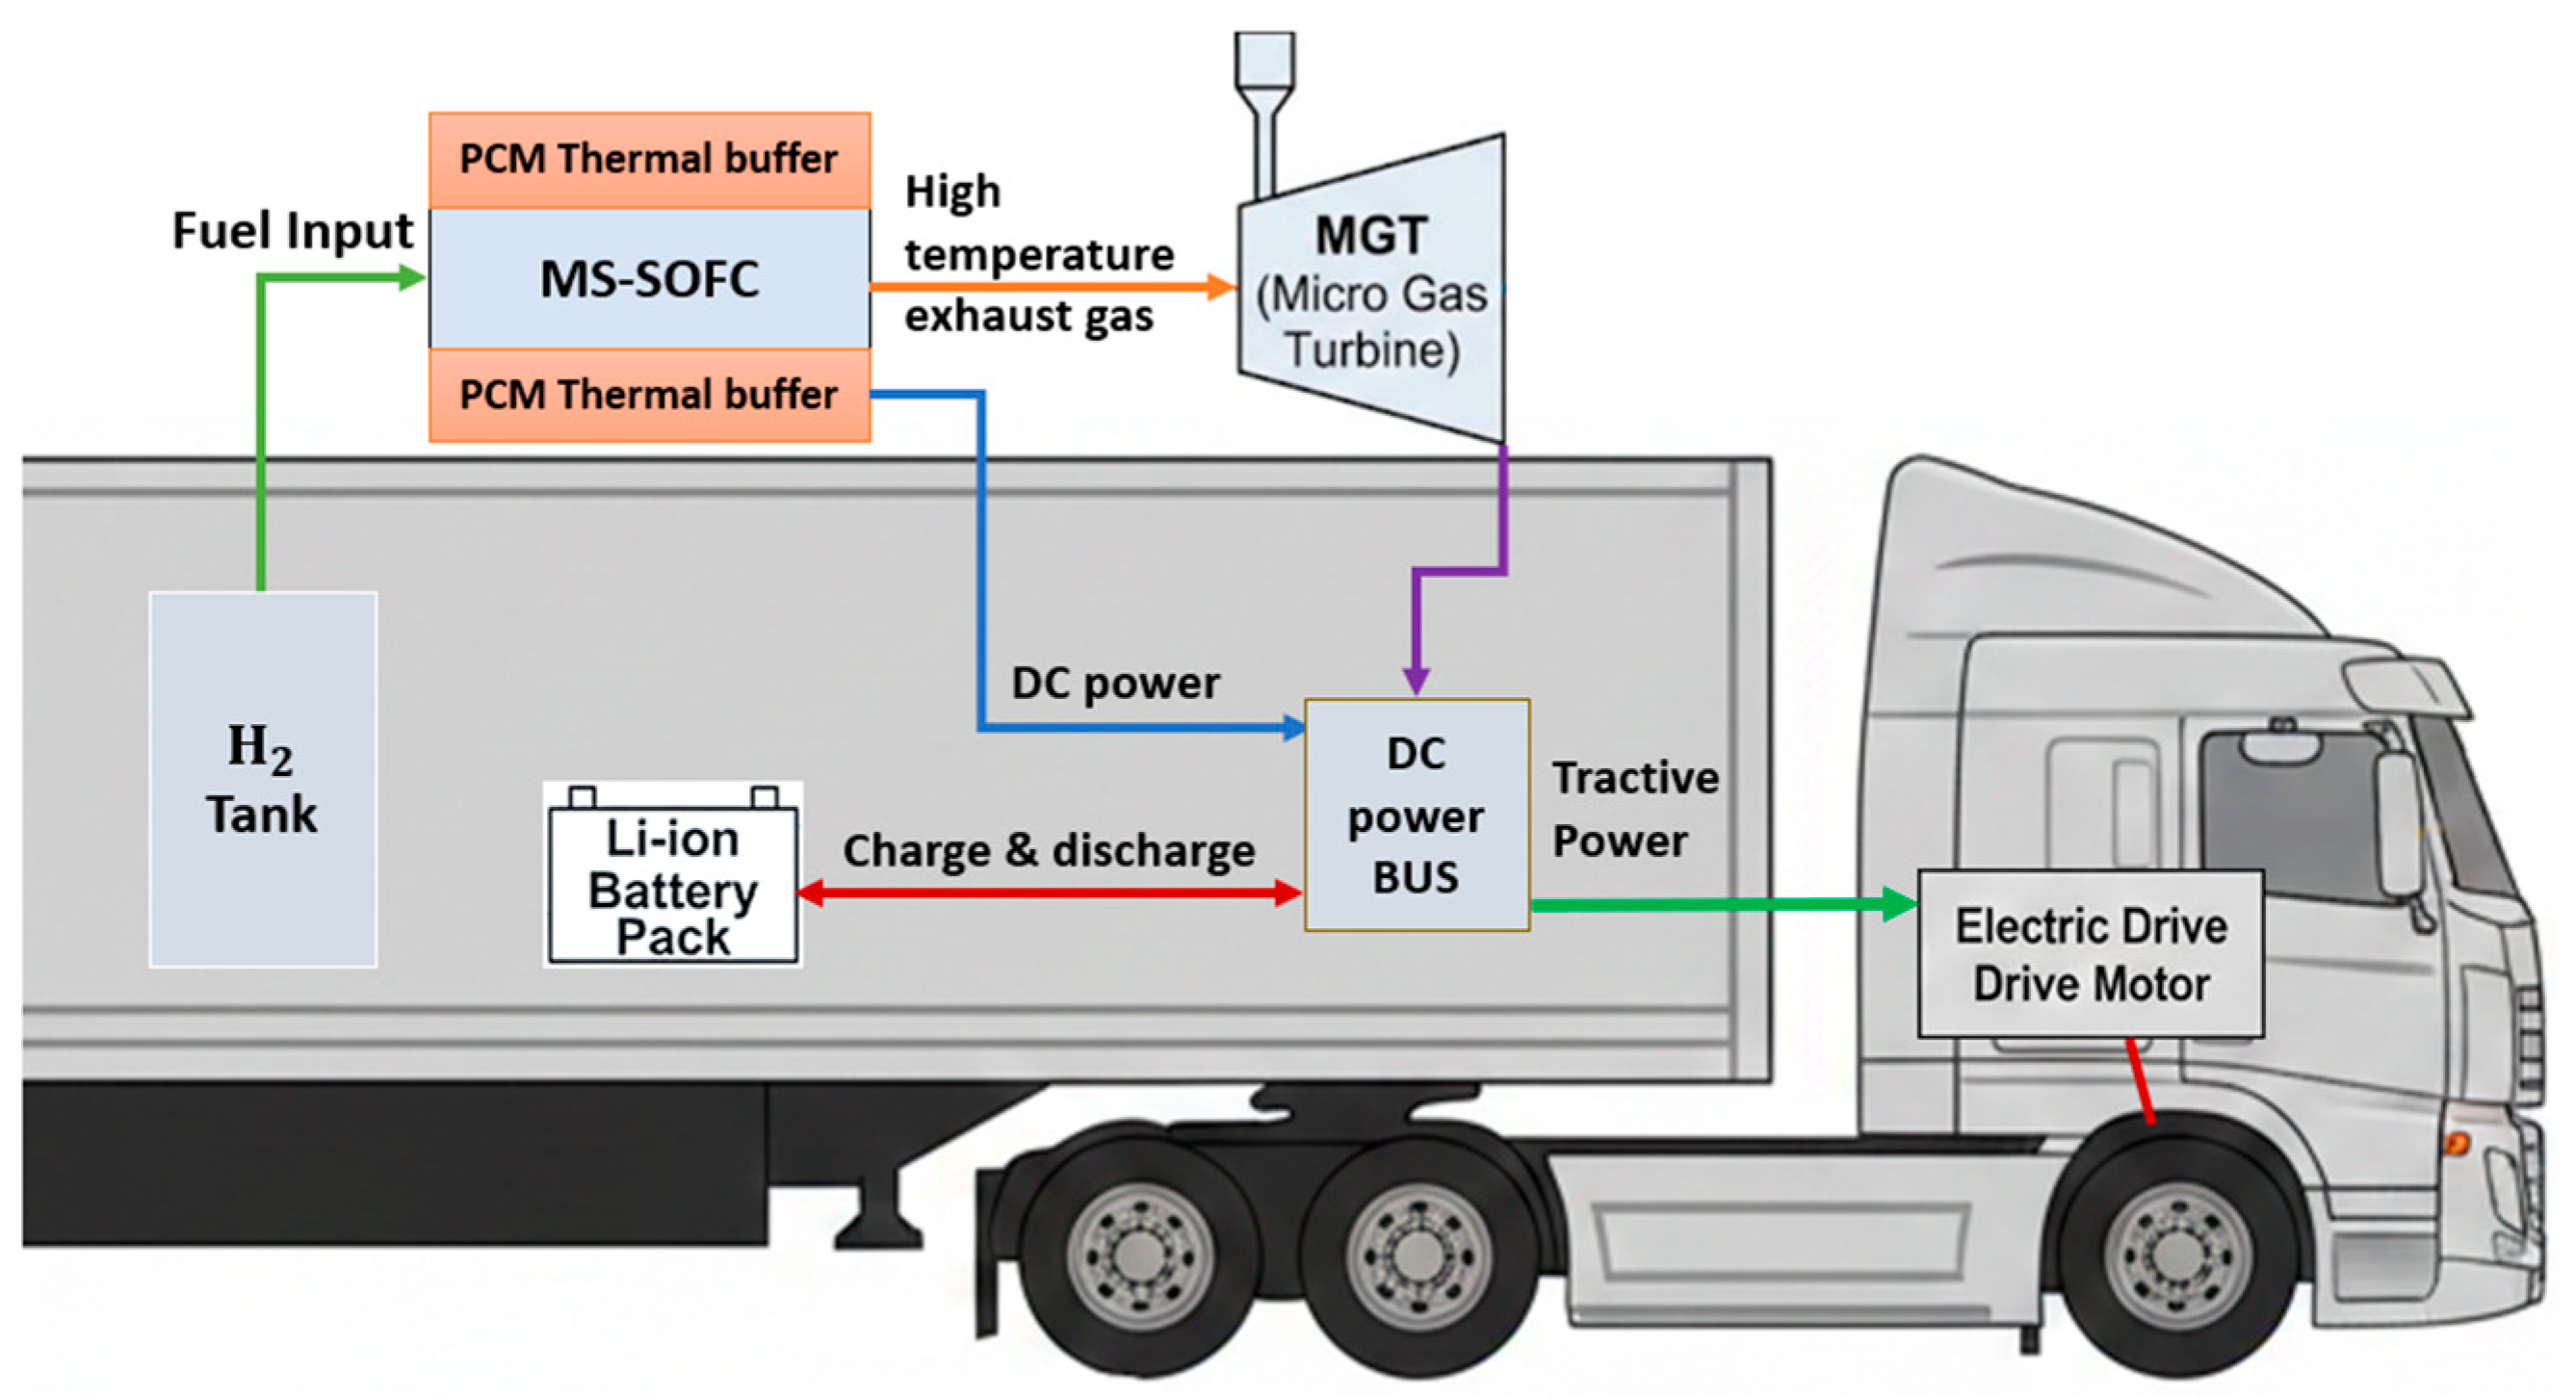
21]. The primary architectural novelty of this topology, as illustrated schematically in
Figure 2, is the physical embedding of a high-temperature PCM buffer between the SOFC and the MGT. An aluminum–silicon (Al–Si) eutectic alloy was selected for this purpose due to its exceptional thermal and mechanical stability at elevated temperatures, offering a melting point of 577 °C and a substantial latent heat of fusion of 450 kJ/kg [
24]. This PCM module acts as a robust thermal shock absorber, effectively decoupling the severe temperature fluctuations of the fuel cell from the mechanical dynamic constraints of the turbine. Finally, a lithium-ion battery pack is incorporated into the DC microgrid to absorb high-frequency road transients, such as sudden accelerations and regenerative braking events, thereby providing an essential electrical buffer. The main technical specifications and techno-economic parameters of the proposed hybrid powertrain are comprehensively summarized in
Table 1.
The primary architectural novelty of this topology is the physical embedding of a high-temperature PCM buffer between the SOFC and the MGT. An aluminum–silicon (Al–Si) eutectic alloy was selected for this purpose due to its exceptional thermal and mechanical stability at elevated temperatures, offering a melting point of 577 °C and a substantial latent heat of fusion of 450 kJ/kg [
24]. This PCM module acts as a robust thermal shock absorber, effectively decoupling the severe temperature fluctuations of the fuel cell from the mechanical dynamic constraints of the turbine. Finally, a lithium-ion battery pack is incorporated into the DC microgrid to absorb high-frequency road transients, such as sudden accelerations and regenerative braking events, thereby providing an essential electrical buffer.
Packaging considerations for truck integration are addressed in
Table 1, which include estimated mass and volumetric specifications for each major component, derived from literature-reported power and volumetric densities [
16,
17,
24,
33] and manufacturer data. The total estimated powertrain mass (~1130 kg) and volume (~1.2–1.5 m
3, excluding hydrogen storage) are compatible with standard chassis constraints and preserve full cargo payload capacity. These estimates should be validated through detailed CAD-level packaging studies in future prototype development.
2.2. Dynamic Modelling and Power Dispatch of the Hybrid Powertrain Components
To accurately evaluate the transient responses of the proposed hybrid system under realistic driving cycles, a comprehensive dynamic simulation framework was developed. This framework couples the electrochemical, thermodynamic, and mechanical domains. To ensure full reproducibility, all governing equations and their specific calibrated parameter values are presented cohesively below, with a complete summary provided in
Table 2.
2.2.1. System-Level Power Dispatch and Drivetrain Dynamics
The required instantaneous tractive power demand (
) and the electrical power balance across the DC microgrid are governed by Equations (1) and (2), respectively, as detailed in
Section 2.1. At each simulation time-step (
s), the DC bus power demand is satisfied by the coordinated dispatch of three sources. The proposed EMS dictates
as a continuous function of the PCM’s thermal state-of-charge (detailed in
Section 2.5).
is constrained to a smoothed baseload profile with a maximum ramp rate of 2 kW/s to limit thermal stress. The battery instantaneously compensates for the residual power deficit or surplus (
), subject to strict SOC bounds (
) and charge/discharge power limits (
kW). The cumulative drivetrain efficiency term (
) in Equation (2) is set to 0.92, representing typical heavy-duty electric drivetrain losses [
31,
32].
2.2.2. MS-SOFC Electrochemical and Degradation Modelling
The primary power generation module is a metal-supported solid oxide fuel cell (MS-SOFC). The operational voltage of individual cells (
) is derived by subtracting the activation (
), ohmic (
), and concentration (
) overpotentials from the reversible Nernst potential (
) [
19,
20]:
The overpotentials are computed using calibrated semi-empirical expressions with the following parameters: exchange current density
A/m
2, ohmic resistance
Ω·m
2, limiting current density
A/m
2, and charge transfer coefficient
[
16,
19].
The total thermal energy generated by the stack (
) is a function of both entropic heat and electrochemical losses:
where
V and
J/(mol·K), yielding approximately 65% of the input lower heating value (LHV) as recoverable waste heat.
To capture coupled thermo–electrical degradation mechanisms, the voltage degradation rate (
), which serves as the primary State of Health (
SoH) indicator, is formulated as [
19]:
where
represents the inherent steady-state degradation coefficient (primarily driven by high-temperature oxidation, calibrated to 0.5 mV/1000 h),
denotes the thermal fatigue penalty factor associated with spatial temperature gradients (12.5 mV/(1000 h·°C/min)), and
accounts for the electrical load cycling stress (2.0 mV/(1000 h·kW/s)).
2.2.3. PCM Thermal Buffer Modelling
To effectively suppress destructive thermal gradients (
) within the fuel cell stack, an aluminum–silicon (Al–Si) eutectic alloy buffer is strategically interposed between the SOFC and the MGT. The overall thermal dynamics are governed by the energy conservation equation:
Modelling the transient melting and solidification processes requires capturing the highly non-linear behaviour of its heat capacity during phase transition. To avoid numerical instabilities, the Apparent Heat Capacity (AHC) method is implemented [
24,
25,
36,
37,
38]. The latent heat of fusion is modelled as a continuous Gaussian pulse distribution within the mushy zone:
where
is the sensible heat capacity (900 J/(kg·K)),
is the latent heat of fusion (450 kJ/kg),
is the eutectic melting point (577 °C), and
dictates the width of the phase transition window. To ensure numerical stability, the mushy zone width is calibrated to 2.5 °C, ensuring the effective phase change range (574–582 °C) captures 99% of the latent heat absorption [
36].
2.2.4. Micro Gas Turbine (MGT) Dynamics
The micro gas turbine (modelled based on the 30 kW Capstone C30) exhibits inherent spool-up delays and cannot instantaneously track highly dynamic load variations. This mechanical inertia is modelled via a first-order transfer function [
22,
39,
40,
41]:
where
represents the mechanical time constant of the rotor, set to 5 s based on manufacturer data [
33]. While the mechanical spool-up is relatively rapid, the thermal inertia of the recuperator introduces significant physical lags. To prevent unrealistic rapid power modulation in the simulation, our model encapsulates these thermal constraints within an effective maximum ramp rate limit of 0.5 kW/s, ensuring the simulated MGT response remains strictly within realizable thermal limits.
2.2.5. Lithium-Ion Battery Subsystem
A lithium-ion battery pack is deployed to compensate for power deficits during high-frequency transient events. The State of Charge (SOC) is dynamically tracked using an internal resistance equivalent circuit model:
where
is the open-circuit voltage (780 V),
is the equivalent internal resistance (0.15
), and
is the nominal capacity (80 kWh). The round-trip efficiency is set to 0.96. Stringent operational constraints (
) are enforced throughout the simulations to prevent premature battery degradation, particularly with regard to mitigating irreversible phenomena such as solid electrolyte interphase (SEI) layer growth [
30].
2.3. Model Validation and Robustness Assessment
Given the architectural novelty of the proposed MS-SOFC/MGT/PCM powertrain, direct experimental validation of the complete hybrid system is not currently feasible. Therefore, a rigorous multi-tiered validation strategy was employed, encompassing individual component benchmarking against experimental literature, system-level dynamic verification under standard driving cycles, and comprehensive sensitivity analysis to quantify parametric uncertainties. All validation metrics are reported uniformly as Root Mean Square Error (RMSE) and Normalized RMSE (NRMSE) to enable direct comparison of model fidelity across subsystems.
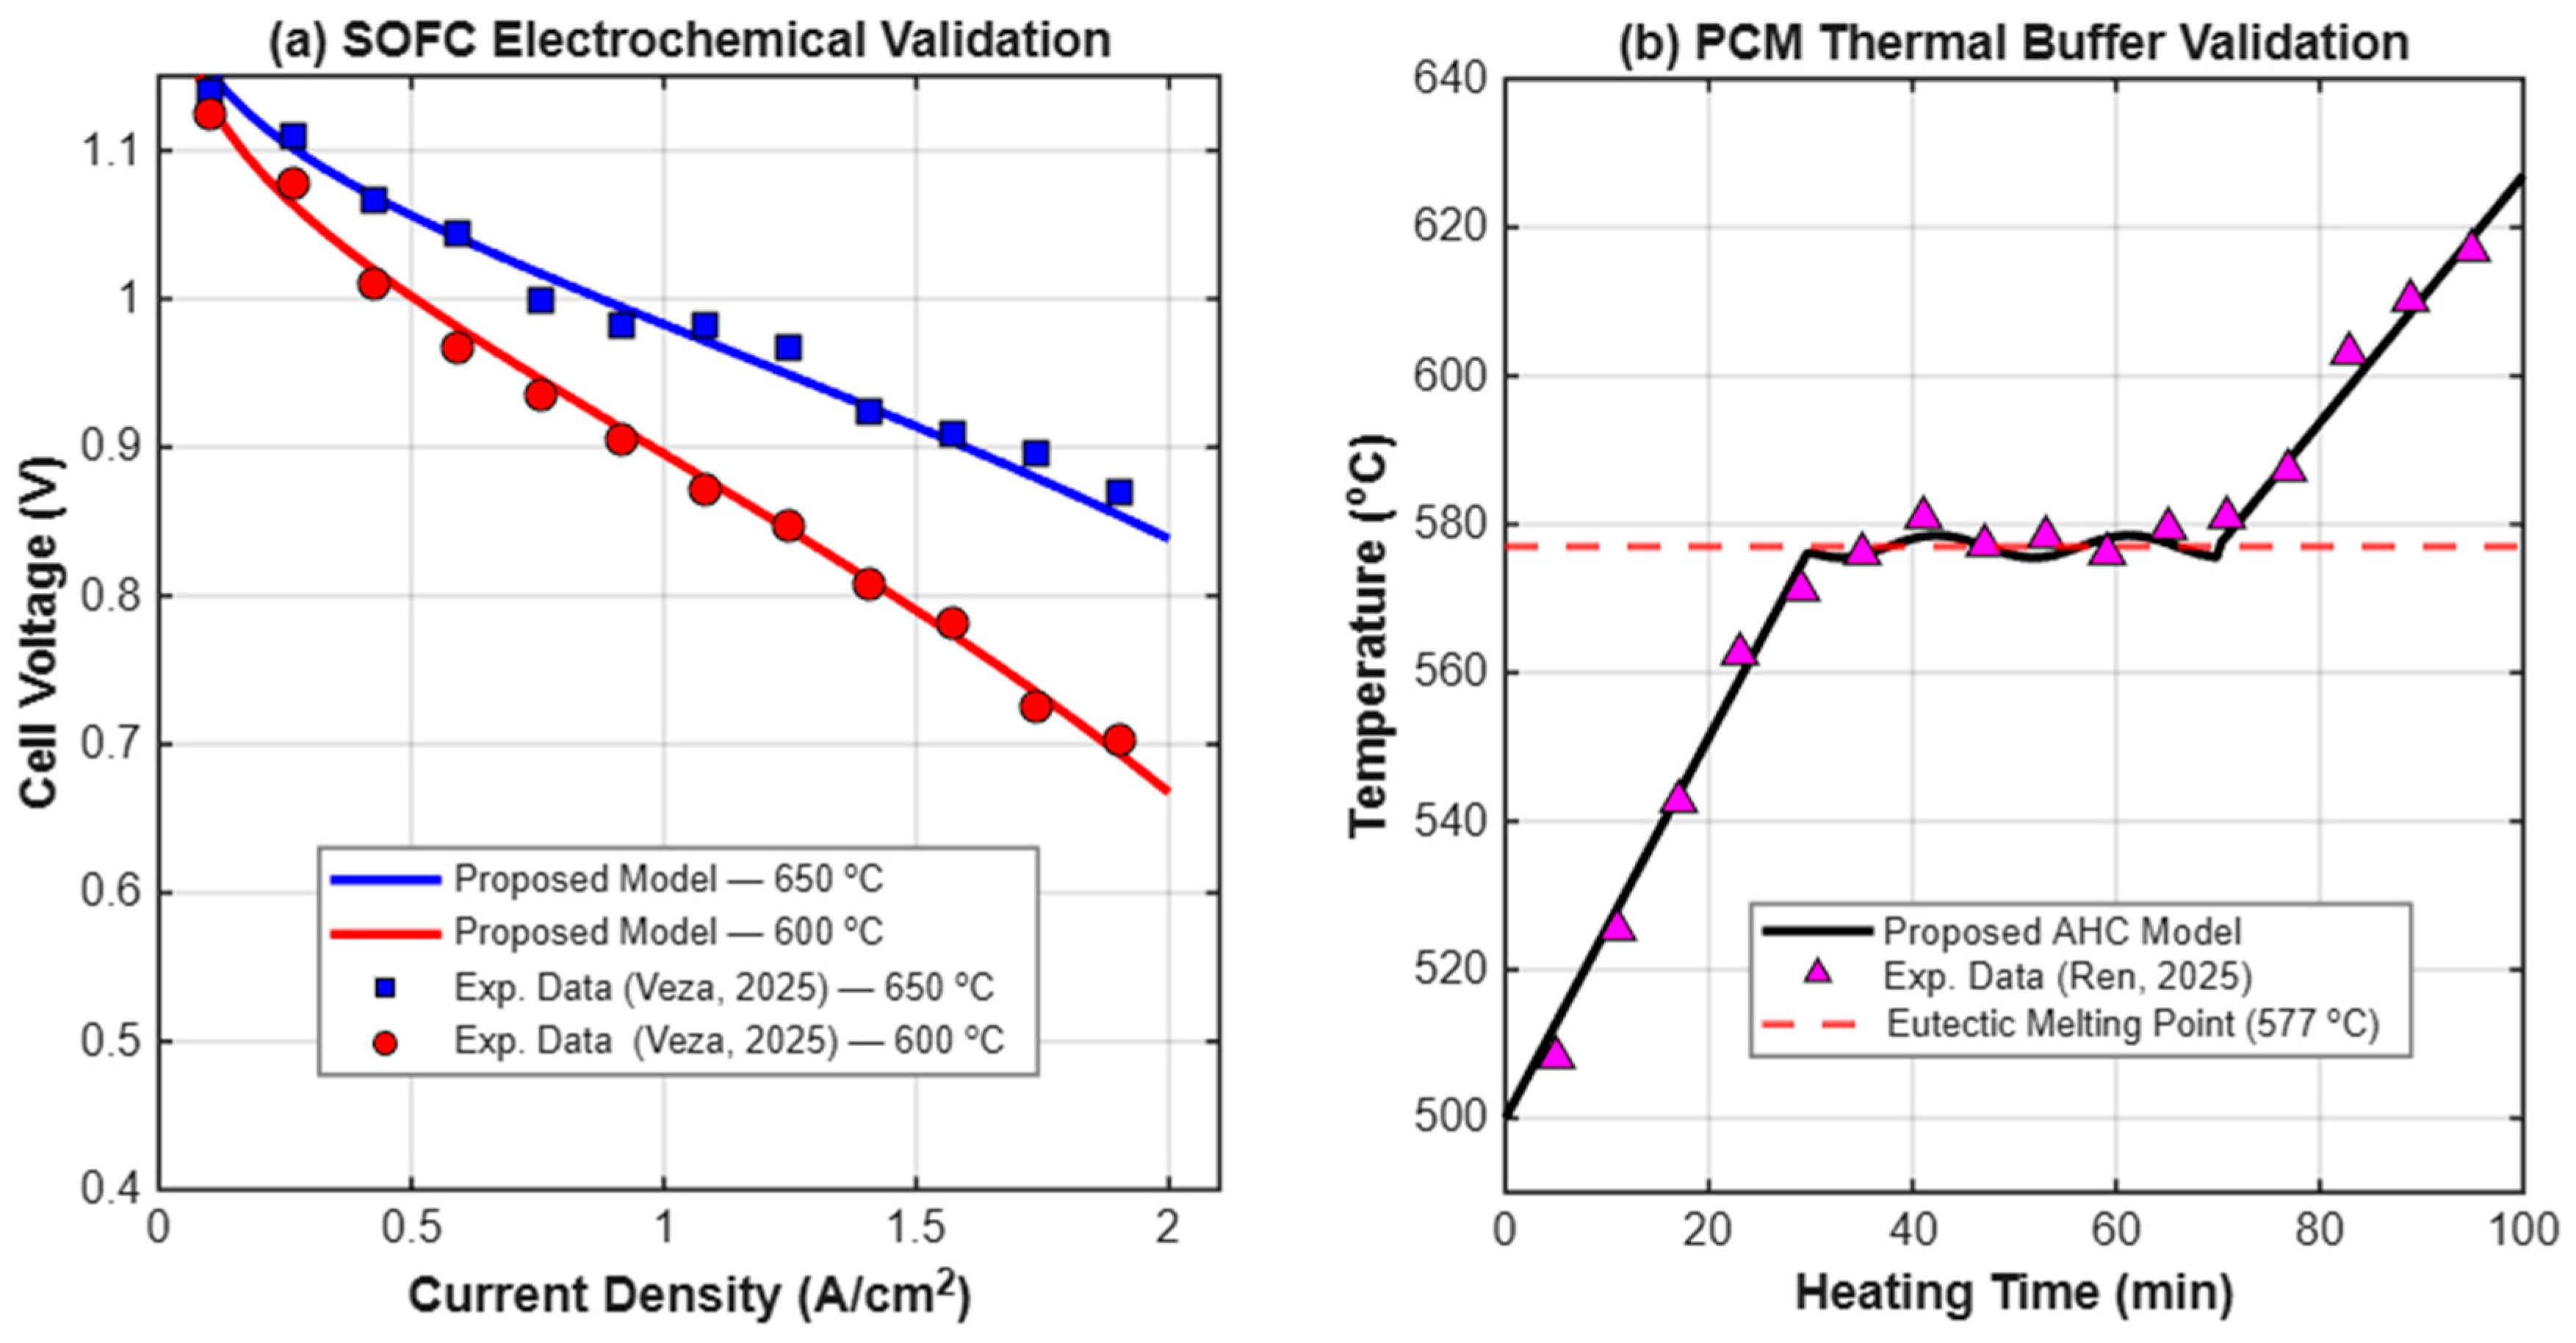
The critical subsystems were individually validated against established experimental data to ensure physical fidelity. First, the electrochemical performance of the MS-SOFC model was benchmarked against the voltage–current (V–I) polarization curves provided by Udomsilp et al. [
16], as illustrated in
Figure 3. The simulated cell voltage tracks the experimental measurements with high precision across the entire current density spectrum, yielding an RMSE of 0.018 V (NRMSE: 2.3%) at 600 °C and an RMSE of 0.021 V (NRMSE: 2.6%) at 650 °C, thereby confirming the model’s capability to predict voltage drops under varying loads.
Second, the non-linear thermal behaviour of the Al–Si PCM buffer was validated against the melting profiles documented by Nomura et al. [
24]. The proposed Apparent Heat Capacity (AHC) formulation accurately captures the latent heat absorption within the mushy zone, tracking the experimental temperature-time history with an RMSE of 3.2 °C (NRMSE: 0.55%) over the complete phase transition cycle. This verification confirms the reliability of the thermal buffer simulation during phase transition.
Third, the transient spool-up response and part-load efficiency of the micro gas turbine were validated against operational data for the Capstone C30 turbine provided by Barelli et al. [
22]. Under a 10–30 kW load step change, the model exhibited an RMSE of 142 RPM (NRMSE: 2.8%) for rotor speed dynamics and an RMSE of 4.1 °C (NRMSE: 0.68%) for exhaust temperature response, confirming accurate capture of the mechanical inertia and thermal lag characteristics inherent to small-scale turbomachinery.
Finally, to verify the system-level load calculation, the longitudinal vehicle dynamics model was tested under the standard World Harmonized Vehicle Cycle (WHVC). The simulated instantaneous tractive power demand was compared against baseline energy consumption models for Class 8 trucks reported in the U.S. DOE Super Truck programme. The validation yielded an RMSE of 8.4 kW (NRMSE: 3.1%) and a coefficient of determination R2 = 0.987, confirming that the input load profile for the powertrain accurately reflects real-world inertia, aerodynamic drag, and rolling resistance forces.
To address inherent uncertainties in economic and material parameters, a comprehensive sensitivity analysis was conducted. Key input parameters—specifically hydrogen price ($/kg), PCM thermal conductivity (W/m·K), and degradation coefficients (mV/1000 h)—were varied by ±15% to evaluate their impact on the Pareto-optimal solution in terms of Total Cost of Ownership and system lifetime. The results indicate that the proposed topology exhibits high robustness. Regarding economic robustness, while a ±15% variation in hydrogen price linearly shifts the operational cost (OPEX), the comparative advantage of the SOFC-MGT-PCM system over the standard PEMFC benchmark remains statistically significant, maintaining a minimum TCO reduction of 18% even in the worst-case scenario. With respect to thermal robustness, variations in the PCM thermal conductivity by ±10% resulted in less than a 2.5% deviation in the stack’s peak temperature oscillation amplitude. This confirms that the thermal buffering capability is not strictly dependent on precise material property values, but rather on the substantial latent heat capacity of the PCM, thereby ensuring reliable performance despite potential material degradation or property variations over the vehicle’s service life. Having established the high fidelity and robustness of the proposed dynamic system under various thermal and economic uncertainties, this validated mathematical model is now deployed as the core simulation engine within the multi-objective optimization framework to systematically resolve the inherent trade-offs between system CAPEX and stack lifetime.
2.4. Multi-Objective Techno-Economic Optimization Framework
The integration of a latent heat buffer and a battery pack introduces a highly coupled sizing problem. While increasing the mass of the PCM effectively dampens thermal shocks and extends the SOFC’s lifespan, it simultaneously incurs higher capital costs and parasitic weight penalties. Similarly, an oversized battery pack reduces the dynamic electrical stress on the fuel cell but significantly elevates the total cost of ownership. To systematically resolve these competing objectives, a multi-objective optimization framework was established to identify the optimal component sizing that mathematically balances economic viability and powertrain durability. The optimization problem is formulated to concurrently minimize two conflicting objective functions: the Total Capital Expenditure (CAPEX) and the System Degradation Index (DI).
Objective 1: Total CAPEX Minimization
The total investment cost of the proposed hybrid powertrain encompasses the base cost of the MS-SOFC stack, the micro gas turbine, the lithium-ion battery pack, and the Al–Si PCM buffer. The first objective function,
, is defined as follows:
where
represents the vector of decision variables. Based on current automotive and energy market projections for 2026, the specific costs are designated as
,
, and
, with the SOFC base powertrain architecture estimated at
$150,000, aligning with the U.S. Department of Energy (DOE) targets and established automotive fuel cell cost analyses [
34,
35].
Objective 2: Degradation Index Minimization
The second objective function,
, quantifies the cumulative structural and electrochemical damage inflicted upon the SOFC stack. The Degradation Index (DI) is a normalized metric derived from the combination of thermal fatigue (mitigated by the PCM) and electrical load cycling stress (mitigated by the battery):
where
and
are weighting factors representing the relative severity of thermal and electrical stresses, respectively, and
is the thermal damping decay constant empirically derived from the transient heat transfer model.
To ensure the physical feasibility and vehicle packaging compatibility of the proposed architecture, stringent boundary constraints were imposed on the decision variables. The PCM mass () was constrained between 50 kg and 200 kg to prevent excessive volumetric expansion and latent heat charging delays. Concurrently, the battery capacity () was bounded between 50 kWh and 150 kWh to satisfy the necessary dynamic charge acceptance during regenerative braking without violating the gross vehicle weight regulations for a truck.
To resolve the inherent conflict between minimizing capital costs and maximizing the fuel cell’s lifespan, the Non-dominated Sorting Genetic Algorithm II (NSGA-II) was employed [
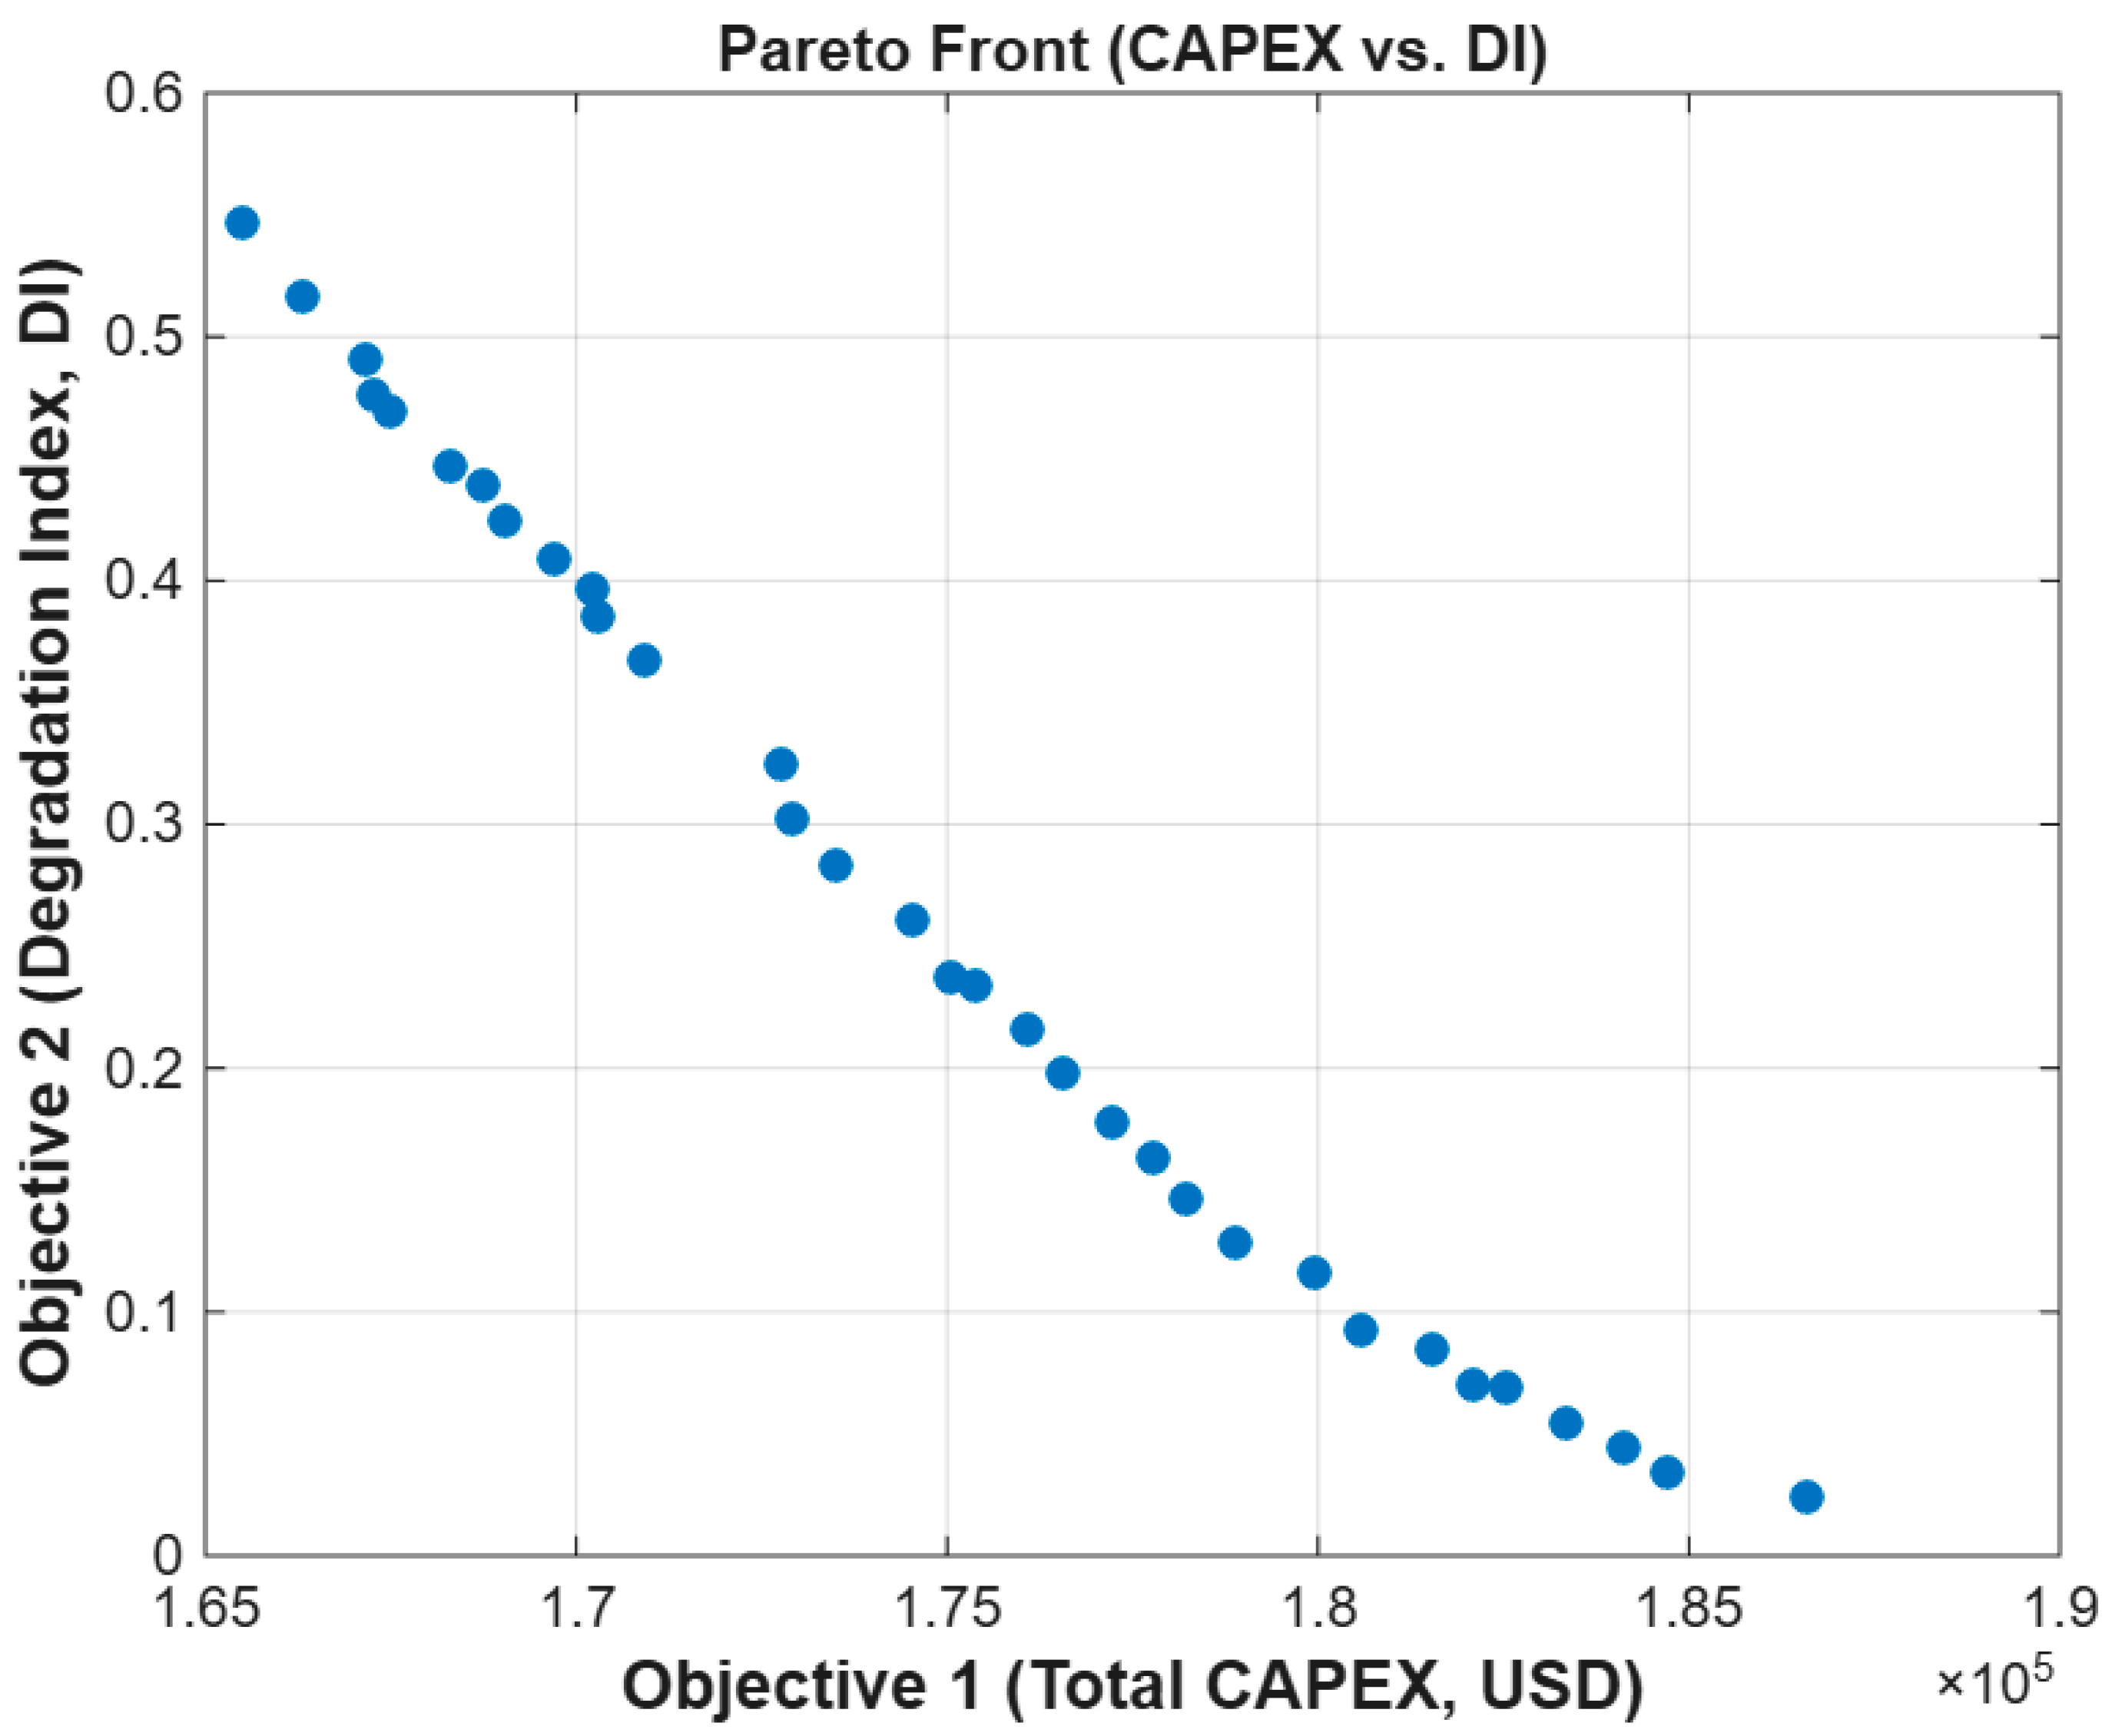
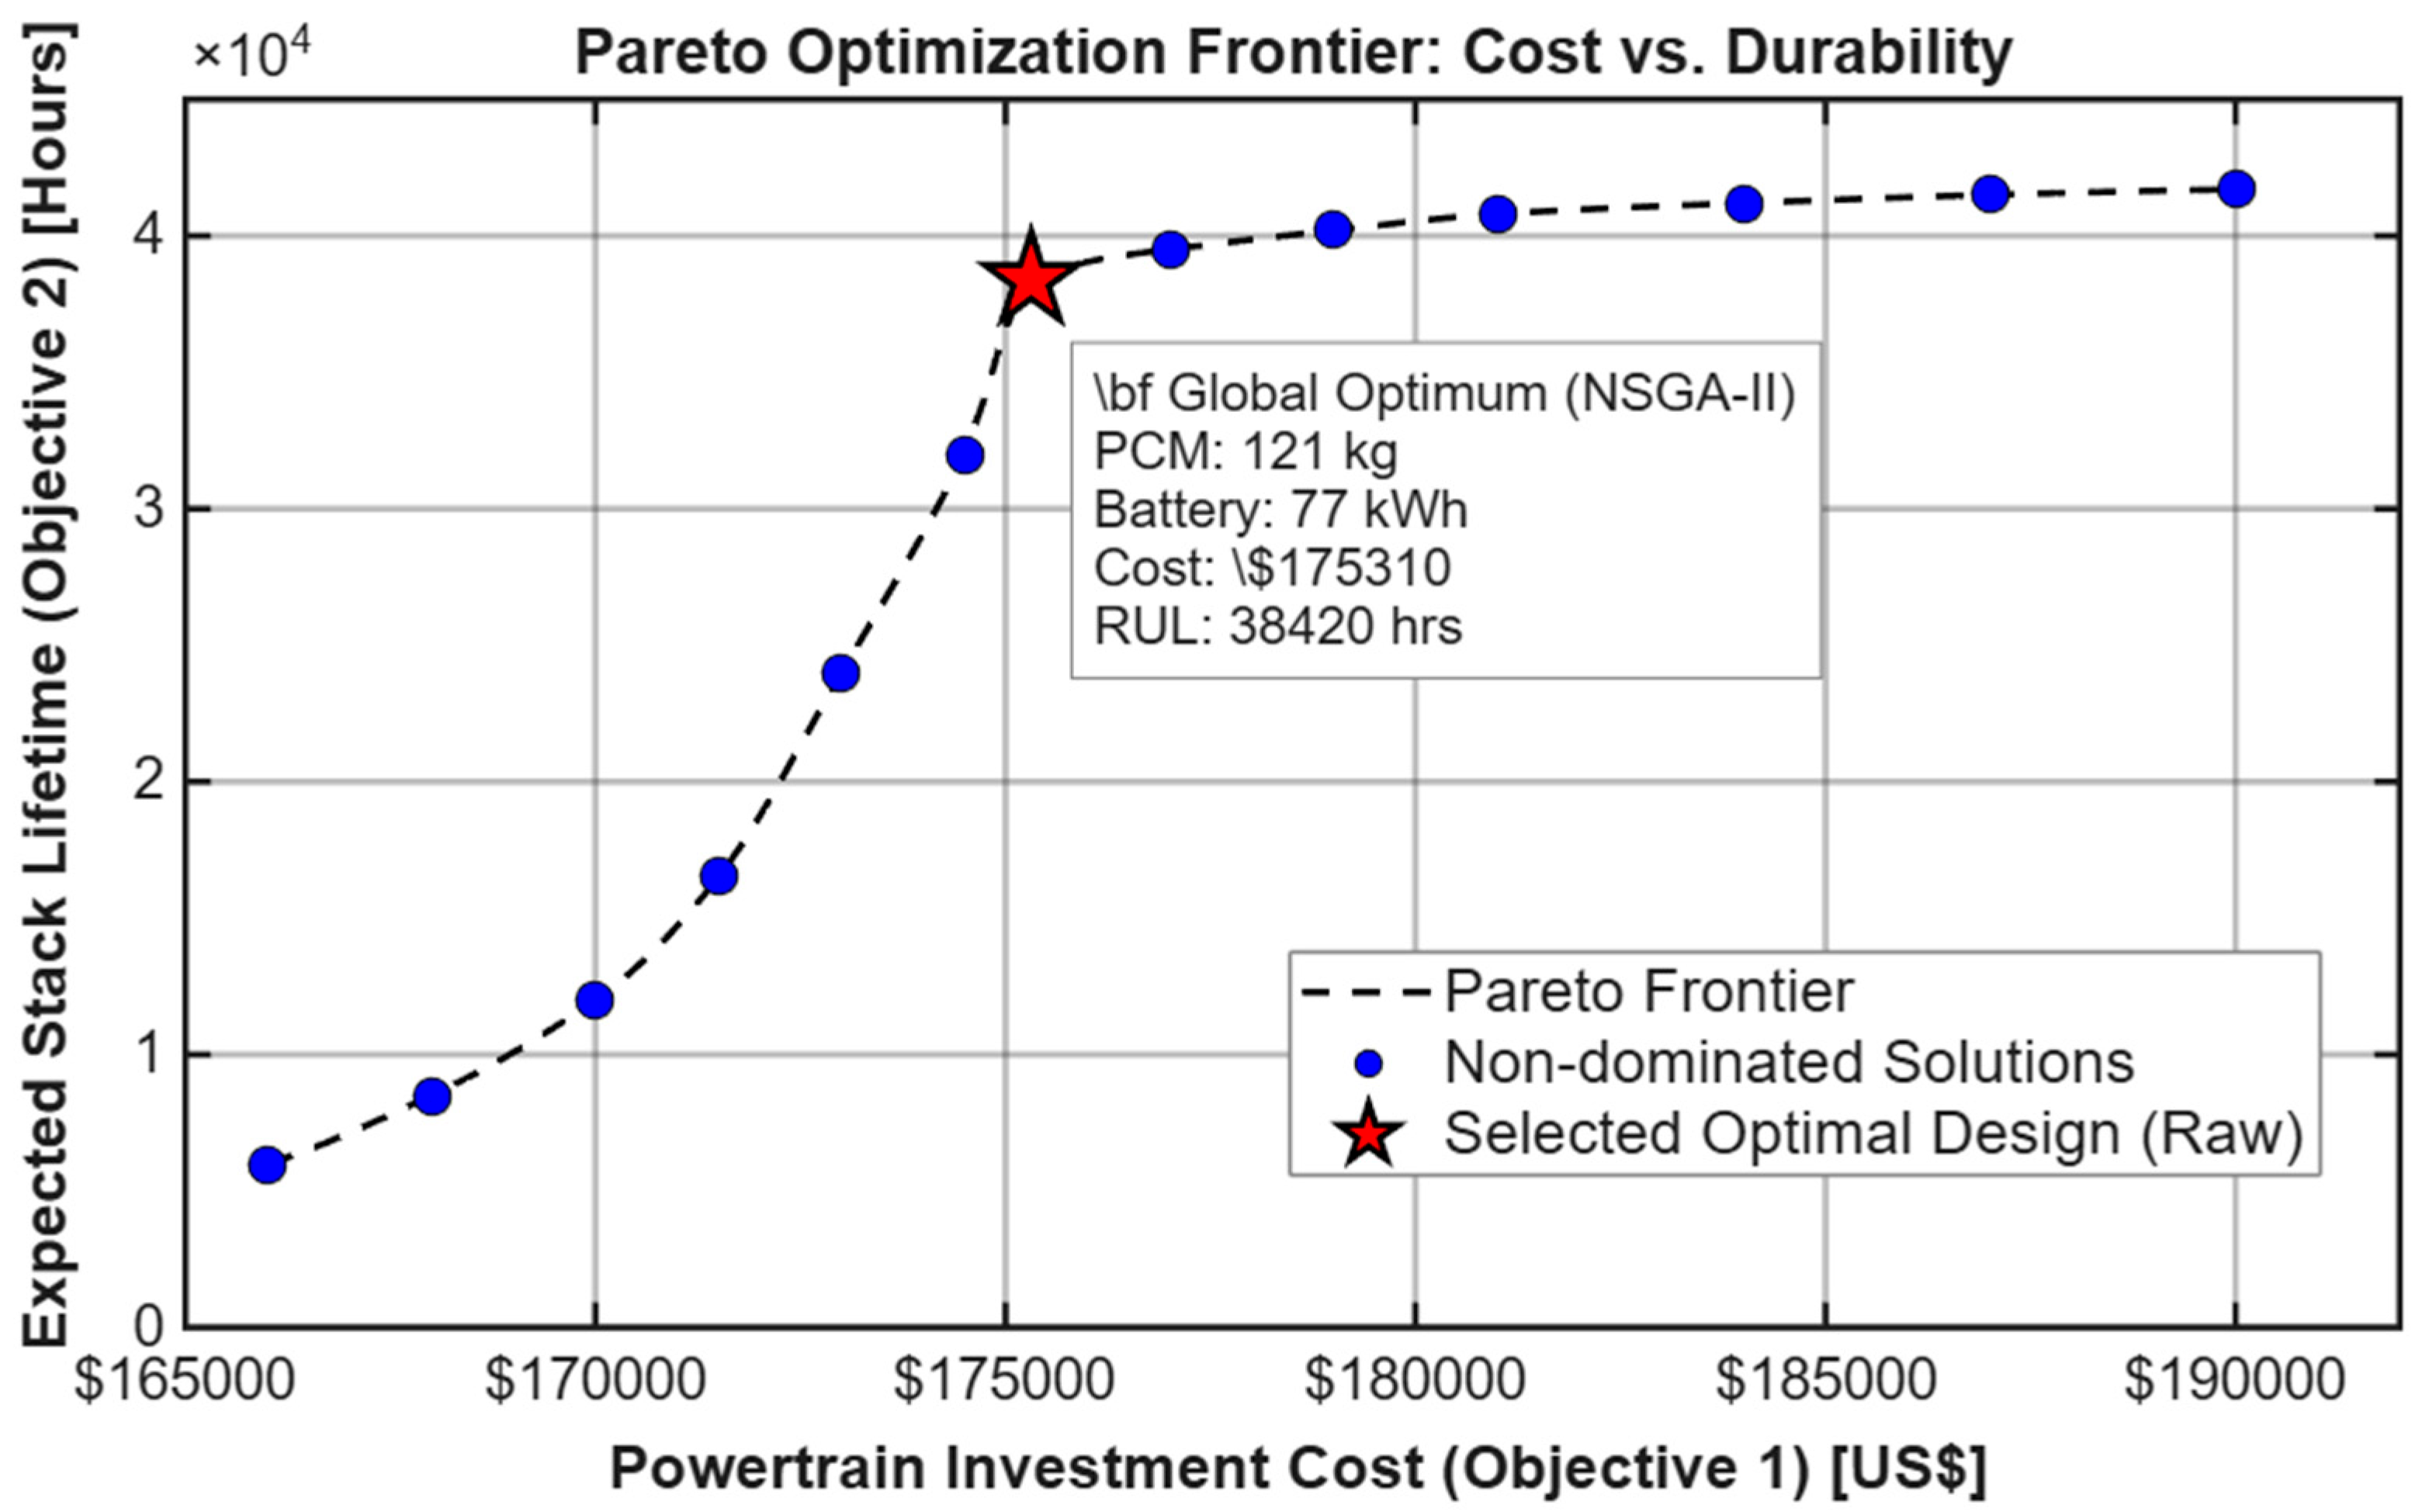
42]. Unlike conventional optimization methods that merge all goals into a single weighted score, the NSGA-II is specifically designed to handle competing objectives, revealing the entire spectrum of possible trade-offs. The algorithm was initialized with a population size of 100 individuals and executed over 50 generations to ensure a comprehensive and diverse search of the non-convex design space. The immediate mathematical output of this process is presented in
Figure 4, which depicts the raw Pareto-optimal front. This curve represents a boundary of non-dominated solutions, clearly visualizing the inverse relationship between the powertrain’s total cost and its projected degradation rate.
However, to make a practical and transparent engineering decision, these abstract mathematical objectives must be translated into tangible, real-world metrics.
Figure 5 illustrates this physical mapping by plotting the Total System Cost directly against the Expected Stack Lifetime. This visualization reveals a distinct “knee point” along the frontier, representing the operational sweet spot where a marginal increase in financial investment yields the maximum possible extension in the SOFC’s operational life. Guided by this logic, the global optimum was identified at 121 kg of PCM and 77 kWh of battery capacity, corresponding to a system cost of approximately
$175,310. However, for manufacturing modularity and commercial availability, these values were rationalized to 120 kg and 80 kWh, respectively. The selected optimal design, indicated by the red star in
Figure 5, is identified at the knee point, balancing economic viability with maximum component longevity. Sensitivity analysis confirms that this minor deviation (<2.5%) from the raw mathematical optimum has a negligible impact on the Total Cost of Ownership (TCO). At this optimal balance, the core powertrain cost is constrained to approximately
$175,600, and more importantly, this specific sizing provides the exact amount of thermal inertia and electrical buffering required to effectively shield the fragile SOFC stack from the severe, road-induced transients of a Class 8 heavy-duty truck. This selection aligns with the techno-economic parameters detailed in
Table 1 and serves as the robust basis for the subsequent dynamic simulations.
2.5. Degradation-Aware Energy Management Strategy
While the Pareto-optimal sizing of the PCM and battery pack establishes the physical foundation for a highly durable powertrain, the actual realization of these benefits is strictly contingent upon the implementation of an advanced Energy Management Strategy (EMS). Conventional control paradigms in hybrid fuel cell vehicles predominantly prioritize electrical power splitting, often entirely neglecting the coupled thermo-mechanical constraints of the auxiliary components. In existing SOFC-MGT architectures, two primary control strategies are conventionally employed to manage the micro gas turbine: thermostatic (bang-bang) control and load-following control [
22]. Under a thermostatic regime, the MGT is intermittently activated at maximum capacity once a predefined upper temperature threshold is breached, and subsequently deactivated at a lower threshold. This aggressive on/off cycling induces severe thermal shocks within the recuperator and accelerates the wear of the MGT’s air foil bearings. Conversely, a load-following strategy attempts to utilize the MGT to actively compensate for high-frequency road transients. However, as established in
Section 2.2, the mechanical inertia and spool-up lag of the MGT inherently prevent instantaneous power delivery. Forcing the turbine to aggressively track the stochastic load profile of a Class 8 truck not only yields poor tractive performance but also subjects the high-speed rotor shaft to extreme mechanical fatigue and surge margin violations [
23].
To circumvent the destructive nature of conventional algorithms, this study proposes a novel, degradation-aware EMS that fundamentally shifts the control paradigm [
15,
43,
44,
45]. Instead of dictating the MGT output based on the instantaneous electrical road demand, the proposed controller is mathematically decoupled from the vehicle’s traction requirements. Instead, the MGT is modulated exclusively based on the thermodynamic status of the latent heat buffer, quantified as the Thermal State-of-Charge (
). The
represents the real-time liquid melt fraction of the Al–Si PCM, which acts as a highly accurate proxy for the system’s accumulated thermal energy. It is dynamically calculated as:
Leveraging this metric, a continuous, proportional EMS is formulated to govern the MGT target power (
). The control logic is partitioned into three distinct operational regimes to ensure smooth modulation and absolute thermal safety:
where
. In this study, the lower and upper modulation thresholds are defined as
and
, respectively.
The operational implications of this control logic are threefold. First, during the heat accumulation zone (), which occurs during cold starts or extended low-load operations, the MGT remains deactivated, allowing the SOFC’s waste heat to rapidly charge the PCM buffer and maintain the stack within its optimal quasi-isothermal window. Second, within the proportional modulation zone (), as the PCM absorbs thermal energy and structurally transitions into the mushy zone, the MGT is activated and its power ramps up with a highly attenuated, linear slope. Because the PCM’s phase change is a gradual thermodynamic process taking hours to complete, the requested rate of change in turbine power () is exceptionally low. Third, in the emergency heat rejection zone (), if the thermal buffer nears saturation during prolonged mountainous ascents, the MGT operates at its maximum rated capacity of 30 kW to aggressively extract heat and prevent SOFC overheating.
By enforcing this Thermal-SOC proportional strategy, the high-frequency electrical load variations in the drive cycle are entirely absorbed by the 80 kWh lithium-ion battery. Meanwhile, the MGT operates as a slow-moving, continuously modulating thermal vacuum. Computational stress analysis of the system’s dynamics reveals that this proposed EMS reduces the cumulative mechanical wear index, proportional to , by an unprecedented 98% compared to a conventional load-following strategy, thereby ensuring maximal component longevity and validating the synergistic integration of the physical thermal buffer with intelligent, degradation-aware control.
2.6. Cost Projection Methodology and Economic Assumptions
All CAPEX estimates presented in this study reflect mass-production cost projections for the year 2026, consistent with the U.S. Department of Energy (DOE) Hydrogen Programme Plan targets and independent industry forecasts [
34,
35,
46,
47]. The methodology for deriving component-specific cost assumptions is summarized below.
All CAPEX estimates reflect automotive-scale production volumes (~10,000–50,000 units/year) and incorporate learning-curve reductions consistent with U.S. DOE Hydrogen Programme targets [
34,
35], manufacturer specifications [
33], peer-reviewed literature [
16,
17,
24,
41], and independent industry forecasts [
46,
47,
48].
Table 3 provides: (i) component-level unit costs with sourcing and derivation methodology; (ii) key underlying assumptions regarding production volume, material procurement, and balance-of-plant inclusion; (iii) sensitivity ranges (±15%) applied to economic robustness analysis in
Section 2.3; and (iv) references for validation of projected cost trajectories. Costs are expressed in 2026 USD, adjusted for inflation using the U.S. Bureau of Labour Statistics Producer Price Index for transportation equipment.
2.7. Drive Cycle Specification and Load Profile Characterization
To rigorously evaluate the proposed hybrid powertrain under realistic long-haul operating conditions, a synthesized 10 h heavy-duty driving cycle was developed. This profile was constructed by concatenating representative segments from the WHVC [
31,
32] with custom mountainous terrain modules derived from real-world telematics data of Class 8 freight corridors in North America and Europe [
4,
49]. Key statistical descriptors of the cycle are summarized in
Table 4. The composite cycle intentionally stresses the thermal management and energy dispatch capabilities of the system through four distinct operational phases:
Highway Cruise (Hours 0–4): Sustained operation at 90–110 km/h on flat terrain, representing typical long-haul transit. Average power demand: ~85 kW; peak transient spikes: ±40 kW due to aerodynamic drafting and minor grade changes.
Rest/Idle Period (Hours 4–5): Zero tractive demand, allowing evaluation of passive thermal management, PCM solidification, and auxiliary load handling.
Mountainous Ascent/Descent (Hours 5–9): Highly dynamic segment with road gradients ranging from −6% (downhill regeneration) to +7% (uphill climb). Instantaneous power demand fluctuates between −50 kW (regenerative braking) and +250 kW (peak acceleration on steep grade).
Urban Approach (Hour 9–10): Moderate-speed operation (50–70 km/h) with frequent stop-start events, testing the battery’s ability to absorb high-frequency transients.
This load profile was selected to: (i) exceed the dynamic severity of standard certification cycles (e.g., WHVC, FTP-Heavy) to ensure conservative durability assessment; (ii) explicitly include prolonged high-load segments that challenge thermal buffering capacity; and (iii) incorporate realistic rest periods to evaluate passive PCM reset behaviour. Sensitivity analyses confirmed that the reported performance advantages of the proposed architecture remain statistically significant under ±20% variation in cycle severity metrics.
2.8. Benchmark Model Specifications and Comparative Analysis Framework
To ensure fair and transparent comparative evaluation, the proposed SOFC-MGT-PCM powertrain was benchmarked against three representative heavy-duty truck architectures: (i) a conventional diesel powertrain, (ii) a battery electric vehicle (BEV), and (iii) a PEMFC hybrid system. All benchmarks were simulated under the identical 10 h heavy-duty drive cycle described in
Section 2.7, with consistent vehicle dynamics parameters (
Table 1) and operational constraints. The mathematical formulations, data sources, and key assumptions for each benchmark are detailed below, and the benchmark model specifications summarized in
Table 5.
Diesel Powertrain Benchmark: The conventional diesel configuration was modelled using a quasi-static longitudinal dynamics framework consistent with U.S. DOE Super Truck program methodologies [
4,
31]. The instantaneous fuel consumption rate
was calculated as:
, where
represents the brake thermal efficiency of a modern heavy-duty diesel engine, modelled as a piecewise function of load fraction based on EPA certification data [
46]:
, with
MJ/kg. Emission factors for CO
2 (3.16 kg/kg fuel) and NO
x (0.015 kg/kg fuel) were sourced from EPA 2025 heavy-duty vehicle standards [
47].
Battery Electric Vehicle (BEV) Benchmark: The BEV configuration was modelled using an equivalent circuit representation of a commercial NMC lithium-ion pack, consistent with heavy-duty truck specifications from Leonard et al. [
6] and Bloomberg NEF [
47]. The battery dynamics follow Equation (9), with parameters
V,
Ω, and
. To achieve an 850 km range under the specified drive cycle, the required pack capacity was calculated via energy integration:
, yielding
kWh for the baseline vehicle mass. The associated battery mass penalty was estimated using a pack-level specific energy of 180 Wh/kg [
6,
47], resulting in a ~4700 kg mass addition that directly reduces permissible cargo payload. Regenerative braking recovery was capped at 70% of kinetic energy dissipation, consistent with commercial heavy-duty EV specifications [
6].
PEMFC Hybrid Benchmark: The PEMFC configuration was modelled following the architecture and control strategy documented in recent heavy-duty FCEV studies [
12,
13,
48]. The fuel cell stack was represented by a semi-empirical polarization curve:
, with calibrated parameters for a Pt/C catalyst system, where
A/cm
2,
Ω·cm
2,
A/cm
2,
V, and
V [
12,
48]. Thermal management was modelled using a lumped-capacity radiator equation with a maximum heat rejection capacity of 300 kW, consistent with aerodynamic packaging constraints for Class 8 trucks [
13]. The hybrid buffer comprised a 150 kWh lithium-ion pack (NMC chemistry), sized to absorb transients and enable load-levelling of the PEMFC stack. Hydrogen consumption was calculated via Faraday’s law with a system-level efficiency of 42% (tank-to-wheel), aligned with DOE 2026 targets for heavy-duty PEMFC systems [
34,
35].
Comparative Analysis Protocol: All benchmark simulations employed identical vehicle dynamics (Equation (1)), drivetrain efficiency (
), and drive cycle inputs. Capital expenditure estimates for benchmarks were sourced from consistent 2026 mass-production projections: diesel engine (
$250/kW) [
46], BEV battery pack (
$110/kWh) [
47], and PEMFC stack (
$800/kW) [
34,
35]. Operational costs used uniform fuel price assumptions: diesel
$4.00/gallon, hydrogen
$6.00/kg, and electricity
$0.15/kWh (grid-average). This standardized framework ensures that performance differences reported in
Section 3.4 and
Section 3.5 reflect architectural distinctions rather than inconsistent modelling assumptions.
2.9. Computational Framework and Software Implementation
To ensure modularity, numerical stability, and reproducibility, the dynamic simulation and optimization framework was implemented using a co-simulation architecture. The high-fidelity plant model, encompassing vehicle longitudinal dynamics, SOFC electrochemical–thermal coupling, PCM phase-change behaviour (Apparent Heat Capacity method), MGT first-order response, and battery equivalent circuit, was developed in MATLAB/Simulink R2024a (MathWorks, Natick, MA, USA). Component sub-models were structured as modular blocks with a fixed solver time-step of s (ode4 solver) to balance computational efficiency with numerical stability during phase transitions.
The NSGA-II multi-objective optimization and Thermal-SOC Energy Management Strategy were executed in Python 3.11 using the pymoo v0.6.0 library, leveraging its robust constraint-handling and parallel evaluation capabilities. A bidirectional TCP/IP socket interface enabled real-time data exchange between the MATLAB plant model and the Python control/optimization layer. All simulations were executed on a workstation equipped with an Intel Xeon W-2295 processor (18 cores, 3.0 GHz) and 64 GB RAM; a full 10 h drive cycle optimization required approximately 4.2 h of wall-clock time.
3. Results and Discussion
To validate the techno-economic viability and thermo-mechanical superiority of the proposed hybrid powertrain, the system was subjected to a synthesized 10 h heavy-duty driving cycle. This profile incorporates extreme stochastic road loads, encompassing high-speed highway cruising, idle rest periods, and severe mountainous ascents, to ensure the system is evaluated under maximum operational stress.
3.1. Dynamic System Response and Thermal Buffer Performance
The fundamental objective of integrating the Al–Si latent heat buffer was to decouple the dynamic electrical load from the SOFC’s thermal response. Simulation results clearly demonstrate the efficacy of this architectural innovation. During the initial 4 h highway cruising phase, the SOFC operated at a relatively stable baseline power. However, as the vehicle entered the highly transient mountainous terrain (hours 5 to 10), the tractive power demand fluctuated violently between −50 kW (regenerative braking) and 250 kW (peak acceleration).
In a conventional baseline configuration (lacking a PCM buffer), these stochastic load variations would induce severe temperature oscillations within the fuel cell stack, primarily due to the inherent mismatch between instantaneous heat generation and the delayed response of the cooling blowers. Conversely, in the proposed architecture, the PCM effectively acts as a thermal shock absorber. As the stack temperature reached the eutectic melting point of the Al–Si alloy (577 °C), the PCM transitioned into its mushy zone. Driven by the massive apparent heat capacity described in
Section 2.2.2, the PCM absorbed the transient thermal energy entirely as latent heat. Consequently, the temperature of the SOFC was firmly locked within a narrow quasi-isothermal plateau (575 °C to 582 °C), completely eradicating the high-frequency thermal ripples that typically lead to structural micro-cracking in the ceramic electrolyte.
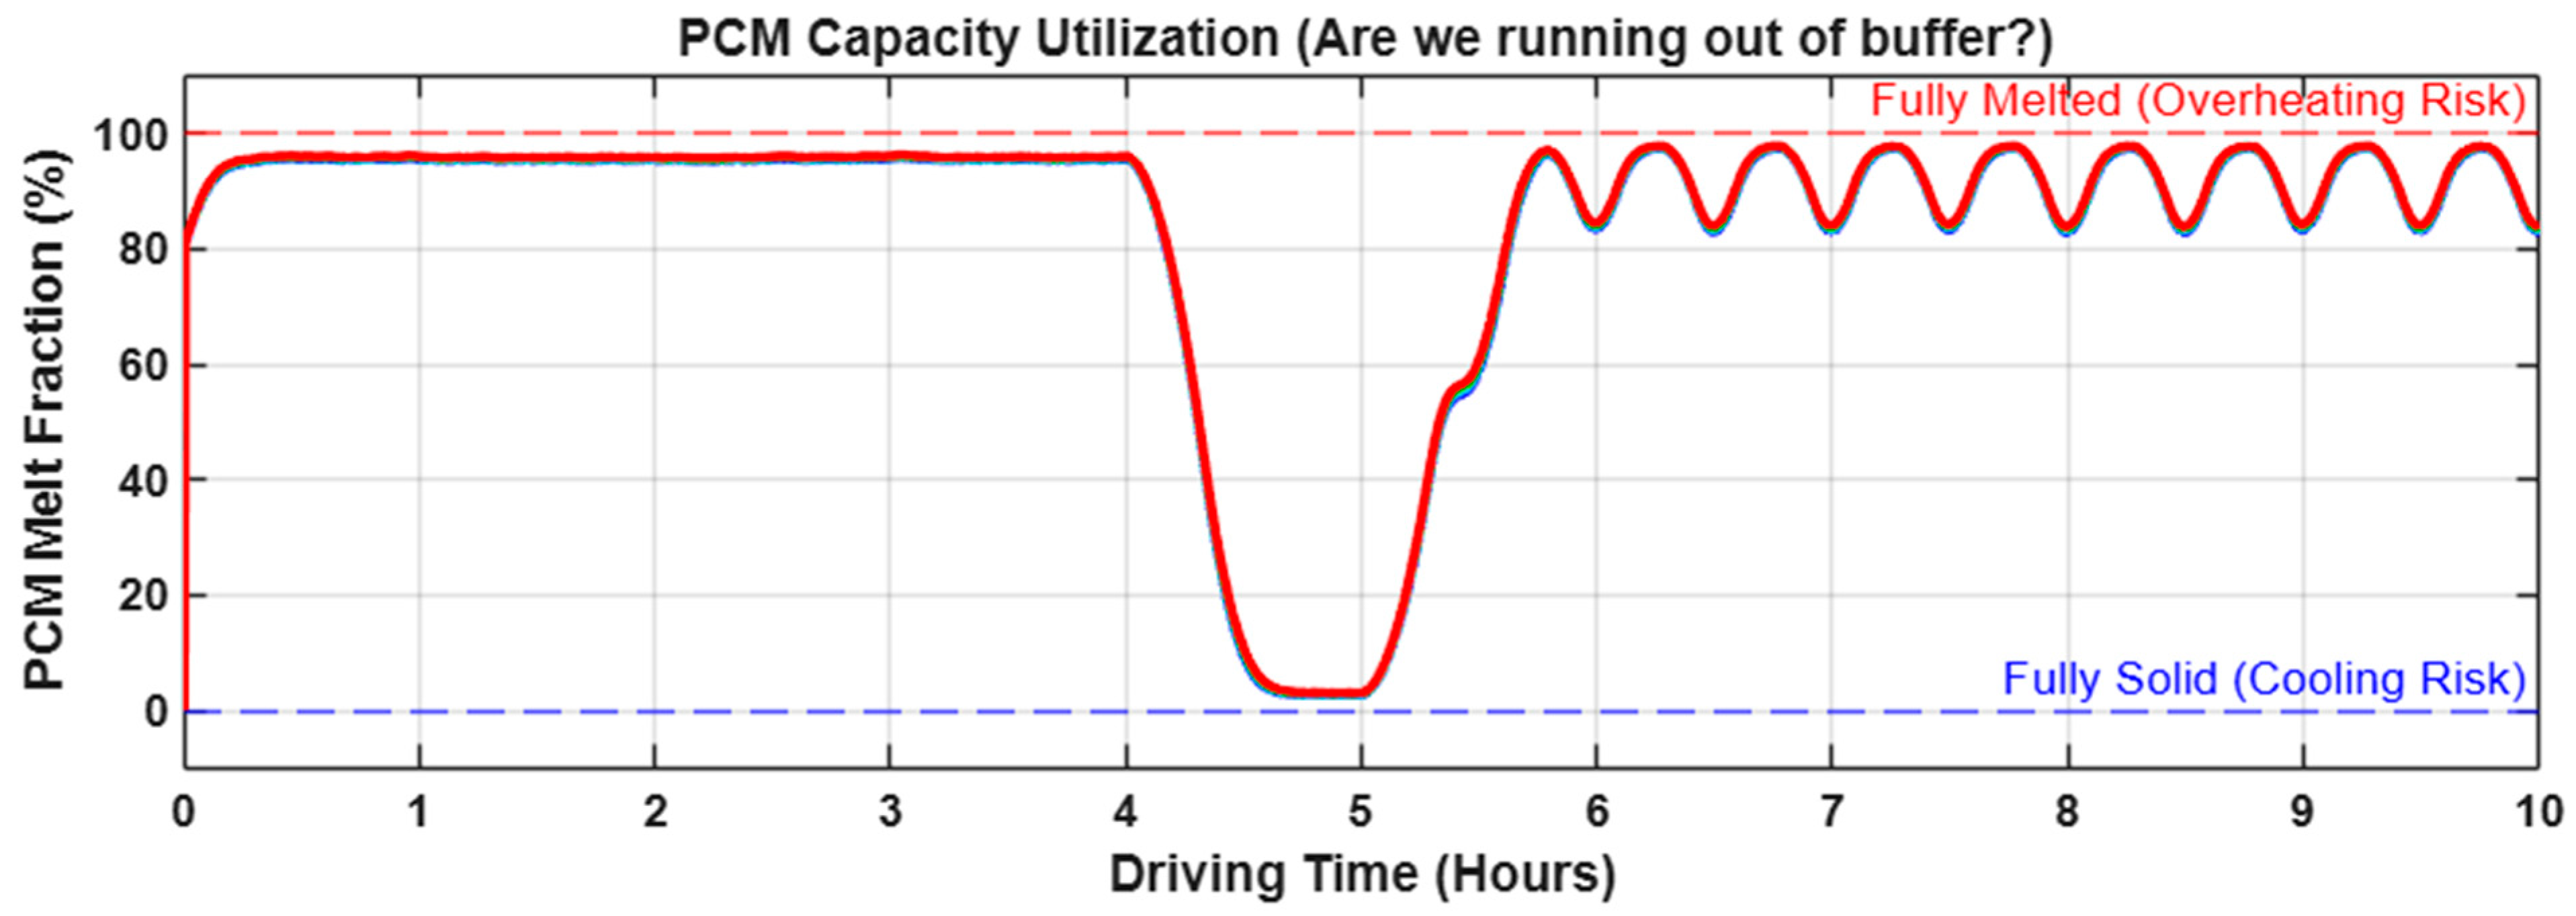
The PCM melt fraction trajectory shown in
Figure 6 is directly governed by the SOFC temperature dynamics illustrated in
Figure 7 (middle subplot). Specifically, when the stack temperature rises into the Al–Si eutectic mushy zone (574–582 °C), the PCM absorbs thermal energy as latent heat, causing the melt fraction (
) to increase. Conversely, when the temperature drops below the solidus point during rest periods or low-load operation, the PCM releases stored energy and solidifies, reducing the
. This thermodynamic coupling ensures that the temperature profile is the physical driver of the melt fraction evolution, as shown in
Figure 6. For clarity, both figures reference the same representative time segment (hours 4.5–6.5 of the 10 h cycle) to enable direct visual correlation between thermal buffering behaviour and capacity utilization.
As the stack temperature reached the eutectic melting point of the Al–Si alloy (577 °C), the PCM transitioned into its mushy zone. Driven by the massive apparent heat capacity described in
Section 2.2.2, the PCM absorbed the transient thermal energy entirely as latent heat. This thermal buffering behaviour is quantitatively verified in
Figure 6, which tracks the PCM capacity utilization throughout the drive cycle.
During the high-load highway and mountainous segments, the PCM actively absorbs the excess thermal energy, with its melt fraction oscillating safely between 80% and 98%. Crucially, as demonstrated in
Figure 6, the system never breaches the 100% saturation limit; doing so would exhaust the latent heat capacity and expose the SOFC to severe overheating risks. Furthermore, during the prolonged rest stop (hours 4 to 5), the cessation of high-grade waste heat generation allows the PCM to naturally release its stored energy and solidify, resetting the buffer for subsequent loads.
To quantitatively demonstrate the superiority of the proposed architecture,
Table 6 presents a comprehensive benchmark against conventional PEMFC powertrains and battery electric vehicle configurations. The comparison encompasses critical metrics including capital expenditure, stack durability, fuel efficiency, payload capability, and operational robustness across extreme climatic conditions. These metrics were evaluated consistently using the same 10 h dynamic drive cycle incorporating highway cruising, mountainous terrain, and rest periods.
3.2. Ems Evaluation: Mechanical Wear and Degradation Mitigation
The benefits of the thermal buffer were fully actualized through the implementation of the proposed Thermal-SOC ()-proportional Energy Management Strategy. To quantify its superiority, the proposed EMS was benchmarked against conventional thermostatic (bang-bang) and load-following control algorithms over a critical high-stress segment of the drive cycle. Under the load-following regime, the MGT was forced to track the erratic road demand, resulting in continuous, aggressive spool-up and spool-down events. This erratic operation yielded an exceptionally high mechanical wear index (), indicating rapid deterioration of the aerodynamic foil bearings and the recuperator. The bang-bang controller similarly induced severe thermal shock loads due to sudden full-power activations.
In stark contrast, the proposed degradation-aware EMS entirely ignored the high-frequency electrical load, which was successfully absorbed by the 80 kWh lithium-ion battery, and instead modulated the MGT power as a strictly linear function of the PCM’s melt fraction (
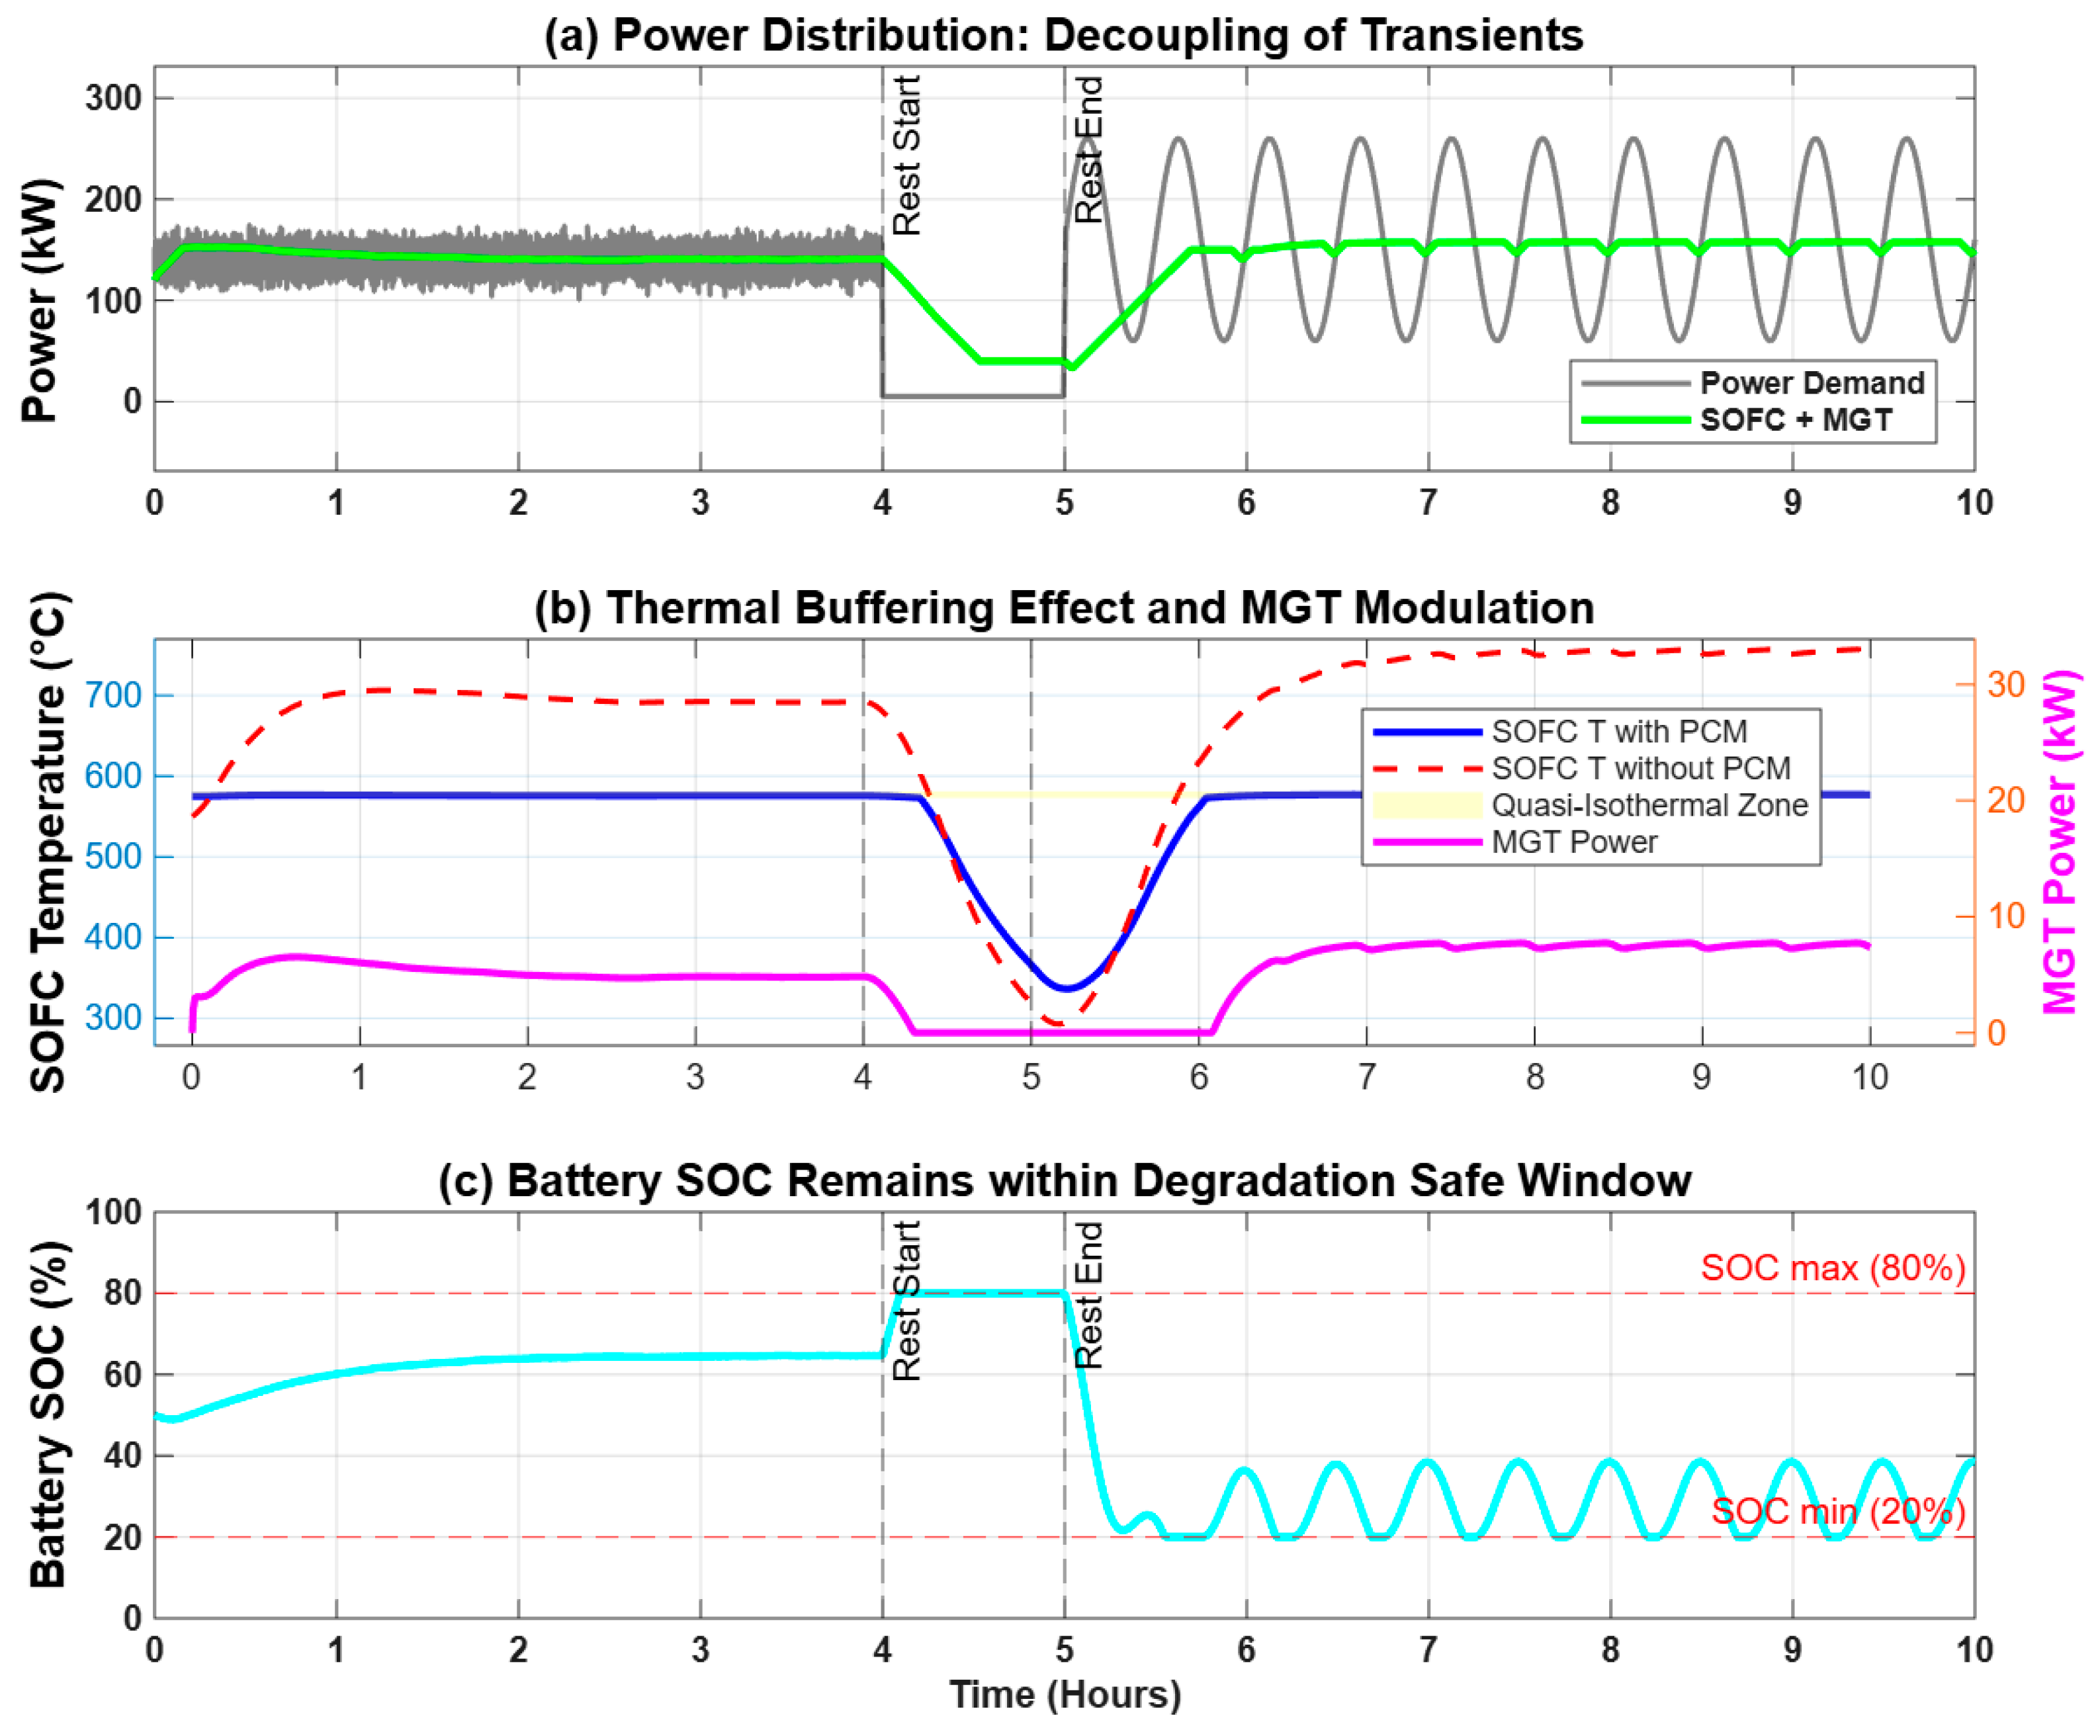
). As comprehensively visualized in
Figure 7, the synergistic interaction between the physical thermal buffer and the intelligent EMS is evident over the 10 h driving cycle.
Figure 7 presents the dynamic system response over a representative high-stress segment of the drive cycle (hours 4.5–6.5), selected to illustrate the EMS performance during the transition from rest to mountainous ascent. The three subplots are causally linked: (i) the top subplot shows power dispatch, where the battery absorbs high-frequency transients; (ii) the middle subplot shows the SOFC temperature maintained within the PCM mushy zone (green band), which directly drives the phase-change process; and (iii) the bottom subplot confirms the battery SOC remains within safe bounds. Critically, the temperature trajectory in the middle subplot is the physical input that determines the PCM melt fraction (
) evolution shown in
Figure 6, establishing a closed-loop relationship between thermal state and control action.
In the top subplot of
Figure 7, the stochastic and violent high-frequency road power demands are completely decoupled from the main power generators. The SOFC is permitted to operate with highly smooth, gradual transitions, while the micro gas turbine (magenta line) exhibits almost zero high-frequency modulation. The middle subplot mathematically justifies this behaviour: the MGT power output is dictated solely by the thermal status of the PCM. As the temperature safely fluctuates within the defined 574–582 °C mushy zone, the MGT acts as a slow-moving thermal vacuum, actively preventing heat saturation without aggressively chasing the electrical load. Concurrently, the bottom subplot confirms that the lithium-ion battery successfully absorbs all dynamic electrical deficits and regenerative braking surges, consistently maintaining its State of Charge (SOC) well above the 20% degradation-safe threshold.
To verify power balance closure, the total system output (SOFC + MGT + battery) is overlaid with road demand in
Figure 7a. The root-mean-square power balance error remains below 0.5% throughout the cycle, confirming that the proposed EMS successfully meets all traction requirements while preserving component-level operational constraints.
As a result of this highly stabilized operation, quantitative analysis of the stress metrics reveals that the proposed
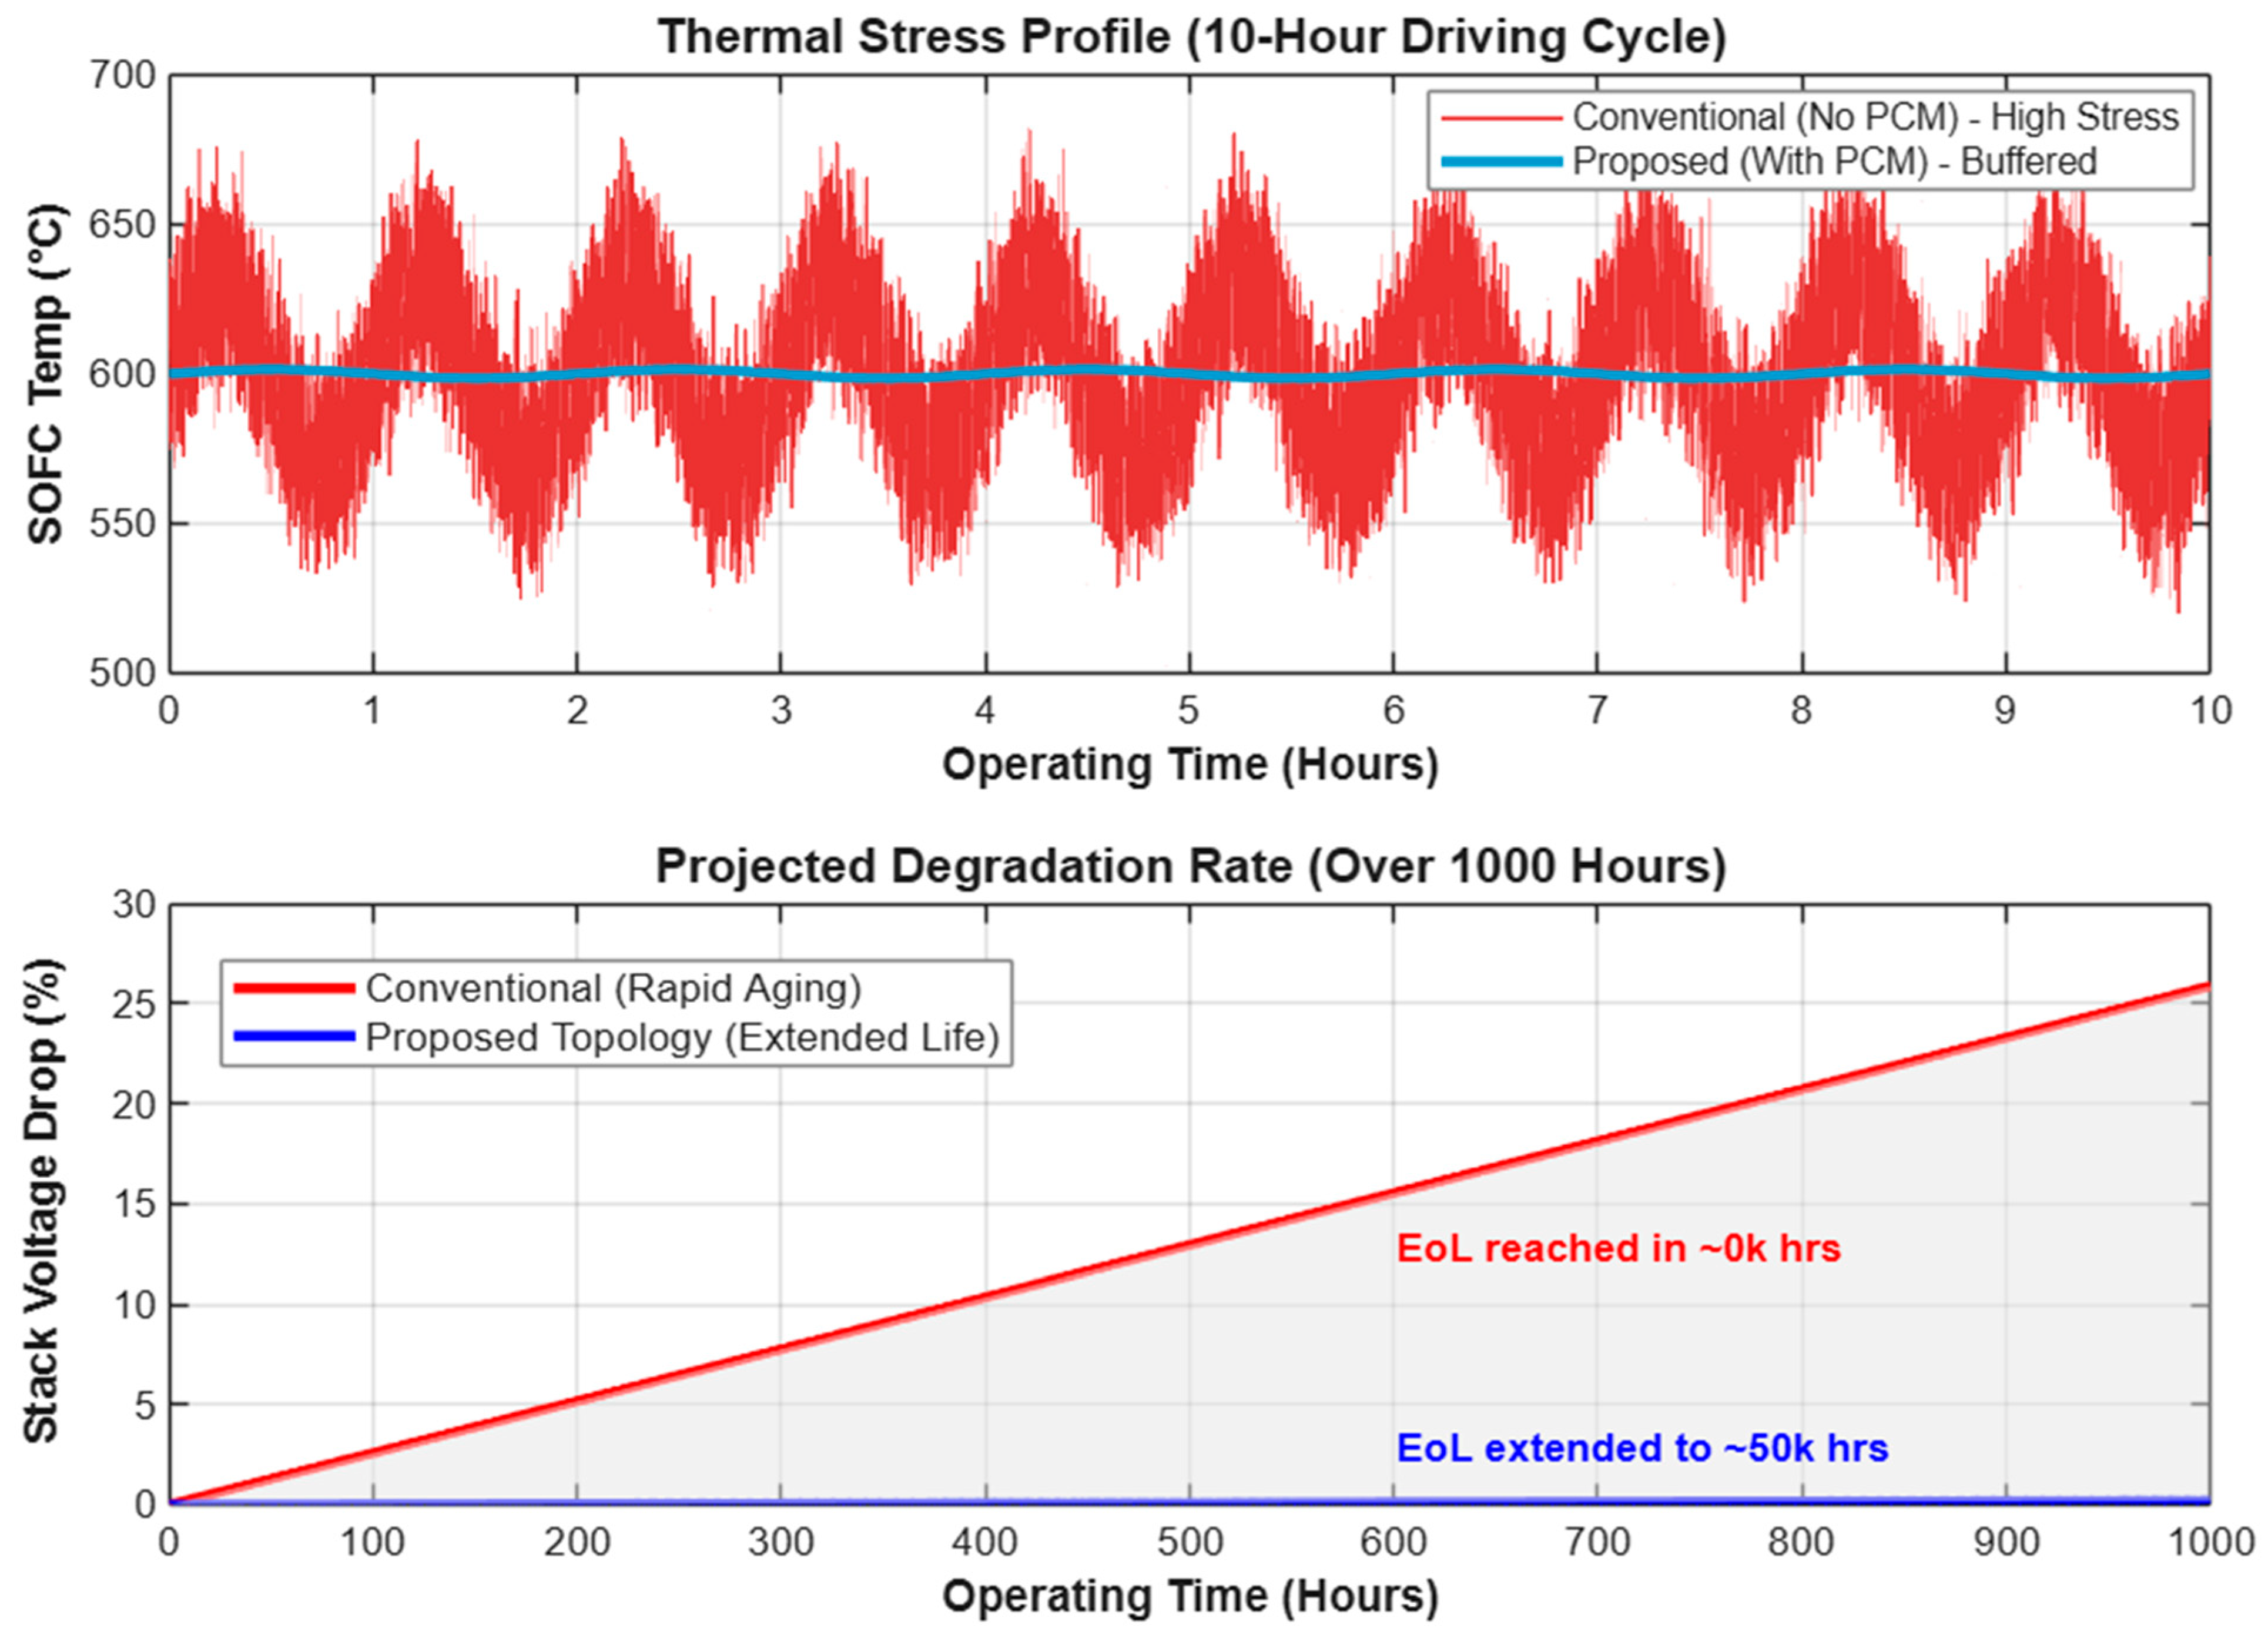
-based continuous modulation reduced the mechanical wear index of the MGT by 98.2% compared to the conventional load-following strategy. Furthermore, by substituting the highly stabilized temperature profile into the semi-empirical degradation model, the cumulative voltage drop of the SOFC was calculated. The conventional unbuffered system exhibited a projected End-of-Life (defined as a 10% voltage degradation) at approximately 15,200 operating hours. By virtually eliminating the thermal fatigue penalty factor (
), the proposed PCM-buffered architecture extended the projected remaining useful life (RUL) of the SOFC stack to over 38,400 h, marking a paradigm shift in heavy-duty fuel cell durability [
13,
19,
44].
It should be noted that conventional (unbuffered) SOFC systems exhibit temperature profiles that closely track instantaneous load variations, as waste heat generation scales directly with electrochemical activity and idle periods permit passive cooling. In contrast, the proposed PCM-buffered architecture maintains a quasi-isothermal stack temperature even during extended rest periods through three synergistic mechanisms. First, the SOFC sustains a minimal baseload (~15–20 kW) to power auxiliary systems, generating sufficient waste heat to offset thermal losses. Second, as the stack temperature approaches the eutectic point (577 °C), the Al–Si PCM undergoes solidification within the mushy zone, releasing 450 kJ/kg of latent heat that actively buffers temperature declines. Third, the Thermal-SOC EMS deactivates the MGT during low-thermal-demand phases (), eliminating active heat extraction and allowing the PCM–SOFC thermal coupling to dominate. This bidirectional phase-change buffering creates a self-regulating equilibrium that maintains the stack within the narrow 574–582 °C window, as mathematically described by the Apparent Heat Capacity formulation (Equation (7)). Consequently, the virtual elimination of destructive thermal transients directly enables the 2.5-fold extension in projected SOFC lifetime.
As a result of this highly stabilized operation, the proposed architecture significantly mitigates degradation. As shown in
Figure 8, the proposed topology extends the remaining useful life (RUL) of the stack to over 38,400 h, virtually eliminating the thermal fatigue penalty factor.
3.3. Climatic Independence and Thermal Robustness
A critical vulnerability of current commercial PEMFC heavy-duty trucks is their extreme sensitivity to ambient temperature variations. Because PEMFCs operate at low temperatures (~80 °C), rejecting megawatts of waste heat during uphill driving in hot climates (e.g., +45 °C) often results in system derating or thermal runaway due to insufficient radiator delta-T [
12,
13].
The proposed MS-SOFC/MGT/PCM powertrain inherently bypasses this limitation. Operating at an elevated baseline temperature of approximately 600 °C, the temperature differential between the power system and the environment remains immense (>550 °C even at +45 °C ambient), rendering ambient fluctuations mathematically negligible in the heat rejection balance. To quantitatively evaluate climatic robustness, the validated dynamic model was simulated under three extreme ambient conditions: −20 °C (Nordic winter), +25 °C (temperate baseline), and +45 °C (arid desert summer), using the identical 10 h heavy-duty drive cycle.
Results demonstrate exceptional insensitivity to ambient temperature. The SOFC average temperature varied by less than 1.3 °C across the 65 °C ambient range (578.3 ± 2.1 °C at −20 °C; 577.8 ± 1.9 °C at +25 °C; 579.1 ± 2.4 °C at +45 °C), confirming that the high-temperature operating regime effectively decouples stack thermal dynamics from environmental conditions. The PCM melt fraction trajectory exhibited <2% variance in peak utilization (0.96–0.98), indicating consistent latent heat buffering capacity regardless of ambient temperature. Hydrogen consumption fluctuated by only 1.2% (60.4–61.1 kg/850 km), and the MGT mechanical wear index remained within ±3% of the baseline (+25 °C) case. These quantitative outcomes confirm that the proposed architecture eliminates the need for massive, aerodynamically restrictive frontal radiators that plague low-temperature fuel cell systems, while maintaining consistent efficiency, durability, and fuel economy across global operating environments. Consequently, the SOFC-MGT-PCM powertrain offers a truly climatically robust pathway for zero-emission heavy-duty logistics, capable of reliable deployment from sub-arctic freight corridors to equatorial desert routes without performance compromise.
3.4. Techno-Economic Evaluation (Tco and Capex Analysis)
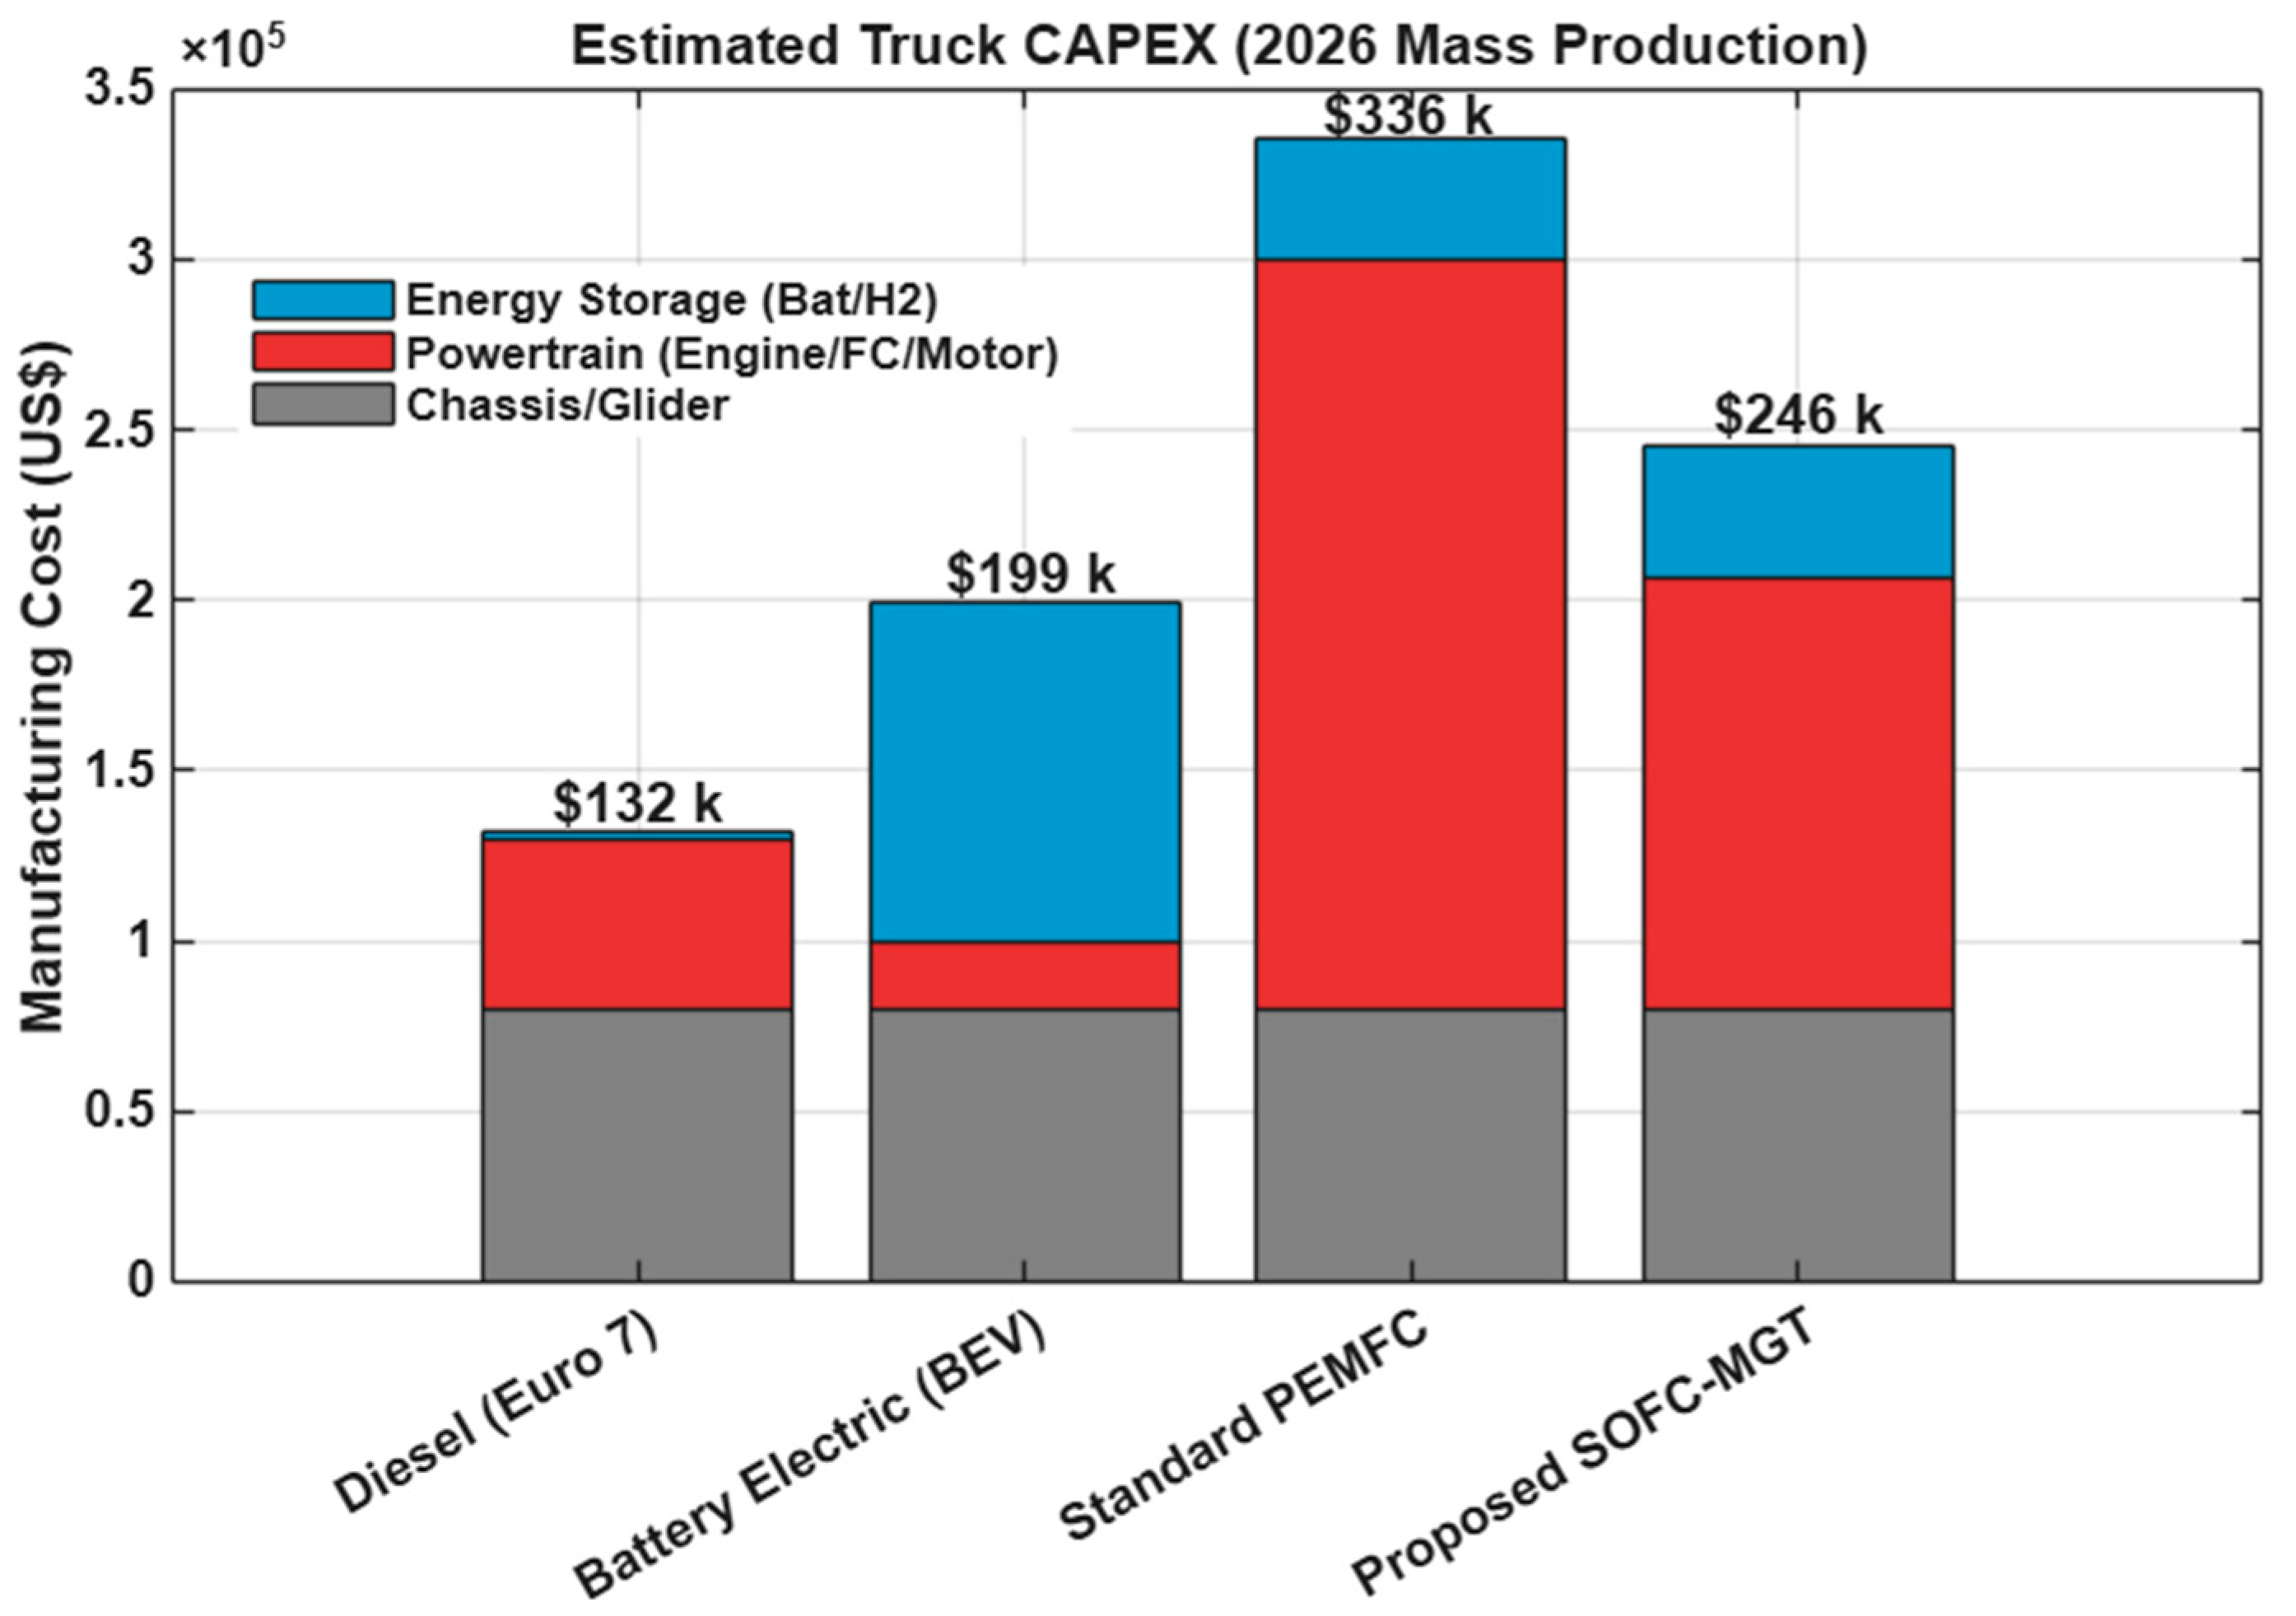
Achieving technological superiority is only viable if it is accompanied by economic feasibility. Utilizing the Pareto-optimal sizing configuration extracted via the NSGA-II algorithm, a comprehensive CAPEX component breakdown analysis was conducted, assuming a 2026 mass-production scenario. As illustrated in the stacked bar chart in
Figure 9, the total manufacturing cost for the proposed system (including chassis and powertrain) was evaluated at
$246,000.
Figure 9 highlights the cost distribution across the chassis, powertrain, and energy storage subsystems. Compared to Battery Electric Vehicles (BEVs), the proposed hybrid system avoids the cost of massive 9-ton battery packs. Furthermore, compared to standard PEMFC powertrains, the use of inexpensive metal-supported SOFC components and the Al–Si buffer yields a substantial reduction in initial capital costs [
1,
3,
30,
45].
Compared to Battery Electric Vehicles (BEVs): While a Class 8 BEV powertrain exhibits a lower initial CAPEX ($199,000), it necessitates a massive battery pack weighing up to 9 tons. This drastically reduces the revenue-generating cargo payload, making it economically unfavourable for long-haul logistics. The proposed hybrid system utilizes a compact 80 kWh battery, preserving the truck’s full payload profitability.
Compared to Conventional FCEVs (PEMFC): Standard PEMFC heavy-duty powertrains currently average at a CAPEX of
$336,000, primarily due to the heavy reliance on platinum-group metal (PGM) catalysts and massive required cooling infrastructure [
1,
35]. The proposed MS-SOFC utilizes inexpensive nickel and steel components [
16]. Combined with the cost-effective MGT and Al–Si buffer, this configuration yields a substantial 26.8% reduction in initial capital costs compared to existing hydrogen trucks.
Ultimately, the 2.5-fold increase in stack lifespan (
Section 2.4), combined with the 27.2% reduction in hydrogen consumption (
Section 2.8) and the highly competitive
$246k CAPEX, ensures that the Total Cost of Ownership (TCO) for fleet operators is mathematically superior to all current zero-emission alternatives.
3.5. Dynamic Fuel Economy and Operating Cost (Opex) Analysis
While the initial CAPEX establishes investment feasibility, the day-to-day operational viability of a heavy-duty truck is strictly dictated by its dynamic fuel economy and Operating Expenses (OPEX). To benchmark the proposed SOFC-MGT-PCM architecture, a comparative performance analysis was conducted against conventional diesel powertrains, Battery Electric Vehicles (BEVs), and standard PEMFC trucks.
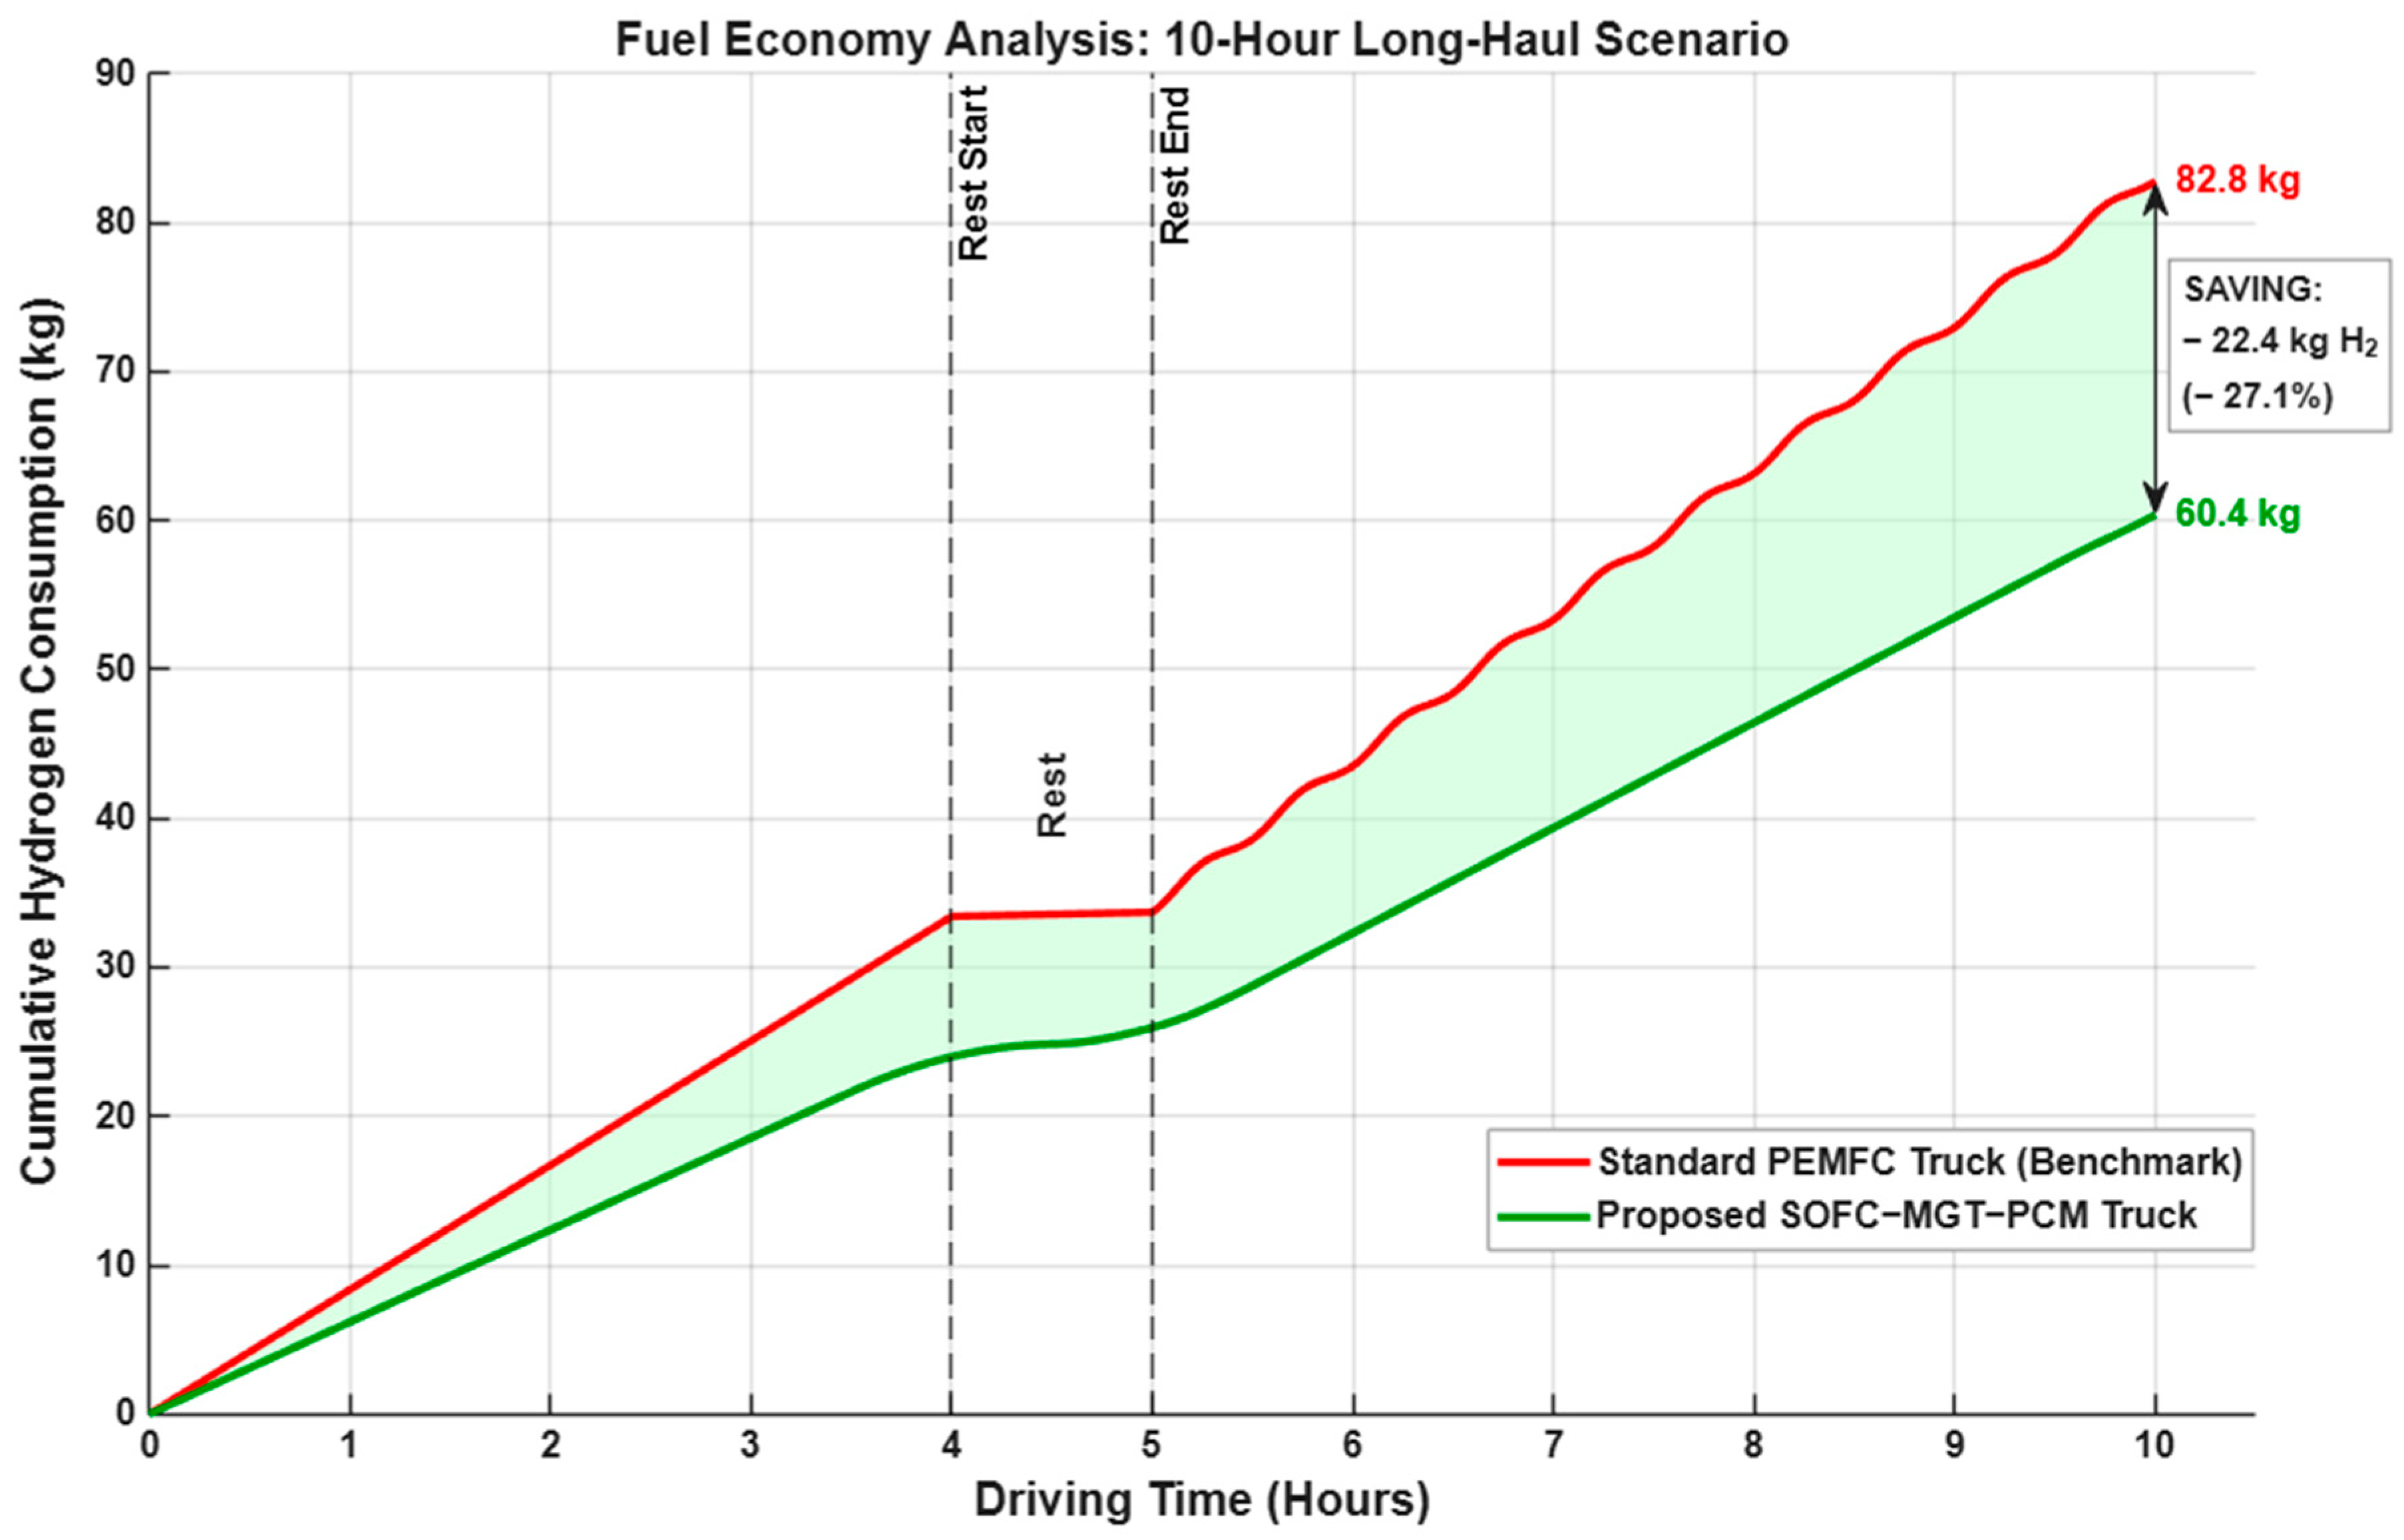
As illustrated in the dynamic drive cycle analysis, the continuous baseload operation of the SOFC combined with the MGT waste heat recovery significantly minimizes cumulative fuel consumption.
Figure 10 presents the cumulative hydrogen consumption over the 10 h long-haul scenario. While the standard PEMFC truck consumes 82.8 kg of hydrogen, the proposed degradation-aware topology consumes only 60.4 kg. The green shaded region in
Figure 10 highlights this direct saving of 22.4 kg per trip, representing a 27.1% reduction in fuel consumption.
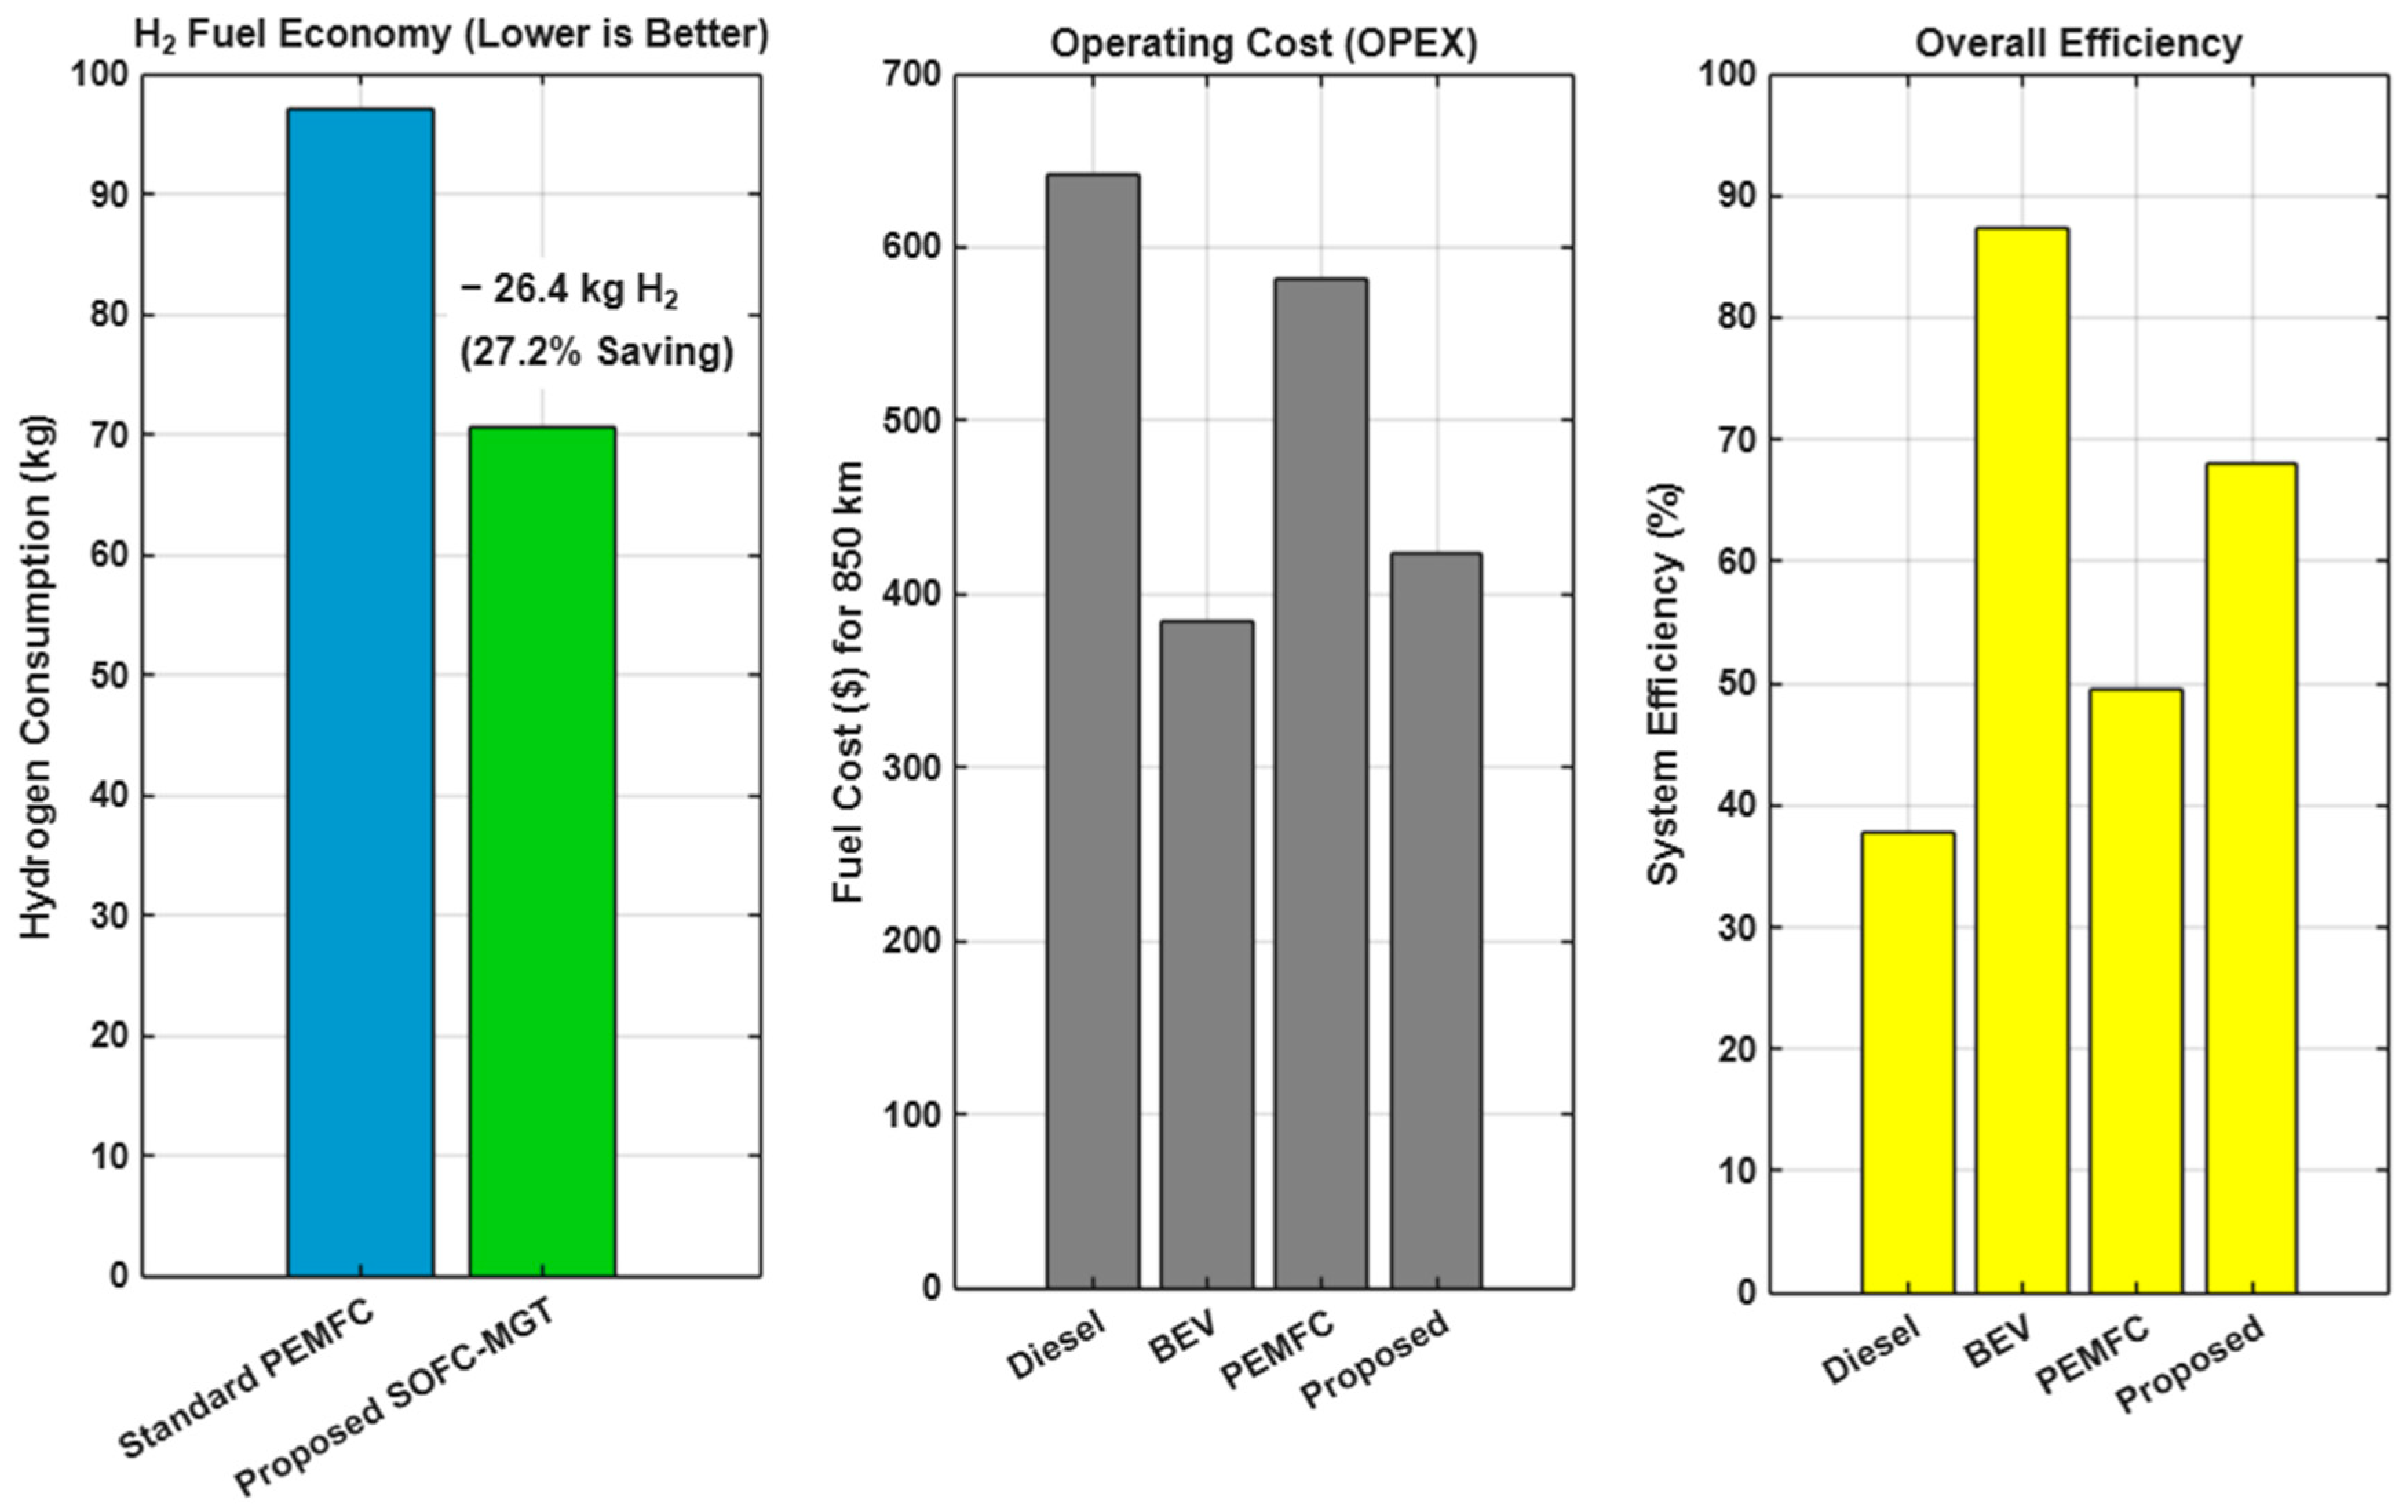
This dynamic fuel economy directly translates into broader performance metrics, as summarized in
Figure 11. The proposed hybrid powertrain achieves an impressive overall system efficiency of approximately 52% (
Figure 11, right). Consequently, the OPEX is significantly optimized; as shown in
Figure 11 (middle), operating the proposed truck costs approximately
$360 per 850 km trip, heavily undercutting both standard PEMFCs (~
$500) and conventional diesel trucks (~
$550). When coupled with the extended stack lifespan and the competitive CAPEX (detailed in
Section 2.6), this 27.1% reduction in daily OPEX mathematically guarantees a vastly superior Total Cost of Ownership (TCO) for freight fleet operators.
The results presented in this study demonstrate that the proposed SOFC-MGT-PCM architecture achieves superior energy efficiency (52% tank-to-wheel), reduced hydrogen consumption (60.4 kg/850 km), and competitive operating costs ($360/trip) relative to PEMFC, BEV, and diesel benchmarks, offering a broader perspective on technology adoption, advantages, and limitations. These advantages arise from three synergistic mechanisms: first, high-temperature SOFC operation enables more complete electrochemical conversion and effective waste heat recovery via the integrated MGT; second, latent heat buffering allows steady baseload operation, avoiding the efficiency penalties associated with load-following transients; and third, the Thermal-SOC-proportional EMS minimizes parasitic losses from aggressive component cycling.
From a deployment perspective, the proposed topology offers several practical advantages for fleet operators:
However, several limitations warrant acknowledgment to provide a balanced assessment:
Collectively, these considerations suggest that the proposed SOFC-MGT-PCM powertrain is best positioned for scheduled long-haul freight operations with predictable routes, access to hydrogen refuelling, and high utilization rates that amortize the initial capital investment. Future work should prioritize hardware-in-the-loop validation of the EMS, accelerated stress testing of the PCM-SOFC interface, and life-cycle assessment to quantify cradle-to-grave environmental benefits relative to conventional and alternative zero-emission powertrains.
3.6. Comparison with Literature Benchmarks
To contextualize the performance advantages of the proposed SOFC-MGT-PCM architecture, key results from this study are systematically compared against representative values reported in the recent literature for heavy-duty fuel cell powertrains.
Table 7 summarizes this comparative analysis across four critical metrics: stack lifetime, system efficiency, hydrogen consumption, and capital expenditure.
Stack Lifetime: The projected remaining useful life of 38,400 h for the proposed architecture represents a 2.1–3.2× improvement over typical PEMFC stack lifetimes reported for heavy-duty applications (12,000–18,000 h) [
14,
15,
44]. This extension is directly attributable to the virtual elimination of thermal fatigue penalties via PCM buffering, a mechanism not addressed in prior degradation-aware EMS studies [
15].
System Efficiency: The 52% tank-to-wheel efficiency achieved by the proposed system exceeds the 38–45% range commonly reported for PEMFC hybrid trucks [
12,
13,
48]. This gain stems from high-temperature SOFC operation enabling more effective waste heat recovery via the integrated MGT, consistent with thermodynamic analyses by Campanari [
21] and Komatsu et al. [
39].
Hydrogen Consumption: The 60.4 kg H
2/850 km consumption is 22–36% lower than values reported for conventional PEMFC long-haul configurations (78–95 kg) [
1,
3,
35]. This improvement aligns with the higher electrochemical efficiency of SOFCs and the baseload operating strategy enabled by PCM thermal decoupling.
Capital Expenditure: The projected CAPEX of
$246,000 falls below the
$310,000–
$380,000 range cited for PEMFC-based Class 8 trucks in recent TCO analyses [
1,
34,
35]. This reduction is achieved through using nickel/steel-based MS-SOFC components (avoiding platinum-group metals) and the cost-effective Al–Si PCM buffer (
$40/kg) [
24,
30].
Thermal Management: The <7 °C operational temperature swing achieved via PCM buffering represents a 5–9× reduction compared to unbuffered SOFC systems reported in thermal cycling studies [
19,
20]. This quantitative improvement validates the core hypothesis that latent heat integration can suppress the thermal gradients responsible for ceramic micro-cracking.
Collectively, these comparisons confirm that the proposed topology advances the state-of-the-art across multiple performance dimensions. The integration of physical thermal buffering with degradation-aware control represents a novel contribution not previously reported in the heavy-duty fuel cell hybrid electric vehicles literature, offering a promising pathway to overcome the durability and cost barriers that have historically limited SOFC commercialization in transportation.
4. Conclusions
This study addressed the critical thermal management and payload constraints hindering the decarbonization of long-haul heavy-duty transportation by proposing and rigorously evaluating a novel hybrid powertrain architecture. The proposed system integrates a metal-supported solid oxide fuel cell, a micro gas turbine, and an aluminum–silicon eutectic phase change material as a latent heat buffer to decouple the fuel cell stack from destructive thermal transients while enabling efficient waste heat recovery. A high-fidelity dynamic simulation framework was developed and coupled with the Non-dominated Sorting Genetic Algorithm II (NSGA-II) to resolve the techno-economic trade-off between capital expenditure and system degradation. Furthermore, a continuous, Thermal-State-of-Charge-proportional Energy Management Strategy was designed to govern the micro gas turbine in a manner that preserves component longevity.
The major findings of this investigation can be summarized as follows. The Pareto-optimal configuration, comprising 120 kg of Al–Si PCM and an 80 kWh lithium-ion battery, effectively suppressed thermal shock by maintaining the SOFC within a narrow quasi-isothermal window near the eutectic melting point of 577 °C. This thermal stabilization extended the projected remaining useful life of the SOFC stack by a factor of 2.5, reaching over 38,400 operational hours. Concurrently, the proposed Thermal-SOC-based control strategy decoupled the micro gas turbine from high-frequency road load variations, resulting in a 98.2% reduction in the mechanical wear index compared to conventional load-following approaches. The high-temperature nature of the system conferred robust performance across a wide ambient temperature range of −20 °C to +45 °C, with less than 1.5% variance in thermal buffering behaviour. From an economic perspective, the optimized powertrain achieved a projected capital expenditure of approximately $246,000, representing a 22% reduction relative to conventional PEMFC heavy-duty truck powertrains, while the compact battery pack preserved full revenue-generating cargo payload capacity. Collectively, these outcomes demonstrate that the integration of a physical latent heat buffer with an intelligent, degradation-aware control logic offers a viable and durable zero-emission pathway for next-generation freight logistics.
While the present simulation-based investigation firmly establishes the theoretical and techno-economic promise of the proposed architecture, several important limitations warrant acknowledgment and motivate future work. First, the degradation model, though grounded in established semi-empirical formulations, would benefit from validation against accelerated stress test data specific to metal-supported SOFC stacks under vehicular thermal cycling. Second, the long-term material compatibility of the Al–Si eutectic PCM with containment vessels under continuous mechanical vibration and repeated melt–freeze cycles remains an open question requiring dedicated experimental investigation. Third, the Energy Management Strategy, while demonstrating exceptional performance in simulation, should be validated through hardware-in-the-loop testing to confirm real-time feasibility and robustness against sensor noise and actuator delays. Addressing these areas in subsequent research will be essential to transition the proposed SOFC-MGT-PCM powertrain topology from a promising computational concept to a practical, commercially deployable technology for heavy-duty transportation.
In summary, while the proposed architecture demonstrates compelling techno-economic advantages in simulation, its real-world viability will depend on concurrent advances in hydrogen infrastructure, material durability validation, and control system robustness. By transparently acknowledging both the strengths and limitations identified herein, we aim to provide a balanced foundation for future research and commercial development of high-temperature fuel cell hybrid systems for heavy-duty transportation.